
Groundwater Hydrogeochemical and Quality Appraisal for Agriculture Irrigation in Greenbelt Area, Iraq

 ,
,  ,
,  ,
,
Abstract
:
1. Introduction
2. Materials and Methods
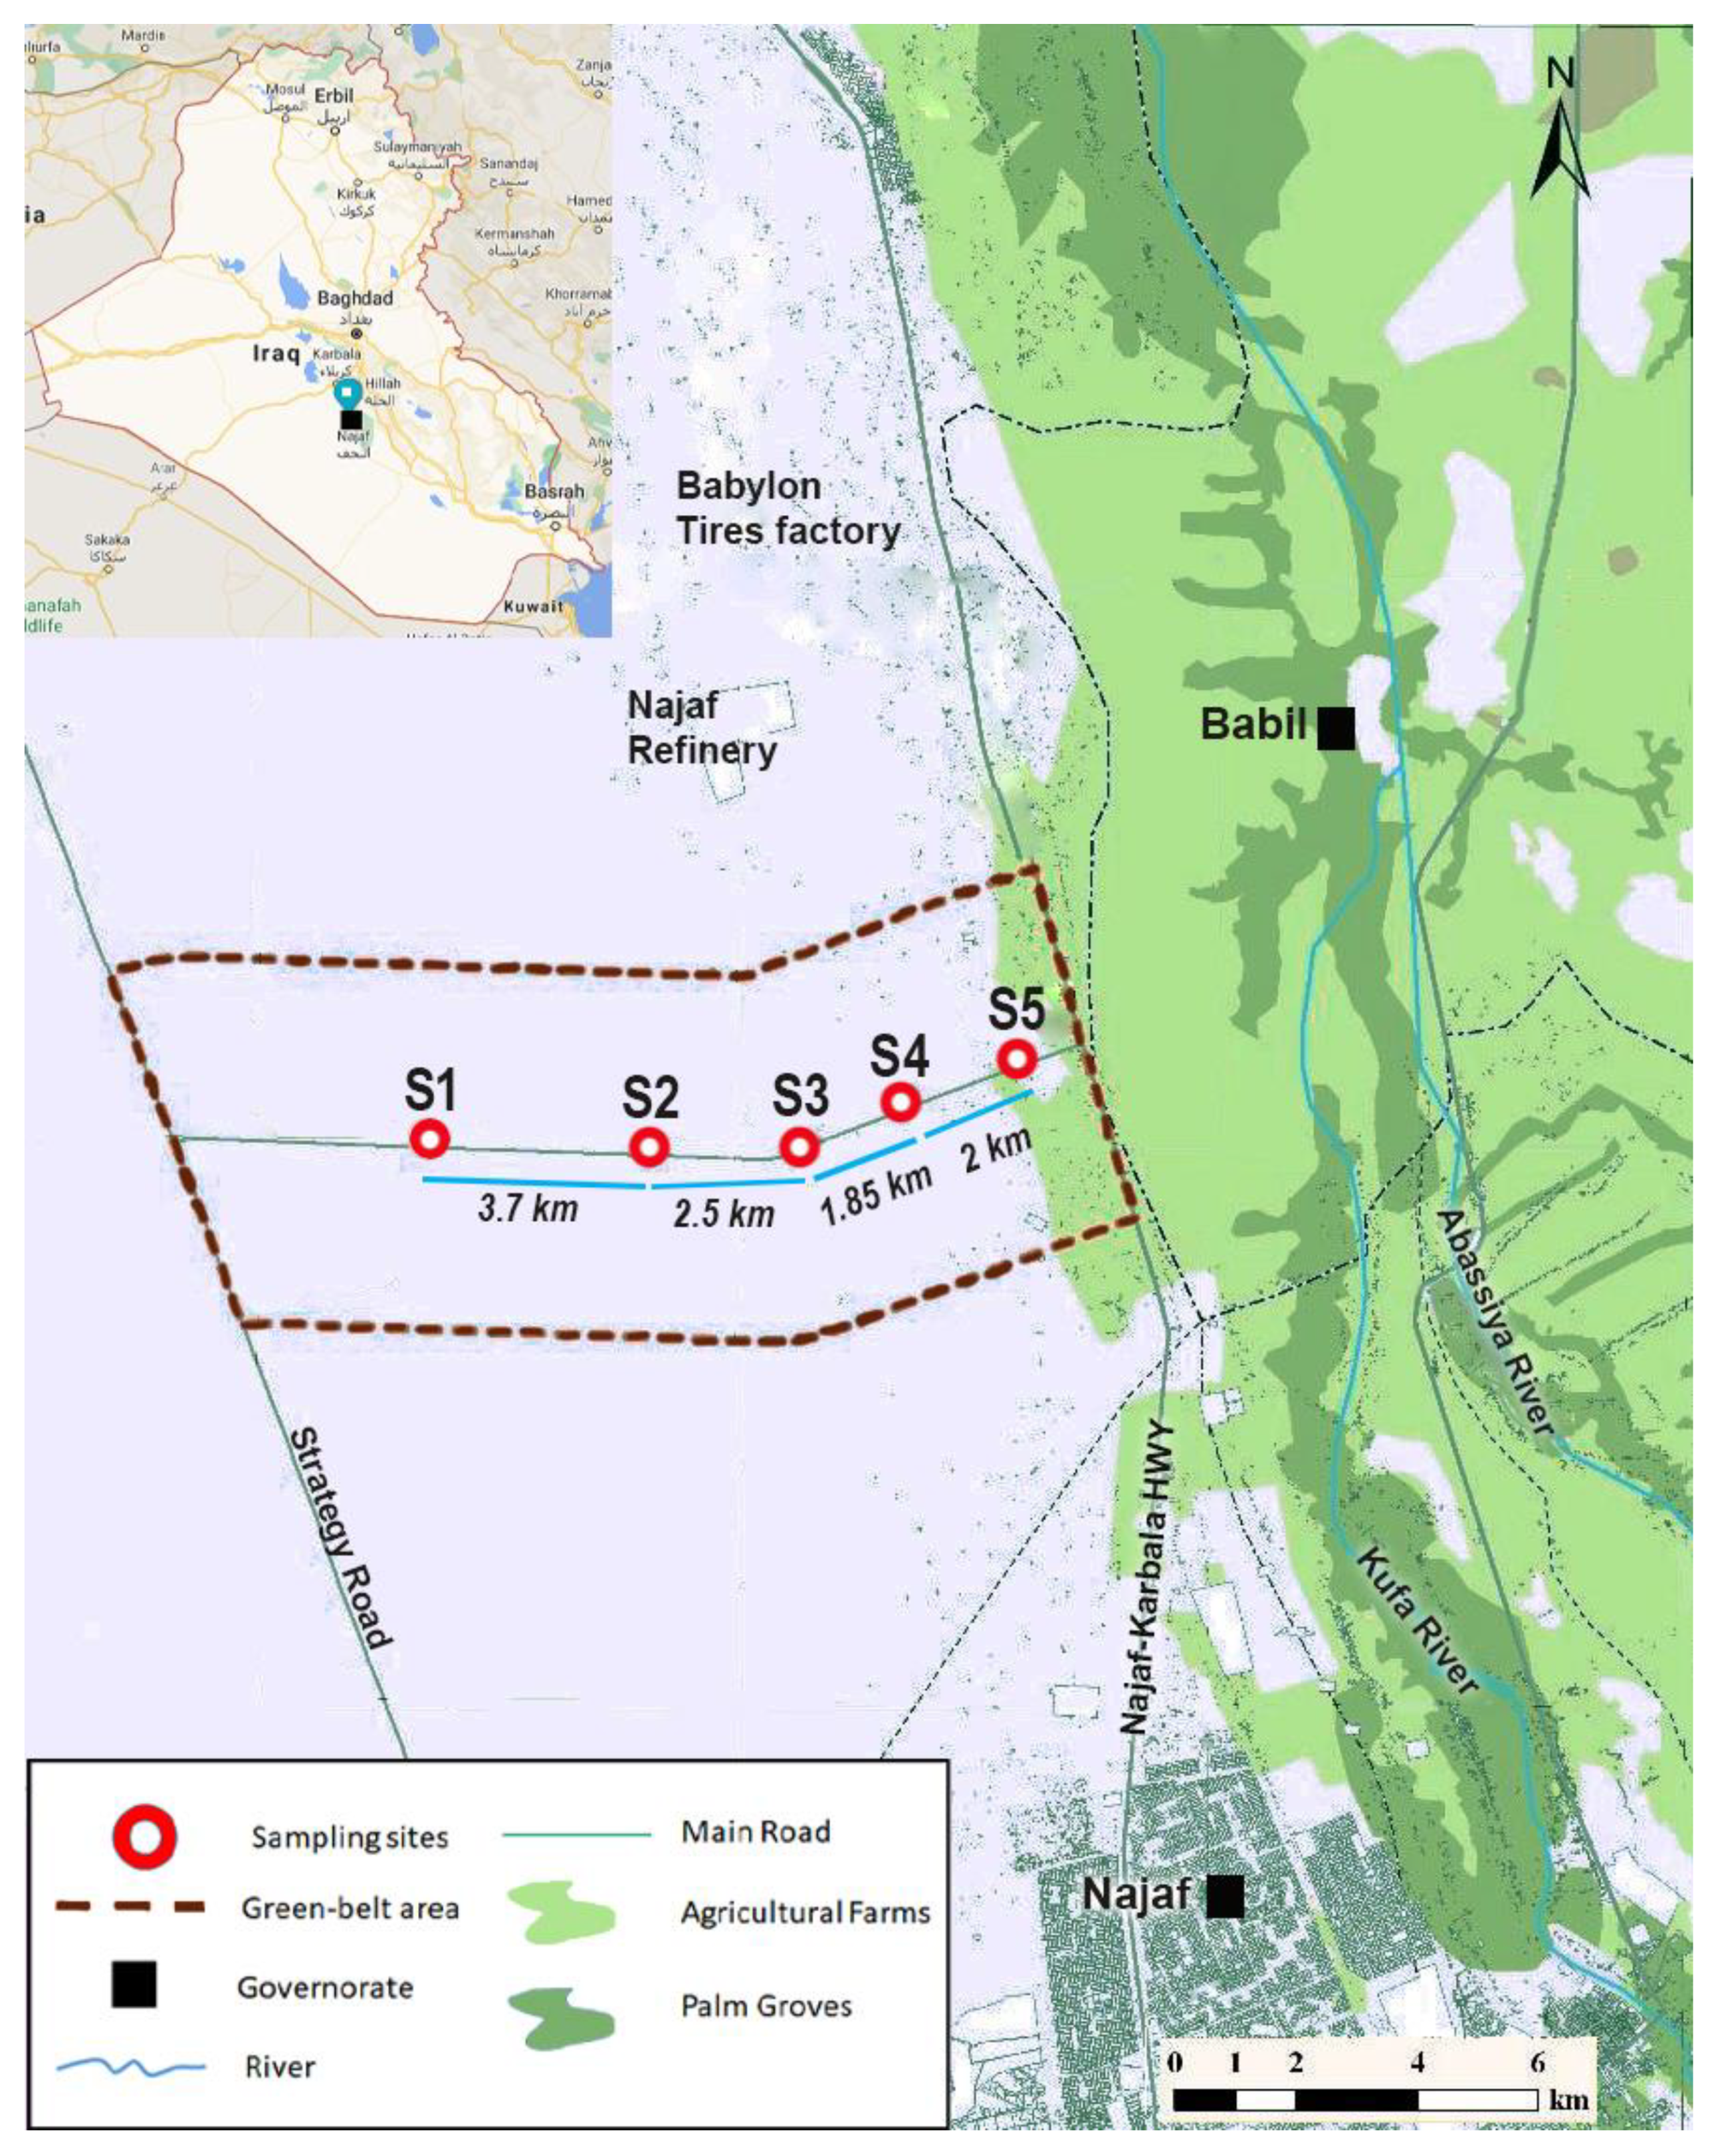
2.1. Site Description (Location, Climate)
2.2. Geological and Hydrogeological Setting
2.3. GeoDatabase
2.4. Assessment Methods
2.4.1. Ion Exchange
2.4.2. Salinization
2.4.3. Irrigation Water Quality Index (IWQI)
2.4.4. Suitability for Irrigation
3. Results and Discussion
3.1. Hydrogeochemical Processes
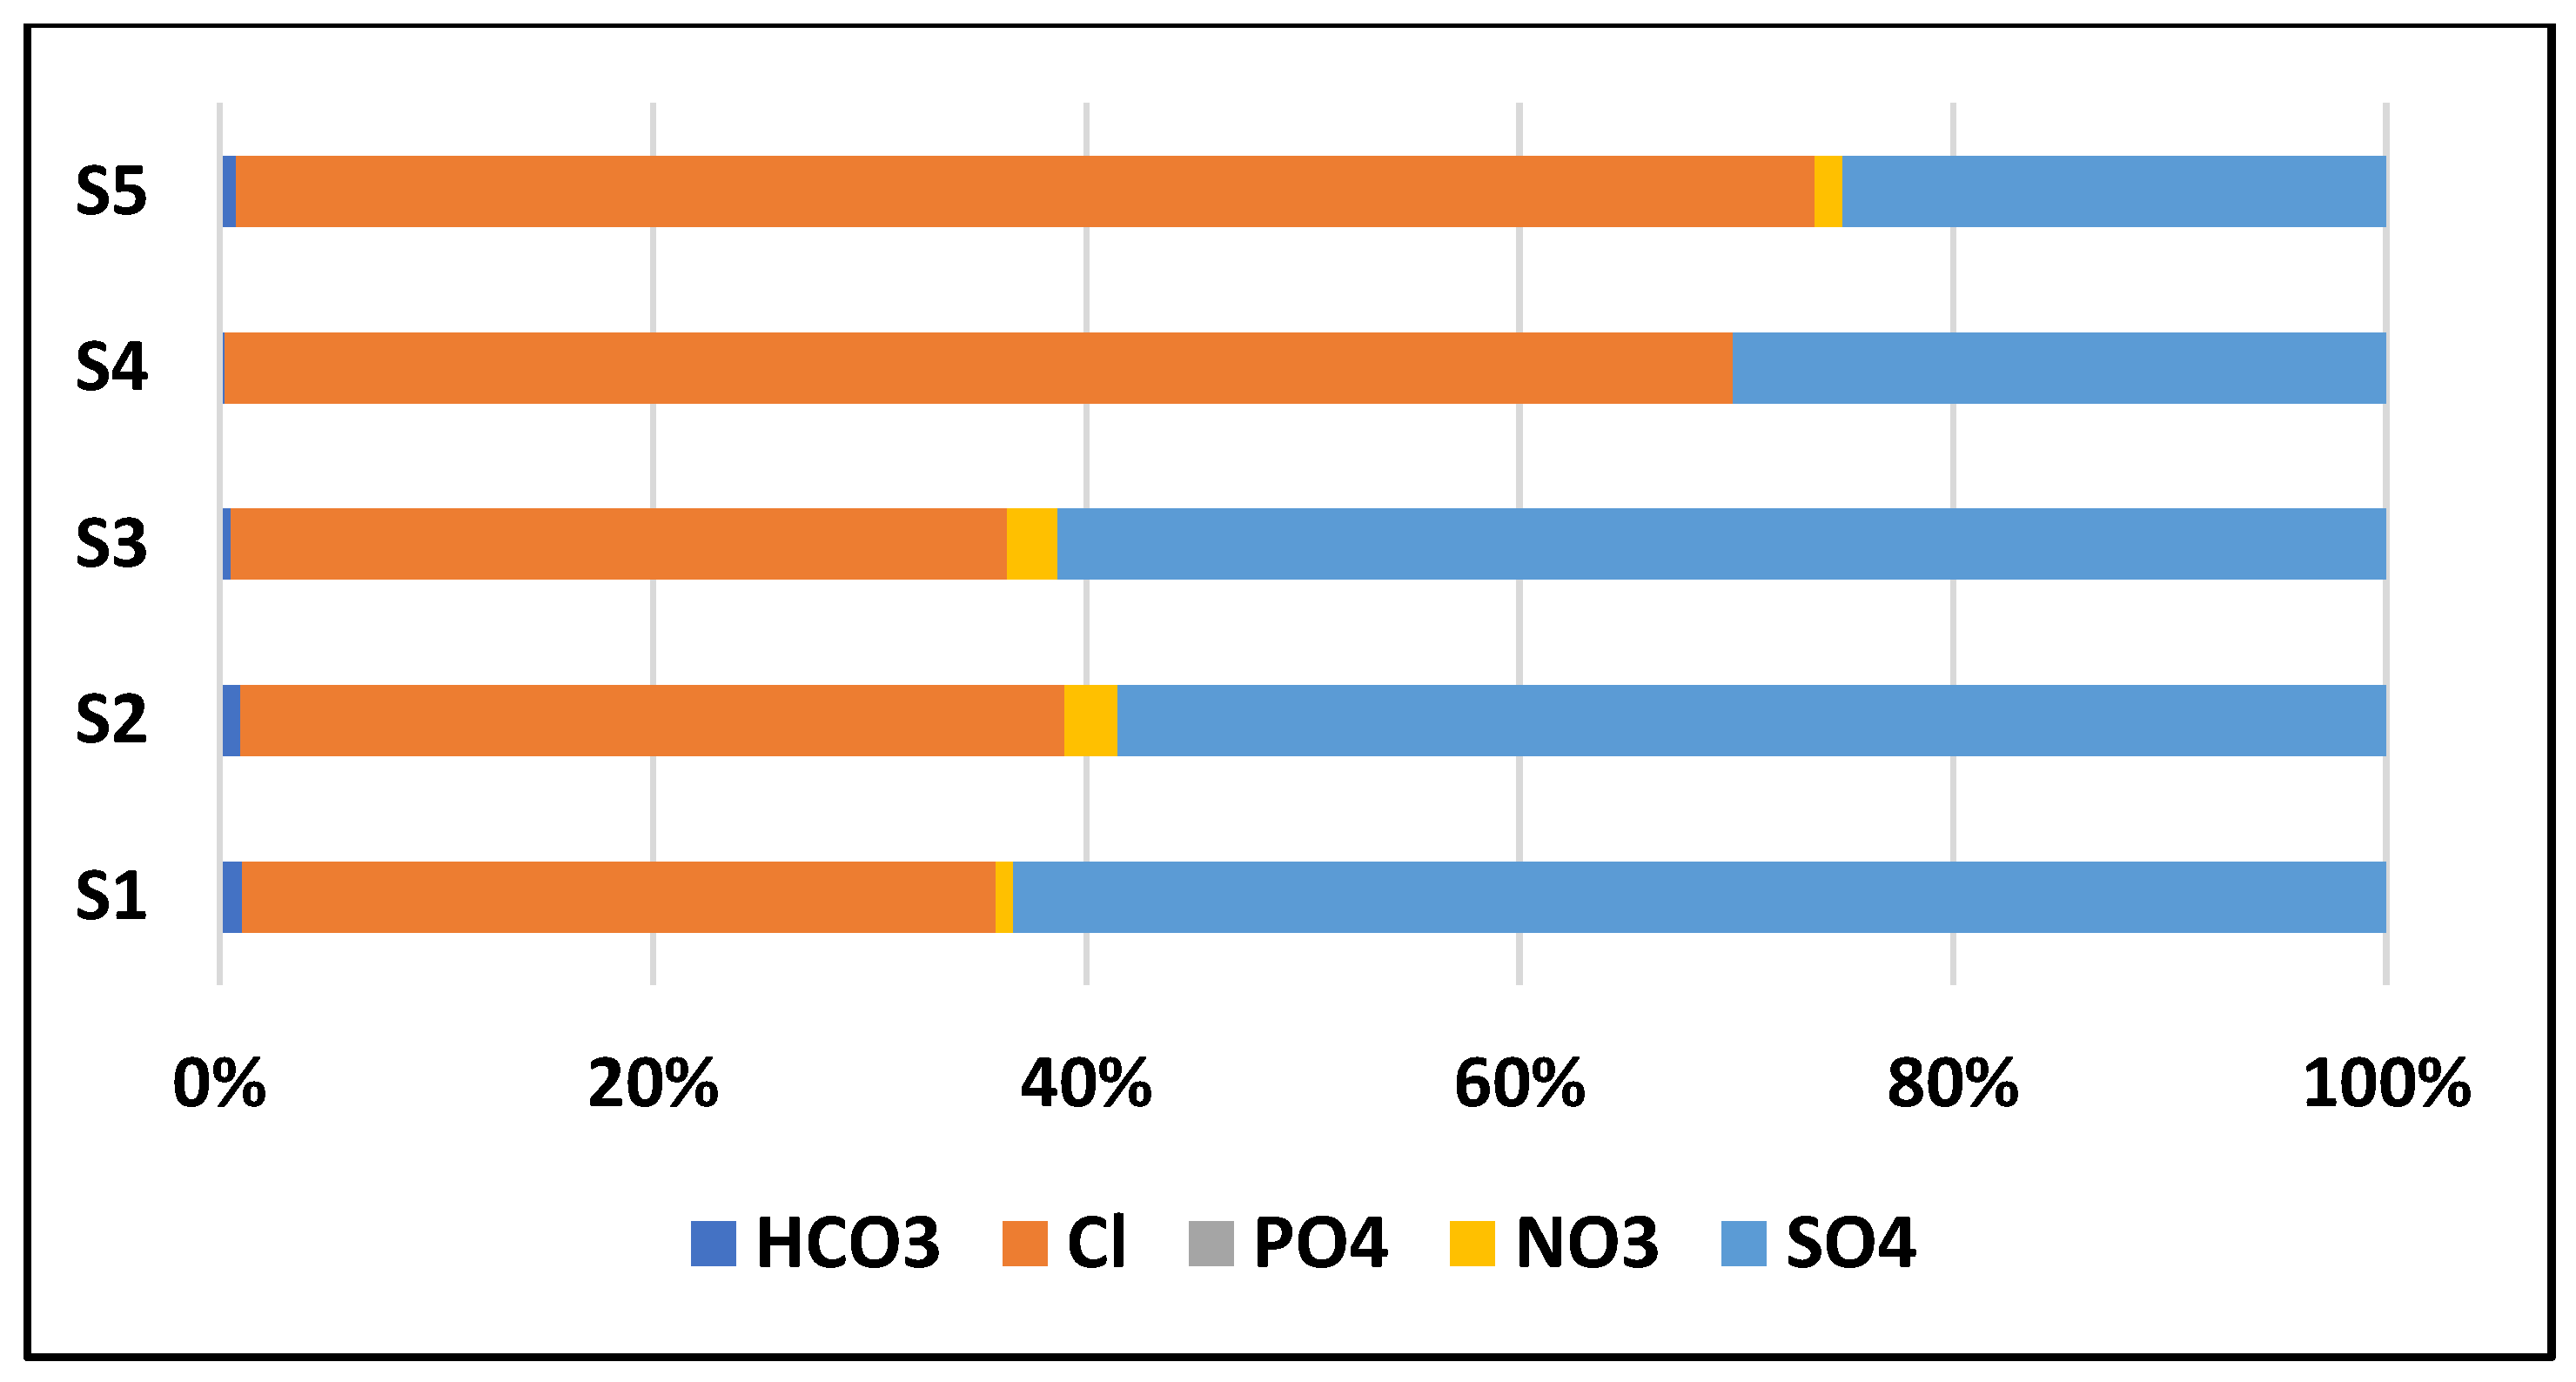
3.1.1. Hydrochemistry Characteristics
3.1.2. Ion Exchange
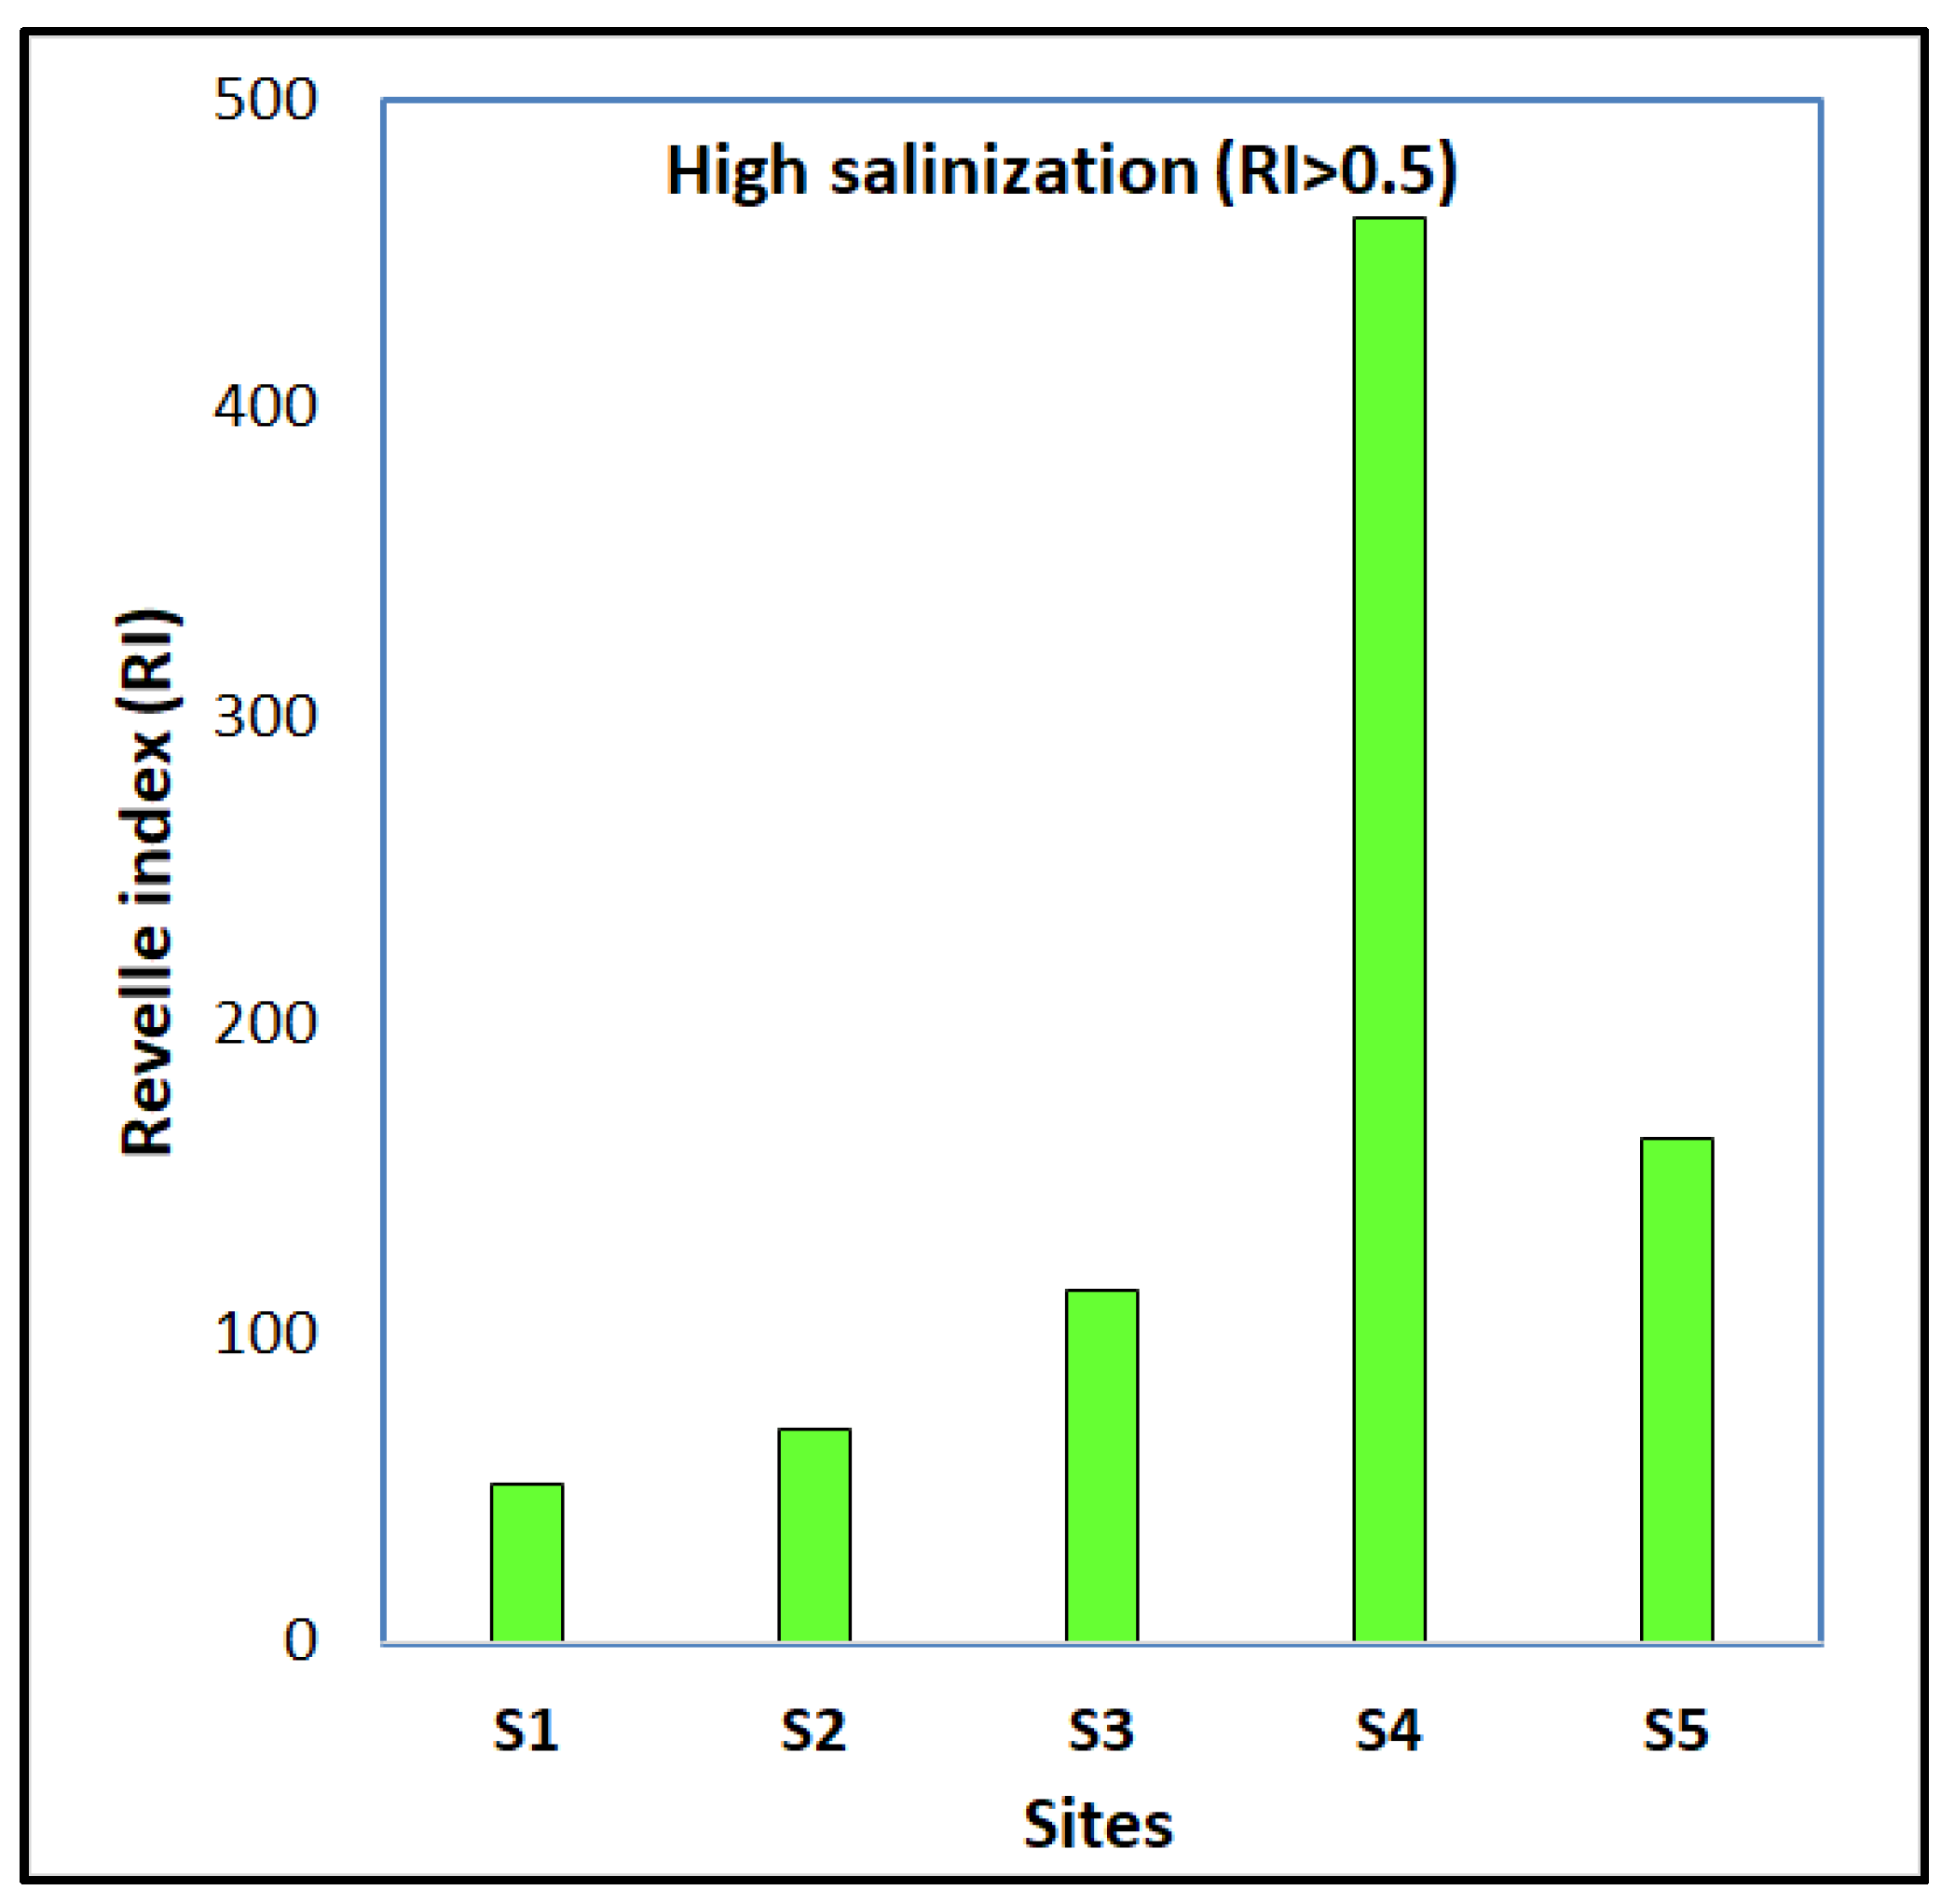
3.1.3. Salinization
3.2. Groundwater-Quality Assessment
3.3. Groundwater Suitability for Irrigation
3.3.1. Salinity Hazard
3.3.2. Sodium Hazard
3.3.3. Total Hardness (TH)
3.3.4. Permeability Index (PI)
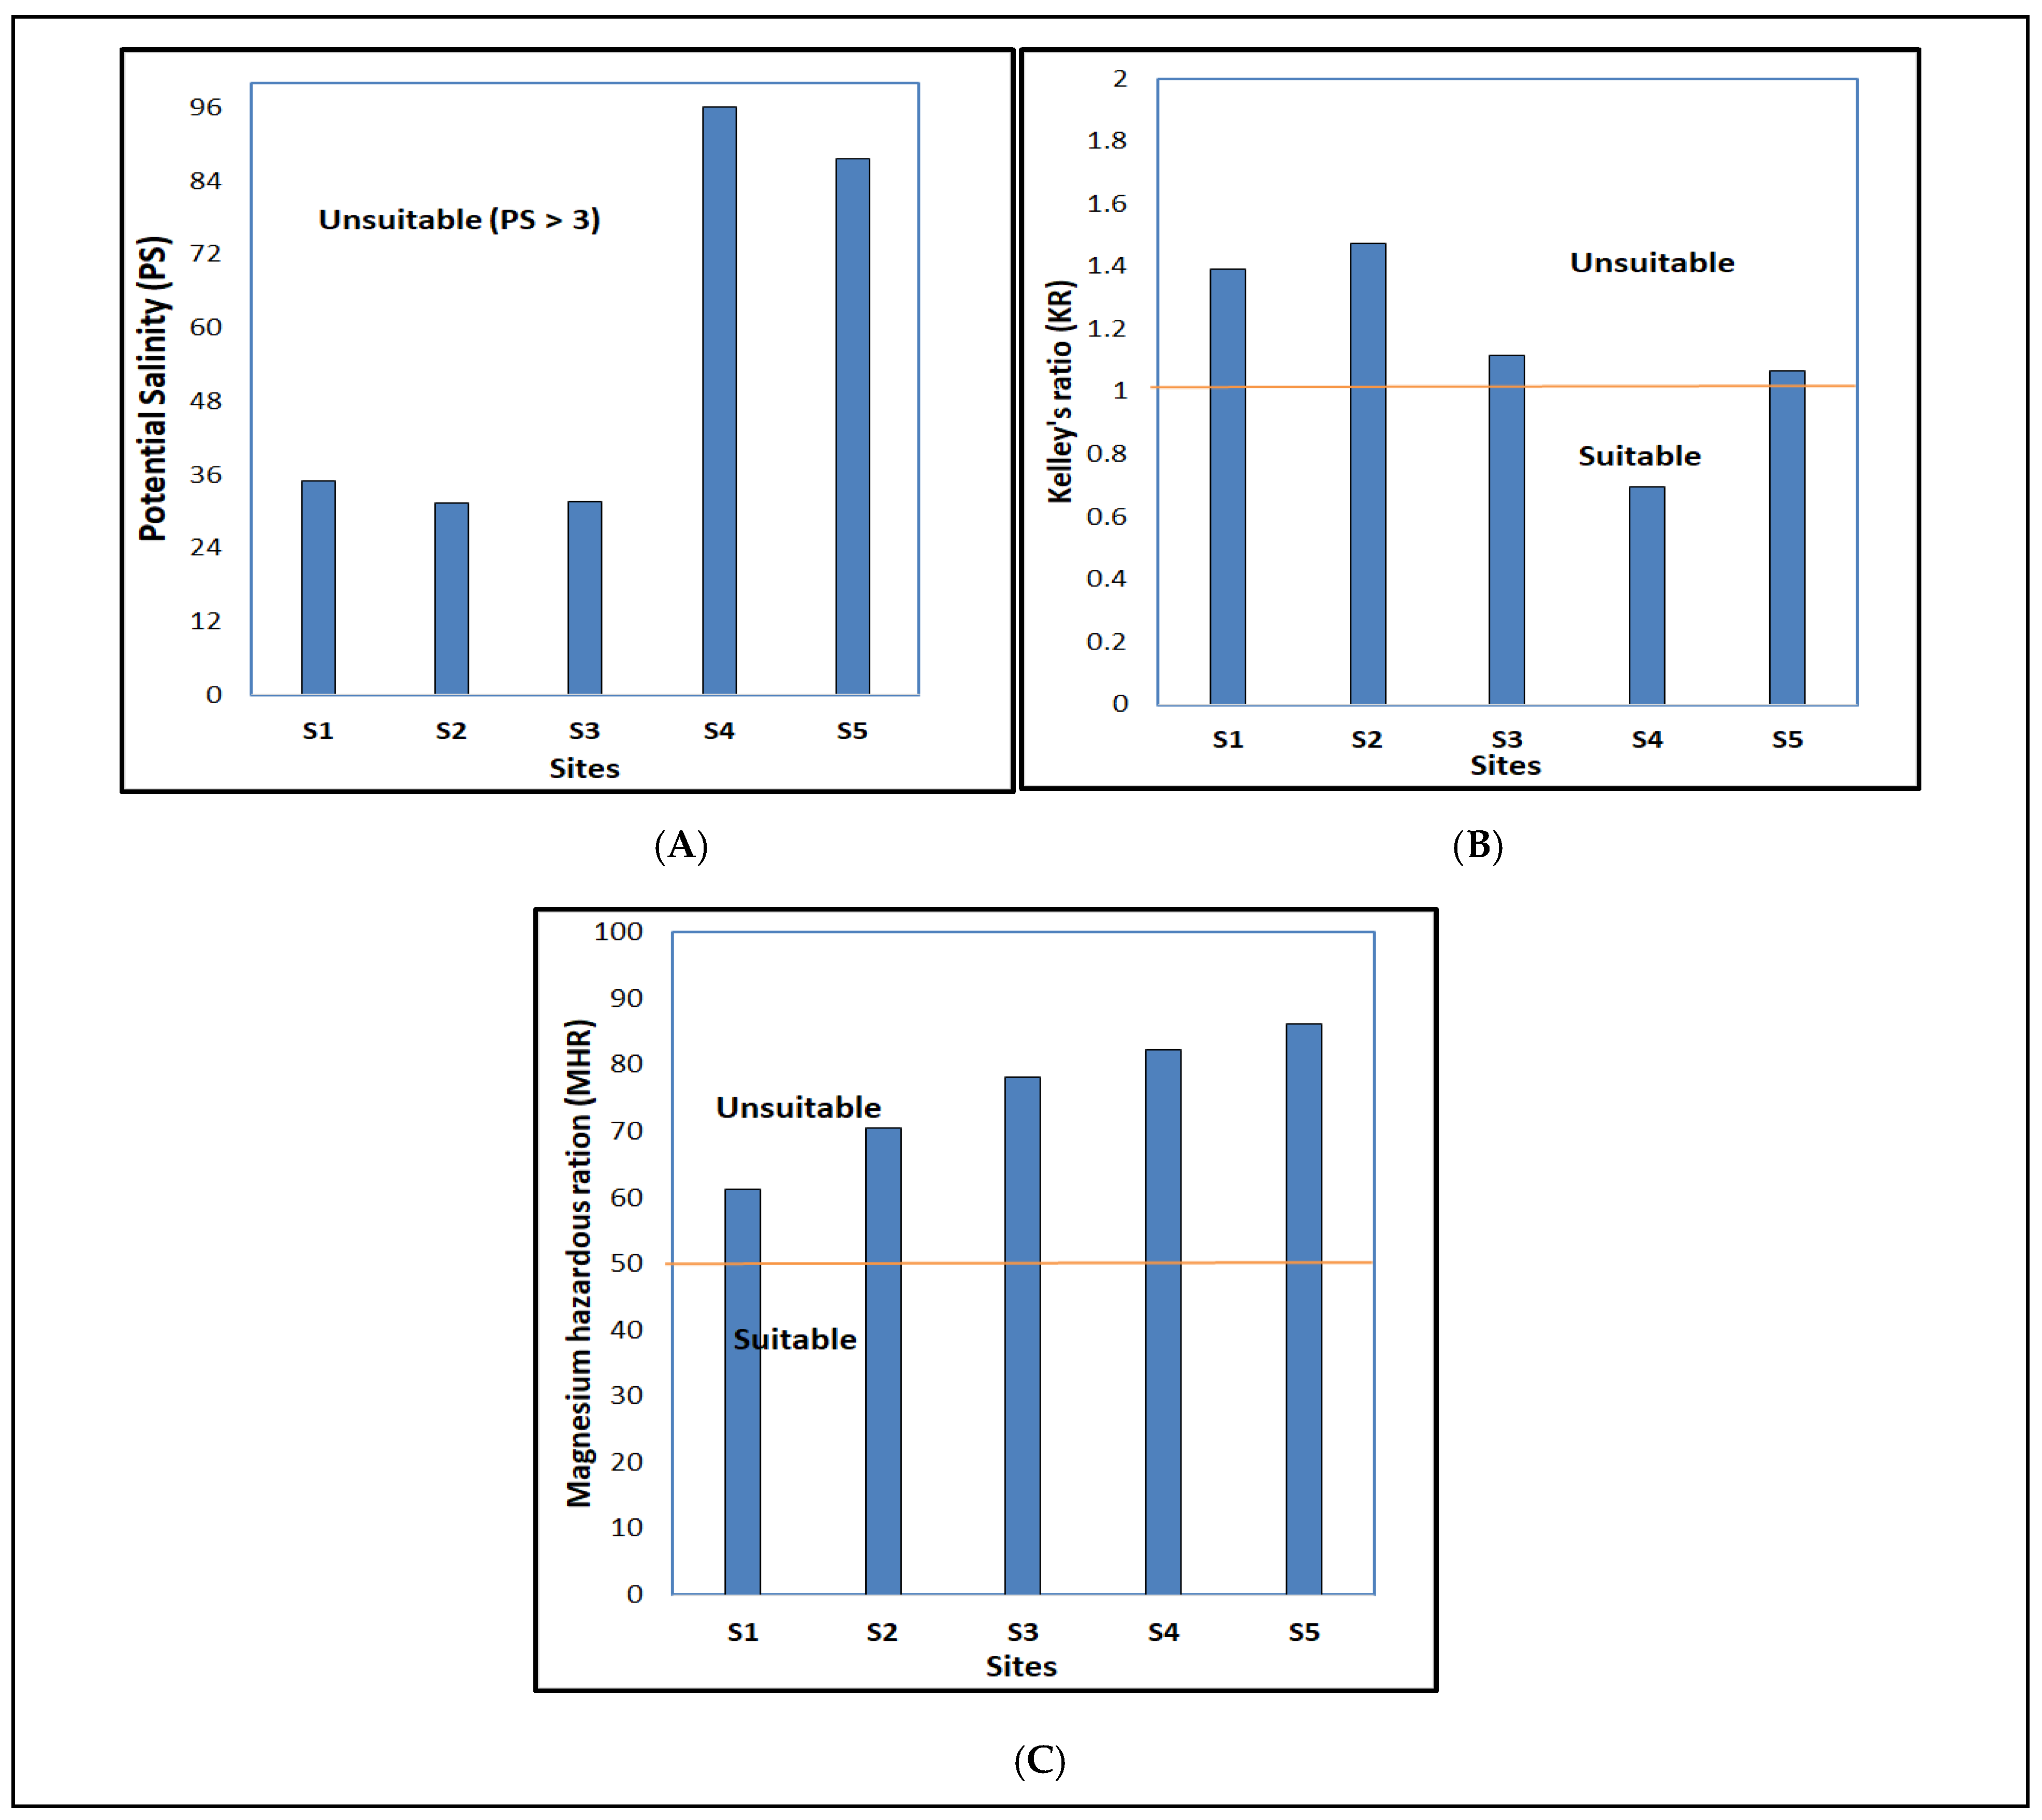
3.3.5. Potential Salinity (PS)
3.3.6. Kelley’s Ratio (KR)
3.3.7. Magnesium Hazard
4. Conclusions
Author Contributions
Funding
Institutional Review Board Statement
Informed Consent Statement
Data Availability Statement
Conflicts of Interest
References
- Kawo, N.S.; Karuppannan, S. Groundwater quality assessment using water quality index and GIS technique in Modjo River Basin, central Ethiopia. J. Afr. Earth Sci. 2018, 147, 300–311. [Google Scholar] [CrossRef]
- Al-Mussawi, W.H. Assessment of groundwater quality in Umm Er Radhuma aquifer (Iraqi Western Desert) by integration between irrigation water quality index and GIS. J. Univ. Babylon 2014, 22, 201–217. [Google Scholar]
- Adabanija, M.A.; Afolabi, O.A.; Lawal, L. The influence of bedrocks on groundwater chemistry in a crystalline basement complex of southwestern Nigeria. Environ. Earth Sci. 2020, 79, 87. [Google Scholar] [CrossRef]
- Amiri, V.; Sohrabi, N.; Dadgar, M.A. Evaluation of groundwater chemistry and its suitability for drinking and agricultural uses in the Lenjanat plain, central Iran. Environ. Earth Sci. 2015, 74, 6163–6176. [Google Scholar] [CrossRef]
- El Baba, M.; Kayastha, P.; Huysmans, M.; De Smedt, F. Evaluation of the Groundwater Quality Using the Water Quality Index and Geostatistical Analysis in the Dier al-Balah Governorate, Gaza Strip, Palestine. Water 2020, 12, 262. [Google Scholar] [CrossRef] [Green Version]
- Mary, I.A.; Ramkumar, T.; Venkatramanan, S. Application of statistical analysis for the hydrogeochemistry of saline groundwater in Kodiakarai, Tamilnadu, India. J. Coast. Res. 2012, 28, 89–98. [Google Scholar] [CrossRef]
- Zhao, X.; Guo, H.; Wang, Y.; Wang, G.; Wang, H.; Zang, X.; Zhu, J. Groundwater hydrogeochemical characteristics and quality suitability assessment for irrigation and drinking purposes in an agricultural region of the North China plain. Environ. Earth Sci. 2021, 80, 162. [Google Scholar] [CrossRef]
- Patil, V.B.B.; Pinto, S.M.; Govindaraju, T.; Hebbalu, V.S.; Bhat, V.; Kannanur, L.N. Multivariate statistics and water quality index (WQI) approach for geochemical assessment of groundwater quality—A case study of Kanavi Halla Sub-Basin, Belagavi, India. Environ. Geochem. Health 2020, 42, 2667–2684. [Google Scholar] [CrossRef]
- Adebayo, T.B.; Abegunrin, T.P.; Awe, G.O.; Are, K.S.; Guo, H.; Onofua, O.E.; Adegbola, G.A.; Ojediran, J.O. Geospatial mapping and suitability classification of groundwater quality for agriculture and domestic uses in a Precambrian basement complex. Groundw. Sustain. Dev. 2020, 12, 100497. [Google Scholar] [CrossRef]
- Sataa, A.-B.; Albakeri, S.; Salih, M.M. Evaluation the Quality of Wells Water in Greenbelt Area North of AL-Najaf Al Ashraf City. Eng. Technol. J. 2016, 34, 2692–2704. [Google Scholar]
- Alikhan, H.A.; Hussein, A.K.; Alshukri, A.S. Groundwater quality assessment using water quality index: A case study of Al Najaf City, Iraq. Period. Eng. Nat. Sci. 2020, 8, 1482–1490. [Google Scholar] [CrossRef]
- Pei-Yue, L.; Hui, Q.; Jian-Hua, W. Groundwater Quality Assessment Based on Improved Water Quality Index in Pengyang County, Ningxia, Northwest China. E-J. Chem. 2010, 7, S209–S216. [Google Scholar] [CrossRef]
- Brindha, K.; Vaman, K.V.N.; Srinivasan, K.; Babu, M.S.; Elango, L. Identification of surface water-groundwater interaction by hydrogeochemical indicators and assessing its suitability for drinking and irrigational purposes in Chennai, Southern India. Appl. Water Sci. 2014, 4, 159–174. [Google Scholar] [CrossRef] [Green Version]
- Twigg, Z.A. Studying the effect of the service activities and agricultural on some physical and Chemical characteristic of ground water in area corresponding to the junction of Al-kifel in the province of Al-Najaf Al-Ashraf. Kufa J. Agric. Sci. 2013, 5, 423–441. [Google Scholar]
- Chung, S.Y.; Venkatramanan, S.; Kim, T.H.; Kim, D.S.; Ramkumar, T. Influence of hydrogeochemical processes and assessment of suitability for groundwater uses in Busan City, Korea. Environ. Dev. Sustain. 2015, 17, 423–441. [Google Scholar] [CrossRef]
- Al-Jiburi, H.K.; Al-Basrawi, N.H. Hydrogeology of the western part of the Iraqi western desert. Iraqi Bull. Geol. Min. 2014, 10, 1–20. [Google Scholar]
- Ali, B.M. Hydrogeological study of area between Najaf–Karbala’a cities. Iraqi J. Sci. 2012, 2, 353–361. [Google Scholar]
- American Public Health Association. Standard Methods for The Examination of Waterand Wastewater, 21st ed.; American Public Health Association: Washington, DC, USA, 2005. [Google Scholar]
- Schoeller, H. Qualitative evaluation of groundwater resources. In Methods and Techniques of Ground-water Investigations and Development; UNESCO: Paris, France, 1965; p. 5483. [Google Scholar]
- Karunanidhi, D.; Aravinthasamy, P.; Deepali, M.; Subramani, T.; Sunkari, E.D. Appraisal of subsurface hydrogeochemical processes in a geologically heterogeneous semi-arid region of south India based on mass transfer and fuzzy comprehensive modeling. Environ. Geochem. Health 2020, 43, 1009–1028. [Google Scholar] [CrossRef]
- Hameed, A.; Al-Obaidy, M.J. Impact of Medical City and Al-Rasheed Power Plant Effluents on the Water Quality Index Value of Tigris River at Baghdad City. Impa Eng. Tech. J. 2016, 34, 28–29. [Google Scholar]
- Călmuc, V.A.; Călmuc, M.; Țopa, M.C.; Timofti, M.; Iticescu, C.; Georgescu, L.P.; de Jos, D. Various methods for calculating the water quality index. Ann. Dunarea Jos Univ. Galati Fascicle II Math. Phys. Theor. Mech. 2018, 41, 171–178. [Google Scholar] [CrossRef]
- Ayers, R.S.; Westcot, D.W. Water Quality for Agriculture; FAO: Rome, Italy, 1994; Volume 29, pp. 77042–77044. [Google Scholar]
- Bora, M.; Goswami, D.C. Water quality assessment in terms of water quality index (WQI): Case study of the Kolong River, Assam, India. Appl. Water Sci. 2016, 7, 3125–3135. [Google Scholar] [CrossRef] [Green Version]
- Allison, L.E.; Richards, L.A. Diagnosis and Improvement of Saline and Alkali Soils, No. 60; Soil and Water Conservative Research Branch, Agricultural Research Service, USA Department of Agriculture: Washington, DC, USA, 1954.
- Todd, D.K. Groundwater Hydrology; Jon Wiley Sons Inc.: New York, NY, USA, 1980; p. 535. [Google Scholar]
- Eaton, F.M. Significance of Carbonates in Irrigation Waters. Soil Sci. 1950, 69, 123–134. [Google Scholar] [CrossRef]
- Doneen, L.D. Notes on water Quality in Agriculture. Department of Water Science and Engineering, University of California: Davis, CA, USA,, 1964. [Google Scholar]
- Kelley, W.P. Use of Saline Irrigation Water. Soil Sci. 1963, 95, 385–391. [Google Scholar] [CrossRef]
- Raghunath, H.M. Groundwater Pollution and Legislation Groundwater, 2nd ed.; Taylor and Francis: Abingdon, UK, 1987. [Google Scholar]
- GEMS/Water Programme. Water Quality Outlook; GEMS Water: Marina del Rey, CA, USA, 2006. [Google Scholar]
- Egbi, C.D.; Anornu, G.; Appiah-Adjei, E.; Ganyaglo, S.Y.; Dampare, S.B. Evaluation of water quality using hydrochemistry, stable isotopes, and water quality indices in the Lower Volta River Basin of Ghana. Environ. Dev. Sustain. 2018, 21, 3033–3063. [Google Scholar] [CrossRef]
- Fischer, D.; Charles, E.G.; Baehr, A.L. Effects of Stormwater Infiltration on Quality of Groundwater Beneath Retention and Detention Basins. J. Environ. Eng. 2003, 129, 464–471. [Google Scholar] [CrossRef]
- Rajmohan, N.; Masoud, M.H.; Niyazi, B.A. Impact of evaporation on groundwater salinity in the arid coastal aquifer, Western Saudi Arabia. Catena 2020, 196, 104864. [Google Scholar] [CrossRef]
- Fisher, R.S.; Mullican, W.F., III. Hydrochemical evolution of sodium-sulfate and sodium-chloride groundwater beneath the northern Chihuahuan Desert, Trans-Pecos, Texas, USA. Hydrogeol. J. 1997, 5, 4–16. [Google Scholar] [CrossRef]
- Shakir, E.; Zahraw, Z.; Al-Obaidy, A.H.M. Environmental and health risks associated with reuse of wastewater for irrigation. Egypt. J. Pet. 2017, 26, 95–102. [Google Scholar] [CrossRef] [Green Version]
- Kaur, T.; Bhardwaj, R.; Arora, S. Assessment of groundwater quality for drinking and irrigation purposes using hydrochemical studies in Malwa region, southwestern part of Punjab, India. Appl. Water Sci. 2016, 7, 3301–3316. [Google Scholar] [CrossRef] [Green Version]
- Shah, M.; Sircar, A.; Varsada, R.; Vaishnani, S.; Savaliya, U.; Faldu, M.; Vaidya, D.; Bhattacharya, P. Assessment of geothermal water quality for industrial and irrigation purposes in the Unai geothermal field, Gujarat, India. Groundw. Sustain. Dev. 2018, 8, 59–68. [Google Scholar] [CrossRef]
- Hameed, A.; Jawad, M.; Obaidy, A.; Awad, E.S.; Kadhem, A.J.; al Mashhady, A.A. Evaluating Water Quality of Mahrut River, Diyala, Iraq for Irrigation. Eng. Tech. J. 2015, 33, 830–837. [Google Scholar]
- Ben Alaya, M.; Saidi, S.; Zemni, T.; Zargouni, F. Suitability assessment of deep groundwater for drinking and irrigation use in the Djeffara aquifers (Northern Gabes, south-eastern Tunisia). Environ. Earth Sci. 2014, 71, 3387–3421. [Google Scholar] [CrossRef] [Green Version]
- Westcot, D.W. Quality Control of Wastewater for Irrigated Crop Production (Water Reports-10); FAO; United Nations: Rome, Italy, 1997. [Google Scholar]
- US Department of Agriculture. Diagnosis and improvement of saline and alkali soils. In Agriculture Handbook; US Department of Agriculture: Washington, DC, USA, 1954; Volume 60, pp. 83–100. [Google Scholar]
- Wilcox, L. Classification and Use of Irrigation Waters, no. 969; US Department of Agriculture: Washington, DC, USA, 1955.
- Keesari, T.; Ramakumar, K.L.; Chidambaram, S.; Pethperumal, S.; Thilagavathi, R. Understanding the hydrochemical behavior of groundwater and its suitability for drinking and agricultural purposes in Pondicherry area, South India—A step towards sustainable development. Groundw. Sustain. Dev. 2016, 2–3, 143–153. [Google Scholar] [CrossRef]
- Rawat, K.S.; Singh, S.K.; Gautam, S.K. Assessment of groundwater quality for irrigation use: A peninsular case study. Appl. Water Sci. 2018, 8, 233. [Google Scholar] [CrossRef] [Green Version]
- Ahmed, F.T.; Khan, A.H.A.N.; Khan, R.; Saha, S.K.; Alam, F.; Dafader, N.C.; Sultana, S.; Bin Elius, I.; Al Mamum, S. Characterization of arsenic contaminated groundwater from central Bangladesh: Irrigation feasibility and preliminary health risks assessment. Environ. Nanotechnol. Monit. Manag. 2021, 15, 100433. [Google Scholar] [CrossRef]
- Bhat, M.A.; Wani, S.A.; Singh, V.K.; Sahoo, J.; Tomar, D.; Sanswal, R. An overview of the assessment of groundwater quality for irrigation. J Agric. Sci. Food Res 2018, 9, 9. [Google Scholar]
- Avci, H.; Dokuz, U.E.; Avci, A.S. Hydrochemistry and groundwater quality in a semiarid calcareous area: An evaluation of major ion chemistry using a stoichiometric approach. Environ. Monit. Assess. 2018, 190, 641. [Google Scholar] [CrossRef]
- Anim-Gyampo, M.; Anornu, G.; Appiah-Adjei, E.; Agodzo, S. Quality and health risk assessment of shallow groundwater aquifers within the Atankwidi basin of Ghana. Groundw. Sustain. Dev. 2019, 9, 100217. [Google Scholar] [CrossRef]


| Well (Site No.) | X-Latitude | Y-Longitude | WD, m | SWL, m | DWL, m | Discharge, L/s |
| S1 | 32 9 59.64° | 44 11 46.02° | 183 | 48 | 45 | 7 |
| S2 | 32 9 56.7° | 44 14 7.08° | 172 | 25 | 48 | 9 |
| S3 | 32 9 58.2° | 44 15 41.28° | 50 | 24.9 | 32.1 | 6 |
| S4 | 32 10 22.02° | 44 16 46.32° | 50 | 16 | 22 | 7 |
| S5 | 32 10 46.26° | 44 17 58.68° | 50 | 18 | 25 | 9 |
| Score | <25 | 26–50 | 51–75 | 76–100 | >100 |
|---|---|---|---|---|---|
| IWQI class | Excellent | Good | Poor | Very poor | Unsuitable |
| Possible usage | Drinking, irrigation, and industrial | Drinking, irrigation, and industrial | irrigation and industrial | irrigation | Proper treatment required before use. |
| SAFE | UNSAFE | ||||
| Indices | Formula | Ref. |
|---|---|---|
| SAR | [25] | |
| SSP | [26] | |
| RSC | [27] | |
| PS | [28] | |
| KR | [29] | |
| MH | [30] | |
| TH | [30] | |
| PI | [28] |
| Parameters | Units | Minimum | Maximum | Mean | Std. Deviation |
|---|---|---|---|---|---|
| pH | - | 6.9 | 8.0 | 7.34 ± 0.2 | 0.46 |
| EC | µs/cm | 4680 | 5960 | 5026 ± 238 | 534.12 |
| TDS | mg/L | 2995 | 3814 | 3216.56 ± 153 | 341.87 |
| Ca2+ | mg/L | 180.68 | 471.34 | 333.077 ± 48 | 108.40 |
| Mg2+ | mg/L | 453.78 | 1089.00 | 669.659 ± 113 | 252.30 |
| Na+ | mg/L | 400 | 490 | 447.6 ± 18 | 39.89 |
| K+ | mg/L | 32.8 | 46.0 | 38.56 ± 2.33 | 5.21 |
| HCO3− | mg/L | 12.20 | 31.73 | 22.926 ± 4.13 | 9.23 |
| Cl− | mg/L | 969.5 | 3278.0 | 1861.3 ± 527 | 1179.00 |
| PO43− | mg/L | 0.01 | 0.12 | 0.068 ± 0.02 | 0.04 |
| NO3− | mg/L | 0.000 | 63.435 | 40.9504 ± 12.44 | 27.81 |
| SO42− | mg/L | 1040 | 1940 | 1512 ± 148 | 330.33 |
| Parameters | Units | Agriculture Standard [23] | Unit Weights (Wi) |
|---|---|---|---|
| pH | - | 7.25 | 0.011594 |
| Total dissolved solid (TDS) | mg/L | 2000 | 0.000042 |
| Carbonate (CO32−) | meq/L | 0.1 | 0.840600 |
| Bicarbonate (HCO3−) | meq/L | 10 | 0.008406 |
| Chloride (Cl−) | meq/L | 30 | 0.002802 |
| Calcium (Ca2+) | meq/L | 20 | 0.004203 |
| Magnesium (Mg2+) | meq/L | 5 | 0.016812 |
| Sodium (Na+) | meq/L | 40 | 0.002102 |
| Potassium (K+) | mg/L | 2 | 0.042030 |
| Phosphate-P (PO4-P) | mg/L | 2 | 0.042030 |
| Nitrate-N (NO3+-N) | mg/L | 10 | 0.008406 |
| Ammonium-N (NH4+-N) | mg/L | 5 | 0.016812 |
| Sulfate (SO42−) | meq/L | 20 | 0.004203 |
| 1.0000 | |||
| Scheme 32. | Para. | pH | TDS | CO32− | HCO3− | Cl− | Ca2+ | Mg2+ | Na+ | K+ | PO4-P | NO3+-N | NH4+-N | SO42− | WQI |
|---|---|---|---|---|---|---|---|---|---|---|---|---|---|---|---|
| S1 | Vi | 8.00 | 3186.20 | 0.06 | 0.52 | 30.00 | 5.89 | 9.34 | 21.22 | 37.80 | 0.03 | 5.60 | 1.16 | 12.13 | 139 |
| Qi | 400 | 159.31 | 60.00 | 5.20 | 100.00 | 29.46 | 186.7 | 53.04 | 1890.0 | 1.30 | 56.00 | 23.30 | 60.63 | ||
| QiWi | 4.64 | 0.01 | 50.44 | 0.04 | 0.28 | 0.12 | 3.14 | 0.11 | 79.44 | 0.05 | 0.47 | 0.39 | 0.25 | ||
| S2 | Vi | 7.20 | 2994.20 | 0.00 | 0.40 | 27.48 | 4.24 | 10.20 | 21.30 | 46.00 | 0.02 | 14.55 | 2.07 | 9.38 | 103 |
| Qi | 80.0 | 149.71 | 0.00 | 4.00 | 91.60 | 21.21 | 203.9 | 53.26 | 2300.0 | 1.14 | 145.45 | 41.47 | 46.88 | ||
| QiWi | 0.93 | 0.01 | 0.00 | 0.03 | 0.26 | 0.09 | 3.43 | 0.11 | 96.67 | 0.05 | 1.22 | 0.70 | 0.20 | ||
| S3 | Vi | 7.60 | 3039.00 | 0.00 | 0.24 | 27.31 | 3.61 | 12.93 | 18.48 | 35.00 | 0.04 | 14.30 | 1.03 | 10.38 | 82 |
| Qi | 240 | 151.95 | 0.00 | 2.39 | 91.03 | 18.07 | 258.5 | 46.20 | 1750.0 | 1.96 | 143.00 | 20.50 | 51.88 | ||
| QiWi | 2.78 | 0.01 | 0.00 | 0.02 | 0.26 | 0.08 | 4.35 | 0.10 | 73.55 | 0.08 | 1.20 | 0.34 | 0.22 | ||
| S4 | Vi | 7.00 | 3813.40 | 0.00 | 0.20 | 92.34 | 4.81 | 22.41 | 18.91 | 41.20 | 0.02 | 0.00 | 5.41 | 8.88 | 97 |
| Qi | 0.00 | 190.67 | 0.00 | 2.00 | 307.79 | 24.06 | 448.2 | 47.28 | 2060.0 | 0.98 | 0.00 | 108.25 | 44.38 | ||
| QiWi | 0.00 | 0.01 | 0.00 | 0.02 | 0.86 | 0.10 | 7.53 | 0.10 | 86.58 | 0.04 | 0.00 | 1.82 | 0.19 | ||
| S5 | Vi | 7.00 | 3045.40 | 0.00 | 0.52 | 85.03 | 2.26 | 14.03 | 17.39 | 32.80 | 0.00 | 12.00 | 1.22 | 6.50 | 76 |
| Qi | 0.00 | 152.27 | 0.00 | 5.20 | 283.43 | 11.29 | 280.5 | 43.48 | 1640.0 | 0.16 | 120.00 | 24.38 | 32.50 | ||
| QiWi | 0.00 | 0.01 | 0.00 | 0.04 | 0.79 | 0.05 | 4.72 | 0.09 | 68.93 | 0.01 | 1.01 | 0.41 | 0.14 |
| Indices | Range | Classification | Distribution% |
|---|---|---|---|
| Electrical Conductivity (EC) | <250 | Excellent | - |
| 250–750 | Good | - | |
| 750–2000 | Doubtful | - | |
| >2000 | Unsuitable | 100% | |
| Sodium Adsorption Ratio (SAR) | <10 | Excellent | 100% |
| 10–18 | Good | - | |
| 18–26 | Doubtful | - | |
| >26 | Unsuitable | - | |
| Soluble Sodium Percent (SSP) | <20 | Excellent | - |
| 20–40 | Good | - | |
| 40–60 | Permissible | 80% | |
| 60–80 | Doubtful | 20% | |
| >80 | Unsuitable | - | |
| Residual Sodium Carbonate (RSC) | <1.25 | Good | 100% |
| 1.25–2.5 | Doubtful | - | |
| >2.5 | Unsuitable | - | |
| Total Hardness (TH) | <60 | Soft | 40% |
| 61–120 | Moderately hard | 60% | |
| 121–180 | Hard | - | |
| >180 | Very hard | - | |
| Permeability Index (PI) | Class I (>75) | Excellent | - |
| Class II (25–75) | Good | 100% | |
| Class III (<25) | Poor | - | |
| Potential Salinity (PS) | <3 | Suitable | - |
| >3 | Unsuitable | 100% | |
| Kelley’s Ratio (KR) | <1 | Suitable | 20% |
| >1 | Unsuitable | 80% | |
| Magnesium Hazard Ratio (MHR) | <50 | Suitable | - |
| >50 | Unsuitable | 100% |
| Parameters | None | Slight to Moderate | Sever |
|---|---|---|---|
| EC, μS/cm | <700 | 700–3000 | >3000 |
| TDS, mg/L | <450 | 450–2000 | >2000 |
| Salinity Hazard Class | EC, μS/cm | TDS, mg/L | Classes | Characteristics |
|---|---|---|---|---|
| C1 | 0–250 | <200 | Excellent | Low-salinity water can be utilized to irrigate most soils with little risk of soil salinity developing. |
| C2 | 251–750 | 200–500 | Good | Medium-salinity water can be used for irrigation if there is a moderate quantity of drainage. |
| C3 | 751–2250 | 501–1500 | Permissible | High-salinity water should not be used on soil with poor drainage. Even with adequate drainage, salinity control may necessitate particular management. |
| C4 | >2250 | 1501–3000 | Unsuitable | Very high-salinity water is not suitable for irrigation under normal conditions. |
| Sodium hazard class | SAR meq/L | Irrigation-water suitability | Characteristics | |
| S1 | 0–10 | Low | Suitable for all types of soils except for crops that are particularly sensitive to sodium. | |
| S2 | 10–18 | Medium | Suitable for organic or coarse-textured soils with good permeability. In fine-textured soil, it is unsuitable. | |
| S3 | 18–26 | High | Harmful for almost all types of soils. Good drainage, high leaching, and gypsum addition are all required. | |
| S4 | >26 | Very high | Unsuitable for irrigation. | |
Publisher’s Note: MDPI stays neutral with regard to jurisdictional claims in published maps and institutional affiliations. |
© 2022 by the authors. Licensee MDPI, Basel, Switzerland. This article is an open access article distributed under the terms and conditions of the Creative Commons Attribution (CC BY) license (https://creativecommons.org/licenses/by/4.0/).
Share and Cite
Awad, E.S.; Imran, N.S.; Albayati, M.M.; Snegirev, V.; Sabirova, T.M.; Tretyakova, N.A.; Alsalhy, Q.F.; Al-Furaiji, M.H.; Salih, I.K.; Majdi, H.S. Groundwater Hydrogeochemical and Quality Appraisal for Agriculture Irrigation in Greenbelt Area, Iraq. Environments 2022, 9, 43. https://doi.org/10.3390/environments9040043
Awad ES, Imran NS, Albayati MM, Snegirev V, Sabirova TM, Tretyakova NA, Alsalhy QF, Al-Furaiji MH, Salih IK, Majdi HS. Groundwater Hydrogeochemical and Quality Appraisal for Agriculture Irrigation in Greenbelt Area, Iraq. Environments. 2022; 9(4):43. https://doi.org/10.3390/environments9040043
Chicago/Turabian StyleAwad, Eman Sh., Noor S. Imran, Muthanna M. Albayati, Vyacheslav Snegirev, Tamara M. Sabirova, Natalia A. Tretyakova, Qusay F. Alsalhy, Mustafa H. Al-Furaiji, Issam K. Salih, and Hasan Sh. Majdi. 2022. "Groundwater Hydrogeochemical and Quality Appraisal for Agriculture Irrigation in Greenbelt Area, Iraq" Environments 9, no. 4: 43. https://doi.org/10.3390/environments9040043