Communication

Relationship of Fluoride Concentration to Well Depth in an Alluvial Aquifer in a Semiarid Area

by
María Socorro Espino-Valdés
1,
Daniel F. Rodríguez-Lozano
1,
Mélida Gutiérrez
2,*,
Humberto Silva-Hidalgo
1 and
Adán Pinales-Munguía
1
1
Facultad de Ingeniería, Circuito Universitario, Campus II, Universidad Autónoma de Chihuahua, Chihuahua 31124, Mexico
2
Department of Geography, Geology and Planning, Missouri State University, Springfield, MO 65897, USA
*
Author to whom correspondence should be addressed.
Environments 2022, 9(12), 155; https://doi.org/10.3390/environments9120155
Submission received: 28 September 2022 / Revised: 9 December 2022 / Accepted: 10 December 2022 / Published: 16 December 2022
(This article belongs to the Topic Environmental Toxicology and Human Health)

Abstract

:
Groundwater of northern Mexico contains high concentrations of geogenic fluoride (F), a contaminant known to affect human health. The origin of F in groundwater in this region has been related to the weathering of rhyolite and other volcanic rocks present in the alluvium. However, the relationship of F concentration to water depth has not been established. F concentrations, pH, and total dissolved solids (TSD) were determined for 18 wells within the Meoqui-Delicias aquifer in 2021. The F concentrations varied between 0.62 mg L−1 and 4.84 mg L−1, and 61% of the wells exceeded the 1.5 mg L−1 guideline. F concentrations did not correlate to TDS but correlated to well depth (r = −0.52, p < 0.05). Because of the less-than-strong correlation coefficient value obtained, a diagram of F concentrations vs. well depth was constructed. The diagram showed a distinct enrichment of F in shallow wells, suggesting that groundwater residence time and evaporation may be important factors in explaining the F content within the aquifer. This pattern was confirmed after plotting 2003 and 2006 data for the same wells. These findings are important to better understand the distribution of F in neighboring alluvial aquifers as well as in alluvial aquifers elsewhere.

1. Introduction

Groundwater with high fluoride (F) concentrations occurs in regions of more than 25 countries in the world [1,2]. Recent estimates establish that 180 million people are potentially affected by F, most of them in Asia and Africa [2]. Although the F sources are believed to be geogenic for the most part, there are notable hydrologic, climatic, and geologic differences among the affected regions. Arid and semiarid areas are prone to groundwater with high F concentrations due to prevailing conditions that favor the dissolution of F, such as high pH and alkalinity, warm temperatures, well depth, mean annual precipitation, aquifer lithology, and long residence times [2,3]. Within a particular aquifer, there can also be variations in the F concentration. For example, the F concentration may increase in the deeper parts of a large aquifer [3], but in other cases, it may increase near the discharge area because of a longer residence time, and, since the water is by then found in the shallow part of the aquifer, evaporation may also play a role [4,5]. Hence, geogenic high F groundwaters have been classified into three major types [6]: high F in shallow groundwater, high F in deep groundwater, and high F in geothermal water. Studies that narrow down the affected areas and report their F spatial distribution and the factors responsible for their content have increased in recent years [6,7,8,9].
Ingestion of groundwater containing F is the most common pathway of exposure leading to health problems [10], including a condition known as fluorosis [1,11]. The standard guideline for F concentration in drinking water set by the World Health Organization and by many countries is 1.5 mg L−1 F; however, a limit of 1.0 mg L−1 F is advisable in places where people drink more water [1]. Ingesting water above 1.5 mg L−1 F causes teeth discoloration (dental fluorosis), whereas chronic ingestion of higher concentrations (e.g., 4.0 mg L−1 F) has more serious consequences to human health, affecting the bones (skeletal fluorosis) and vital organs, as well as developing neurotoxic and metabolic effects [10,11,12]. The health predicament complicates when arsenic (As) is found co-occurring with F, as is the case in many regions worldwide [12,13,14,15,16,17,18,19,20,21,22,23,24].
The guideline in Mexico for drinking water is 1.5 mg L−1 F [25], but in the future, it will be 1.0 mg L−1 F, a change that will take a few years to be fully implemented [14]. High concentrations of F in the groundwater of northern Mexico are common, where concentrations up to 28 mg L−1 F have been observed [10]. Among the most affected regions in Mexico with high F concentrations are the states of Chihuahua, Durango, and Zacatecas [14]. In the state of Chihuahua, a median of 1.4 mg L−1 F with 45% of sampled wells exceeding the 1.5 mg L−1 F guideline was reported for samples collected in 2017–2019 [10]. Another study, based on 445 groundwater samples from rural communities of southeast Chihuahua, found F concentrations varying between 0.05 and 11.8 mg L−1 F, and 37.2% of these samples exceeded the 1.5 mg L−1 F guideline [15]. Most of the F studies report the presence of both F and As [3,16,17,18,24].
In the alluvial aquifers of northern and central Mexico, the origin of F has been reported as geogenic, associated with the weathering of silicate-rich rocks such as rhyolite and ignimbrite [9,13,15,24]. These studies also report that the distribution of F concentrations varies greatly with location [13,14,15]. Therefore, factors that might explain this variability are constantly sought, among them the depth of the well, groundwater extraction, and total dissolved solids (TDS). Well-known factors responsible for high F concentrations include aridity, alkalinity, and the presence of silicate-rich rocks [2,3]. Less explored factors include well depth, residence time, and the input of anthropogenic contaminants [10,16]. The objectives of this study were to determine the relationship between F concentration and well depth in an alluvial aquifer in northern Mexico and to infer about the variation in this pattern in space and time.

2. Materials and Methods

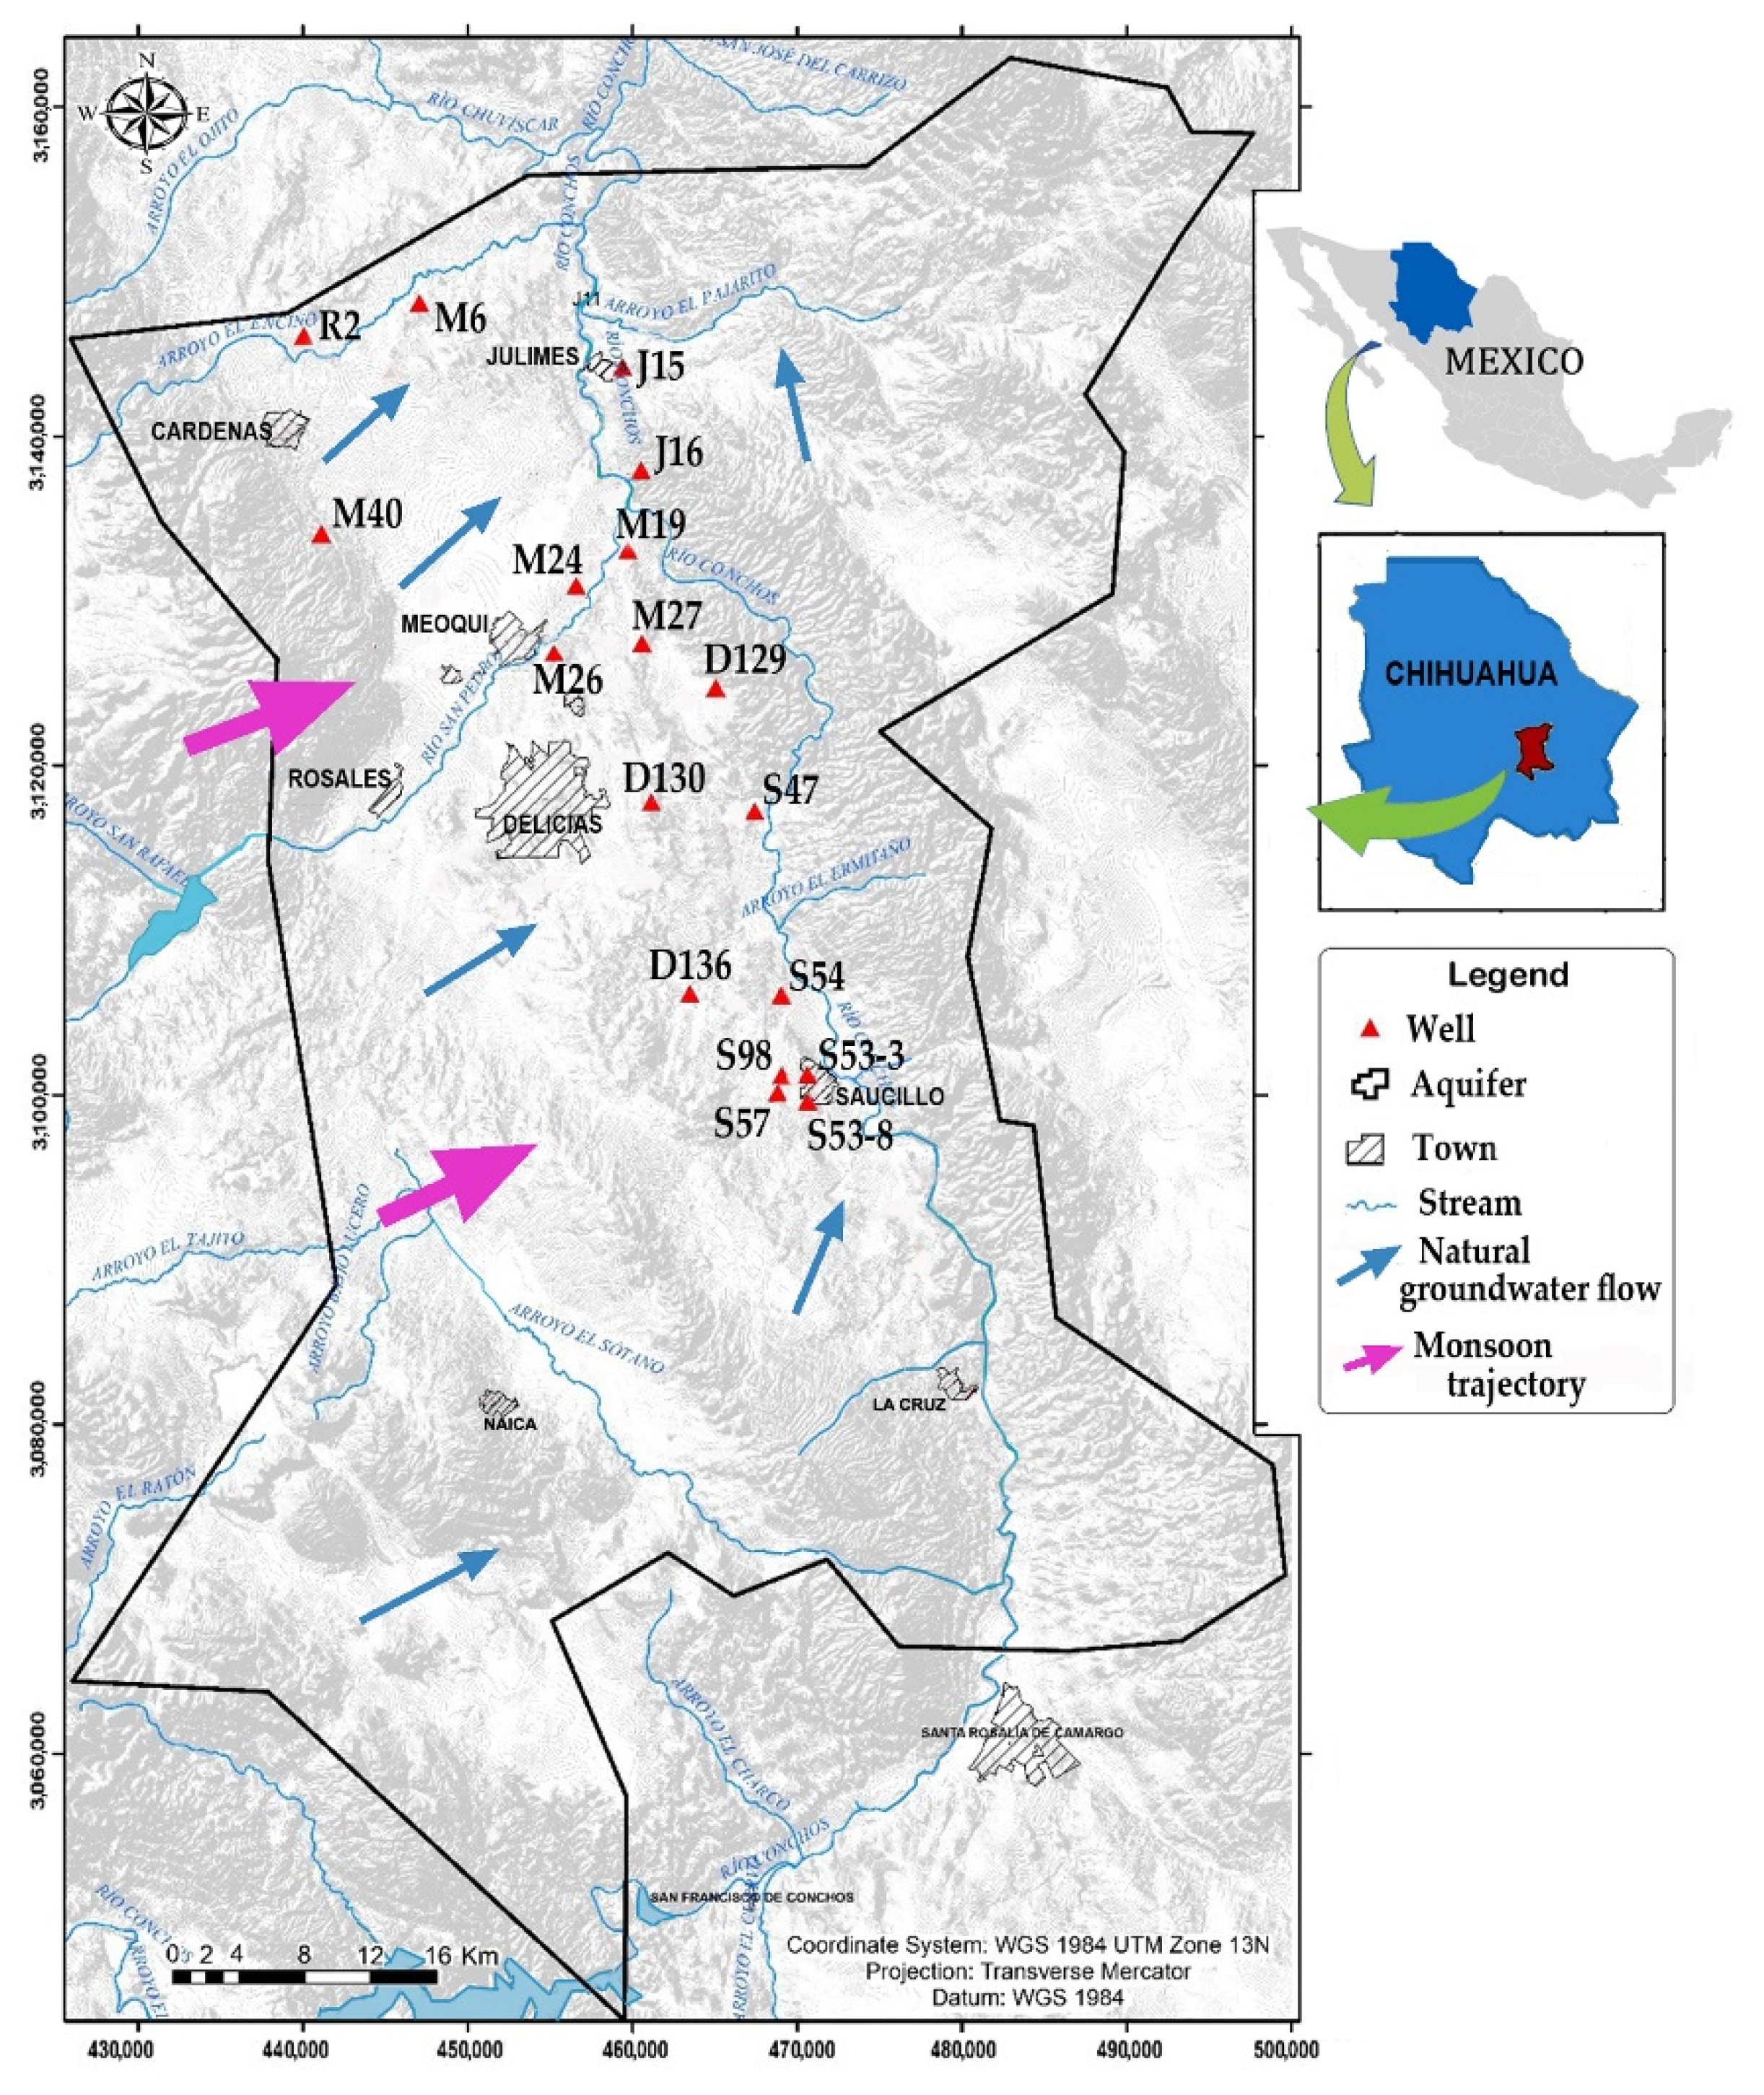
2.1. Description of the Study Area

The study area comprises the Meoqui-Delicias aquifer, an overexploited alluvial aquifer located in the central part of the state of Chihuahua, Mexico. This aquifer underlies a region of irrigated agriculture and dairy farm operations known as Distrito de Riego 005. The aquifer occupies a surface area of 4830 km2 and has an irregular geometry, with a maximum thickness of 500 m and an average thickness of 300 m [26]. The aquifer is recharged primarily in the many arroyos and the alluvial fans that form at the base of hills that rise on its western part, but a significant recharge likely occurs at the fields, which are irrigated with surface water [26]. The local discharge areas are the Rio Conchos and Rio San Pedro, and the regional groundwater flows in a northerly direction. Although this is a primarily unconfined aquifer, under clay lenses, it operates as a confined aquifer.
The climate is semiarid, with an average annual precipitation of 284 mm. Most of the precipitation occurs during the monsoon season (July to September). The aquifer provides drinking water to several communities (total pop. ≈200,000) and contributes 17% of the water used to irrigate crops [27]. However, this amount may vary depending on the amount of surface water available, e.g., during dry periods, when more groundwater is extracted.

2.2. Sampling and Analyses
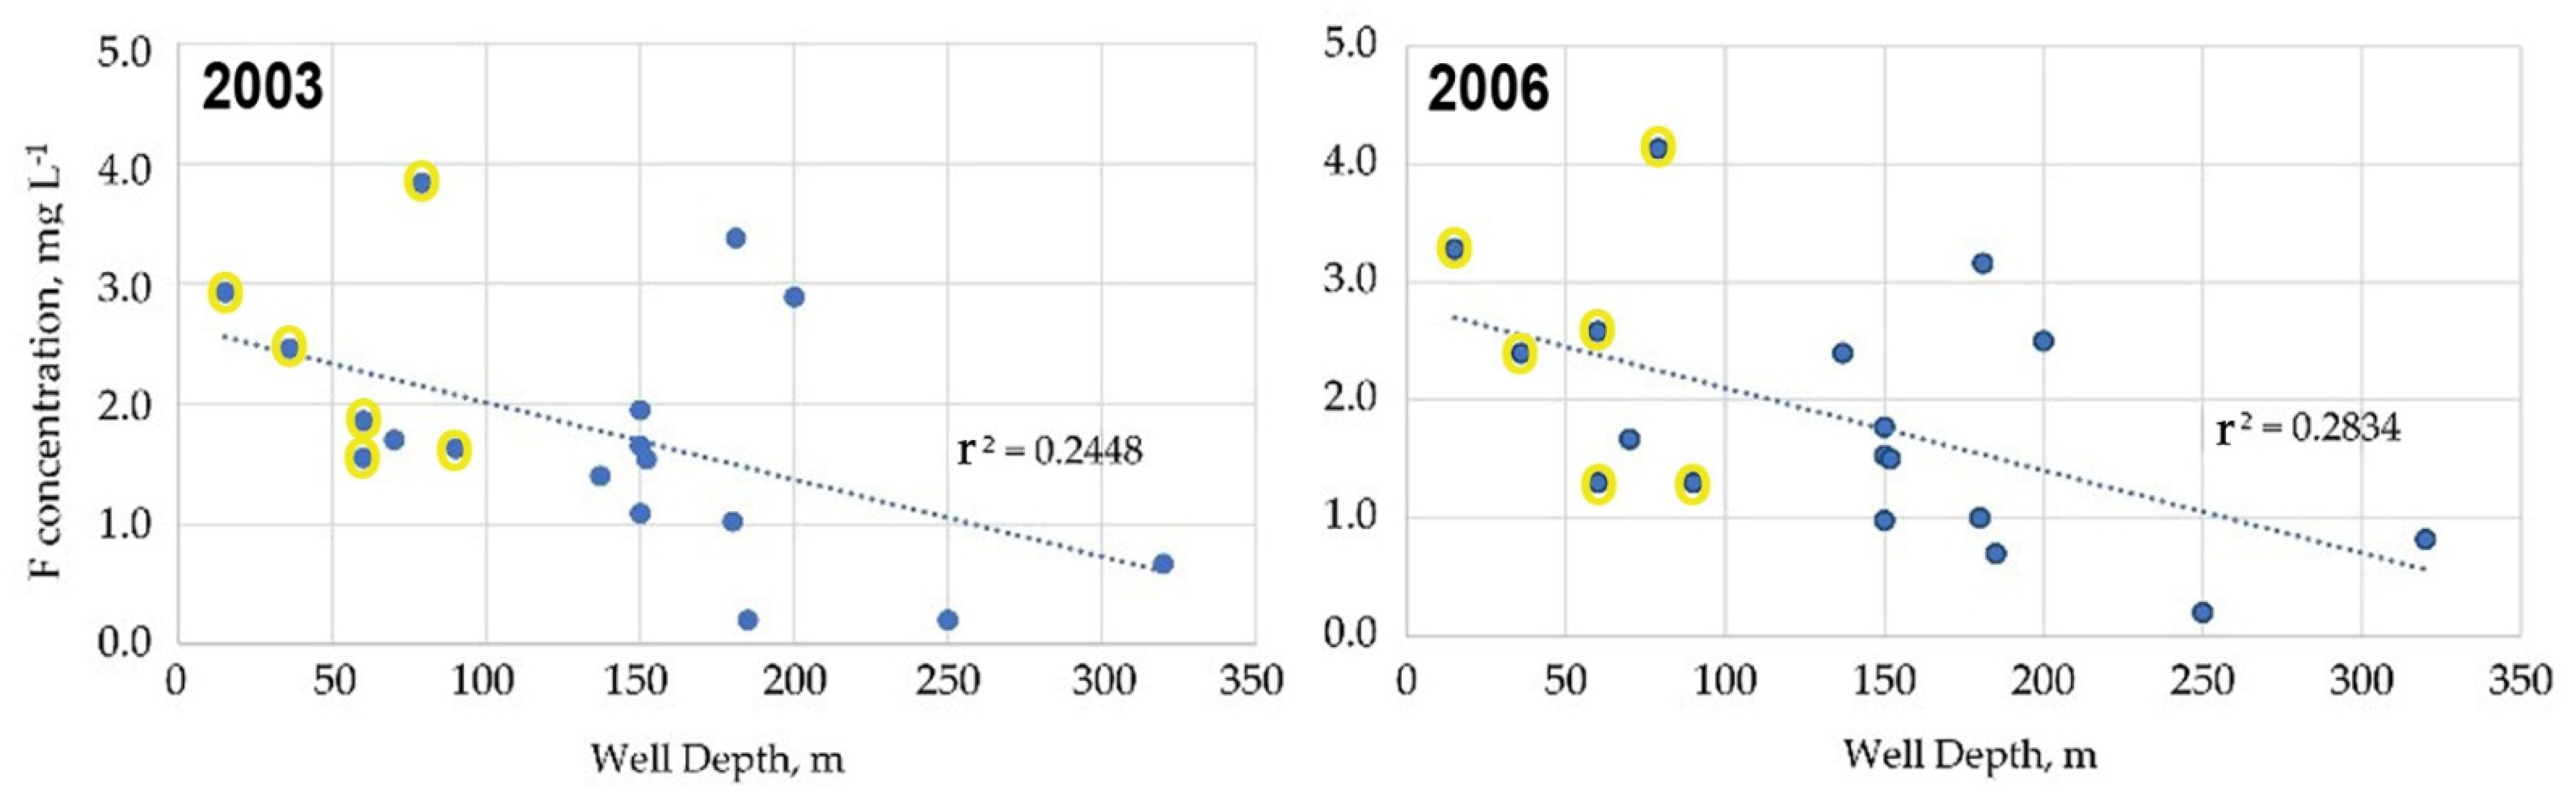
The groundwater was sampled from 18 wells in 2021 according to standard procedure [25]. The location of these wells, natural groundwater flow direction, and the prevalent trajectory of monsoon rains are shown in Figure 1. The wells included here were selected to match those wells for which F concentrations were reported in 2003 and 2006 [26]. The major ion concentration of groundwater in these wells sampled in 2006 is shown in Figure 2 (Tables S1 and S2 in Supplementary Material).
Temperature, pH, electrical conductivity, and TDS were measured in the field using a HANNA HI9828 multiparameter probe. Groundwater samples were kept cool during their transport to the laboratory, where they were analyzed for F concentration using a selective ion electrode, according to the standard method [28]. All reagents were of analytical quality. The F electrode and multiparameter probe were calibrated daily. The probe was calibrated using pH 4, 7, and 10 calibrating solutions and a 1413 µS conductivity calibrating solution, whereas the F electrode was calibrated using 1.0 mg/L F and 10 mg/L F standard solutions. Replicates were determined at least every 10 samples.
The locations of the sampled wells were plotted using ArcMap with WGS 1984 coordinate System and a Transverse Mercator Projection, and the map was constructed at a 1:380,000 scale. A Spearman correlation was utilized to determine the correlation between F concentrations and TDS, as well as between F concentration and well depth.

3. Results

The results are listed in Table 1. The median of the 2021 F concentration values is 1.58 mg L−1 F, and 61% of the samples exceeded the 1.5 mg L−1 F guideline. This result would imply health problems in the form of dental fluorosis. However, this problem has not spread through the population because of small inverse osmosis filters fitted to many of the wells in the city of Delicias and in most of the rural communities [27]. The water quality reflected in Figure 2 shows Ca and Na are major cations that vary over a broad range of values and shows a similar behavior for anions SO4 and HCO3. According to Figure 2, concentration variations seem to be independent of well depth. This behavior is likely the result of the heterogeneity of the alluvial fill and solutes leaked down after the intensive agricultural practices taking place on the surface (increase in TDS and soil salinization) [26,27,29].
A concentration map of each of F and TDS allows for a better visualization of their concentration patterns. The spatial distributions of F concentration and TDS for 2021 data are shown in Figure 3. TDS values are lower in wells within or near the natural recharge area (wells R2, M40, M24, and M26) and increase as they approach the discharge areas. The pronounced increase in TDS in two wells, one in the northern part of the aquifer and one in the center of the aquifer, may be due to infiltration of irrigation return flows and other wastes containing large amounts of dissolved salts, e.g., dairy farm effluents [29]. F concentrations followed a different pattern than TDS as was confirmed by their low correlation. F concentrations increased at discharge areas, and their overall distribution pattern is rather irregular, as reported in other studies in northern Mexico [14].
The Spearman correlation coefficient between F concentrations and TDS was low (r = 0.24), and p, the probability of r being significant at 95% (α = 0.05, two tailed), was not significant at p < 0.05. A visual comparison between the plotted concentrations (Figure 3) shows a roughly similar pattern, except for wells M24 and D130, whose difference in concentrations was high enough to lower the correlation coefficient below the 95% confidence threshold. In contrast, the correlation coefficient between F concentration and well depth was −0.52 and was significant at p < 0.05. As a way to validate the relationship between well depth and F concentrations, and since the correlation was moderate and not a strong one, the 2021 data were plotted (Figure 4). The diagram clearly shows decreasing F concentrations with increasing well depth, which means that the F concentration is highest in shallower wells and, for the most part, coincides with discharge areas.

4. Discussion

Although TDS is reportedly associated with high F concentrations [3], this relationship was not validated in the Meoqui-Delicias aquifer. The low correlation between F concentrations and TDS is likely the result of human activities taking place at the surface and the infiltration of both excess surface water used to irrigate crops and domestic and dairy farm wastes [29]. However, F concentrations correlated, albeit weakly and inversely, to water depth. Few studies report the relationship between F concentration and well depth; however, high F concentration in the shallow part of overexploited alluvial aquifers have been reported in the western United States [30] and in northern China [6,7,31].
The moderate correlation (correlation coefficient −0.52 for 2021 data) between F concentrations and well depth may be a reflection of the heterogeneity of the alluvium and change in groundwater flow direction near some wells, as extensive extractions of groundwater are common in overexploited aquifers such as the Meoqui-Delicias aquifer [27]. To validate the F–well depth association, data from 2003 and 2006 [26] were plotted. The graphs, shown in Figure 5, indicate a behavior that is similar to the one observed for 2021. Therefore, the higher F concentrations being associated with shallow wells was not a one-time occurrence but rather a confirmed pattern.
The above results help develop a conceptual model for F concentration in groundwater, as follows: Rain infiltrates through the arroyos and alluvial fans at the base of hills and starts flowing as groundwater toward the discharge areas. As groundwater comes in contact with the silicate-rich rock fragments in the alluvial material, it picks up F that is naturally released via chemical weathering, incorporating it into the aquifer through the vertical flow of F-rich water. As groundwater approaches the central part of the aquifer, it mixes with irrigation drainage water, and the direction of flow changes according to the new potentiometric levels created by groundwater withdrawals of some wells, resulting in an increase in its residence time and its F concentration. Once the groundwater reaches the shallow depth near the discharge areas, evaporation further heightens the F concentration.
From the public health point of view, 67%, 61%, and 61% of wells surpassed the 1.5 mg L−1 F guideline in 2003, 2006, and 2021, respectively, and only one well (J15) had a concentration above 4 mg L−1 F, although this occurred consistently in all sampled years. The results obtained here agree with the F concentration behavior reported for other arid areas worldwide contaminated with geogenic F [3,4,5]. Based on this information, an effective strategy to mitigate the problem would be to direct remediation actions to wells where the highest F concentrations are to be expected, including wells near groundwater discharge areas as well as those with a historically high F content.

5. Conclusions

The results of the 2021 study show F concentrations varying between 0.62 and 4.84 mg L−1 F. Once these concentrations were plotted on a map, F concentrations were lower in recharge areas and higher in discharge areas, which highlights the groundwater residence time as a controlling process to the F content in groundwater. The shallow groundwater depth in discharge areas will also allow a further increase in F concentration through evaporation. TDS in this area has a large anthropogenic component, i.e., irrigation return flows and dairy farm effluents, which affected the correlation to F concentration. Since the Spearman correlation between F concentrations and well depth was only moderate, the data were then plotted into F concentrations vs. well depth, and the resulted diagram showed F concentration decreasing with increasing depth. These results were confirmed after comparing this graph to the graphs of 2003 and 2006 data for the same wells. The moderate correlation coefficients and low regression values obtained for the relation between F concentration and well depth could be due to the heterogeneity of the alluvium and the changes in local water flow direction generated by irregular and often large groundwater withdrawals in some wells used to irrigate crops, especially during dryer years. In sum, groundwater residence time and evaporation, in this order, seemed to be additional factors significantly affecting F concentration besides the well-known factors of alluvium mineral composition and alkalinity.

Supplementary Materials

The following supporting information can be downloaded at: https://www.mdpi.com/article/10.3390/environments9120155/s1, Table S1: Laboratory analytical procedures and Mexican technical standards describing analytical methodologies and quality controls for the analytical determination of arsenic, fluoride, pH and physicochemical parameters of water.; Table S2: Water quality of major ions in groundwater samples collected in 2006 [26].

Author Contributions

Conceptualization, M.S.E.-V. and H.S.-H.; methodology, M.S.E.-V.; software, M.S.E.-V.; validation, M.S.E.-V., A.P.-M. and H.S.-H.; formal analysis, M.S.E.-V.; investigation, M.S.E.-V. and M.G.; resources, A.P.-M.; data curation, H.S.-H.; writing—original draft preparation, M.S.E.-V. and D.F.R.-L.; writing—review and editing, M.G.; visualization, D.F.R.-L.; supervision, M.S.E.-V.; project administration, A.P.-M. and H.S.-H.; funding acquisition, M.S.E.-V. All authors have read and agreed to the published version of the manuscript.

Funding

This research received no external funding.

Institutional Review Board Statement

Not applicable.

Informed Consent Statement

Not applicable.

Data Availability Statement

Data and methodology are reported in detail in Rodríguez-Lozano D.F. Evolución espacial y temporal de la presencia de fluoruros en el acuífero Meoqui-Delicias, Chihuahua. M.S. Thesis. Universidad Autónoma de Chihuahua, Facultad de Ingenieria, Mexico. 2022.

Acknowledgments

The authors are grateful for the constructive comments and insightful reviews from three anonymous reviewers. We also thank Nayeli Villalobos and Alejandro Hernández for helping with driving to the study area and taking the sample and field measurements and the farmers who kindly allowed access to their well to take the samples and measurements.

Conflicts of Interest

The authors declare no conflict of interest.

References

  1. Kimambo, V.; Bhattacharya, P.; Mtalo, F.; Mtamba, J.; Ahmad, A. Fluoride occurrence in groundwater systems at global scale and status of defluoridation—State of the art. Groundw. Sustain. Dev. 2019, 9, 100223. [Google Scholar] [CrossRef]
  2. Podgorsky, J.; Berg, M. Global analysis and prediction of fluoride in groundwater. Nat. Commun. 2022, 13, 4232. [Google Scholar] [CrossRef] [PubMed]
  3. McMahon, P.B.; Brown, C.J.; Johnson, T.D.; Belitz, K.; Lindsey, B.D. Fluoride occurrence in United States groundwater. Sci. Total Environ. 2020, 732, 139217. [Google Scholar] [CrossRef] [PubMed]
  4. Guo, Q.; Wang, Y.; Ma, T.; Ma, R. Geochemical processes controlling the elevated fluoride concentrations in ground waters of the Taiyuan Basin, Northern China. J. Geochem. Explor. 2007, 93, 1–12. [Google Scholar] [CrossRef]
  5. Jia, H.; Qian, H.; Qu, W.; Zheng, L.; Feng, W.; Ren, W. Fluoride occurrence and human health risk in drinking water wells from southern edge of Chinese Loess Plateau. Int. J. Environ. Res. Public Health 2019, 16, 1683. [Google Scholar] [CrossRef] [PubMed] [Green Version]
  6. Wang, Y.; Zheng, C.; Ma, R. Review: Safe and sustainable groundwater supply in China. Hydrogeol. J. 2018, 26, 1301–1324. [Google Scholar] [CrossRef]
  7. Li, J.; Wang, Y.; Zhu, C.; Xue, X.; Qian, K.; Xie, X.; Wang, Y. Hydrogeochemical processes controlling the mobilization and enrichment of fluoride in groundwater of the North China Plain. Sci. Total Environ. 2020, 730, 138877. [Google Scholar] [CrossRef]
  8. Su, H.; Kang, W.; Kang, N.; Liu, J.; Li, Z. Hydrogeochemistry and health hazards of fluoride-enriched groundwater in the Tarim Basin, China. Environ. Res. 2021, 200, 111476. [Google Scholar] [CrossRef]
  9. Gutiérrez, M.; Alarcón-Herrera, M.T. Fluoruro en aguas subterráneas de la región centro-norte de México y su posible origen. Rev. Int. Contam. Ambient. 2022, 38, 389–397. [Google Scholar] [CrossRef]
  10. Kumar, S.; Singh, R.; Venkatesh, A.S.; Udayabhanu, G.; Sahoo, P.R. Medical Geological assessment of fluoride contaminated groundwater in parts of Indo-Gangetic Alluvial plains. Sci. Rep. 2019, 9, 16243. [Google Scholar] [CrossRef]
  11. Edmunds, W.M.; Smedley, P.L.; Selinus, O. Fluoride in natural waters. In Essentials of Medical Geology, 2nd ed.; Alloway, B., Centeno, J.A., Finkelman, R.B., Fuge, R., Lindh, U., Smedley, P.L., Eds.; Springer: New York, NY, USA, 2013; pp. 311–336. [Google Scholar]
  12. Jiménez-Córdova, M.I.; Sánchez-Peña, L.C.; Barrera-Hernández, A.; González-Horta, C.; Barbier, O.; Del Razo, L.M. Fluoride is associated with altered metabolism of arsenic in an adult Mexican population. Sci. Total Environ. 2019, 684, 621–628. [Google Scholar] [CrossRef] [PubMed]
  13. Alarcón-Herrera, M.T.; Martin-Alarcon, D.A.; Gutiérrez, M.; Reynoso-Cuevas, L.; Martín-Domínguez, A.; Olmos-Márquez, M.A.; Bundschuh, J. Co-occurrence, possible origin, and health-risk assessment of arsenic and fluoride in drinking water sources in Mexico: Geographical data visualization. Sci. Total Environ. 2020, 698, 134168. [Google Scholar] [CrossRef] [PubMed]
  14. González-Horta, C.; Ballinas-Casarrubias, L.; Sánchez-Ramírez, B.; Ishida, M.C.; Barrera-Hernández, A.; Gutiérrez-Torres, D.; Zacarias, O.L.; Saunders, R.J.; Drobná, Z.; Mendez, M.A.; et al. A Concurrent Exposure to Arsenic and Fluoride from Drinking Water in Chihuahua, Mexico. Int. J. Environ. Res. Public Health 2015, 12, 4587–4601. [Google Scholar] [CrossRef] [PubMed] [Green Version]
  15. Navarro, O.; Gonzalez, J.; Júnez-Ferreira, H.E.; Bautista, C.-F.; Cardona, A. Correlation of arsenic and fluoride in the groundwater for human consumption in a semiarid region of Mexico. Procedia Eng. 2016, 186, 333–340. [Google Scholar] [CrossRef]
  16. Armienta, M.A.; Segovia, N. Arsenic and fluoride in the groundwater of Mexico. Environ. Geochem. Health 2008, 30, 345–353. [Google Scholar] [CrossRef] [PubMed]
  17. Fernández-Macías, J.C.; Ochoa-Martínez, A.C.; Orta-García, S.T.; Varela-Silva, J.A.; Pérez-Maldonado, I.N. Probabilistic human health risk assessment associated with fluoride and arsenic co-occurrence in drinking water from the metropolitan area of San Luis Potosí, Mexico. Environ. Monit. Assessm. 2020, 192, 712. [Google Scholar] [CrossRef]
  18. Li, C.C.; Gao, X.B.; Zhang, X.; Wang, Y.X.; Howard, K. Groundwater fluoride and arsenic mobilization in a typical deep aquifer system within a semi-arid basin. J. Hydrol. 2022, 609, 127767. [Google Scholar] [CrossRef]
  19. He, X.; Li, P.; Ji, Y.; Wang, Y.; Su, Z.; Elumalai, V. Groundwater arsenic and fluoride and associated arsenicosis and fluorosis in China: Occurrence, distribution and management. Exp. Health 2020, 12, 355e368. [Google Scholar] [CrossRef]
  20. Maity, J.P.; Vithanage, M.; Kumar, M.; Ghosh, A.; Mohan, D.; Ahmad, A.; Bhattacharya, P. Seven 21st century challenges of arsenic-fluoride contamination and remediation. Groundw. Sustain. Dev. 2021, 12, 100538. [Google Scholar] [CrossRef]
  21. Cinti, D.; Vaselli, O.; Poncia, P.P.; Brusca, L.; Grassa, F.; Procesi, M.; Tassi, F. Anomalous concentrations of arsenic, fluoride and radón in volcanic sedimentary aquifers from central Italy: Quality indexes for management of the water resource. Environ. Pollut. 2019, 253, 525–537. [Google Scholar] [CrossRef]
  22. Kumar, M.; Goswami, R.; Patel, A.K.; Srivastava, M.; Das, N. Scenario, perspectives, and mechanism of arsenic and fluoride co-occurrence in the groundwater: A review. Chemosphere 2020, 249, 126126. [Google Scholar] [CrossRef] [PubMed]
  23. Ortega-Guerrero, M.A. Presencia, distribución, hidrogeoquimica y origen de arsénico, fluoruro y otros elementos traza disueltos en agua subterránea, a escala de cuenca hidrológica tributaria de Lerma-Chapala, Mexico. Rev. Mex. Cienc. Geol. 2009, 26, 143–161. [Google Scholar]
  24. Reyes-Gómez, V.M.; Alarcón-Herrera, M.T.; Gutiérrez, M.; Núñez-López, D. Fluoride and arsenic in an alluvial aquifer system in Chihuahua, Mexico: Contaminant levels, potential sources, and co-occurrence. Water Air Soil Pollut. 2013, 224, 1433. [Google Scholar] [CrossRef]
  25. NOM014-SSA1-1993; Norma Oficial Mexicana. Procedimientos Sanitarios Para el Muestreo de Agua Para uso y Consumo Humano en Sistemas de Abastecimiento de Agua Públicos y Privados. Secretaría de Salud: Mexico City, Mexico, 1993. Available online: https://dof.gob.mx/nota_detalle.php?codigo=4801645&fecha=12/11/1993#gsc.tab=0 (accessed on 9 December 2022).
  26. Rodríguez-Lozano, D.F. Evolución Espacial y Temporal de la Presencia de Fluoruros en el Acuífero Meoqui-Delicias, Chihuahua. Master’s Thesis, Facultad de Ingenieria, Universidad Autónoma de Chihuahua, Chihuahua, Mexico, 2022. [Google Scholar]
  27. Gutiérrez, M.; Calleros-Rincón, E.Y.; Espino-Valdés, M.S.; Alarcón-Herrera, M.T. Role of nitrogen in assessing the sustainability of irrigated areas: Case study of northern Mexico. Water Air Soil Pollut. 2021, 232, 148. [Google Scholar] [CrossRef]
  28. NMX-AA-077-SCFI-2001; Determination of Fluoride in natural Wastewaters Treated Wastewaters-Test Method. Secretaría de Economía: Mexico City, Mexico, 2001. Available online: https://www.gob.mx/cms/uploads/attachment/file/166793/NMX-AA-077-SCFI-2001.pdf (accessed on 9 December 2022).
  29. Lucero, B.A.R.; Gutiérrez, M.; Magaña, J.E.M.; Salcido, F.M.; Fierro, W.M. Salt Content of Dairy Farm Effluents as an Indicator of Salinization Risk to Soils. Soil Syst. 2018, 2, 61. [Google Scholar] [CrossRef] [Green Version]
  30. Rosecrans, C.; Belitz, K.; Ransom, K.M.; Stackelberg, P.E.; McMahon, P.B. Predicting regional fluoride concentrations at public and domestic supply depths in basin-fill aquifers of the western United States using a random forest model. Sci. Total Environ. 2022, 806, 150960. [Google Scholar] [CrossRef]
  31. Li, D.; Gao, X.; Wang, Y.; Luo, W. Diverse mechanisms drive fluoride enrichment in groundwater in two neighboring sites in northern China. Environ. Pollut. 2018, 237, 430–441. [Google Scholar] [CrossRef]
Figure 1. Meoqui-Delicias aquifer and location of the sampled wells. Samples are labeled using the first letter of the nearest community (D for Delicias, M for Meoqui, R for Rosales, J for Julimes, and S for Saucillo) followed by a number.
Environments 09 00155 g001
Figure 2. Piper diagram showing major ion concentration of the sampled wells.
Environments 09 00155 g002
Figure 3. (a) Total dissolved solids (TDS) and (b) F concentrations in the sampled wells.
Environments 09 00155 g003
Figure 4. F concentration vs. well depth for 2021 data. Points with a yellow rim are located at a discharge area.
Environments 09 00155 g004
Figure 5. F concentration vs. well depth for 2003 and 2006 data. Points with a yellow rim are located at a discharge area.
Environments 09 00155 g005
Table 1. Fluoride (F) concentrations, pH, and TDS in groundwater.
WellLocationDepth
m
F 2003 1
mg L−1
F 2006 1
mg L−1
F 2021
mg L−1
pH 2021TDS 2021
mg L−1
D139La Merced701.701.671.567.70794
D130Santa Fe3200.670.820.947.302059
D136Est. Armendáriz2002.892.502.617.19863
J15Julimes793.844.134.847.041193
J16Ex-hacienda H.152.933.283.577.43890
M6Potrero del Llano1813.383.163.397.91953
M19El Torreón601.862.583.127.98701
M24Las Puentes362.462.402.857.43539
M26Fco. Portillo1501.090.980.917.54355
M27Nuevo Loreto1501.651.531.677.12675
M40Est. Consuelo1501.951.771.857.03398
R2Barranco Blanco1521.541.501.607.38587
S47Orranteño901.631.301.317.03735
S54Gomeño601.551.301.527.31786
S56-3Saucillo P31850.200.700.756.74834
S56-8Saucillo P82500.200.200.627.23843
S57Vicente Guerrero1801.021.000.897.58456
S98Est. Saucillo1371.402.401.327.22668
(1) F concentrations for 2003 and 2006 reported in [26].
Publisher’s Note: MDPI stays neutral with regard to jurisdictional claims in published maps and institutional affiliations.

