Article

Differentiation between Impacted and Unimpacted Microbial Communities of a Nitrogen Contaminated Aquifer

by
Justin G. Morrissy
1,*,
Suzie M. Reichman
2,3,
Matthew J. Currell
1,4,
Aravind Surapaneni
5,6,
Mallavarapu Megharaj
7,8,
Nicholas D. Crosbie
9,
Daniel Hirth
10,
Simon Aquilina
11,
William Rajendram
12 and
Andrew S. Ball
6
1
School of Engineering, RMIT University, GPO Box 2476, Melbourne, VIC 3001, Australia
2
Centre for Anthropogenic Pollution Impact and Management (CAPIM), University of Melbourne, Parkville, VIC 3010, Australia
3
School of BioSciences, University of Melbourne, Parkville, VIC 3010, Australia
4
Water: Effective Technologies & Tools Research Centre, RMIT University, GPO Box 2476, Melbourne, VIC 3001, Australia
5
South East Water, Frankston, VIC 3199, Australia
6
ARC Training Centre for the Transformation of Australia’s Biosolids Resource, School of Science, RMIT University, Bundoora West, VIC 3083, Australia
7
Global Centre for Environmental Remediation (GCER), Faculty of Science, ATC Building, The University of Newcastle, Callaghan, NSW 2308, Australia
8
Cooperative Research Centre for Contamination Assessment and Remediation of Environment (CRC CARE), The University of Newcastle, ATC Building, Callaghan, NSW 2308, Australia
9
Melbourne Water, Docklands, VIC 3008, Australia
10
BlueSphere Environmental, Southbank, VIC 3006, Australia
11
Gippsland Water, Traralgon, VIC 3844, Australia
12
Greater Western Water, Sunbury, VIC 3429, Australia
*
Author to whom correspondence should be addressed.
Environments 2022, 9(10), 128; https://doi.org/10.3390/environments9100128
Submission received: 15 July 2022 / Revised: 26 September 2022 / Accepted: 30 September 2022 / Published: 9 October 2022

Abstract

:
Nitrogen contamination is ubiquitous across the globe; as a result of this, the need to understand and predict the extent and effects of nitrogen contamination on microbial ecosystems is increasingly important. This paper utilises a dataset that provides a rare opportunity to observe varying contamination conditions in a single aquifer and understand the differences between potential background bores and two different types of contamination spread across the other bores. Using physicochemical and microbiological community analysis, this paper aims to determine the impacts of the two contaminants, nitrate and ammonia, on the microbial communities and the differences between polluted and physicochemical background bores. Total nitrogen (N) varied by a factor of over 2000 between bores, ranging from 0.07 to 155 mg L−1. Nitrate (NO3) concentrations ranged from 150 to <0.01 mg L−1; ammonium (NH4+) concentrations ranged from 26 to <0.1 mg L−1. MANOVA analysis confirmed an overall significant relationship (p = 0.0052) between N variables and the physicochemical data (or status) of the three areas of contamination dubbed ‘contamination zones’. The contamination zones were defined by no known presence of contamination in the uncontaminated bores, the presence of NO3 contamination and the presence of NO3 and NH4+ contamination. PERMANOVA analysis confirmed that there was an overall significant difference in the microbial communities between the three contamination zones (p = 0.0002); however, the presence of NH4+ had a significant effect (p = 0.0012). In general, the nitrate-contaminated bores showed a decrease in the abundance of individual OTUs. We further confirmed that NH4+ contamination had a significant relationship with an increased percentage of abundance occupied by the Planctomycetota phylum (specifically the Candidatus Brocadia genus). It was found that one of the two background bores (BS-004) was likely also representative of natural microbial background, and another (BS-002) showed characteristics that may be representative of past or intermittent contamination. This paper demonstrates a possible way to determine the microbial background and discusses the potential uses for this information.

Graphical Abstract

1. Introduction

Pollution of land and water is a trillion-dollar issue globally, contributing to the loss of biodiversity, acidification of oceans, eutrophication of water sources and global climate change [1,2]. Many contaminants have been so widely present, for such a long period, that it has become challenging to determine what ecosystems and environments were before their presence. Nitrogen contamination is currently less prominent in media coverage and public debate than global climate change or plastic pollution; however, it is one of the oldest and most widespread environmental contaminants. The impact of nitrogen pollution includes an increasing incidence of eutrophication globally, as well as an increased incidence of respiratory distress and methemoglobinaemia in humans [3,4]. Nitrate is also one of the main sources of groundwater contamination [5]. Nitrogen contamination originates from many sources: overuse of fertilisers in agriculture, leakage of privately owned wastewater tanks, leakage of wastewater treatment plant (WWTP) infrastructure and leakage of chemical by-products from industrial applications, to name a few [6]. The artificial fixation of nitrogen has more than doubled natural global nitrogen fixation from ~203 Tg·N·yr−1 to ~413 Tg·N·yr−1; however, the rate of conversion of reactive nitrogen back into atmospheric nitrogen has been unable to keep up at ~339 Tg·N·yr−1 [6]. As a result, nitrogen is accumulating in the environment, which can be seen in the increasing rates of eutrophication and multiple papers discussing the different effects of nitrogen pollution [7,8,9].

1.1. Physicochemical Background

Establishing background conditions is essential to understanding the extent and/or effect of any contamination in a region. Without a background assessment, it becomes difficult to differentiate between areas with naturally different physicochemical or microbial characteristics and areas that have been altered due to anthropogenic influence. Additionally, situations where remediation efforts are put in place in areas where they are not necessarily needed can potentially be avoided by first establishing background conditions. Determining the background of physicochemical properties can be exceptionally difficult in situations where contamination is ubiquitous. As a result of this, other factors need to be considered to assist in the differentiation between background and contaminated conditions.

1.2. Microbial Background

Microbial communities represent a vast reservoir of potential, in their capability to perform natural ecosystem functions, such as their huge influence on all the major and minor global nutrient cycles, their ability to adapt to changes in their ecosystems, and their ability to resist and degrade various pollutants [10,11]. The adaptability of microbial communities is often viewed as one of their most remarkable traits, especially in the fields of contamination and remediation. However, the consequences that come about through changes to ecosystem structure and function because of adaptation are rarely considered. This is exacerbated by a lack of ability to determine the differences between unimpacted and impacted microbial communities.
Physicochemical testing and background are well-established benchmarks, have been thoroughly explored within the literature by authors such as Reimann and Garrett [12] and Panno et al. [13] and are well-understood methods for assessing the impacts of contamination in the environment. In contrast, our understanding of microbial ecosystems and their background states, in groundwater or otherwise, is lacking. Microbial background is also far more complex than that of a physicochemical background; for example, in the data set presented in this paper, there are over 6000 operational taxonomic units (OTUs), all of which may react differently under various conditions. Delving straight into the complexity of understanding the natural ranges of 6000 microbial populations and how they interact with each other, and the constantly changing physicochemical and environmental conditions, even in environments considered stable, such as groundwater, is a huge undertaking. Initially, to mitigate some of this complexity, looking at some of the larger elements of the microbial communities is likely a good starting point. Additionally, it is likely that the exact structure of the microbial ecosystem is constantly slightly shifting; however, the major ecosystem functions should remain relatively consistent. Steube et al. [14] and Griebler et al. [15] discuss the importance of determining the background for both physicochemical and ecological parameters for groundwater and speculate about general parameters, such as biomass and community structure, that could be used to calculate the background for microbial communities. However, despite both papers using statistical analysis to establish background thresholds for the physicochemical properties, neither was able to make progress towards definitive methods for differentiating between contaminated and background microbial communities. The data collected for this paper presents an opportunity to study both unimpacted communities and communities impacted by several pollution sources simultaneously across a relatively small region within a single aquifer. The changes in the microbial communities across different contaminated and uncontaminated regions allow us to determine the characteristics of the different impacted and unimpacted microbial communities and use this to differentiate between them.
The aims of this paper are to:
  • Determine how nitrogen contamination influences the structure and ecosystem functions of the microbial communities of a nitrogen-contaminated aquifer.
  • Use microbial community data and physicochemical data to explore how to differentiate between impacted and unimpacted microbial communities.
  • Demonstrate the value of microbial functional group analysis in the characterisation of the impact and extent of groundwater contamination.
Our previous work in Morrissy et al. [16] identified that nitrogen pollution had an effect on the microbial communities at the Boneo site in Victoria, Australia; additionally, multiple papers have discussed the structure of microbial communities and how they change over different conditions [17,18,19]. The importance of this work lies in the novelty of utilising a relatively small dataset to show the effects of pollution on the major ecosystem functions of microbial communities in groundwater and how we can use this information to predict contaminant impact, fate, and behaviour in groundwater. This should be of particular interest to industries involved in contamination as it shows how much information can be gained from utilising 16S sequencing even for a relatively short-term and inexpensive sampling campaign.

2. Materials and Methods
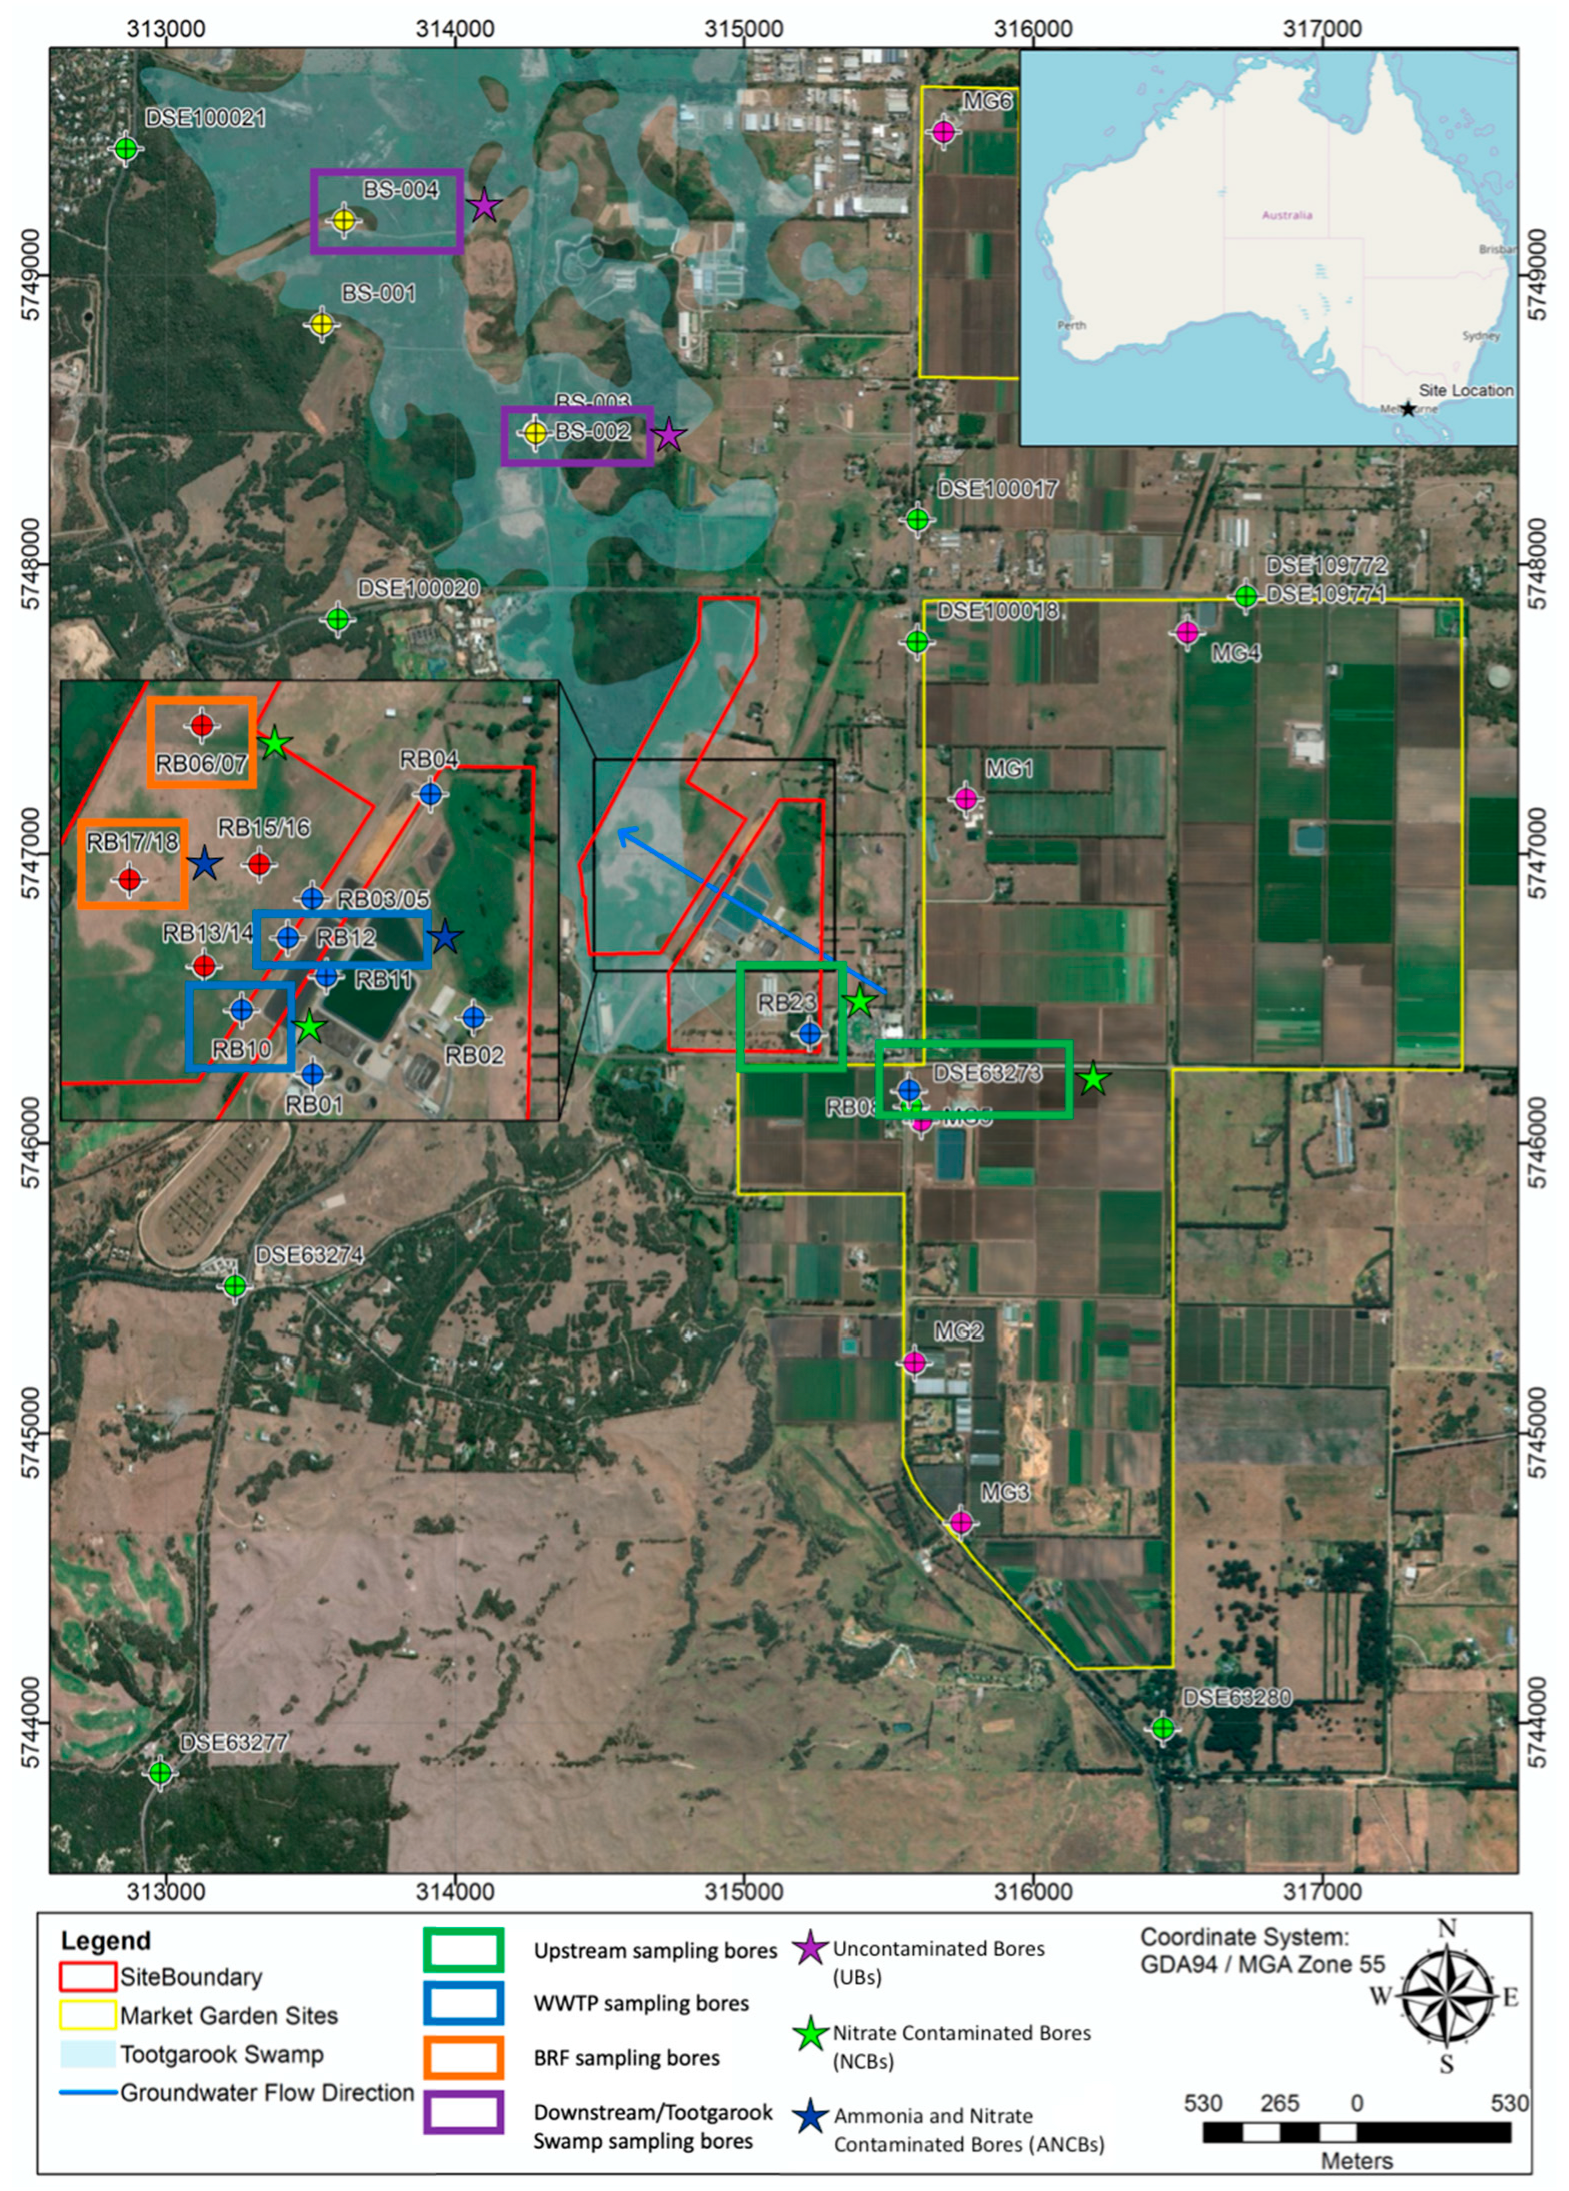
Other than the data analysis, the methods adopted here are the same as those outlined in Morrissy et al. [16] (with some minor rewording), as this current paper is a further analysis of the data (towards the objectives outlined above) as a part of a larger research project.

2.1. Study Area

A detailed description of the sampling site (Figure 1) can be found in Adebowale et al. [20] and McCance et al. [21]. Briefly, the site is approximately 80 km southeast of Melbourne, Australia. The site represents a typical example of a region with multiple current and historical nitrogen contamination sources. The main nitrogen groundwater plume was centred around the wastewater treatment plant (WWTP); however, due to the up-gradient intensive agriculture (market garden farms) and down-gradient cattle grazing paddocks, the normal background concentration of nitrogen and thus the extent of influence of the WWTP versus other sources was challenging to determine. Delineation of current and historical contamination plumes at the site are discussed in McCance et al. [21] and McCance et al. [22]; the main plume extends from bore site RB11 across RB12 and through RB13/14 and past RB17/18 (Figure 1).
The Quaternary Bridgewater Formation was the primary aquifer of concern at this site. It comprises carbonate-cemented aeolian sands and is unconfined and up to 100 m thick [23]. Across the region, the hydraulic conductivity of the aquifer averages approximately 20 m/day [23]. Further details about the aquifer setting and site history can be found in McCance et al. [21] and McCance et al. [22].

2.2. Sampling Timeline and Locations

For the duration of the study, consisting of three sampling campaigns, 10 bores were sampled and a total of 24 groundwater samples were taken. All bores were not able to be sampled on every sampling campaign (hence 24 samples instead of 30); all samples were taken in triplicate (resulting in a total of 72 subsamples). The three sampling campaigns took place in August 2018, November 2018 and May 2019 (more detail on the bores sampled in each campaign can be found in Morrissy et al. [16] Table 1). The locations of the sampled bores are shown in Figure 1. Further details about the bores are described in Adebowale et al. [20]. The groundwater flowed from southeast to northwest. Bores DSE63273 and RB23 are both up-gradient from the WWTP (in terms of the regional groundwater flow direction—see McCance et al. [21]). Bores RB10 and RB12 are adjacent to each other within the WWTP boundary; RB17/18 and RB06/07 are nested bores (one shallow, one deeper) within the Browns Road Farm down-gradient of the WWTP. Bores BS02 and BS04 are located further north along the groundwater flow direction, within the Tootgarook Swamp, within a conservation reserve. These sites currently show no indication of nitrate or any other contamination from either the WWTP or agriculture. Further details about the groundwater flow paths can be found in McCance et al. [22].

2.3. Sampling Techniques, Technology and Guidelines

Groundwater samples were collected in accordance with environmental protection agency (EPA) Victoria guidelines [24,25] using low flow sampling techniques. For monitoring bores, the standing water level was first measured using a Solinst interface probe, and then continuously monitored during low-flow pumping, along with field physio-chemical parameters (electrical conductivity, oxidation-reduction potential, dissolved oxygen, temperature and pH). These parameters were monitored using a multi-parameter field probe (YSI Pro Plus or HACH HQ40D) [20]. Samples were collected following stabilisation of these parameters.

2.4. Major Ions and Nutrients Analysis

Samples for analysis of major ions and nutrients were collected into bottles provided by Australian Laboratory Services (ALS laboratory) and delivered to the laboratory on the same day for analysis, using standard analytical techniques required under the National Association of Testing Authorities (NATA) accreditation. Sample duplicates, triplicates and field blanks were collected according to the standard operating procedures (Table S1) and analysed for quality assurance; all reported data met the necessary reporting thresholds of these methods.

2.5. Microbial Analysis

2.5.1. Sampling

Samples for microbial analysis were collected in sterilised 1 L, round, borosilicate amber glass laboratory bottles. Bottles were sterilised in an autoclave at standard temperature and pressure before being sealed and transported to the sampling location. After collection, samples were transported back to the lab and filtered using a Microfil, mixed cellulose esters, 0.22 µm white gridded, sterile filter within a sterile filter apparatus. Filtered samples were stored at −20 ℃ in a freezer within 24 h of collection.

2.5.2. DNA Extraction and Sequencing

Once the samples from all sampling rounds were processed, they were removed from the freezer, and DNeasy PowerWater Kits used to extract the DNA from the filtered samples. After extraction, samples were processed for 16S rRNA sequencing using the Nextera ® XT Index Kit (Illumina, San Diego, CA, USA) as outlined in the 16S Metagenomic Sequencing Library Preparation guide provided by Illumina. The DNA from the library was quantified using Qubits 2.0 Fluorometer (Life Technologies, Carlsbad, CA, USA) and 2100 Bioanalyzer (Agilent Technologies, Santa Clara, CA, USA). The samples were pooled and run in a MiSeq platform (Illumina, San Diego, CA, USA) at the School of Science, RMIT University [26].

2.5.3. File Preparation

Following sequencing, the raw files were copied from the MiSeq machine and loaded into R studio along with all the collected environmental data (including the major ions and nutrients), where further processing and analysis were completed. Raw files were trimmed, chimeric reads were removed, and reads were grouped into operational taxonomic units (OTUs) and assigned taxonomic classifications. This was performed using the Applecorn script (https://github.com/MonashBioinformaticsPlatform/applecorn) (accessed on 13 September 2019), and taxonomic classifications used the silva (132) database for reference.

2.5.4. Data Analysis

Multiple MANOVAs were used to determine significant differences between the contamination zones and multiple PERMANOVAs were used to determine the effects of the contamination zones and nitrogen molecules on the microbial communities. Sunburst charts were made in excel using the OTU abundance data that was exported from R studio (a list of the primary packages used throughout R studio analysis can be seen in Table S2). The term OTU will be used in reference to the lowest taxonomic level of analysis when referring to our data throughout the rest of this paper. The method of grouping OTUs is typically accurate up until the genus level; however, it can underestimate species richness (i.e., each OTU may represent more than one species) [27]. OTUs are preferable in this case as they are more inclined to slightly overestimate the impact of a contaminant rather than underestimate the impact. Additionally, there is no real effect on the comparisons between samples as they all use the same method, the effect would only come into play when comparing richness data to other datasets.

3. Results

3.1. Physicochemical Properties

Total N varied by a factor of over 2000, ranging from 155 to 0.07 mg L−1, with the highest concentration found in bore DSE63273 (Table 1). The high concentration of total N at this site was likely due to being immediately downstream from an agricultural region and adjacent to a poultry manure stockpile [20]. The lowest concentration of total nitrogen was found in the BS-002 bore in the Tootgarook Swamp; this bore was chosen as a potential representative of uncontaminated groundwater (with respect to N) in the region.
Nitrate (NO3) concentrations ranged from 150 to <0.01 mg L−1 across the sampled bores, with the highest concentration also found in bore DSE63273. The lowest concentration of NO3, which was below the detection limit, was found in bore BS-004, in the Tootgarook Swamp, which is further evidence of the minimal anthropogenic impact at this site. Together with bore BS-002, the two Tootgarook Swamp bores, from the site history and physicochemical evidence, were considered to represent (to the best extent possible) unimpacted sites. This considers the low nitrogen concentrations and their location within the aquifer and region. These concentrations also coincide with concentrations seen in historical data of the now-contaminated bores from before they were contaminated; it should be noted that both the agricultural region and the WWTP predate the beginning of the historical data (unpublished data). Ammonium (NH4+) concentrations ranged from 26 to <0.1 mg L−1 across the bores, with the highest NH4+ concentration found in RB12. The concentration of NH4+ was below detection limits in bores RB23, RB10, RB17 and RB06 and at or close to the detection limits in bores BS-002 and BS-004. The highest concentrations of NH4+ was within and immediately downstream from the RB12 side of the WWTP.
Nitrate (NO3) concentrations ranged from 150 to <0.01 mg L−1 across the bores, with the highest NO3 concentration found in DSE63273. The concentration of NO3 was at or close to the detection limits in bores BS-002 and BS-004. The highest concentrations of NO3 were immediately downstream from the agricultural region with the concentrations generally decreasing the further downstream they were, with the exception of a spike at the location of the RB12 bore. Total nitrogen shows similar trends to the NO3; however, no samples were at or below the detection limits. Table 1 also shows that most of the nutrients in bores BS-002 and BS-004 had lower concentrations than the other bores, while RB07 and BS-004 had somewhat higher concentrations of iron (Fe) than the other bores.

3.2. Nitrogen and Physicochemical Properties in Contamination Zones

The analysis of the data presented in Morrissy et al. [16] allowed us to identify three ‘contamination zones’ which were defined by no known presence of contamination in the uncontaminated bores (UB’s) (BS-002 and BS-004), the presence of NO3 contamination (NCBs) (bores DSE63273, RB23, RB10 and RB6/7) and the presence of NO3 and NH4+ contamination (ANCBs) (bores RB12 and RB17/18). Using MANOVA analysis of the physicochemical data with the N variables as the dependent variables, we determined if there was any statistically significant difference between the contamination zones with regard to N contamination (Table 2). The MANOVA shows an overall significant relationship (p = 0.0052) between N variables and contamination zones. Pairwise analysis shows a significant relationship between the NCBs and the UBs (p = 0.0079) and ANCBs (p = 0.0133), and a significant relationship between the ANCBs and the UBs (p = 0.0438).

3.3. Nitrogen and Microbial Communities in Contamination Zones

When analysing the microbial community data, we used PERMANOVA analysis to show that there was an overall significant difference between the three contamination zones (Pr (>F) = 0.0002) (Table 2). We also tested to see if the presence of NH4+ had a significant effect (Pr (>F) = 0.0012) (Table 2). This showed that although much of the variance can be explained by the presence of NH4+, more of the variance can be explained by the contamination zones. The pairwise analysis of the contamination zones shows that there are significant differences between the ANCBs and both the UBs (Pr (>F) = 0.0099) and NCBs (Pr (>F) = 0.0001), but not between the UBs and the NBCs (Pr (>F) = 0.4048). The fact that the contamination zones explained more of the variance indicates that the effect of the plume extending from the WWTP may not be solely attributed to NH4+. Pairwise analysis also confirms the original test results that most, but not all, of the variance between the contamination zones can be explained by the presence of NH4+ (Pr (>F) UB-NCB = 0.4323, Pr (>F) UB-ANCB = 0.0453 and Pr (>F) NCB-ANCB = 0.0006).

3.4. Major Ecosystem Functions

Determining the ecosystem functions of the ecosystems in different contamination zones and bores requires integrating both the microbial community data and the physicochemical data to understand the functions the major OTUs perform and their purpose. To gain a snapshot of the functions performed by the most abundant microorganisms in the different bores for the study area, the following will discuss the 20 OTUs with the highest abundance, up to 50% (Table 3).

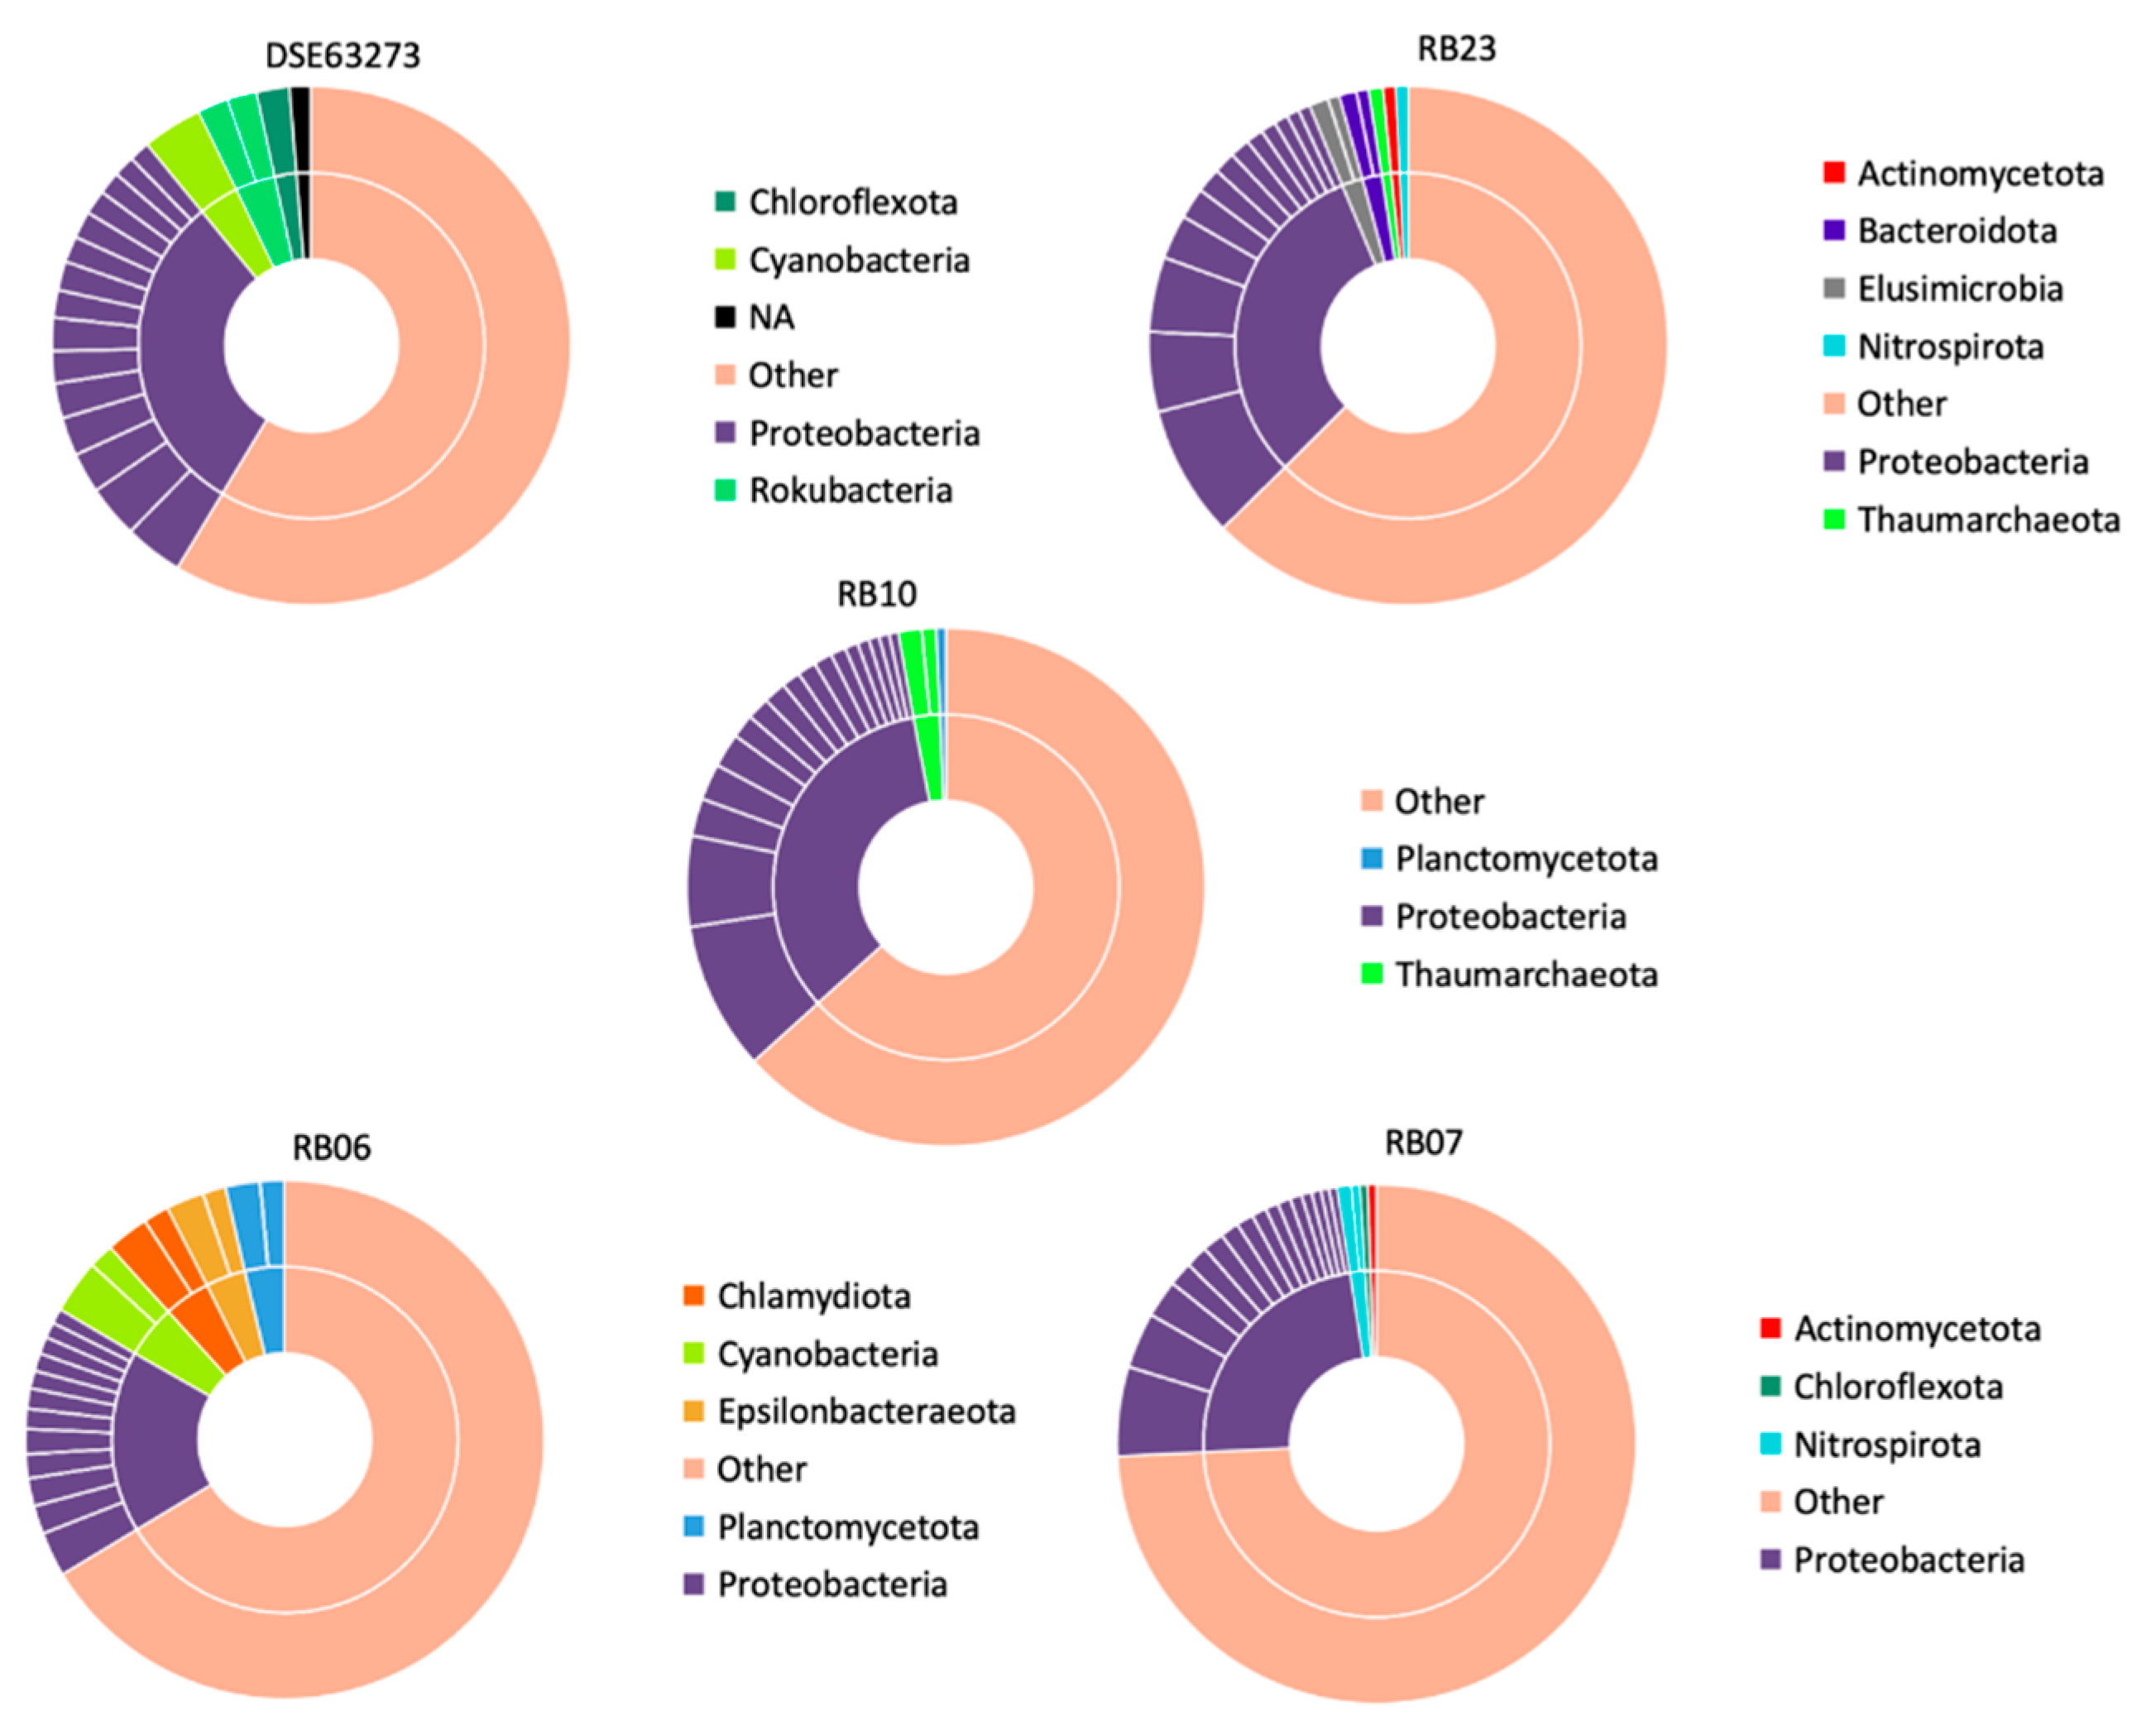
3.4.1. Nitrogen Contaminated Bores (NCB)

  • Bore DSE63273
The 20 OTUs with the highest abundance in the DSE63273 bore made up 41.4% of the total abundance in the bore; 15 of the top 20 were Proteobacteria (30.5%) (Figure 2). Within the Proteobacteria there were two sulphur (S)-reducing Deltaproteobacteria (Family Desulfobulbaceae). The remaining proteobacteria were Gammaproteobacteria consisting of eight methanotrophs (16.9%) (Family Methylomonaceae), two chemotrophs with known resistance to metals (Genus Cupriavidus), two known to mineralise aromatic compounds (Genus Acinetobacter) and one which is associated with agricultural activity, N fixation, S oxidation and can be pathogenic (Genus Stenotrophomonas) [28,29,30]. Additionally present were a class of the Chloroflexota phylum known to be chemoheterotrophic (Class Anaerolineae) [31], an order of the cyanobacteria phylum capable of NO3 reduction (Order Melainabacteria) [32], two Rokubacteria (NC10) thought to couple anaerobic methane (CH4) oxidation with nitrite (NO2) reduction (Family Methylomirabilaceae) [32] and a completely uncharacterised microorganism. The DSE63273 bore resides immediately downstream from an agricultural region and beside a road. Thus, the most abundant microorganisms in bore DSE63273 appeared to be focused around methanotrophs, S reduction and N respiration.
  • Bore RB23
The 20 OTUs with the highest abundance in the RB23 bore made up 37.4% of the total abundance in the bore; 13 of the top 20 were Proteobacteria (31.2%) (Figure 2). Within the Proteobacteria there were two OTUs of Desulfarculaceae, three Gammaproteobacteria with known denitrifiers in the family (Family Burkholderiaceae) [33], and eight Alphaproteobacteria consisting of three complete denitrifiers (Genus Rhodoplanes) [34], two S and Fe reducers (7.4%) (Genus Rhodobacter) [35,36] and three possible degraders of aromatic compounds (14.3%) (Family Sphingomonadaceae). In addition, there was one Fe oxidiser (Class Acidimicrobiia) [37], four fermentative bacteria from the Bacteroidota and Elusimicrobia phyla (Family Chitinophagaceae and Order Elusimicrobia) [38,39], one NO2 oxidiser in the Nitrospirota phylum (Genus Nitrospira) [40] and one NH4+ oxidising archaea in the Thaumarchaeota phylum (Family Nitrosopumilaceae) [41]. Bore RB23 was situated in a small grove of trees slightly upstream from the WWTP and further downstream than bore DSE63723 from the agricultural region. The most abundant microorganisms in bore RB23 focus on NO3 reducers, denitrifiers, NH4+ oxidisers and an equal emphasis on fermentation, Fe and S reduction, and degradation of aromatic compounds.
  • Bore RB10
The 20 OTUs with the highest abundance in the RB10 bore made up 36.7% of the total abundance in the bore; 17 of the top 20 were Proteobacteria (33.8%) (Figure 2). Within the Proteobacteria there were 12 Gammaproteobacteria; three OTUs of Burkholderiaceae, one OTUs of Nitrosomonadaceae and eight opportunistic pathogens from the Pseudomonas (5.5%) and Legionella (18.4%) genera; Pseudomonas is also capable of NO3 reduction [42,43]. Alphaproteobacteria has two OTUs of Rhodoplanes [34], two S reducers (Genus Myxococcales) [44], and a N fixer (Family Rhizobiaceae) [45]. Additionally, there were two OTUs of Nitrosopumilaceae and one ANAMMOX bacteria (Family Brocadiaceae). Bore RB10 resides within the bounds of the WWTP and immediately adjacent to a sludge drying pan. The most abundant microorganisms in bore RB10 were known opportunistic pathogens in humans and microorganisms involved with the N cycle.
  • Bore RB06
The 20 OTUs with the highest abundance in the RB06 bore made up 33.7% of the total abundance in the bore; 14 of the top 20 were Proteobacteria (17.0%) (Figure 2). The Proteobacteria phylum was represented by four OTUs of Sphingomonadaceae, two OTUs of Enterobacteriaceae, two OTUs of Immundisolibacter and a single OTU of Pseudomonas, Stenotrophomonas, an OTU capable of S reduction and acetate, ethanol and propanol degradation (Genus Desulfuromonas) [46] and a sulphate (SO42−) oxidiser (Genus Thermithiobacillus) [47]. Additionally, there were two OTUs of Sericytochromatia, two OTUs of Arcobacter, two OTUs of Candidatus Brocadia and two unknown OTUs from the Chlamydiota phylum. Bore RB06 was situated in the Brown’s Road Farm slightly further downstream from the WWTP than RB17/18 and further north. The most abundant microorganisms in bore RB06 were aromatic compound degraders, S and N-related OTUs and a few pathogenic OTUs.
  • Bore RB07
The 20 OTUs with the highest abundance in the RB07 bore made up 25.8% of the total abundance in the bore, 16 of the top 20 were Proteobacteria (23.4%) (Figure 2). Within the Proteobacteria phylum were 11 OTUs of Fe oxidising bacteria from the Gallionellaceae family (18.5%), three OTUs of Burkholderiaceae and two OTUs of S oxidising, NO2 reducing bacteria (Genus Sulfurifustis) [48]. Additionally, there were two OTUs from the Nitrospirota phylum capable of NO2 oxidation and SO42− reduction (Order Thermodesulfovibrionia) [49], an OTU from the Chloroflexota phylum capable of organohalide-respiration (Order Dehalococcoidia) [50,51] and an OTU from the Actinobacteria phylum that has no relevant functions (Class Solirubrobacterales) [52]. Bore RB07 is paired with RB06; Fe oxidising bacteria dominated the most abundant microorganisms in bore RB07 with some S and N related OTUs.

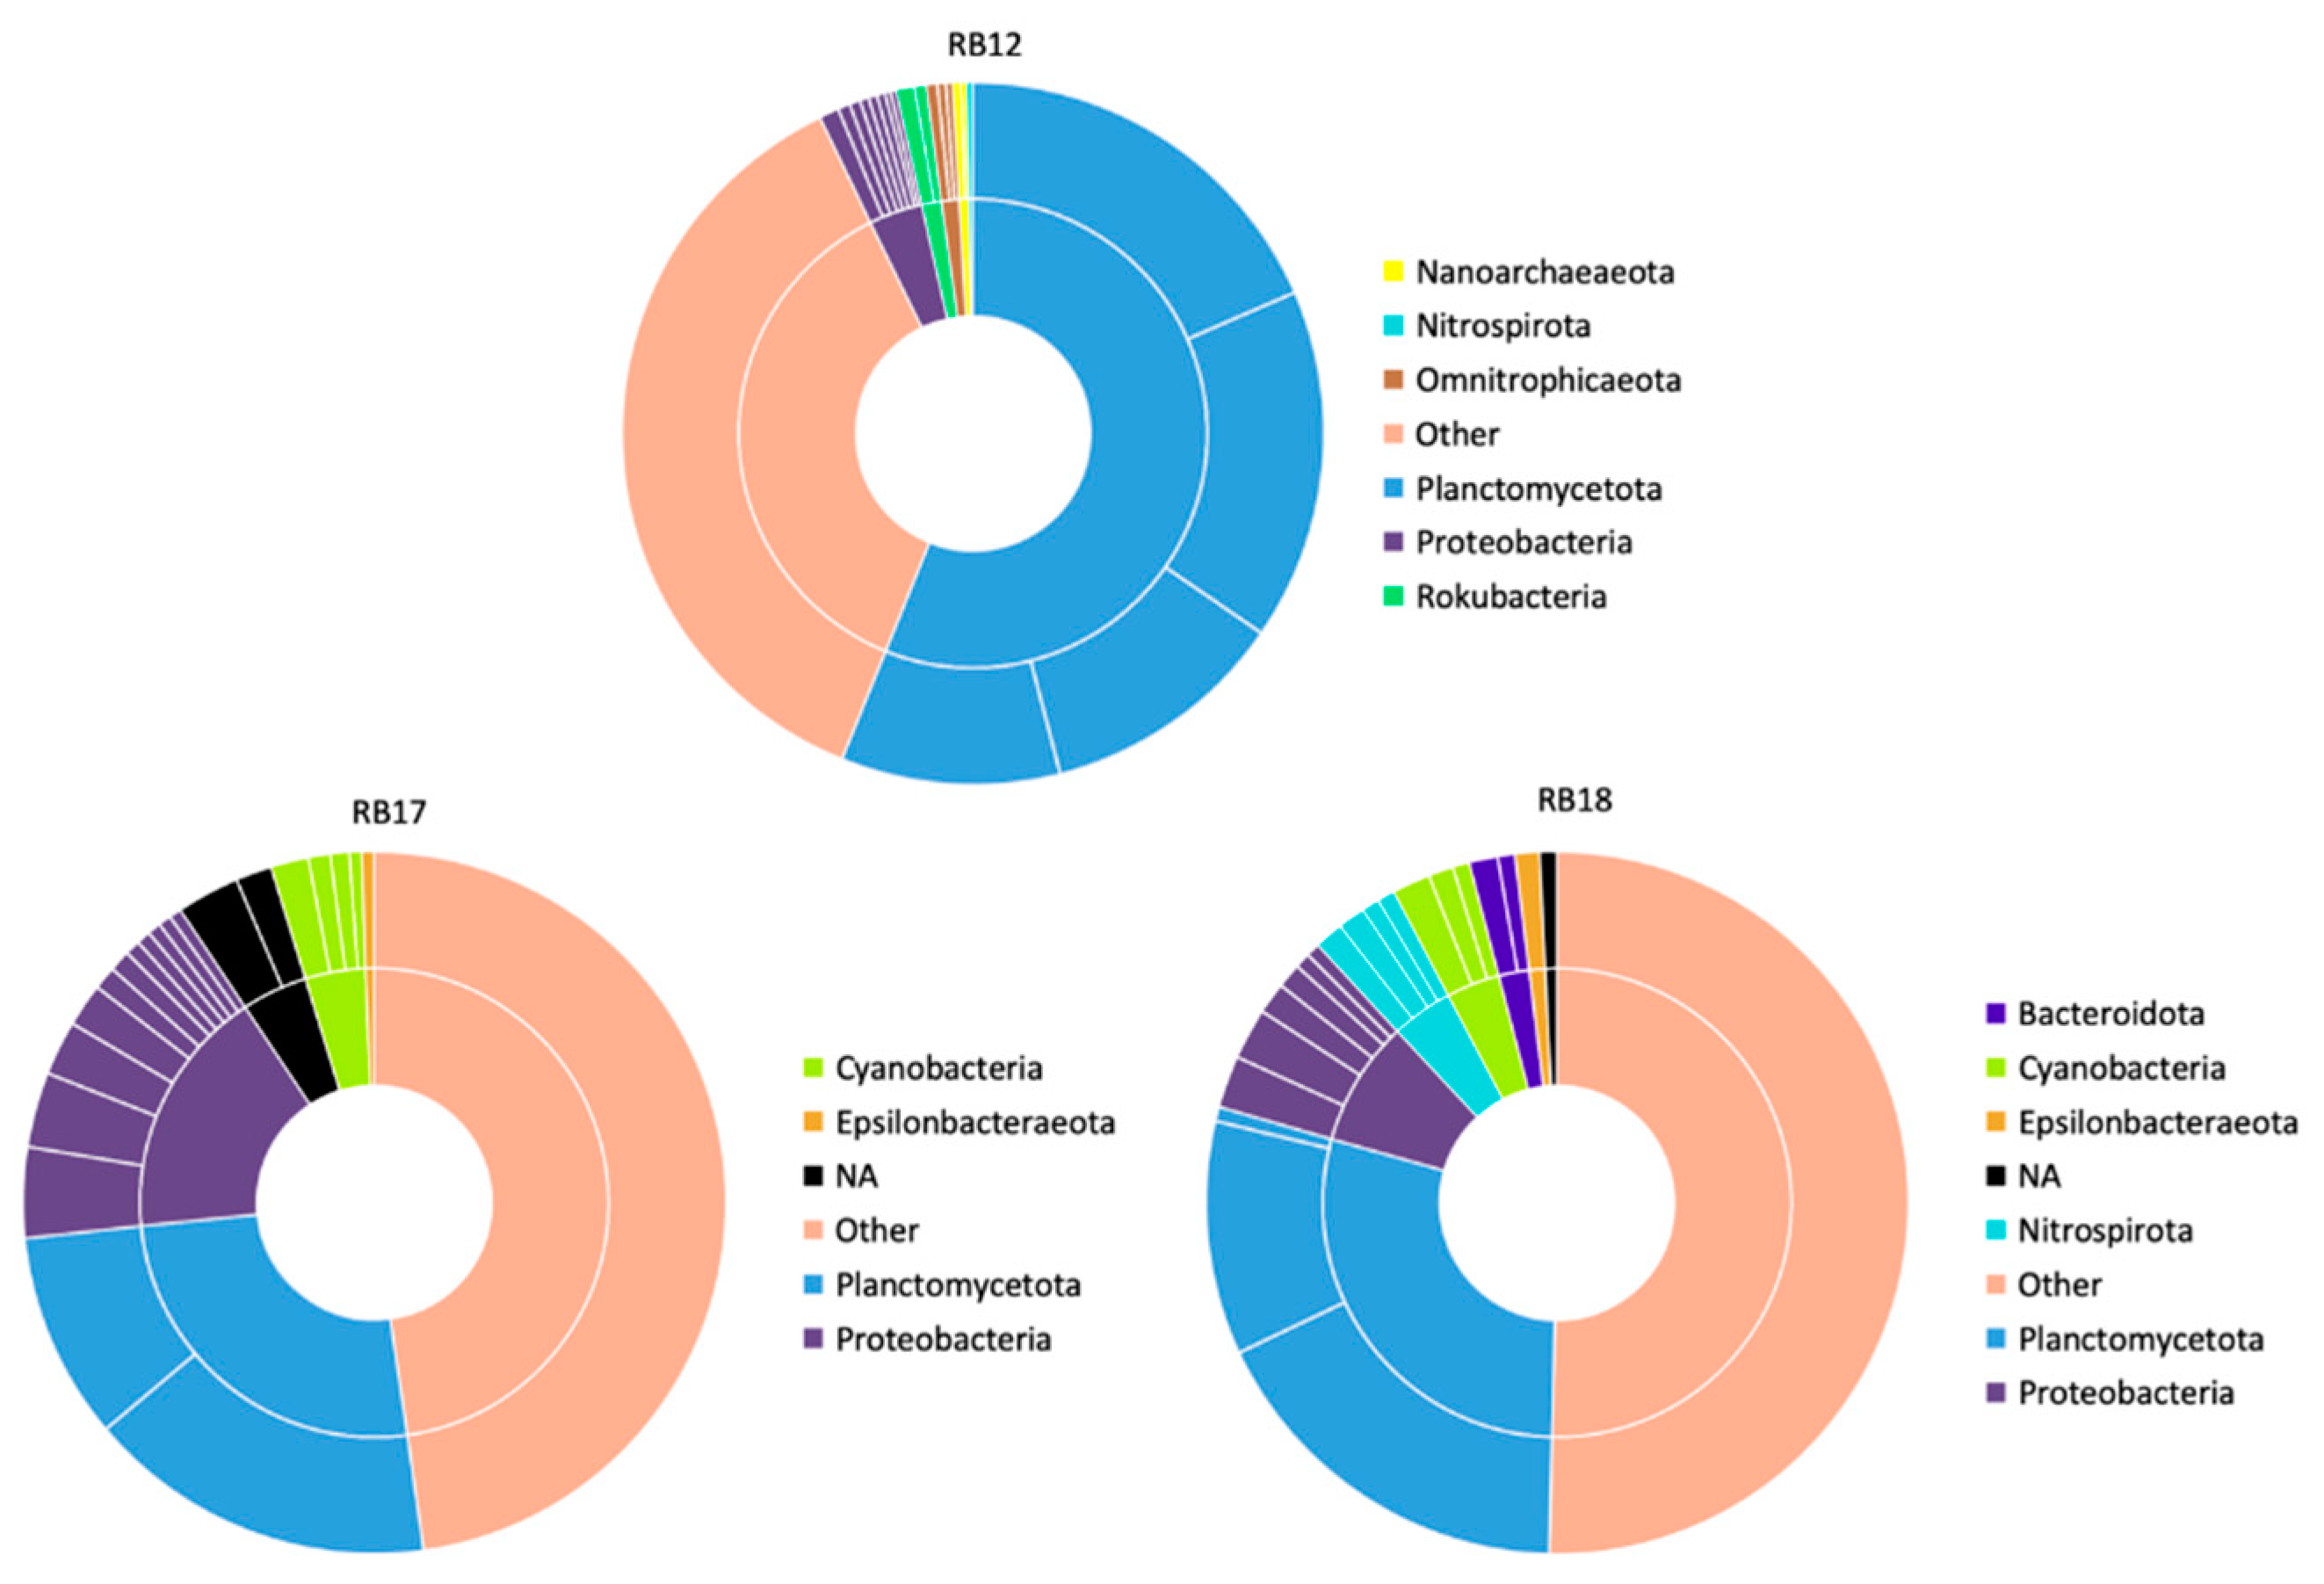
3.4.2. Ammonia and Nitrogen Contaminated Bores (ANCB)

  • Bore RB12
Most (56.1%) of the abundance in Bore RB12 was made up of four OTUs in the Candidatus Brocadia genus (Figure 3). The genus Candidatus Brocadia in the Planctomycetota phylum is one of only a few known genera capable of performing ANAMMOX [53,54]. RB12 was situated immediately downstream from the WWTP and resided within the NH4+ plume extending out of the WWTP. Bore RB12 has the highest concentrations of NH4+ of all the bores and the highest abundance of the ANAMMOX performing Candidatus Brocadia genus.
  • Bore RB17
A significant fraction (25.6%) of the abundance in bore RB17 was made up of two OTUs in the Candidatus Brocadia genus (Figure 3). In terms of abundance,16.7 % was made up of 10 OTUs in the Proteobacteria phylum; two OTUs of Rhodoplanes, two OTUs of Pseudomonas, an OTU of Stenotrophomonas, two OTUs of Enterobacteriaceae which is a pathogenic NO3 reducer, two OTUs of Immundisolibacter which is capable of aromatic compound degradation [55] and an OTU of Sphingomonadaceae. In addition, 3.6 % of the abundance was made up of three OTUs of Cyanobacteria, an OTU of Melainabacteria and two OTUs of Sericytochromatia which is capable of N fixation [56,57]. Finally, two unidentified microorganisms accounted for 4.6% of the abundance. Bore RB17 was located within the Brown’s Road Farm downstream from the WWTP. Like bore RB12, a large proportion of the abundance in RB17 is made up of ANAMMOX OTUs and much of the rest of the OTUs are comprised of pathogenic bacteria and OTUs related to the N cycle.
  • Bore RB18
The 20 OTUs with the highest abundance in the RB10 bore made up 49.6% of the total abundance in the bore (Figure 3). The Proteobacteria phylum (8.6%) was represented by 6 OTUs; two OTUs of Pseudomonas, two OTUs of Enterobacteriaceae, an OTU of Immundisolibacter and an OTU of Sphingomonadaceae. The Planctomycetota phylum (29.0%) was represented by two OTUs of Candidatus Brocadia (28.4%) and an OTU of the Phycisphaeraceae family known to reduce N [58]. Additionally, there were four OTUs of Nitrospira, two OTUs of Sericytochromatia and an OTU of Melainabacteria. Finally, the Epsilonbacteraeota phylum had an NO3 reducing OTU (genus Arcobacter) [59], and the Bacteroidota phylum had two environmental OTUs (genus Citreitalea). Bore RB18 was paired with RB17 and like bores RB12 and RB17, ANAMMOX OTUs made up a large proportion of the abundance in bore RB18 and much of the rest of the OTUs comprised of pathogenic bacteria and OTUs related to the N cycle.

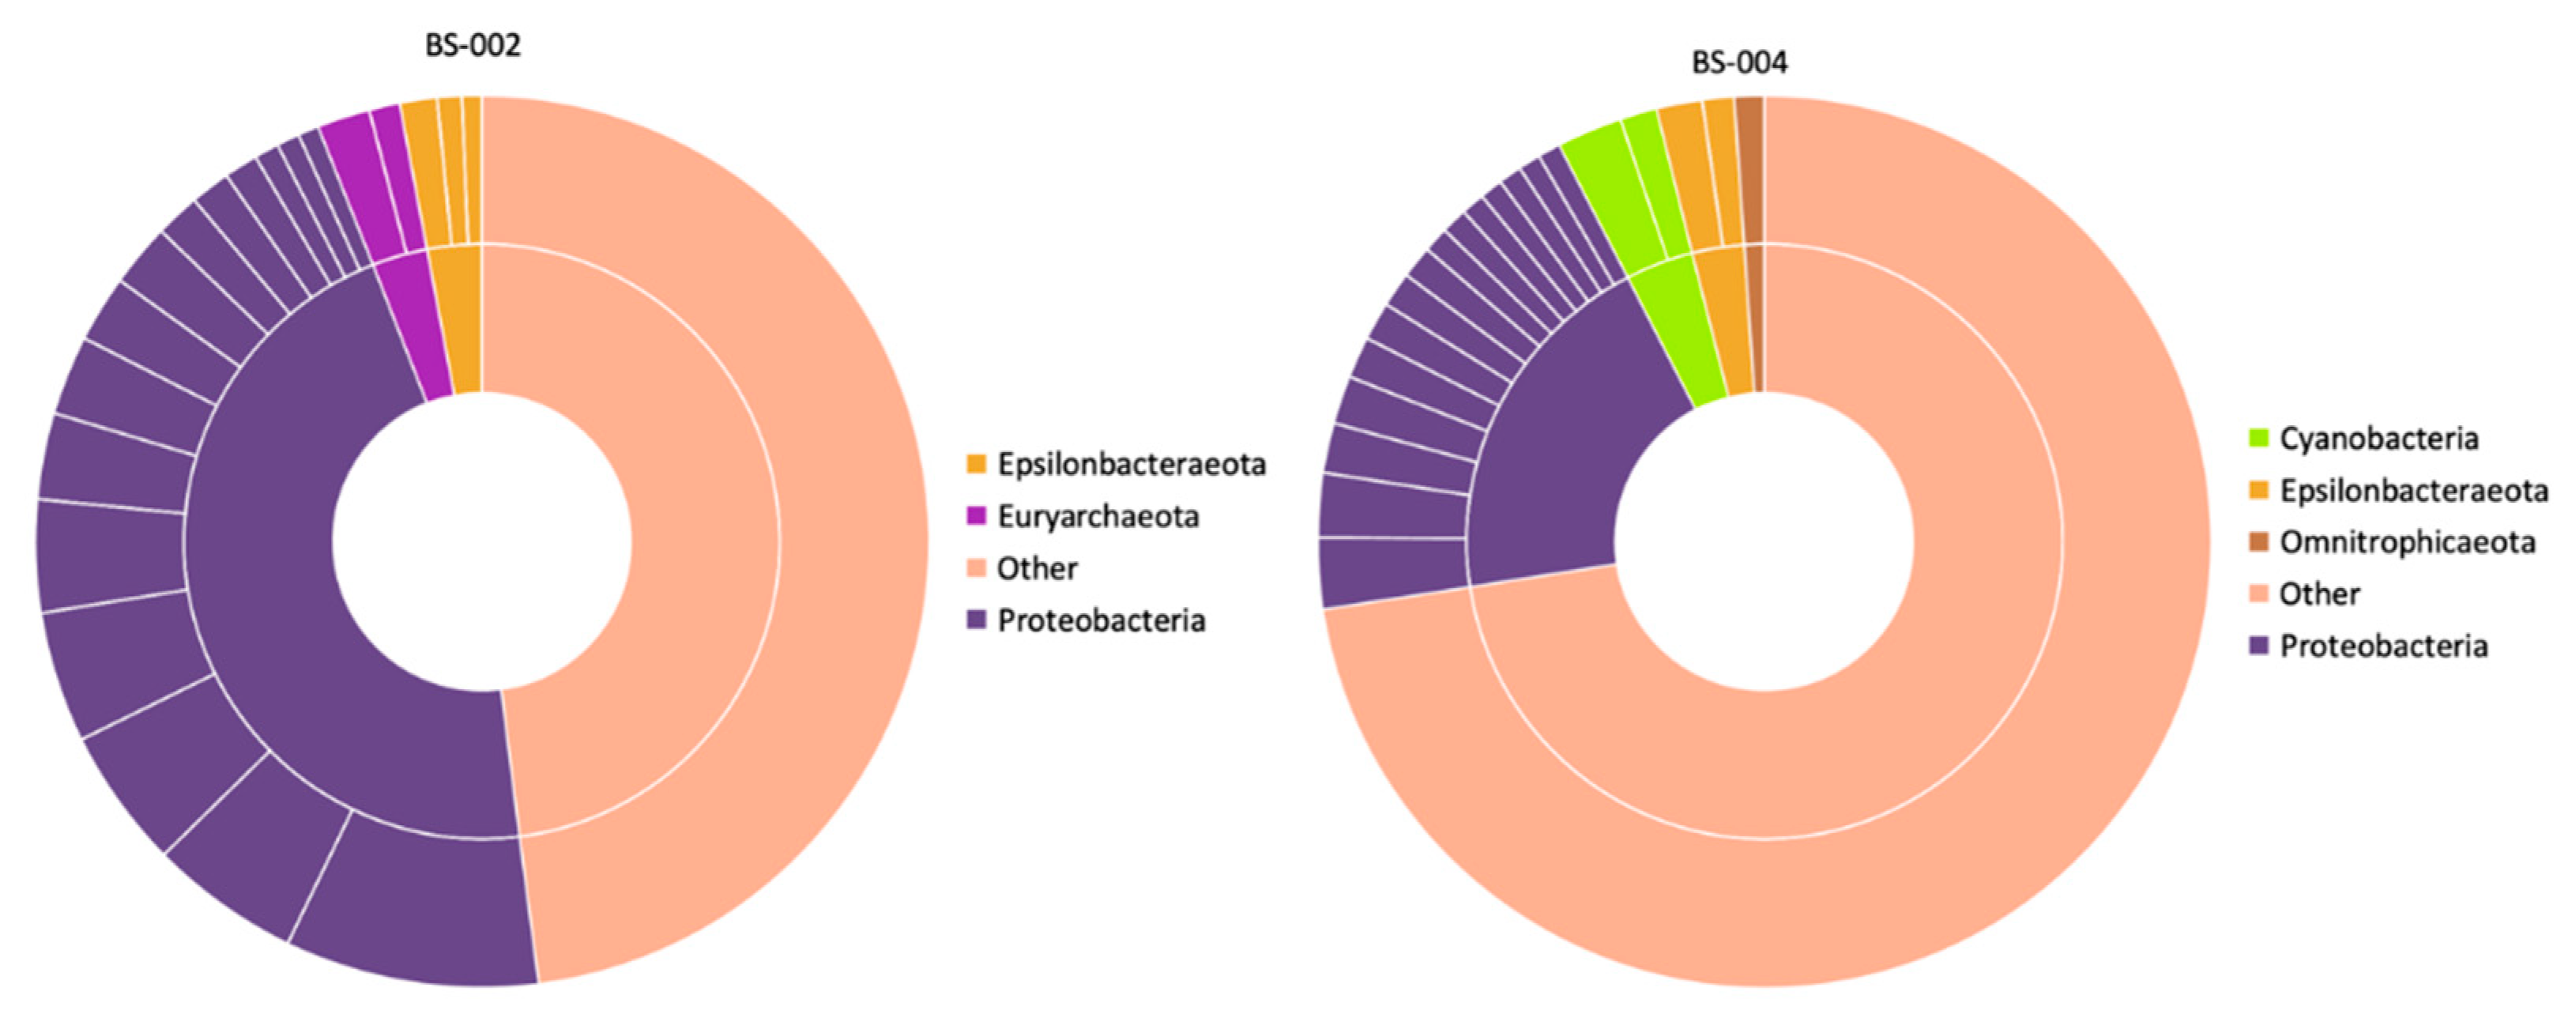
3.4.3. Uncontaminated Bores (UB)

  • Bore BS-002
A high proportion (45.3%) of the abundance in BS-002 was made up of 14 OTUs of Proteobacteria (Figure 4). Within the Proteobacteria phylum there were two OTUs of denitrifiers (Genus Azospirillum) (14.6%) [60], two OTUs of Fe, SO42− and NO3 reducers (Genus Magnetospirillum) (7.6%) [61], two OTUs of S oxidising, NO3 reducing bacteria (Genus Sulfuritalea) (8.2%) [62], two OTUs of Burkholderiaceae (6.5%), two OTUs of S reducers (Genus Desulfatirhabdium) [63], two OTUs of Fe and NO3 reducing bacteria (Genus Ferribacterium) [64] and two OTUs of methanotrophs (Genus Methylomonas) [65]. Additionally, the Euryarchaeota phylum had two OTUs of methanotrophic bacteria (Genus Methanospirillum) [66] and the Epsilonbacteraeota phylum had two OTUs of S oxidising NO3 reducing bacteria (Genus Sulfuricurvum) [67]. The BS-002 bore was located within the Tootgarook Swamp, with no known groundwater contamination influence from the WWTP or agriculture. Most of the abundance in the BS-002 bore was focused on denitrification reactions with some S and Fe redox reactions.
  • Bore BS-004
The 20 OTUs with the highest abundance in the RB07 bore made up 27.4% of the total abundance in the bore, 16 of the top 20 were Proteobacteria (19.8%) (Figure 4). Within the Proteobacteria phylum were three OTUs of Sphingomonadaceae, two OTUs of Enterobacteriaceae, two OTUs of Immundisolibacter, two OTUs of Burkholderiaceae, two OTUs of Desulfobulbaceae, an OTU of Pseudomonas, an S oxidising, NO3 reducing bacteria (Genus Sulfuricella) [68], a methanotrophic NO3 reducer (Genus Methylobacillus) [69] and a SO42− reducing bacteria (Genus Desulfatitalea) [70]. Additionally, there were two OTUs of Sericytochromatia, two OTUs of Arcobacter and one NO3- reducer from the Omnitrophicaeota phylum (Genus Omnitrophaceae) [71]. The BS-004 bore was also located within the Tootgarook Swamp slightly further downstream than BS-002. The most abundant microorganisms in BS-004 were focused on N and S processes, with a few opportunistic pathogens and other processes scattered throughout.

4. Discussion

Previous sampling data from this site and the physicochemical data obtained indicate that the UBs are the most likely bores to reflect the background for the study area, with no notable NH3 or NO3 concentrations detected in the bores. Since their construction in 2017, NO3 and NH4+ in the UBs remained below 0.3 mg L−1 and 0.2 mg L−1, respectively. However, pairwise statistical analysis shows that microbially, there was no significant difference between the NCBs and the UBs, so either there is no difference between the microbial communities of the NCBs and the UBs or multivariate statistics were not sufficient to establish the difference in microbial communities between the two zones. This dataset provides a rare opportunity to observe different contamination conditions in a single aquifer and understand the microbial differences between uncontaminated bores and different types of contamination (WWTP and agricultural pollution) spread across other bores within a range of physicochemical conditions.
Table 3 shows the richness, diversity, and evenness estimators and the percentage commonality of OTUs between bores. Despite all this information and the multivariate statistical analysis none of this data analysis shows any significant trends that enable the differentiation between the uncontaminated and the contaminated bores. This leads to the conclusion that statistical analysis by itself, with the currently available tools, may not be an effective way to differentiate between the microbial communities in uncontaminated and contaminated conditions. A more appropriate analysis of background communities may involve a combination of indicator species and a deeper understanding of the major ecosystem functions being performed in the background communities compared to contaminated communities.

4.1. Major Ecosystem Function Analysis

Analysing the major ecosystem functions allows us to delve into trends that may have been previously unnoticed, enabling us to build profiles of the ecosystems in different areas and different levels of contamination and non-contamination. We can then review these profiles against each other and determine the similarities and differences. With this method (possibly with some standardisation), we can build a network of profiles that enables comparison of similarities and differences across areas and regions. Trends such as major ecosystem functions that consist of many species, a large percentage of the abundance, or a combination of the two could be used to indicate a disturbance in the ecosystem. Indicator species and groups are useful in this regard; however, the ecological function may not be tied to a specific species or group but may have interchangeable species dependent on the physicochemical properties and location.
In our previous work [16], an NH4+ plume extending from the WWTP was detailed by analysing the physicochemical, diversity, evenness, and phylum data. As a result of the microbial community analysis, the presence of undetected NH4+ contamination in RB17 was hypothesised because it showed similar characteristics to the other NH4+ contaminated bores. Major ecosystem function (MEF) analysis builds upon this, demonstrating the similarities between the NH4+-contaminated wells. The analysis also shows some of these characteristics in the RB06 bore, namely the presence of Candidatus Brocadia, though with much lower abundance. We hypothesise that this may be an early indication that the NH4+ contamination extending from the WWTP has begun to influence the microbial communities in the RB06 bore. Candidatus Brocadia was also present in even lower abundance in RB10, which may indicate a similar process. There were no indications of any NH4+ contamination events in the physicochemical legacy data for RB06, RB10 or RB17 in the past 10 years and all bores are adjacent to the known NH4+ contamination plume. This shows the usefulness of using this type of analysis in addition to that of the physicochemical analysis.
The DSE63273 bore is also a deep (25.1 m) bore with high concentrations of NO3; thus, the high abundance of N-related OTUs was expected. The chemistry data in Table 1 show no indication of other contamination; however, DSE63273 is adjacent to a road and immediately downstream from a manure stockpile. This MEF analysis shows a large number and abundance of methanotrophs and S-reducing bacteria present in the bore. Roads such as the one immediately adjacent to DSE63273 are known to impact the local ecology in their surrounds. Previous studies have shown that methanotrophs are associated with hydrocarbon contamination, and asphalt roads are known to contain high concentrations of S [72,73]. Sulphur reducers and methanotrophs could also originate from the manure stockpile. It seems more likely that the sulphur reducers and methanotrophs originate from the manure stockpile; however, the influence of the road cannot be ruled out completely.
The MEF analysis also shows many Fe-reducing bacteria in the RB07 bore; this was reflected in the physicochemical data, with RB07 having one of the highest concentrations of Fe across all the samples. In this example, the high abundance of Fe-reducing bacteria in the bore could be a result of the high Fe concentration combined with the slightly reducing environment, creating a more favourable environment for Fe reduction. BS-004 also has high Fe; however, it does not show a comparable abundance of Fe-reducing bacteria. This may be due to the differences in redox potential, EC and pH between the bores.
There are two bores in this project that were identified as possible background bores. Locationally, both bores were considered to be outside the influence of the WWTP contamination, and the physicochemical analysis (Table 1) shows low concentrations of both NO3 and NH4+. Table 3 shows very few common OTUs between the two bores, though the difference in depth and redox conditions may play a large role in this.

4.2. Determining Microbial Background

The first step in differentiating between impacted and unimpacted microbial communities should be to define any anthropogenic activities or contaminants in the region and determine if these may have impacted the ecosystem. For this study, the two main contaminants of concern were NO3 and NH4+; we propose that if a large percentage of the MEF was attributed to N transformation in the uncontaminated bores, this might be cause for concern. The MEF analysis showed that of the two UBs (within the top 20 OTUs or 50%), bore BS-002 attributed 41.7% of its abundance to microorganisms capable of N reduction and bore BS-004 attributes 14.5% of its abundance to microorganisms capable of N transformation. The bores immediately downstream from the WWTP also showed the presence of several pathogenic OTUs, which can also be seen in BS-004. The MEF analysis for bore BS-004 showed a diverse range of OTUs and functions; there does not seem to be any influence of NO3 on the assemblage of the microorganisms observed in the well, and both the Pseudomonas and Enterobacteriaceae found in the bore had low abundance and naturally occur in groundwater [74]. Due to this evidence, we propose that BS-004 may be a suitable representative of an unimpacted microbial community for the area observed in this study. Bore BS-002 also showed a diverse range of OTUs with a range of functions; many of these OTUs perform N transforming functions which could indicate intermittent or past N contamination in the bore. There are few legacy data for the BS-002 bore, so no conclusions about past contamination can be gleaned from this; however, the bore was adjacent to an equestrian centre and at the edge of the Tootgarook Swamp closest to the market gardens (agricultural area) so contamination events cannot be completely ruled out.
Hypothetically, if the composition of BS-002 was a result of N contamination in the region that would mean that the microbial community could adapt and remove that N at a rate that left it undetected through physicochemical testing. If this were the case, the value of such an ecosystem service would be immeasurable. However, further analysis of the microbial communities would be needed to have any conclusive results regarding this.

4.3. Concluding Remarks

Towards the first aim, we have shown evidence of NH4+ contamination corresponding with an increase in the percentage of abundance occupied by the Planctomycetota phylum (specifically the Candidatus Brocadia genus). The trends across the NO3 contamination were less clear, with no specific organism/s showing repeated increased abundance across the NCBs. In general, the NCBs seemed to have an increase in the abundance of denitrifying and N-reducing OTUs; however, more analysis of the microbial communities is needed for a more conclusive outcome.
For the second aim, using a physicochemical and microbial community dataset taken over a relatively short sampling campaign, we have demonstrated a method to differentiate between bores impacted by NH4+ and those unimpacted by NH4+. Out of the bores we sampled, the bore most likely to represent an unimpacted microbial ecosystem was shown to be BS-004 whereas bore BS-002 showed signs that it might have been impacted by nitrogen contamination in some capacity.
For the final aim, we provided evidence that at the sampled site bores previously thought to be outside the influence of NH4+ contamination may be experiencing the influence of NH4+ contamination. This shows that there is value in using functional group analysis alongside routine physicochemical analysis to provide greater breadth and depth of understanding of the extent and impact of contamination in an aquifer.
Future research may be best aimed at improving our understanding of the interactions between contamination and microbial ecosystems in groundwater; this could be achieved by further expansion of this work by including of more sites and longer, more frequent sampling campaigns. Future research could also focus on appropriate statistical methods with the power and breadth to differentiate between different ecosystems and could include the use of identification tools such as PICRUSt2 or Vikodak.

Supplementary Materials

The following supporting information can be downloaded at: https://www.mdpi.com/article/10.3390/environments9100128/s1, Table S1: Methods of analysis used by ALS; Table S2: R studio packages used throughout analysis.

Author Contributions

Conceptualization, methodology, software, formal analysis, investigation, data curation and writing—original draft preparation was all completed by J.G.M. Supervision and project administration were the responsibilities of A.S.B., M.J.C., S.M.R., A.S. and M.M. Funding acquisition: A.S.B., M.J.C., S.M.R., A.S., M.M., N.D.C., S.A. and W.R. Writing—review and editing was completed by A.S.B., M.J.C., S.M.R., A.S., M.M., N.D.C., S.A., D.H., W.R. and J.G.M. Comments and edits were organised and enacted by J.G.M. All authors have read and agreed to the published version of the manuscript.

Funding

This research was funded by CRC CARE with in-kind support from Gippsland Water, Melbourne Water, South East Water, Western Water (Grant No. 2.3.02).

Data Availability Statement

16S microbial community data and environmental data can be found in the NCBI Sequence Read Archive (SRA) (https://www.ncbi.nlm.nih.gov/bioproject/PRJNA861729, accessed on 13 September 2019) under the heading ‘Groundwater microbial communities in an unconfined nitrogen contaminated aquifer’.

Acknowledgments

The authors would like to thank CRC CARE, Gippsland Water, Melbourne Water, South East Water, Western Water and BlueSphere Environmental for their funding and support in undertaking this work (Grant no. 2.3.02). The authors would also like to thank Esmaeil Shahsavari for his generous assistance with the sequencing and Kirill Tsyganov and the Monash Bioinformatics Platform for their assistance with the analysis of the microbial community data.

Conflicts of Interest

The authors declare that they have no known competing financial interests or personal relationships that could have appeared to influence the work reported in this paper.

References

  1. Landrigan, P.J. The hidden costs of environmental contamination. Eur. Respir. J. 2012, 40, 286–288. [Google Scholar] [CrossRef] [PubMed] [Green Version]
  2. Landrigan, P.J.; Fuller, R.; Hu, H.; Caravanos, J.; Cropper, M.L.; Hanrahan, D.; Sandilya, K.; Chiles, T.C.; Kumar, P.; Suk, W.A. Pollution and global health—An agenda for prevention. Environ. Health Perspect. 2018, 126, 084501. [Google Scholar] [CrossRef] [PubMed] [Green Version]
  3. Fan, A.M.; Steinberg, V.E. Health implications of nitrate and nitrite in drinking water: An update on methemoglobinemia occurrence and reproductive and developmental toxicity. Regul. Toxicol. Pharmacol. 1996, 23, 35–43. [Google Scholar] [CrossRef] [PubMed]
  4. Wolfe, A.H.; Patz, J.A. Reactive nitrogen and human health: Acute and long-term implications. Ambio A J. Hum. Environ. 2002, 31, 120–125. [Google Scholar] [CrossRef] [PubMed]
  5. Ahuja, S. Chapter 2—Water quality worldwide. In Handbook of Water Purity and Quality, 2nd ed.; Ahuja, S., Ed.; Academic Press: Amsterdam, The Netherlands, 2021; pp. 19–33. [Google Scholar]
  6. Morrissy, J.G.; Currell, M.J.; Reichman, S.M.; Surapaneni, A.; Megharaj, M.; Crosbie, N.D.; Hirth, D.; Aquilina, S.; Rajendram, W.; Ball, A.S. Nitrogen contamination and bioremediation in groundwater and the environment: A review. Earth-Sci. Rev. 2021, 222, 103816. [Google Scholar] [CrossRef]
  7. Clark, C.M.; Bell, M.D.; Boyd, J.W.; Compton, J.E.; Davidson, E.A.; Davis, C.; Fenn, M.E.; Geiser, L.; Jones, L.; Blett, T.F. Nitrogen-Induced Terrestrial Eutrophication: Cascading Effects and Impacts on Ecosystem Services. Ecosphere 2017, 8, e01877. [Google Scholar] [CrossRef] [Green Version]
  8. Denk, T.R.; Mohn, J.; Decock, C.; Lewicka-Szczebak, D.; Harris, E.; Butterbach-Bahl, K.; Kiese, R.; Wolf, B. The nitrogen cycle: A review of isotope effects and isotope modeling approaches. Soil Biol. Biochem. 2017, 105, 121–137. [Google Scholar] [CrossRef] [Green Version]
  9. Katz, B.G. Nitrogen Overload: Environmental Degradation, Ramifications, and Economic Costs; John Wiley & Sons: Hoboken, NJ, USA, 2020. [Google Scholar]
  10. Arrigo, K.R. Marine microorganisms and global nutrient cycles. Nature 2005, 437, 349–355. [Google Scholar] [CrossRef]
  11. van der Meer, J.R. Environmental pollution promotes selection of microbial degradation pathways. Front. Ecol. Environ. 2006, 4, 35–42. [Google Scholar] [CrossRef]
  12. Reimann, C.; Garrett, R.G. Geochemical background—Concept and reality. Sci. Total Environ. 2005, 350, 12–27. [Google Scholar] [CrossRef]
  13. Panno, S.; Kelly, W.; Martinsek, A.; Hackley, K. Estimating background and threshold nitrate concentrations using probability graphs. Groundwater 2006, 44, 697–709. [Google Scholar] [CrossRef] [PubMed]
  14. Steube, C.; Richter, S.; Griebler, C. First attempts towards an integrative concept for the ecological assessment of groundwater ecosystems. Hydrogeol. J. 2009, 17, 23–35. [Google Scholar] [CrossRef]
  15. Griebler, C.; Stein, H.; Kellermann, C.; Berkhoff, S.; Brielmann, H.; Schmidt, S.; Selesi, D.; Steube, C.; Fuchs, A.; Hahn, H.J. Ecological assessment of groundwater ecosystems—Vision or illusion? Ecol. Eng. 2010, 36, 1174–1190. [Google Scholar] [CrossRef]
  16. Morrissy, J.G.; Currell, M.J.; Reichman, S.M.; Surapaneni, A.; Megharaj, M.; Crosbie, N.D.; Hirth, D.; Aquilina, S.; Rajendram, W.; Ball, A.S. The variation in groundwater microbial communities in an unconfined aquifer contaminated by multiple nitrogen contamination sources. Water 2022, 14, 613. [Google Scholar] [CrossRef]
  17. Wang, Y.; Zhang, G.; Wang, H.; Cheng, Y.; Liu, H.; Jiang, Z.; Li, P.; Wang, Y. Effects of Different dissolved organic matter on microbial communities and arsenic mobilization in aquifers. J. Hazard. Mater. 2021, 411, 125146. [Google Scholar] [CrossRef]
  18. Guo, L.; Wang, G.; Sheng, Y.; Shi, Z.; Sun, X. Groundwater microbial communities and their connection to hydrochemical environment in golmud, Northwest China. Sci. Total Environ. 2019, 695, 133848. [Google Scholar] [CrossRef]
  19. Gilbert, D.; Amblard, C.; Bourdier, G.; Francez, A.J. Short-term effect of nitrogen enrichment on the microbial communities of a peatland. Hydrobiologia 1998, 373, 111–119. [Google Scholar] [CrossRef]
  20. Adebowale, T.; Surapaneni, A.; Faulkner, D.; McCance, W.; Wang, S.; Currell, M. Delineation of Contaminant sources and denitrification using isotopes of nitrate near a wastewater treatment plant in peri-urban settings. Sci. Total Environ. 2019, 651, 2701–2711. [Google Scholar] [CrossRef]
  21. McCance, W.; Jones, O.; Surapaneni, A.; Currell, M. Characterising sources of groundwater contamination: A guide to the use of novel groundwater tracers at wastewater treatment plants. Water E-J. 2020, 5, 1–16. [Google Scholar] [CrossRef]
  22. McCance, W.; Jones, O.A.H.; Cendón, D.I.; Edwards, M.; Surapaneni, A.; Chadalavada, S.; Wang, S.; Currell, M. Combining environmental isotopes with Contaminants of Emerging Concern (CECs) to characterise wastewater derived impacts on groundwater quality. Water Res. 2020, 182, 116036. [Google Scholar] [CrossRef]
  23. Leonard, J.G. Port Phillip Region Groundwater Systems-Future Use and Management. Department of Water Resources: Melbourne, VIC, Australia, 1992. [Google Scholar]
  24. EPA Victoria. Goundwater sampling guidelines. In Publication 669; State Government of Victoria: Melbourne, VIC, Australia, 2000. [Google Scholar]
  25. EPA Victoria. Sampling and analysis of waters, wastewaters, soils and wastes. In Publication IWRG701; State Government of Victoria: Melbourne, VIC, Australia, 2009. [Google Scholar]
  26. Koshlaf, E.; Shahsavari, E.; Aburto-Medina, A.; Taha, M.; Haleyur, N.; Makadia, T.H.; Morrison, P.D.; Ball, A.S. Bioremediation potential of diesel-contaminated Libyan soil. Ecotoxicol. Environ. Saf. 2016, 133, 297–305. [Google Scholar] [CrossRef] [PubMed]
  27. Johnson, J.S.; Spakowicz, D.J.; Hong, B.Y.; Petersen, L.M.; Demkowicz, P.; Chen, L.; Leopold, S.R.; Hanson, B.M.; Agresta, H.O.; Gerstein, M.; et al. Evaluation of 16s rRNA gene sequencing for species and strain-level microbiome analysis. Nat. Commun. 2019, 10, 5029. [Google Scholar] [CrossRef] [PubMed] [Green Version]
  28. Adegoke, A.A.; Stenström, T.A.; Okoh, A.I. Stenotrophomonas maltophilia as an emerging ubiquitous pathogen: Looking beyond contemporary antibiotic therapy. Front. Microbiol. 2017, 8, 2276. [Google Scholar] [CrossRef] [PubMed] [Green Version]
  29. Ryan, R.P.; Monchy, S.; Cardinale, M.; Taghavi, S.; Crossman, L.; Avison, M.B.; Berg, G.; Van Der Lelie, D.; Dow, J.M. The versatility and adaptation of bacteria from the genus stenotrophomonas. Nat. Rev. Microbiol. 2009, 7, 514–525. [Google Scholar] [CrossRef] [PubMed]
  30. Staley, J.T.; Boone, D.R.; Brenner, D.J.; De Vos, P.; Garrity, G.M.; Goodfellow, M.; Krieg, N.R.; Rainey, F.A.; Schleifer, K.H. Bergey’s Manual® of Systematic Bacteriology: Volume 2: The Proteobacteria, Part B: The Gammaproteobacteria. Vol. 2; Springer Science & Business Media: Berlin, Germany, 2007. [Google Scholar]
  31. Yamada, T.; Sekiguchi, Y. Anaerolineaceae. In Bergey’s Manual of Systematics of Archaea and Bacteria; John Wiley & Sons: Hoboken, NJ, USA, 2018; pp. 1–5. [Google Scholar]
  32. Soo, R.M.; Skennerton, C.T.; Sekiguchi, Y.; Imelfort, M.; Paech, S.J.; Dennis, P.G.; Steen, J.A.; Parks, D.H.; Tyson, G.W.; Hugenholtz, P. An expanded genomic representation of the phylum Cyanobacteria. Genome Biol. Evol. 2014, 6, 1031–1045. [Google Scholar] [CrossRef] [Green Version]
  33. Willems, A.; Busse, J.; Goor, M.; Pot, B.; Falsen, E.; Jantzen, E.; Hoste, B.; Gillis, M.; Kersters, K.; Auling, G.; et al. Hydrogenophaga, a new genus of hydrogen-oxidizing bacteria that includes Hydrogenophaga flava comb. nov. (formerly Pseudomonas flava), Hydrogenophaga Palleronii (formerly Pseudomonas Palleronii), Hydrogenophaga Pseudoflava (formerly Pseudomonas Pseudoflava and “Pseudomonas Carboxydoflava”), and Hydrogenophaga Taeniospiralis (formerly Pseudomonas taeniospiralis). Int. J. Syst. Evol. Microbiol. 1989, 39, 319–333. [Google Scholar]
  34. Hiraishi, A.; Ueda, Y. Rhodoplanes gen. nov., a new genus of phototrophic bacteria including Rhodopseudomonas Rosea as Rhodoplanes Roseus comb. nov. and Rhodoplanes Elegans Sp. Nov. Int. J. Syst. Evol. Microbiol. 1994, 44, 665–673. [Google Scholar] [CrossRef] [Green Version]
  35. Imhoff, J.F.; Trüper, H.G.; Pfennig, N. Rearrangement of the Species and genera of the phototrophic “purple nonsulfur bacteria”. Int. J. Syst. Evol. Microbiol. 1984, 34, 340–343. [Google Scholar] [CrossRef] [Green Version]
  36. Dobbin, P.S.; Warren, L.H.; Cook, N.J.; McEwan, A.G.; Powell, A.K.; Richardson, D.J. Dissimilatory iron (III) reduction by Rhodobacter capsulatus. Microbiology 1996, 142, 765–774. [Google Scholar] [CrossRef] [Green Version]
  37. Norris, P.R. Acidimicrobiales. In Bergey’s Manual of Systematics of Archaea and Bacteria; John Wiley & Sons: Hoboken, NJ, USA, 2015; pp. 1–2. [Google Scholar]
  38. Geissinger, O.; Herlemann, D.P.; Mörschel, E.; Maier, U.G.; Brune, A. The Ultramicrobacterium “Elusimicrobium minutum” Gen. Nov., Sp. Nov., the first cultivated representative of the termite group 1 phylum. Appl. Environ. Microbiol. 2009, 75, 2831–2840. [Google Scholar] [CrossRef] [Green Version]
  39. Kämpfer, P.; Lodders, N.; Falsen, E. Hydrotalea flava gen. nov., sp. nov., a new member of the phylum Bacteroidetes and allocation of the genera Chitinophaga, Sediminibacterium, Lacibacter, Flavihumibacter, Flavisolibacter, Niabella, Niastella, Segetibacter, Parasegetibacter, Terrimonas, Ferruginibacter, Filimonas and Hydrotalea to the family Chitinophagaceae fam. nov. Int. J. Syst. Evol. Microbiol. 2011, 61, 518–523. [Google Scholar] [PubMed]
  40. Spieck, E.; Eberhard, B. Nitrospira. In Bergey’s Manual of Systematics of Archaea and Bacteria; John Wiley & Sons: Hoboken, NJ, USA, 2015; pp. 1–4. [Google Scholar]
  41. Qin, W.; Heal, K.R.; Ramdasi, R.; Kobelt, J.N.; Martens-Habbena, W.; Bertagnolli, A.D.; Amin, S.A.; Walker, C.B.; Urakawa, H.; Könneke, M.; et al. Nitrosopumilus maritimus gen. nov., sp. nov., Nitrosopumilus cobalaminigenes sp. nov., Nitrosopumilus oxyclinae sp. nov., and Nitrosopumilus ureiphilus sp. nov., four marine ammonia-oxidizing archaea of the phylum Thaumarchaeota. Int. J. Syst. Evol. Microbiol. 2017, 67, 5067–5079. [Google Scholar] [CrossRef] [PubMed]
  42. Garrity, G.M.; Bell, J.A.; Lilburn, T. Pseudomonadaceae. In Bergey’s Manual of Systematics of Archaea and Bacteria; John Wiley & Sons: Hoboken, NJ, USA, 2015; p. 1. [Google Scholar]
  43. Washington, C.W., Jr. Legionella. In Bergey’s Manual of Systematics of Archaea and Bacteria; John Wiley & Sons: Hoboken, NJ, USA, 2015; pp. 1–44. [Google Scholar]
  44. Spröer, C.; Reichenbach, H.; Stackebrandt, E. The correlation between morphological and phylogenetic classification of myxobacteria. Int. J. Syst. Evol. Microbiol. 1999, 49, 1255–1262. [Google Scholar] [CrossRef] [PubMed]
  45. Tóth, E.; Szuróczki, S.; Kéki, Z.; Bóka, K.; Szili-Kovács, T.; Schumann, P. Gellertiella hungarica gen. nov., sp. nov., a novel bacterium of the family Rhizobiaceae isolated from a spa in Budapest. Int. J. Syst. Evol. Microbiol. 2017, 67, 4565–4571. [Google Scholar] [CrossRef]
  46. Pfennig, N.; Biebl, H. Desulfuromonas acetoxidans gen. nov. and sp. nov., a new anaerobic, sulfur-reducing, acetate-oxidizing bacterium. Arch. Microbiol. 1976, 110, 3–12. [Google Scholar] [CrossRef]
  47. Garrity, G.M.; Bell, J.A.; Lilburn, T. Thermithiobacillaceae fam. nov. In Bergey’s Manual of Systematics of Archaea and Bacteria; John Wiley & Sons: Hoboken, NJ, USA, 2015; p. 1. [Google Scholar]
  48. Kojima, H.; Shinohara, A.; Fukui, M. Sulfurifustis Variabilis gen. nov., sp. nov., a sulfur oxidizer isolated from a lake, and proposal of Acidiferrobacteraceae fam. nov. and Acidiferrobacterales ord. nov. Int. J. Syst. Evol. Microbiol. 2015, 65 Pt 10, 3709–3713. [Google Scholar] [CrossRef]
  49. Umezawa, K.; Kojima, H.; Kato, Y.; Fukui, M. Dissulfurispira thermophila gen. nov., sp. nov., a thermophilic chemolithoautotroph growing by sulfur disproportionation, and proposal of novel taxa in the phylum Nitrospirota to reclassify the genus Thermodesulfovibrio. Syst. Appl. Microbiol. 2021, 44, 126184. [Google Scholar] [CrossRef]
  50. Löffler, F.E.; Yan, J.; Ritalahti, K.M.; Adrian, L.; Edwards, E.A.; Konstantinidis, K.T.; Müller, J.A.; Fullerton, H.; Zinder, S.H.; Spormann, A.M. Dehalococcoides mccartyi gen. nov., sp. nov., obligately organohalide-respiring anaerobic bacteria relevant to halogen cycling and bioremediation, belong to a novel bacterial class, Dehalococcoidia classis nov., order Dehalococcoidales ord. nov. and family Dehalococcoidaceae fam. nov., within the phylum Chloroflexi. Int. J. Syst. Evol. Microbiol. 2013, 63 Pt 2, 625–635. [Google Scholar]
  51. Taş, N.; Van Eekert, M.H.; De Vos, W.M.; Smidt, H. The little bacteria that can—Diversity, genomics and ecophysiology of ‘Dehalococcoides’ spp. in contaminated environments. Microb. Biotechnol. 2010, 3, 389–402. [Google Scholar] [CrossRef] [Green Version]
  52. Reddy, G.S.; Garcia-Pichel, F. Description of Patulibacter americanus sp. nov., isolated from biological soil crusts, emended description of the genus Patulibacter Takahashi et al. 2006 and proposal of Solirubrobacterales ord. nov. and Thermoleophilales ord. nov. Int. J. Syst. Evol. Microbiol. 2009, 59, 87–94. [Google Scholar] [CrossRef] [Green Version]
  53. Jetten, M.S.; Op den Camp, H.J.; Kuenen, J.G.; Strous, M. “Candidatus brocadiaceae” fam. nov. In Bergey’s Manual of Systematics of Archaea and Bacteria; John Wiley & Sons: Hoboken, NJ, USA, 2015; pp. 1–10. [Google Scholar]
  54. Moore, T.A.; Xing, Y.; Lazenby, B.; Lynch, M.D.; Schiff, S.; Robertson, W.D.; Timlin, R.; Lanza, S.; Ryan, M.C.; Aravena, R.; et al. Prevalence of anaerobic ammonium-oxidizing bacteria in contaminated groundwater. Environ. Sci. Technol. 2011, 45, 7217–7225. [Google Scholar] [CrossRef] [PubMed]
  55. Corteselli, E.M.; Aitken, M.D.; Singleton, D.R. Description of Immundisolibacter cernigliae gen. nov., sp. nov., a high-molecular-weight polycyclic aromatic hydrocarbon-degrading bacterium within the class Gammaproteobacteria, and proposal of Immundisolibacterales ord. nov. and Immundisolibacteraceae fam. nov. Int. J. Syst. Evol. Microbiol. 2017, 67, 925–931. [Google Scholar] [PubMed]
  56. Monchamp, M.E.; Spaak, P.; Pomati, F. Long term diversity and distribution of non-photosynthetic cyanobacteria in peri-alpine lakes. Front. Microbiol. 2019, 9, 3344. [Google Scholar] [CrossRef] [PubMed] [Green Version]
  57. Di Rienzi, S.C.; Sharon, I.; Wrighton, K.C.; Koren, O.; Hug, L.A.; Thomas, B.C.; Goodrich, J.K.; Bell, J.T.; Spector, T.D.; Banfield, J.F.; et al. The human gut and groundwater harbor non-photosynthetic bacteria belonging to a new candidate phylum sibling to cyanobacteria. elife 2013, 2, e01102. [Google Scholar] [CrossRef]
  58. Fukunaga, Y.; Kurahashi, M.; Sakiyama, Y.; Ohuchi, M.; Yokota, A.; Harayama, S. Phycisphaera Mikurensis gen. nov., sp. nov., isolated from a marine alga, and proposal of Phycisphaeraceae fam. nov., Phycisphaerales ord. nov. and Phycisphaerae classis nov. in the phylum Planctomycetes. J. Gen. Appl. Microbiol. 2009, 55, 267–275. [Google Scholar] [CrossRef] [Green Version]
  59. Vandamme, P.; Falsen, E.; Rossau, R.; Hoste, B.; Segers, P.; Tytgat, R.; De Ley, J. Revision of campylobacter, Helicobacter, and Wolinella taxonomy: Emendation of Generic Descriptions and Proposal of Arcobacter gen. nov. Int. J. Syst. Evol. Microbiol. 1991, 41, 88–103. [Google Scholar] [CrossRef] [Green Version]
  60. Tarrand, J.J.; Krieg, N.R.; Döbereiner, J. A taxonomic study of the Spirillum lipoferum group, with descriptions of a new genus, Azospirillum gen. nov. and two species, Azospirillum lipoferum (Beijerinck) comb. nov. and Azospirillum brasilense sp. nov. Can. J. Microbiol. 1978, 24, 967–980. [Google Scholar] [CrossRef]
  61. Wang, Q.; Wang, X.; Zhang, W.; Li, X.; Zhou, Y.; Li, D.; Wang, Y.; Tian, J.; Jiang, W.; Zhang, Z.; et al. Physiological characteristics of magnetospirillum gryphiswaldense msr-1 that control cell growth under high-iron and low-oxygen conditions. Sci. Rep. 2017, 7, 2800. [Google Scholar] [CrossRef] [Green Version]
  62. Kojima, H.; Fukui, M. Sulfuritalea hydrogenivorans gen. nov., sp. nov., a facultative autotroph isolated from a freshwater lake. Int. J. Syst. Evol. Microbiol. 2011, 61, 1651–1655. [Google Scholar] [CrossRef] [Green Version]
  63. Balk, M.; Altınbaş, M.; Rijpstra, W.I.C.; Damste, J.S.S.; Stams, A.J. Desulfatirhabdium butyrativorans gen. nov., sp. nov., a butyrate-oxidizing, sulfate-reducing bacterium isolated from an anaerobic bioreactor. Int. J. Syst. Evol. Microbiol. 2008, 58, 110–115. [Google Scholar] [CrossRef]
  64. Cummings, D.E.; Caccavo Jr, F.; Spring, S.; Rosenzweig, R.F. Ferribacterium limneticum, gen. nov., sp. nov., an Fe (III)-reducing microorganism isolated from mining-impacted freshwater lake sediments. Arch. Microbiol. 1999, 171, 183–188. [Google Scholar] [CrossRef]
  65. Bowman, J.P.; Sly, L.I.; Nichols, P.D.; Hayward, A.C. Revised Taxonomy of the methanotrophs: Description of Methylobacter gen. nov., emendation of Methylococcus, validation of Methylosinus and Methylocystis species, and a proposal that the family Methylococcaceae includes only the group I methanotrophs. Int. J. Syst. Evol. Microbiol. 1993, 43, 735–753. [Google Scholar] [CrossRef]
  66. Ferry, J.G.; Smith, P.H.; Wolfe, R.S. Methanospirillum, a new genus of methanogenic bacteria, and characterization of Methanospirillum hungatii Sp.Nov. Int. J. Syst. Evol. Microbiol. 1974, 24, 465–469. [Google Scholar] [CrossRef]
  67. Kodama, Y.; Watanabe, K. Sulfuricurvum kujiense gen. nov., sp. nov., a facultatively anaerobic, chemolithoautotrophic, sulfur-oxidizing bacterium isolated from an underground crude-oil storage cavity. Int. J. Syst. Evol. Microbiol. 2004, 54, 2297–2300. [Google Scholar] [CrossRef] [PubMed] [Green Version]
  68. Kojima, H.; Fukui, M. Sulfuricella denitrificans gen. nov., sp. nov., a sulfur-oxidizing autotroph isolated from a freshwater lake. Int. J. Syst. Evol. Microbiol. 2010, 60, 2862–2866. [Google Scholar] [CrossRef] [PubMed] [Green Version]
  69. Yordy, J.R.; Weaver, T.L. Methylobacillus: A new genus of obligately methylotrophic bacteria. Int. J. Syst. Evol. Microbiol. 1977, 27, 247–255. [Google Scholar] [CrossRef]
  70. Higashioka, Y.; Kojima, H.; Watanabe, M.; Fukui, M. Desulfatitalea tepidiphila gen. nov., sp. nov., a sulfate-reducing bacterium isolated from tidal flat sediment. Int. J. Syst. Evol. Microbiol. 2013, 63 Pt 2, 761–765. [Google Scholar] [CrossRef] [Green Version]
  71. Kizina, J. Insights into the Biology of Candidate Division Op3 Lim Populations; Universität Bremen: Bremen, Germany, 2017. [Google Scholar]
  72. Saidi-Mehrabad, A.; He, Z.; Tamas, I.; Sharp, C.E.; Brady, A.L.; Rochman, F.F.; Bodrossy, L.; Abell, G.C.; Penner, T.; Dong, X.; et al. Methanotrophic bacteria in oilsands tailings ponds of northern Alberta. ISME J. 2013, 7, 908–921. [Google Scholar] [CrossRef] [Green Version]
  73. De Silva, S.; Ball, A.S.; Shahsavari, E.; Indrapala, D.V.; Reichman, S.M. The effects of vehicular emissions on the activity and diversity of the roadside soil microbial community. Environ. Pollut. 2021, 277, 116744. [Google Scholar] [CrossRef]
  74. Bruins, M.R.; Kapil, S.; Oehme, F.W. Pseudomonas pickettii: A common soil and groundwater aerobic bacteria with pathogenic and biodegradation properties. Ecotoxicol. Environ. Saf. 2000, 47, 105–111. [Google Scholar] [CrossRef]
Figure 1. Site location and layout map. BRF = Browns Road Farm.
Environments 09 00128 g001
Figure 2. Sunburst chart of 20 microorganisms (OTUs) with the highest abundance in the nitrate-contaminated bores (NCBs) (DSE63273, RB23, RB10, RB06, RB07) separated by bore and organised by phylum. ‘Other’ represents the proportion of OTUs not represented by the 20 most abundant OTUs. The inner ring of the sunburst chart represents the phylum taxonomic level and the inner ring represents the individual OTUs.
Environments 09 00128 g002
Figure 3. Sunburst chart of the top 50% or top 20 microorganisms (OTUs) with the highest abundance in the ammonia and nitrate contaminated bores (ANCBs) (RB12, RB17, RB18) separated by bore and organised by phylum. ‘Other’ represents the proportion of OTUs not represented by the top 50% of the most abundant OTUs. The inner ring of the sunburst chart represents the phylum taxonomic level and the inner ring represents the individual OTUs.
Environments 09 00128 g003
Figure 4. Sunburst chart of top 50% or 20 microorganisms (OTUs) with the highest abundance in the uncontaminated bores (UBs) (BS-002, BS-004) separated by bore and organised by phylum. ‘Other’ represents the proportion of OTUs not represented by the 20 most abundant OTUs. The inner ring of the sunburst chart represents the phylum taxonomic level and the inner ring represents the individual OTUs.
Environments 09 00128 g004
Table 1. The physiochemical ranges and values of the ten groundwater wells sampled for this project. Units in mg L−1 unless otherwise stated.
Min-max Physiochemical PropertiesDSE63273RB23RB10RB12RB17RB18RB06RB07BS-002BS-004
Dissolved Oxygen4.474.77–5.920.22–0.510.15–0.470.2–0.640.17–0.560.12–0.610.22–0.760.24–0.740.17–0.69
EC (field) (uS/cm)29451434–14872357–26592192–26411486–17231309–14801915–26333342–3503940–1004718–776
pH (Field) (unitless)6.706.93–7.276.68–6.736.69–6.816.84–7.016.87–7.246.79–7.196.73–6.787.37–7.437.44–7.77
Redox Potential (Field) (mV)107.028.9–111.321.1–61.223.3–68.729.1–77.220.7–79.933.4–35.9−8.4–24.0−59.6–5.5−106.9–−83.5
Alkalinity (total) as CaCO3315170–270430–610450–560350–370350–370270–330410–420240–250210–210
Bicarbonate, as Bicarbonate385210–329.4530–744.2550–683.2430–450430–450330–400490–510300–300250–260
Sulfate as SO42−41024–45580–760330–530220–330130–190490–11001500–15007–826–34
Anionic Strength (meq/L)3213–1729–3426–2917–2014–1622–3748–489–107–8
Cationic Strength (meq/L)28.512–1427–3424–3118–1813–1518–3736–368–97–7
Calcium390150–170350–430230–320200–200130–170210–480470–57083–8447–51
Magnesium4115–1950–6948–6127–3222–2534–6370–8111–1125–28
Sodium13575–85110–140120–160120–130100–110110–170160–21078–8249–52
Potassium1.21–111–1431–400.8–0.83–3.50.8–0.81–71–1.34–4
Chloride230150–170170–210170–210150–160110–140180–250300–320160–17093–100
Bromide1600680–9703700–47001200–1400530–830510–600700–9401500–1600380–450230–280
Ammonia as N0.15<0.1–<0.1<0.1–<0.15.5–26<0.1–<0.13.3–4.6<0.1–<0.10.1–0.10.1–0.10.2–0.2
Nitrate (as N)15064–8314–5440–6312–1511–187.5–180.22–0.220.01–0.01<0.01–<0.01
Nitrogen (Total Oxidised)15564–8815–5440–6312–1511–157.15–180.26–0.260.01–0.01<0.01–<0.01
Nitrogen (Total)15565–8815–5560–7613–1618–208.2–200.9–1.20.07–0.20.3–0.66
TOC3.71.3–2.510–1310–121.6–7.11.3–6.14.4–8.113–162.6–2.62.7–3.1
Organic Nitrogen, as N0.60.2–0.40.8–1.20.2–0.20.4–0.60.1–0.10.7–0.80.7–1.10.1–0.20.1–0.4
Kjeldahl Nitrogen Total3.20.2–0.70.8–1.35.5–260.5–23.1–8.30.8–2.20.9–0.940.06–0.20.3–0.46
Phosphorus0.009<0.005–<0.005<0.005–<0.0050.05–0.05<0.005–<0.0050.006–0.006<0.005–<0.0050.08–0.08<0.005–<0.0050.05–0.05
TDS2250960–12001700–19001400–16001000–1200790–8401200–21002700–2800440–480300–360
Iron (Filtered)0.020.003–0.0030.015–0.0150.009–0.0090.003–0.0030.003–0.003<0.1–<0.10.9–1.20.096–0.130.57–1.4
Molybdenum (Filtered)<0.0010.0006–0.0006<0.001–<0.001<0.001–<0.0010.0002–0.00020.0001–0.0001<0.001–<0.001<0.001–<0.0010.0002–0.00020.004–0.0055
Nickel (Filtered)<0.0010.0011–0.00110.004–0.0110.004–0.00540.00078–0.0030.00059–0.000590.002–0.0020.001–0.0020.002–0.00510.00018–0.00018
Zinc (Filtered)0.02950.006–0.0140.01–0.0130.0086–0.0150.0043–0.0110.004–0.0070.005–0.0320.01–0.010.0026–0.0080.0007–0.003
Bore Depth (CS) (m)25.111.15.35.14.710.89.14.626.45.5
Number of samples 1333332222
Table 2. P and Pr (>F) values from MANOVA and PERMANOVA statistical tests determining the differences between all data and pairwise analysis of the 3 contamination zones.
MANOVA (p)PERMANOVA (Pr(>F))
Analysis GroupsAll Nitrogen Variables Contamination ZonesAmmonia (NH4+)
all0.00520.00020.0012
UB-ANCB0.04380.00990.0453
UB-NCB0.00790.40480.4323
NCB-ANCB0.01330.00010.0006
Table 3. The richness, diversity and evenness estimators and the percentage commonality of OTUs between bores.
Min Max Microbial Community DescriptorsDSE63273RB23RB10RB12RB17RB18RB06RB07BS-002BS-004
Non-Chimeric Sequences 6403 12,150–26,6741584–21,7827353–23,7601542–21,9201691–30,8381964–228415,628–36,0199588–33,5921809–13,032
OTUs 1289 1153–1263263–25901705–2391415–1643398–1591556–7582894–2906940–1534379–1882
Total OTUs 1289172529263055227620511035371116822146
ACE14291227–1309291–27171907–2551432–1790409–1703578–8373075–3099994–1589389–2066
Chao1 estimated no species 15241260–1404779–33332069–5870574–1772593–1916858–16643345–64211039–1614610–2090
Gini-Simpson0.010.01–0.040.01–0.110.04–0.130.02–0.10.02–0.10.01–0.010.01–0.010.03–0.050.01–0.02
Shannon rare 5.414.6–5.723.56–6.583.58–5.353.98–4.753.92–4.915.19–5.556.34–6.454.65–4.924.87–6.03
Pielou’s Evenness0.760.64–0.810.64–0.840.48–0.70.54–0.790.54–0.820.82–0.840.8–0.810.63–0.720.8–0.82
Percent of OTUs in CommonDSE63273RB23RB10RB12RB17RB18RB06RB07BS-002BS-004
DSE63273 12.2116.4716.7714.0813.7212.2223.1217.5222.46
RB2312.21 24.2622.0327.5434.1426.1421.6933.8220.25
RB1016.4724.26 52.6240.4832.3020.6541.5417.1623.83
RB1216.7722.0352.62 42.2436.6319.2442.9516.1623.98
RB1714.0827.5440.4842.24 49.8324.0531.3518.2921.72
RB1813.7234.1432.3036.6349.83 26.1127.3725.7321.16
RB0612.2226.1420.6519.2424.0526.11 18.0320.8117.25
RB0723.1221.6941.5442.9531.3527.3718.03 21.6038.96
BS-00217.5233.8217.1616.1618.2925.7320.8121.60 23.64
BS-00422.4620.2523.8323.9821.7221.1617.2538.9623.64
Publisher’s Note: MDPI stays neutral with regard to jurisdictional claims in published maps and institutional affiliations.

