
Electrical and Electronic Waste Management Problems in Africa: Deficits and Solution Approach


Abstract
:1. Introduction
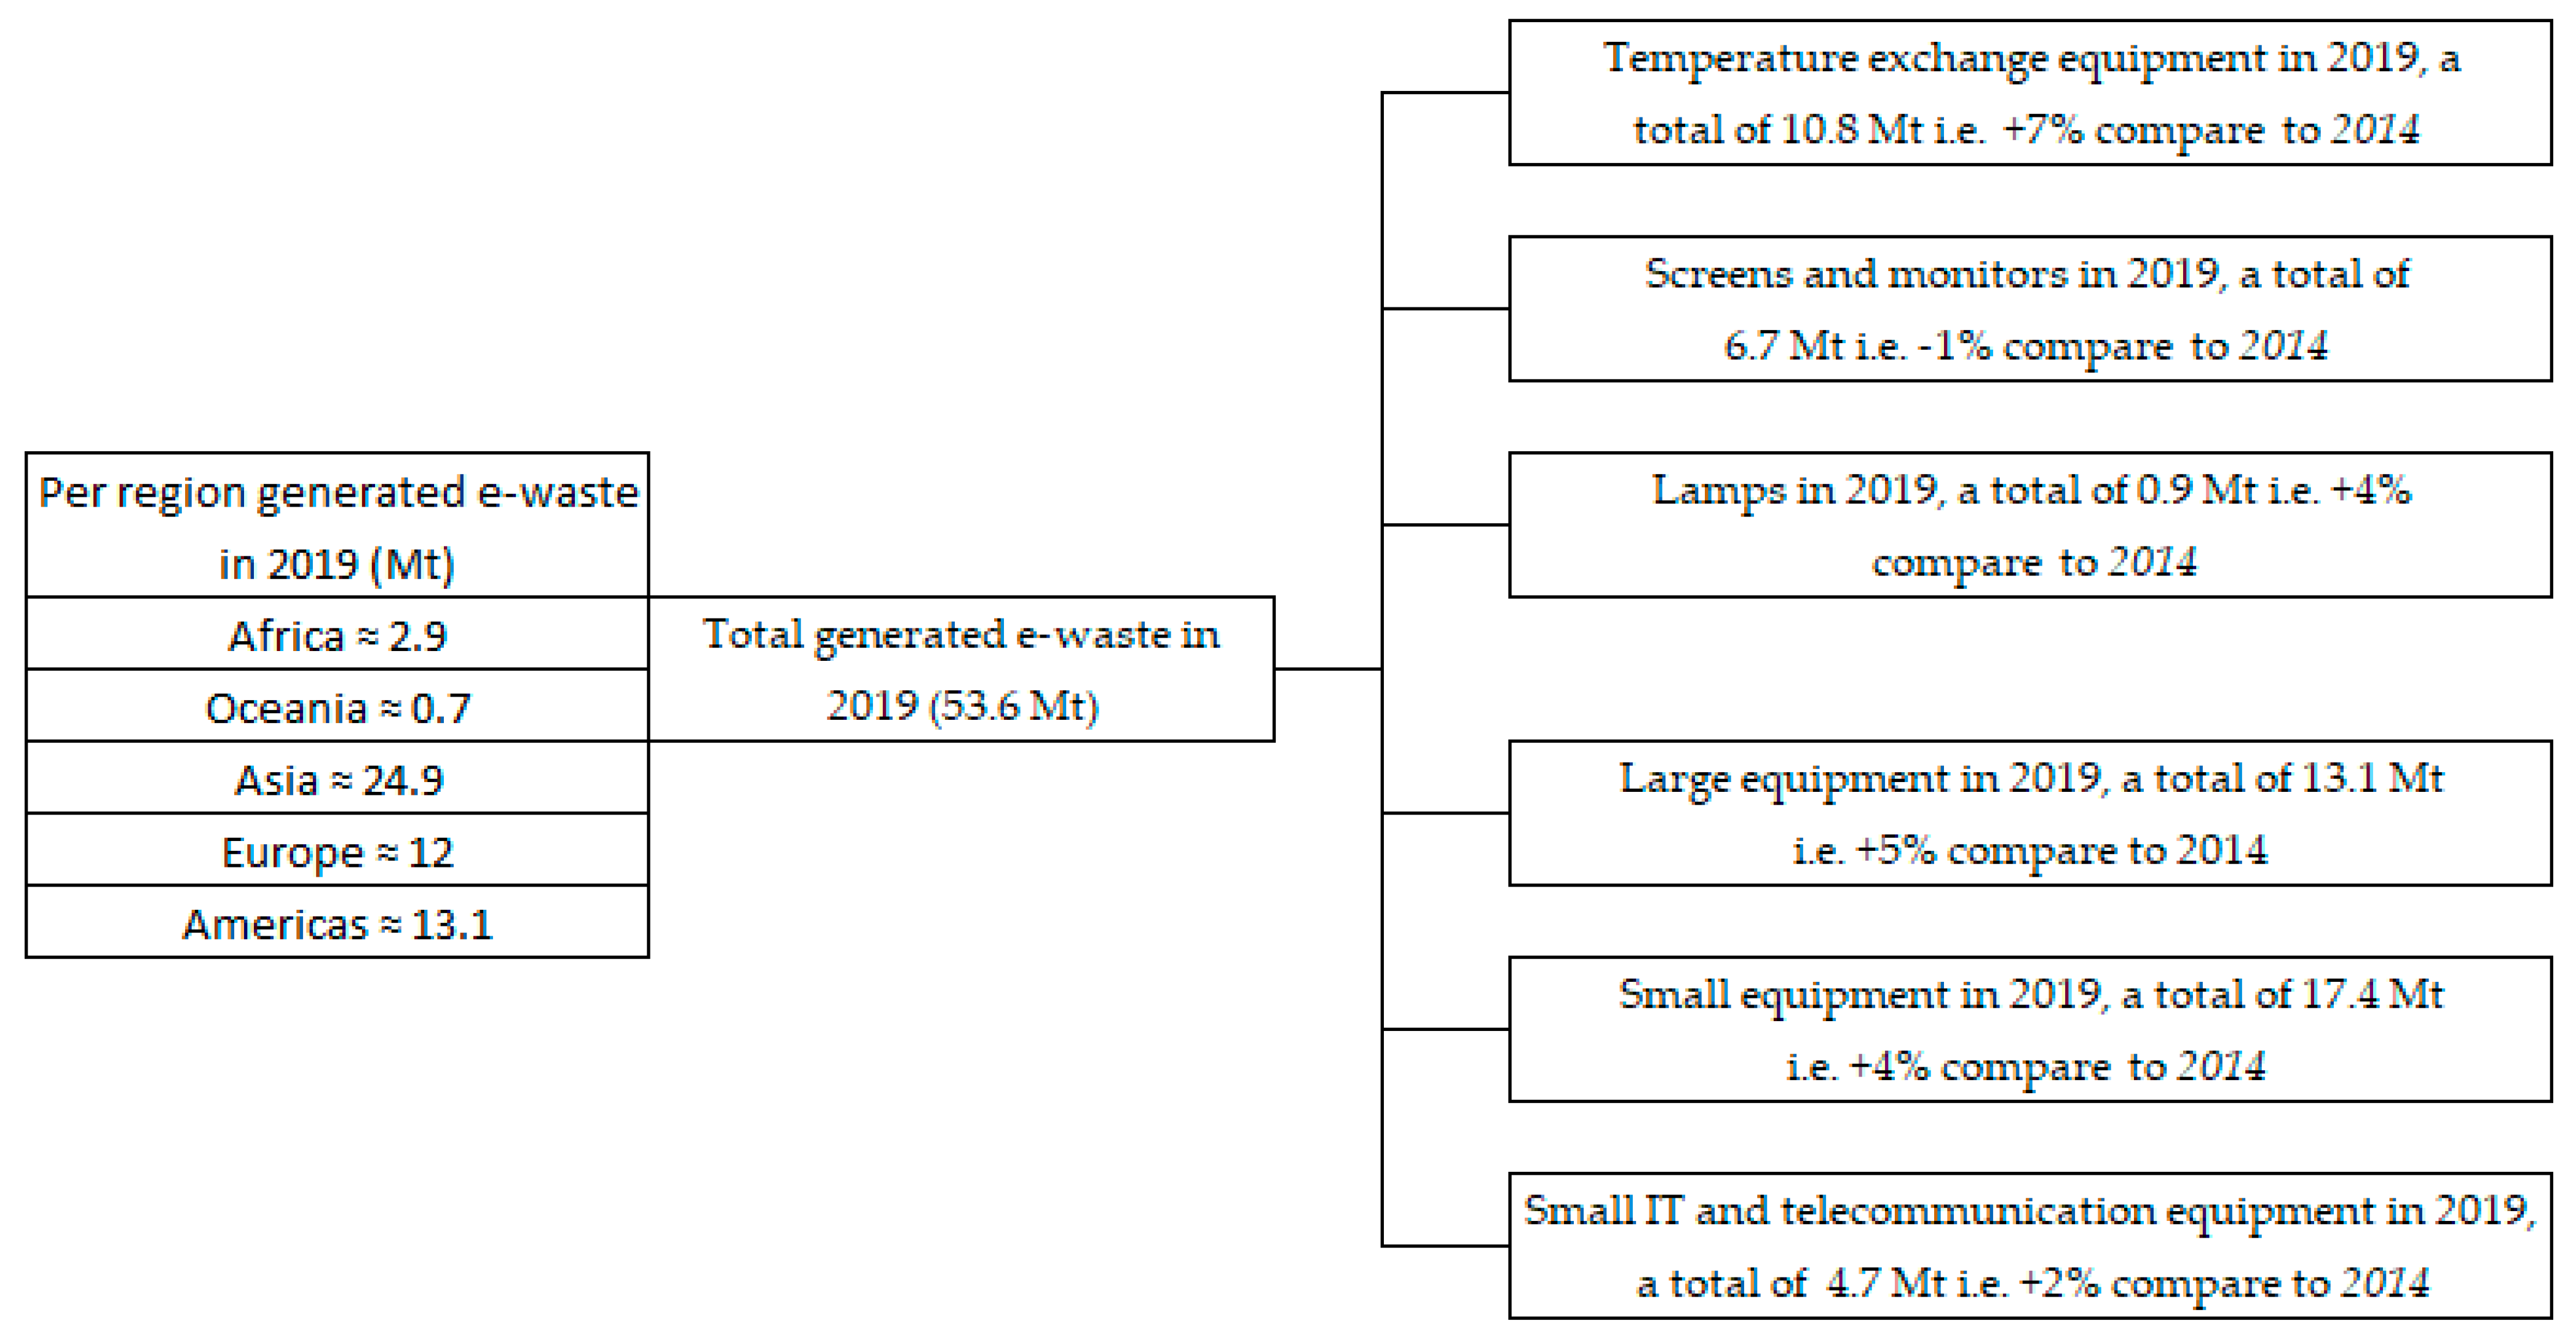
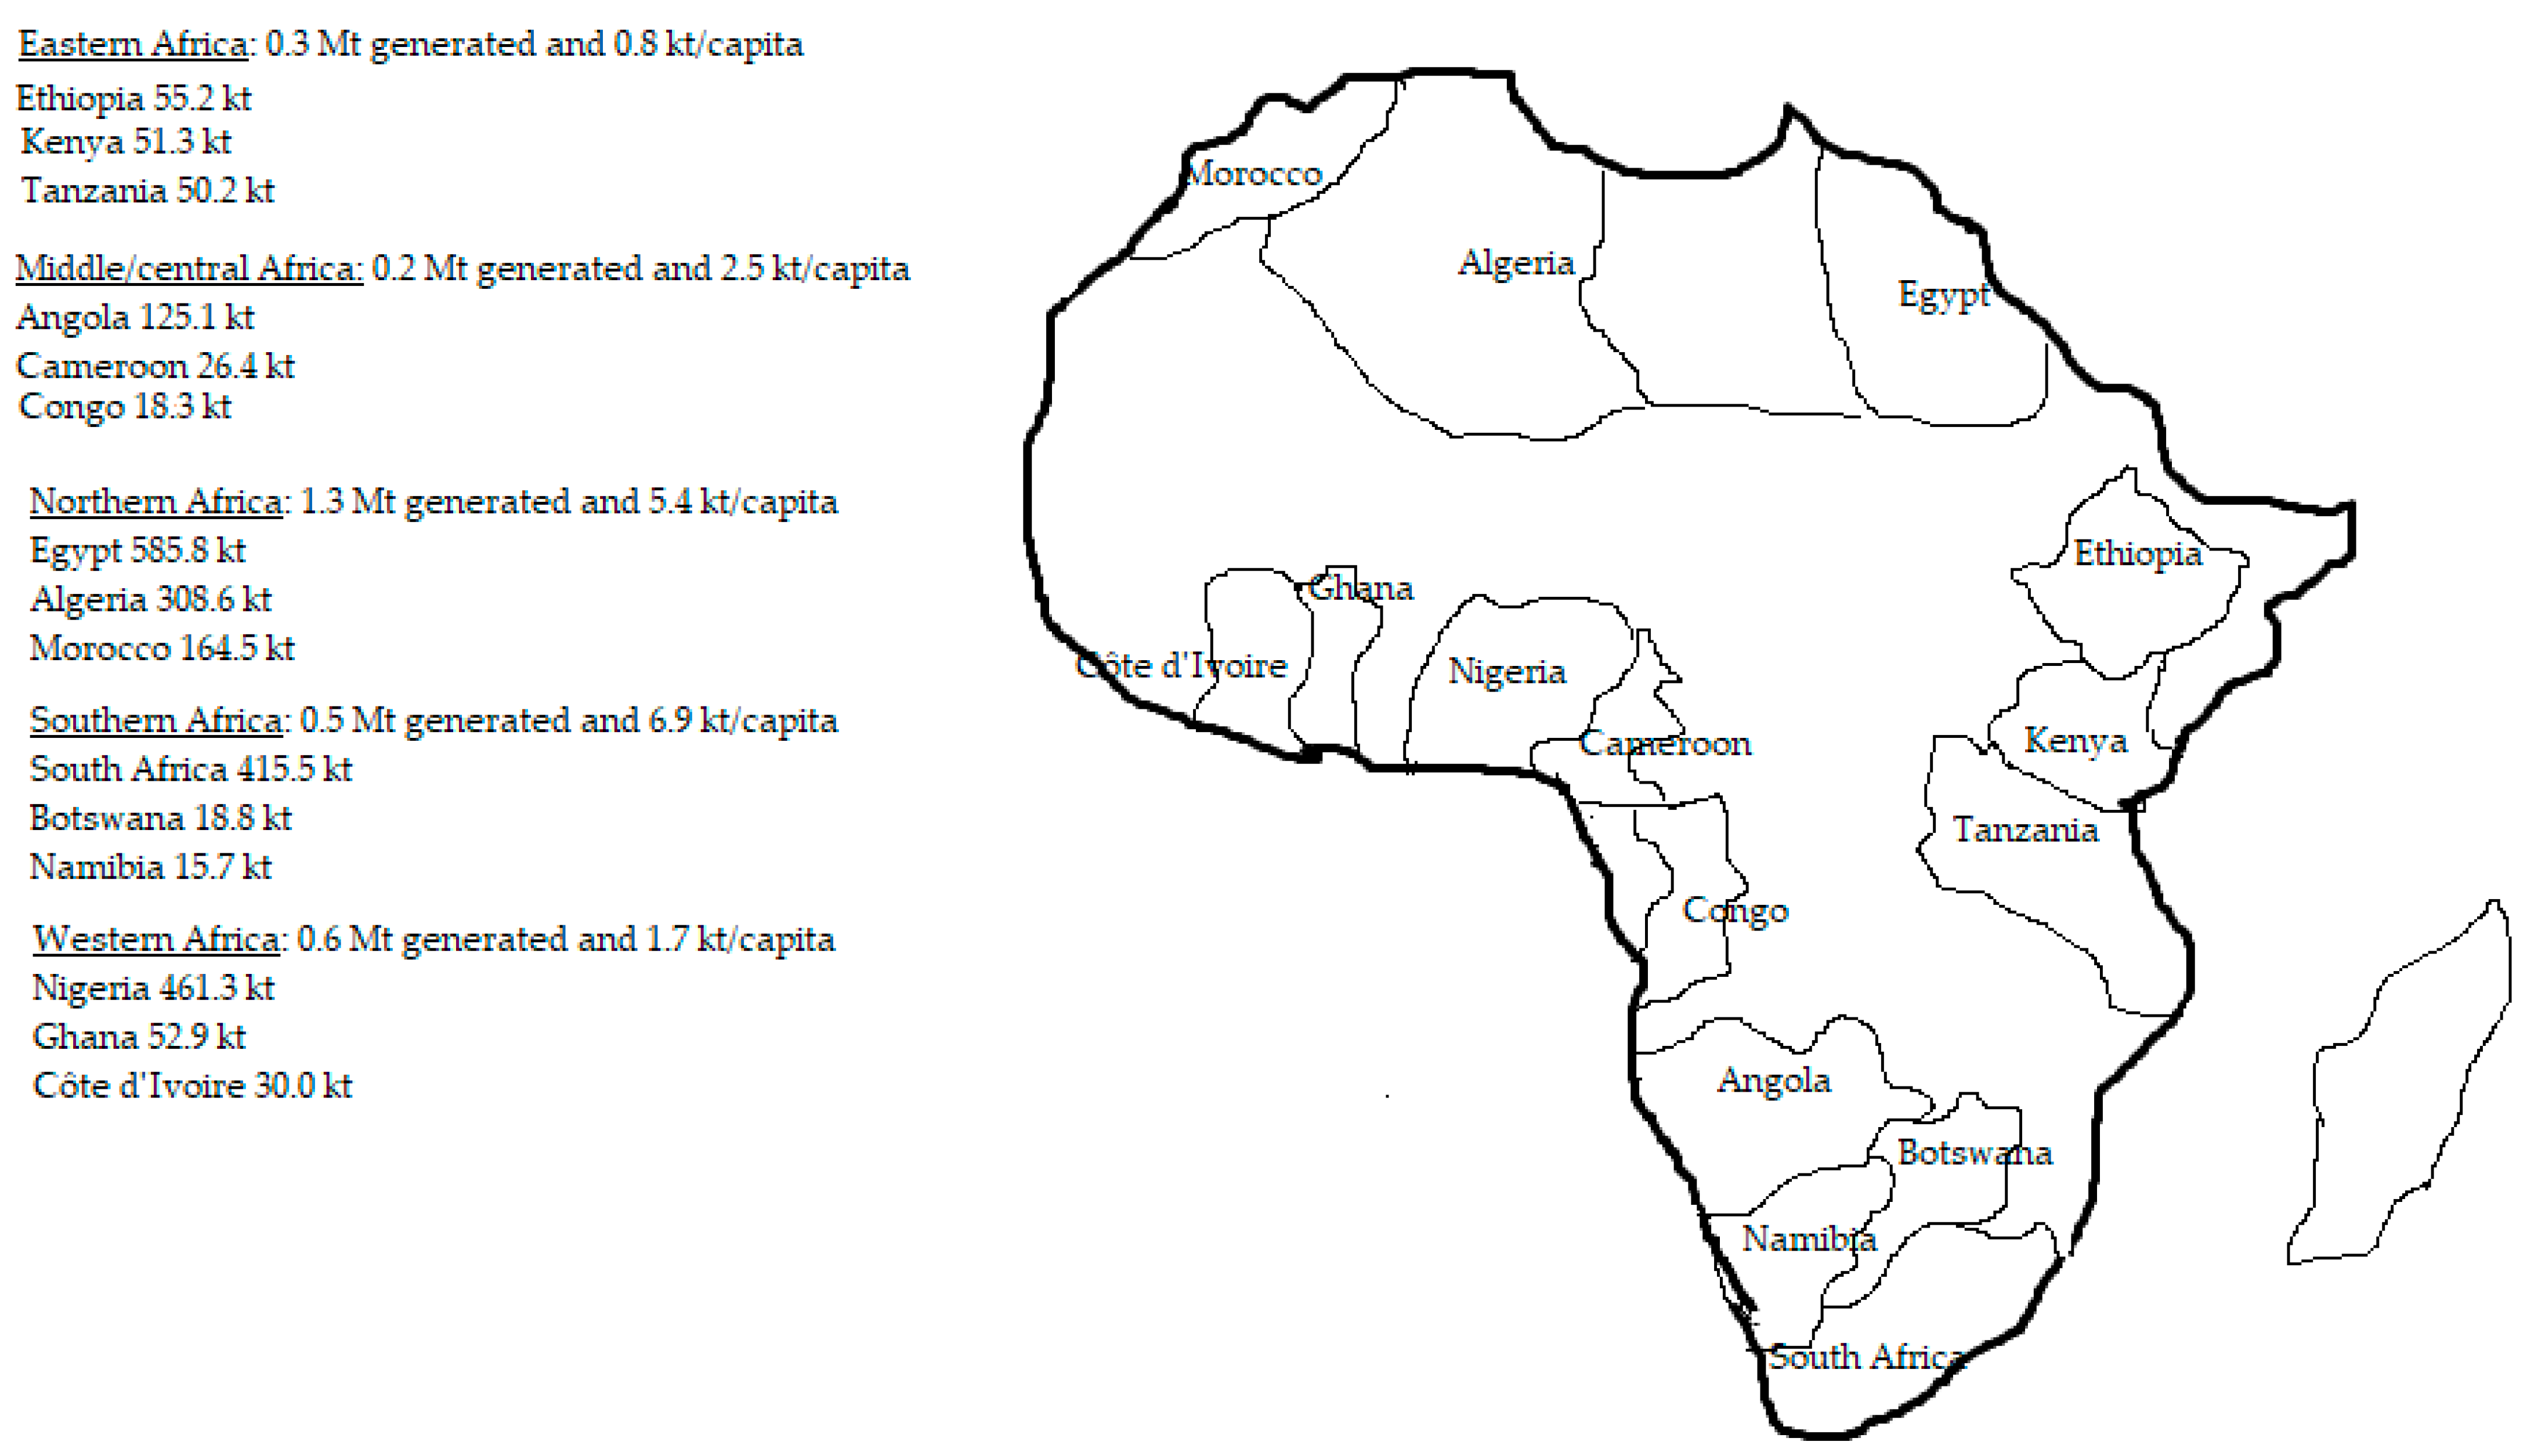
2. E-Scraps Generated
3. Special Case of Batteries
4. E-Waste Valorization and Toxic Substances
5. E-Waste Recycling Process
6. Strategies for Africa
7. Discussion
8. Conclusions
Author Contributions
Funding
Data Availability Statement
Acknowledgments
Conflicts of Interest
References
- Almosa, Y.; Parkinson, J.; Rundle-Thiele, S. Littering reduction: A systematic review of research 1995–2015. SAGE J. 2017, 23, 203–222. [Google Scholar] [CrossRef]
- Witt, U. Learning to consume—A theory of wants and the growth of demand. J. Evol. Econ. 2001, 11, 23–36. [Google Scholar] [CrossRef]
- Babu, B.; Parande, A.K.; Basha, C.A. Electrical and electronic waste: A global environmental problem. Waste Manag. Res. 2007, 25, 307–318. [Google Scholar]
- Vaibhav, S.; Ismail, S.A.; Singh, P.; Singh, R.P. Urban solid waste management in the developing world with emphasis on India: Challenges and opportunities. Rev. Environ. Sci. Biotechnol. 2015, 14, 317–337. [Google Scholar]
- Petronijevic, V.; Dordevic, A.; Stefanovic, M.; Arsovski, S.; Krivokapic, Z.; Misic, M. Energy Recovery through End-of-Life Vehicles Recycling in Developing Countries. Sustainability 2020, 12, 8764. [Google Scholar] [CrossRef]
- Parrot, P.; Sotamenou, J.; Dia, K.B. Municipal solid waste in Africa: Strategies and Livelihoods in Yaoundé, Cameroon. Waste Manag. 2008, 29, 986–995. [Google Scholar] [CrossRef] [PubMed]
- Telenko, C.; O’Rourke, J.; Seepersad, C.C.; Webber, M.E. A Compilation of Design for Environment Guidelines. J. Mech. Des. 2016, 138, 031102. [Google Scholar] [CrossRef]
- Han, J.; Jiang, P.; Childs, P.R.N. Metrics for Measuring Sustainable Product Design Concepts. Energies 2021, 14, 3469. [Google Scholar] [CrossRef]
- Wieser, H.; Tröger, N. Exploring the inner loops of the circular economy: Replacement, repair, and reuse of mobile phones in Austria. J. Clean. Prod. 2018, 172, 3042–3055. [Google Scholar] [CrossRef]
- Al-Salem, S.M.; Lettieri, P.; Baeyens, J. Recycling and recovery routes of plastic solid waste (PSW): A review. Waste Manag. 2009, 29, 2625–2643. [Google Scholar] [CrossRef]
- Heijungs, R.; Huppes, G.; Guinée, J.B. Life cycle assessment and sustainability analysis of products, materials and technologies. toward a scientific framework for sustainability life cycle analysis, Paper, Polymer Degradation and Stability. Polym. Degrad. Stab. 2010, 95, 422–428. [Google Scholar] [CrossRef]
- Wang, F.; Huisman, J.; Meskers, C.E.M.; Schluep, M.; Stevels, A.; Hagelüken, C. The Best-of-2-Worlds philosophy: Developing local dismantling and global infrastructure network for sustainable e-waste treatment in emerging economies. Waste Manag. 2012, 32, 2134–2146. [Google Scholar] [CrossRef] [PubMed]
- Şildar, A.; Rene, E.R.; Van Hullebusch, E.D.; Lens, P.N.L. Electronic waste as a secondary source of critical metals: Management and recovery technologies. Resour. Conserv. Recycl. 2018, 135, 296–312. [Google Scholar] [CrossRef]
- Yan, M.; Chan, C.A.; Gygax, A.F.; Yan, J.; Campbell, L.; Nirmalathas, A.A.; Leckie, C. Modeling the total energy consumption of mobile network services and applications. Energies 2019, 12, 184. [Google Scholar] [CrossRef] [Green Version]
- Andrac, A.S.G.; Anderson, O. Life Cycle Assessments of Consumer Electronics—Are They Consistent? Int. J. Life Cycle Assess. 2010, 15, 827–846. [Google Scholar] [CrossRef]
- Singh, N.; Duan, H.; Yin, F.; Song, Q.; Li, J. Characterizing the materials composition and recovery potential from waste mobile phones: A comparative evaluation of cellular and smart phones. ACS Sustain. Chem. Eng. 2018, 6, 13016–13024. [Google Scholar] [CrossRef]
- Mihai, F.C. E-Waste in Transition—From Pollution to Resource, 1st ed.; InTech: Rijeka, Croatia, 2016. [Google Scholar]
- Al-Rahmi, W.; Aias, N.; Alil, A.; Yahaya, N.; Saleh, M.; Al-Maatouk, Q. Strategies to manage electronic waste approaches: An overview in East Asia. Int. J. Eng. Technol. 2018, 7, 3268–3275. [Google Scholar]
- Kim, H.C.; Keoleian, G.A.; Horie, Y.A. Optimal household refrigerator replacement policy for life cycle energy, greenhouse gas emissions, and cost. Energy Policy 2006, 34, 2310–2323. [Google Scholar] [CrossRef]
- Cinelli, M.; Coles, S.R.; Jorgesen, A.; Zamagni, A.; Fernando, C.; Kirwan, K. Workshop on life cycle stability assessment: The state of the art and research needs. Int. J. Life Cycle Assess. 2012, 18, 1421–1424. [Google Scholar] [CrossRef]
- Gaidajis, G.; Angelakoglou, K.; Aktsoglou, D. E-waste: Environmental Problems and Current Management. J. Eng. Sci. Technol. Rev. 2010, 3, 193–199. [Google Scholar] [CrossRef]
- Holuszko, M.E.; Espinosa, D.C.R.; Scarazzato, T.; Kumar, A. Electronic Waste: Recycling and Reprocessing for a Sustainable Future, 1st ed.; John Wiley & Sons, Ltd.: New York, NY, USA; WILEY-VCH GmbH: Weinheim, Germany, 2022. [Google Scholar]
- Burlakovs, J.; Jani, Y.; Kriipsalu, M.; Vincevica-Gaile, Z.; Kaczala, F.; Celma, G.; Ozola, R.; Rozina, L.; Rudovica, V.; Hogland, M.; et al. On the way to ‘zero waste’ management: Recovery potential of elements, including rare earth elements, from fine fraction of waste. J. Clean. Prod. 2018, 186, 81–90. [Google Scholar] [CrossRef]
- Jowitt, S.M.; Werner, T.T.; Wenig, Z.; Mudd, M. Recycling of the rare earth elements. Curr. Opin. Green Sustain. Chem. 2018, 13, 1–7. [Google Scholar] [CrossRef]
- Buechler, D.T.; Zyaykina, N.N.; Spencer, C.A.; Lawson, E.; Ploss, N.M.; Hua, I. Comprehensive elemental analysis of consumer electronic devices: Rare earth, precious, and critical elements. Waste Manag. 2020, 103, 67–75. [Google Scholar] [CrossRef] [PubMed]
- Forti, V.; Baldé, C.P.; Kuehr, R.; Bel, G. The Global E-Waste Monitor 2020, Quantities, Flows, and the Circular Cconomy Potential. UNU/UNITAR: Geneva, Switzerland; ITU: Geneva, Switzerland, 2020; Available online: https://ewastemonitor.info/wp-content/uploads/2020/11/GEM_2020_def_july1_low.pdf (accessed on 13 February 2023).
- Birke, K.P. Modern Battery Engineering—A Comprehensive Introduction; World Scientific: Stuttgart, Germany, 2019. [Google Scholar]
- Burlakovs, J.; Kriipsalu, M.; Klavins, M.; Bhatnagar, A.; Vincevica-Gaile, Z.; Stenis, J.; Jani, Y.; Mykhaylenko, V.; Denafas, G.; Turkadze, T.; et al. Paradigms on landfill mining: From dump site scavenging to ecosystem services revitalization. Resour. Conserv. Recycl. 2017, 123, 73–84. [Google Scholar] [CrossRef] [Green Version]
- Hogland, W. Remediation of an Old Landfill Site, Soil Analysis, Leachate Quality and Gas Production. ESPR-Environ. Sci. Pollut. Res. 2002, 9 (Suppl. S1), 49–54. [Google Scholar] [CrossRef] [PubMed]
- Burlakovs, J.; Kaczala, F.; Vincevica-Gaile, Z. Mobility of metals and valorization of sorted fine fraction of waste after landfill excavation. Waste Biomass 2016, 7, 593–602. [Google Scholar] [CrossRef]
- Hogland, W.; Marques, M.; Nimmermark, S. Landfill mining and waste characterization: A strategy for remediation of contaminated areas. J. Mater. Cycles Waste Manag. 2004, 6, 119–124. [Google Scholar] [CrossRef]
- Meskers, C.E.M.; Hagelüken, C.; Damme, G.V. The Minerals, Metals & Materials Society (TMS), Green recycling of EEE: Special and precious metal recovery from EEE. In Proceedings of the Extraction & Processing Division (EPD) Congress at The Minerals, Metals & Materials Society (TMS) Annual Meeting & Exhibition, San Francisco, CA, USA, 15–19 February 2009. [Google Scholar]
- Baldé, C.P.; Forti, V.; Gray, V.; Kuehr, R.; Stegmann, P. The Global E-Waste Monitor 2017—Quantities, Flows and Resources. UNU: Tokyo, Janpan; ITU: Geneva, Switzerland, 2017; Available online: https://collections.unu.edu/eserv/UNU:6341/Global-E-waste_Monitor_2017__electronic_single_pages_.pdf (accessed on 13 February 2023).
- Global Alliance for Incinerator Alternatives (GAIA). Waste-to-Energy Has no Place in Africa. GAIA: Berkeley, CA, USA, 2018. Available online: https://www.no-burn.org/wp-content/uploads/Ethiopia_factsheet_layout_SEP-7-2018.pdf (accessed on 13 February 2023).
- Tesfaye, F.; Lindberg, D.; Hamuyuuni, J.; Taskinen, P.; Hupa, L. Improving urban mining practices for optimal recovery of resources from e-waste. Miner. Eng. 2017, 111, 209–221. [Google Scholar] [CrossRef]
- Cui, J.; Zhang, L. Metallurgical recovery of metals from electronic waste: A review. J. Hazard. Mater. 2008, 158, 228–256. [Google Scholar] [CrossRef]
- Li, W.; Achal, V. Environmental and health impacts due to e-waste disposal in China—A review. J. Total Environ. 2020, 737, 139745. [Google Scholar] [CrossRef] [PubMed]
- Singh, N.; Duan, H.; Tanga, Y. Toxicity evaluation of E-waste plastics and potential repercussions for human health. Environ. Int. 2020, 137, 105559. [Google Scholar] [CrossRef] [PubMed]
- Karwowska, E.; Andrzejewska-Morzuch, D.; Lebkowska, M.; Tabernacka, A.; Wojtkowska, M.; Telepko, A.; Konarzewska, A. Bioleaching of metals from printed circuit boards supported with surfactant-producing bacteria. J. Hazard. Mater. 2014, 264, 203–210. [Google Scholar] [CrossRef]
- Nfor, B.; Fai, P.B.A.; Fobil, J.N.; Basu, N. Effects of Electronic and Electrical Waste–Contaminated Soils on Growth and Reproduction of Earthworm (Alma nilotica). Environ. Toxicol. Chem. 2022, 41, 287–297. [Google Scholar] [CrossRef]
- Quan, S.X.; Yan, B.; Yang, F.; Li, N.; Xiao, X.-M.; Fu, J.-M. Spatial Distribution of Heavy Metal Contamination in Soils near a Primitive E-Waste Recycling Site; Springer: Berlin/Heidelberg, Germany, 2015; Volume 22, pp. 1290–1298. [Google Scholar]
- Adaramodu, A.; Osuntogun, A.; Ehi-Eromosele, C.O. Heavy Metal Concentration of Surface Dust Present in E-Waste Components: The Westminister Electronic Market, Lagos Case Study. Sci. Acad. Publ. 2012, 2, 9–13. [Google Scholar]
- Willner, J.; Fornalczyk, A.; Jablonska-Czapla, M.; Grygoyc, K.; Rachwal, M. Studies on the Content of Selected Technology Critical Elements (Germanium, Tellurium and Thallium) in Electronic Waste. Materials 2021, 14, 3722. [Google Scholar] [CrossRef]
- Ackah, M. Soil elemental concentrations, geoaccumulation index, non-carcinogenic and carcinogenic risks in functional areas of an informal e-waste recycling area in Accra, Ghana. Chemosphere. 2019, 235, 908–917. [Google Scholar] [CrossRef]
- Tokumaru, T.; Ozaki, H.; Onwona-Agyeman, S.; Ofosu-Anim, J.; Watanabe, I. Determination of the Extent of Trace Metals Pollution in Soils, Sediments and Human Hair at e-Waste Recycling Site in Ghana. Arch. Environ. Contam. Toxicol. 2017, 73, 377–390. [Google Scholar] [CrossRef]
- Khaliq, A.; Rhamdhani, M.A.; Brooks, G.; Masood, S. Metal extraction processes for electronic waste and existing industrial routes: A review and Australian perspective. Resources 2014, 3, 152–179. [Google Scholar] [CrossRef] [Green Version]
- Nnorom, I.C.; Osibanjo, O. Overview of electronic waste (e-waste) management practices and legislations, and their poor applications in the developing countries. Resour. Conserv. Recycl. 2008, 52, 843–858. [Google Scholar] [CrossRef]
- Wikipedia. Available online: https://en.wikipedia.org/wiki/Africa (accessed on 13 February 2023).
- Statista. Available online: https://www.statista.com/statistics/1224168/total-population-of-africa/ (accessed on 13 February 2023).
- Statista. Available online: https://www.statista.com/statistics/1224179/population-growth-in-africa/ (accessed on 13 February 2023).
- Vusumuzi, M.; Mfowabo, M. E-waste management in Sub-Sahara Africa: Systematic literature review. Cogent Bus. Manag. 2020, 7, 1814503. [Google Scholar]
- Borthakur, A. Policy approaches on E-waste in the emerging economies: A review of the existing governance with special reference to India and South Africa. J. Clean. Prod. 2020, 252, 119885. [Google Scholar] [CrossRef]
- Mostafa, T.M.; Sarhan, D.S. Economic Feasibility Study of E-Waste Recycling Facility in Egypt. Evergreen 2018, 5, 26–35. [Google Scholar] [CrossRef]
- RWANDA UTILITIES REGULATORY AUTHORITY (RURA). Available online: https://rura.rw/fileadmin/Documents/ICT/Laws/Regulation__Governing_e-waste_management_in_Rwanda.pdf (accessed on 13 February 2023).
- Statista. Available online: https://www.statista.com/statistics/1067081/generation-electronic-waste-globally-forecast/ (accessed on 13 February 2023).
- Sthiannopkao, S.; Wong, M.H. Handling e-waste in developed and developing countries: Initiatives, practices, and consequences. Sci. Total Environ. 2013, 463–464, 1147–1153. [Google Scholar] [CrossRef] [PubMed]
- Bimir, M.N. Revisiting e-waste management practices in selected African countries. J. Air Waste Manag. Assoc. 2020, 70, 659–669. [Google Scholar] [CrossRef]
- Statista. Available online: https://www.statista.com/statistics/791885/africa-mobile-phone-shipment-by-quarter/ (accessed on 13 February 2023).
- Le Nigeria Abrite La Première Unité De Fabrication De Smartphones D’Afrique. Available online: https://afrique.latribune.fr/africa-tech/telecoms/2017-04-23/le-nigeria-abrite-la-premiere-unite-de-fabrication-de-smartphones-d-afrique.html (accessed on 13 February 2023).
- Hp. Available online: https://h20195.www2.hp.com/v2/GetDocument.aspx?docname=c06000309 (accessed on 13 February 2023).
- Lenovo. Available online: https://www.lenovo.com/de/de/sustainability-product-recycling (accessed on 13 February 2023).
- Dell. Available online: https://www.dell.com/de-at/dt/corporate/social-impact/advancing-sustainability/electronics-recycling/index.htm#scroll=off&pdf-overlay=//www.delltechnologies.com/asset/de-at/services/cross-portfolio/briefs-summaries/dell-recycling-services-leadership-timeline.pdf (accessed on 13 February 2023).
- Samsung. Available online: https://www.samsung.com/at/explore/brand/environmental-strategy/ (accessed on 13 February 2023).
- Huawei. Available online: https://consumer.huawei.com/at/support/recycling/ (accessed on 13 February 2023).
- The World Bank Group. Climate Change Action Plan (2021–2025) A Summary; The World Bank Group: Washington, DC, USA, 2021; Available online: https://openknowledge.worldbank.org/bitstream/handle/10986/35799/CCAP-2021-25.pdf?sequence=2&isAllowed=y (accessed on 13 February 2023).
- Solid Waste Management City Profile. Available online: https://www.waste.ccacoalition.org/sites/default/files/files/city_profile_vienna_rev.pdf (accessed on 13 February 2023).
- Solid Waste Management City Profile. Available online: https://www.waste.ccacoalition.org/sites/default/files/files/city_profile_douala_english.pdf (accessed on 13 February 2023).
- WIKIPEDIA. Available online: https://fr.wikipedia.org/wiki/Yaound%C3%A9 (accessed on 13 February 2023).
- Köppl, A.; Loretz, S.; Meyer, I.; Schratzenstaller, M.; Köberl, K.; Sutrich, A. Effekte Eines Ermäßigten Mehrwertsteuersatzes Für Reparaturdientleistungen; WIFO: Vienna, Austria, 2019; Available online: https://www.wifo.ac.at/jart/prj3/wifo/resources/person_dokument/person_dokument.jart?publikationsid=61957&mime_type=application/pdf (accessed on 13 February 2023).
- Ojedokun, O.; Henschel, N.; Arant, R.; Boehnke, K. Applying the theory of planned behavior to littering prevention behavior in a developing country (Nigeria). Waste Manag. 2022, 142, 19–28. [Google Scholar] [CrossRef]
- Park, M.; Israsena, P.; Tangsantikul, J.; Durling, D. E-waste and Obsolescence: Designing out Toxicity. In Proceedings of the Research: Uncertainty Contradiction Value—DRS International Conference 2012, Bangkok, Thailand, 1–4 July 2012. [Google Scholar]


| Item | Average Item Mass (kg) | Estimated Lifespan (years) |
|---|---|---|
| Cell/Mobile phone | 0.1 | 2 |
| Notebook * | 2.3 | 4 |
| Desktop computer | 25 | 5 |
| Television | 30 | 5 |
| Refrigerator | 35 | 10 |
| Battery * | 0.055 | 3.5 |
| Industrial Processes | Metals Recovered | Main process Features | Main Metallurgical Process | Toxic Substances | Exposure Route | Average Estimated Concentration in e-Waste (mg/kg) * | Health Effects (a Few Diseases) |
|---|---|---|---|---|---|---|---|
| Noranda process at Quebec, Canada | Cu, Au, Ag, Pt, Pd, Se, Te, and Ni | Smelting of e-waste and Cu concentrate (14% of the total throughput). Electrorefining for metal recovery | Pyrometallurgy | Persistent organic contaminants | |||
| Brominated flame retardants | Air, dust, food, water, and soil | Thyroid problem, impaired development of the nervous system etc. | |||||
| Boliden Rönnkär Smelter | Cu, Ag, Au, Pd, Ni, Se, Zn, and Pb | Smelting in Kaldo reactor, upgrading in Cu and high Precious Metals recovery by copper refining. Total feed 100,000 tons every year | Pyrometallurgy | Polybrominated diphenyl ethers (PBDEs) | Reproductive neurobehavioral development, thyroid function. Hormonal | ||
| Polybrominated biphenyl (PBBs) | |||||||
| Test at Boliden Rönnkär Smelter | Copper and precious metals (PMs) | PC scrap feeding to a zinc Fuming process (1:1 mixture with crushed revert slag); Plastics were tested as reducing agent and fuel; Copper and precious metals following the cop per collector to be recovered to the copper smelter | Pyrometallurgy | Polychlorinated biphenyl (PCBs) | Air, dust, food, and soil (bio-accumulative in fish and seafood) | Carcinogenicity, on multiple targets such as liver, thyroid, immune function, repro duction, and neurobehavioral development. | |
| Umicore´s Precious metal refinery at Hoboken, Belgium | Au, Ag, Pd, Pt, Se, Ir, Ru, Rh, Cu, Ni, Pb, In, Bi, Sn, and Sb As, | IsaSmelt, copper leaching, and electrowinning and precious metal refining for Precious Metal Operation (PMO); E-waste cover up to 10% of the feed (250,000 tons of different wastes per annum); Plastic partially substitutes the coke as reducing agent and fuel in IsaSmelt; existence of Offgas emission control system | Combination of pyrometallurgy and hydrometallurgy | Dioxins | |||
| Polychlorinated dibenzodioxins (PCDDs) and dibenzofurans (PCDFs) | Air, dust, food, water, soil, and vapour | Reproductive, neurobehavioral and immune development | |||||
| Polyaromatic hydrocarbons (PAHs) | Released as combustion byproduct: air, dust, soil, and food (bio accumulative in fish and seafood) | Carcinogenicity, mutagenicity, and teratogenicity | |||||
| Heavy metals | |||||||
| Umicore’s trial | Au, Ag, Pd, Pt, Se, Ir, Ru, Rh, Cu, Ni, Pb, In, Bi, Sn, As, and Sb | Plastics-rich material from WEEE were tested to replace coke as a reducing agent and energy source for the IsaSmelet | Combination of pyrometallurgy and hydrometallurgy | Lead (Pb) | Air, dust, food, water, and soil | 1782.4 | Neurobehavioral development of children. Anemia. Kidney damage. Chronic neurotoxicity |
| Chromium (Cr) or hexavalent chromium | Air, dust, food, water, and soil | 75.5 | Carcinogenicity, Reproductive functions. | ||||
| Cadmium (Cd) | Air, dust, food, water, and soil (specially rice and vegetables) | 39 | Endocrine function. Ovotoxicity | ||||
| Dunn’s patent for gold refining | Au | Gold scrap reacted with chlorine at 300 °C to 700 °C; Hydrochloric acid to dissolve the impurity-metal chlorides; Ammonium hydroxide and nitric acid washing respectively to dissolve the silver chloride; Samples should contain more than 80% of gold | Combination of pyrometallurgy and hydrometallurgy | Mercury (Hg) | Air, dust, food, water, and soil (bio accumulative in fish) | 1.2 | Neurobehavioral development of children (especially methylmercury). Anemia. Kidney damage |
| Outotec’s Ausmelt TSL and Kaldo Furnaces | Zn, Cu, Au, Ag, In, Pb, Cd, and Ge | Copper scrap and e-waste recycling with many refining steps downstream | Pyrometallurgy | Zinc | Air, dust, food, water, and soil | 1561.1 | Increased risk of Cu deficiency (Anemia, neurological abnormalities) |
| Nickel (Ni) | Air, water, soil, and food (plants) | 65.8 | Carcinogenic, lung embolism, respiratory failure | ||||
| Lithium (Li) | Air, water, soil, and food (plants) | 44.3 | Burning sensation, Cough. Labooured breathing | ||||
| Barium (Ba) | Air, dust, and water | 626 | Increased blood pressure, stomach irritation, nerve | ||||
| Dowa mining Kosaka Japan | Cu, Au, and Ag | E-waste TSL, smelting in a secondary copper process | Hydrometallurgy | Beryllium (Be) | Air, water, and food | 0.014 | Pneumonia. Berylliosis a persistent and lung problem |
| Aluminum (Al) | Air, dust, water, and soil | 9510 | Skeletal development and metabolism, neurotoxicity, fetal toxicity | ||||
| Antimony (Sb) | Air, water, and soil | 180 | Damage lung, heart, liver, and kidney, eye irritation, etc. | ||||
| Arsenic (As) | Air, soil, water, and food | 0.47 | Skin alterations. Decreased nerve, diabetes, cancer | ||||
| Bismuth (Bi) | Air, water, and soil | 2.7 | Kidney damage, serious ulceration stomatitis, albumin, etc. | ||||
| I.S-Nikko’s recycling facility, Korea | Au, Ag, and Platinum Group Metals | Recycling in TSL, smelting followed by electrolytic refining | Pyrometallurgy | Cobalt (Co) | Air, dust, water, soil, and food | 8.3 | Discomfort of bodies, albumin, diarrhea, etc. |
| Copper (Cu) | Air, dust, water, and soil | 115.5 | Asthma, pneumonia, nausea, vision and heart problem, etc. | ||||
| Gallium (Ga) | Air, water, and fume | 2.43 | Irritation of the nose, mouth, and eyes, headache, diarrhea | ||||
| Day‘s Patent | Pt, Pd, and Precious Metals | Smelting in plasma arc furnace at 1400 °C. PMs collected in Basis Metal (BM). Ag and Cu used to collect metal | Combination of pyrometallurgy and hydrometallurgy | Germanium (Ge) | Air and dust | 1.9 | Abdominal cramps, burning sensation, red skin and eyes |
| Indium (In) | Air, dust, water, and soil | 4.6 | Damage the heart, kidney and liver, etc. | ||||
| Molybdenum (Mo) | Air, dust, water, and soil | 1.2 | Liver disfunction with hyperbilirubinemia, pain in knees, etc. | ||||
| Selenium (Se) | Air, dust, water, and soil | 12.67 | Hair loss, cardiovascular, renal, and neurological problem | ||||
| Aleksandrovich Patent | Au and Platinum Group Metals | Scrap combustion in a BM with carbon reduction | Pyrometallurgy | Silver (Ag) | Water and soil | 49 | Allergic dermatitis, inhalation hazards |
| Tin (Sn) | Air, dust, water, and soil | 1716.4 | Eye and skin irritation, headache, stomach ache, etc. | ||||
| Vanadium (V) | Air, dust, water, and soil | 66 | Severe eye, nose, and throat irritation | ||||
| Aurubis recycling Germany | Cu, Pd, Zn, Sn, and Precious Metals | Smelting of Cu and e-waste in TLS, black Cu processing and electrorefining | Hydrometallurgy | Yttrium (Y) | Air, dust, water, and soil | 1.99 | Lung embolisms, cancer with humans |
| Iron (Fe) | Air, dust, water, and soil | 91.1 | Liver damage | ||||
| Material | Energy Savings (%) |
|---|---|
| Aluminum | 95 |
| Copper | 85 |
| Iron and steel | 74 |
| Lead | 65 |
| Zinc | 60 |
| Paper | 64 |
| Plastic | >80 |
| 2019 | 2021 | 2030 | |
|---|---|---|---|
| Worldwide | 53.6 | 54.8 | 74.7 |
| Africa | 2.9 | 3 | 4 |
| Metrics | Attributes | Business as Usual Production | Under Selected DfE Conditions Production |
|---|---|---|---|
| Material | Material origin (M1) | • Stainless steel (1), screen (1), plastic (1), battery (0), ceramic as composite (0) | • Only recy. stainless steel (2), only recy. * LCD screen (2), recy. PC-plastic (2), recy. battery (1), natural ceramic (1) |
| Material property (M2) | • Stainless steel (1), screen (1), plastic (1), battery (0), ceramic as composite (0) | • Only recy. stainless steel (2), only recy. LCD screen (2), recy. PC-plastic (2), recy. battery (1), natural ceramic (1) | |
| Use material quantity (M3) | • Stainless steel (1), screen (1), plastic (1), battery (0), ceramic as composite (0) | • Only recy. stainless steel (2), only recy. LCD screen (2), recy. PC-plastic (2), recy. battery (1), natural ceramic (1) | |
| Use of material type (N) | 5 | 5 | |
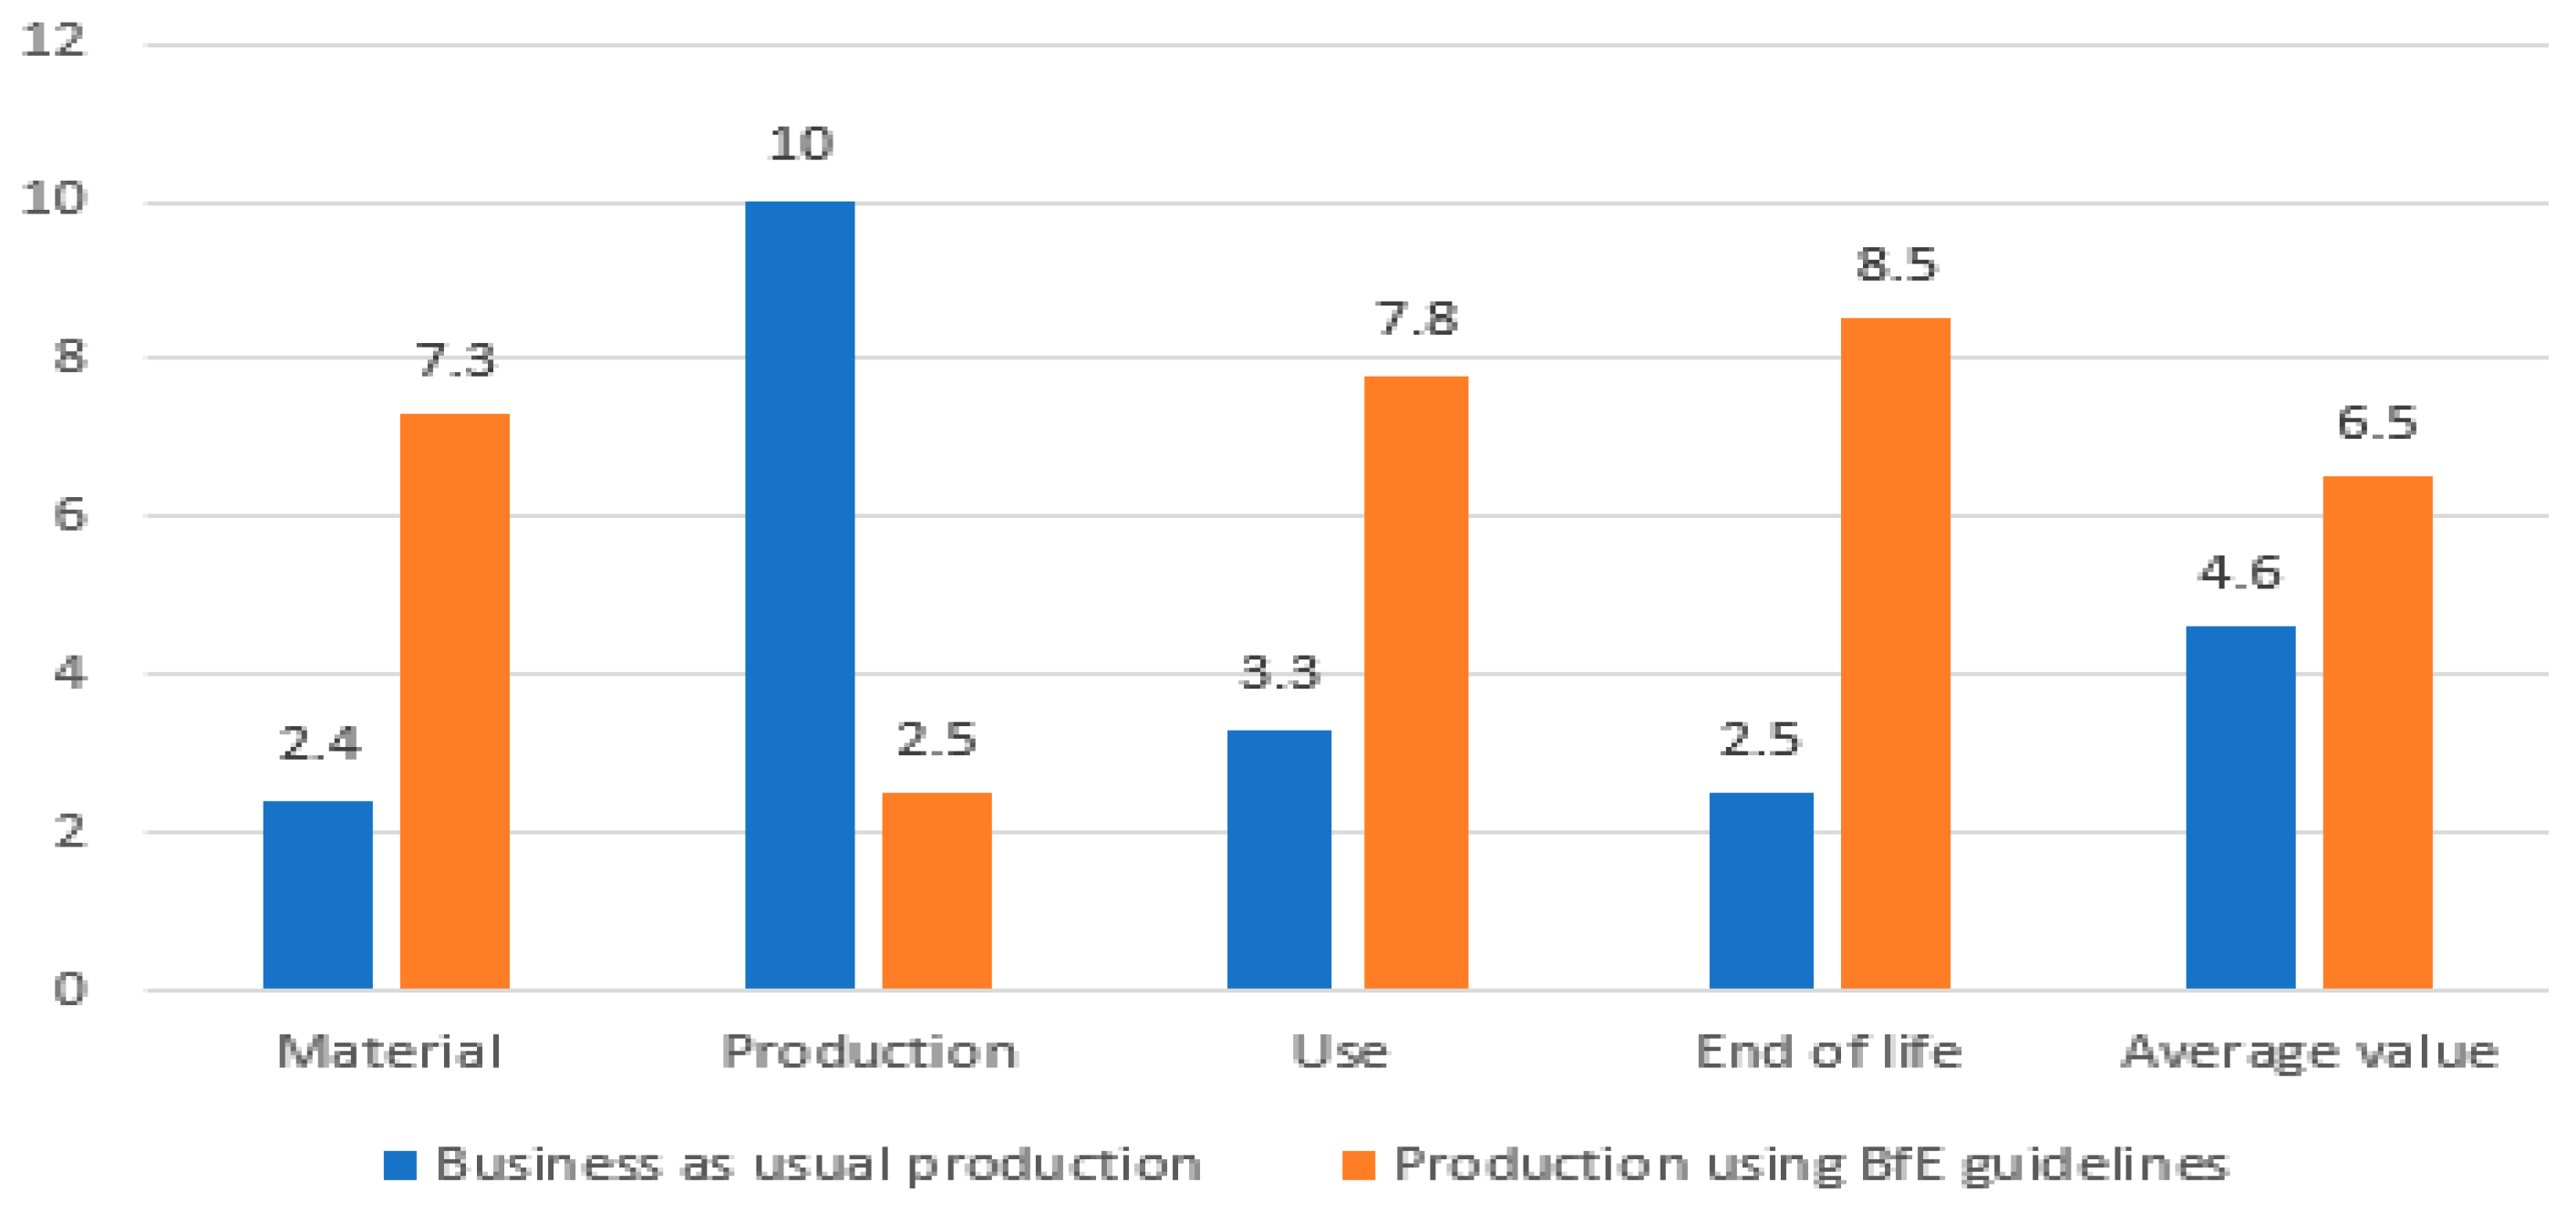
| MetricMaterial | 2.4 | 7.3 | |
| Production | Balance between the number of parts and complexity (P1) | Currently design standard with a mass production (2) | The same design standard with a few more steps like the production of recycled components (1) |
| Parts standardisation (P2) | Battery and some components can benefit from standard component (2) | Some components require customisation (0) | |
| Parts design for assembly (P3) | Good potential for assembly (2) | Good potential for assembly (2) | |
| Suitable fabrication method (P4) | Currently valid operations are needed (2) | Relative more operations are needed (1) | |
| MetricProduction | 10 | 2.5 | |
| Use | Product use time/lifetime (U1) | The design time needs to be closer to its use time (1) | The design time needs to be closer to its use time (2) |
| Energy consumption during use (U2) | Needs battery to power (1) | Needs also recy. battery to power (2) | |
| Robustness, reliability, and maintenance (U3) | Internal components for the base will require a fair amount of resource to maintain/service (1) | Internal components for the base will require a fair amount of resource to maintain/service (1) | |
| MetricUse | 3.3 | 7.8 | |
| Reuse (E1) | Battery and some components have fair potential to be reused (1) | Battery and some components have great potential to be reused (2) | |
| Recycling, remanufacturing, and repair (E2) | All material involved can be recycled or not (1) | Almost all material involved can be recycled (2) | |
| Disposal (E3) | Blender base that contains battery and some components will not be easy to disassemble (1) | Battery and some components cause a very slight negative impact due to disposal (1) | |
| Ease of disassembly (E4) | Blender base that contains battery and some components will not be easy to disassemble (1) | Blender base that contains battery and some components will be easier to disassemble/landfill (2) | |
| End of life | MetricEOL | 2.5 | 8.5 |
| Appropriate Measures to Be Put in Place | |
|---|---|
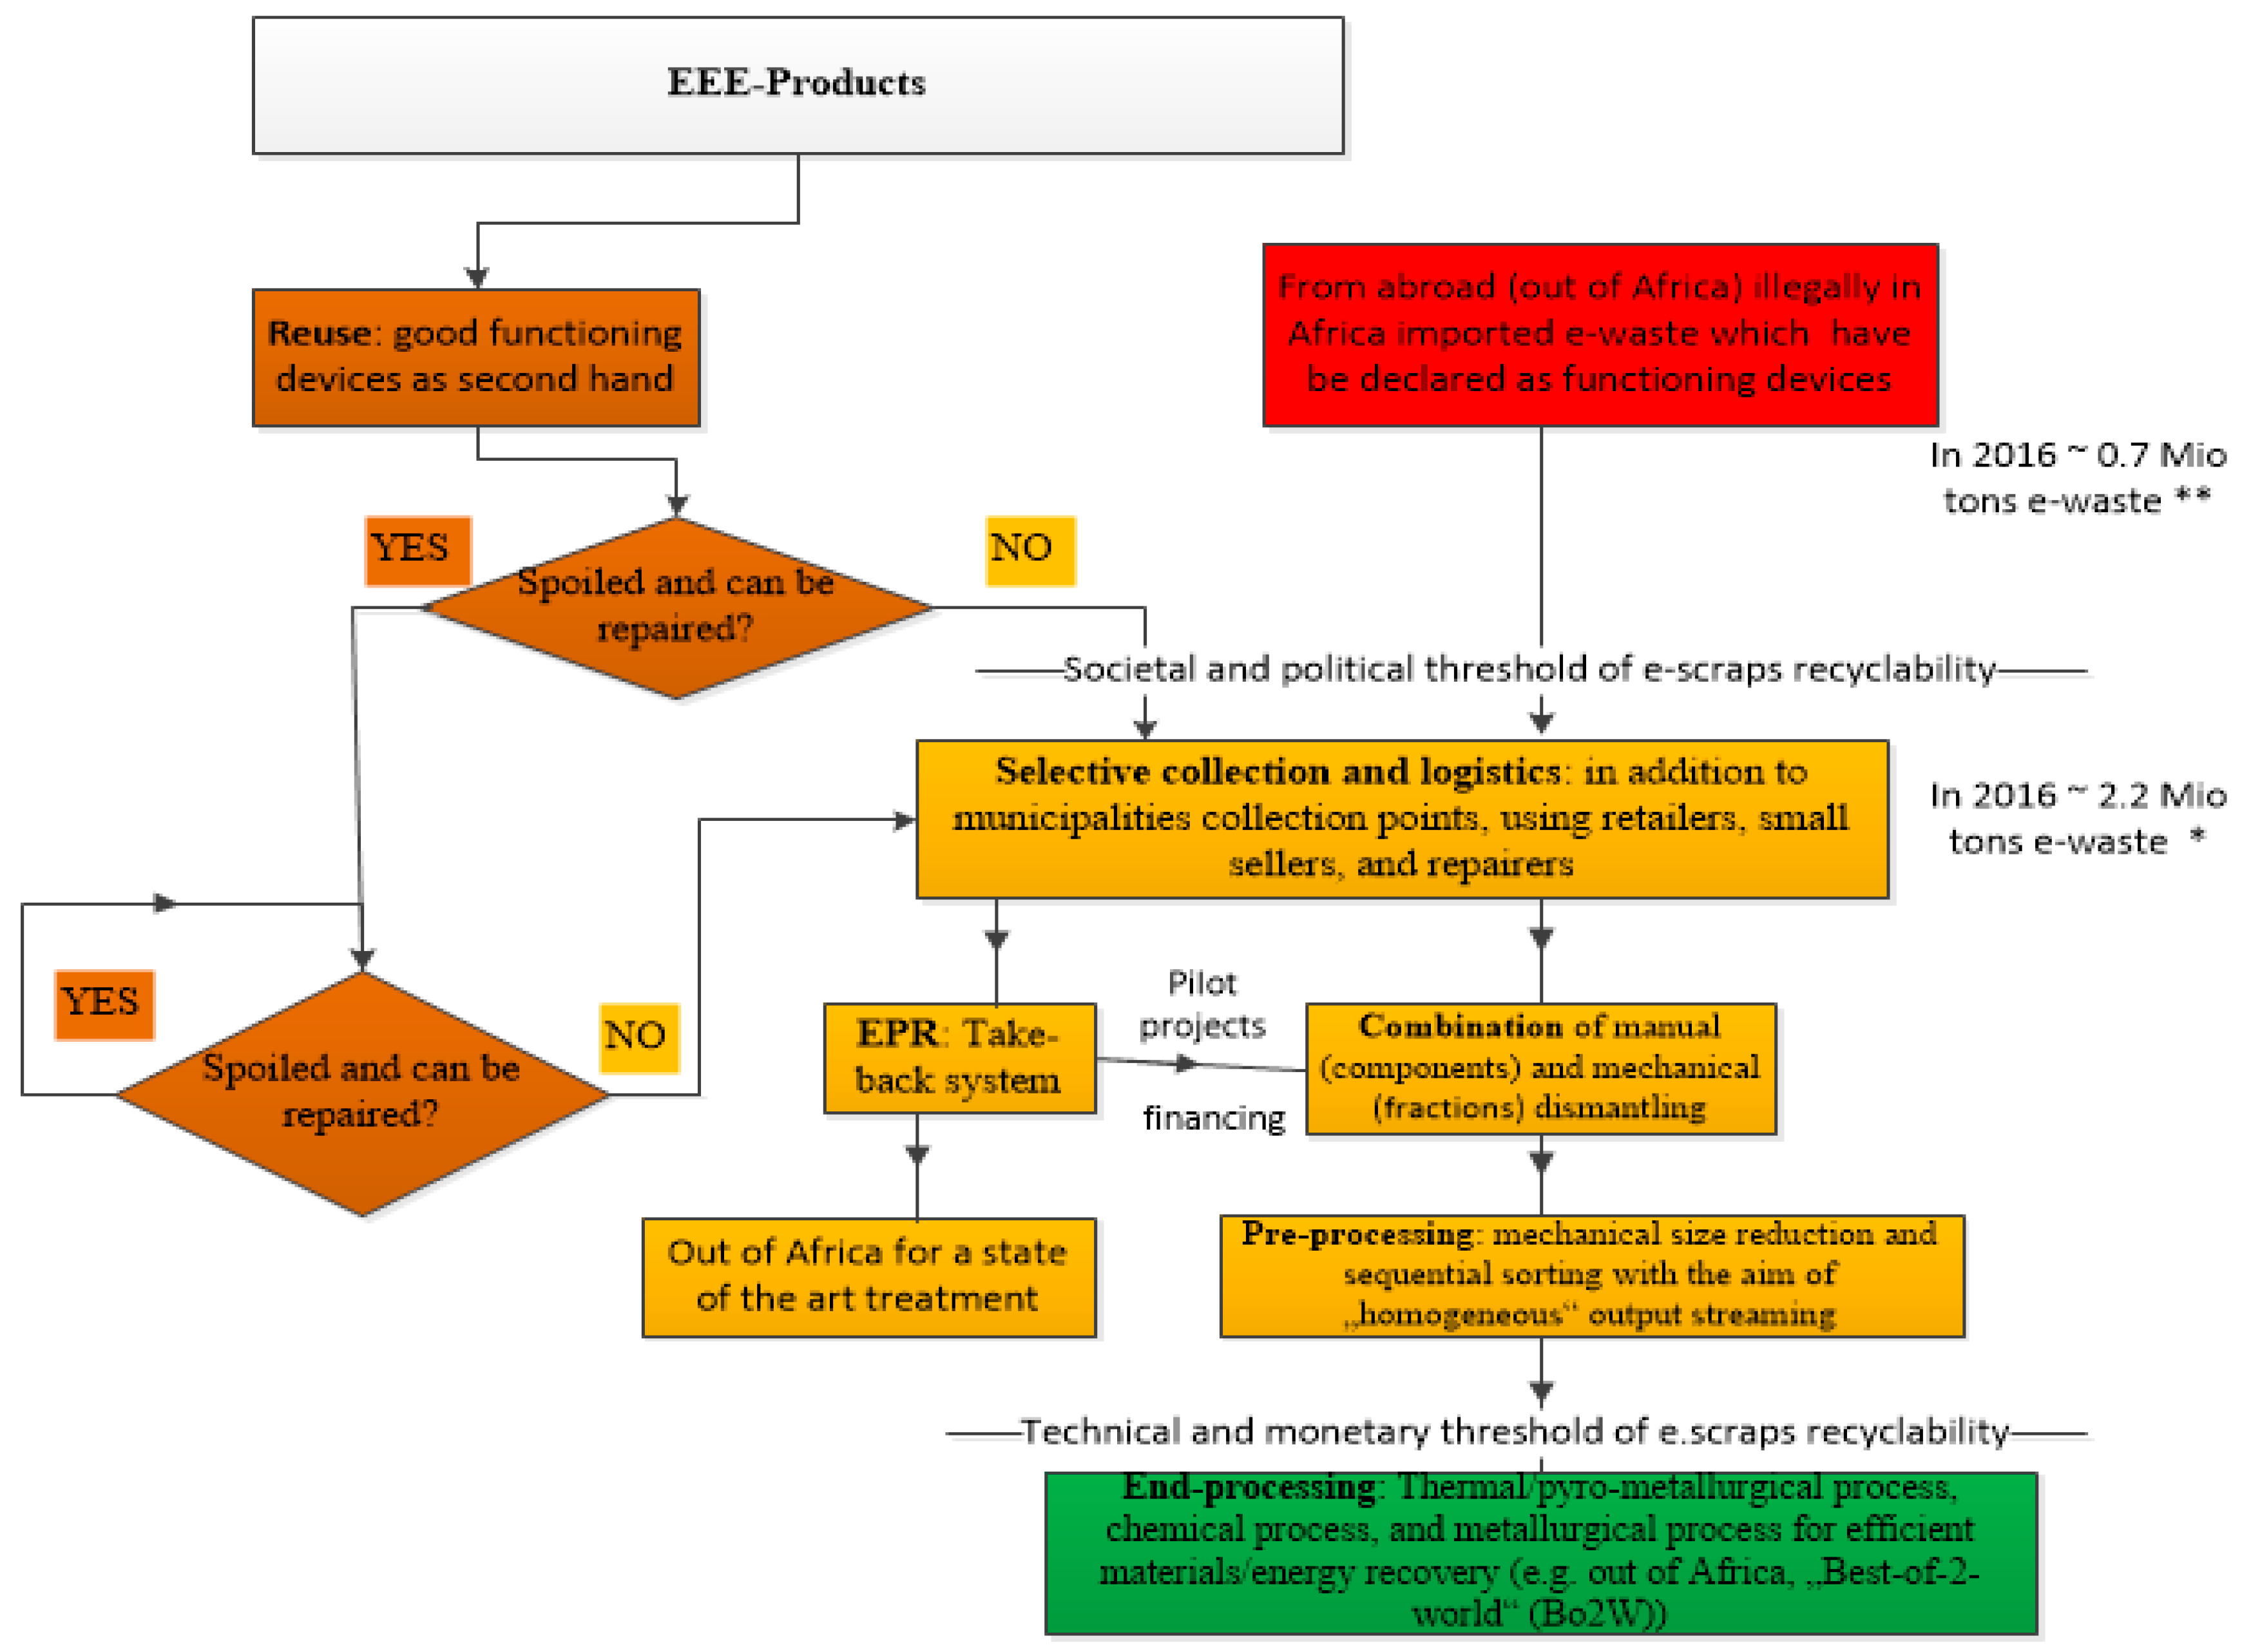
| Based on current practice in African countries, a significant portion of e-waste is illegally imported, causing significant harm to the population and the environment. In the short term, this activity needs to be effectively and completely banned, monitored, and sanctioned by national and international law. | |
| Short-term strategy (within 5 years) should focus on improving the current situation by implementing a comprehensive and efficient collection and logistics strategy that involves all stakeholders. This should be accompanied by monitoring and raising awareness among all actors involved in the process to ensure proper handling of the waste and promote health and environmental safety. Additionally, motivated by the need to minimize the environmental impact of e-waste, several technological changes have been made. These include: • The replacement of CRT screens with LCD screens (eliminating Pb but introducing Hg) • The introduction of optical fibres (Cu eliminated from the cabling, but F, Pb, Y and Zr introduced) • The introduction of rechargeable batteries (Ni, Cd reduced, but Li increased), and so on. All this changes and their consequences need to be considered during the improvement. A well-organized and structured manual disassembly process for products that are not taken back will also be a part of a sustainable African e-scrap recycling strategy. | |
| Meddle-term strategy (from 6 to 30 years) involves gradually organizing e-waste preprocessing up to recycling. This includes reducing landfill, organizing waste handling and utilization services by waste companies country-wide, improving hazardous waste collection, ensuring that hazardous waste packaging and labeling comply with special legislation, transporting hazardous waste only to landfills that can treat them, treating specific types of hazardous waste in Africa, stabilizing waste quantities using charges/taxes, and further reducing waste. An effective take-back system (EPR) or a combination of manual and mechanical disassembly, mechanical size reduction, and sequential sorting systems should be used to obtain homogeneous output streams at the end of the process. With photovoltaic technology being part of the solution for renewable energy, its recycling will become a challenge in 15 years due to the large amount of obsolete solar panels. Pilot projects in cooperation with producers (EPR) and the Climate Change Action Plan (2021–2025) from the World Bank Group (WBG) should be implemented [65]. Financial possibilities should be utilized to set up a policy and transitional legislation that considers e-waste management problems for sustainable development in Africa. The educational system should be reformed starting with a proper program on waste management, and encourage reduce, reuse, repair, and recycling to increase the lifespan of products and save resources. | |
| The long-term strategy (from 31 to 50 years) consists of end processing, which is a technical and economic challenge in e-waste treatment. Various processes, such as thermal pyro metallurgical, chemical, and metallurgical, are used for efficient materials and/or energy recovery. Umicore Precious Metal Refining in Belgium has the capacity to produce 2400 tons of silver, 100 tons of gold, 25 tons of palladium, and 25 tons of platinum per year, and the investment cost for the metallurgical processes is more than €500 million. Technical know-how and large investments are necessary to achieve this step, and many individual African countries do not have the capacity to do it alone. The “Best of Two Worlds (Bo2W)” philosophy can be a solution approach for African countries, or many countries can come together and construct the plant corresponding to their needs. “Best of two worlds (Bo2W)” philosophy [12] suggests a pragmatic network solution for e-waste management in emerging economies, which seek technical and logistical integration of “best” manual e-scrap disassembly based preprocessing in developing countries and “best” end processing treatment of hazardous and complex fractions in dedicated facilities in developed countries. Existing technologies should be used to recycle the minimized waste, which occurs when EEE products reach the end of their life cycle. The goal is to gradually and significantly reduce this waste by improving its landfill and take the treatment of electrical and electronic waste in Africa out of its embryonic state. | |
| Austria | Cameroon | |
|---|---|---|
| Population (in million) | 8.9 | 26.6 |
| Considered big cities and its popuulation (in milion) | Vienna ≈ 1.9 | Douala (Dla) ≈ 3.5 Yaounde (Yde) ≈ 4.1 |
| Municipal Solid Waste (MSW) quantity per year | Vienna ≈ 1,024, 407 tons, 549 kg/capita | Dla ≈ 694,483 tons, Yde ≈ 2/3 of Dla quantity, 226.3 kg/capita for both cities |
| Considered plastic and EEE waste quantity per year in those cities | Plastic ≈ 8195 tons EEE ≈ 8333 tons (from DRZ-Vienna) | Plastic ≈ 20,884 (3% of 694,483) tons for Dla and 13,890 tons for Yde EEE ≈ 2/3 of 26.4 kt for both cities |
| Existence of well organized waste selection and collection | Yes | No |
| EEE devices disassembly time | 1–3 h depending on devices | Bad dissassembly activity, dangerous burning to gain copper for example |
| EEE repair time of devices | 1–3 h depending on devices | It depends on when spare parts are available |
| EEE repair costs (in €) | 20–150 and sometimes more, Vienna provincial government supports with a sum of 100 maximum the repair costs | 3–50 and sometimes more. No official financial support (informal activity in precarious conditions in Dla and Yde) |
| Availability of EEE spare parts | Yes (Ebay, Amazon, www.ifixit.com, etc.) | Yes, but it takes long time until reception of spare parts, with consequences on the repair time |
| EEE spare parts market | National and international | International |
| EEE spare parts warranty time (in year) | 2–3 (a national law) | Non existant/applicable |
| Labor cost per hour (in €) | 15 without overhead by DRZ and more by some SMEs | 0.3–0.6 (informal activity) |
Disclaimer/Publisher’s Note: The statements, opinions and data contained in all publications are solely those of the individual author(s) and contributor(s) and not of MDPI and/or the editor(s). MDPI and/or the editor(s) disclaim responsibility for any injury to people or property resulting from any ideas, methods, instructions or products referred to in the content. |
© 2023 by the authors. Licensee MDPI, Basel, Switzerland. This article is an open access article distributed under the terms and conditions of the Creative Commons Attribution (CC BY) license (https://creativecommons.org/licenses/by/4.0/).
Share and Cite
Moyen Massa, G.; Archodoulaki, V.-M. Electrical and Electronic Waste Management Problems in Africa: Deficits and Solution Approach. Environments 2023, 10, 44. https://doi.org/10.3390/environments10030044
Moyen Massa G, Archodoulaki V-M. Electrical and Electronic Waste Management Problems in Africa: Deficits and Solution Approach. Environments. 2023; 10(3):44. https://doi.org/10.3390/environments10030044
Chicago/Turabian StyleMoyen Massa, Gilbert, and Vasiliki-Maria Archodoulaki. 2023. "Electrical and Electronic Waste Management Problems in Africa: Deficits and Solution Approach" Environments 10, no. 3: 44. https://doi.org/10.3390/environments10030044