3.1. Soil Analysis
Rhizosphere soils pH, electrical conductivity (EC), organic matter (OM), and color are presented in
Table 1. Soil pH is an important property which controls chemical reactions of metals [
47]. Rhizosphere soils revealed a moderately alkaline pH (8.1–8.4), confirming the findings of Naveen et al. [
54] that, in general, areas impacted by heavy metals from dumps tend to have higher pH. Gajaje et al. [
55], in their study on soils around Morupule dumpsite (Botswana), found an average pH of 8.3 in rhizosphere soils and associated it with heavy metal contamination (Cu, Cr, Mn, and Pb). Skrbic et al. [
56], suggested that the PTEs highest retention in rhizosphere soils occurred with high pH, due to lower metals solubility in this pH range. Alkaline pH might affect plant growth because of the difficulty in absorbing essential plant nutrients, as well as PTEs, e.g., Fe, Mn, Cu, and Zn [
36].
EC showed high values, when compared to sandy soils guidelines (≤100 μS/cm; Lund, 2008), being ranked R4 >> R2 > R1 > R3. Bhardwaj et al. [
39] suggested that rhizosphere soils in areas near waste dumps, usually exhibit higher EC values, being associated with contamination by metal ion enriched leachates [
5], and deposition of contaminated ashes resulting from waste incineration [
57]. Bernardo et al. [
24], reported high EC values and high Cr, Cu, Mn, Ni, Pb, Zn, and Zr concentrations in the Hulene-B dump surrounding soils, associating it with leachates. Another factor that may be associated with high EC is the presence of shallow water [
58]. In sandy soils, the presence of water during rainfall episodes and periodic enrichment by surface leachates promote EC [
37]. Studies related EC to crop yields and found that high EC values can reduce yields [
59]. However, for horticultural crops, EC (salinity) results were considered within the recommended limit (<1000 μS/cm) [
60].
Soil OM content was ranked R1 > R4 > R2 > R3, coherent with other studies, with generally low OM [
61]. Some studies have shown that in contaminated areas, high OM content in rhizosphere can lead to the uptake of heavy metals, which bind easily to OM [
34] and consequently decrease their toxicity levels from the rhizosphere to crops [
62]. Rhizosphere soils color was classified as very dark in all samples, with sample R1 the darkest, associated with its OM content, which can be incorporated in interstitial spaces of sandy soils [
63]. Bernardo et al. [
64] linked the Hulene-B surrounding soils color variation to leachates circulating freely on the soil surface and waste incineration ashes, which can be associated with rhizosphere soils PTEs contamination [
65], which can be transferred to edible plants [
66].
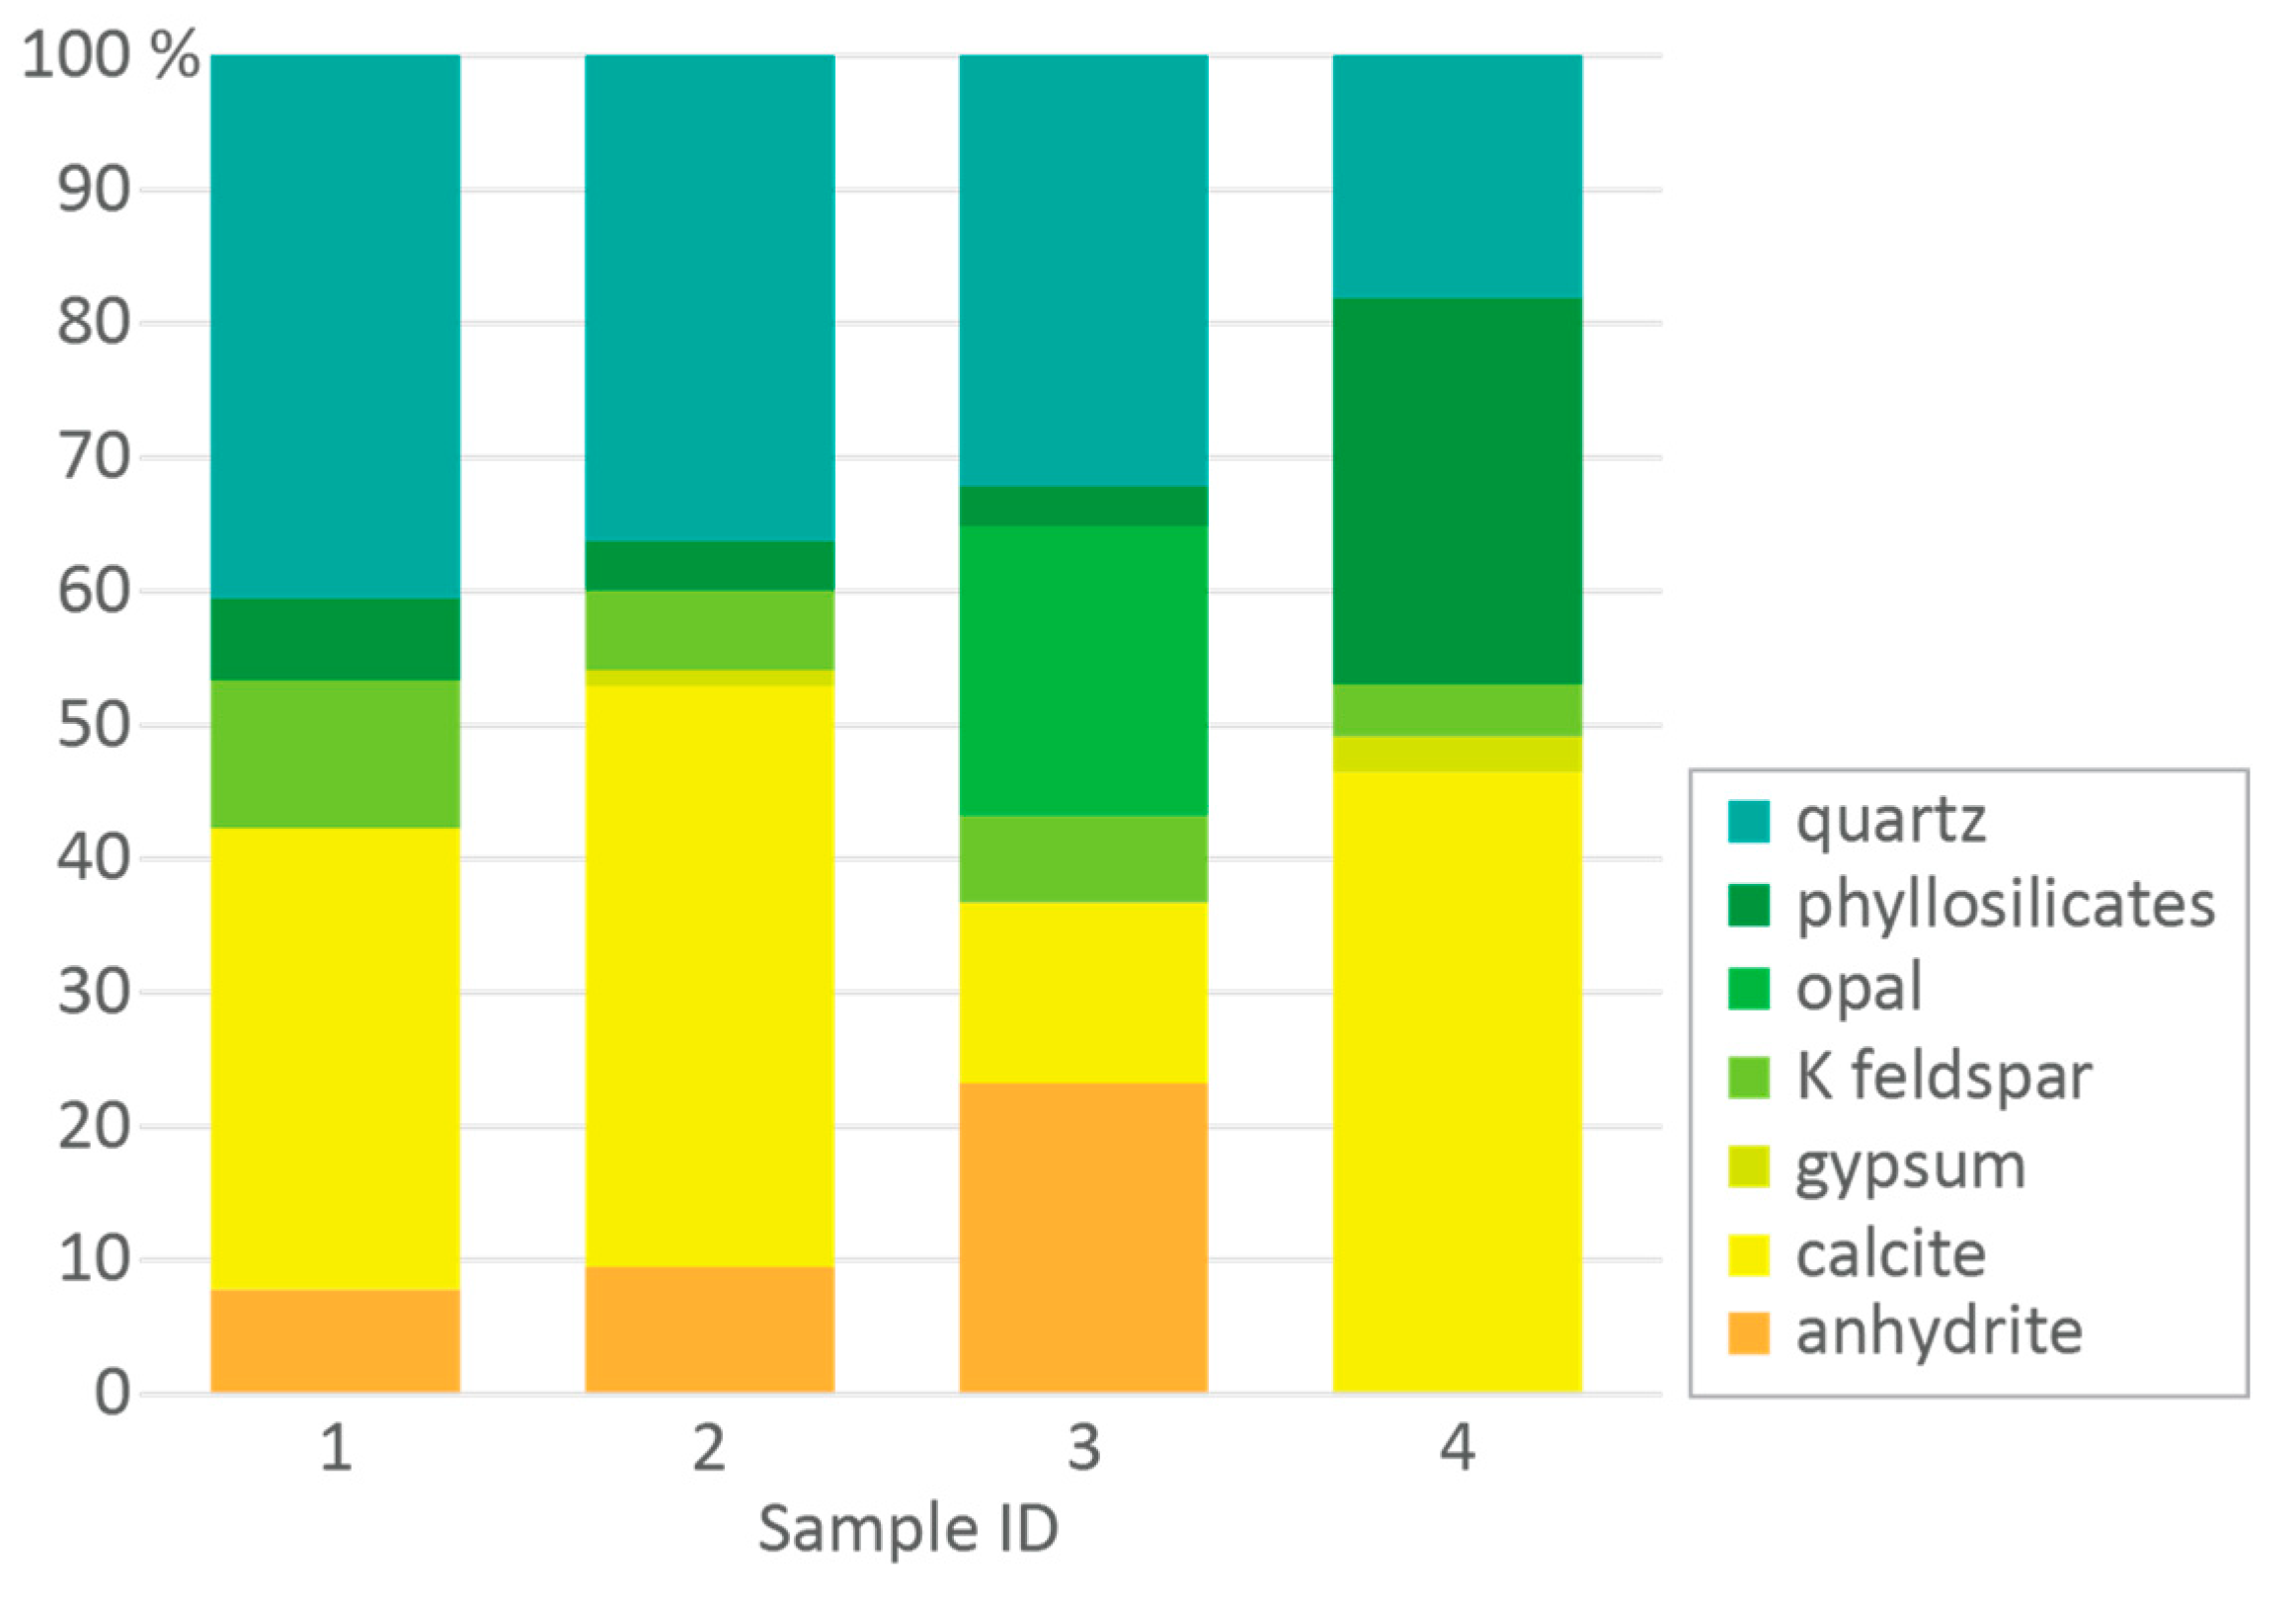
Mineral phases are identified on the studied rhizosphere soils, where quartz (SiO
2), calcite (CaCO
3), phyllosilicates (micas and kaolinite), anhydrite (CaSO
4), K feldspar (KAlSi
3O
8), opal (SiO
2·nH
2O), and gypsum (CaSO
4·2H
2O) can be found (
Figure 3), thus suggesting differentiated processes between intra-dune and other soils around the Hulene-B dump. Quartz content (18.1 to 40.5%) was similar to intra-dune deposits [
32], which also revealed high calcite content. Samples R2 and R4 showed a higher calcite content, possibly due to the influence of soils remobilization in depth during the construction of the leachate transport channels.
Phyllosilicates content (3.0 to 28.8%) may be linked to the predominant aeolian and superficial deposition processes of the intra-dune area. Previous studies suggested that phyllosilicates content present a higher PTEs adsorption capacity, e.g., [
67]. Quartz, under conditions of exceptional morphology fracture, can adsorb PTEs, such as Pb, Cu, and Cr [
68]. Calcite has been reported to have the ability to immobilize heavy metals such as Pb, Fe, and Cd in contaminated soils near areas such as dumpsites [
69].
Soils PTEs (
Table 2) revealed significant differences (one sample
t-test;
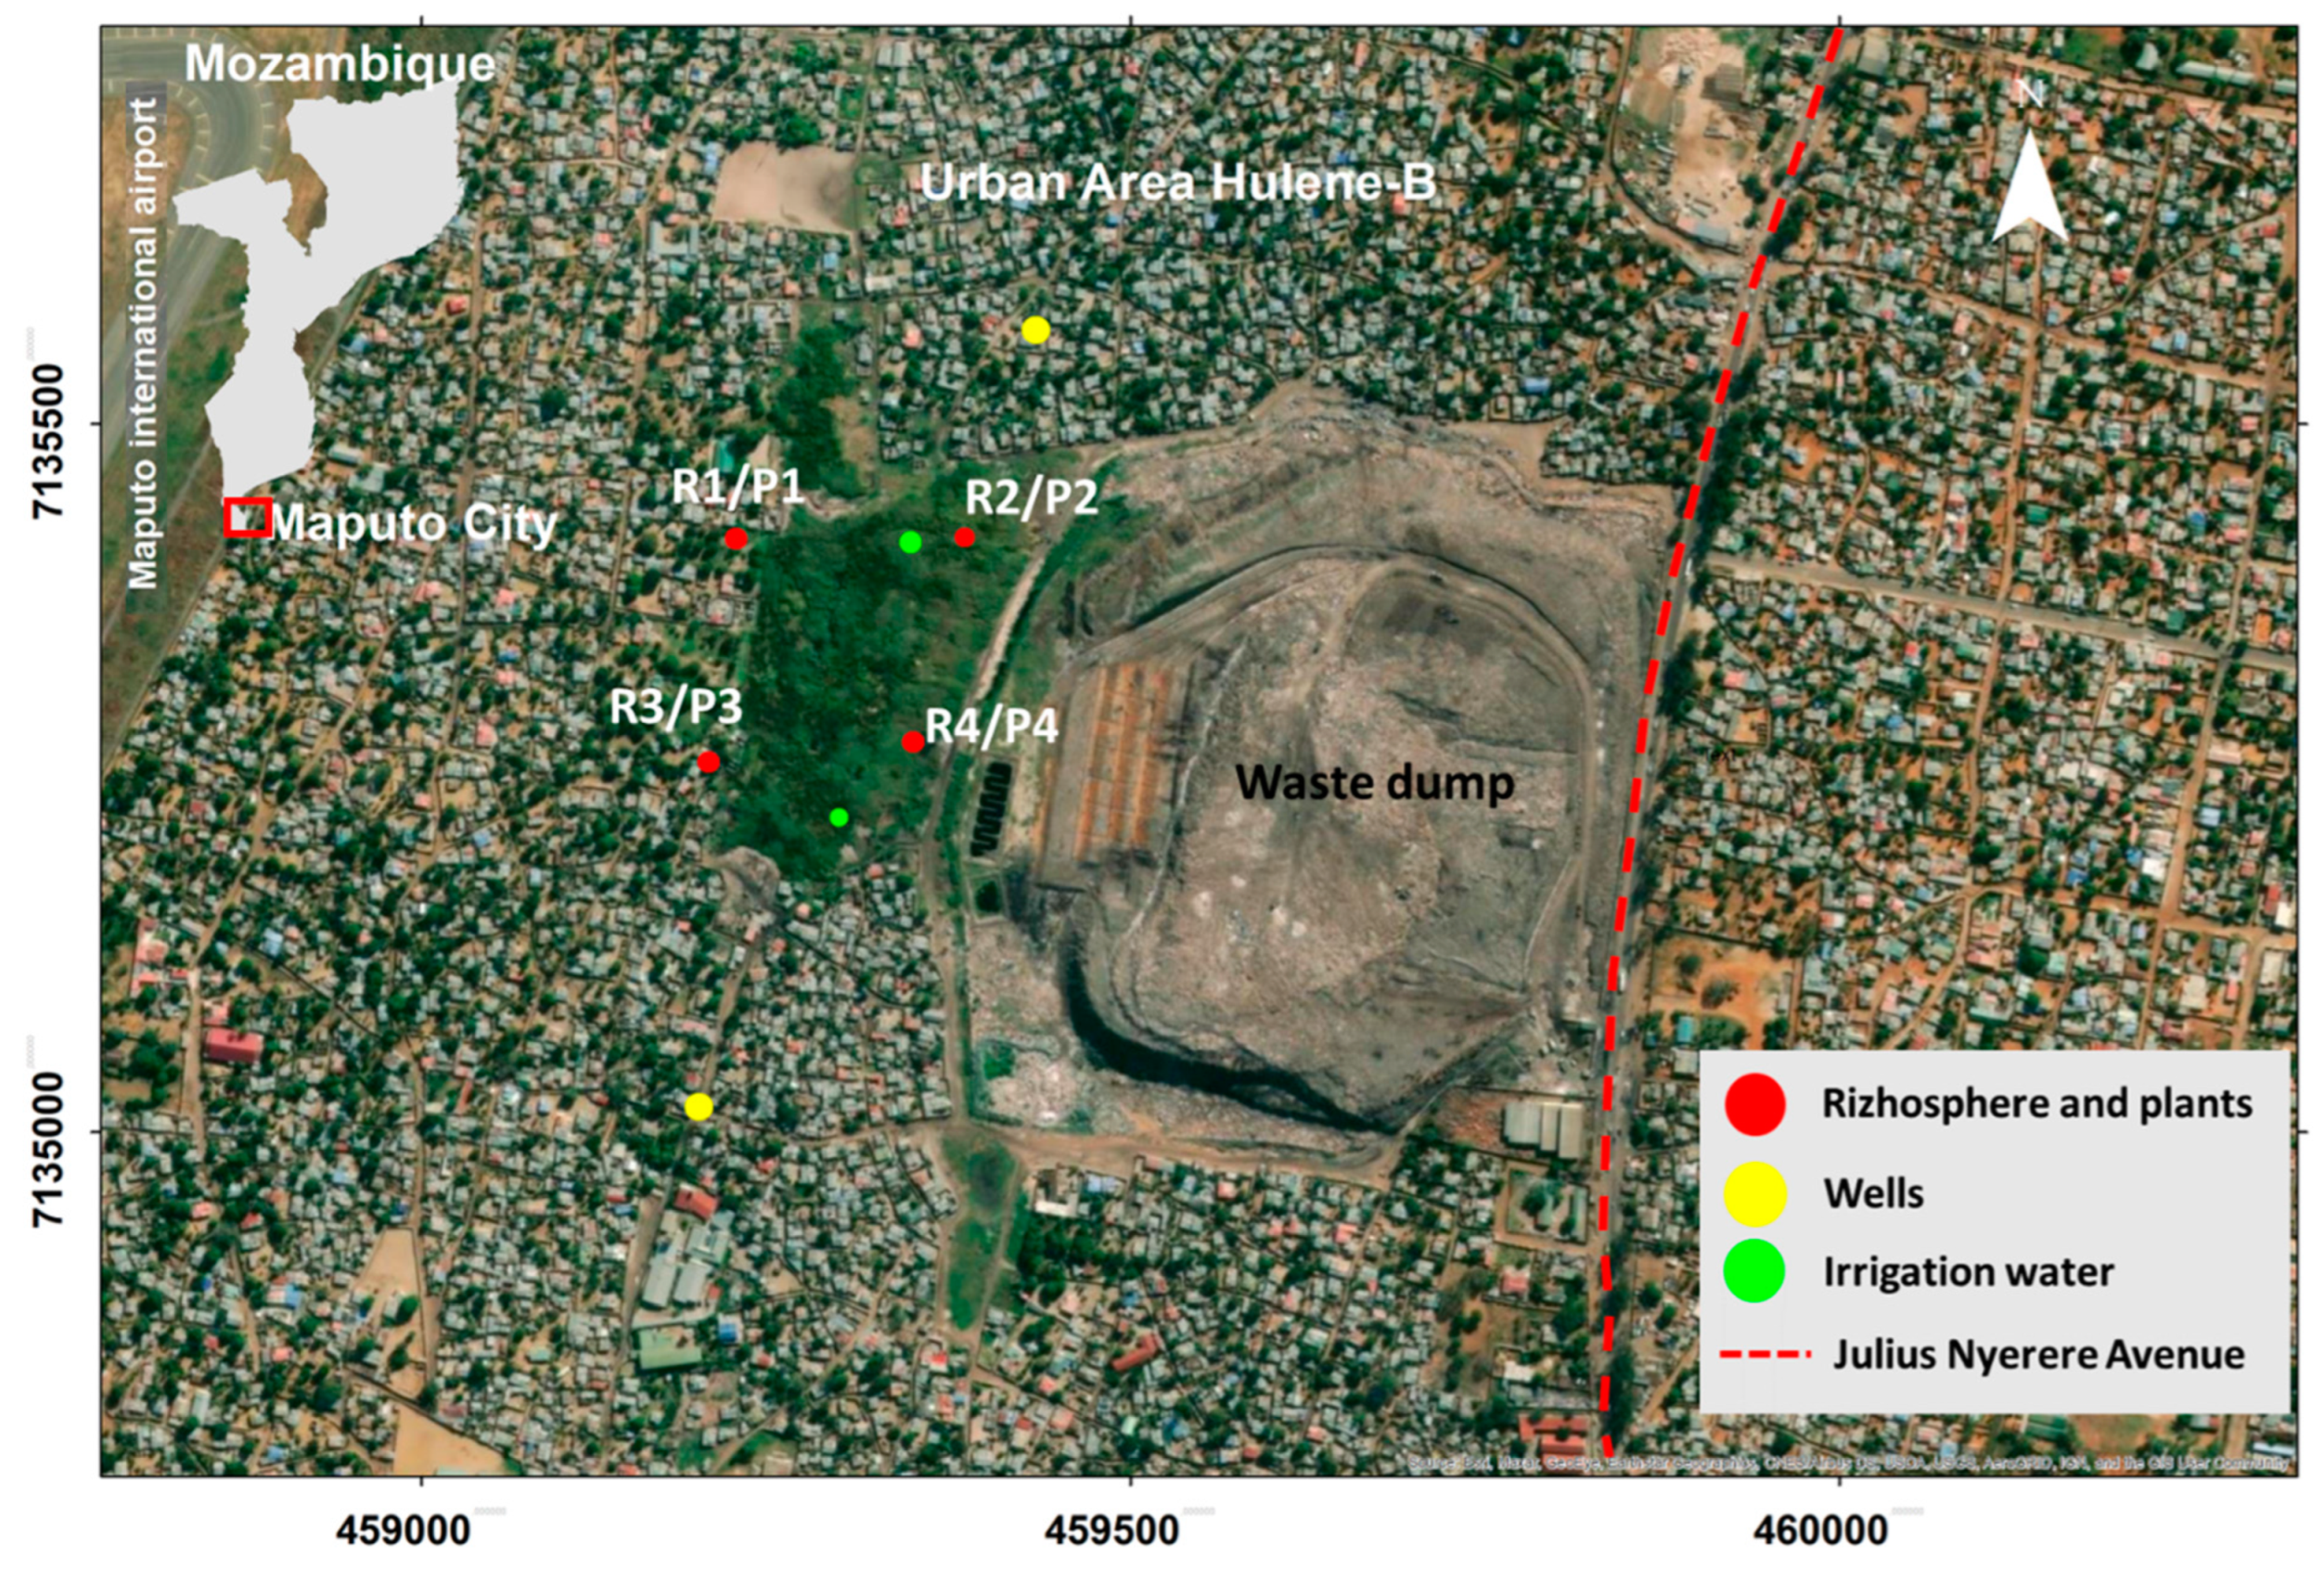
p < 0.05) between samples Cr, Fe, Mn, Ti, and Zr content. The cluster analysis formed two major groups, one with sample R1 and another with samples R2 and R4, revealing an association to mean background values, and these three variables were grouped with sample R3. Sample R1 presented higher PTEs concentrations than other samples. The results suggested an external Cu, Ni, Pb, Ti, Zn, and Zr contamination contribution, especially in sample R1. This sample was collected on northwest section of the dump, relatively distant, suggesting contamination by transported waste incineration ash, with this location being in the direction of displacement and deposition of windborne suspended materials.
The rhizosphere soil pollution index (PI) of sample R1 revealed low pollution considering Cr, moderate pollution by Zr, Fe, and Ti, and high to very high pollution by Cu, Pb, Zn, and Ni (
Table 3). Sample R2 Cu, Pb, and Zn content contributed to a very high PI; Ni, Ti, and Zr contributed to a moderate PI; and Ti contributed to a high PI. Similar results were found for samples R3 and R4. The higher contributions of Cu, Pb, Zn and Ni PI values in sample R1 may be associated with location, i.e., near the waste incineration and Julius Nyerere Avenue on the W, with sources of ash and contaminated dust. High concentrations of Cu, Pb, Zn, and Ni were reported in road dust samples next to the Hulene-B dump, being associated with waste incineration, intense traffic, and pavement degradation [
70]. Samples R2 and R4 showed higher Cu, Pb, Zn, Ni, Ti, and Zr content, possibly linked to the superficial circulation of leachates, which occurs cyclically. Bernardo et al. [
70] reported high EC values and associated a possible contamination by leachate flows. Sample R3 presented a high PI with respect Cu, associated with surface water enriched by leachates circulation.
Pollution load index (PLI) was ranked Cu >> Pb >> Zn > Zr > Ni > Ti > Fe > Mn > Cr, suggesting environmental deterioration in the surrounding area of the dumpsite. Sample R1 was the one that contributed most PTEs and had a high rate of contamination. Sample R1 was collected in the NW border of the dump, strongly influenced by waste incineration, with ashes regularly transported and deposited in this location. On the dump surroundings, the incineration of urban wastes, such as electronics, hospital waste, tires, and lamps, has been pointed out as a source of Cr, Cu, Mn, Ni, Pb, and Zn [
57]. Sample R4 was the one that most contributed to this index, with high Cu and Pb content, and it was collected at the SW border of the dump, where surface dispersion of leachate predominates. Leachates have been identified as a source of PTEs in the surroundings of dumps [
71] and are associated with higher OM content, which may influence the fixation of contaminants [
72]. Sample R2, located north of the dump and close to the dump, with its relatively low contribution, may be associated with possible leaching of contaminants in this strip. However, the high pollution index by Cu, Pb, and Zn may be associated with the circulation of leachates that cyclically affect this area. However, sample R3 showed a low contribution, which may be related to its relatively distant location from the Hulene-B dump. High contributions of Cu may be associated with new deposits in the southwest, where open-air burning and ash deposition are recorded in the surrounding soils.
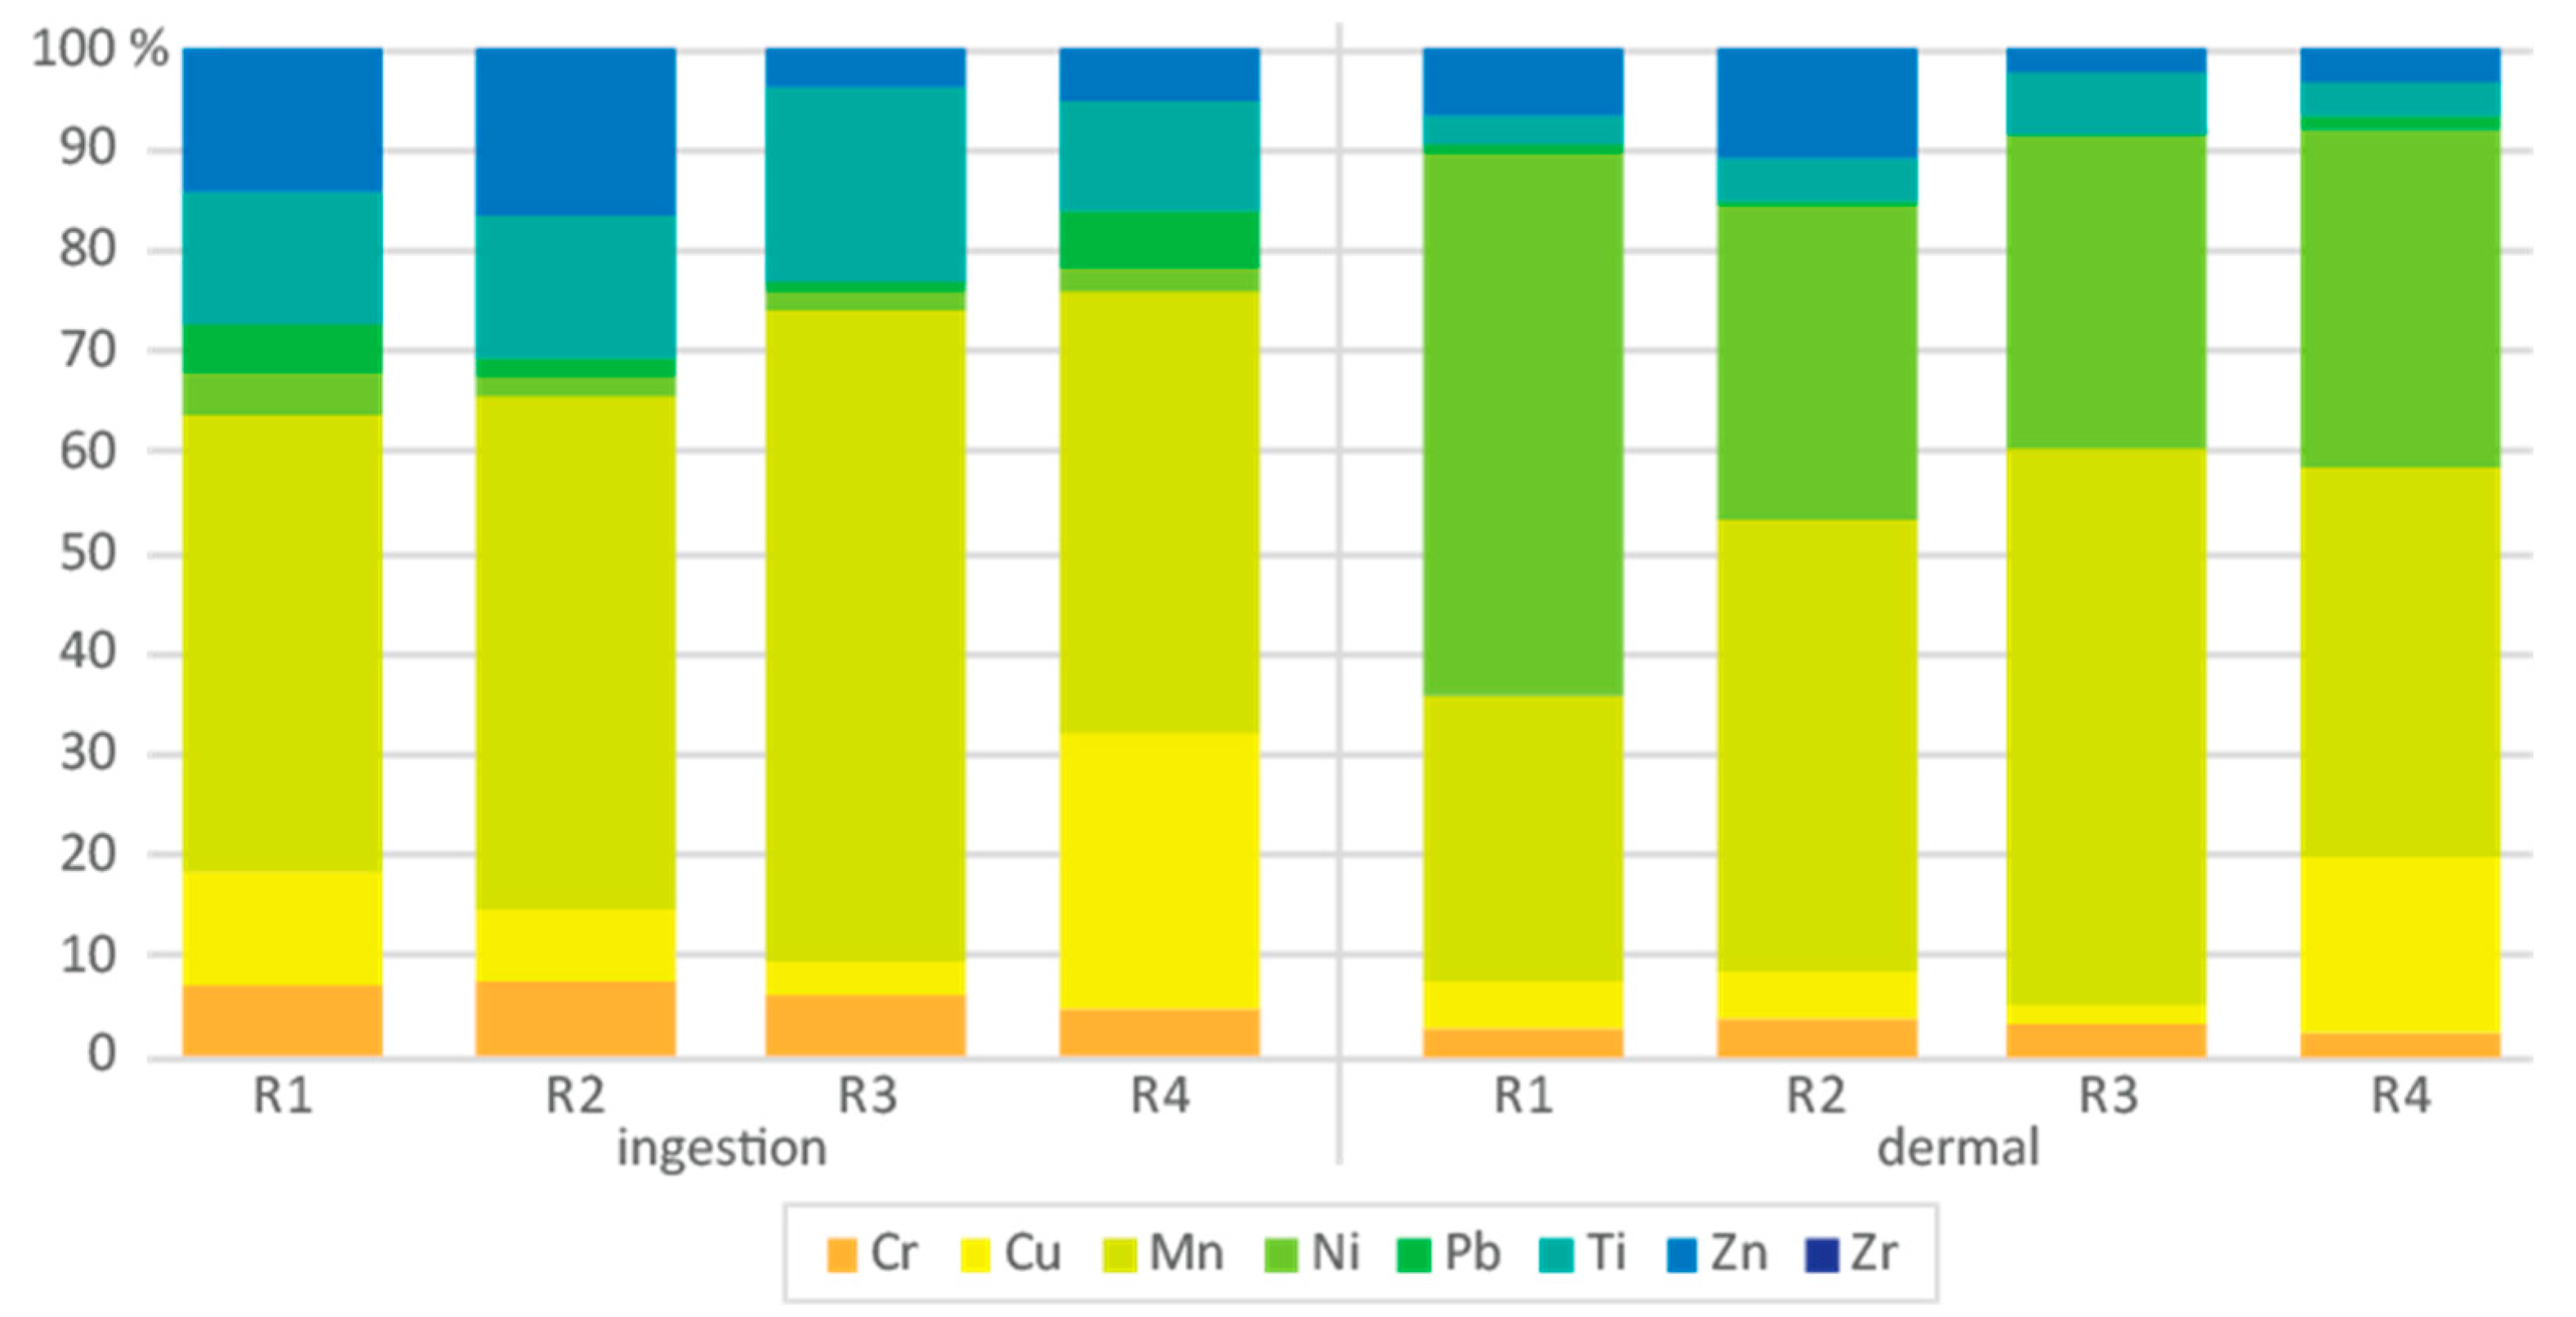
Rhizosphere soils hazard quotient (HQ) by ingestion and dermal contact for children was considered, due to higher risk by playing on the ground and hand-to-mouth behaviors in young age (
Figure 4). All PTEs presented HQ > 1 by ingestion, except for Zr, with Mn being the element posing a higher hazard followed by Cu, Ti, and Zn. Dermal contact HQ was >1, except by Pb in samples R1 and R3, and Zr in all samples, with Ni and Mn being the PTEs posing a higher hazard. Prolonged exposure to Mn can induce pneumonia, hallucinations, pulmonary embolism, and bronchitis [
71], while Ni poisoning affects lung function, breathing difficulties, coughing, skin or eye irritation, and chronic exposure to Cu can induce anemia and central nervous system and cardiovascular system disorders [
73].
3.2. Water Analysis
Water pH was higher in stream waters, being higher than reference values (
Table 4). Water sample WS presented a pH slightly below recommended for consumption [
38]. pH is recognized to influence Hg, Pb, and Zn bioavailability and toxicity in drinking water [
74]. Yesil et al. [
75] reported higher bioavailability and toxicity of Hg and Pb in slightly acidic-to-neutral waters, such as sample WS, suggesting a greater health risk. Irrigation water IWN presented a higher Pb concentration than the reference value [
52], which may be associated with ash deposition, as Pb contamination is caused by burning waste such as electronic equipment, batteries, paint cans, varnishes, and organic solvents, which is common [
24]. In addition, free leachate circulation, which regularly reaches this area, is reported as a Pb dispersion source, in environments around waste dumps [
6]. IWS showed high Hg content, which may also be associated with waste incineration [
76].
The water pollution index revealed severe Hg P
i in the two water samples collected from wells (
Table 5), while Pb P
i showed a slight pollution in sample WS and heavy P
i in IWN. Zinc P
i was classified as medium polluted in both wells and slightly polluted in IWS, taking in consideration Zn toxicity despite its higher concentration when compared to Pb and Hg content. Mercury can incorporate into groundwaters and surface waters through leachates produced at waste dumps by anaerobic decomposition of wastes or by particulate material resulting from the burning of contaminated wastes [
76]. The practice of waste burning at the Hulene-B dump may be influencing the dispersion of ash enriched by heavy metals that were successively deposited in the vicinity of the waste dump and contributed to the contamination of groundwaters and stream waters. Lead enrichment in areas surrounding landfills has been associated with the deposition and burning of electronic equipment and rechargeable batteries wastes [
78]. In the surroundings of the Hulene-B dumpsite, other potential Pb sources may be linked to, e.g., traffic-related materials (Julius Nyerere Avenue) and an international airport (
Figure 1). Zinc enrichment has been associated with batteries, alloys, paint cans, cosmetics, pharmaceuticals, textiles, and electrical and electronic equipment waste, which is continuously deposited and burnt in the Hulene-B dump [
79].
3.4. Data Integration
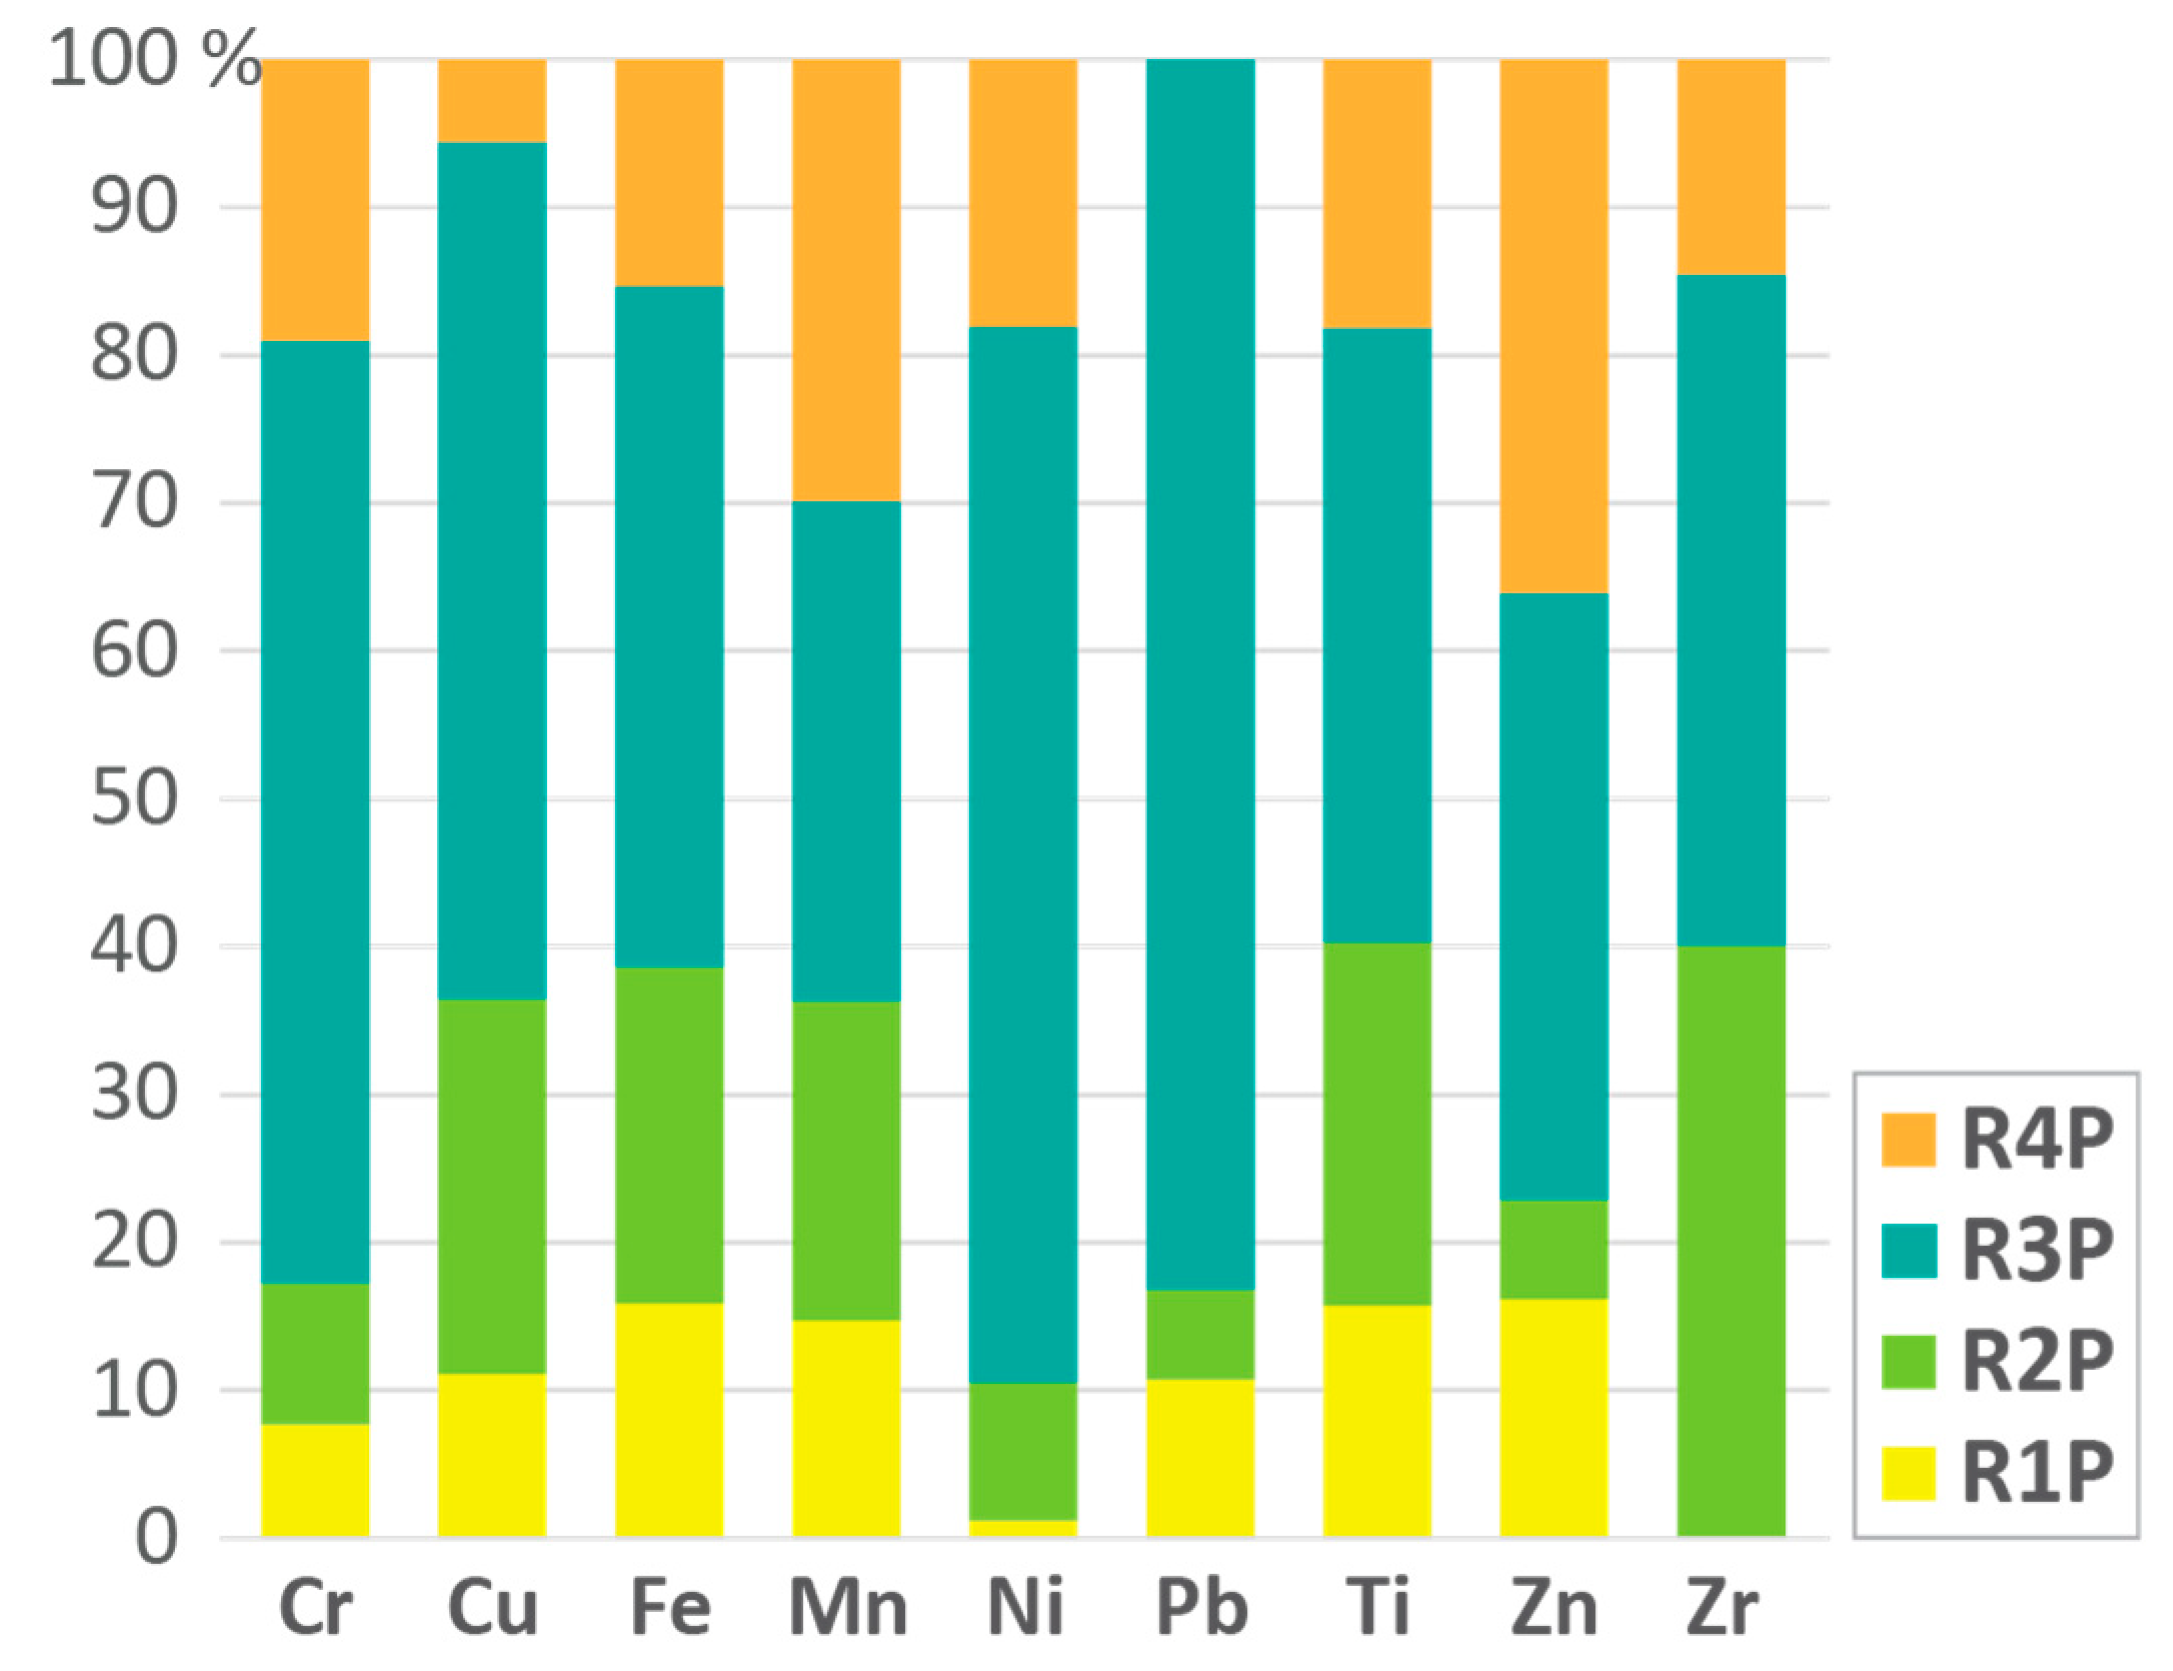
The transfer factor (TF) from soil to plants is an important factor for consumption toxicity, with soil pH and OM being relevant in this process. Studied samples TF was >1 (
Figure 5), except for Pb in R4P and Zr in R1P. High TF values suggested a higher capacity of the plants to absorb contaminants [
80,
85]. Transfer factor was ranked RP3 > RP4 > RP2 > RP1, with sample RP3 presenting higher TF for all PTEs, with Pb being the most representative element. Lead can be absorbed from plants leaves by ash or road dust deposition, with this plant being collected in a SE wind direction over the Hulene-B landfill. Wang et al. [
4] suggested that plant leaves grown in the surrounding of dumps are constantly being enriched by PTEs from ashes resulting from waste incineration. Sample RP4 Zn and Mn TF showed higher percentage rates.
Daily elemental intake (DIM) and hazard risk index (HRI) are presented in
Table 7. Sample R1P (
Amaranthus spinosus) DIM was ranked Fe >> Zn > Ti, with other PTEs being negligible. The HRI was high for all elements, except for Ni and Zr, being ranked Cr > Cu > Pb > Zn > Mn > Ti > Fe. Sample RP2 (
Ipomoea batatas) DIM was >1 in Fe, Zr and Ti, while HRI > 1 was ranked Cu > Cr > Mn > Pb. Sample RP3 (
Cucurbita pepo) DIM > 1 was ranked Fe > Cr > Ti, and HRI was ranked Cr > Cu > Pb > Ti > Mn > Ni > Zn. Sample RP4 (
Brassica oleracea L) DIM > 1 was ranked Fe > Zn > Ti, while HRI was ranked Cr > Cu > Pb > Zn > Mn > Ti > Fe. The consumption of plants contaminated by PTEs can induce various diseases and even cancer [
86]. Chromium toxicity in humans has been linked to damaged blood cells, livers, nervous systems, and kidneys [
73]. Chronic Cu consumption may result in gastrointestinal irritation, diarrhea, and liver failure [
87], while Fe toxicity can cause vomiting, diarrhea, and damage to the intestine and other organs [
88], and Mn is linked to memory problems, hallucinations, and Parkinson’s disease [
89]. Nickel chronic ingestion has been associated with gastrointestinal and neurological effects including lung cancer. Ingestion of Pb can disturb almost all organs and the nervous system, in addition to causing kidney damage, brain damage, miscarriage, and death [
89], and Ti can cause damage to DNA, brain [
90], as well as liver and kidneys, and it can cause cancer [
91], while excessive and prolonged Zn intake can lead to anemia and affect the immune system [
73,
90]. Zirconium, which is classified as having low toxicity [
91], despite the presence and retention in relatively high amounts in biological systems, has not yet been associated with any specific metabolic function [
92].
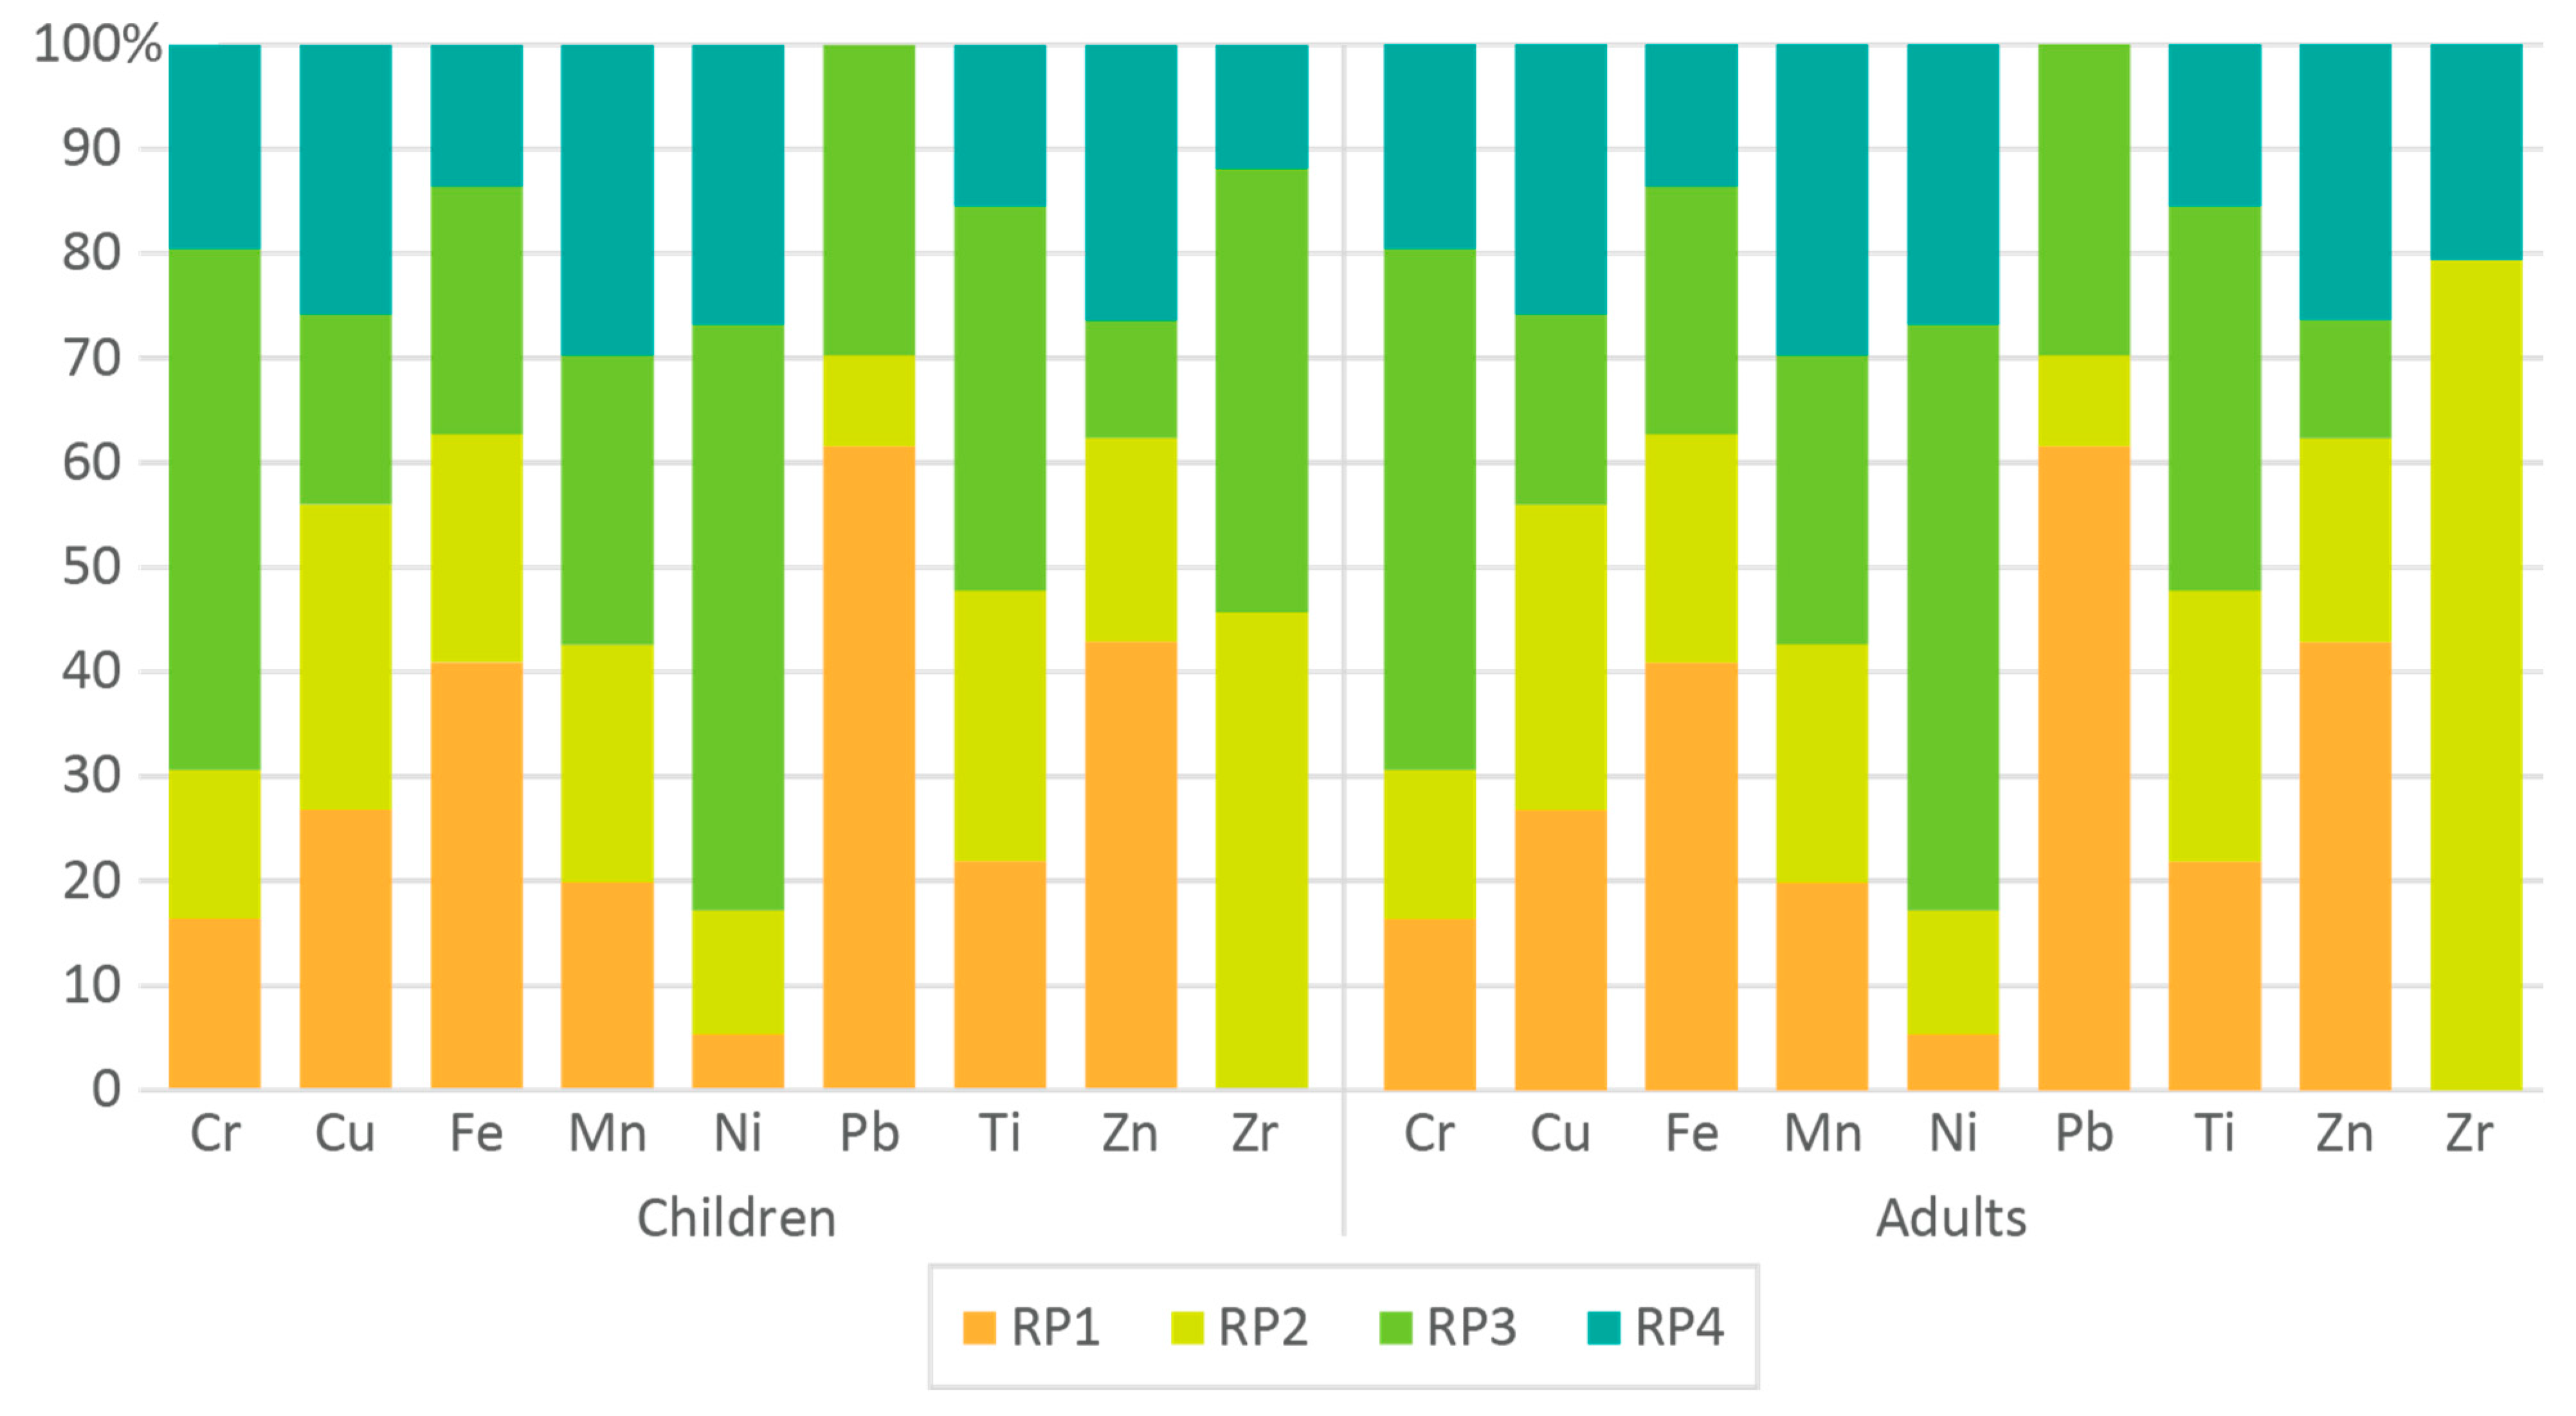
Targeted hazard quotient (THQ) and hazard index (HI
plant) are presented in
Figure 6, with THQ being ranked Cr > Cu > Pb > Zn > Mn > Ni > Fe > Zr. The contribution of sample RP1 (
Amaranthus spinosus) to induce adverse health effects in children and adults was ranked Cr > Cu > Pb> Zn > Mn > Ti > Fe, with nickel <1 and not posing potential risk for adverse health effects. Sample RP2 (
Ipomoea batatas) Fe, Ni, and Zr content do not pose a potential health risk, with the main contributions being posed by Cu > Cr > Zn > Ti > Mn > Pb. Sample RP3 (
Brassica oleracea L) the main contributors to potential health outcomes were ranked Cr > Cu > Pb > Ti > Mn > Ni > Zn, with Fe and Zr content representing <1. Meanwhile, sample RP4 (
Cucurbita pepo) PTEs were ranked Cr > Cu > Zn > Mn > Ti > Ni, with Fe and Zr < 1. In all samples, the highest THQ risk index was posed to children. Similar findings were reported as a result of their lower body mass, suggesting a higher likelihood of developing cancer throughout life [
41].
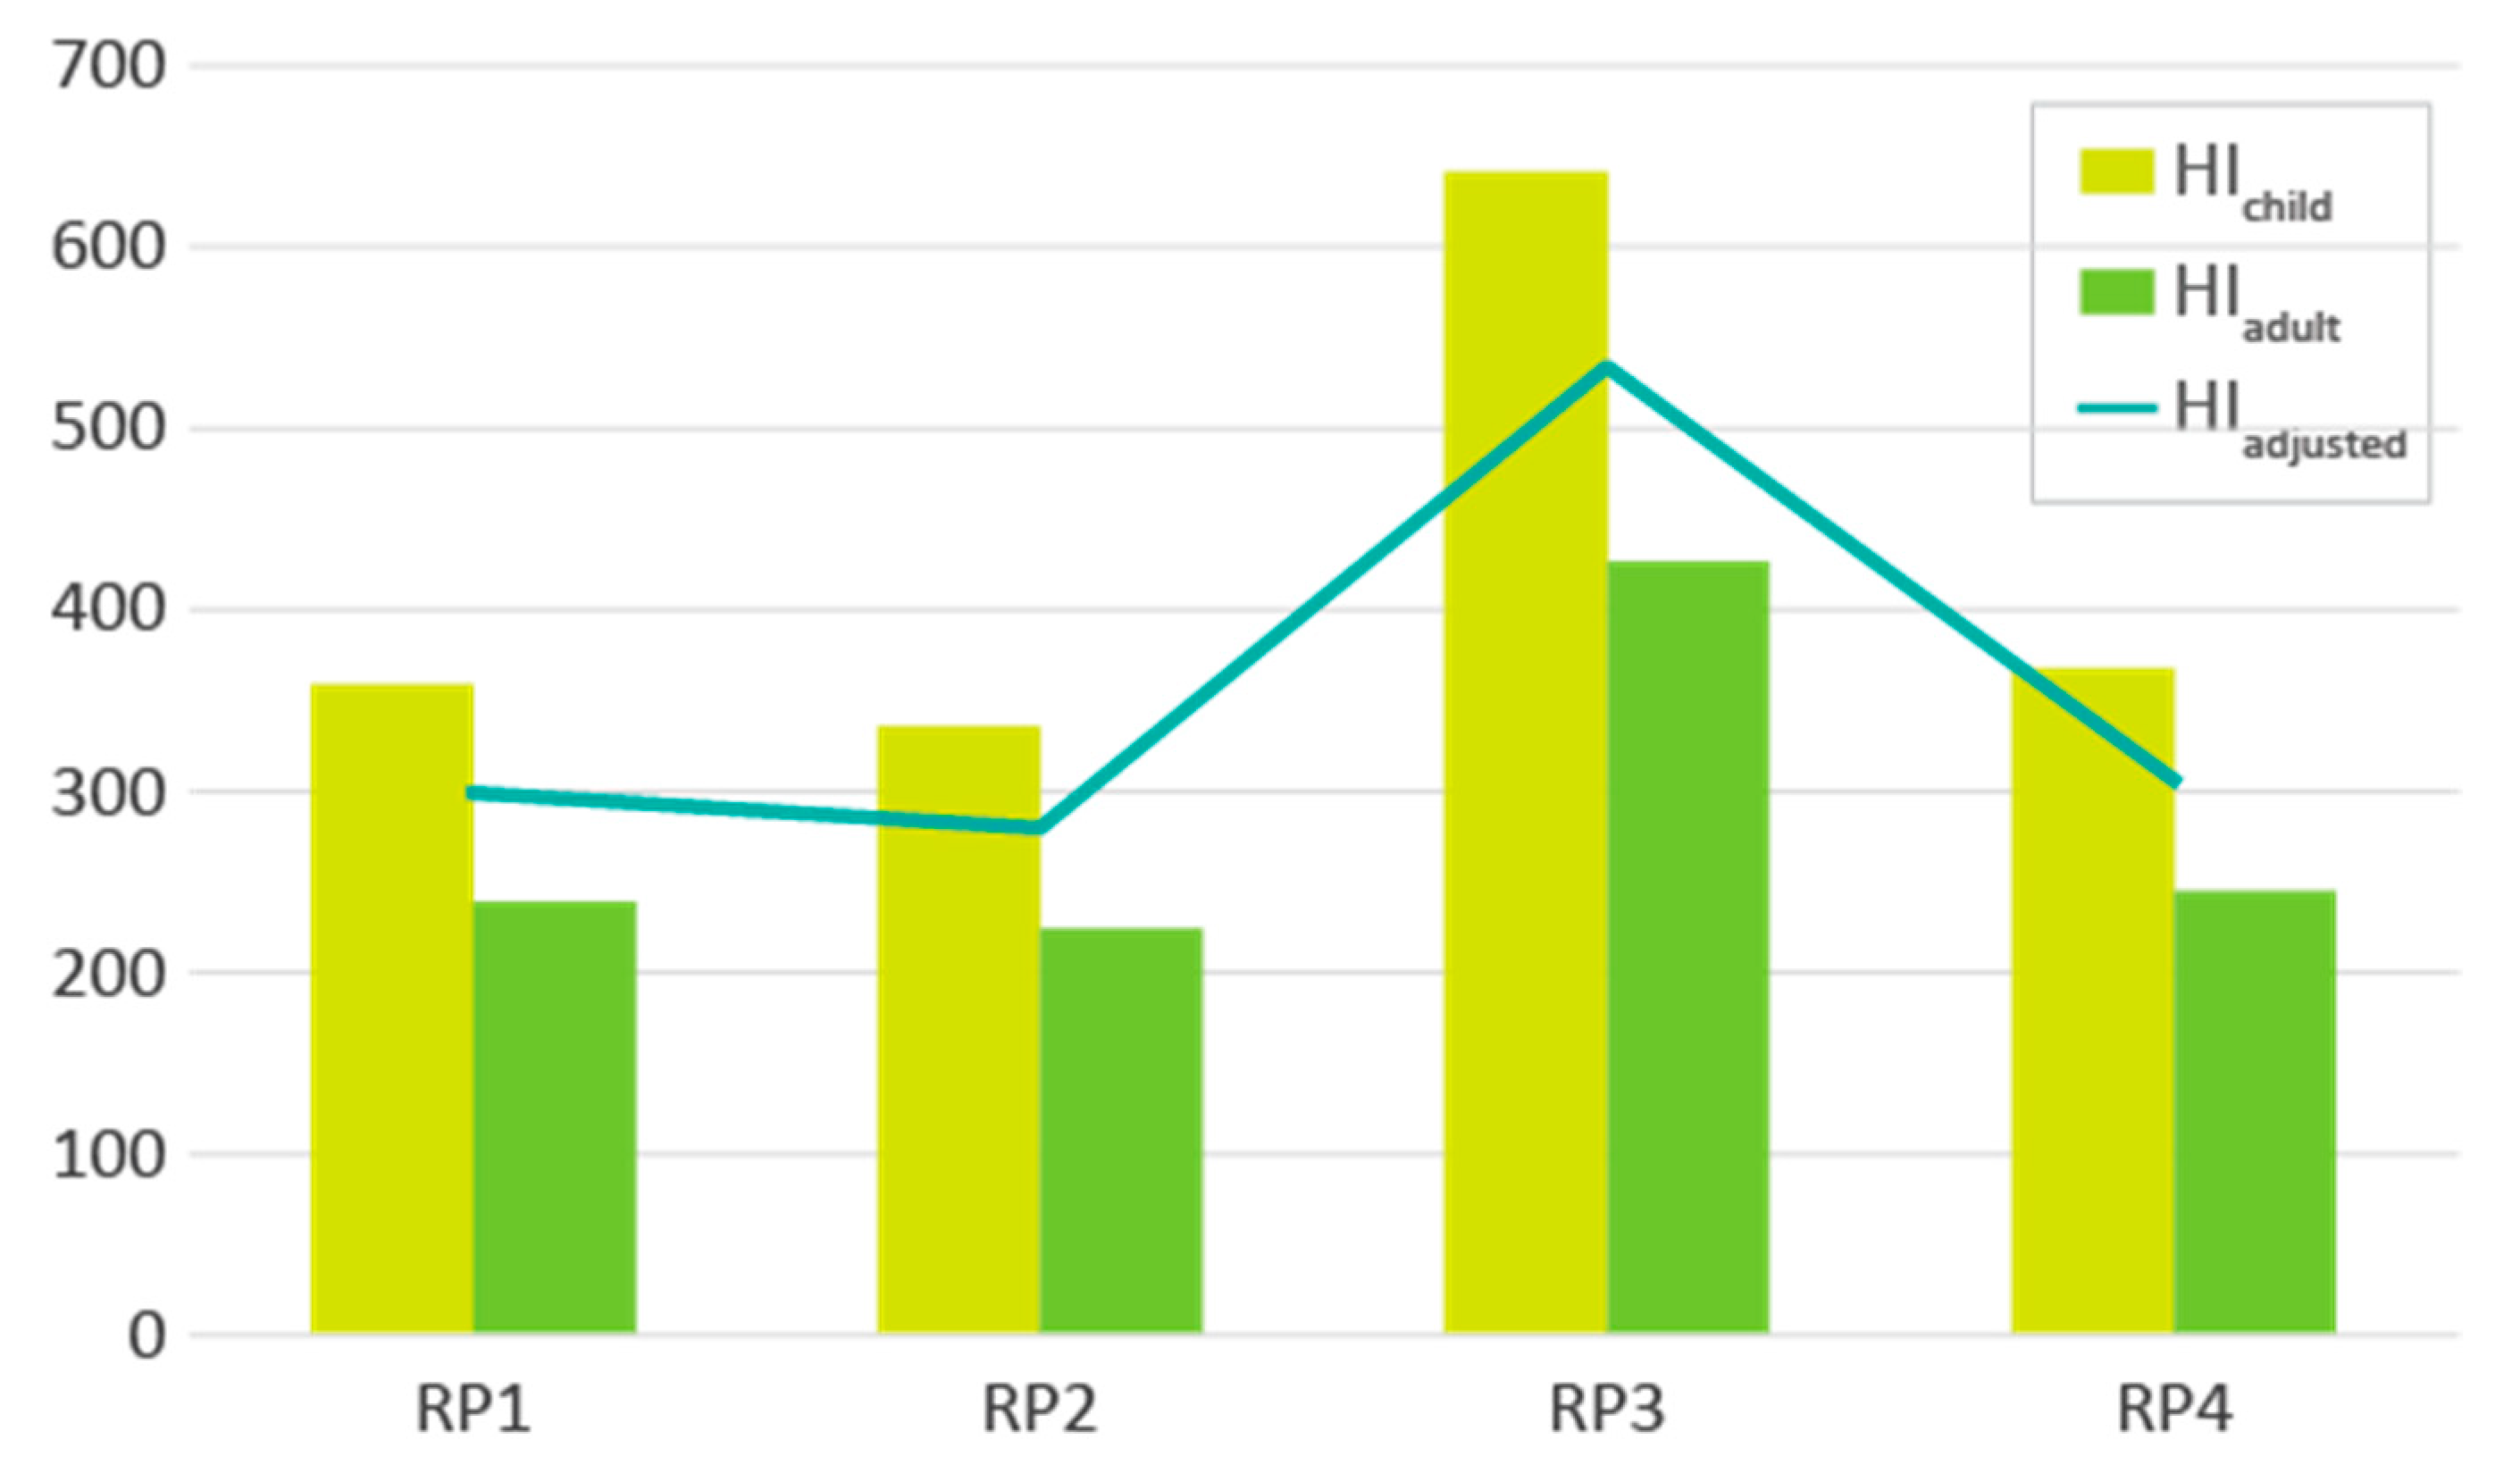
HI
plant was similar to THQ, being >1 in all samples and higher for children (
Figure 7), being ranked RP3 (6.41 × 10
2 to 4.27 × 10
2) > RP4 (3.68 × 10
2 to 2.45 × 10
2) > RP1 (3.59 × 10
2 to 2.39 × 10
2) > RP2 (3.36 × 10
2–2.24 × 10
2). Long-term consumption of the studied plants may induce cancer (e.g., kidney, bladder, and respiratory tract), nervous system disorders, memory problems, hallucinations, cardiovascular diseases, and diabetes. In children, this has also been associated with cognitive development problems and aggressive behavior [
93,
94].
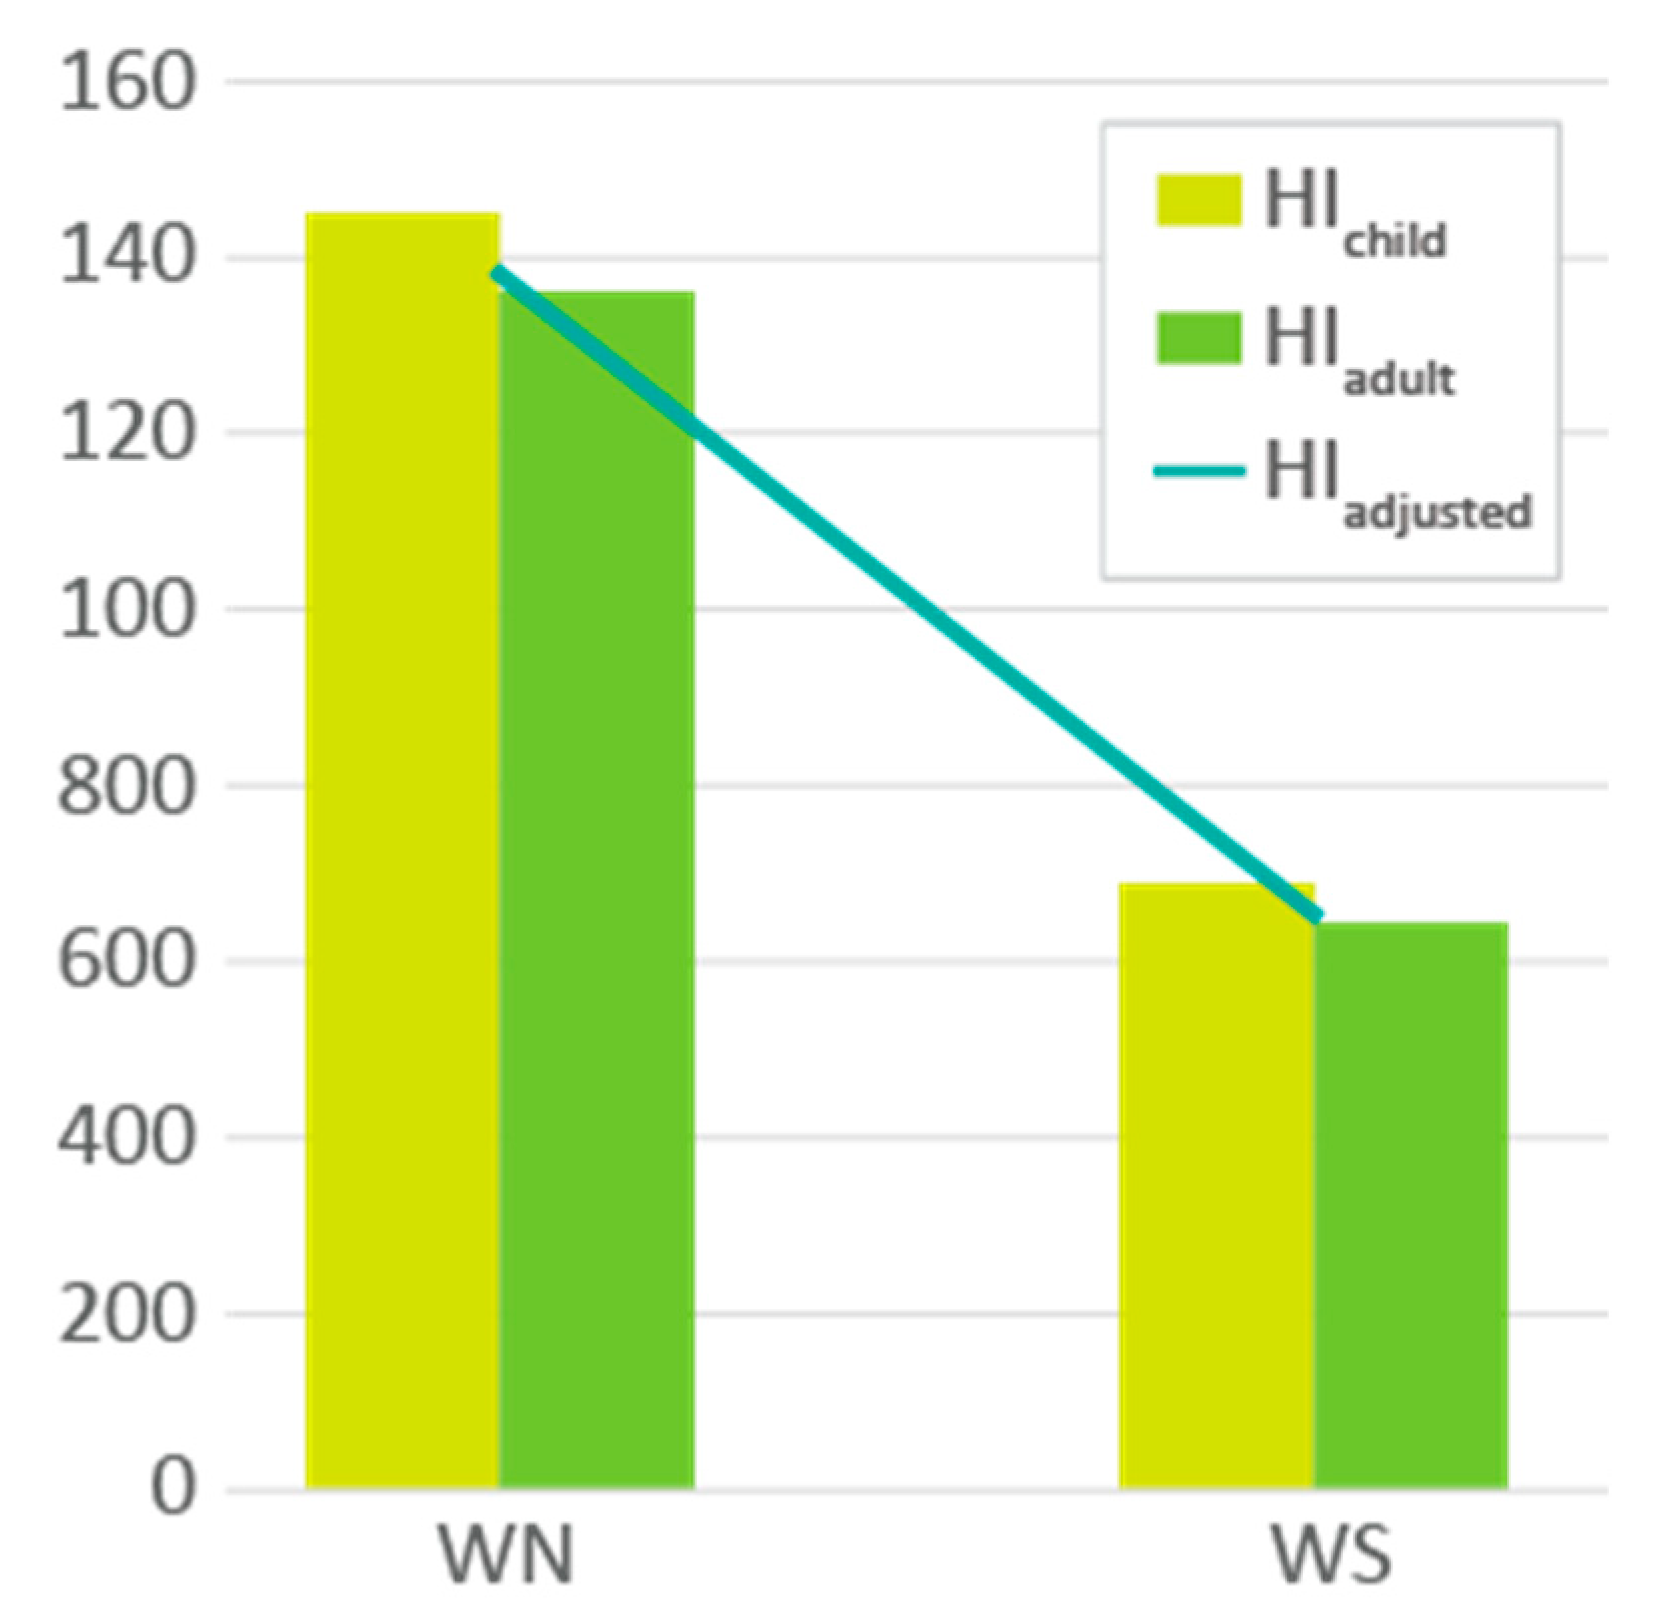
Well water samples systemic toxicity (non-carcinogenic hazard) presented values above 1.00 × 10
0 (
Figure 8). The results are linked to Hg concentration, with Pb and Zn being considerably negligible. Mercury is a toxic element, being ranked the third most toxic among all PTEs [
7]. It was estimated that chronic Hg consumption of about 0.00023 mg/L per day can induce adverse renal, neurological, and respiratory effects [
95,
96], and it can irreversibly damage kidneys, liver, and central nervous system [
97]. Well waters do not present a carcinogenic risk for humans by direct consumption, with Pb showing the highest values of 1.09 × 10
−7 and 6.55 × 10
−7 for WN and WS, respectively, both being below the threshold of 1.00 × 10
−6. The implication of lead on human health depends on intensity, duration, and level of exposure, which can result in a range of toxic effects such as hematological, neurological, psychological, renal, and genetic mutation and reproduction are examples of the cumulative effect on the body [
98]. As expected, in well waters, children had a higher health risk than adults, due to their lower body mass [
41]. Lead toxicity in children can induce neurological complications, including difficulties in learning, concentration, and aggressive behavior [
89]. Water ingestion is considered one of the main forms of Pb poisoning in children, accounting for about 7% [
99].


