Article

Long-Term Changes of Positive Anomalies of Erythema-Effective UV Irradiance Associated with Low Ozone Events in Germany 1983–2019

by
Gudrun Laschewski
* and
Andreas Matzarakis
Deutscher Wetterdienst, Research Centre Human Biometeorology, 79104 Freiburg, Germany
*
Author to whom correspondence should be addressed.
Environments 2023, 10(2), 31; https://doi.org/10.3390/environments10020031
Submission received: 23 January 2023 / Revised: 4 February 2023 / Accepted: 8 February 2023 / Published: 15 February 2023
(This article belongs to the Special Issue Environmental Risk and Climate Change II)

Abstract

:
In order to assess whether there is an increasing need for adaptation to the associated human health risks, the long-term occurrence (1983–2019) of low-ozone events (LOEs) with associated near-surface anomalies of erythema-effective UV irradiance was examined using an impact-related approach. Based on satellite data, means of four locations in Germany (Sylt, Berlin, Frankfurt, Munich) were compared for three subperiods (T1: 1983–1989, T2: 1990–1997, T3: 1998–2019). The period of peak global ozone depletion in the 1990s (T2) is characterized by a larger frequency of LOEs than the preceding (T1) and the subsequent (T3) subperiods. During the most recent subperiod (T3), the mean number of LOEs is 1.1 ± 0.5 events/year, with a variability of 0 to 4.2 ± 0.8 events/year, and shows a statistically significant decrease in the annual number of −4.8%/year. The annual totals of the LOE-associated anomalies of the erythema-effective UV radiation dose show no trend during T3. With regard to LOE-associated UV index anomalies, spring is the season most affected by LOEs, with more than half of all cumulative UV peak loads, while the absolute maximum values of the LOE-associated UV index anomaly of about 1.8 UV index occur near the summer solstice. Within the most recent subperiod (T3), summer contributes an increasing share of the peak loads. Overall, the study confirms that LOEs pose health risks due to intermittent, pronounced positive anomalies in erythema-effective UV irradiance and therefore require special attention and adaptation measures. Long-term changes can be identified, but to date there has been no evidence of an increasing health risk in Germany.

1. Introduction

Solar ultraviolet radiation (UVR) is known to be biologically very effective. In terms of human health, it can be associated with both positive and negative effects [1,2]. Short-term effects range from the initiation of vitamin D formation in the human body [3] as a positive example, to sunburn of the human skin or cataracts in the eyes [4,5,6] as negative examples. The most significant negative long-term effects are the development of melanoma or nonmelanoma skin cancer [7,8,9,10,11]. Since the long-term effects can have dramatic consequences, dealing with UVR exposure requires special attention. The risks from UVR are usually not unavoidable but can be significantly reduced with appropriate behavior and suitable framework conditions (e.g., for working or staying outdoors) [12,13,14]. In connection with the increasingly frequent discussions in Germany and other countries about the consequences of long-term changes in the atmosphere (e.g., due to climate change), the question arises as to whether there are indications that an increasing need for adaptation due to possibly increased UVR must be assumed [14,15]. The UVR in the human environment is characterized by a very high temporal and spatial variability. It depends (in addition to the sun elevation) mainly on total column ozone (TCO) and cloudiness, but also on aerosols, the albedo of the surface and the altitude of the location [16,17,18,19]. Stratospheric ozone is the strongest absorber of UVR [16]. In addition to the climatological knowledge of the average conditions [17], the occurrence of events with strongly positive anomalies in UVR is of importance for health protection. It stands to reason that such events are possible scenarios for the occurrence of sunburns. Such intermittent sun exposure is associated with an increased risk of developing melanoma [20,21]; for example, people with more than five episodes of severe sunburn have a 2-fold increased risk of melanoma [22].
Due to the inverse relationship between TCO and UVR, the occurrence of low-ozone events (LOEs) is predestined for strongly positive UVR anomalies; however, the effect of significantly reduced TCO on the UVR can be masked, in particular by clouds and/or aerosols. LOEs can arise for two different reasons [23]. On the one hand, the weather situation can lead to a high tropopause height and thus to a (reversible) displacement of part of the stratospheric ozone [24]. On the other hand, it is possible that air masses from the polar vortex, in which ozone has been irreversibly degraded by chlorine chemistry, are trans-ported to lower latitudes in spring [25,26,27,28,29,30]. In simplified terms, the LOEs can be referred to as LOEs of dynamic origin and LOEs of chemical origin.
There are a number of studies that examine LOEs and also consider their occurrence in mid-latitudes; however, a uniform definition of the term LOE has not yet been established [23,31,32,33,34,35,36,37,38,39,40,41,42,43,44,45,46,47,48,49,50,51,52,53,54,55]. Mainly early studies use a fixed threshold as the LOE definition [23,31,33,34,35,37,39,53,54]. Absolute deviations are rarely used [23,32,54]. In the last two decades, studies have often been based on relative deviations [36,38,40,41,42,43,44,45,46,47,48,49,50,51,52,53,55]. The common use of monthly mean thresholds has the disadvantage of artificial jumps in the reference value at the turn of the month, which can be avoided, for example, by concepts of extreme value theory [42] or mitigated by linear interpolation [52]. To determine the reference value, the present study uses a smoothing method based on daily mean thresholds, and thus represents a further development of the method of time-dependent relative deviation, which essentially corresponds to a nonlinear interpolation of the monthly mean thresholds and considers the impact-related approach of the study.
Compared to the number of studies on ozone anomalies, the relationship between LOEs and UVR anomalies is less often the subject of study [40,46,51,52,53,54,55]. A methodological challenge here is the superimposition of the influences of changes in the TCO with changes in cloud cover, which is characteristic of the mid-latitudes as a result of the frequently changing weather systems. This question is dealt with in different ways. Ref. [55] considers changes in UVR as a deviation from average conditions, i.e., the evaluation assumes cloud cover, which is averaged over the entire study period. Ref. [42] takes actual cloud cover into account and compares UVR to preindustrial cloudless conditions. Studies [40,46,51,52,53] investigate the (theoretical) change in UVR under the assumption of cloudless conditions or allow cloudiness to a certain specified extent.
The aim of the present study is to investigate the occurrence of “health-relevant” LOEs, i.e., in the sense of unusual health risks due to increased UVR exposure as a result of a significantly reduced TCO. In contrast to previous work, an impact-based approach is used, which refers to conditions that people are essentially used to and considers all-sky conditions, i.e., is not constrained by explicit assumptions about cloudiness in advance. Accordingly, this study combines an improved, time-dependent relative LOE definition and an impact-related approach to investigate the long-term changes of positive UVR anomalies in Germany during the period 1983 to 2019.

2. Materials and Methods

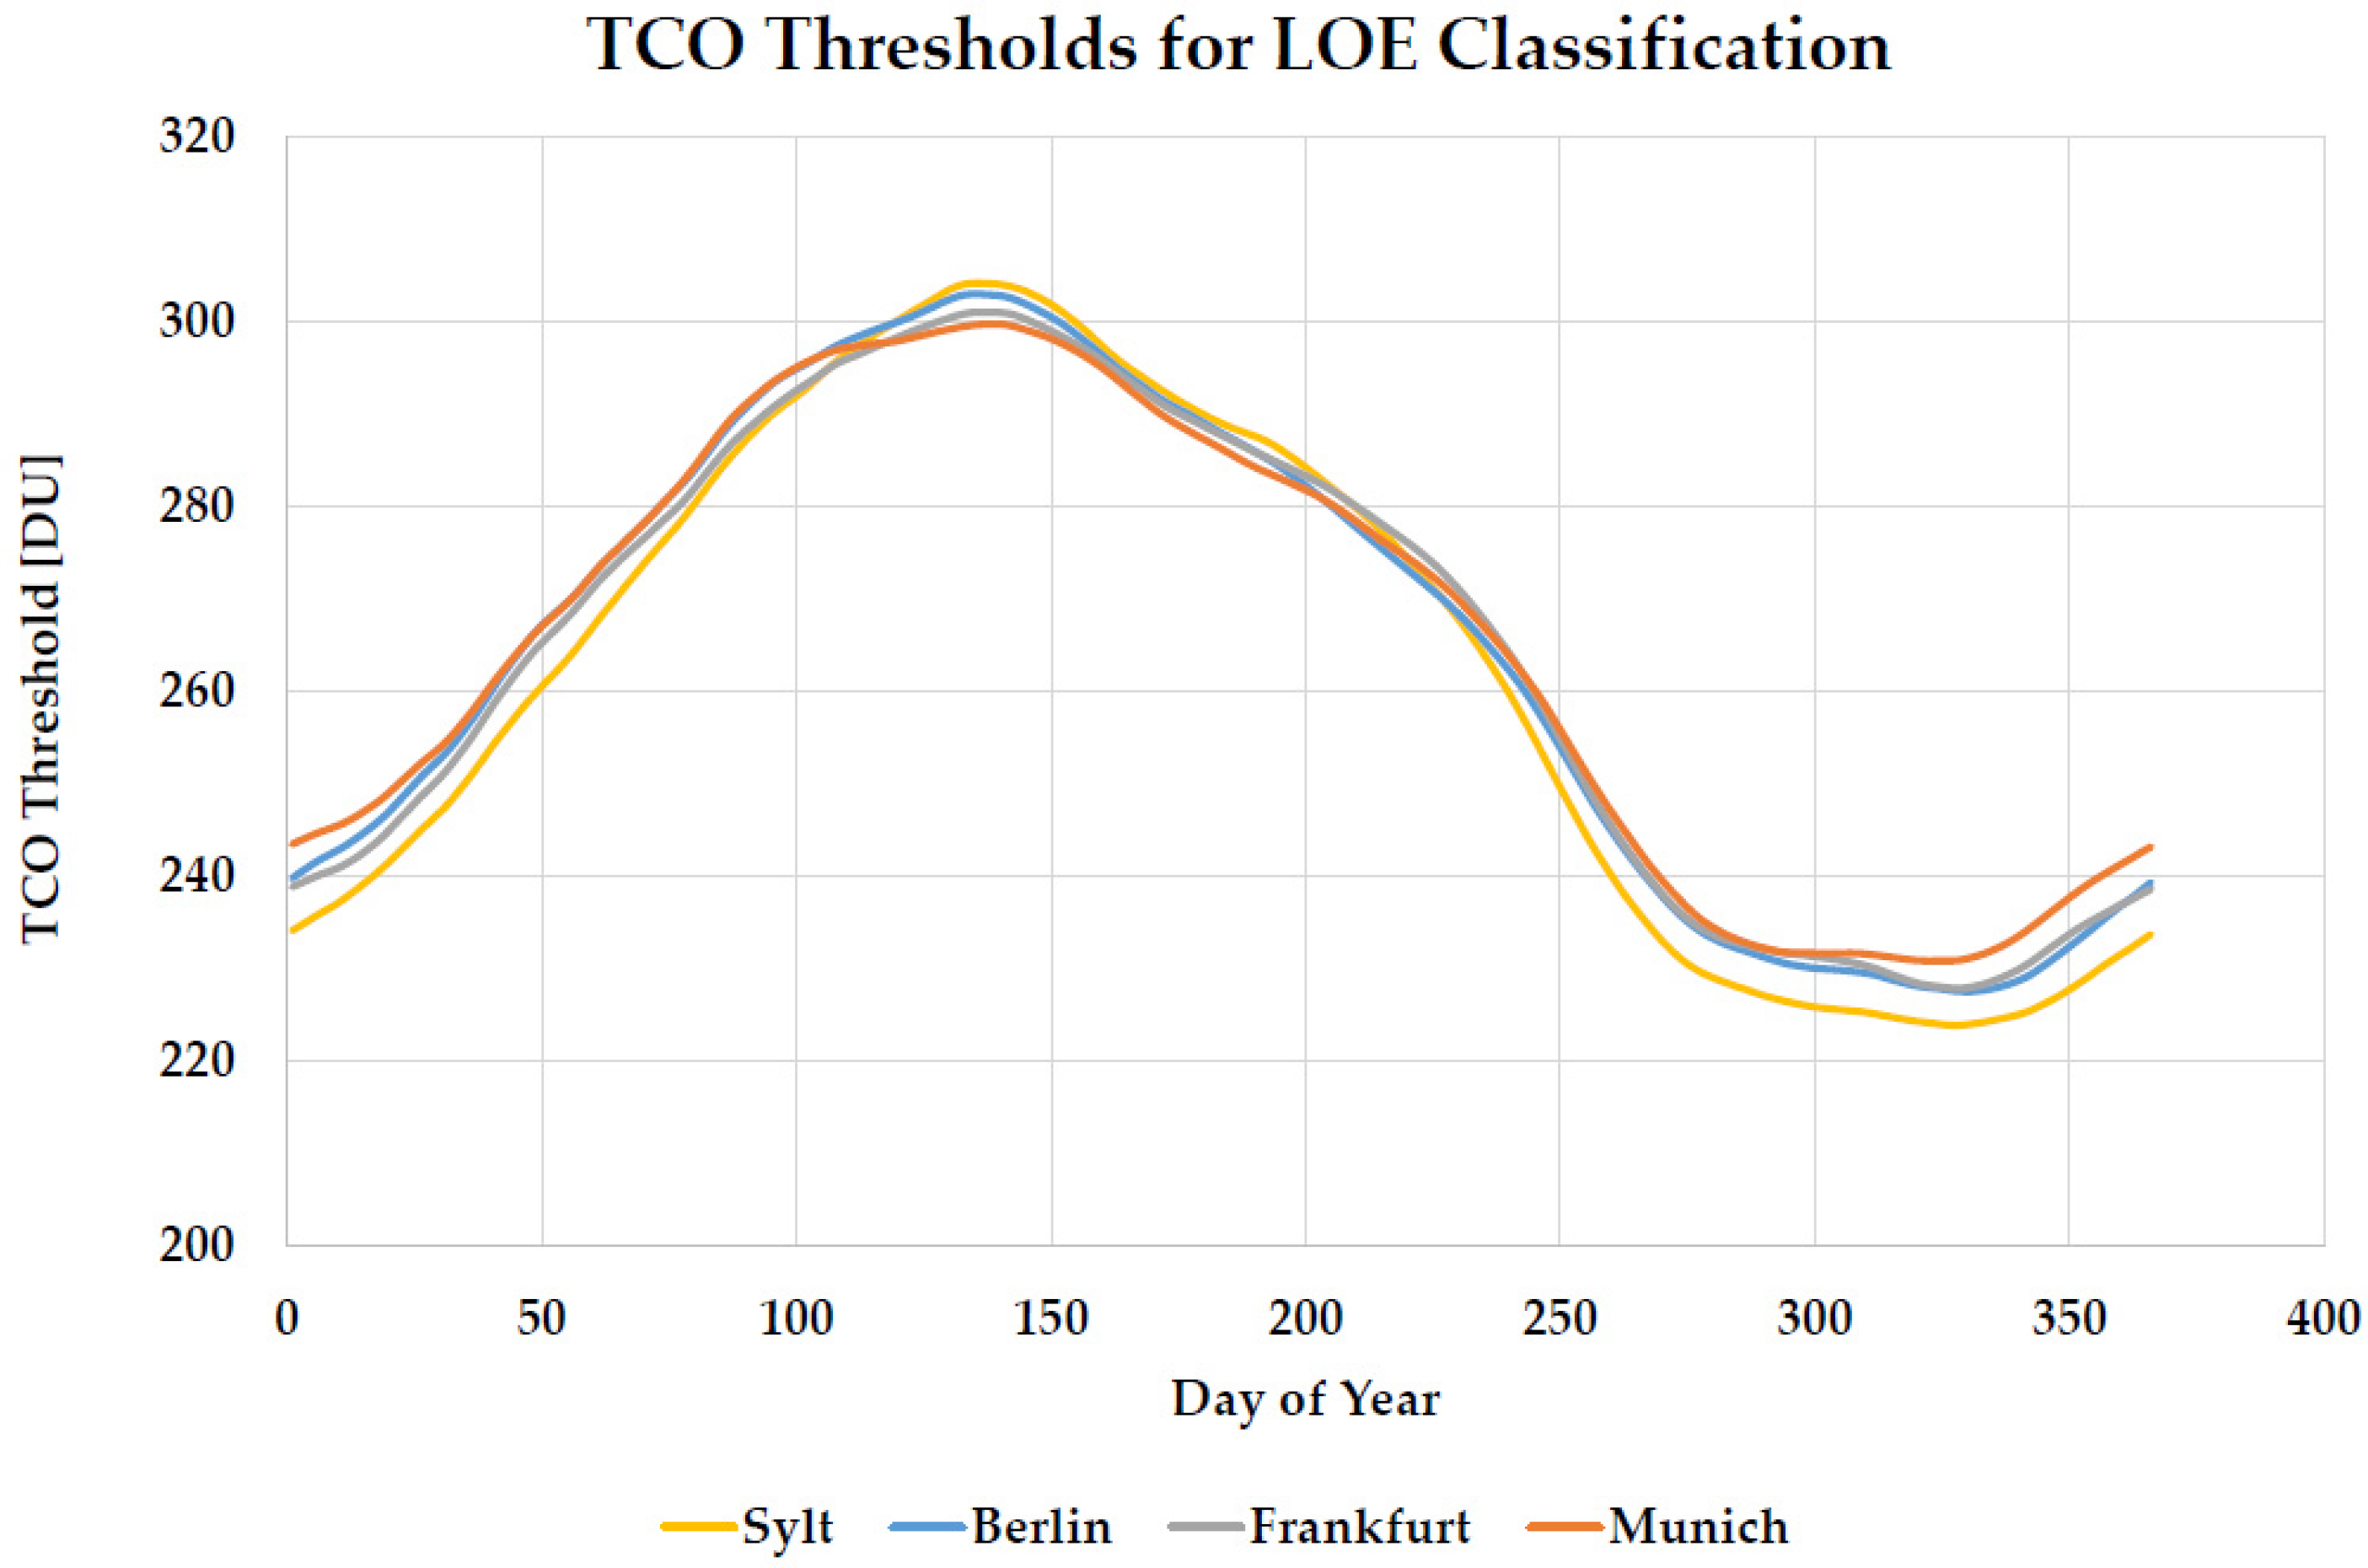
2.1. Total Column Ozone Data and Definition of Low-Ozone Events

In this study, TCO data based on multisensor reanalysis were used from the Tropospheric Emission Monitoring Internet Service [56,57], which is hosted by the Royal Netherlands Meteorological Institute. The mean bias of the multisensor reanalysis is reported to be less than 1% [56].
For the period, for which values are available in all months from January to December (1971–2021), data were extracted for 4 locations in Germany: Sylt, 54.9° N, 8.33° E, 16 m; Berlin, 52.5° N, 13.41° E, 36 m; Frankfurt, 50.1° N, 8.68° N, 112 m; Munich, 48.1° N, 11.57° N, 495 m. The selection of the locations aims to cover the span of the geographic latitude of Germany as far as possible (Figure 1). The locations are each about 2 degrees (2.0–2.4 degrees) apart geographically and (with the exception of Sylt) each represent regions with high population densities.
First, the number of LOEs is determined for each location. A uniform definition of the term LOE has not yet been established in the scientific literature. The method used here shows some parallels, but also differences to the approach of [52]. For each of the 4 locations, the mean daily TCO at local solar noon and its standard deviation is calculated for the entire period. A LOE (TCO) is defined here by the condition that the daily value of the TCO (at local solar noon) is less than or equal to the 30-day moving average of the difference between the long-term average and twice the standard deviation. On the one hand, this procedure avoids jumps at the end of the month, which are unavoidable when using monthly mean values of the TCO. TCO deviations in the range of up to −17 DU over the course of one month would be due solely to using the monthly means as a reference to identify the anomalies. On the other hand, the fact is considered that the study is carried out with a special focus on the possible health significance of LOEs. The human body adapts rather gradually to the UVR exposure that changes over the course of the year. Unsystematically varying daily thresholds, which would mean frequent (daily) fluctuations in the sense of progress, but also regression, of adaptation, do not seem plausible as a physiological reference and are avoided with the 30-day moving average. Ref. [52] uses monthly means of TCO and monthly means of TCO standard deviation, which are linearly interpolated to obtain daily values. To define an “extreme low ozone episode eLOE” [52], which corresponds to the LOE (TCO) in the present study, the value 2 of the quotient of the interpolated daily values of TCO monthly means and the monthly means of TCO standard deviation is used, which is equivalent to using twice the standard deviation and refer to value 1. Instead of the linear interpolation of the monthly means [52], the present study uses the moving 30-day average, which—with minor deviations due to the different month lengths—essentially corresponds to an improved, nonlinear interpolation of the monthly mean thresholds. Figure 2 shows the thresholds of the TCO for the 4 locations considered, which must be reached or fallen below depending on the day of the year for a classification as LOE (TCO). Although the mean TCO shows a north–south gradient with higher values in the north, the thresholds for the LOE classification for the 4 locations are relatively close, which is due to the fact that the standard deviation also shows a north–south gradient with higher values in the north.

2.2. Definition of Subperiods

With regard to the LOEs (TCO), the 4-location means of the annual numbers were calculated and their development over time was examined. Different subperiods were defined on this basis. In further evaluations, these subperiods enable comparisons that are based on long-term changes in TCO und the characteristic occurrence of LOEs (TCO) instead of purely arbitrarily defined periods (e.g., 10-year periods). TCO is subject to significant fluctuations due to various causes (such as solar cycle, quasi-biennial oscillation, volcanic eruptions, weather patterns, ozone-depleting substances) [58]. Since—among other influences—the 11-year solar cycle plays a role, which as an external factor is not caused by changes in the earth’s atmosphere, the 11-year moving average of the number of LOEs (TCO) is included in the trend analysis. Figure 3 shows the 4-location means of the annual number of LOEs (TCO) in the period 1971 to 2021 together with the 11-year moving average. In order to obtain the most comprehensive possible overview of the long-term changes in the occurrence of LOEs (TCO), the entire available dataset of the TCO 1971–2021 was first considered. However, the erythema-effective UV irradiance for all-sky conditions of the 4 locations is only available for the period 1983–2019, so that the evaluation with regard to the health-relevant LOEs is limited to this period.
In relation to the entire period, the number of LOEs (TCO) does not show a uniform linear trend. The 11-year moving average shows weaker negative trends, with a decrease in the number of LOEs (TCO) in the periods up to the early 1980s and since the late 1990s, respectively, and stronger changes in the period in between, with an increase from 1983 to 1993 and a decrease afterwards. Long-term measurements of the TCO in southern Germany (Hohenpeissenberg) show that the 1990s mark the period with the lowest TCO [59]. This period is strongly influenced by the highest levels of chlorine and bromine in the atmosphere, which have been slowly decreasing again since the mid-1990s, and by the effects of increased aerosol pollution on the ozone layer after the Pinatubo volcanic eruption [59,60]. A study with global data for the period 1979 to 2016 [58] identifies the year 1996 as the trend reversal in ozone depletion. In the 1990s, the number of LOEs (TCO) reached the highest values of the entire study period. The linear trend of the long-term (11-year moving) average of the number of LOEs (TCO) since 1998 essentially corresponds to the trend of the individual years (~−6%/year). Due to the facts about long-term TCO changes and the characteristic occurrence of LOEs (TCO), it makes sense to evaluate the subperiod 1990 to 1997 separately from the previous and subsequent subperiods. Accordingly, the following different subperiods are considered in the study: T1: 1983–1989, T2: 1990–1997, T3: 1998–2019.

2.3. Erythema-Effective UV Irradiance Data and Definition of Health-Relevant Low-Ozone Events

The erythema-effective UV irradiance data for the 4 locations were extracted according to its geographic coordinates from the UVR climatology [17] of the Deutscher Wetterdienst (German National Meteorological Service) which provides data for both clear-sky and all-sky conditions. Details on how the UVR climatology was calculated can be found in [17]. The principal method can be briefly outlined as follows. The clear-sky UVR data are essentially computed by an empirical parametrization [61] as a function of the TCO (multisensor reanalysis, see also Section 2.1) and the solar zenith angle, also considering climatological data of surface albedo [62] and aerosols [63] as well as the varying sun–earth distance and the elevation of the location [17]. To obtain all-sky UVR data, the clear-sky UVR data are subject to cloud correction using cloud modification factors (CMF) [17,64]. CMF is calculated as a function of the solar zenith angle and the effective cloud albedo in the visible spectral range (provided by Satellite Application Facility on Climate Monitoring of the European Organization for the Exploitation of Meteorological Satellites). It considers the fact that in the UV spectral range, clouds reduce the irradiance less than in the visible spectral range. Based on the method described, the existing UVR climatology of the Deutscher Wetterdienst for the years 1983 to 2015 [17] was extended by the years 2016 to 2019. The calculation of the data in hourly resolution enables the determination of the daily maximum and the daily sum of the erythema-effective UV irradiance, i.e., UV index and erythema-effective UVR dose. The present study specifically considers the LOEs with regard to their direct influence on human health and therefore focuses on the changes in UVR in the human environment. In this study, LOEs are classified as “health-relevant” if they are associated with health risks beyond those normally encountered, i.e., when associated with positive anomalies in erythema-effective UV exposure relative to an appropriate threshold. Typically, in Germany and other mid-latitude regions, there is an alternation of cloudy periods and phases with little or no cloud, each caused by the changing weather systems. These phases can change at high frequency or, for example, can persist for weeks in blocking situations. It can therefore be assumed that people are basically used to the full range of conditions. In contrast, the mean cloudiness as a purely statistical value does not represent an appropriate threshold value. A health-related positive anomaly of the UVR can rather be assumed if the UVR exceeds the typical clear-sky level, and consequently an increased risk of sunburn beyond the typical extent must be expected. From the set of all LOEs (TCO), which result due to the TCO anomaly described above, those events are classified as “health-relevant”, which show a positive deviation of the daily maximum of the erythema-effective UV irradiance under all-sky conditions from the mean daily maximum at clear-sky conditions (30-day moving average). The 30-day moving average is used as a reference value in analogy to the procedure described above for the TCO anomaly. The advantage of the impact-related definition of health-relevant LOEs is that it can include both clear-sky conditions and, in principle, cloudy days, as long as positive anomalies in erythema-effective UV irradiance (compared to the level of typical clear-sky conditions) are recorded.
The method used here shows some parallels but also differences to the approach of [42]. The reference to clear-sky conditions is in accordance with [42]. Differences result from the determination of the reference period and the initial situation. While the present study carries out an analysis for situations with strongly negative TCO anomalies [42], examines, among other things, the reasons for high UVR anomalies. The reference value used is the preindustrial level of the 1950s with a fixed deviation of 15% [42]. However, this study aims to identify additional health risks (i.e., risks that exceed the usual level), and therefore, the period of the last few decades is taken as a basis, for which exposure and basic adaptation of people can be assumed.
The results presented below deal with the health-relevant LOEs (i.e., with associated near-surface anomalies of the erythema-effective UV irradiance), unless the term LOE (TCO) is used, which indicates an exclusive reference to low TCO.

3. Results

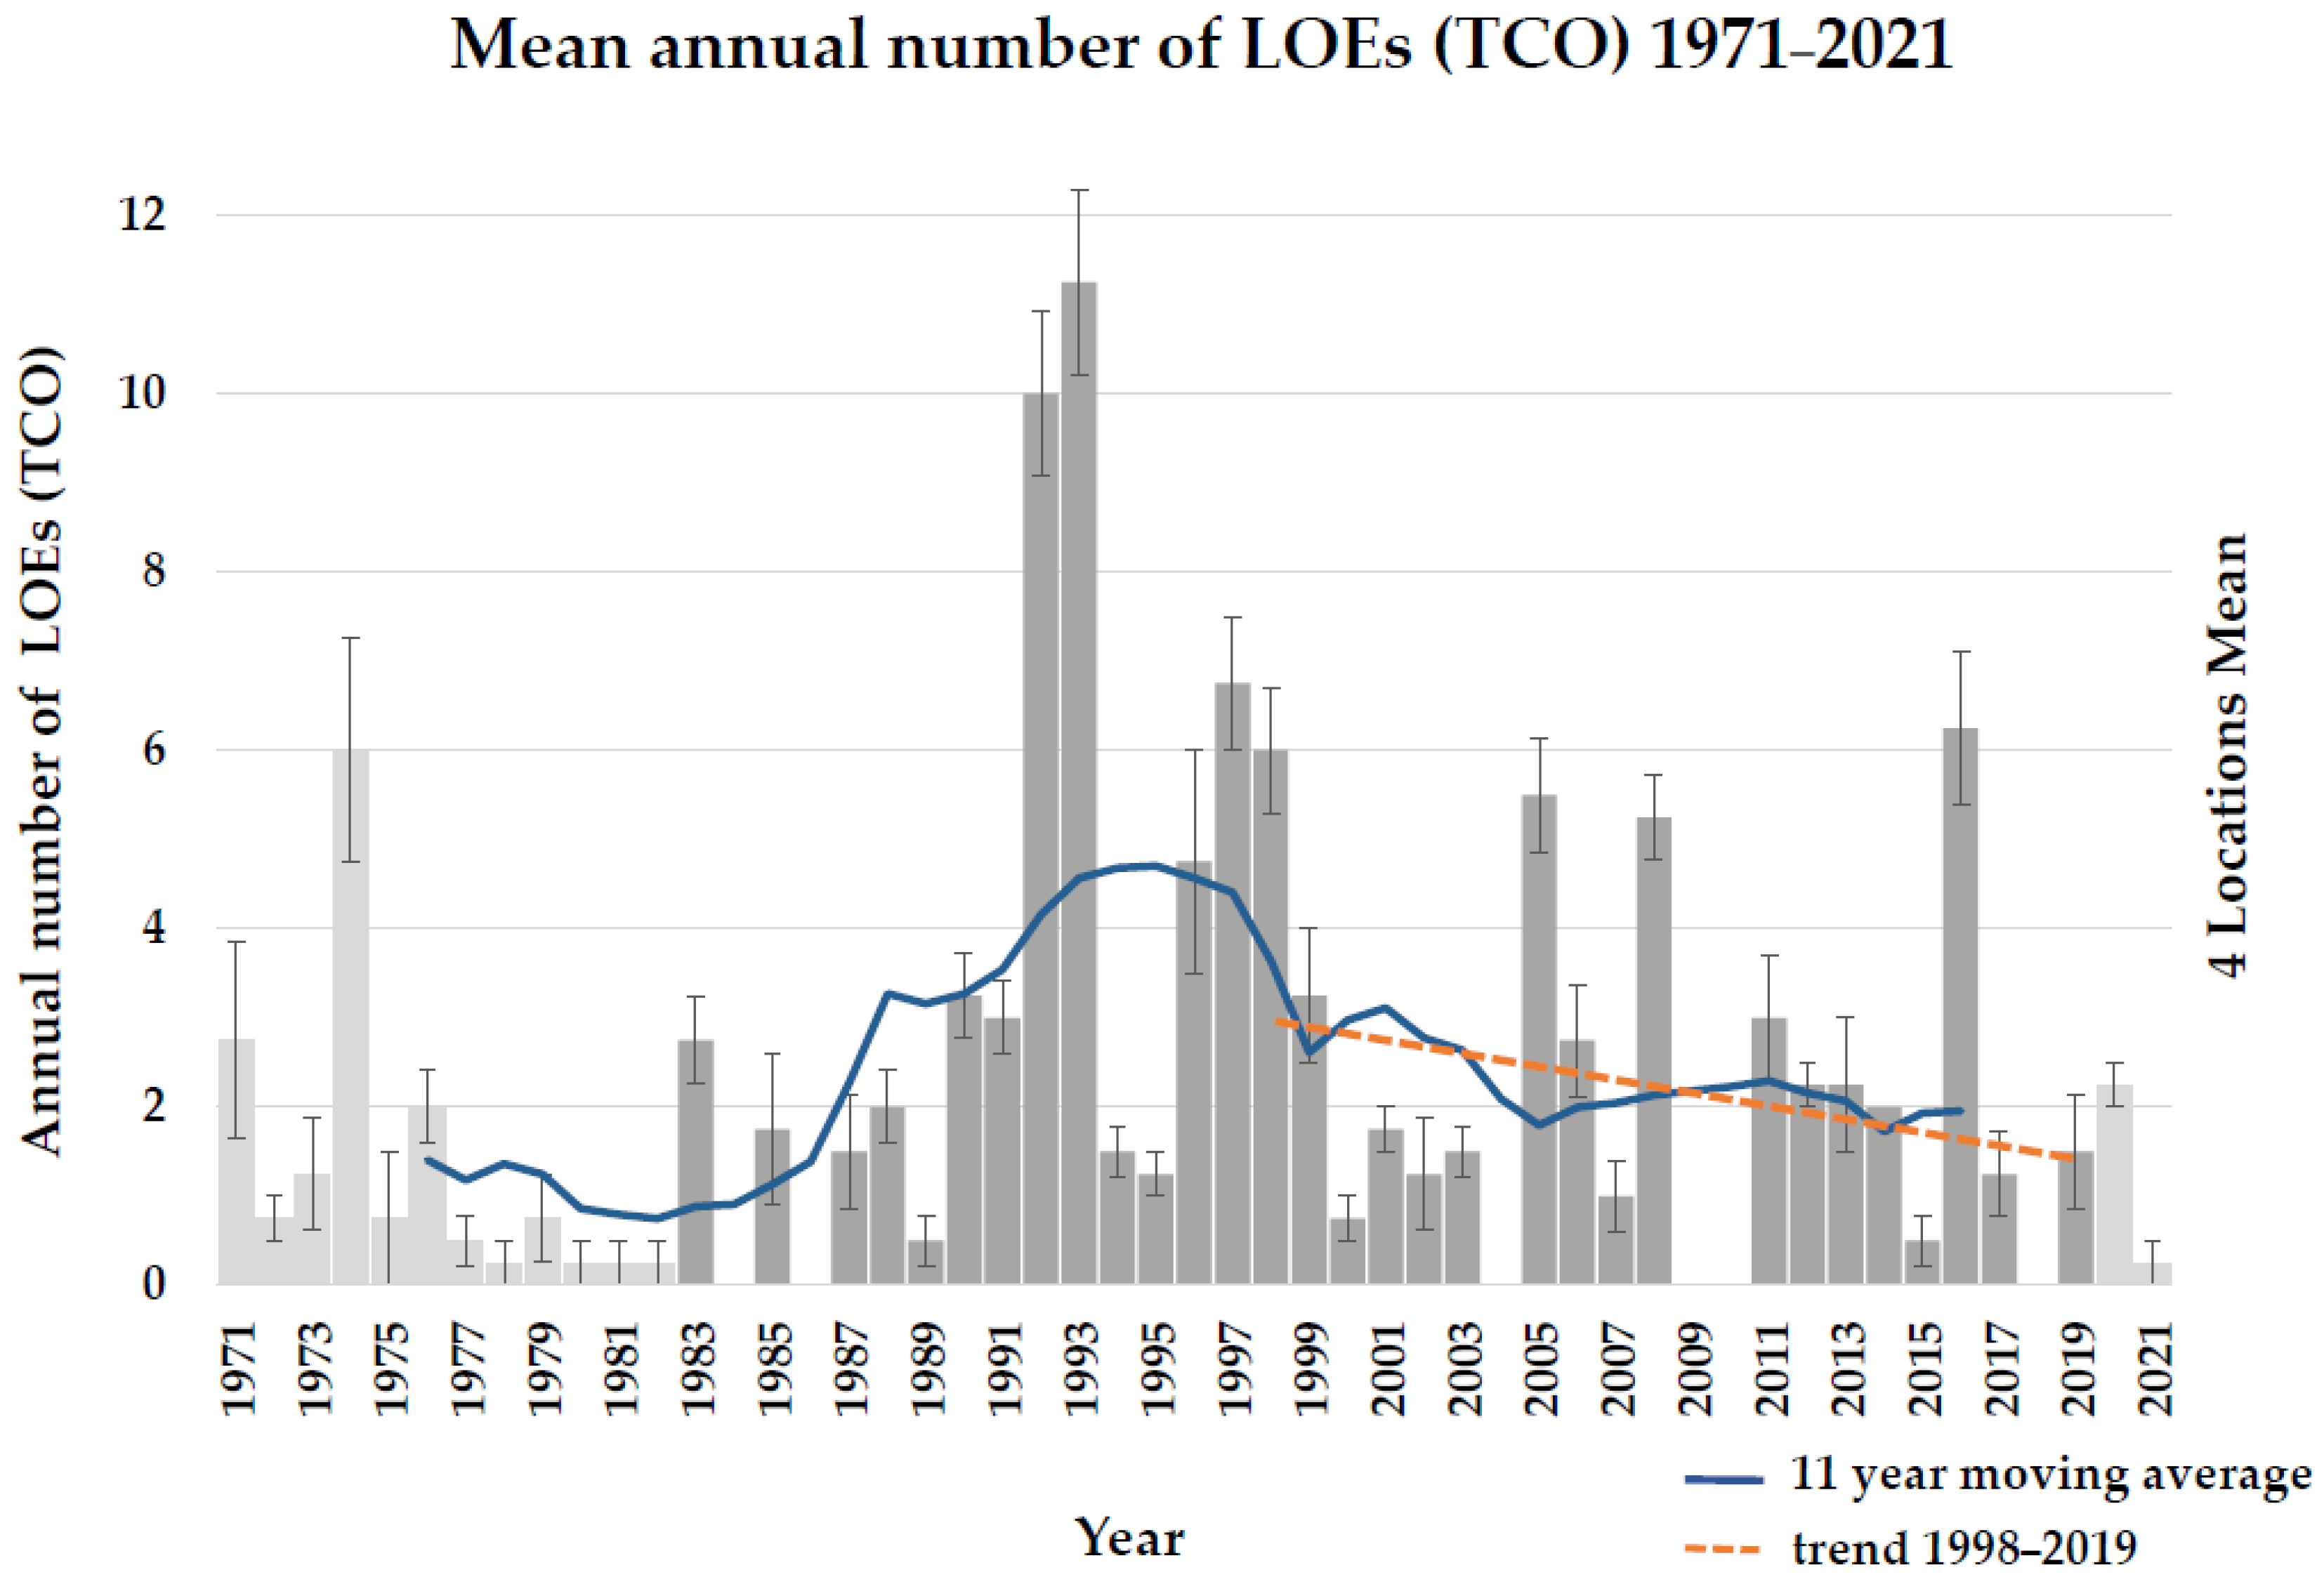
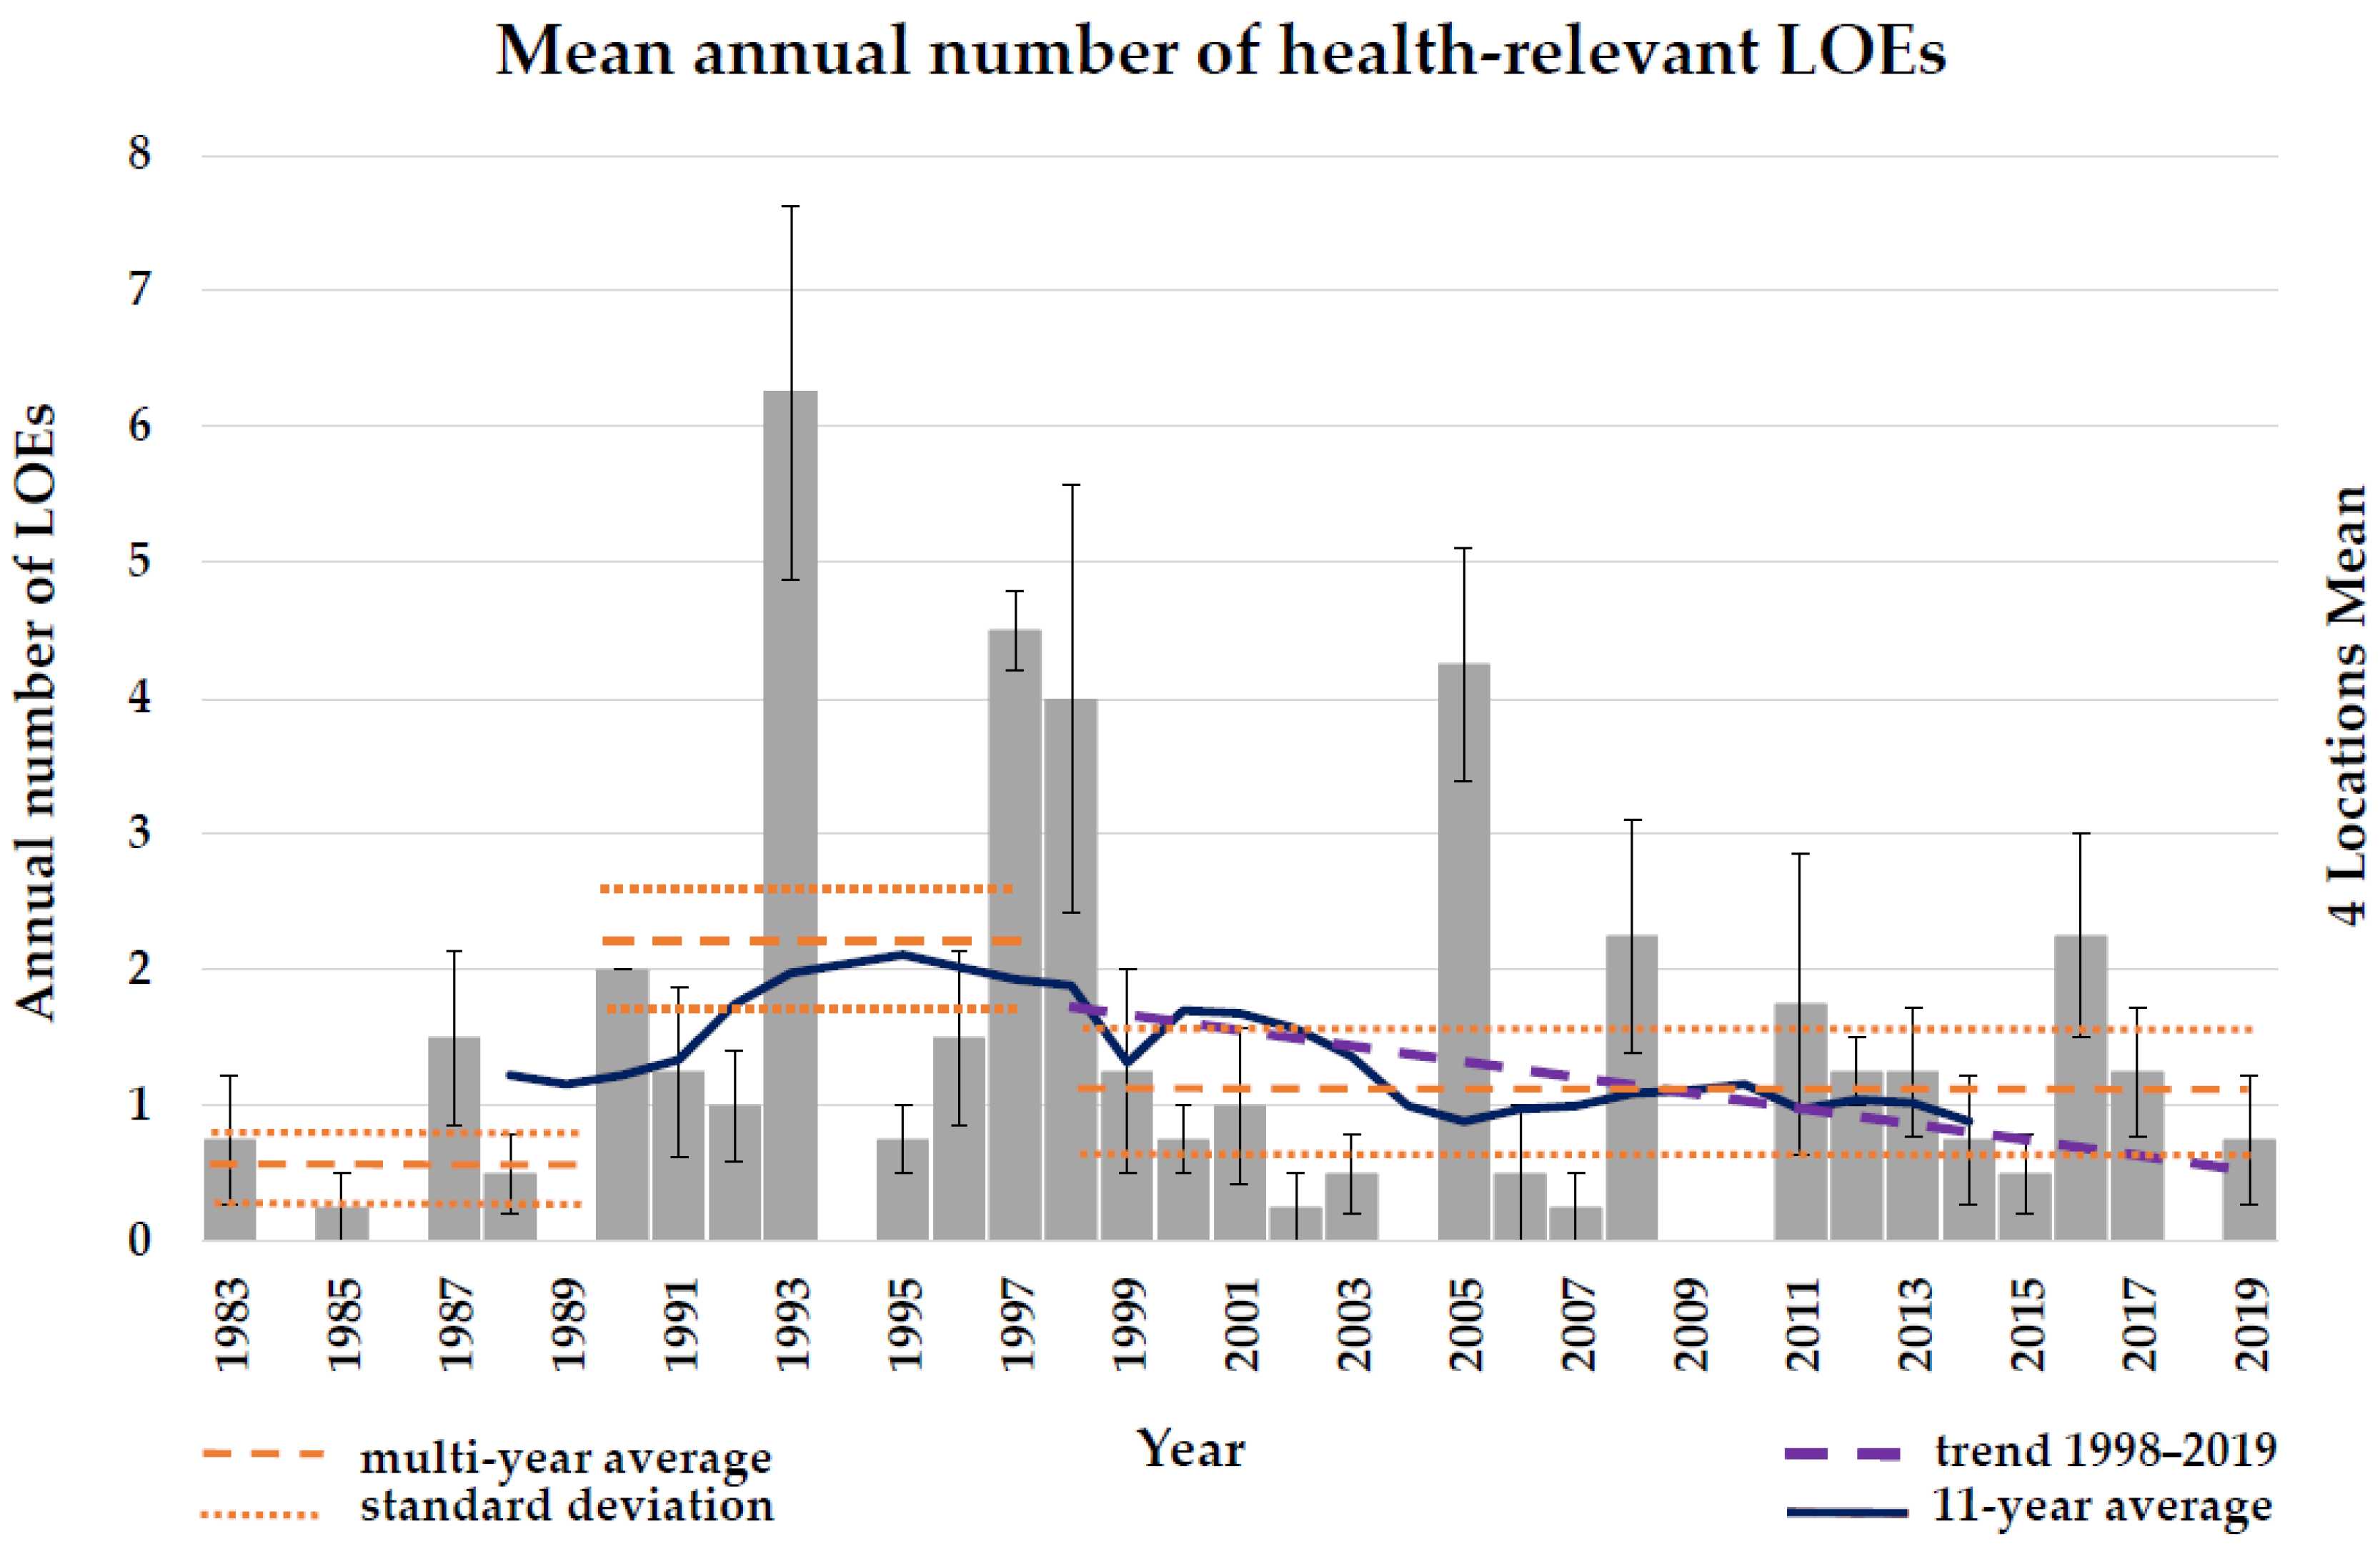
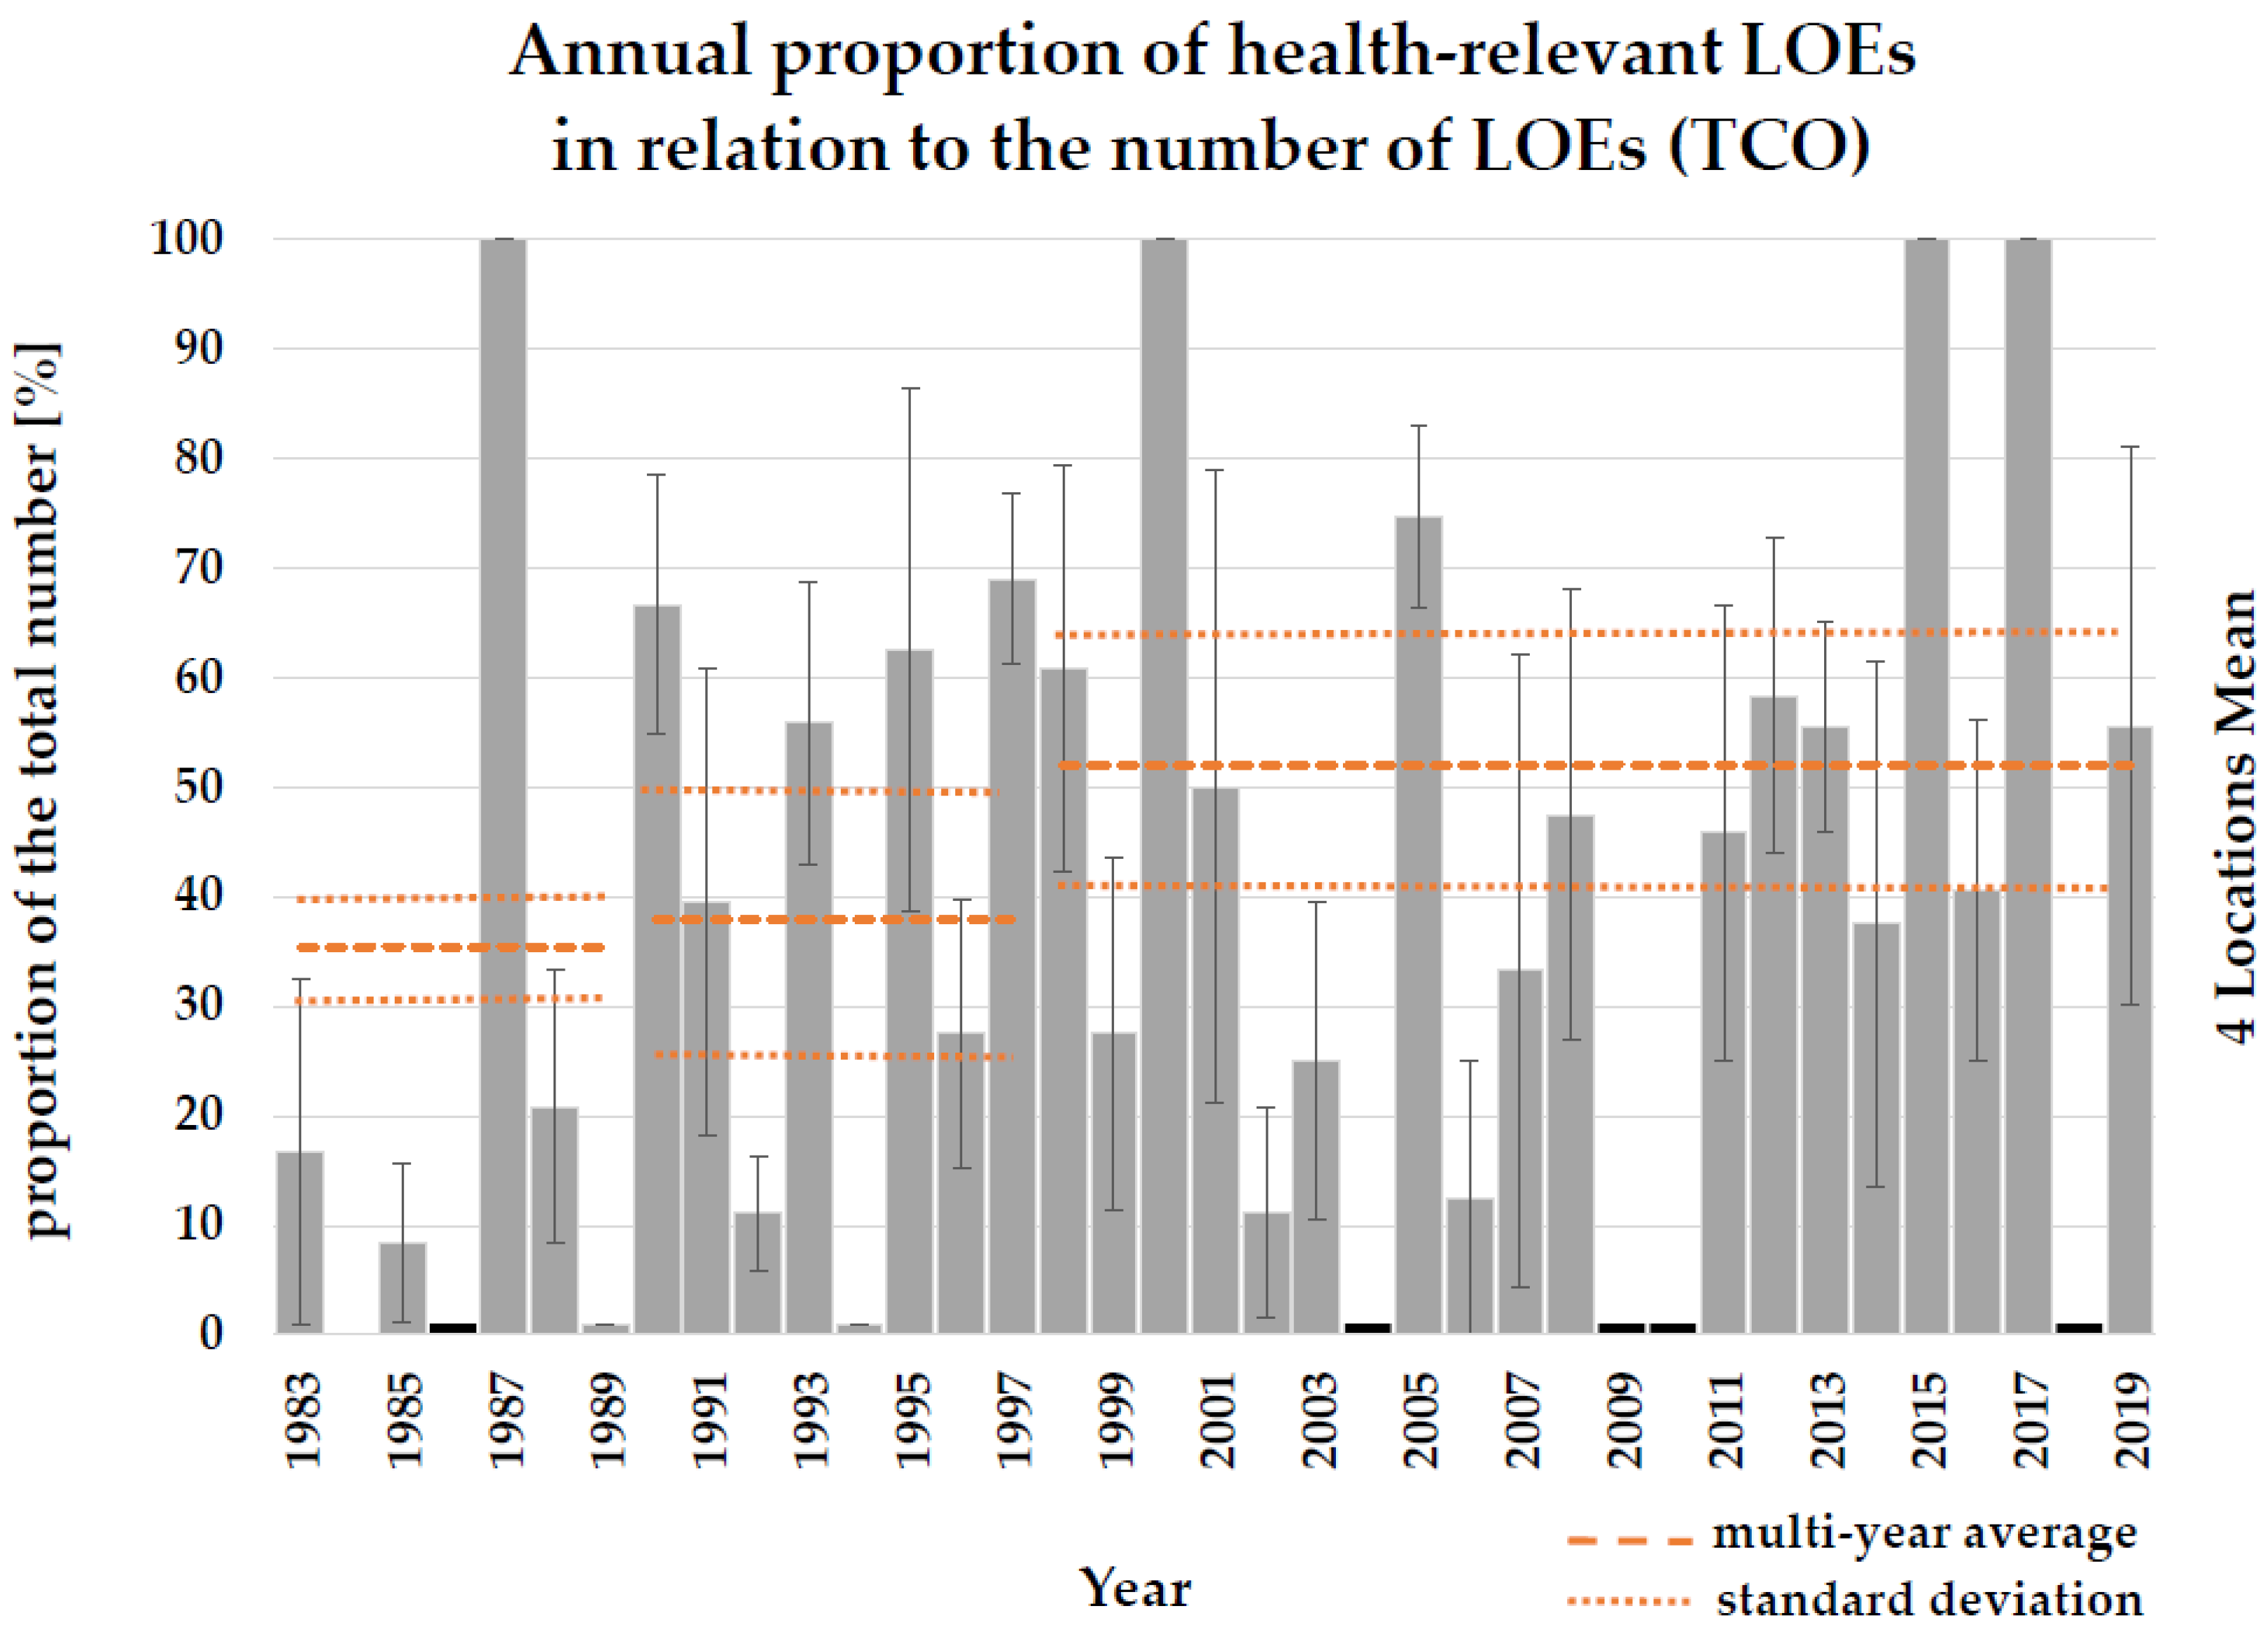
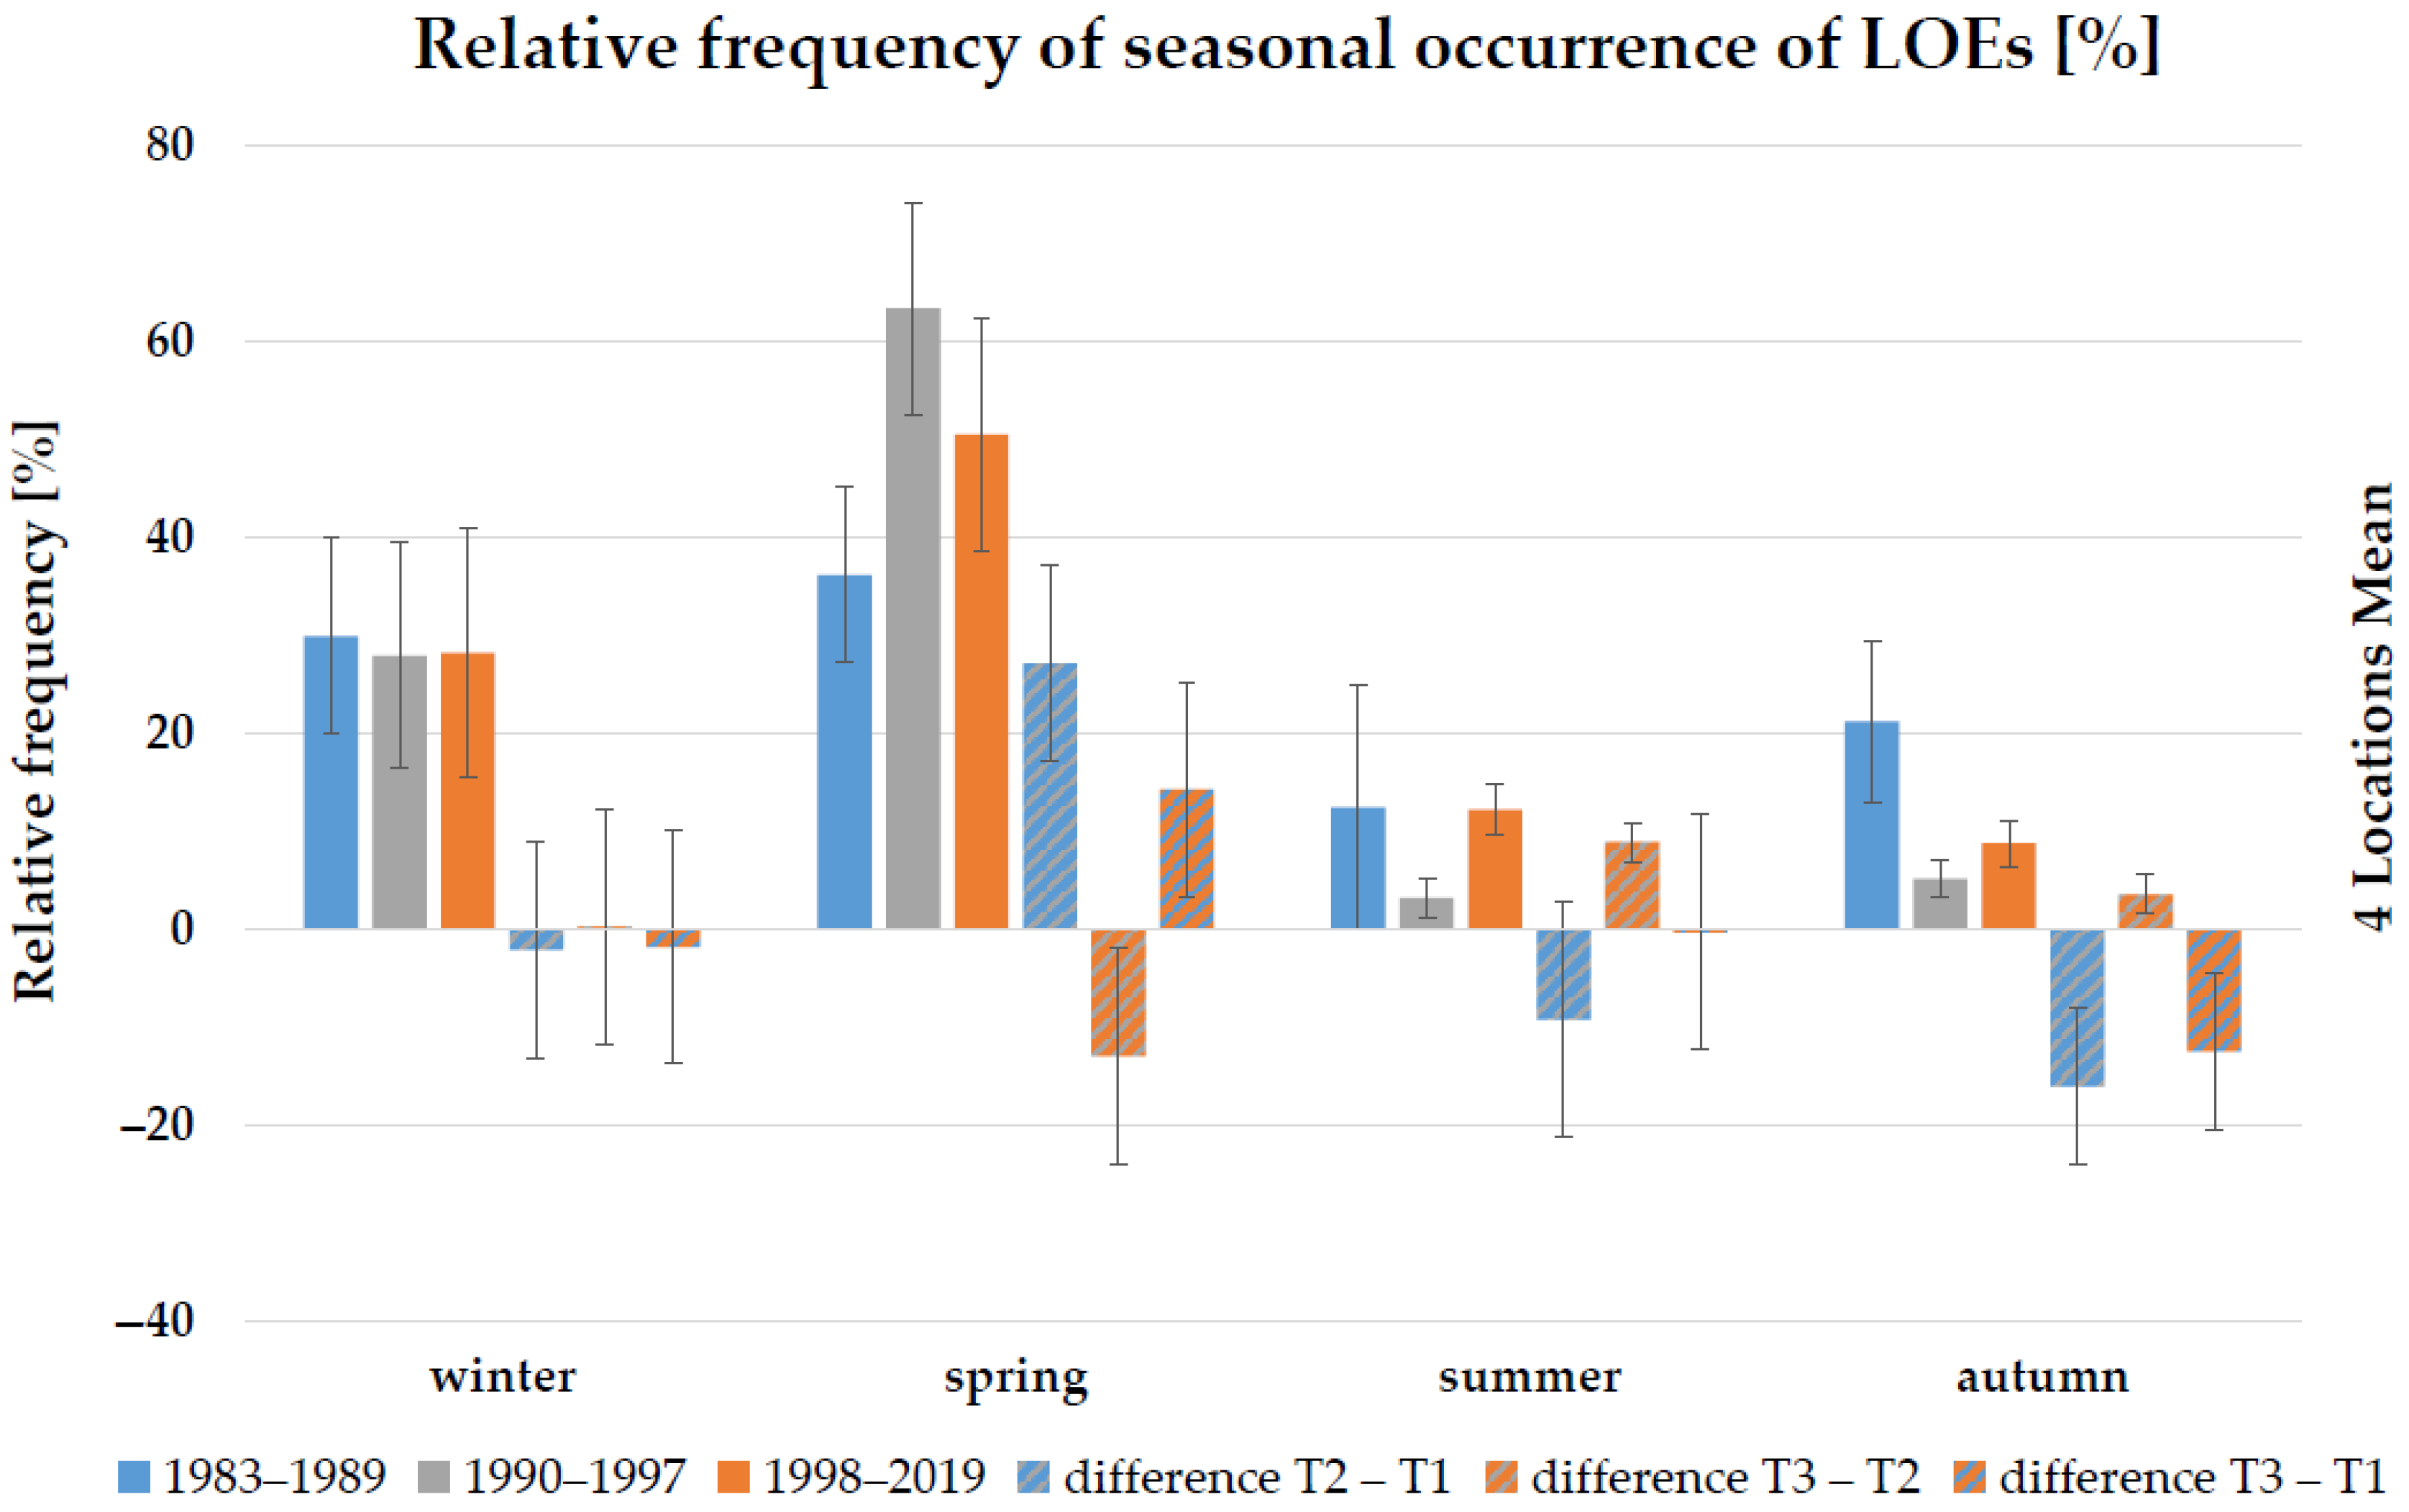
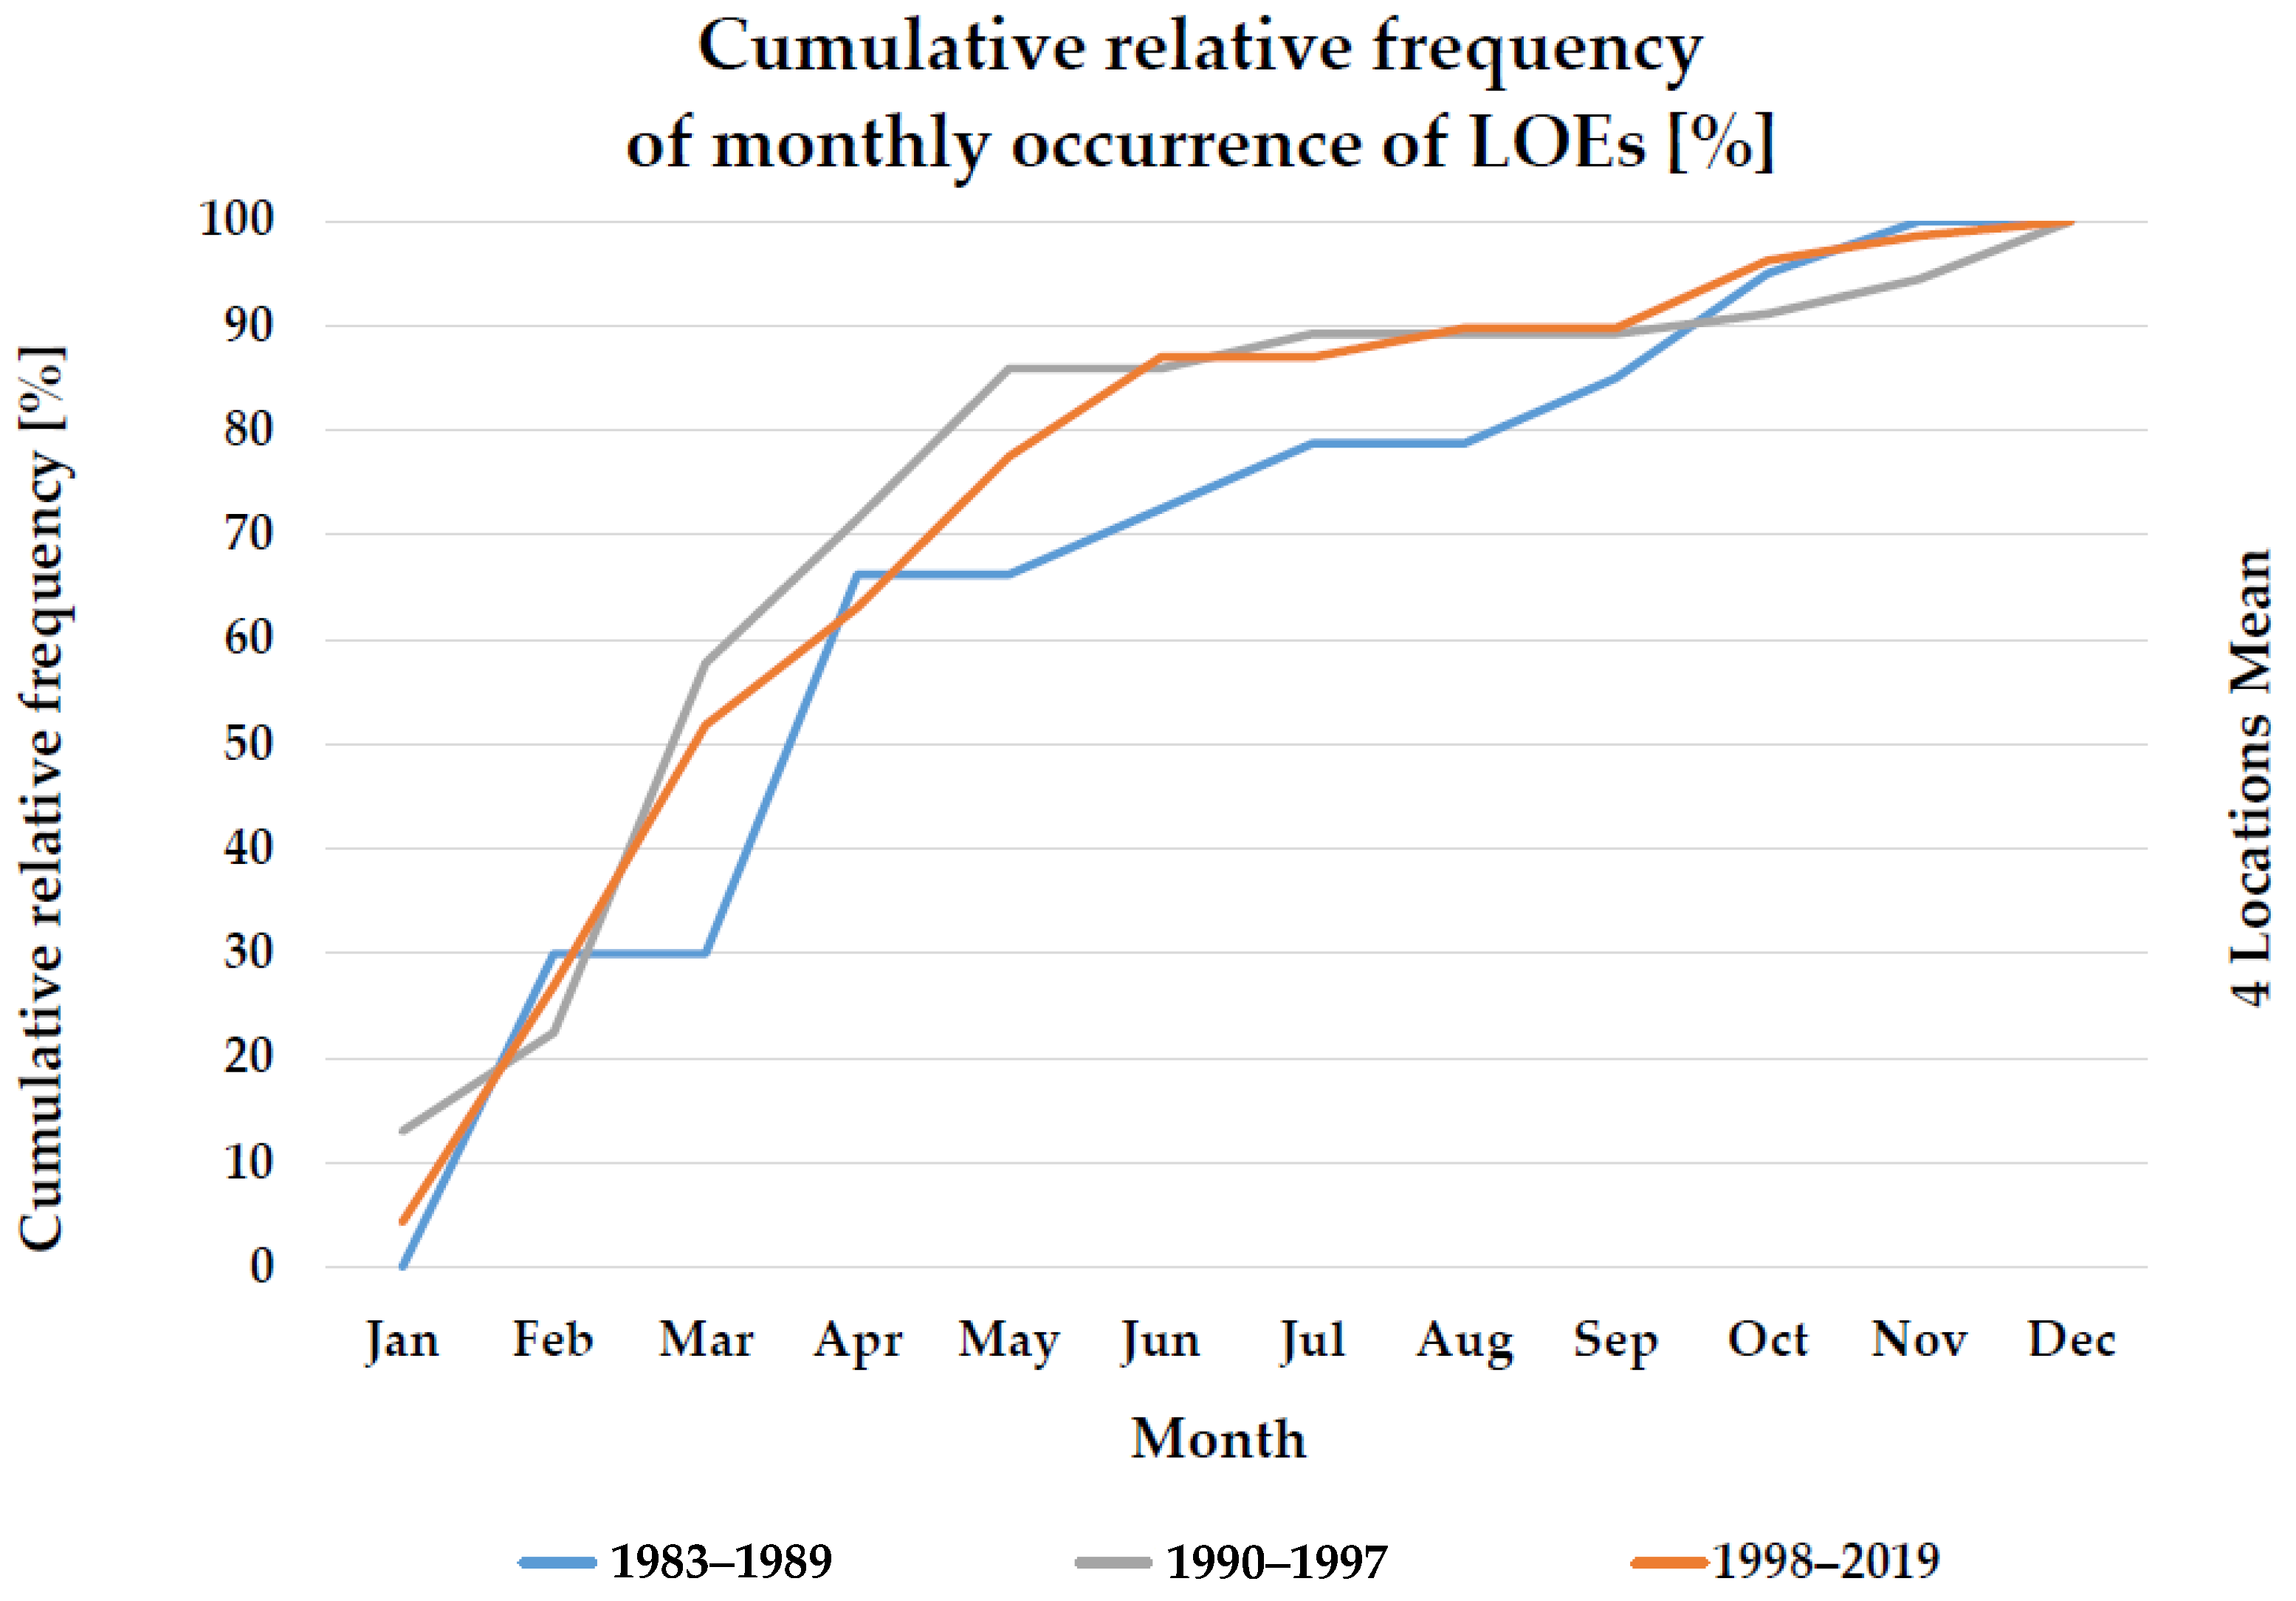
3.1. Occurrence of Human Health-Relevant Low-Ozone Events

The four-location means of the annual number of health-relevant LOEs in Germany in the period 1983–2019 are shown in Figure 4.
On average, 0.6 ± 0.2 events per year associated with positive anomalies in erythema-effective UV irradiance occur in subperiod T1, 2.2 ± 0.4 events per year in subperiod T2 and 1.1 ± 0.5 events per year in subperiod T3. The health-relevant LOEs occur in the period of the 2000s (T3) in a larger number on average than in the 1980s (T1), but only half as often compared to the 1990s (T2). The annual number of events is characterized by a large variability. In the most recent subperiod, T3, 0 to 4.2 ± 0.8 events per year occur. The (linearly described) trend in the most recent subperiod, T3, shows a decrease in mean number by −4.8%/year. The trend of the 11-year moving average in T3 is statistically significant (p < 0.05). The subperiods T1 and T2 each show no statistically significant trends.
Figure 5 shows the percentage of health-relevant LOEs, i.e., the annual proportion of days on which LOEs and anomalies of the erythema-effective UV irradiation occur at the same time in relation to the number of days with LOEs due to anomalies of the TCO. The mean proportion in subperiod T1 is 35 ± 5%, in subperiod T2 is 37 ± 12% and in subperiod T3 is 52 ± 11%, while in all subperiods, the variability extends over the entire possible range from 0 to 100%. Accordingly, on average, health-relevant LOEs during the 2000s (T3) account for about half (51%) of all LOEs that occur. Their average share in the most recent period is approximately 16 percent larger than in the subperiod T1. The subperiods T1 and T2 have average shares of a comparable magnitude. This could be interpreted as an indication of the weather-related influence of changing cloud conditions (decrease in cloud cover) and/or a shift in the occurrence of the LOE to periods that are usually characterized by less cloud cover (e.g., from winter to spring). Within subperiod T3, there is a trend towards an increase in the annual LOE share of +1.2%/year, but this is not statistically significant.
To determine whether there is evidence of temporal shifts in the occurrence of LOEs, the relative frequency of seasonal occurrence of LOEs and changes between periods were evaluated (Figure 6). The most frequent occurrence is always in spring, with an average of 36 ± 9% during T1, 63 ± 11% during T2 and 51 ± 11% during T3. Over time, there have been changes in the seasonal frequencies of the occurrence of health-relevant LOEs. In the subperiod T2, compared to the previous subperiod T1, LOEs occurred more frequently in spring (+27 ± 10%) and less frequently in autumn (−16 ± 8%) and summer (−9 ± 12%). Only the spring trend is clearly an increase. In the most recent subperiod, T3, this development is at least partially reversed, which is shown by a (compared to subperiod T2) more frequent occurrence in summer (+9 ± 2%) and autumn (+4 ± 2%), as well as a less frequent occurrence in spring (−13 ± 11%). Currently (T3) about half (51 ± 11%) of the health-relevant LOEs occur in spring, followed by winter (28 ± 12%), summer (12 ± 2%) and autumn (9 ± 2%). Consequently, the frequency of occurrence in summer and winter during the 2000s (T3) is approximately at the same level as during the 1980s (T1); in spring, on the other hand, it is increased, but this increase in frequency is currently (T3) only about half of the increase during the 1990s (T2) and within the range of the standard deviations. The occurrence in autumn is currently (T3) decreased in comparison to T1. The results of Figure 6 suggest that it is less likely that a temporal shift in the occurrence of the LOEs to periods typically characterized by less cloudiness is responsible (or partly responsible) for the results in Figure 5. Rather, it can be assumed that the results of Figure 5 reflect a more frequent occurrence of clear-sky or sparsely cloudy weather conditions.
The extent to which there are temporal shifts in the occurrence of LOEs within the seasons over the course of the period under consideration was examined using the cumulative relative frequency of the monthly occurrence of LOEs (Figure 7). Looking at spring, the steepest increase in the cumulative relative frequencies of monthly occurrences of LOEs is observed during subperiod T1 in April and during subperiods T2 and T3 in March. It follows that during the 1990s and 2000s (T2 and T3), a larger proportion of the spring LOEs occurred earlier in the season than during the 1980s (T1).
A significant proportion of the LOEs (28 ± 12%) occur in winter (Figure 6), and thus at a time when UVR exposure in Germany typically only reaches a low level due to the low sun elevation, even with a clear sky [17], and a health hazard in the sense of a risk of sunburn cannot be assumed a priori. Under these conditions, a health risk assessment based solely on UVR anomalies is not appropriate, but requires an assessment of absolute levels of UVR exposure. The absolute values of the UVR exposure differ depending on the geographical latitude and thus in northern and southern Germany, since they are strongly determined by the sun elevation. The individual UVR exposure depends on the exposure duration and the response of the skin to the UVR exposure, which in turn can be described and classified via the skin type [65]. In Germany, skin type II occurs most frequently, with a proportion of 55.4% of the population [66]. According to the International Commission on Non-Ionizing Radiation Protection, an average minimum erythema dose (MED) of 250 J/m2 corresponds to skin type II [67]. Table 1 shows the mean proportions (1983 to 2019) of winter LOEs associated with a health risk from prolonged UVR exposure in northern Germany (locations: Sylt and Berlin) and southern Germany (locations: Frankfurt and Munich). In Table 1, the term “health risk” is used for reaching the MED for skin type II. The risk levels are given according to [68]. Even with prolonged exposure in winter, the health risk in northern Germany is negligible on at least one-third of the days with LOE (33% to 38%), while in southern Germany, at least a low risk can always be assumed. In winter in southern Germany, people with skin type II are at risk of sunburn on 57% to 79% of days with LOEs for prolonged exposure of more than 1.5 h.

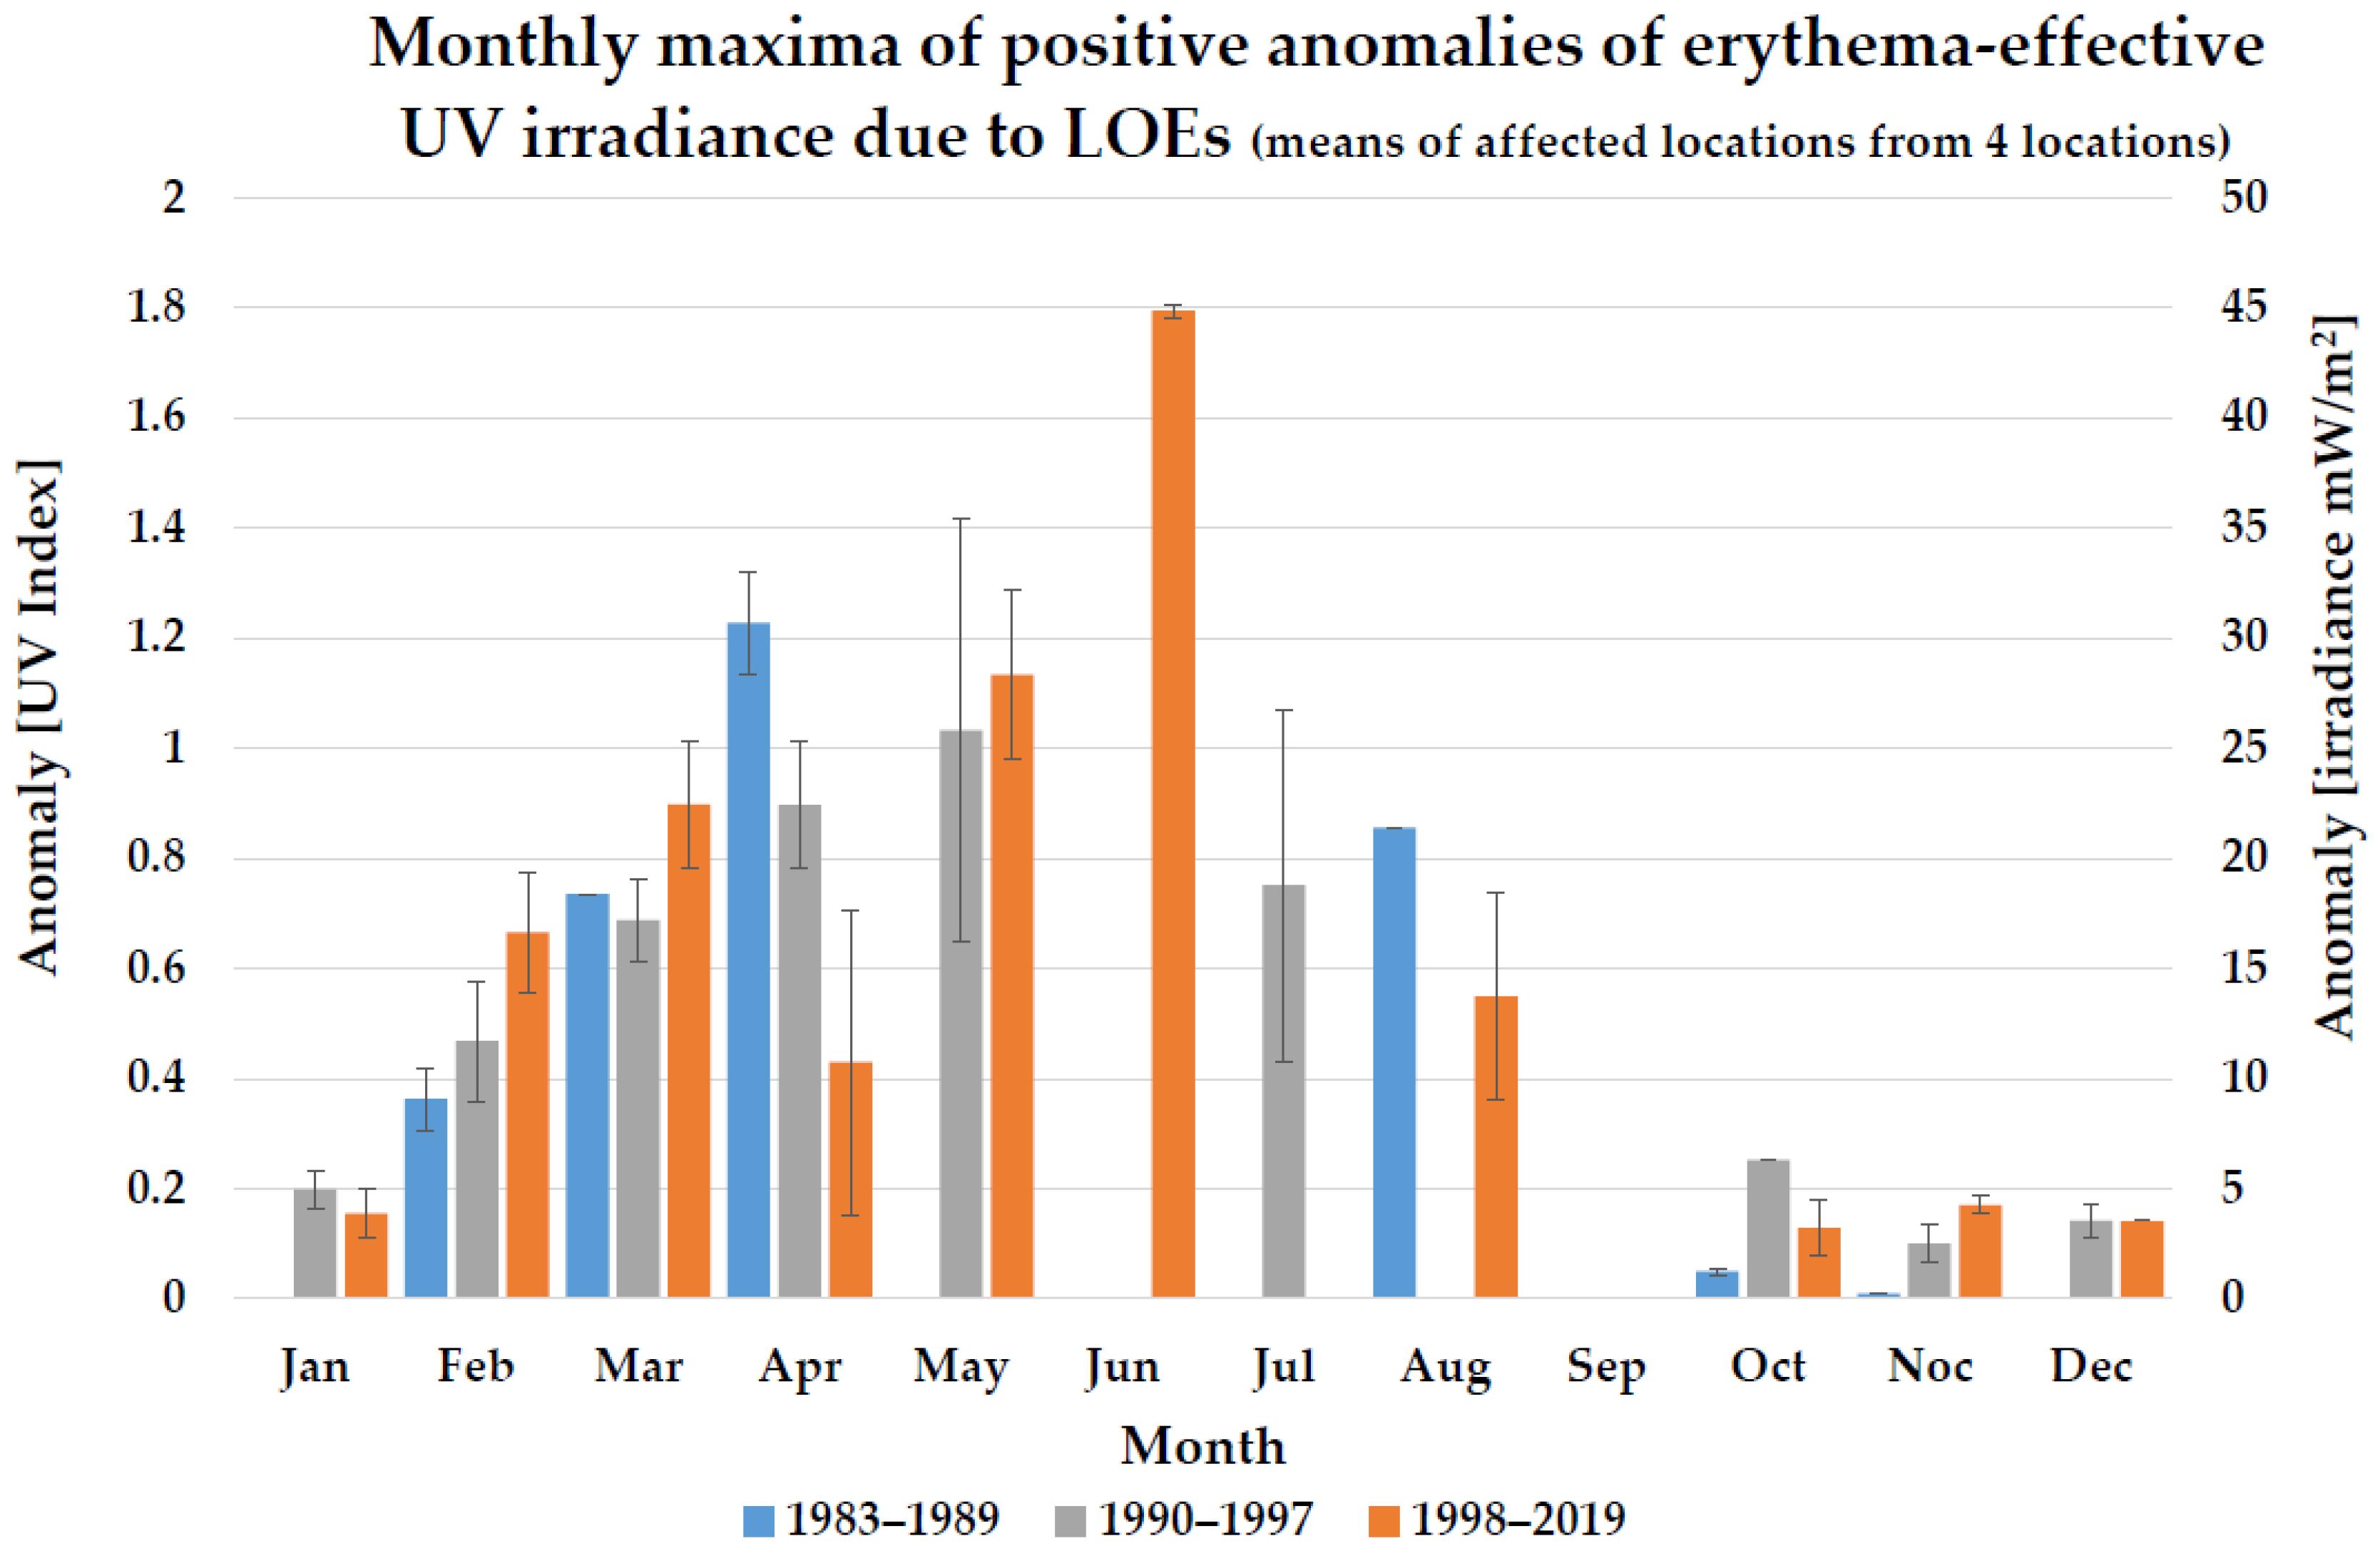
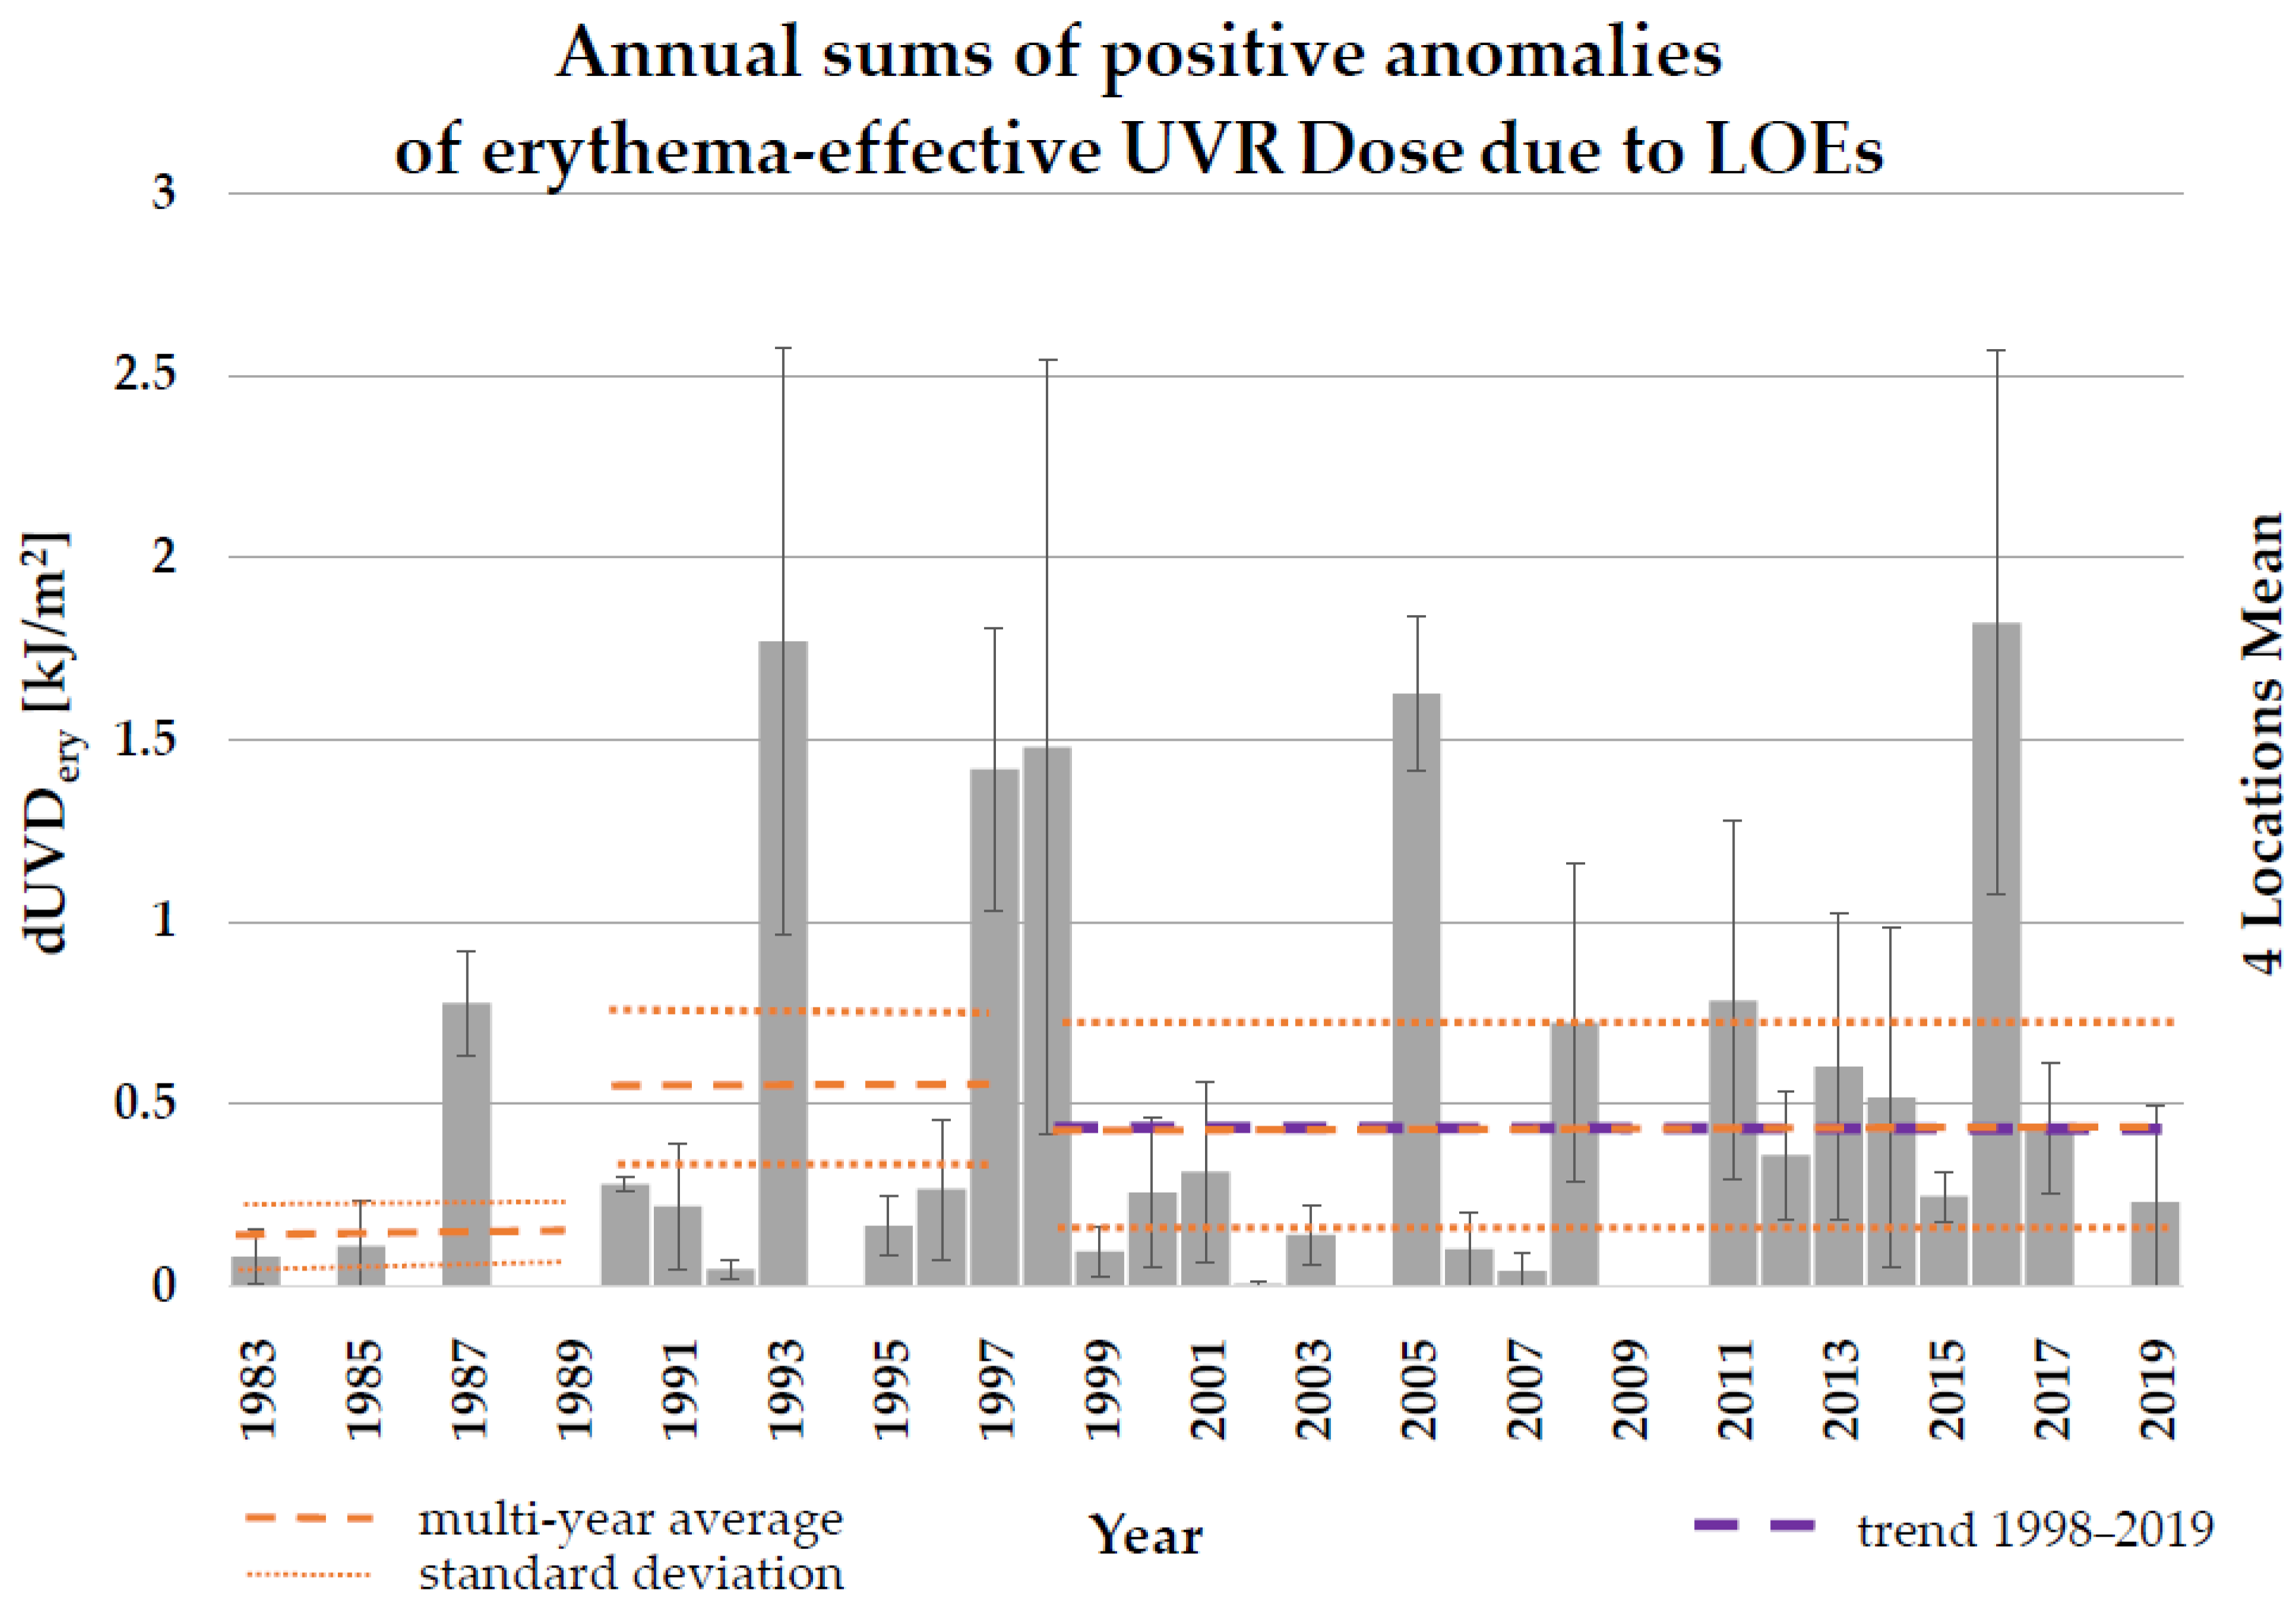
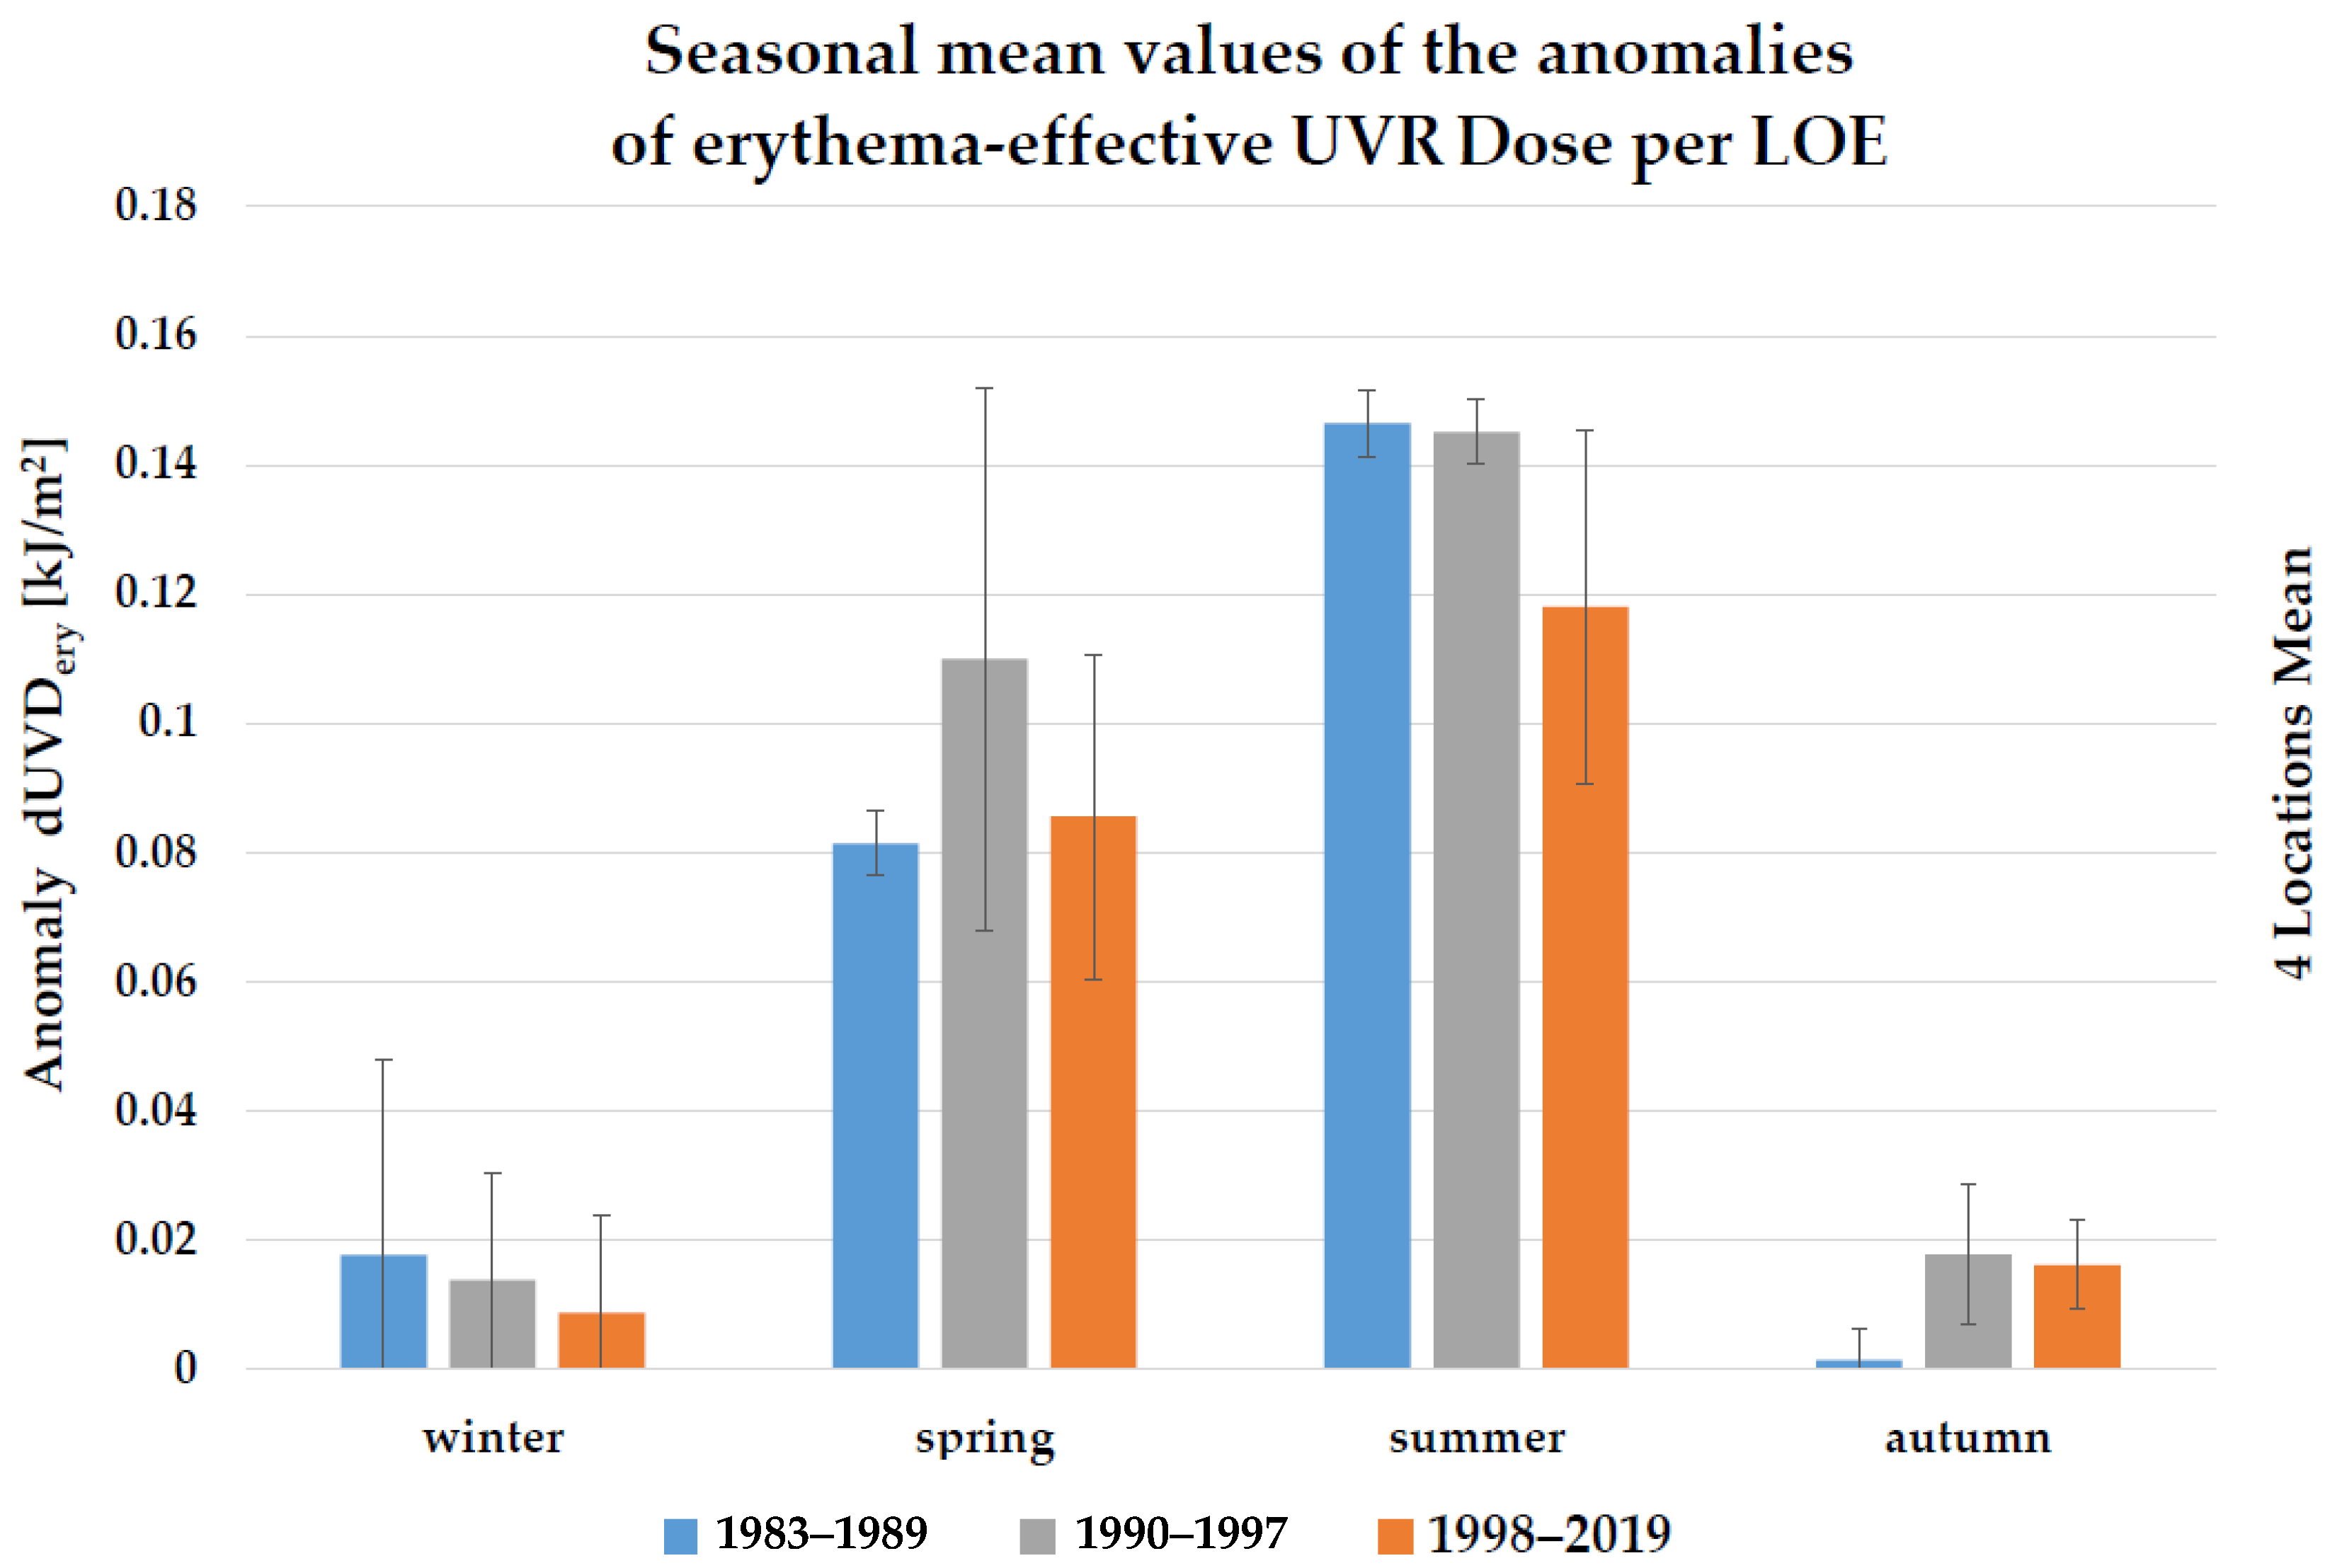
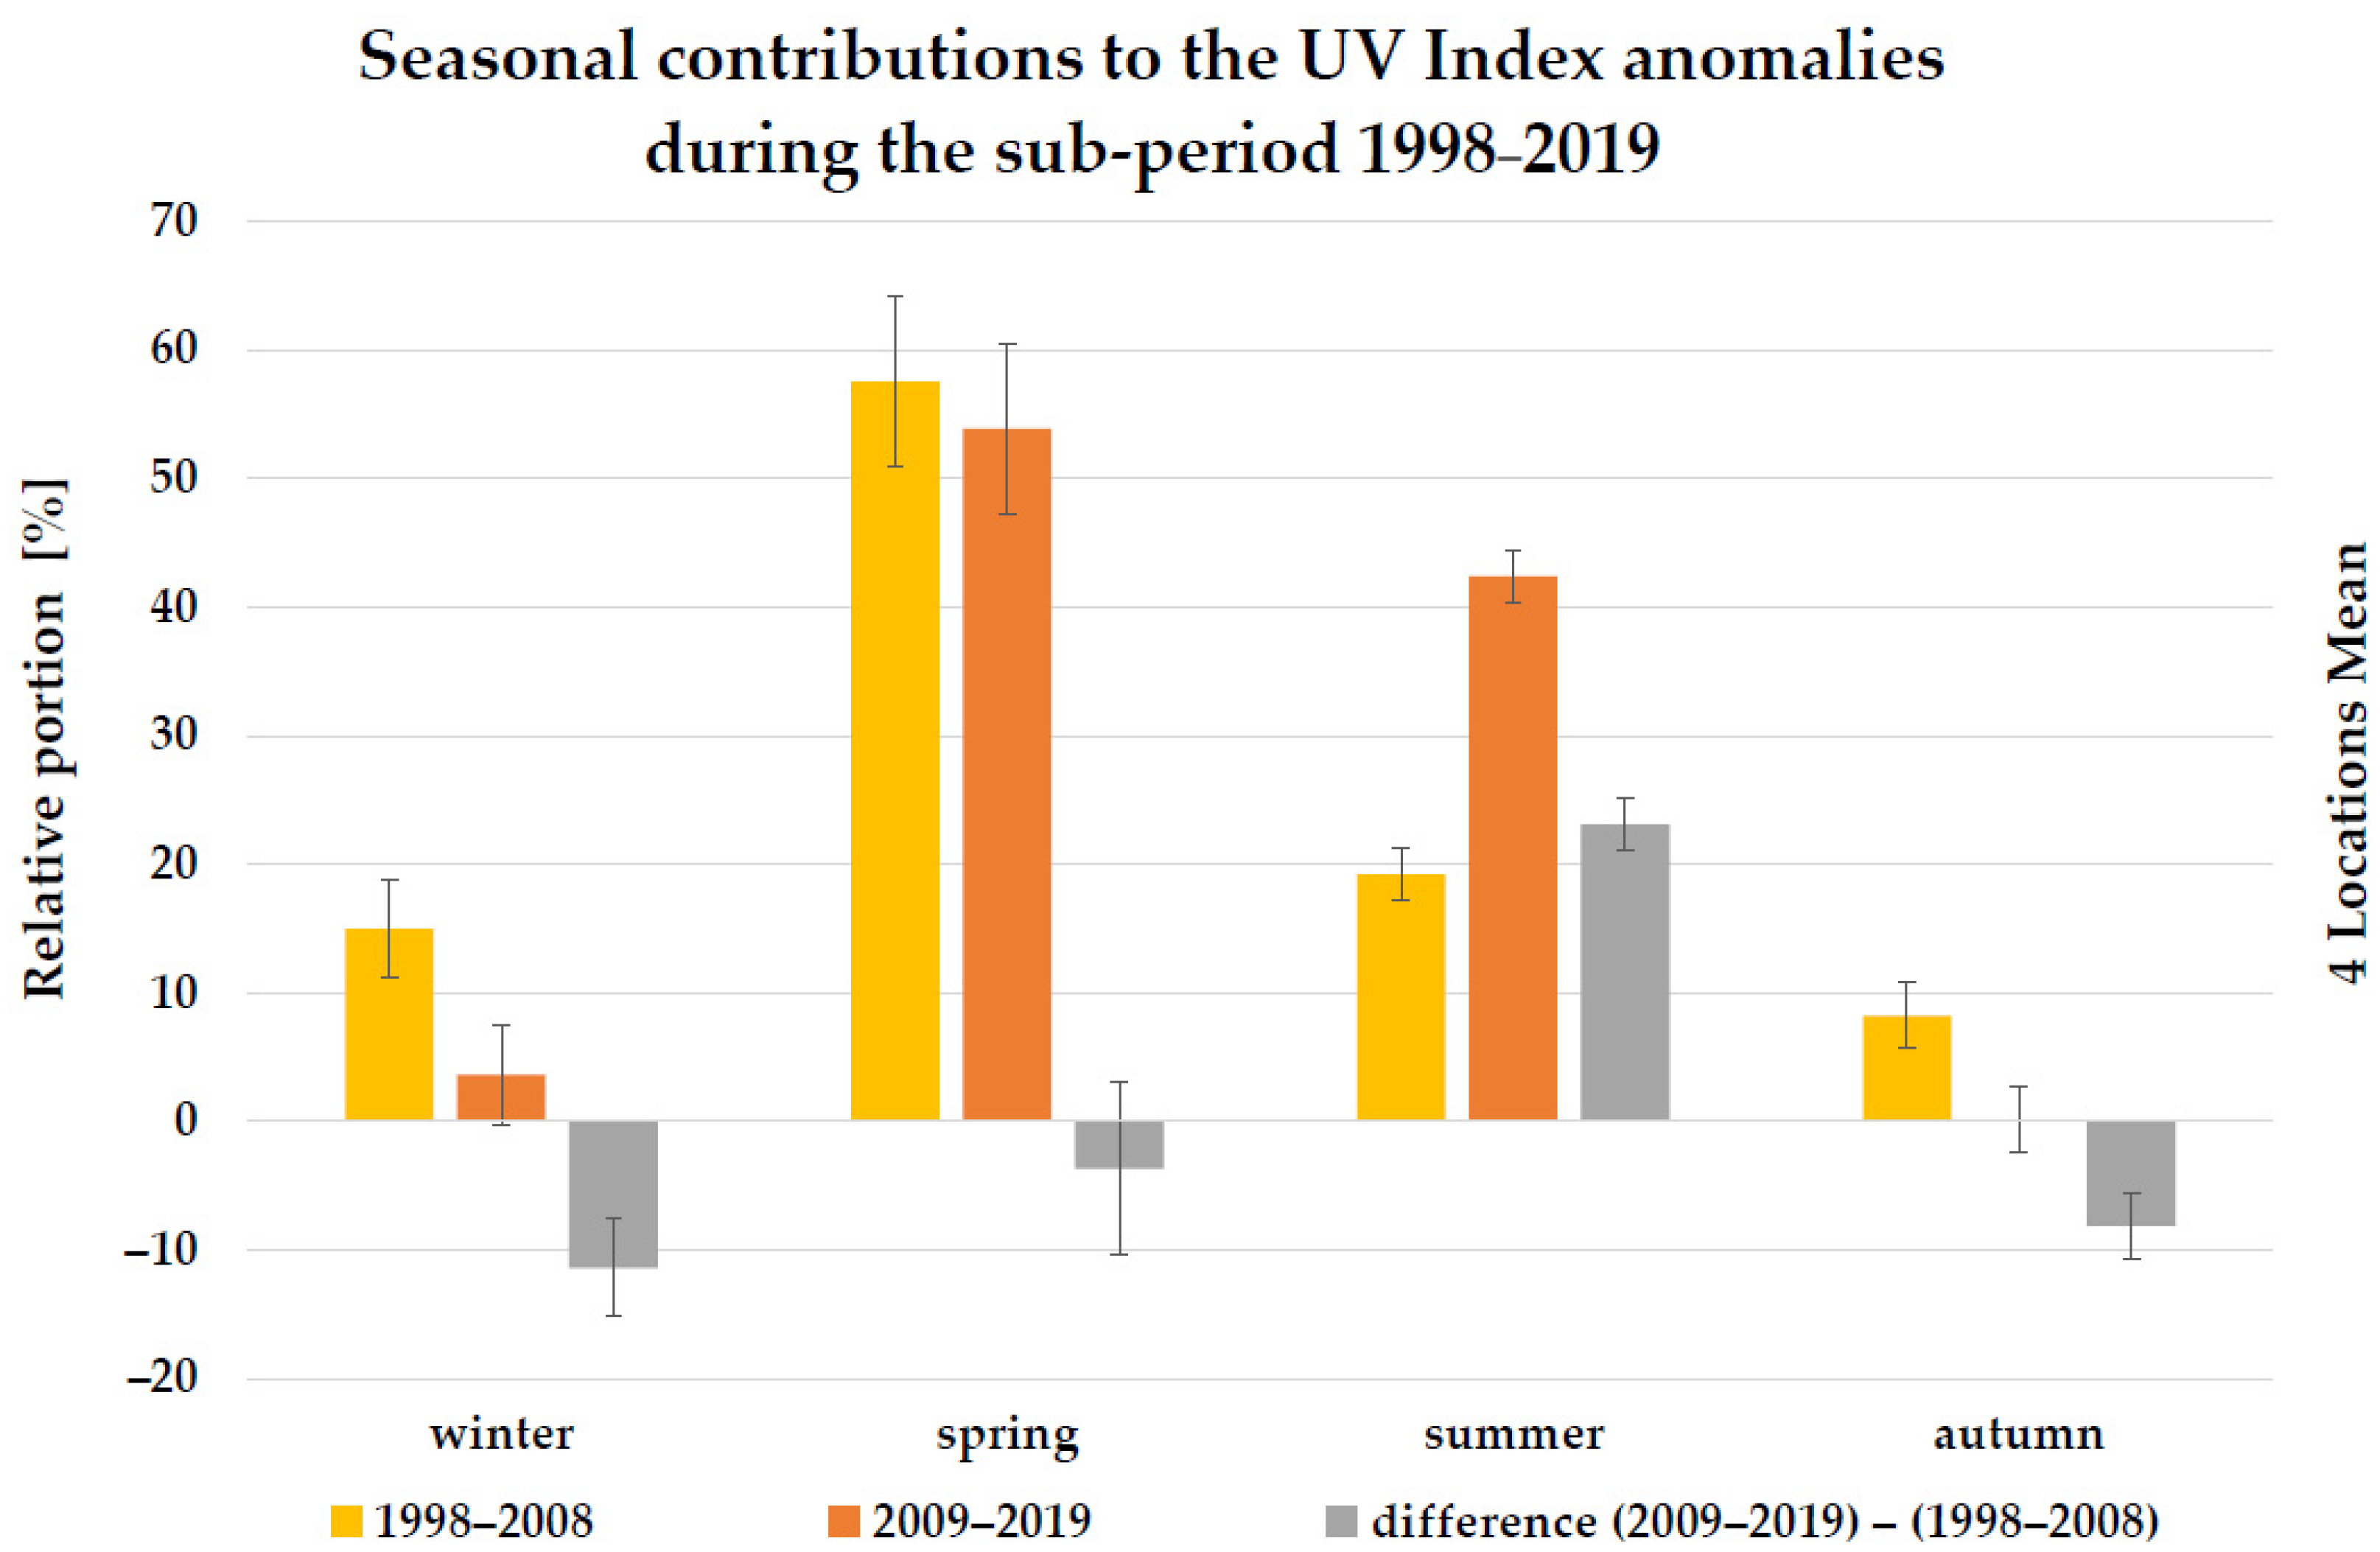
3.2. Anomalies of Erythema-Effective UV Irradiance and UVR Dose Associated with Low-Ozone Events

Figure 8 shows the monthly maxima of the positive anomalies of the erythema-effective UV irradiance associated with LOEs in the three subperiods. The mean values are calculated from the number of locations affected, i.e., four locations at most, but fewer locations if only some of them are affected.
The largest mean maximum of the anomaly of the erythema-effective UV irradiance associated with LOEs is noted in June: 45 mW/m2 UV irradiance (equivalent to 1.8 UV index) in the most recent subperiod, T3. Mean maxima of the anomaly of the erythema-effective UV irradiance, which exceed 12.5 mW/m2 (or 0.5 UV index), occur between February and August (in relation to the entire period 1983–2019, not necessarily in all subperiods). With mean maxima of the anomaly, which exceed 1 UV index or 25 mW/m2 erythema-effective UV irradiance, this is the case between April and June. UVR anomalies greater than 1.5 UV index or 35.7 mW/m2 erythema-effective UV irradiance are only detected in June. As expected, the mean maxima of the anomaly of the erythema-effective UV irradiance largely follow the position of the sun, with increasing values as the sun elevation increases. Due to the satellite data used, the other differences are to be assigned to the influences of cloud cover and the individual extend of the TCO anomalies. Long-term changes in the aerosol optical thickness are not represented with this database.
For an assessment of the health relevance of LOEs, in addition to the maximum anomalies of the erythema-effective UV irradiance, it is also of interest how they affect the corresponding annual dose. Figure 9 shows the mean annual sums of the anomalies of the erythema-effective UV dose associated with LOEs. In relation to the subperiods, there are mean annual anomalies of 0.15 ± 0.07 kJ/m2 during T1, 0.55 ± 0.21 kJ/m2 during T2 and 0.44 ± 0.30 kJ/m2 during T3. The mean annual anomalies of the erythema-effective UVR dose associated with LOEs in the most recent period, T3, is 20 percent below the mean annual anomalies during the 1990s, but the difference is within the range of the standard deviations. The variability (standard deviation) is highest in the period T3. The mean proportion of LOE-associated anomalies in UVR exposure is 0.09 percent, less than 1/1000 of the mean annual dose of erythema-effective UV irradiance during T3. The highest mean annual sum of the anomalies of the erythema-effective UVR dose occurred in 2016, which was 4.1 times the mean anomaly and reached 0.38 percent of the mean annual dose. For the most recent period, T3, there is no statistically significant trend across the evaluated locations.
Figure 10 shows the seasonal mean values of the anomalies of the erythema-effective UVR dose per event.
In relation to the seasons, the strongest mean anomaly of the erythema-effective UVR dose per event occurs in summer. It is 0.146 ± 0.005 kJ/m2 during T1, 0.145 ± 0.005 kJ/m2 during T2 and 0.118 ± 0.027 kJ/m2 during T3, i.e., during period T3 it is about 20 percent below that of the summer periods of T1 and T2, but the difference is within the range of the standard deviations. In spring, the mean anomaly of the erythema-effective UVR dose per event during the period T3 shows a size comparable to the values of the period T1. It is about 23 percent below the value of the spring periods of T2 and about 28 percent below the value of the summer periods of T3, but all differences are within the range of the standard deviations. During the spring and summer periods of T3, the anomaly of the erythemal UVR dose per event is about 5% of the mean seasonal daily erythema UVR dose, which is 1.58 ± 0.30 kJ/m2 in spring and 2.58 ± 0.16 kJ/m2 in summer.
The seasonal contributions to the UV index anomalies during T3 and changes between the 1998–2008 and 2009–2019 half-periods of T3 are shown in Figure 11. Spring contributes the strongest proportions of UV index anomalies during period T3 (54 ± 7% to 58 ± 7%), followed by summer (19 ± 2% to 42 ± 2%). The changes between the two 11-year half-periods within T3 show a significantly increasing proportion of UV index anomalies in summer (+23 ± 2%), and smaller decreasing changes in proportions in winter (−11 ± 4%), autumn (−8 ± 3%) and spring (−4 ± 7%).

4. Discussion and Conclusions

In order to assess whether there is an increasing need for adaptation to associated human health risks, the long-term occurrence (1983–2019) of health-relevant LOEs and the associated, positive anomalies of erythema-effective UV irradiation were examined. Health-relevant LOEs were identified using improved time-dependent thresholds in relation to TCO and UVR, the calculation concept of which was adapted to the health aspect of the study. Three time periods were compared (T1: 1983–1989, T2: 1990–1997, T3: 1998–2019), defined according to the different characteristics of the frequency of occurrence of the LOEs (TCO). From the point of view of health protection, the frequency of occurrence of health-relevant LOEs, the associated positive anomalies in UVR doses and UVR peak exposures and the long-term changes in these parameters are of interest.
Both LOEs (TCO) and health-relevant LOEs are characterized by a rare occurrence with a pronounced annual variability. These events do not occur every year, but can occur at any season. During the 1990s (T2), the annual numbers reached the largest values of the entire study period (mean: LOEs (TCO) 5.2 ± 0.7, LOE 2.2 ± 0.4; maximum: LOEs (TCO) 11.3 ± 1, LOE 6.3 ± 1.4), which is in accordance with the highest concentrations of ozone-depleting substances in the atmosphere [59,60] and is also reflected in the general occurrence of days with large erythemal-effective UVR doses in other parts of Europe [69]. In the most recent period, T3, the annual number of LOEs (TCO) decreases by about −6% per year, and thus confirms a result from Austria about a decreasing number of LOEs (TCO) [48]. However, in the recent subperiod, T3, opposite trends are also observed: the number of LOEs is declining, but relative to the total number of LOEs (TCO), a larger proportion of health-relevant LOEs (characterized by positive near-surface anomalies of erythema-effective UV irradiation) occur. This is a plausible explanation for the fact that compared to the trend of the LOEs (TCO), the decline in the annual number of health-relevant LOEs is smaller, at −4.8% per year. Differences in the numbers of LOEs (TCO) and health-relevant LOEs result principally from the fact that the effect of significantly reduced TCO on the near-surface UVR can be masked, in particular by clouds and/or aerosols. While long-term changes in the optical thickness of aerosols are not represented with the analyzed satellite-based data for methodological reasons, the studied changes in the relative frequency of seasonal occurrence of LOEs suggest that the increasing proportion of health-relevant LOEs can be interpreted as consequence of a more frequent occurrence of clear-sky or sparsely cloudy weather conditions. A study also based on the evaluation of satellite data provides further indications of changes in cloud cover [17]. For some locations (Berlin and Munich match with the present study), the mean differences in the UV index for monthly decades (10 ± 1 days) from 2006–2015 are compared to 1983–1992, distinguishing between clear-sky and all-sky conditions. The periods differ somewhat from those considered here. An increase in UV index can be seen during the spring and early summer months. The increase in clear-sky UV index is associated with the changes in TCO, but the additional increase in all-sky UV index compared to clear-sky UV index indicates a further impact of reduced cloud cover during these months [17]. If weather conditions with reduced cloud cover occur more frequently, the probability of this also increases in relation to the rare LOEs evaluated.
The two different causes for the formation of LOEs may provide another possible explanation for the increasing proportion of health-relevant LOEs. In connection with the slow recovery of the ozone layer since the late 1990s [60], it can be assumed that the probability of the occurrence of LOEs of chemical origin is tending to decrease. In the present analysis, there are at least indications that support this assumption. The mean annual total of all LOEs was larger during the period of peak ozone depletion in the 1990s (T2) than in the subsequent period, T3. In addition, within period T3, a shift in the occurrence of the LOE-associated UV peak loads to summer was found. However, LOEs of chemical origin occur only in spring, while LOEs of dynamic origin occur at any time of year. Due to the association of the LOEs of dynamic origin with the occurrence of large anticyclones, they are often accompanied by a clear-sky or sparsely cloudy weather character in spring and summer in Germany. Consequently, the increasing proportion of health-relevant LOEs could also be interpreted as an indication of an increasing proportion of LOEs of dynamic origin in the total number of LOEs.
As the analysis shows, LOEs occur most frequently in spring. This is in principal agreement with a study from Austria [48], which also found the largest proportion in spring (note that this refers to 2-day eLOEs in relation to TCO in [52]). Within spring, a greater proportion of LOEs occur earlier in the year (in March rather than April) in subperiods T2 and T3 compared to T1. The occurrence of LOEs at this time of the year is of particular importance with regard to health effects, because at the end of winter, human skin is usually still unaccustomed to the sun and has not yet developed any or has only developed a little self-protection. Consequently, significantly increased erythema-effective UV irradiance can potentially be linked to increased health risks (such as sunburn and the long-term consequences) the earlier in spring they occur. However, it must be considered that there is no risk automatism (in the sense of “the earlier, the worse”) due to the dependence on the sun elevation. The daily maximum values of sun elevation increase in the course of spring (until the summer solstice is reached), so the risk is ultimately determined by the specific constellation, not least in relation to the prevailing thermal conditions, which also determine other influences such as the amount of clothing worn, and thus the exposed body surface.
Winter is the season with the second most frequent occurrence of LOEs. Despite the low sun elevation, there are health risks in terms of the possibility of reaching the MED for skin type II, especially with longer exposure times, such as can be assumed for people who work outdoors. In southern Germany, up to 4/5 of the winter LOEs are associated with a sunburn risk for this group of people for longer stays of more than 1.5 h. With the aim of uniform statements on health protection throughout Germany, it therefore seems appropriate to include the winter LOEs in the analysis of “health-relevant” LOEs. It must also be considered that the calculated data for the erythema-effective UV irradiance are related to a horizontal surface, whereas surfaces facing the sun almost vertically, such as parts of the face, receive up to 40% more UVR when the sun elevation is low [70].
The seasonal mean values of the anomalies of the erythema-effective UVR dose per event follow the sun elevation with the largest values in summer. They do not show any significant differences during the subperiods T1 to T3, which can be interpreted as an expression of the variability of the occurrence dates of the rather rare individual events. Due to the rare and very variable occurrence of LOEs, the average annual total of the LOE-associated positive anomalies of the erythema-effective UVR dose contributes little to the total annual UVR dose (about 1/1000), even though it can increase to a multiple of its average value in individual years. In general, outdoor workers are particularly exposed to UVR, and as a result of their frequent exposure in the course of their work, are also more likely to experience increased UVR from LOEs. As part of the GENESIS UV study on UVR exposure values in 250 occupations [71], it was determined that the annual UVR exposure of the various occupations range from around 50 SED to 650 SED (1 standard erythema dose (SED) amounts to 100 Jm−2 [72]). In addition to occupational exposure, there is leisure exposure, which averages 130 SED [14]. If the largest annual UVR dose anomaly due to LOEs during the entire analysis period 1983 to 2019 (of the year 2016) is proportionally transferred to the personal exposure in a very rough estimate, then according to the present analysis, additional LOE-related UVR doses of 0.7 ± 0.6 SED to 3.0 ± 2.5 SED result for the sum of occupational and average leisure time exposure.
Although in period T3 the annual number of LOEs is on average only about half as large as in period T2 and shows a negative trend, the annual sums of the anomalies of the erythema-effective UVR dose show neither a significant difference in the mean values of the two periods nor a trend. These results reflect the fact that the mean dose anomaly per event is larger during period T3 than during T2, which in turn is associated with the observed larger proportion of summer (comparing the half-periods of T3) to UVR peak exposure (UV index anomalies). Here again, opposing trends can be seen, which cancel each other out during T3 in their effect on the annual sums of the anomalies of the erythema-effective UVR dose.
With regard to necessary adaptation measures, the question of extrapolating the results also arises, i.e., of assessing future developments. Regarding springtime Arctic ozone depletion, the ozone layer is expected to recover by mid-century [60]. It is therefore reasonable to conclude that LOEs of chemical origin may become less frequent in the coming decades, but may still occur. In the case of the predominantly occurring LOEs of dynamic origin, there is still little evidence of further development. Because of the declining number of LOEs, simple extrapolations of the retrospective trends would suggest a decrease in UVR exposure. On the other hand, a further reduction in cloud cover and a more frequent occurrence of LOEs in summer could make an increase in UVR exposure more likely. Neither the net effect of the opposing trends nor the admissibility of the extrapolations can currently be reliably estimated. With regard to future individual UVR exposure and health risks, there are indications that changes in people’s behavior (e.g., the amount of clothing worn) must also be considered in connection with climate change [73].
Since it is important from a health protection perspective to avoid any form of sunburn, with regard to the question of adaptation measures, raising public awareness and using the existing tools for information on events with increased UVR and the necessary sun protection measures remain important tasks. In Germany, the existing UVR warning system (UVWS) of the Deutscher Wetterdienst specifically addresses situations with low TCO by issuing warnings in the event of expected exceptionally high daily maxima of erythema-effective UV irradiance (UV index) [74]. In addition to warnings of absolutely high values of UV index, which usually occur during the time around the summer solstice, the UVWS also includes seasonal LOEs in spring. The information on the increased UVR in such situations has been available since 2005. Related to climate change, existing national information systems in Germany were evaluated by the Federal Environment Agency from the point of view of public health [75]. This evaluation also provides insights into the acceptance and awareness of the UVWS, which was, however, evaluated as a unit together with the general, daily forecasts of the UV index. The results suggest a need for action at this point, especially with regard to suitable communication concepts and implementation of adaptation measures in order to reach those exposed and to ensure their consistent sun protection.
Overall, the present study confirms that LOEs pose health risks due to intermittent, pronounced positive UVR anomalies, and therefore require special attention and adaptation measures. Long-term changes with respect to the frequency of occurrence of health-relevant LOEs, the associated anomalies in UVR doses and UVR peak exposures can be identified, but to date there has been no evidence of an increasing health risk from LOEs in Germany. An assessment of future developments is subject to considerable uncertainty. There is a need for further research and development.

Author Contributions

Conceptualization, methodology and formal analysis, G.L.; investigation, G.L.; resources, G.L.; data curation, G.L. writing—original draft preparation, G.L.; writing—review and editing, G.L. and A.M.; visualization, G.L.; supervision, A.M. All authors have read and agreed to the published version of the manuscript.

Funding

This research received no external funding.

Data Availability Statement

The TCO data are available from the Tropospheric Emission Monitoring Internet Service, hosted by the Royal Netherlands Meteorological Institute (temis.nl). The UVR data is available from the author upon reasonable request.

Acknowledgments

The authors acknowledge the provision and free access of the TCO data by the Royal Netherlands Meteorological Institute and the multisensor reanalysis update supported by the European Copernicus service (C3S). The authors acknowledge the work of all colleagues contributed to the UVR climatology of the Deutscher Wetterdienst. Special thanks to the European Organisation for the Exploitation of Meteorological Satellites EUMETSAT and the CMSAF for providing free access to long-term datasets of various atmospheric satellite data products, which were used in the UVR climatology. The authors also acknowledge the topic-related discussions with experts from Bundesamt für Strahlenschutz, Fachbereich Optische Strahlung and Forschungszentrum Jülich GmbH, Institut für Energie- und Klimaforschung, Stratosphäre. The authors greatly appreciate the anonymous reviewer’s efforts and expertise in improving the quality of the manuscript.

Conflicts of Interest

The authors declare no conflict of interest.

References

  1. Norval, M.; Lucas, R.; Cullen, P.; de Gruijl, F.R.; Longstreth, J.; Takizawa, Y.; van der Leun, J.C. The human health effects of ozone depletion and interactions with climate change. Photochem. Photobiol. Sci. 2011, 10, 199–225. [Google Scholar] [CrossRef] [PubMed]
  2. Lucas, R.M.; Yazar, S.; Young, A.R.; Norval, M.; de Gruijl, F.R.; Takizawa, Y.; Rhodes, L.E.; Sinclair, C.A.; Neale, R.E. Human health in relation to exposure to solar ultraviolet radiation under changing stratospheric ozone and climate. Photochem. Photobiol. Sci. 2019, 18, 641–680. [Google Scholar] [CrossRef] [PubMed]
  3. Holick, M.F. Vitamin D deficiency. N. Engl. J. Med. 2007, 357, 266–281. [Google Scholar] [CrossRef]
  4. WHO World Health Organization. Global Solar UV Index: A Practical Guide. A Joint Recommendation of the World Health Organization, World Meteorological Organization, United Nations Environmental Programme, and the International Commission on Non-Ionizing Radiation Protection; World Health Organization: Geneva, Switzerland, 2002; ISBN 92-4-159007-6. [Google Scholar]
  5. Yam, Y.; Kwok, A. Ultraviolet light and ocular diseases. Int. Ophthalmol. 2014, 34, 383–400. [Google Scholar] [CrossRef] [PubMed]
  6. Feretis, E.; Theodorakopoulos, P.; Varotsos, C.; Efstathiou, M.; Tzanis, C.; Xirou, T.; Alexandridou, N.; Aggelou, M. On the plausible association between environmental conditions and human eye damage. Environ. Sci. Pollut. Res. 2002, 9, 163–165. [Google Scholar] [CrossRef]
  7. Armstrong, B.K.; Kricker, A.; English, R. Sun exposure and skin cancer. Australas. J. Dermatol. 1997, 38 (Suppl. S1), S1–S6. [Google Scholar] [CrossRef]
  8. Armstrong, B.K.; Kricker, A. The epidemiology of UV induced skin cancer. J. Photochem. Photobiol. B 2001, 63, 8–18. [Google Scholar] [CrossRef]
  9. Kricker, A.; Weber, M.; Sitas, F.; Banks, E.; Rahman, B.; Goumas, C.; Kabir, A.; Hodgkinson, V.S.; van Kemenade, C.H.; Waterboer, T.; et al. Early life UV and risk of basal and squamous cell carcinoma in New South Wales, Australia. Photochem. Photobiol. 2017, 93, 1483–1491. [Google Scholar] [CrossRef]
  10. Arnold, M.; de Vries, E.; Whiteman, D.C.; Jemal, A.; Bray, F.; Parkin, D.M.; Soerjomataram, I. Global burden of cutaneous melanoma attributable to ultraviolet radiation in 2012. Int. J. Cancer 2018, 143, 1305–1314. [Google Scholar] [CrossRef]
  11. Savoye, I.; Olsen, C.M.; Whiteman, D.C.; Bijon, A.; Wald, L.; Dartois, L.; Clavel-Chapelon, F.; Boutron-Ruault, M.C.; Kvaskoff, M. Patterns of Ultraviolet Radiation Exposure and Skin Cancer Risk: The E3N-SunExp Study. J. Epidemiol. 2018, 28, 27–33. [Google Scholar] [CrossRef]
  12. Geller, A.C.; Jablonski, N.G.; Pagoto, S.L.; Hay, J.L.; Hillhouse, J.; Buller, D.B.; Kenney, W.L.; Robinson, J.K.; Weller, R.B.; Moreno, M.A.; et al. Interdisciplinary perspectives on sun safety. JAMA Dermatol. 2018, 154, 88–92. [Google Scholar] [CrossRef] [PubMed]
  13. John, S.M.; Garbe, C.; French, L.E.; Takala, J.; Yared, W.; Cardone, A.; Gehring, R.; Spahn, A.; Stratigos, A. Improved protection of outdoor workers from solar ultraviolet radiation: Position statement. J. Eur. Acad. Dermatol. Venereol. 2021, 35, 1278–1284. [Google Scholar] [CrossRef] [PubMed]
  14. Leitlinienprogramm Onkologie (Deutsche Krebsgesellschaft, Deutsche Krebshilfe, AWMF): S3-Leitlinie Prävention von Hautkrebs, Langversion 2.0, 2021, AWMF Registernummer 032/052OL. Available online: https://www.leitlinienprogramm-onkologie.de/leitlinien/hautkrebs-praevention/ (accessed on 30 July 2021).
  15. Kahlenborn, W.; Porst, L.; Voß, A.; Fritsch, U.; Renner, K.; Zebisch, M.; Schauser, I. Klimawirkungs-und Risikoanalyse 2021 für Deutschland (KWRA 2021)/Umweltbundesamt, Fachgebiet I 1.6 KomPass. Available online: https://www.umweltbundesamt.de/publikationen/KWRA-Zusammenfassung (accessed on 7 September 2022).
  16. Bais, A.F.; Bernhard, G.; McKenzie, R.L.; Aucamp, P.J.; Young, P.J.; Ilyas, M.; Jöckel, P.; Deushi, M. Ozone-climate interactions and effects on solar ultraviolet radiation. Photochem. Photobiol. Sci. 2019, 18, 602–640. [Google Scholar] [CrossRef] [PubMed] [Green Version]
  17. Vitt, R.; Laschewski, G.; Bais, A.F.; Diémoz, H.; Fountoulakis, I.; Siani, A.M.; Matzarakis, A. UV-Index climatology for Europe based on satellite data. Atmosphere 2020, 11, 727. [Google Scholar] [CrossRef]
  18. Varotsos, C. Solar ultraviolet radiation and total ozone, as derived from satellite and ground-based instrumentation. Geophys. Res. Lett. 1994, 21, 1787–1790. [Google Scholar] [CrossRef]
  19. Ipiña, A.; López-Padilla, G.; Retama, A.; Piacentini, R.D.; Madronich, S. Ultraviolet radiation environment of a tropical megacity in transition: Mexico City 2000–2019. Environ. Sci. Technol. 2021, 55, 10946–10956. [Google Scholar] [CrossRef]
  20. Craig, S.; Earnshaw, C.H.; Virós, A. Ultraviolet light and melanoma. J. Pathol. 2018, 244, 578–585. [Google Scholar] [CrossRef] [Green Version]
  21. Conforti, C.; Zalaudek, I. Epidemiology and risk factors of melanoma: A review. Dermatol. Pract. Concept. 2021, 11 (Suppl. S1), e2021161S. [Google Scholar] [CrossRef]
  22. White, E.; Kirkpatrick, C.S.; Lee, J.A. Case-control study of malignant melanoma in Washington State. I. Constitutional factors and sun exposure. Am. J. Epidemiol. 1994, 139, 857–868. [Google Scholar] [CrossRef]
  23. Newman, P.A.; Lait, L.R.; Schoeberl, M.R. The morphology and meteorology of southern hemisphere spring total ozone mini-holes. Geophys. Res. Lett. 1988, 15, 923–926. [Google Scholar] [CrossRef]
  24. Siani, A.; Casale, G.R.; Galliani, A. Investigation on a low ozone episode at the end of November 2000 and its effect on ultraviolet radiation. Opt. Eng. 2002, 41, 3082–3089. [Google Scholar] [CrossRef]
  25. Manney, G.L.; Santee, M.L.; Rex, M.; Livesey, N.J.; Pitts, M.C.; Veefkind, P.; Nash, E.R.; Wohltmann, I.; Lehmann, R.; Froidevaux, L.; et al. Unprecedented Arctic ozone loss in 2011. Nature 2011, 478, 469–475. [Google Scholar] [CrossRef] [PubMed]
  26. Varotsos, C.A.; Cracknell, A.P.; Tzanis, C. The exceptional ozone depletion over the Arctic in January–March 2011. Remote Sens. Lett. 2012, 3, 343–352. [Google Scholar] [CrossRef]
  27. Pommereau, J.-P.; Goutail, F.; Pazmino, A.; Lefèvre, F.; Chipperfield, M.P.; Feng, W.; Van Roozendael, M.; Jepsen, N.; Hansen, G.; Kivi, R.; et al. Recent Arctic ozone depletion: Is there an impact of climate change? C. R. Geosci. 2018, 350, 347–353. [Google Scholar] [CrossRef]
  28. Wohltmann, I.; von der Gathen, P.; Lehmann, R.; Maturilli, M.; Deckelmann, H.; Manney, G.L.; Davies, J.; Tarasick, D.; Jepsen, N.; Kivi, R.; et al. Near-Complete Local Reduction of Arctic Stratospheric Ozone by Severe Chemical Loss in Spring 2020. Geophys. Res. Lett. 2020, 47, e2020GL089547. [Google Scholar] [CrossRef]
  29. Dameris, M.; Loyola, D.G.; Nützel, M.; Coldewey-Egbers, M.; Lerot, C.; Romahn, F.; van Roozendael, M. Record low ozone values over the Arctic in boreal spring 2020. Atmos. Chem. Phys. 2021, 21, 617–633. [Google Scholar] [CrossRef]
  30. Petkov, B.H.; Vitale, V.; Di Carlo, P.; Drofa, O.; Mastrangelo, D.; Smedley, A.R.D.; Diémoz, H.; Siani, A.M.; Fountoulakis, I.; Webb, A.R.; et al. An unprecedented Arctic ozone depletion event during spring 2020 and its impacts across Europe. J. Geophys. Res. Atmos. 2021, 128, e2022JD037581. [Google Scholar] [CrossRef]
  31. McCormack, J.P.; Hood, L.L. The frequency and size of ozone “mini-hole” events at northern midlatitudes in February. Geophys. Res. Lett. 1997, 24, 2647–2650. [Google Scholar] [CrossRef]
  32. James, P.M. A climatology of ozone mini-holes over the northern hemisphere. Int. J. Climatol. 1998, 18, 1287–1303. [Google Scholar] [CrossRef]
  33. Petzold, K. The role of dynamics in total ozone deviations from their long-term mean over the Northern Hemisphere. Ann. Geophys. 1999, 17, 231–241. [Google Scholar] [CrossRef]
  34. Bojkov, R.D.; Balis, D.S. Characteristics of episodes with extremely low ozone values in the northern middle latitudes 1957–2000. Ann. Geophys. 2001, 19, 797–807. [Google Scholar] [CrossRef] [Green Version]
  35. Hood, L.L.; Soukharev, B.E.; Fromm, M.; McCormack, J.P. Origin of extreme ozone minima at middle to high northern latitudes. J. Geophys. Res. 2001, 106, 20925–20940. [Google Scholar] [CrossRef] [Green Version]
  36. Krzyscin, J.W. Long-term changes in ozone mini-hole frequency over the Northern Hemisphere derived from ground-based measurements. Int. J. Climatol. 2002, 22, 1425–1439. [Google Scholar] [CrossRef]
  37. Brönnimann, S.; Hood, L.L. Frequency of low-ozone events over northwestern Europe in 1952–1963 and 1990–2000. Geophys. Res. Lett. 2003, 30, 2118. [Google Scholar] [CrossRef] [Green Version]
  38. Koch, G.; Wernli, H.; Schwierz, C.; Staehelin, J.; Peter, T. A composite study on the structure and formation of ozone miniholes and minihighs over central Europe. Geophys. Res. Lett. 2005, 32, L12810. [Google Scholar] [CrossRef]
  39. Iwao, K.; Hirooka, T. Dynamical quantifications of ozone minihole formation on both hemispheres. J. Geophys. Res. 2006, 111, D02104. [Google Scholar] [CrossRef]
  40. Anton, M.; Serrano, A.; Cancillo, M.L.; Garcia, J.A. Total ozone and solar erythemal irradiance in southwestern Spain: Day-to-day variability and extreme episodes. Geophys. Res. Lett. 2008, 35, L20804. [Google Scholar] [CrossRef]
  41. Patil, S.D.; Revadekar, J.V. Extremes in total ozone content over northern India. Int. J. Remote Sens. 2009, 30, 2389–2397. [Google Scholar] [CrossRef]
  42. Rieder, H.E.; Staehelin, J.; Maeder, J.A.; Peter, T.; Ribatet, M.; Davison, A.C.; Stuebi, R.; Weihs, P.; Holawe, F. Extreme events in total ozone over Arosa—Part 1: Application of extreme value theory. Atmos. Chem. Phys. 2010, 10, 10021–10031. [Google Scholar] [CrossRef] [Green Version]
  43. Rieder, H.E.; Staehelin, J.; Maeder, J.A.; Peter, T.; Ribatet, M.; Davison, A.C.; Stuebi, R.; Weihs, P.; Holawe, F. Extreme events in total ozone over Arosa—Part 2: Fingerprints of atmospheric dynamics and chemistry and effects on mean values and long-term changes. Atmos. Chem. Phys. 2010, 10, 10033–10045. [Google Scholar] [CrossRef]
  44. Rieder, H.E.; Jansco, L.M.; Di Rocco, S.; Staehelin, J.; Maeder, J.A.; Peter, T.; Ribatet, M.; Davison, A.C.; De Backer, H.; Koehler, U.; et al. Extreme events in total ozone over the Northern mid-latitudes: An analysis based on long-term data sets from five European ground-based stations. Tellus 2011, 63B, 860–874. [Google Scholar] [CrossRef]
  45. Rieder, H.E.; Frossard, L.; Ribatet, M.; Staehelin, J.; Maeder, J.A.; Di Rocco, S.; Davison, A.C.; Peter, T.; Weihs, P.; Holawe, F. On the relationship between total ozone and atmospheric dynamics and chemistry at mid-latitudes—Part 2: The effects of the El Nino/Southern Oscillation, volcanic eruptions and contributions of atmospheric dynamics and chemistry to long-term total ozone changes. Atmos. Chem. Phys. 2013, 13, 165–179. [Google Scholar] [CrossRef] [Green Version]
  46. Martinez-Lozano, J.; Utrillas, M.; Nunez, J.; Tamayo, J.; Marin, M.; Esteve, A.; Canada, J.; Moreno, J. Ozone mini-holes over Valencia (Spain) and their influence on the UV erythemal radiation. Int. J. Climatol. 2011, 31, 1554–1566. [Google Scholar] [CrossRef] [Green Version]
  47. Frossard, L.; Rieder, H.E.; Ribatet, M.; Staehelin, J.; Maeder, J.A.; Di Rocco, S.; Davison, A.C.; Peter, T. On the relationship between total ozone and atmospheric dynamics and chemistry at mid-latitudes–Part 1: Statistical models and spatial fingerprints of atmospheric dynamics and chemistry. Atmos. Chem. Phys. 2013, 13, 147–164. [Google Scholar] [CrossRef] [Green Version]
  48. Fitzka, M.; Hadzimustafic, J.; Simic, S. Total ozone and Umkehr observations at Hoher Sonnblick 1994–2011: Climatology and extreme events. J. Geophys. Res. Atmos. 2014, 119, 739–752. [Google Scholar] [CrossRef]
  49. Petkov, B.; Vitale, V.; Tomasi, C.; Siani, A.; Seckmeyer, G.; Webb, A.; Smedley, A.; Casale, G.; Werner, R.; Lanconelli, C.; et al. Response of the ozone column over Europe to the 2011 Arctic ozone depletion event according to groundbased observations and assessment of the consequent variations in surface UV irradiance. Atmos. Environ. 2014, 85, 169–178. [Google Scholar] [CrossRef]
  50. Petropavlovskikh, I.; Evans, R.; McConville, G.; Manney, G.L.; Rieder, H.E. The influence of the North Atlantic Oscillation and El Niño–Southern Oscillation on mean and extreme values of column ozone over the United States. Atmos. Chem. Phys. 2015, 15, 1585–1598. [Google Scholar] [CrossRef] [Green Version]
  51. Fragkos, K.; Bais, A.F.; Fountoulakis, I.; Balis, D.S.; Tourpali, K.; Meleti, C.; Zanis, P. Extreme total column ozone events and effects on UV solar radiation at Thessaloniki, Greece. Theor. Appl. Climatol. 2016, 126, 505–517. [Google Scholar] [CrossRef]
  52. Schwarz, M.; Baumgartner, D.J.; Pietsch, H.; Blumthaler, M.; Weihs, P.; Rieder, H.E. Influence of low ozone episodes on erythemal UV-b radiation in Austria. Theor. Appl. Climatol. 2018, 133, 319–329. [Google Scholar] [CrossRef] [Green Version]
  53. Chubarova, N.; Nezval, Y.; Sviridenkov, I.; Smirnov, A.; Slutsker, I. Smoke aerosol and its radiative effects during extreme fire event over Central Russia in summer 2010. Atmos. Meas. Tech. 2012, 5, 557–568. [Google Scholar] [CrossRef]
  54. Kelbch, A.; Wittlich, M.; Bott, A. Quantifying the effects of a low-ozone event and shallow stratocumulus clouds on ultraviolet erythemal radiation exposure. Int. J. Biometeorol. 2019, 63, 359–369. [Google Scholar] [CrossRef]
  55. Bernhard, G.H.; Fioletov, V.E.; Grooß, J.-U.; Ialongo, I.; Johnsen, B.; Lakkala, K.; Manney, G.L.; Müller, R.; Svendby, T. Record-breaking increases in Arctic solar ultraviolet radiation caused by exceptionally large ozone depletion in 2020. Geophys. Res. Lett. 2020, 47, e2020GL090844. [Google Scholar] [CrossRef] [PubMed]
  56. Van der A, R.J.; Allaart, M.A.F.; Eskes, H.J. Extended and refined multi sensor reanalysis of total ozone for the period 1970–2012. Atmos. Meas. Tech. 2015, 8, 3021–3035. [Google Scholar] [CrossRef] [Green Version]
  57. Van der A, R.J.; Allaart, M.A.F.; Eskes, H.J. Multi-Sensor Reanalysis (MSR) of Total Ozone, Version 2; Royal Netherlands Meteorological Institute (KNMI): De Bilt, The Netherlands, 2015. [Google Scholar] [CrossRef]
  58. Weber, M.; Coldewey-Egbers, M.; Fioletov, V.E.; Frith, S.M.; Wild, J.D.; Burrows, J.P.; Long, C.S.; Loyola, D. Total ozone trends from 1979 to 2016 derived from five merged observational datasets—The emergence into ozone recovery. Atmos. Chem. Phys. 2018, 18, 2097–2117. [Google Scholar] [CrossRef] [Green Version]
  59. Ozone Trend and Variability Results. Available online: www.dwd.de/EN/research/observing_atmosphere/composition_atmosphere/ozone/cont_nav/o3_trends.html (accessed on 7 September 2022).
  60. World Meteorological Organization. Executive Summary. Scientific Assessment of Ozone Depletion: 2022; GAW Report No. 278; WMO: Geneva, Switzerland, 2022; p. 56. [Google Scholar]
  61. Allaart, M.; Van Weele, M.; Fortuin, P.; Kelder, H. An Empirical model to predict the UV-index based on Solar Zenith Angle and Total Ozone. Meteorol. Appl. 2004, 11, 59–65. [Google Scholar] [CrossRef] [Green Version]
  62. Herman, J.R.; Celarier, E.A. Earth surface reflectivity climatology at 340–380 nm from TOMS data. J. Geophys. Res. 1997, 102, 28003–28011. [Google Scholar] [CrossRef]
  63. Badosa, J.; van Weele, M. Effects of Aerosols on UV Index; KNMI Scientific Report WR-2002-07; Royal Netherlands Meteorological Institute (KNMI): De Bilt, The Netherlands, 2002. [Google Scholar]
  64. den Outer, P.N.; Slaper, H.; Kaurola, J.; Lindfors, A.; Kazantzidis, A.; Bais, A.F.; Feister, U.; Junk, J.; Janouch, M.; Josefsson, W. Reconstructing of erythemal ultraviolet radiation levels in Europe for the past 4 decades. J. Geophys. Res. 2010, 115, D10102. [Google Scholar] [CrossRef]
  65. Fitzpatrick, T.B. The validity and practicality of sun-reactive skin types I through VI. Arch. Dermatol. 1988, 124, 869–871. [Google Scholar] [CrossRef]
  66. Antonov, D.; Hollunder, M.; Schliemann, S.; Elsner, P. Ultraviolet Exposure and Protection Behavior in the General Population: A Structured Interview Survey. Dermatology 2016, 232, 11–16. [Google Scholar] [CrossRef]
  67. International Commission on Non-Ionizing Radiation Protection. Protection of workers against ultraviolet radiation. Health Phys. 2010, 99, 66–87. [Google Scholar] [CrossRef] [Green Version]
  68. Lehmann, M. Untersuchungen zur Validität von Sonnenschutzempfehlungen für Tage mit Niedrigen UV-Index-Werten. Ph.D. Thesis, Friedrich-Alexander-Universität Erlangen-Nürnberg, Erlangen, Germany, 4 December 2019. [Google Scholar]
  69. Malinović-Milićević, S.; Radovanović, M.M.; Mijatović, Z.; Petrović, M.D. Reconstruction and variability of high daily erythemal ultraviolet doses and relationship with total ozone, cloud cover, and albedo in Novi Sad (Serbia). Int. J. Climatol. 2022, 42, 9088–9100. [Google Scholar] [CrossRef]
  70. McKenzie, R.L.; Paulin, K.J.; Kotkamp, M. Erythemal UV irradiances at Lauder, New Zealand: Relationship between horizontal and normal incidence. Photochem. Photobiol. 1997, 66, 683–689. [Google Scholar] [CrossRef] [PubMed]
  71. Wittlich, M.; Westerhausen, S.; Strehl, B.; Versteeg, H.; Stöppelmann, W. The GENESIS-UV study on ultraviolet radiation exposure levels in 250 occupations to foster epidemiological and legislative efforts to combat non-melanoma skin cancer. Br. J. Dermatol. 2023, ljac093. [Google Scholar] [CrossRef] [PubMed]
  72. Commission Internationale De L’Eclairage; World Meteorological Organization. Rationalizing Nomenclature for UV Doses and Effects on Humans; CIE: Vienna, Austria, 2014; Available online: http://cie.co.at/publications/rationalizing-nomenclature-uv-doses-and-effects-humans (accessed on 4 November 2022).
  73. Laschewski, G.; Matzarakis, A. Weather-Related Human Outdoor Behavior with Respect to Solar Ultraviolet Radiation Exposure in a Changing Climate. Atmosphere 2022, 13, 1183. [Google Scholar] [CrossRef]
  74. Hitze- und UV-Warnungen. Available online: www.dwd.de/DE/wetter/warnungen_aktuell/kriterien/uv_hitze_warnungen.html?nn=508722 (accessed on 7 September 2022).
  75. Capellaro, M.; Sturm, D. Evaluation of Information Systems Relevant to Climate Change and Health. Volume 1: Adaption to Climate Change: Evaluation of Existing National Information Systems (UV-Index, Heat Warning System, Airborne Pollen, Ozone Forecasts) from a Public Health Perspective—How to Reach Vulnerable Populations. Umw. Gesundh. 2015, 3, 1–139. [Google Scholar]
Figure 1. Map of Germany and position of the 4 locations included in the study.
Environments 10 00031 g001
Figure 2. Thresholds of the TCO for Sylt (yellow line), Berlin (blue line), Frankfurt (grey line), Munich (orange line) depending on the day of the year for a classification as LOE (TCO).
Environments 10 00031 g002
Figure 3. Mean annual number of LOEs (TCO) in the period 1971–2021 together with the 11-year moving average (blue line) and the linear trend of the subperiod 1998–2019 (orange dashed line), (4-location means and standard deviations).
Environments 10 00031 g003
Figure 4. Mean annual number of health-relevant LOEs in Germany in the period 1983–2019 together with the 11-year moving average (blue line), the linear trend of the subperiod 1998–2019 (purple dashed line) and the averages and standard deviations of the subperiods T1 (1983–1989), T2 (1990–1997), T3 (1998–2019) (orange dashed lines) (grey: 4-location means and standard deviations).
Environments 10 00031 g004
Figure 5. Mean annual proportion of days on which LOEs and anomalies of erythema-effective UV irradiation occur at the same time in relation to the number of days with LOEs due to anomalies of TCO, together with the averages and standard deviations of the subperiods T1 (1983–1989), T2 (1990–1997), T3 (1998–2019) (orange dashed lines) (grey: 4-location means and standard deviation).
Environments 10 00031 g005
Figure 6. Mean relative frequency of seasonal occurrence of LOEs during the subperiods T1 (1983–1989), T2 (1990–1997), T3 (1998–2019) and changes between subperiods (4-location means and standard deviations).
Environments 10 00031 g006
Figure 7. Mean cumulative relative frequency of monthly occurrence of LOEs during the subperiods T1 (1983–1990), T2 (1990–1997), T3 (1998–2019) (4-location means).
Environments 10 00031 g007
Figure 8. Monthly maxima of the positive anomalies of the erythema-effective UV irradiance and equivalent UV index associated with LOEs during the subperiods T1 (1983–1989), T2 (1990–1997), T3 (1998–2019) (means of affected locations from 4 locations and standard deviations).
Environments 10 00031 g008
Figure 9. Mean annual sums of the anomalies of the erythema-effective UVR dose associated with LOEs together with the linear trend of the subperiod 1998–2019 (purple dashed line) and the averages of the subperiods T1 (1983–1989), T2 (1990–1997), T3 (1998–2019) (orange dashed lines), (4-location means and standard deviations).
Environments 10 00031 g009
Figure 10. Seasonal mean values of the anomalies of the erythema-effective UVR dose per event during the subperiods T1 (1983–1990), T2 (1990–1997), T3 (1998–2019) (4-location means and standard deviations).
Environments 10 00031 g010
Figure 11. Seasonal contributions to the UV index anomalies during period T3 and changes between the 1998–2008 and 2009–2019 subperiods of T3 (4-location means and standard deviations).
Environments 10 00031 g011
Table 1. Mean proportions (1983 to 2019) of winter LOEs associated with health risks from prolonged UVR exposure in northern Germany (locations: Sylt and Berlin) and southern Germany (locations: Frankfurt and Munich). The term “health risk” is used for reaching the MED for skin type II [67]. The risk levels are given according to [68].
Health Risk in Case of Prolonged ExposureMedian of Daily Minimum Exposure Duration to Receive One MED 1Mean Proportion of LOEs in Winter in Northern GermanyMean Proportion of LOEs in Winter in Southern Germany
Negligible9.3 h33–38%0%
Existing but low3.3 h62–67%21–43%
Consideration necessary1.5 h0%57–79%
1 For skin type II [65,67,68].
Disclaimer/Publisher’s Note: The statements, opinions and data contained in all publications are solely those of the individual author(s) and contributor(s) and not of MDPI and/or the editor(s). MDPI and/or the editor(s) disclaim responsibility for any injury to people or property resulting from any ideas, methods, instructions or products referred to in the content.

