1. Introduction
Cities play critical roles in the economy, as 80% of the global gross domestic product (GDP) is produced in cities [
1]. Moreover, 55% of the population lived in urban areas in 2018, and this share is expected to increase to 68% by 2050 [
2]. Increasing urbanization will lead to expanding existing cities and constructing new ones, leading to a rise in the use of natural resources [
3]. In a business-as-usual scenario, the demand for raw materials in urban areas by 2050 will far exceed what the planet can sustainably provide [
3]. The production and use of materials can be linked to climate change, as the production and transport of materials can cause greenhouse gas emissions [
4]. Climate change can negatively impact human health, income, and key infrastructure in urban areas, putting a significant share of the population at risk [
5]. The fast metabolism of cities and the strong link between humans and the consumption of natural resources established by cities mean that urban areas have a critical role in the fight against climate change [
6]. The efficient use of natural resources is vital for a sustainable future, and many cities now include climate adaptation in their policies and planning, creating a demand for decision-support tools [
4,
5].
According to the United Nations International Resource Panel, the integration of an urban metabolism perspective introduces a way to study and understand major resource and energy flows [
3]. This knowledge can then be used to identify investments to help transition a city from a linear to a more resource-efficient metabolism. Urban metabolism takes a holistic approach to analyze the urban processes and flows that result in economic growth, waste, and energy production in cities [
7]. Urban metabolism research has seen significant advancements in recent years [
8] and is now particularly important as a tool to generate data for measuring and assessing the environmental impacts caused by cities [
9,
10]. The research in urban metabolism started with black box models, but has since developed into frameworks that go beyond the inputs and outputs of the region, detailing the inner workings of the system [
11].
The complete description of urban metabolism requires the quantification of anthropogenic and natural material inputs, the transformation of these inputs through urban processes, the addition of materials to stocks, and the output of waste beyond the urban system [
12]. Material flow analysis (MFA) methods have been used in urban metabolism work since the mid-1990s [
11]. MFA offers a useful framework for quantifying the flows in material-based urban metabolism studies [
12,
13,
14,
15]. Urban metabolism studies can cover a broad scope of issues, with studies going from the analysis of specific types of material flows to waste management [
16,
17,
18,
19,
20]. The variety of approaches, resolutions, and types of results have limited the comparability between urban metabolisms and studies. Moreover, the generation and management of information on the metabolism of cities have been limited, facing difficulties that have made comparing different regions or cities impossible [
21]. Hence, the development of consistent and replicable models to understand urban dynamics is a priority in the field of urban metabolism.
One of the most promising approaches to fill this gap consists of the use of the input-output analysis (IOA) framework, which was initially developed by Leontief and meant to be used in physical units [
22,
23]. Input-output tables (IOTs) provide a structure to quantify not only the input and output flows of a system, but also the exchanges of flows between the components of the system. Together with MFA, IOTs in physical units (PIOTs) can provide a formal structure to quantify the mass flows of the urban metabolism in a way that could make studies comparable.
However, the lack of physical data availability has limited the use of these tables in physical units, especially at the urban level. MFA and PIOTs have been integrated into an Urban Accounting Model that was applied to study two neighborhoods in Stockholm [
24]. The results demonstrated how such an integration of models could be used to capture intersectoral flows within the system, going beyond the input-output black box model. This work used a bottom-up approach, making the application of the method a more challenging task, and harder to ensure comparability between studies. A top-down approach involving the combination of MFA and PIOTs was described in work comparing the metabolism of four cities [
25]. In this work, the material flows are calculated by creating national PIOTs with MFA data and monetary IOTs, which are then scaled down to the urban level according to the local employment per sector and the population share. These results compared both the material and sectorial structure of the economy in physical units.
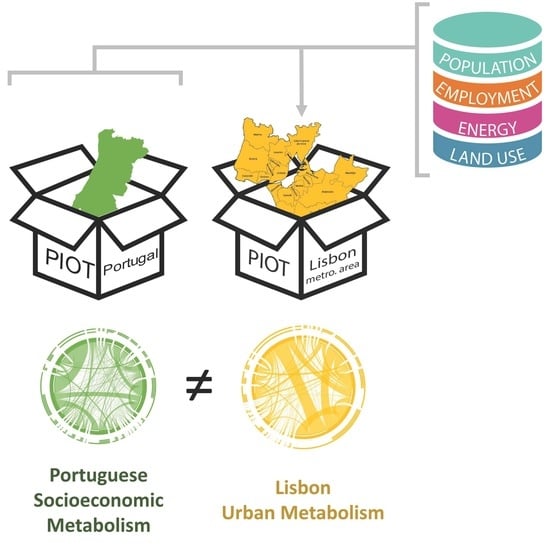
The purpose of this paper is to explore how a top-down model can be used to study how the urban metabolism of a city compares to the metabolism of the country, making use of officially available data and a set of methods for downscaling from the national to the regional level, that may be replicable in different geographies. We propose a method inspired by previous work to downscale national PIOTs and quantify the mass flows exchanged with and in an urban area by type of material. The results are compared with the national socioeconomic metabolism described by the national PIOT. This analysis shows how a city such as Lisbon contributes to the overall national metabolism and what may differ from the rest of the territory.
The second section of this paper describes how the urban PIOTs were calculated based on the existing PIOTs at the national level. The third section describes the case study regions, presents key demographic variables, and characterizes the economic sectors at the national and regional levels based on available data. The results are presented and discussed in the fourth section. The discussion includes the analysis of the material structure, the sectorial structure, the resource productivity, and the mass flows of the two regions. The last section summarizes the work and main findings.
2. Method
The metabolism of a region is characterized by the material flows that it exchanges with nature along its borders, but also by the internal flows established between the different economic sectors that constitute the local economy. The data required for this characterization is very scarce, and most national studies in physical units are based on the MFA method that focuses on indicators, such as domestic material input (DMI) or the physical trade balance (PTB), which is to say, with very low levels of granulometry, particularly in terms of economic sectors discrimination. While these can reveal some differences in the material structure of different countries or through time, they lack the necessary detail to describe the dynamics between the economic sectors or the actual material structure of the economic sectors. This is very relevant, as more detailed flows can, for example, give insight into the economic transitions of a country or how a country can decouple economic growth from resource use [
26].
Similarly, more detailed data describing the urban metabolism has the potential to decipher the urban flows and dynamics, the understanding of which is critical for sustainable development, given the role of urban areas for economic growth and resource use. The calculation of urban mass flows from national PIOTs has been previously used to compare the material structure of four cities [
25]. In this work, we have improved the initial work of Pina et al. (2016) to calculate urban PIOTs and produced a detailed urban metabolism characterization for the Lisbon metropolitan area.
2.1. Quantification of National PIOTs
While national monetary input-output tables (MIOTs) are now available for several years and economies [
27], the availability of equivalent physical tables is limited by the collected mass flow data. A methodology to calculate PIOTs from the existing MIOTs and official mass flow data has now been published and used to study structural changes in the socioeconomic metabolism [
26,
28].
The procedure for the calculation of the tables consists of two main steps. The first is the compilation of the existing physical data and its harmonization, so it can be introduced in the PIOTs as flows of materials associated with economic sectors. The second is the calculation of the unknown flows based on the mass balance principle, monetary flows, and informed assumptions. One of the assumptions relates to the quantification of emissions, as MFA does not typically account for air or water. Thus, balancing items are required to quantify the mass emissions related to fuel combustion. In this work, we do not introduce balancing items, and the emissions values only account for the mass of burned fuel and animal digestion, per the original publication of the PIOTs [
28].
The PIOTs calculated follow a three-dimensional structure, where each table describes the mass exchanges of each material, ensuring its correct mass balance. The materials considered can be found in
Table 1. The method proposes a nomenclature adapted from previous work to ensure mass balance for each material group [
28,
29].
The summation of all the tables (one for each of the seventeen materials) results in one final PIOT with the sectorial resolution of the MIOTs used in the calculations. The resulting tables cover the flows between 36 different economic sectors and enable the analysis of both material and economic flows, thus giving a complete description of the socioeconomic metabolism flows. This work presents the results using a nomenclature that can be found in
Table 2. The sectoral disaggregation presented ensures comparability with variables of less sectoral disaggregation and reduces the complexity of the representation of the results. The Portuguese PIOTs for 2017 were produced using the data sources suggested by Cunha and Ferrão (2021), except the MIOTs, which were gathered from the Portuguese statistics and followed a comparable structure [
30].
2.2. Quantification of Urban PIOTs
A previous method for downscaling national PIOTs to urban regions was based on the use of scaling factors and mass balance [
25]. The method used the share of workers in a metropolitan area out of the national total per economic sector for production and the percentage of the national population in the same area for final consumption. The imports and exports between the urban area and the rest of the country were calculated by ensuring the mass balance of the different flows. This balance means that, for example, if the demand that was scaled using the population ratio were higher than the supply of the urban area, then the demand for that sector would be satisfied by importing from other metropolitan areas. On the other hand, if the sector production, calculated using the share of workers, were larger than the demand, the excess would be exported to other national regions.
In this work, we leverage existing urban data and extend the previous scaling-down method by considering other scaling factors, depending on the sector or the type of material. The choice of the scaling factors was based on its relevance for the production of each sector. The general scaling factors were the population share, energy consumed per sector share, and workers per sector share. Different scaling factors were considered depending on the material for the agriculture sector (including emissions from animals). The fuel emissions were scaled using energy consumption, regardless of the sector. A summary of the type of scaling factors used can be found in
Table 3.
The share of the population living in the Lisbon metropolitan area was used to scale the final consumption, including non-profit institutions serving households and the general government [
31].
The energy consumption per sector for the country and the Lisbon metropolitan area was calculated by summing the tonnes of oil equivalent of the electricity, natural gas, and petroleum products consumption per sector for the respective region [
32]. The energy shares were used to scale the production of the manufacturing sectors to other sectors, as well as other outputs (waste, exports, gross fixed capital, and inventories), and inputs (domestic extraction and imports). The workers per economic sector out of the national workers per sector were similarly used to scale construction, services, and the non-biomass flows from agriculture. The workers per sector for the country and metropolitan area were collected from national statistics [
33].
The emissions from fossil fuels (FF1 and FF2) were always scaled using the share of energy consumption per sector. The agricultural biomass outputs (except for final consumption), domestic extraction, and imports were scaled using the ratio between the farmland area of the Lisbon metropolitan area and the national total.
Different scaling factors were used for the agricultural outputs (except final consumption), imports, and exports for biomass materials. For the agricultural biomass (BM1), the scaling factor was calculated based on 2013 land use data as the ratio between the agricultural land in the Lisbon metropolitan area and the total Portuguese agricultural area [
34]. For the BM1 scaling factor, fodder crop areas, kitchen gardens, and wooded areas were subtracted from the total. For the animal biomass (BM2), the scaling factor considered was the ratio between the number of animal heads in the Lisbon metropolitan area and Portugal [
35]. For the wood flows from agriculture, the scaling used was the wooded area values found in the land use data.
As the final consumption is calculated with a different scaling factor, the supply and demand must be balanced with flows from other urban areas. The tables were balanced for each material, as suggested in the original work [
25].
The appropriate use of the scaling factors to the national PIOTs tables results in the urban PIOTs that describe the main flows in the metropolitan area, except for crossing flows within the urban area. This method provides results describing the dynamics of the material flows of an urban area in a way that is replicable and can provide comparable results, not only between urban areas, but also between the national PIOTs and MIOTs. The model can be improved as more data becomes available at the regional level with sectorial disaggregation. The model would also benefit from material-specific scaling factors whenever relevant, similar to what is conducted for the agriculture sector.
3. Case Study
The case studies chosen were Portugal and a major metropolitan area: Lisbon.
Table 4 presents some demographic and economic data for the nation and Lisbon. The Lisbon metropolitan area has a high population density and a significant contribution to the total GDP. The values show that, while the Lisbon metropolitan area only accounts for 3% of the territory, 27% of the population resides there, resulting in a population density that is approximately nine times the national population density. Additionally, the Lisbon metropolitan area accounts for 36% of the national GDP and only 27% of the population, resulting in a regional GDP per capita above the national value.
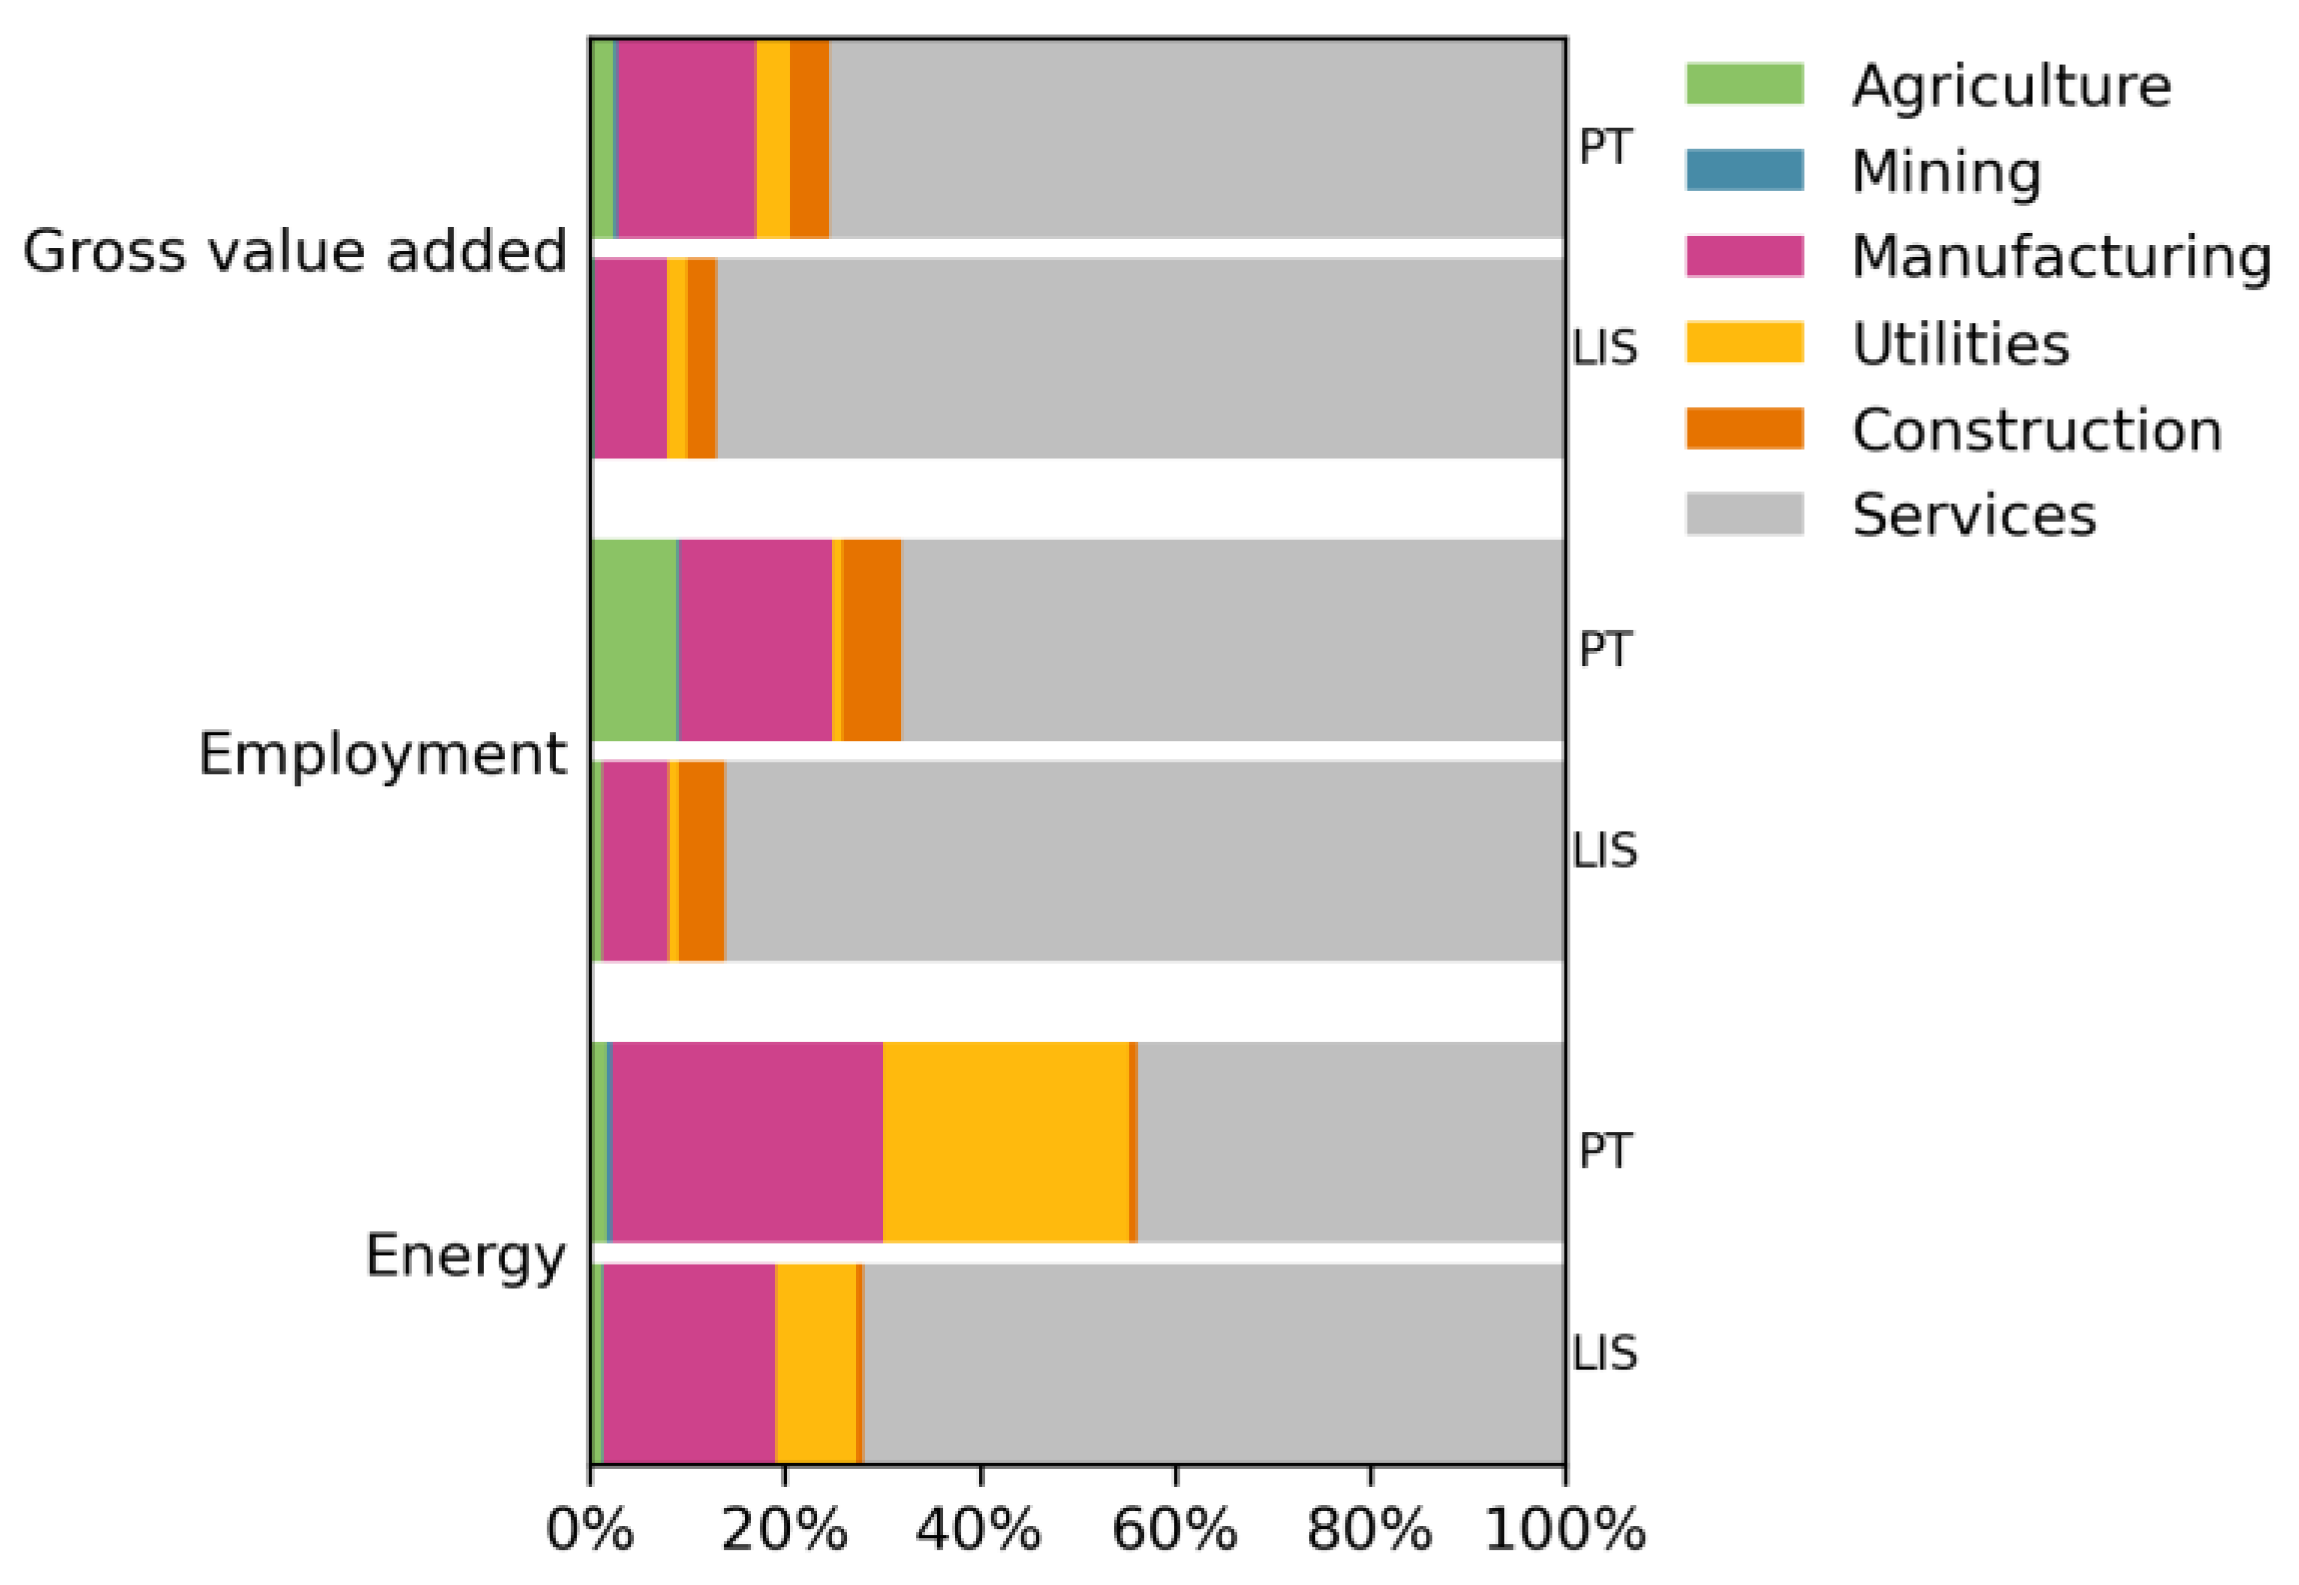
Figure 1 illustrates the distribution of gross value added, employment, and energy consumption per sector for Portugal (PT) and the Lisbon metropolitan area (LIS). The services sector has the highest contribution to GDP at the national (75%) and urban levels (87%). The contribution of services is higher in Lisbon, where the GDP/cap is also higher, as represented in
Figure 1. The Lisbon metropolitan area alone makes up 41% of the national GDP from services. In contrast, the manufacturing sectors account for 14% of the national GDP, while, in the Lisbon metropolitan area, the share of the total GDP is only 7%. The contribution of agriculture and mining to the GDP is also significantly smaller in Lisbon.
The employment breakdown shows a distribution similar to the gross value added. Services account for the largest shares of workers at both levels, but more so in the Lisbon metropolitan area (86%) than at the national level (68%). The shares of workers in agriculture and manufacturing are significantly lower in Lisbon, accounting for 1 and 7%, while the national distribution represents 9 and 16%, respectively. These values suggest that the services sector plays a significant role in the Lisbon metropolitan area, comparatively to the rest of the country, on average.
The distribution of energy consumption per economic sector represented in
Figure 1 shows that the services sector in Lisbon consumes a much larger share than the national average. The shares of the manufacturing industries for energy consumption are larger (28 % and 18% for Portugal and Lisbon) than for employment (16% and 13%, respectively) or GDP (14% and 7%). These values suggest that energy plays a more significant role in manufacturing than in services or agriculture compared with employment. The shares are also larger for utilities, but this was expected considering the link between energy consumption and electricity supply to final demand.
4. Results and Discussion
Previous studies have attempted to quantify the material consumption of Lisbon. A method based on detailed transport statistics that accounted for crossing flows obtained material consumption values in the range of 7.61 t/cap and 10.76 t/cap between 2003 and 2009 [
29]. A material input of 18.9 t/cap and local consumption of 17.1 t/cap were calculated using a methodology similar to the one applied here; the differences between which and the first work are discussed in the publication [
25].
Here, 17 mass flows for each of the 36 economic sectors for the regions analyzed were considered, and both domestic extraction and imports were considered for the material structure of Portugal. The imports and exports with other Portuguese regions were also considered for the Lisbon metropolitan area. The total material input for Portugal was 19 t/cap and 14 t/cap for the Lisbon metro area. The Lisbon area accounts for 27% of the Portuguese population and 20% of the material input, suggesting a difference in the material metabolism of Lisbon when compared with the Portuguese average.
The resource productivity of the regions, calculated as the ratio between the gross value added and the total material input, quantifies the resource productivity at 1.00 €/kg for Portugal and 1.74 €/kg for the Lisbon metropolitan area. While Lisbon has a higher GDP/cap, the material input per capita is lower. This difference could be related to efficiencies associated with the higher population density or the economic structure. The values from
Figure 1 suggest that services have a more predominant role in Lisbon than, on average, in Portugal.
4.1. The Material Structure of the Regions
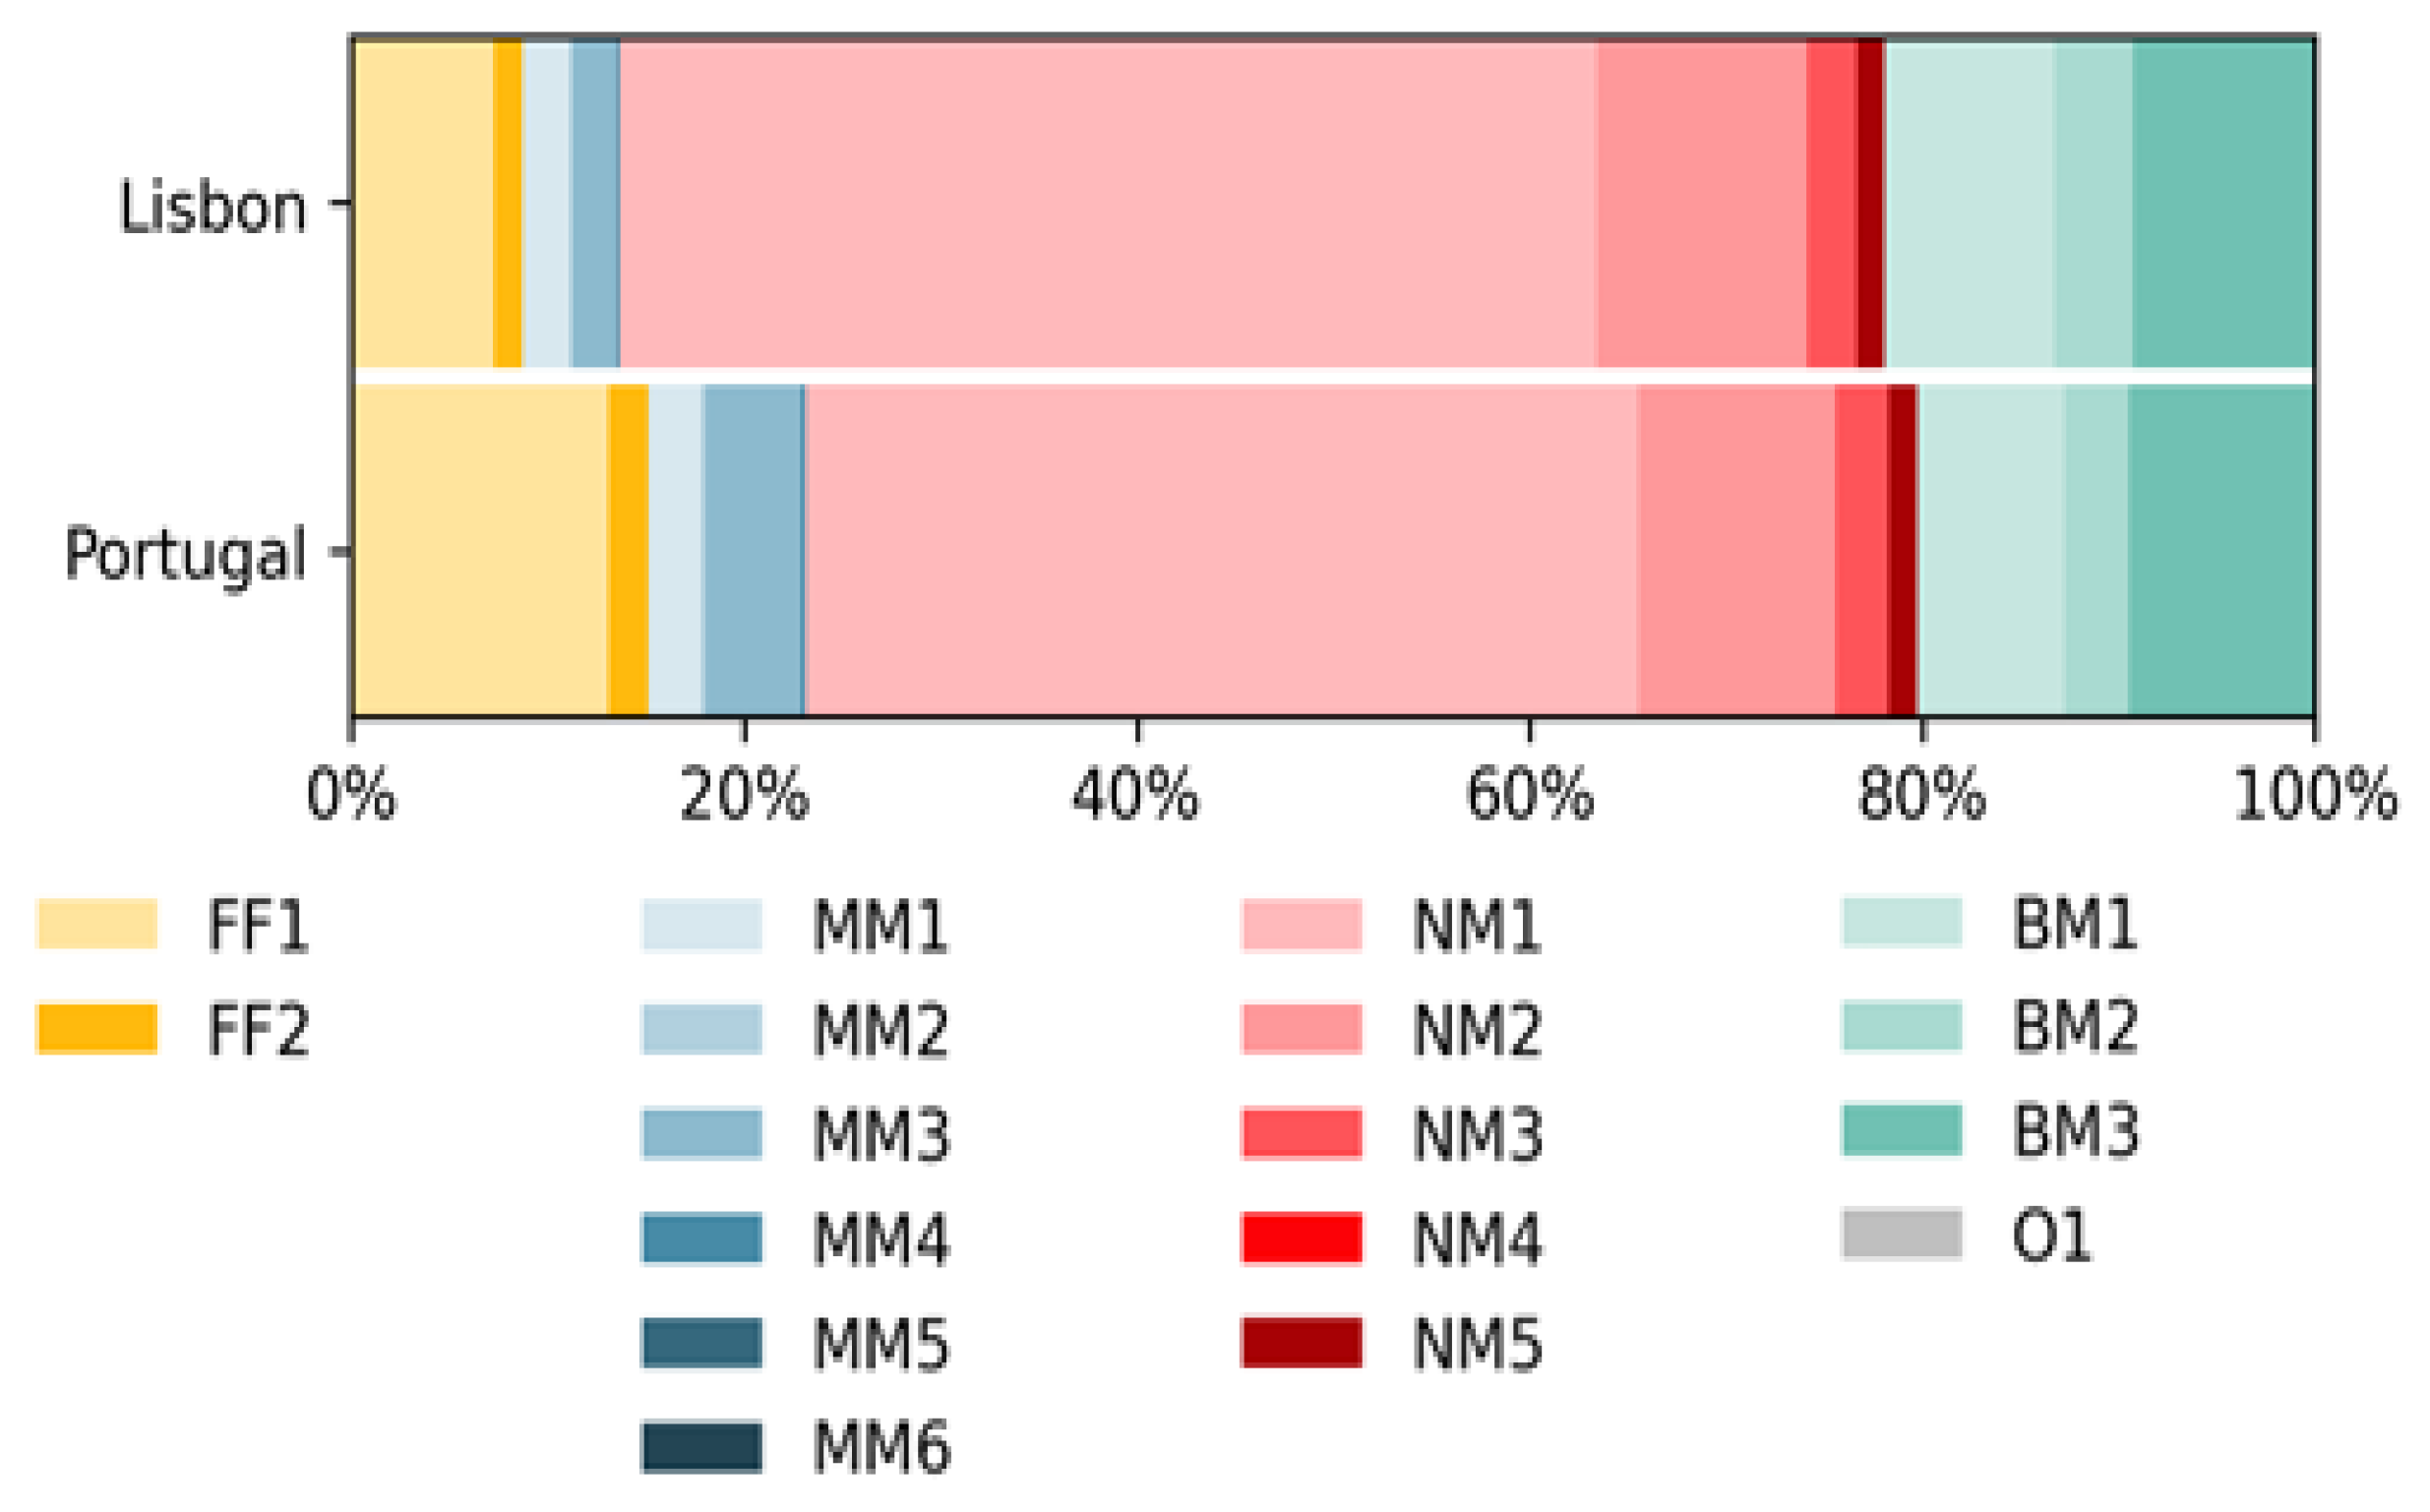
The distribution of the material inputs per type of material is represented in
Figure 2. Non-metallic minerals (NM) are the predominant materials in Portugal and Lisbon, followed by biomass (BM). The Lisbon metropolitan area accounts for 23% of the use of non-metallic minerals in the country and 22% of the total biomass, which is aligned with the share of the population living in the Lisbon metropolitan area (27%).
The main difference in the distribution of materials is observed in the use of non-metallic minerals, which is larger in Lisbon (64%) than in Portugal (57%). In contrast, the percentage of fossil fuels (FF) in Lisbon (9%) is smaller than in Portugal (15%). The share of metallic minerals in Lisbon (5%) is also smaller than for the whole country (8%). These differences in the shares of materials in the national and urban metabolism suggest that Lisbon may have a characteristic economic structure that is not fully aligned with the national economy. This hypothesis is coherent with the differences in the breakdown of the GDP, the workers, and energy, where services in Lisbon accounted for larger shares.
4.2. The Material Structure of the Economic Sectors
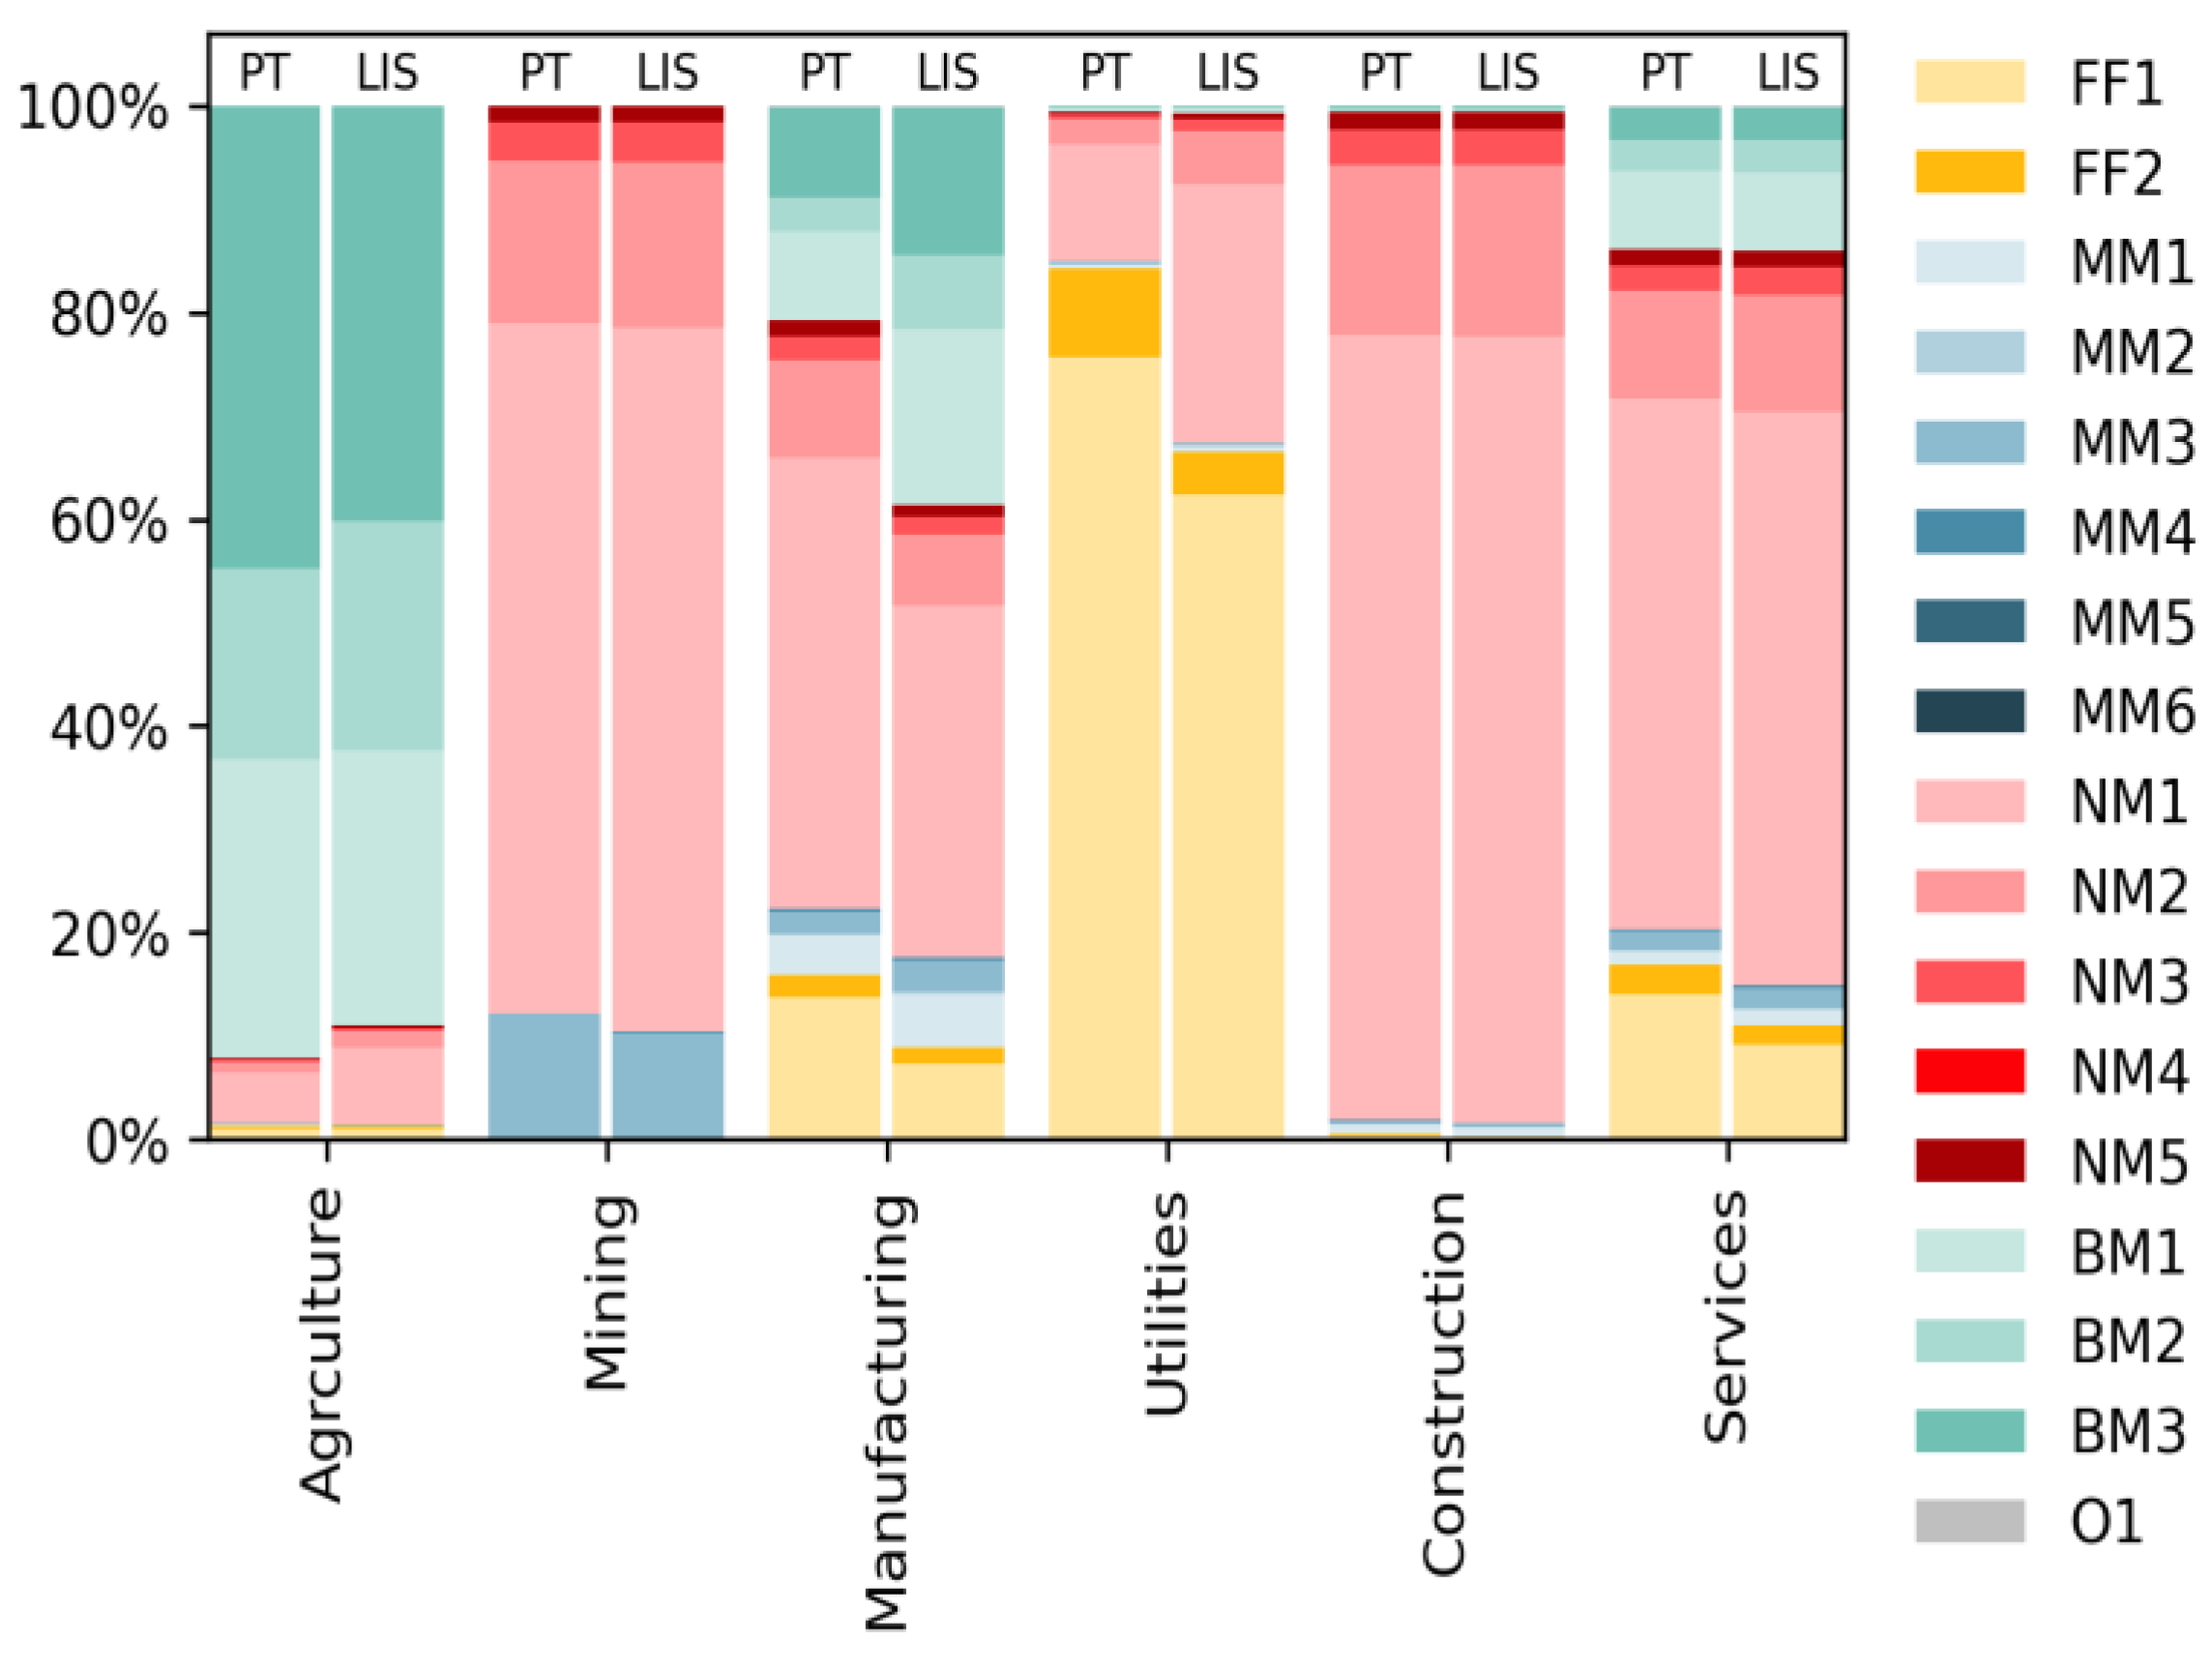
Two approaches can be considered when looking at the material structure of the economic sectors. One accounts for all materials that enter each economic sector, including acquisitions from other sectors, revealing the total shares of each material that each sector needs to produce its outputs. In this perspective, the material inputs of the sectors cannot be summed, as the same material can be processed and then sold to another economic sector, resulting in a double counting if all sectors are summed. The material distribution based on this approach is presented in
Figure 3 for the average Portuguese economic sector and the economic sectors in the Lisbon region.
The type of materials in the input of each sector show differences between the national values and the values for the Lisbon metropolitan area in three sectors. The manufacturing industries in Lisbon consume larger shares of biomass and metallic minerals, and smaller shares of non-metallic minerals and fossil fuels, which could result from the Lisbon metropolitan area having industries that do not represent the national socioeconomic metabolism. Services in Lisbon do also consume a larger share of non-metallic minerals and a smaller share of fossil fuels. Non-metallic materials are typically integrated into buildings and infrastructure, which could mean that Lisbon is developing relatively more infrastructure for services than the country, on average.
The other approach considers the distribution of the materials in the output of each sector in the economic outputs, which include final consumption, exports to other countries, inventories, fixed capital, waste, and emissions of each sector. From this perspective, one can observe the material structure that sustains society.
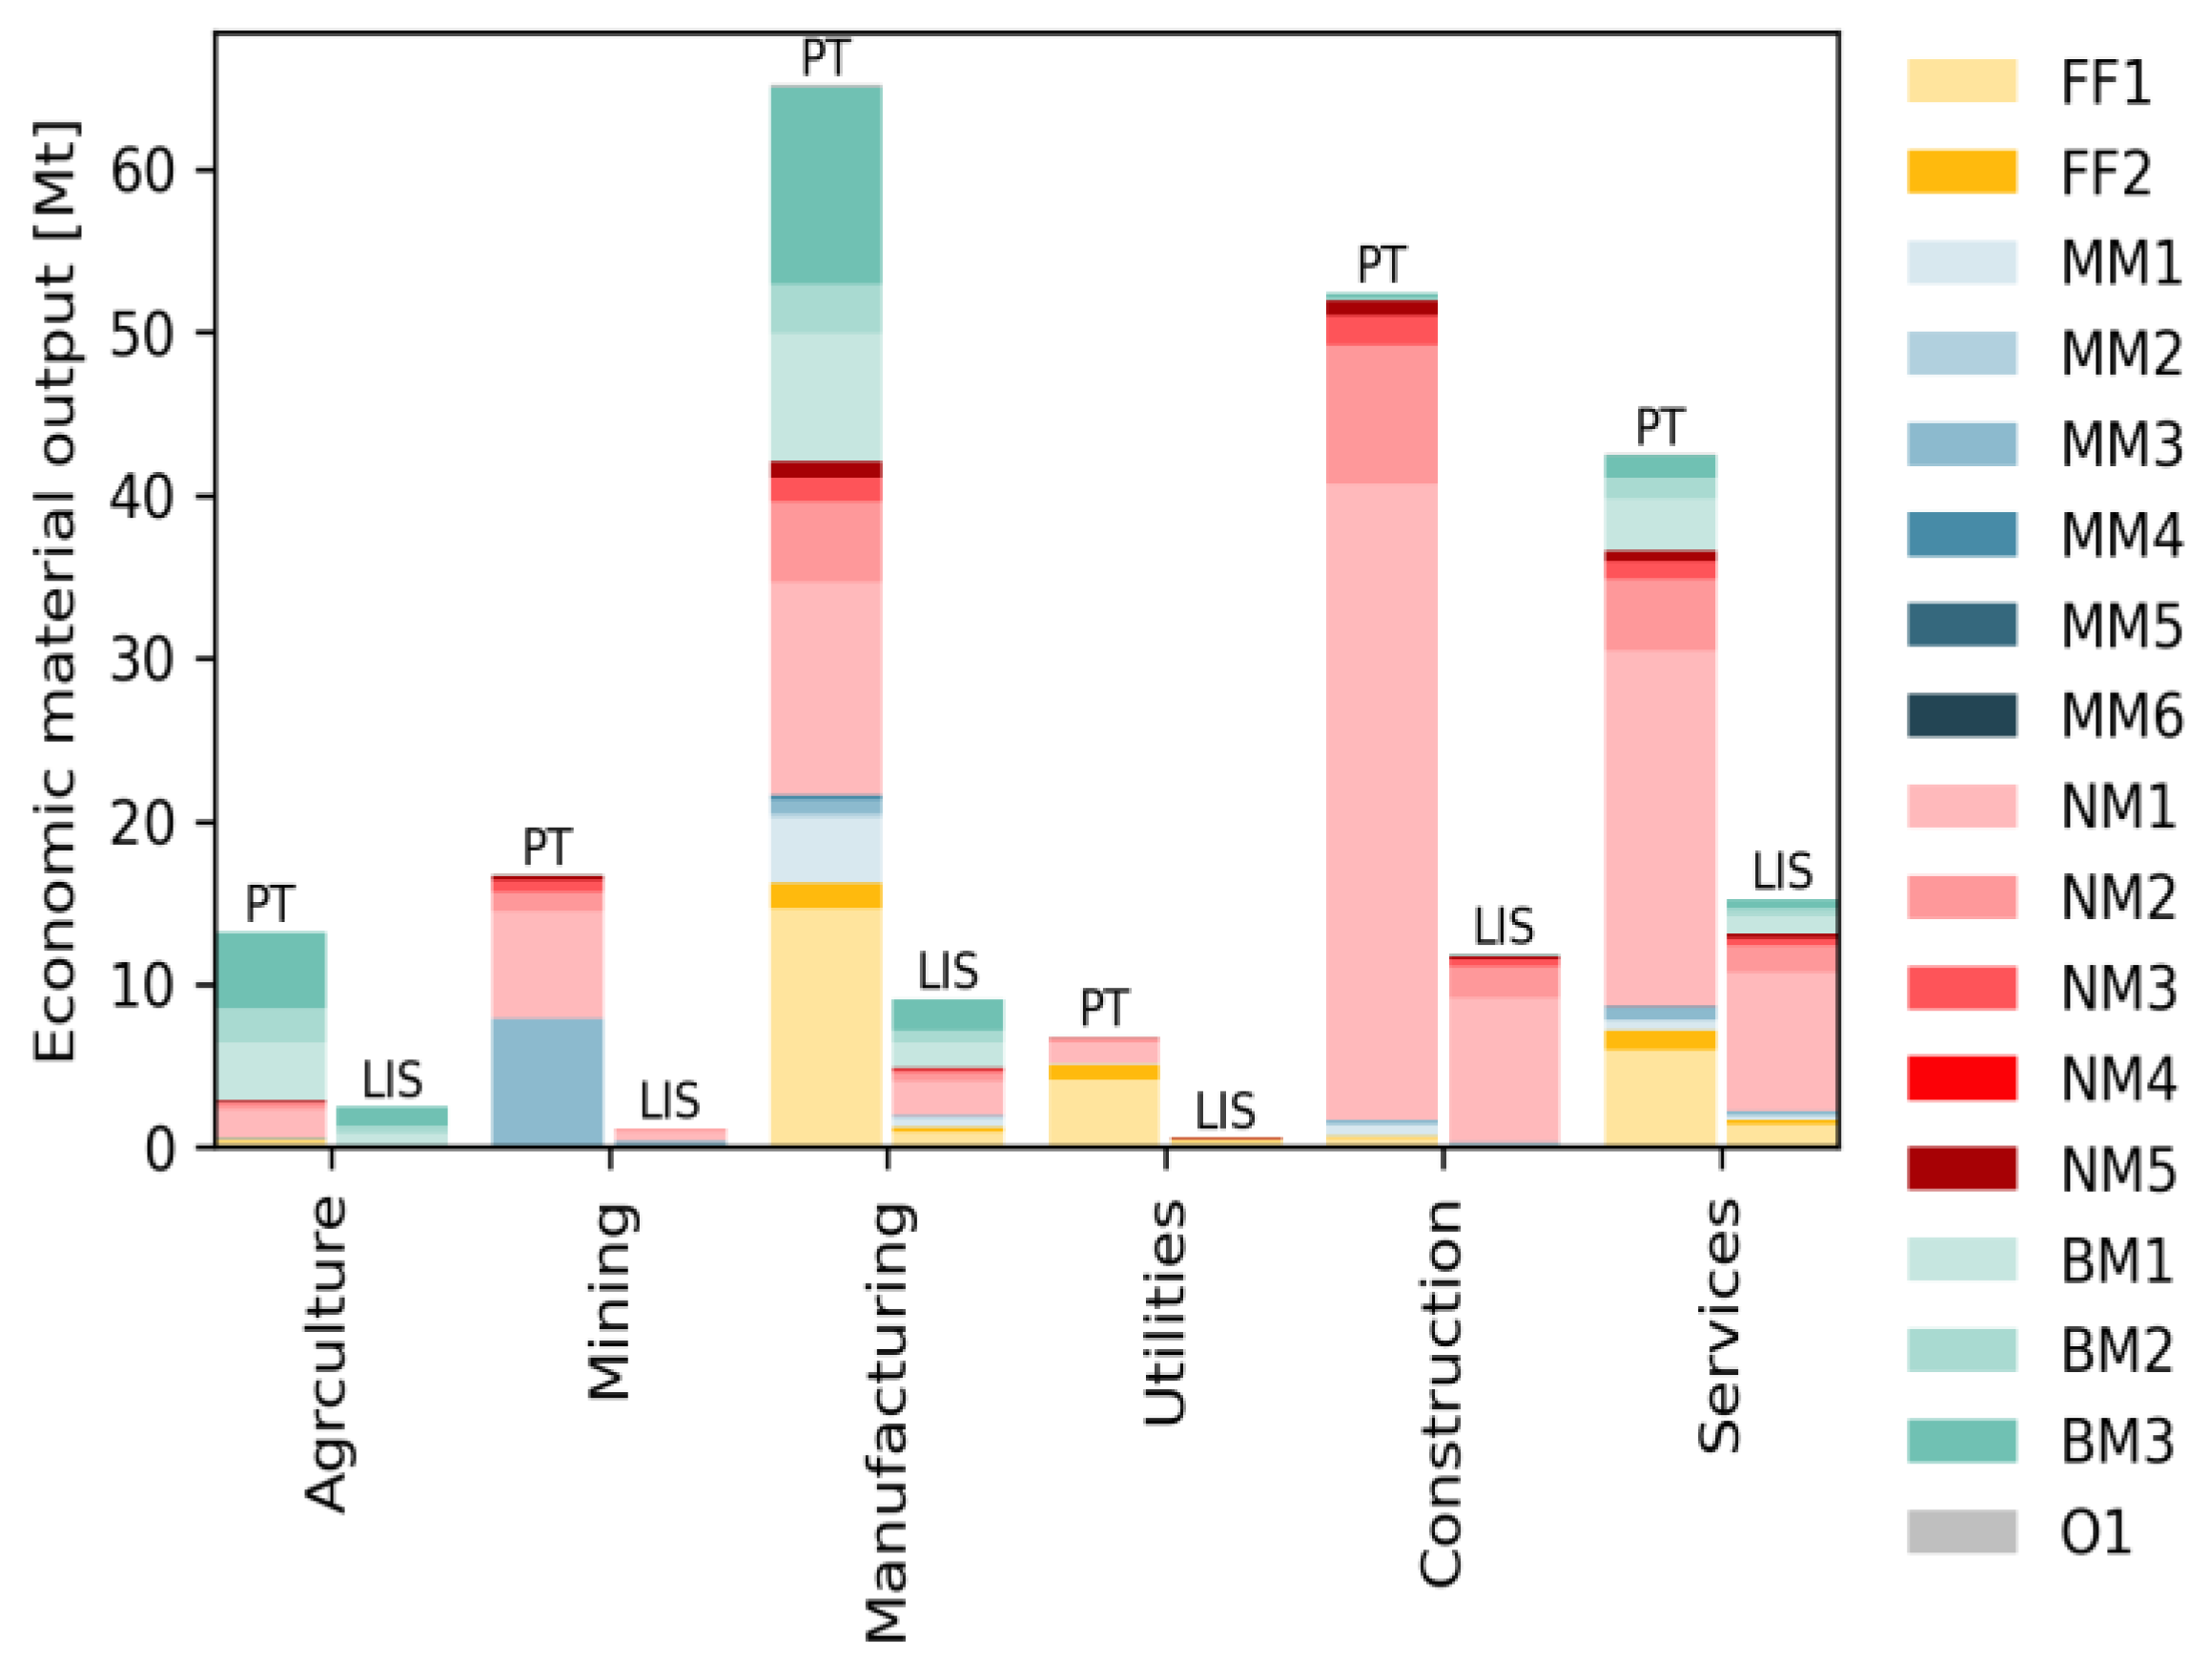
Figure 4 shows the total physical flows of economic output per sector disaggregated by material for Portugal and the Lisbon metropolitan area.
The results show that the services sector in Lisbon contributes to 36% of the national services material output and to 41% of the gross national value added from services. In contrast, Lisbon accounts for 19% of the output from the agricultural sector and only for 6% of the gross value added.
The output share from manufacturing out of all the sectors is smaller in Lisbon (23%) than in Portugal (33%). On the other hand, the output share of services is larger in Lisbon (38% against 22%). This share is a result consistent with the differences in the gross value added. The difference in the shares of gross value added per sector, which suggested that Lisbon would have a metabolism dissimilar to Portugal, is supported by a difference in the distribution of the physical output per sector.
As for the distribution of the types of materials in the outputs of the sectors, the values supporting
Figure 4 reveal some differences beyond what was observed in the input structure in
Figure 3. The outputs of the agriculture sector in Lisbon have lower shares of stone (including sand) (NM1) (3% against 13%) and a higher share of wood (BM3) (46% against 35%), which, for the case of agriculture, suggests that the agriculture sector in Lisbon is building less infrastructure than the average national sector. The mining outputs of Lisbon have a lower share of non-ferrous heavy metals (MM3) (37% against 46%), but a higher share of NM1 (47% against 40%). The manufacturing sector in Lisbon presented a larger share of biomass in the inputs, which is consistent with the outputs of the sector. The outputs of the sector in Lisbon have more biomass of any of the three types of biomass, with biomass (BM) making up 47% of the manufacturing outputs in Lisbon versus 35% for Portugal. The shares of materials in the construction sector outputs in Lisbon and Portugal are comparable. As for services, the share of non-metallic minerals is larger in Lisbon than on average for Portuguese services.
4.3. Resource Productivity
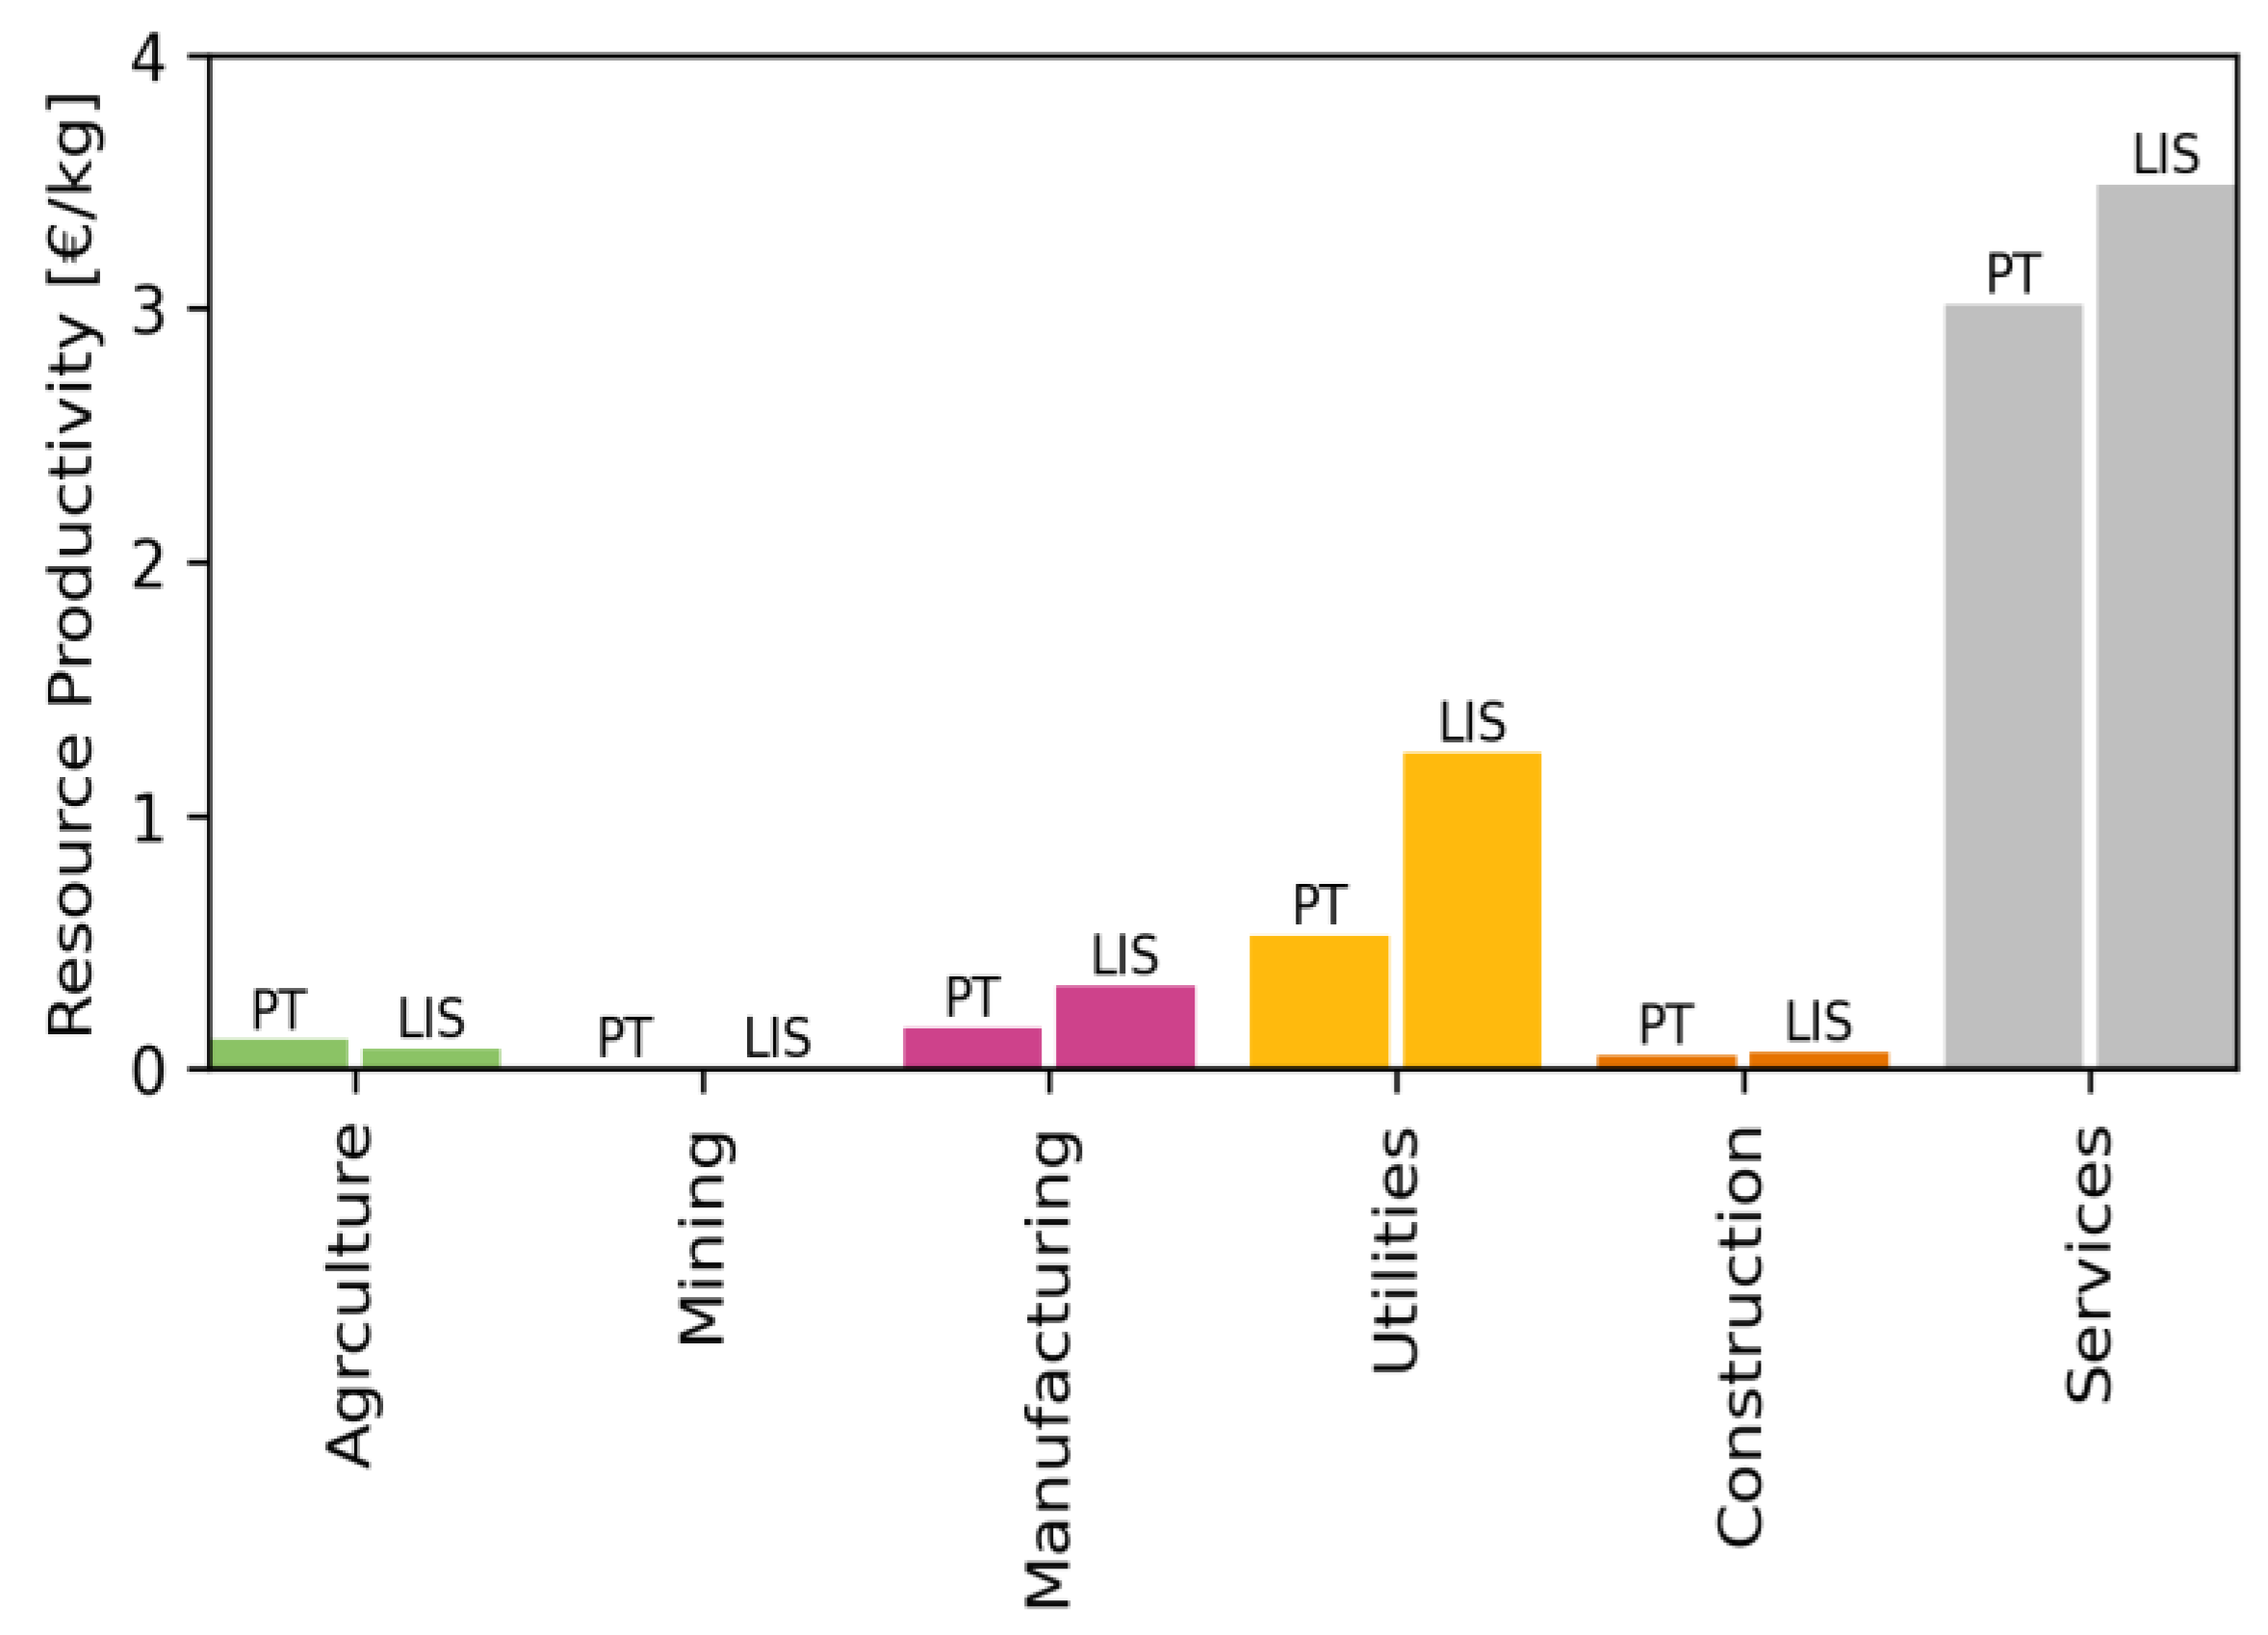
Lisbon presented significantly higher resource productivity than Portugal and differences in material structure. The resource productivity per sector is calculated by the ratio between the gross value added of the economic sector and the total material input of the sector. In most MFA studies, acquisitions from other economic sectors have not been calculated. However, that value is made available in the PIOTs calculated here, enabling the quantification of the resource productivity by sector. Resource productivity is related to the efficiency in using resources, where, for example, less waste may be associated with the same economic output.
Figure 5 presents the resource productivity by sector for the Lisbon metropolitan area and Portugal. Services have the highest resource productivity in Portugal (3.01 €/kg) and Lisbon (3.49 €/kg). Services, like most sectors, have a higher resource productivity in Lisbon than on average for Portugal. The resource productivity of the manufacturing sectors in Lisbon (0.32 €/kg) is more than double the national resource productivity of manufacturing industries (0.16 €/kg), which is consistent with the differences in the material structure of the sector. Only agriculture has a lower resource productivity in Lisbon (0.07 €/kg) than in Portugal (0.11 €/kg). The higher resource productivity of Lisbon is linked to most sectors having higher resource productivity. Additionally, the sector with the highest resource productivity has a larger contribution to Lisbon’s economy than the Portuguese economy on average.
4.4. PIOTs Mass Flows
Chord diagrams have proven useful in illustrating the flows quantified in the IOTs [
28]. These graphs represent the values in the matrix, facilitating its comprehension. However, the diagrams also do not represent crossflows in the same way the tables do not quantify them.
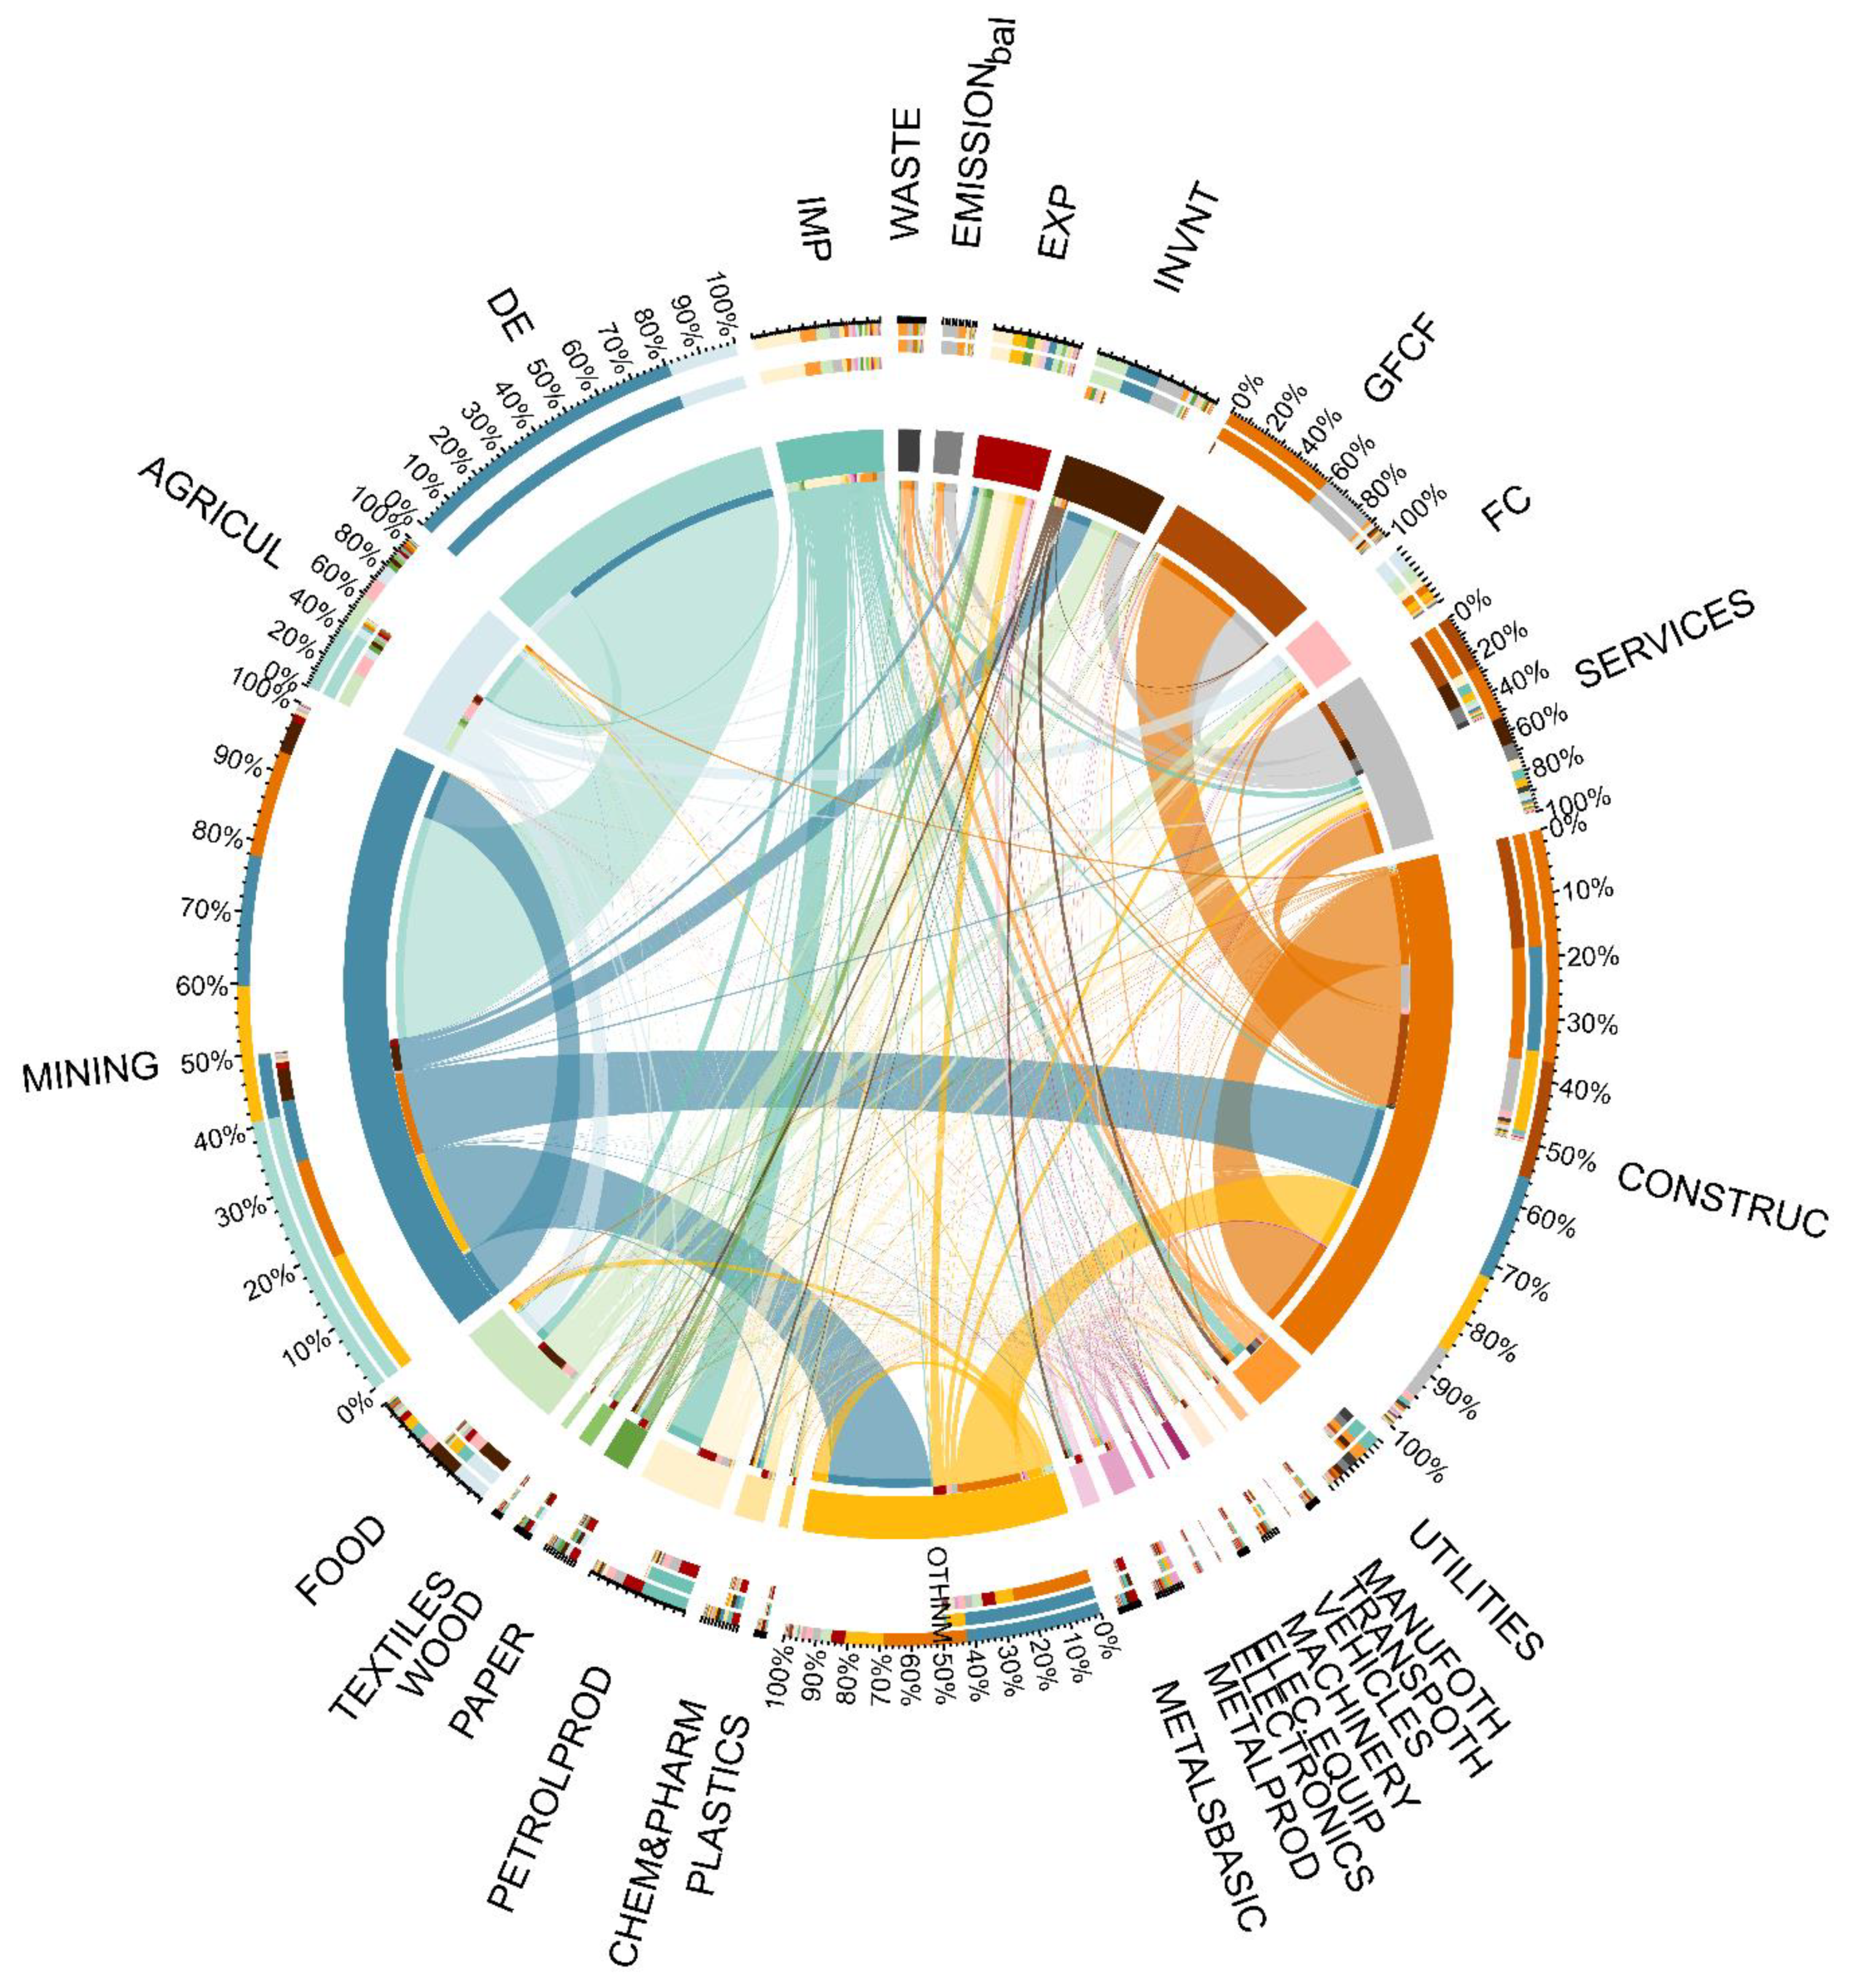
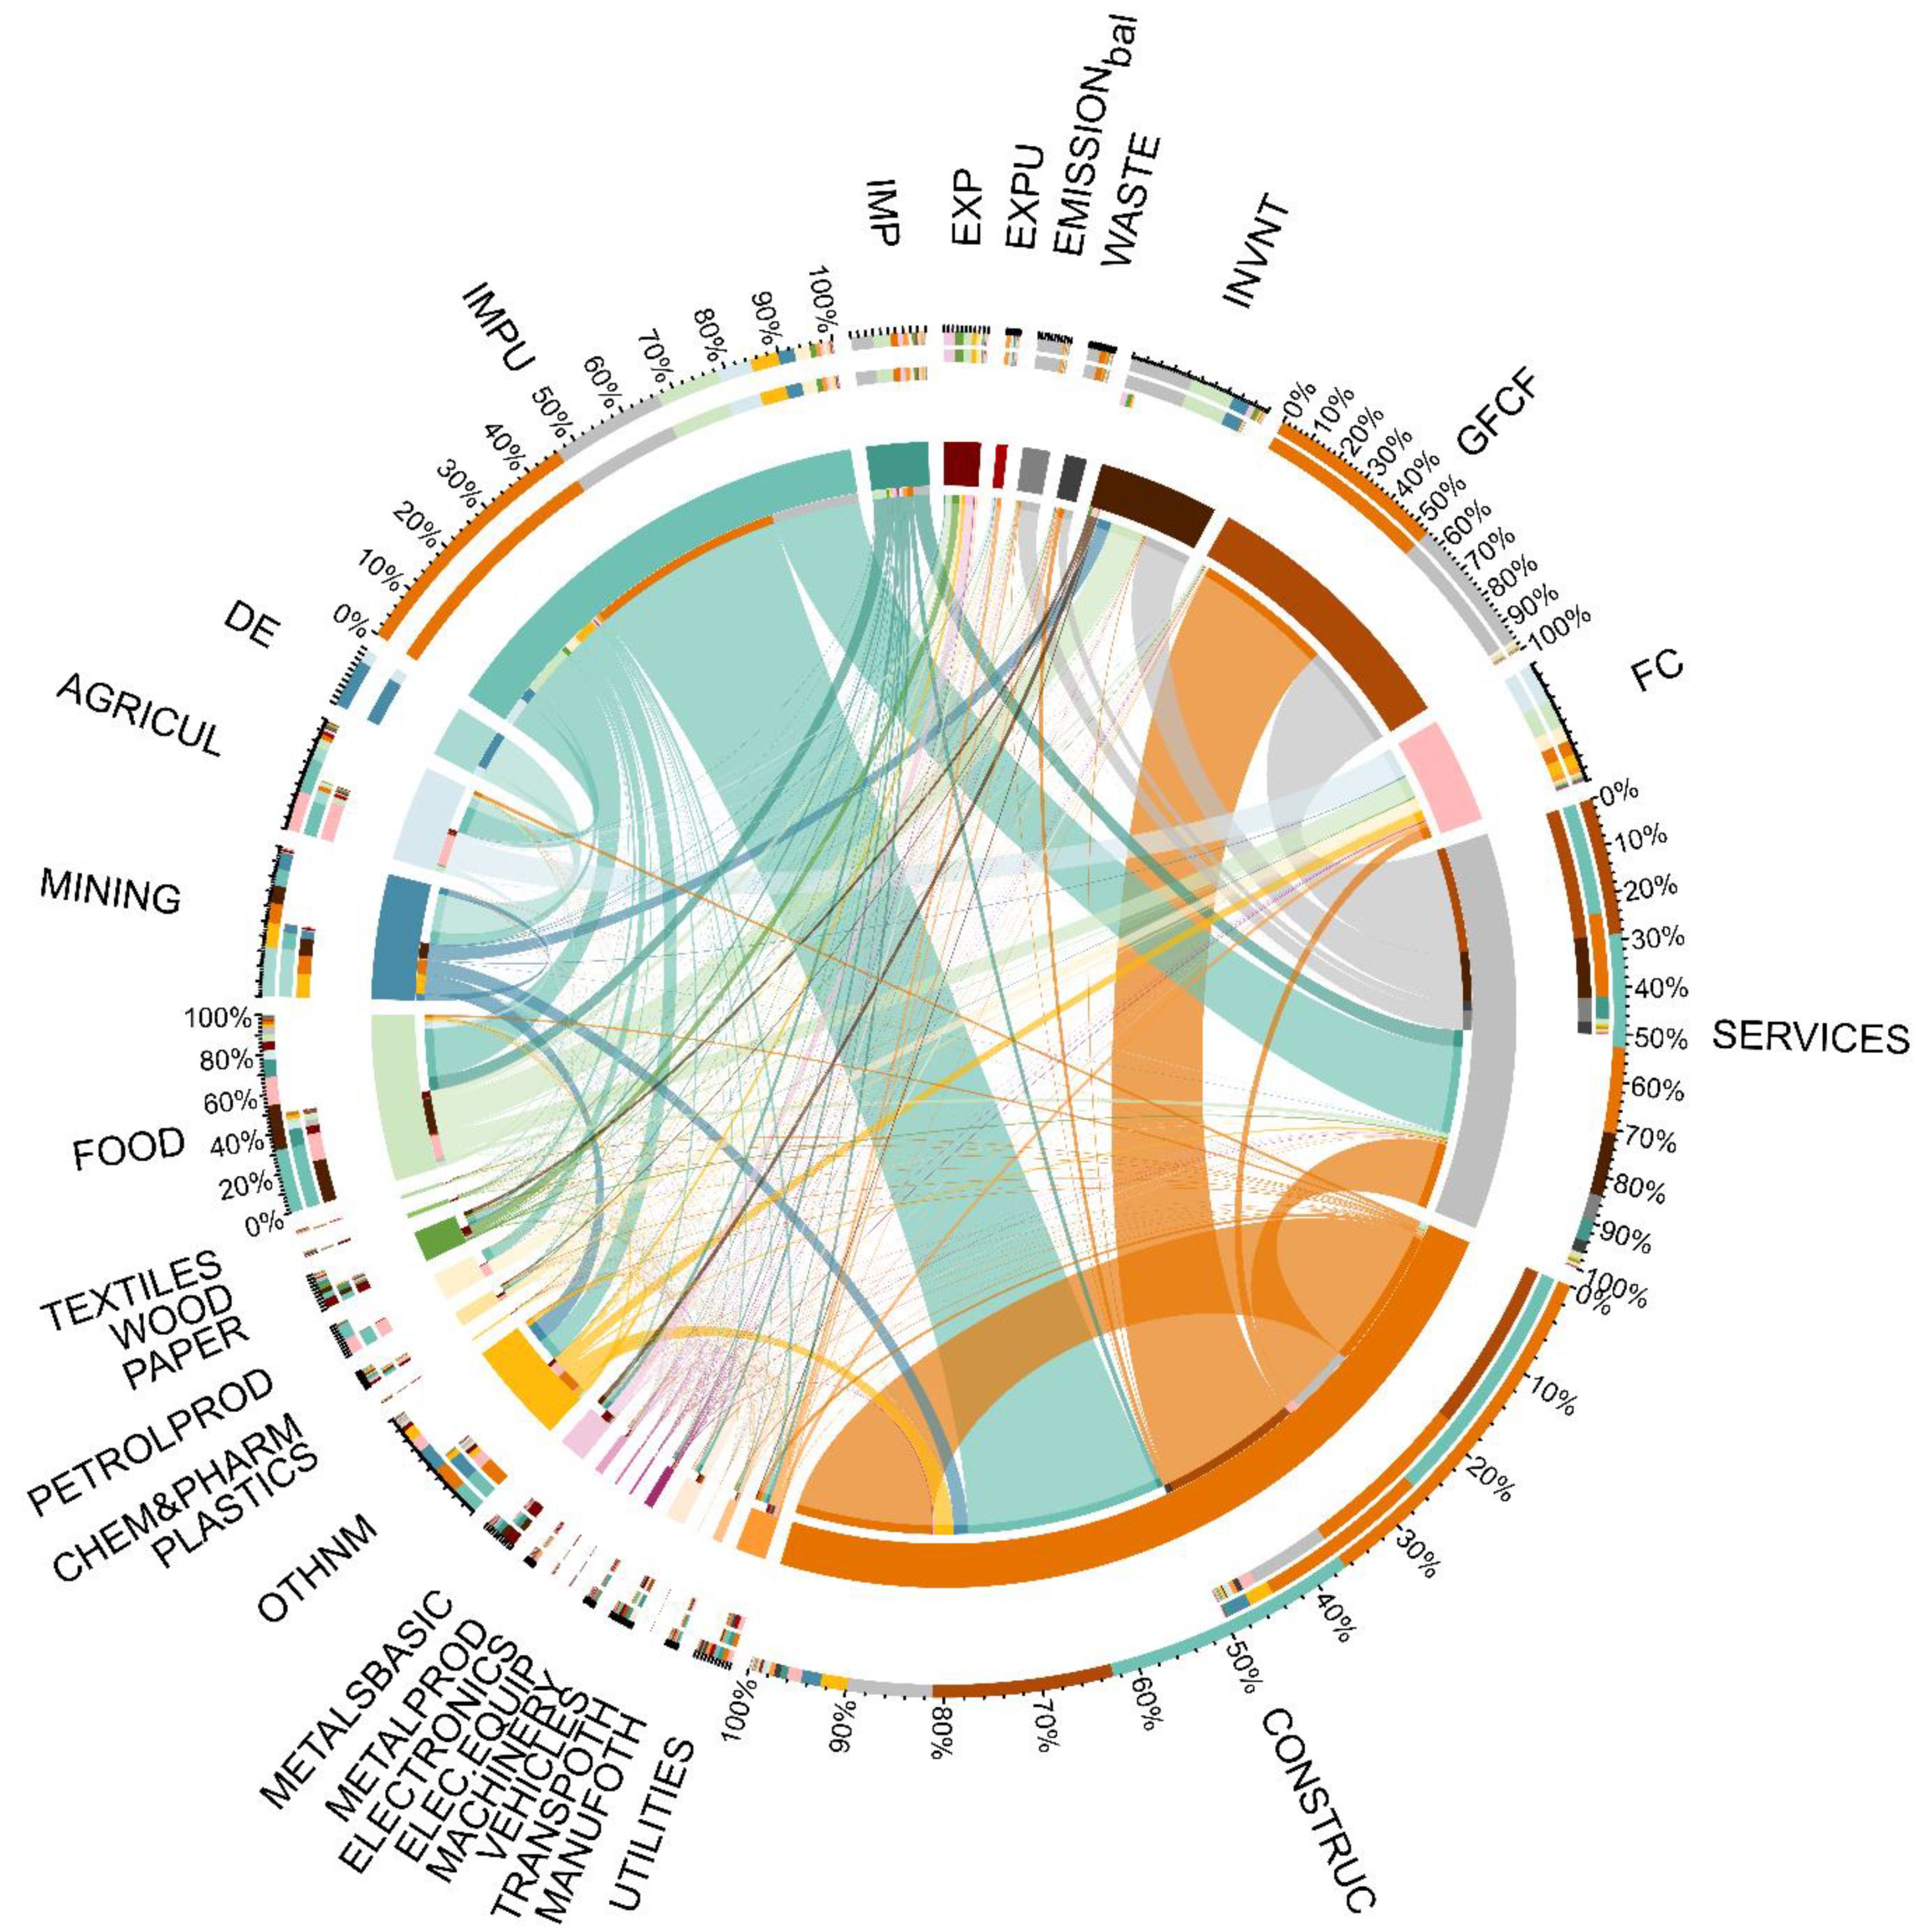
Figure 6 and
Figure 7 present the chord diagrams illustrating the material flows of the Portuguese socioeconomic metabolism and the material flows of the urban metabolism of the Lisbon metropolitan area for 2017, as quantified in the PIOTs. The figures illustrate how the urban metabolism of Lisbon is not representative of the average national metabolism, even though the metropolitan area accounts for a significant share of the population (27%), GDP (36%), and material use (20%).
The chords in the center of the circle of
Figure 6 and
Figure 7 represent the flows between the economic sectors and are colored according to the origin of the flow. The sections of the first circumference that are attached to some of the flows represent the colors of the sectors and are attached to the outgoing flows. For example, in
Figure 6, the mining sector is colored in dark blue with a large blue flow attached to it and going to construction (CONSTRUC). This flow represents the mass that is sold by mining to construction. The outer rings represent the shares. The innermost ring is the distribution of the outgoing flows colored according to the destination sector. The middle ring represents the distribution of the input flows by the origin sector, and the outermost ring is the distribution of the flows related to the sector. For example, for the mining sector in
Figure 6, the inputs from domestic extraction make up a little over 40% of the flows exchanged by the sector, which corresponds to over 80% of the inputs (which make up 50% of the flows exchanged), and around 40% of the outputs (20% of all the flows) are sold to other non-metallic mineral products (OTHNM).
On the side of the input flows into the considered system boundaries, there are clear differences between the total Portuguese flows and the urban flows of the Lisbon metropolitan area. Indeed, 74% of the inputs into the Portuguese economy originated in domestic extraction, while, for Lisbon, domestic extraction only accounts for 9%. The largest share of material inputs into the Lisbon metro area is associated with imports from other regions of the country (81%). The calculated domestic extraction and imports of the considered urban area are only enough to satisfy 19% of the demand for materials in the region, meaning that the metabolism of Lisbon is very dependent on the imports of materials from other regions. The difference in the share of domestic extraction is likely related to a lower share of flows from mining, for which the regional value was calculated based on the share of energy consumption from mining in the Lisbon region. While a lot of the flows from mining at the national level are either directly sold to construction or to manufacturing sectors that then sell products for construction, at the Lisbon regional level, the largest share of inputs in construction comes from other regions in the country. Most of the outputs from construction are sold to services and eventually become fixed capital of the sector.
In Lisbon, some inputs into services that will become fixed capital also come from other regions. These flows suggest that the Lisbon region is very dependent on other regions for the construction of infrastructure that supports services, which previous results showed to have a significant contribution to the resource productivity and gross value added of the region. The detailed flows of the manufacturing sectors also present differences in the national and urban metabolism, like the share of OTHNM, which accounts for 15% of the manufacturing output at the national level, but only 12% in Lisbon.
In contrast, Lisbon food products, beverages, and tobacco (FOOD) account for 54% of the output from manufacturing, while, at the national level, it only accounts for 35%. The FOOD sector in Lisbon contributes 21% of the total output of the sector at the national level. The share of the coke and refined petroleum products sector (PETROLPROD) in the Lisbon manufacturing industries is only 10%. In comparison, at the national level, the sector has a representativeness of 20% in terms of material outputs. The differences between the shares of manufacturing sectors are consistent with the differences identified in the material structure of the manufacturing sector.
5. Conclusions
The contribution of cities to national economic growth and resource use make cities key players in the transition to more sustainable economic paradigms, especially as more and more of the population moves to cities. However, the urban system is very complex, and analyzing the economic and physical (material) interactions between economic sectors and other regions requires a sophisticated urban metabolism approach. Urban metabolism provides a holistic framework for analyzing the urban systems, and, here, a method that relies on officially available data was provided to resolve the current lack of urban data.
This paper focused on the quantification of the urban metabolism of the Lisbon metropolitan area in relation to the Portuguese national socioeconomic metabolism in 2017. The urban flows were calculated by downscaling national flows using metrics calculated from national and regional variables. This work presents a significant development of a previous study by using national PIOTs that were calculated based on a very recent methodology, by using additional metrics for the downscaling of the PIOTs to the urban level, and by presenting a new type of comparison between a national and urban socioeconomic metabolism. In this work, we used PIOTs, for which calculation is based on additional officially available data, including MIOTs and various data on physical flows, refined assumptions, and a mass balance. The scaling factors used included national and urban values on energy consumption by sector, land use, and animal population, in addition to employment by sector and population. The choice of scaling factors was specific to the different sectors, and, in the case of agriculture, also on the type of materials.
The results obtained allowed us to characterize the material structure of the economy with regard to types of materials and material output per sector. The mass flows of the national and urban metabolism were also explored. The results showed that the resource productivity of Lisbon is higher than the national resource productivity. Lisbon is an urban area with a significant contribution to the GDP, considering the area and population of Lisbon. The metropolitan area distinguishes itself from the national panorama through its share of services in the economy and composition of the manufacturing sector.
Additionally, the types of materials consumed vary, and most of the economic sectors in Lisbon have a higher resource productivity than the national value. We provided innovative chord diagrams that demonstrate how the urban metabolism of an economically significant country area can be different from the national metabolism, and how urban areas such as Lisbon depend on other urban regions.
The quantification of the concept of urban metabolism provided in this work offers a significant contribution to the benchmark of the sustainability of different urban areas. It demonstrated that PIOTs can provide relevant information for describing the urban metabolism, and the method allows for further refinement as more data becomes available at the regional level. It was also concluded that both an understanding of the urban economic structure and its dynamics, as well as an understanding of the relation between the urban area and the other regions of the country, can provide critical information for policies regarding the sustainability of the metabolism of the urban region and the country. Circular economy policies, for example, can benefit from the information looking at value chains and flows of materials in the different sectors.


