Article

Influence of Localized Rainfall Patterns on Landslide Occurrence—A Case Study of Southern Hiroshima with eXtended Radar Information Network Data during the July 2018 Heavy Rain Disasters

by
José Maria dos Santos Rodrigues Neto
1 and
Netra Prakash Bhandary
2,*
1
Graduate School of Science and Engineering, Ehime University, Matsuyama 790-8577, Japan
2
Faculty of Collaborative Regional Innovation, Ehime University, Matsuyama 790-8577, Japan
*
Author to whom correspondence should be addressed.
Geosciences 2023, 13(8), 245; https://doi.org/10.3390/geosciences13080245
Submission received: 25 June 2023 / Revised: 31 July 2023 / Accepted: 10 August 2023 / Published: 14 August 2023
(This article belongs to the Special Issue Advanced Numerical Modelling and Analysis in Geotechnical Engineering)

Abstract

:
In this study, we use GIS and other analytical platforms to analyze the landslide distribution pattern in the July 2018 heavy rain disasters in the southern part of Hiroshima Prefecture in Japan in conjunction with chronological XRAIN (eXtended Radar Information Network) radar-acquired localized rainfall data in order to better understand the relationship between rainfall characteristics and landslide probability. An analysis of event rainfall from the July 2018 disasters determines that landslide-inducing rainfall started from 8:30 AM on 5 July and continued until 7:30 AM on 7 July, accumulating to up to 368 mm in total precipitation, and that there were two intensity peaks, one around 7:30 PM on 6 July, and another one around 4:30 AM on 7 July. These two events are associated with particularly high landslide activity, which indicates that landslide activation is related to peak-intensity rainfall combined with accumulated continuous precipitation. The XRAIN data were also used together with landslide reports to calculate the intensity–duration (i.e., I-D) rainfall threshold for the area. The mean annual precipitation in the whole study area ranged between 2025 mm and 3030 mm, with an average value of about 2300 mm. The spatial distribution of rainfall throughout the sampled years indicates that rainfall is remarkably localized, with higher values concentrated on elevated areas. However, it was also observed that the maximum precipitation volumes are not so closely related to landslide occurrence, and the highest landslide activity was found in intermediate precipitation class zones instead. Correlating the localization patterns of event precipitation and mean annual precipitation using Pearson’s correlation coefficient, we found an r value of 0.55, which is considered a moderate correlation between the two datasets (i.e., event precipitation and mean annual precipitation).

1. Introduction

Landslide disasters occur very frequently worldwide, causing substantial human loss and property damage [1,2,3,4]. Such events are predisposed by various physical factors inherent to the slope in question, such as geology, geomorphology, steepness, drainage system, and others [5,6], but the major triggering factor in most of the cases is rainwater infiltration [7]. Most of the landslide disasters around the world happen during the rainy seasons of the respective region, such as around January in South America [8] or July in Japan [9]. The problem of rainfall-induced landslides in Japan was exemplified during the July 2018 heavy rain-induced disasters in west Japan. One of the most heavily affected areas was the city of Kure, in Hiroshima Prefecture (Figure 1).
During the disasters, landslides and massive floods were caused by heavy rains in an event officially referred to as “Heavy Rains of July 2018”. In the course of about 10 days, from 28 June to 8 July, rainfall records reached as high as 1800 mm on the island of Shikoku and 1200 mm in the Tokai region. Many cities recorded more than 400 mm of rainfall over the course of 72 h [12].
In Hiroshima Prefecture, one of the most affected areas was Kure City, with 10 people became deceased due to landslides during the disasters. Additionally, most transportation lines into the city (except maritime ways) were cut off, and 760 houses were damaged (e.g., Figure 2).
The southern part of Hiroshima Prefecture is occasionally affected by heavy rain-induced landslides and flood disasters. Other than the July 2018 event analyzed in this study, other heavy rain-induced landslide disasters were recorded in July 1967 [14], June 1999 [9,15,16,17], and August 2014 [18]. A common factor for these landslide disasters is that they occurred during periods of continuous heavy rain between June and August. Although some predisposed factors (geology, soil condition, slope geometry, etc.) present significant relevance for the occurrence of a slope failure, a triggering factor is always necessary to spark the final break of stability and, consequently, mass movement [19]. The most common trigger in most landslide-affected areas around the world is an increase in soil water saturation, led by unusually heavy rainfall [15,19,20,21,22,23,24,25].
It is also suspected that long-term antecedent rainfall may be related to landslide activation [26], and that rocks and soil that have been weathered due to high precipitation rates might be more susceptible to landslide activation. Moreover, the recurrence of certain rainfall localization patterns has been noted in various areas of the world, a phenomenon that is usually attributed to the regional topography and subsequent circulation of air around the mountains [27,28,29,30,31,32]. This aspect is expected to be especially remarkable in a study area such as Kure City (and the majority of Japan’s coastline), with its rugged terrain and abrupt altitude variability. Therefore, it is expected that event precipitation localization patterns might be similar to long-term precipitation patterns, making it so that knowing the mean annual precipitation patterns for long-term data may allow for knowledge of future landslide-activation-specific rainfall events.
In view of the need for thorough analysis studies of rainfall patterns and their relationship and relevance with landslide disasters to produce more efficient hazard and risk mapping methods, this analytical work aims to investigate rainfall data in the study area of Kure City (Southern Hiroshima Prefecture, Southwestern Japan) in the context of the July 2018 landslide disasters, using innovative XRAIN (eXtended RAdar Information Network) radar-acquired rainfall data. In Hiroshima, XRAIN started its activities in 2016, roughly two years before the landslide disasters of July 2018. Yokoe et al. [33], when using XRAIN data to investigate the same July 2018 heavy rain disasters in Southern Hiroshima, evidenced the quantitative accuracy of XRAIN radar data to capture and measure precipitation values in point data when compared to conventional rain gauge methods, with the exception of rainfall intensity exceeding 80 mm/h. Marc et al. [34] correlated radar-acquired rainfall data in Japan with a specific landslide event and discussed how long-term rainfall and event rainfall localization patterns correlate to slope failure occurrence. They show that rainfall anomalies in a specific rainfall event are closely relatable to landslide activation, thus evidencing the importance of long-term rainfall analysis. Likewise, Moriyama and Hirano [35] use XRAIN data to investigate the relationship between maximum three-hour cumulative rainfall and landslide occurrence, evidencing that slope failure activation occurs in peak rainfall timing. Cremonini and Tiranti [36] exemplified a case study allying radar and gauge rainfall measurement methods for forecasting and early warning systems for landslide disasters, showing that radar data, though susceptible to quantitative error due to miscalibration and other technical difficulties, are viable for the detection of landslide hazards. Other uses of XRAIN data include investigation of the development of small-scale guerilla rain clouds [37], detailed rainfall measurement methods for forecasting [38], and snowfall precipitation measurement methods [39].
This study aims to correlate landslide occurrence (during the July 2018 disasters) with rainfall volume distribution in search of localization patterns, as well as investigate whether long-term mean annual precipitation localization patterns (in this case, from 2016 to 2021) both before and after the analyzed landslide event may be co-relatable with precipitation localization patterns of specific rainfall-induced landslide events (in this case, July 2018). The identification of such localization patterns in different time windows may evidence the effectiveness of XRAIN radar-acquired mean annual precipitation data as a landslide conditioning factor in landslide hazard and risk mapping, as well as lead to a better understanding of the effects of rainfall in landslide activation and probability, which may contribute to better strategies in landslide disaster prevention methods.

2. Materials and Methods

The rainfall-induced landslide GIS inventory referent to the July 2018 disasters was provided by the Geospatial Information Authority of Japan [10]. The landslides were mapped from aerial photographs of the analyzed areas taken by the Geospatial Information Authority of Japan directly after the July 2018 disasters, from 9 to 16 July 2018. Since the whole of the study area was entirely encompassed by the surveyed frame, the landslide distribution of the event is complete and unbiased.
The utilized DEM is provided by the Geospatial Information Authority of Japan [11] and was acquired with airborne laser survey with 0.2″ interval (5 m resolution) and has 0.3 m vertical accuracy. Other miscellaneous GIS data were also provided by the Geospatial Information Authority of Japan [11].
Other details regarding the study area and the utilized database and analysis methods are presented in the following sections.

2.1. Study Area

The area analyzed in this research comprises a 390.5 km2 rectangle around the municipality of Kure in Southern Hiroshima (Figure 1). Stranded between the Hiroshima Mountains in the north and the Seto Inland Sea to the south, the city was a small shipbuilding town that experienced rapid growth in the first half of the 20th century, which forced urbanization in areas at or adjacent to the mountainous terrain.
The mountains are mostly composed of volcanic rocks, namely rhyolites and granites/granodiorites from the Hiroshima Group [40]. When weathered, these rocks erode into a soil commonly referred to as Masado, which is known to be highly permeable and brittle when wet, configuring a material prone to slope failure during rainfall events [25]. This setting, common around the country’s coastline, makes the city a potential high-risk area for landslide disasters.
The Seto Inland Sea (to which Kure is adjacent) has little rainfall compared to the surrounding oceanic coastal areas in Japan, like the Sea of Japan and the Pacific Ocean. Although a substantial part of the oceanic precipitation clouds is blocked either by the Chugoku Mountains northward or the Shikoku Mountains southward, and the region is relatively dry [41], heavy rainfall is particularly concentrated in mountainous areas. In Kure, the average annual precipitation ranges from 1000 to 1600 mm, characterizing a relatively mild rainy zone. Mountain areas around the Seto Inland Sea, however, reach annual average precipitation of 2000 mm to 3000 mm. The period of the year with the heaviest rainfall occurs between June and July every year when the average precipitation reaches 227 mm in a month [42].

2.2. XRAIN Radar-Acquired Rainfall Data

XRAIN radar technology started to be utilized in Japan in the year of 2014, operated by the country’s Ministry of Land, Infrastructure, Transport and Tourism. The technology used in the measurements differs from common radar rainfall data since it uses Multi-parameter (MP) radars, which allows for more accurate measurements of rainfall volume.
Although not as quantitatively accurate as regular rain gauge measurements, radar-based rainfall measurement methods have the advantage of being performed over a bi-dimensional “planar” area, where each pixel in the area’s grid represents a specific value, whereas rain gauge methods extrapolate the value of a single measurement station over extensive regions. This means that radar-acquired data allow for rainfall distribution analysis on a larger scale.
In landslide hazard assessment studies, rainfall data usually comprise mean annual precipitation data collected via rain gauge stations. Typically, each station is referent to a whole municipality and is located near city centers. In the case of the study area, Japan’s Meteorological Agency (JMA) has a measurement station in downtown Kure, with the other nearest stations being at Kurahashi, 16 km southwards, and at Hiroshima, about 18 km northwest.
Slope failure assessment and analysis using rainfall data have been widely performed in the literature, including for the study area of this work [9,16]. However, rain gauge stations gather information on the scale of whole municipalities, which may not be representative of the actual spatial distribution of precipitation in a degree of detail considered ideal for various methods of slope failure assessment. In the case of Kure City, for example, since the nearest rain gauge measurement station is located about 16 km south of the Kure station, mean rainfall data would have, at best, 16 km of accuracy. In reality, rainfall intensity values may vary in the order of less than hundreds of meters, especially in areas with rugged mountainous terrain or coastal regions. However, recent advancements in radar technology, such as XRAIN (eXtended RAdar Information Network), provided by the Data Integration and Analysis System [43], have allowed for instant measurement of rain intensity in much more detailed scales of spatial distribution.
XRAIN data are represented in 287 × 230 m pixel grids, where each pixel value represents the rainfall intensity in mm/h for the referred location at the time of measurement, which occurs every 1 min. The data are obtainable in the Data Integration and Analysis System (DIAS) platform, which is operated by the University of Tokyo and sponsored by the Ministry of Education, Culture, Sports, Science and Technology (MEXT). The measurement spacing can be set as 1, 5, 10, 15, 30, and 60 min.
Although XRAIN raw data express rainfall intensity, precipitation volume can be estimated by the calculation of intensity during a specified period either by averaging the measurements over that period and multiplying it by the number of times that the measurement interval is repeated in it, or simply by summing the intensity values in the case of a 1 h interval analysis with no missing measurements.
In this work, the XRAIN data were downloaded as .zip packed .csv files spaced in 5-min, 30 min, or 1 h intervals. The .csv files comprise tables with cells spatially organized so that each cell represents a 287 × 230 m pixel in a north-oriented grid representing the designated area, and each cell value expresses the rainfall intensity in mm/h at the time of measurement. For the study area, each of the files comprised of a 97 × 67 grid with 4999 pixels. XRAIN data collection for the area of the Chugoku region (where Kure is situated) started in 2016, so the range of collected data spans from 2016 to 2021, summing up to more than 60,000 .csv files. These files were combined in single worksheets in Microsoft Excel for calculations, analysis, and then conversion into ArcGIS shapefiles.

2.3. Data Analysis

After proper conversions, the data were jointly analyzed in ArcGIS Pro for localization and spatial distribution inspections and in Microsoft Excel for other statistical analysis and data visualization.
The investigation methods include determining average precipitation throughout the analyzed time windows (from the year 2016 to 2021) for the whole study area, as well as its spatial distribution. With the use of XRAIN data, precipitation is calculated by acquiring hourly rainfall intensity for each cell of the study area throughout the analyzed period, with a one-hour interval between each intensity measurement in the case of annual precipitation. The hourly rainfall was then converted to precipitation data by multiplying the intensity values by the number of hours in the desired period (e.g., 8760 for a common year). The general flow and steps of the research are illustrated in Figure 3.

2.3.1. Localization Patterns

The reason why accumulation data were analyzed in the format of one year is that meteorological patterns tend to repeat themselves in the cycle of a year. It is expected that rainfall localization and quantification will generally recur after the interval of a year, while the same is not expected in monthly or semiannual intervals. The repetition of rainfall localization patterns over the years evidences the tendency of certain areas to receive more precipitation and, thus, be more susceptible to landslides, both in the sense of soil and rock weathering by rainfall and also in the sense of slope failure triggered by soil saturation during high precipitation events. Thus, it is considered that annual rainfall analysis is appreciated in looking for localization patterns, even in years previous and subsequent to when the case study landslide disaster event occurred. This hypothesis is judged by visualizing these localization patterns in map view along with the actual landslide occurrence points of the July 2018 disasters.
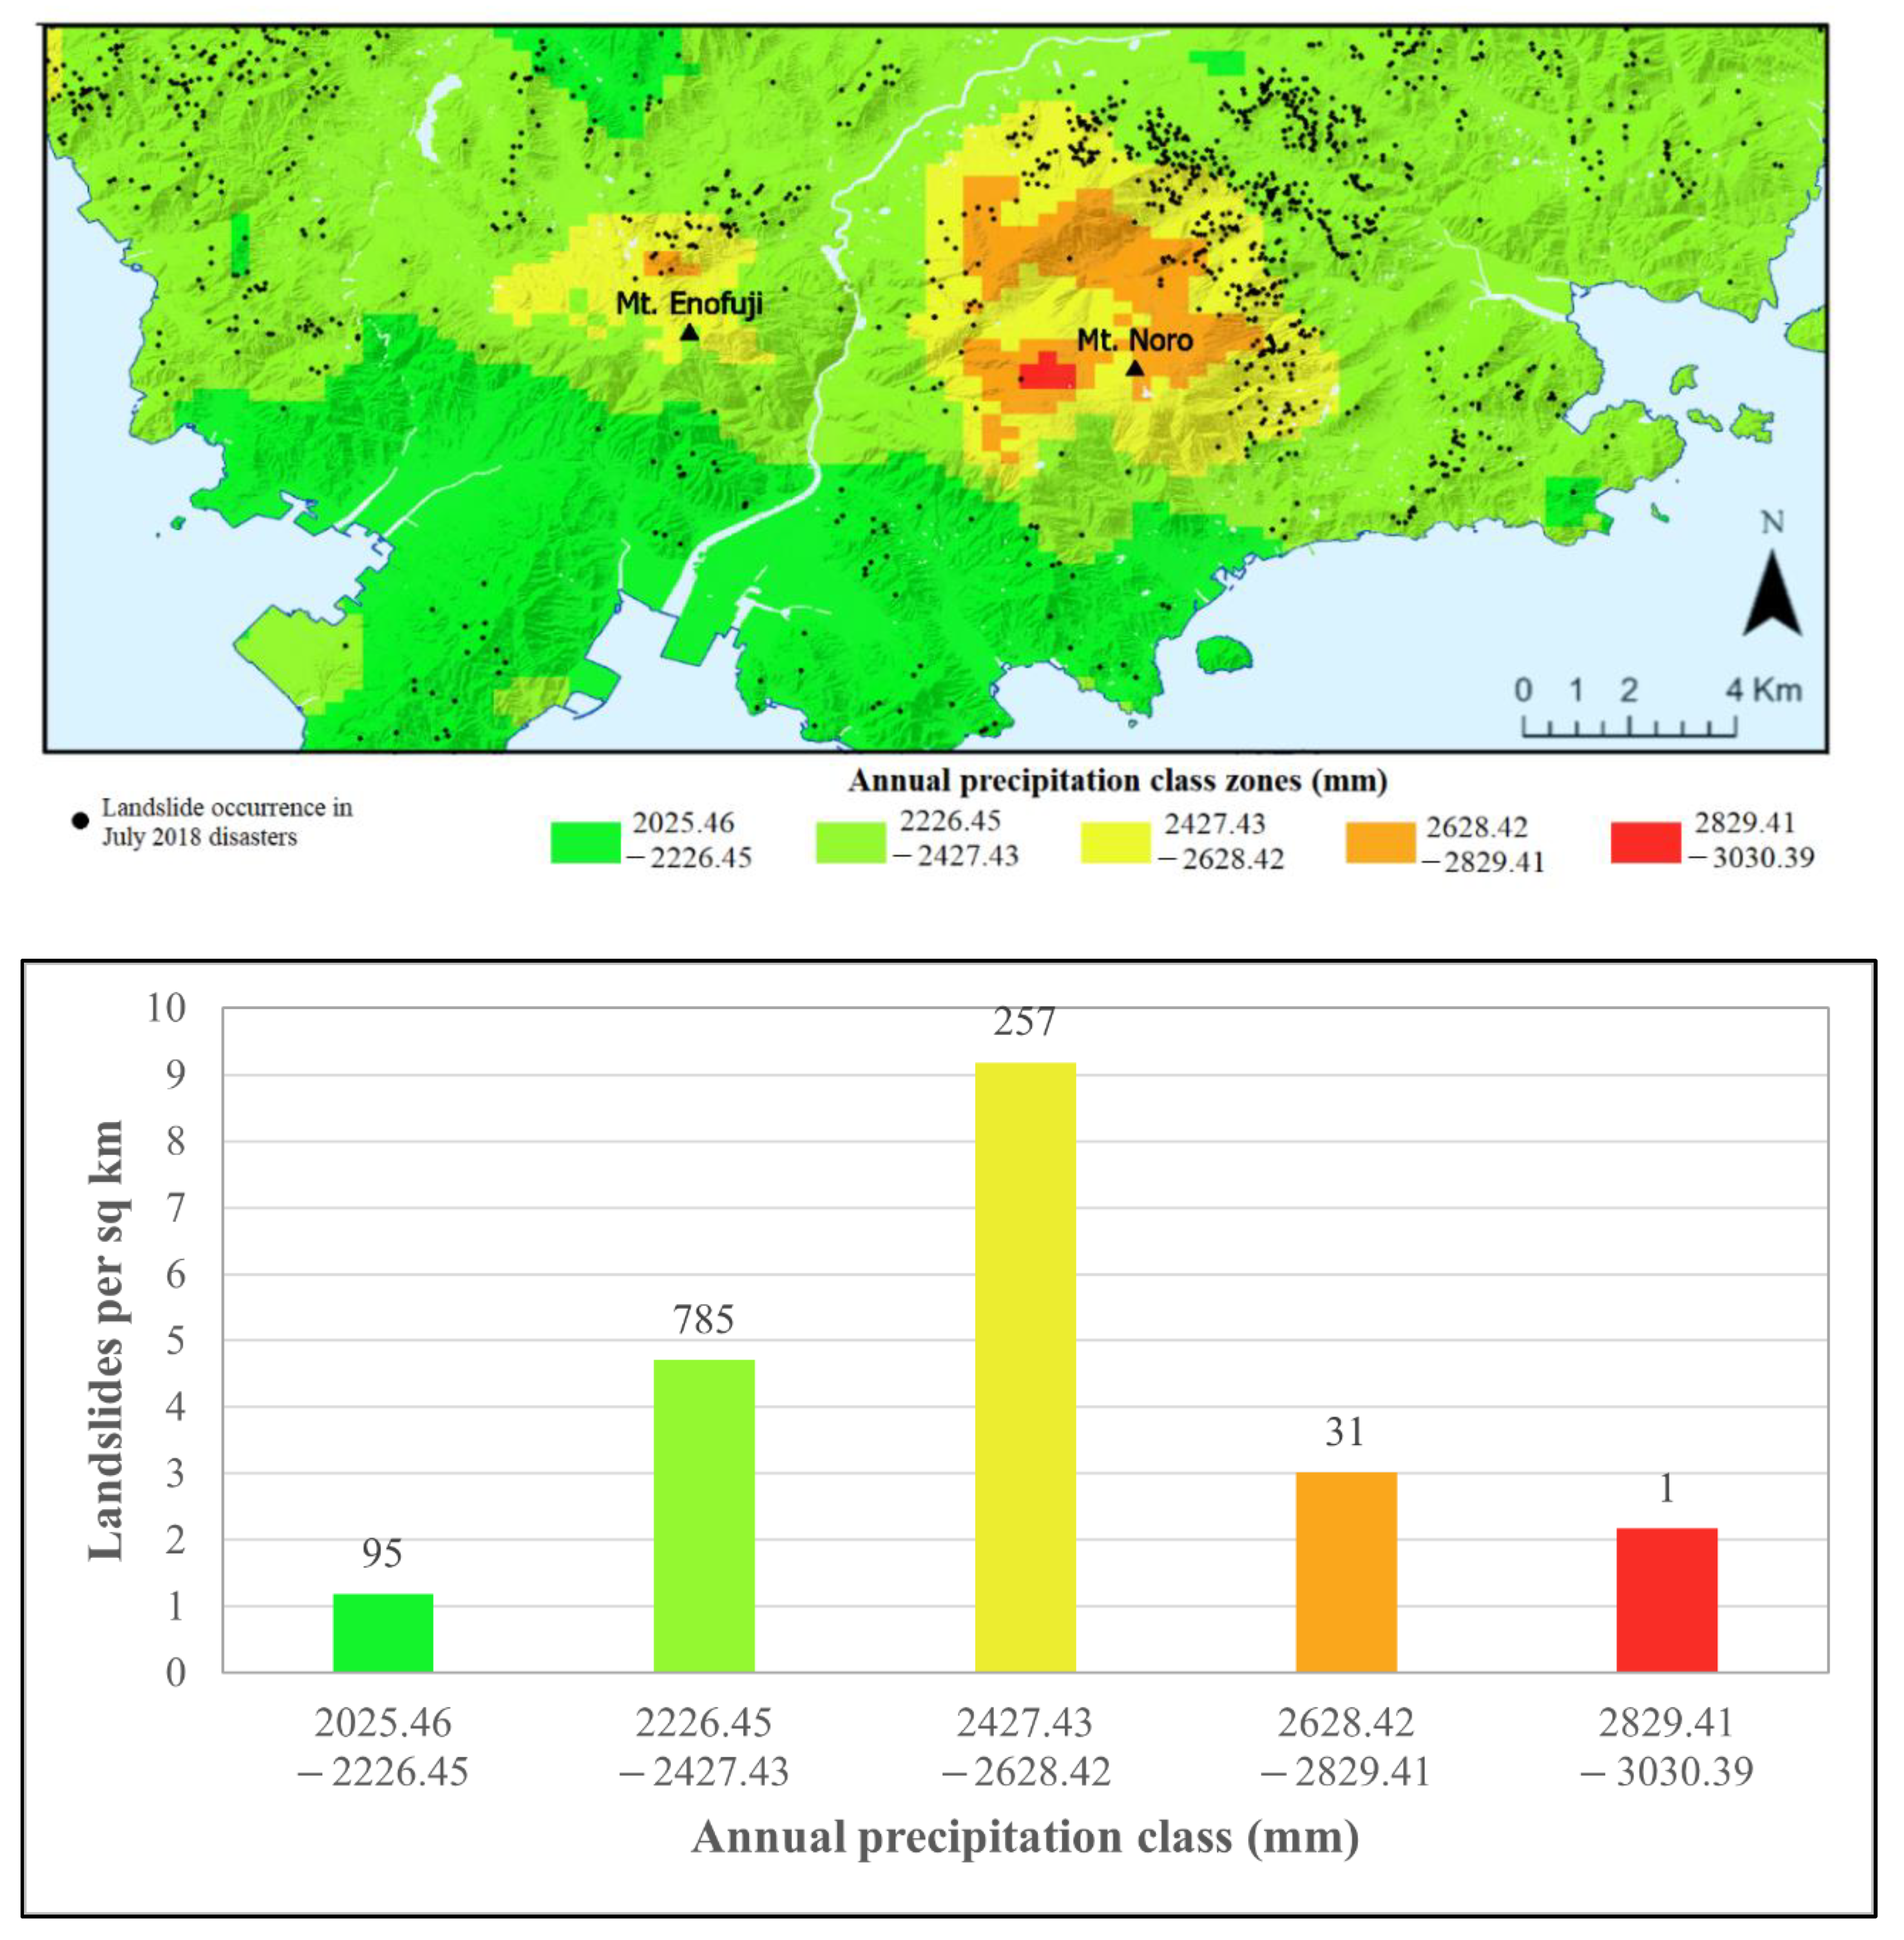
The relationship between localized precipitation and landslide occurrence was further explored by calculating landslide density based on precipitation class zones. The precipitation class zones vary for each analysis period, depending on the localization and quantity of precipitation for the analyzed period. For each analysis (total rainfall from 2016 to 2021 and event rainfall between 5 and 7 July 2018), five precipitation zones (very low, low, medium, high, and very high) and their boundaries were determined by calculating five equal intervals based on the total precipitation value of the analyzed period. The landslide density for each zone is determined with the use of the “Spatial Join” analysis tool in ArcGIS.
In order to investigate the differences and similarities between the annual rainfall patterns and to understand the triggering of slope failures in the July 2018 disasters, along with the map visualization of localized precipitation in the same fashion as the annual rainfall analysis, a timeline of rainfall intensity in the study area was constructed during the 2-day period of rainfall pertaining to the July 2018 disasters. This was carried out by arranging 30 min interval XRAIN rainfall intensity measurement data from the whole study area in a 47 h (period of continuous rainfall during the disasters) span with 30 min accuracy. The timing of rainfall intensity was then compared to disaster documentation, as well as localization patterns along the area.

2.3.2. Intensity–Duration Rainfall Threshold

Empirical slope failure thresholds are based on the statistical analysis of previous rainfall history that has not resulted in landslides. These thresholds are usually expressed by plotting lines in Cartesian, semi-logarithmic, or logarithmic coordinates, where values above the line are considered prone to slope failure occurrence. In empirical slope failure thresholds, the use of data reflecting rainfall conditions that did not result in slope failure triggering is also necessary for efficient sampling [22]. Extensive research and attempts of empirically based threshold models evidence that the threshold values cannot globally represent the situation for slopes and climate settings in any part of the world, which leads to the necessity of developing different models depending on the geographical situation or at least co-relatable settings [44].
Intensity–duration (ID) thresholds are the most widely adopted type of threshold analysis and are considered efficient for making a relationship between the intensity of event rainfall and the accumulation of precipitation from the start of rainfall to the failure event. ID thresholds are usually expressed as a line plotted over Cartesian coordinates with logarithmic values, where rainfall duration until the event is represented by the horizontal (X) axis and event rainfall intensity is represented on the vertical (Y) axis. The threshold lines are usually expressed in the form of the power law equation:
I = c + α × D β
where I is rainfall intensity, D is rainfall duration, and c, α and β are parameters based on the study area. Since ID thresholds always exhibit situations where higher intensity requires less duration for landslide activation, β is always a negative value, characterizing a negative power law. According to the collection of threshold values summarized by Guzzetti et al. [22], the majority of the ID threshold equations across the bibliography exhibit c = 0, α between 4 and 176.4, and β between −2 and −0.19.
The intensity–duration threshold analysis always makes use of a defined duration range, given by the duration between the first analyzed landslide event and the last (first event duration < D < last event duration). Local threshold values usually have smaller ranges due to the narrower sampling data available for analysis, which is also reflected in higher threshold values.

2.3.3. Event Precipitation and Mean Annual Precipitation Comparison

In order to investigate whether there is a correlation between spatial and localization patterns of rainfall when comparing event precipitation (in this case, along the 48 h between 5 and 7 July of 2018, when the landslide disasters of that event occurred) and long-term precipitation (for the years between and including 2016 and 2021, when XRAIN data were available for the study area), relative precipitation values for event precipitation and mean annual precipitation and their differences were calculated, and Pearson’s product-moment correlation coefficient (PPMCC) was employed to compare these two datasets.
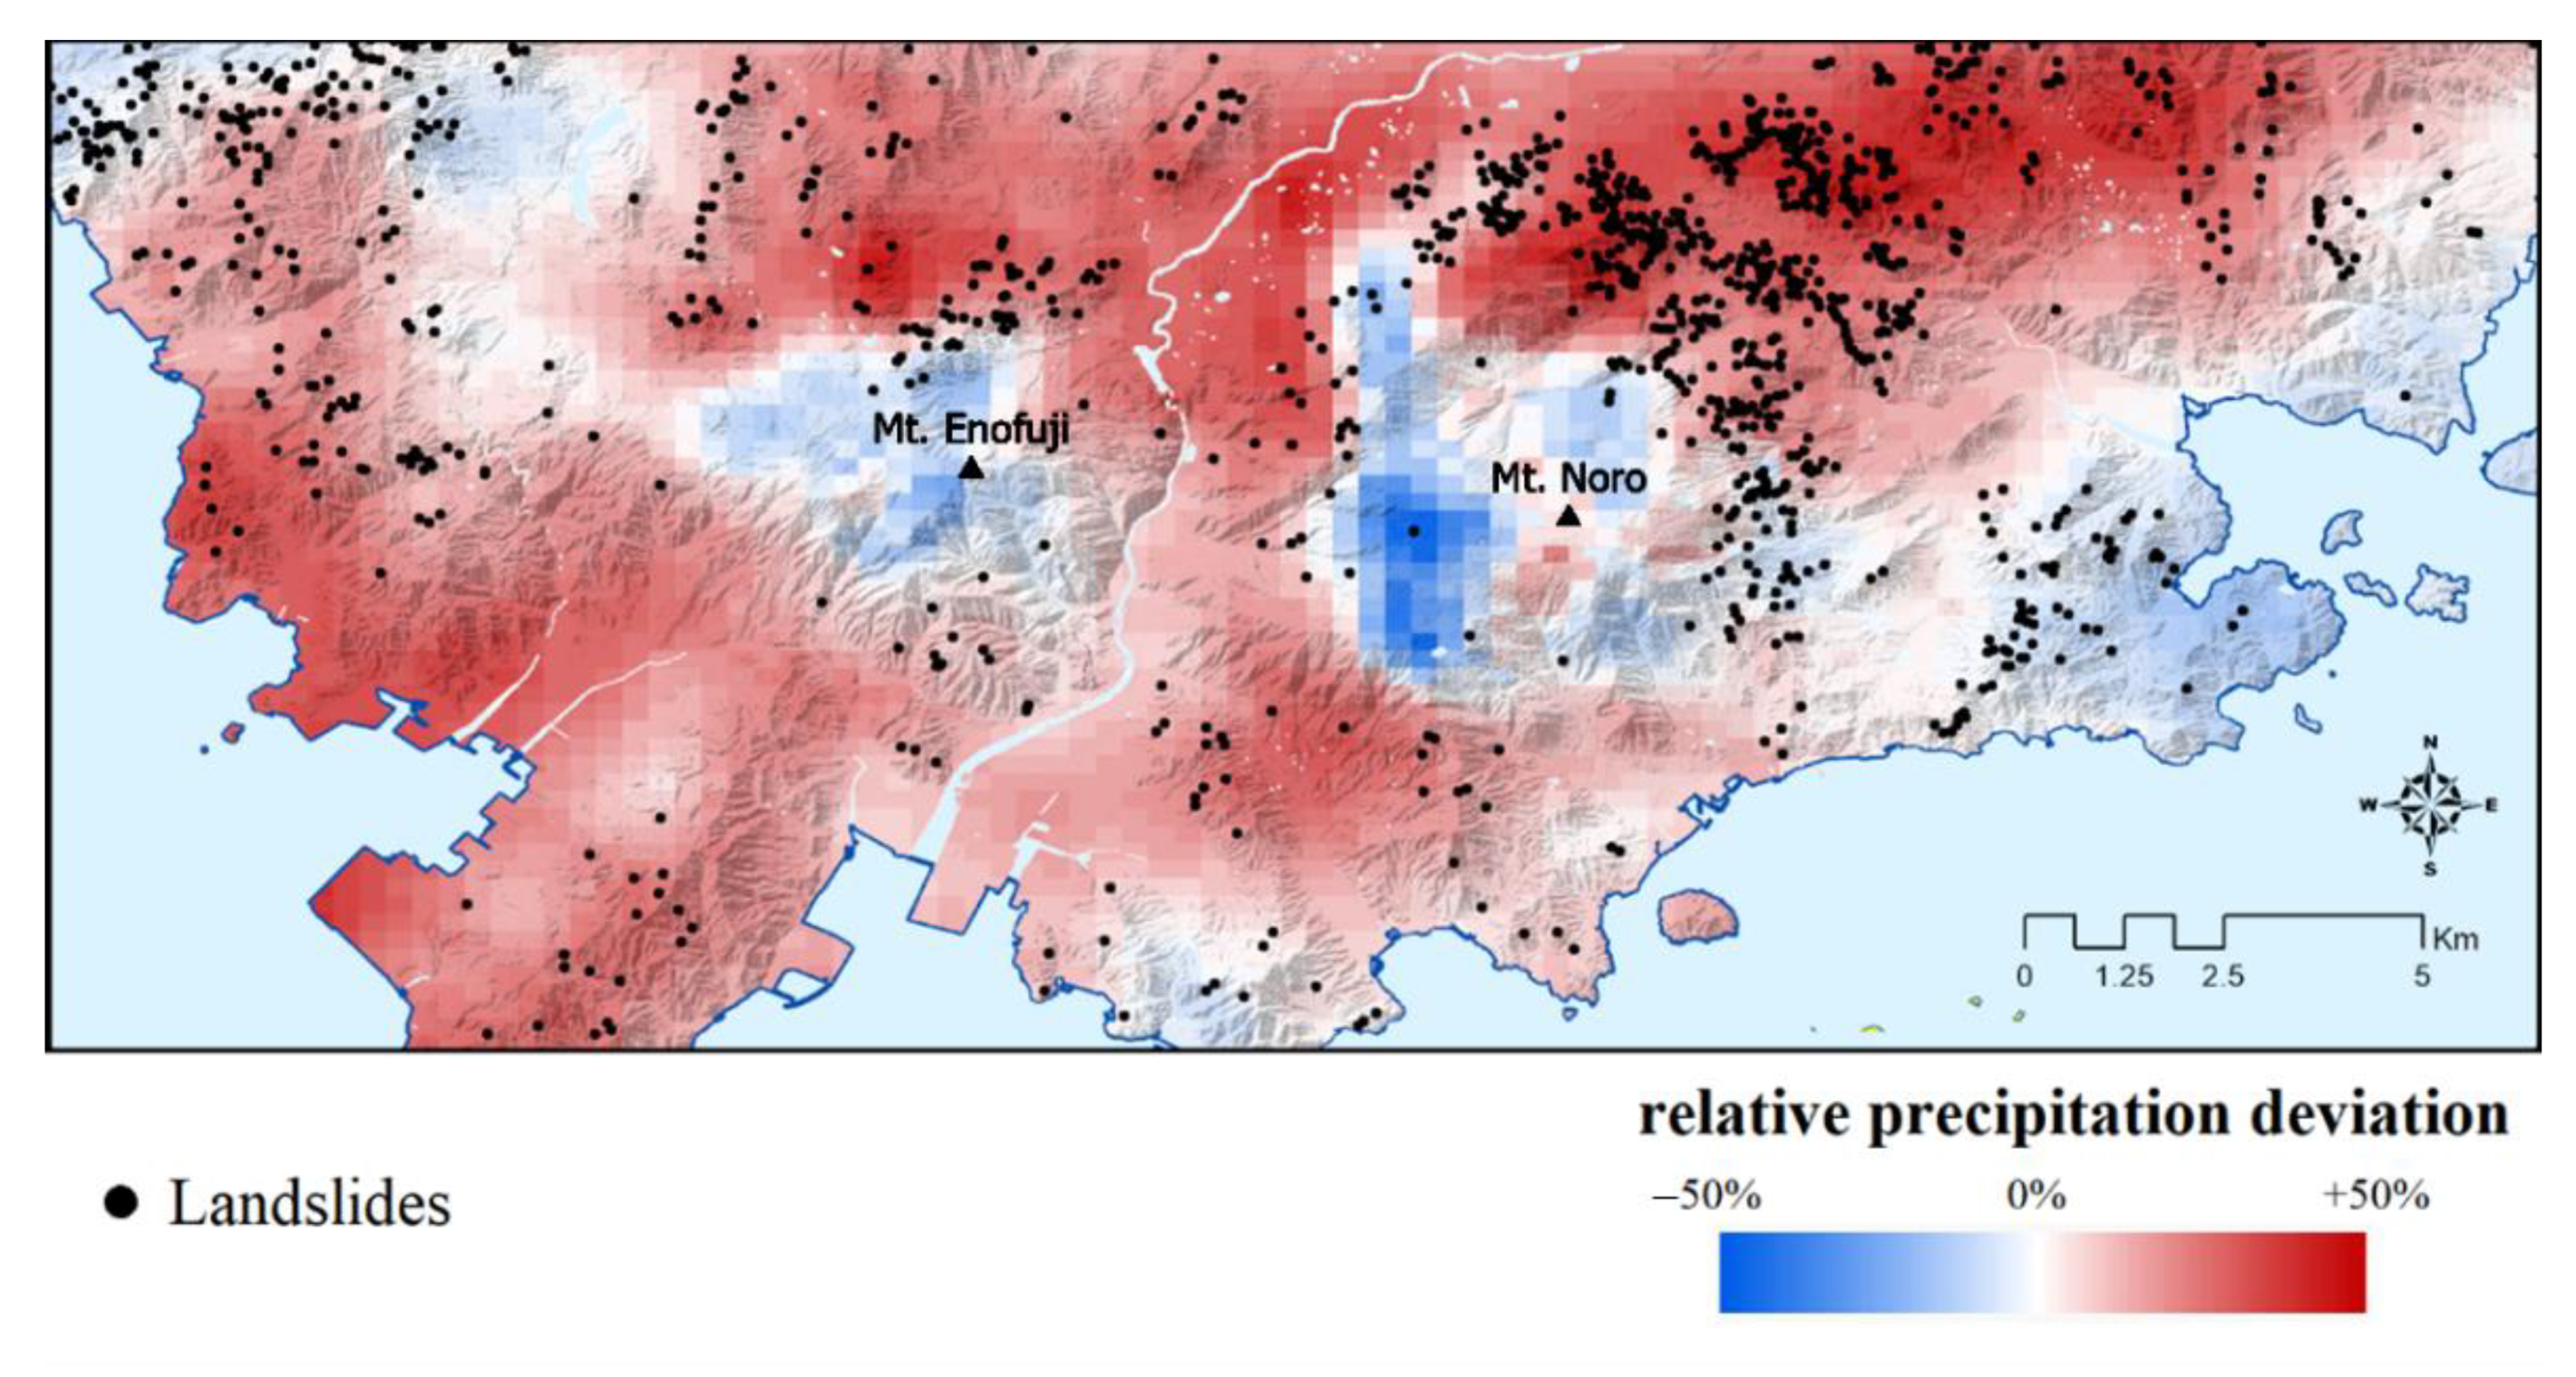
What is here defined as relative precipitation is the percentage relative to the maximum precipitation which the sample cell represents for a given period. This results in a normalized value representing the relative precipitation of XRAIN precipitation cells in the study area, allowing for a quantitative comparison of rainfall localization patterns between different time periods (i.e., event precipitation over 47 h and mean annual precipitation between 2016 and 2021). Thus, the relative precipitation difference is obtained simply by subtracting the mean annual precipitation from the relative event precipitation, both in percentage values. A negative relative precipitation difference value indicates that event precipitation was less intense than the usual mean annual precipitation in that cell, while a positive value indicates that it was more intense, and a value near 0% suggests that there was no big deviation of localized precipitation in that area and that there is a good fit between the two datasets.
The PPMCC value, represented by r, is a measure of linear correlation between two sets of data, given by the ratio between the covariance of two variables and the product of their standard differences [45]. A value closer to 1 represents a good fit between compared datasets. It is given by the following formula:
r = ( x x ¯ ) ( y y ¯ ) ( x x ¯ ) 2 ( y y ¯ ) 2
where x and y are the sample means for each dataset, which in the case of this study are the collection of XRAIN-measured precipitation pixels for the event precipitation and the long-term mean annual precipitation, both normalized to percentage values. Only pixels above land were considered in the calculation.

3. Results and Discussion

3.1. Event Rainfall: 5 to 7 July 2018 Precipitation

Inspection of XRAIN chronological data of the time before and leading to the landslide disasters at Kure City shows that Kure was experiencing a rest of substantial rainfall since 7 AM of 4 July, when Category 1 Typhoon Prapiroon (TY 1807) was weakening into a low-pressure area as it advanced to northeastern Japan, leaving the city to mildly good and sunny weather. The weather was mostly clear for about 25 h until 8:30 AM of 5 July, when heavy rainfall clouds approaching from the southwest landed on Honshu, laying the city into a continuous heavy rainfall situation for about 2 days, a condition which would eventually lead to landslides in the night of 6 July and early morning of 7 July, after which the heavy rainfall finally ceased, and the weather was relatively clear for the whole following day.
Analysis of rainfall data of the event for the study area shows that in the period of 47 h between 5 July 8:30 AM (start of rainfall) until 7 July 7:30 AM (end of rainfall), landslide density based on the five equal interval precipitation classes show peak landslide activity in high precipitation classes (16 landslides per km2 in the 403.10 mm to 434.45 mm precipitation zone), though there is a significant decrease in landslide activity in maximum precipitation zones, with 10 landslides per km2 in the 434.45 mm to 465.79 mm precipitation zone (Figure 4). It is supposed that maximum precipitation zones are not related to peak landslide activity because these zones are related to peak topographical areas, a relationship which will be further discussed in the following sections of this study.
Analysis of average rainfall values for the whole study area allows for chronological interpretations in the case of an isolated event. Taking this approach, it was noted that the average rainfall in the study area was 7.8 mm/h, and the total cumulative rainfall was 368 mm. There were two peaks of rainfall intensity, one around 7:30 PM of 6 July (35 h into the event) with an intensity of 47 mm/h, and another at 4:30 AM of 7 July (44 h into the event) when rainfall intensity reached 40 mm/h (Figure 5).
The reports from the disasters point to high landslide activity in Kure around 19:40 PM on 6 July and then again around 5 to 6 AM on 7 July [13]. These two main landslide occurrence reports will hereinafter be called “subevent 1” and “subevent 2”, respectively. Checking the XRAIN rainfall intensity timeline in Figure 5, it is noticeable that these two subevents coincide directly with the rainfall intensity peaks around 7:30 PM on 6 July and 4:30 AM on 7 July. This evidences that, as expected, landslide triggering is related to peak intensity event rainfall, and that—since the rainfall intensity in subevent 2 is lower than in subevent 1—the intensity threshold for landslide activation is lower when there is longer duration cumulative rainfall. This dynamic will be further explored in the form of rainfall threshold calculations in the following subsection.

3.2. Intensity–Duration Threshold for Southern Hiroshima

The reports published by the Hiroshima Prefectural Government [13] concerning the disasters describe nine specific landslide events throughout Southern Hiroshima. One of the events was not considered in the analysis for displaying outlining values. The events and their details are displayed in Table 1.
Although some of the events occurred outside the study area of Kure City proposed in this analysis, they were used to construct an intensity–duration threshold for Southern Hiroshima Prefecture by plotting the points in a logarithm cartesian coordinate system where the horizontal axis represents duration until failure and the vertical axis represents rainfall average intensity until failure. The threshold and its formula are represented by the resultant power line. The calculated intensity–duration threshold for Southern Hiroshima is represented by the equation I = 133.44 × D−0.841. For purposes of comparison with various other thresholds for different areas of the globe, the calculated threshold line is shown alongside the threshold collection provided by Guzzetti et al. [22] in Figure 6. It is noticeable that the resultant threshold is located slightly above the average in the Guzzeti et al. [22] collection (Figure 6). The proportionally inverse relationship where less rainfall intensity is needed for landslide activation as the rainfall duration increases is clearly observed in the calculated threshold.

3.3. Long-Term Rainfall: Mean Annual Precipitation

Although this research work takes into account a landslide inventory referent exclusively to the July 2018 disasters and not a complete landslide inventory for all of the analyzed mean annual precipitation years (2016–2021), a correlation of MAP and specific landslide events was investigated in order to explore the relevance of long-term recurring antecedent rainfall and landslide occurrence, as also pointed out by Pennington et al. [26].
Upon inspecting the annual precipitation in the study area throughout the years 2016 to 2021, it was noted that mean rainfall accumulation amounts to an average of 2300 mm per year, with a peak value of 3030.29 mm and a minimum value of 2025 mm. The average accumulation values for each of the inspected years are 2954.8 mm for 2016, 2108.7 mm for 2017, 2456.3 mm for 2018, 1847.9 mm for 2019, 2383.3 mm for 2020, and 2852.49 mm for 2021. These results can be visualized in Table 2.
Although these values differ from the Japanese Meteorological Agency’s [12] mean annual rainfall results of 1646.5 mm between 2016 and 2021 for Kure’s rain gauge measurement station, it is noticeable that the precipitation history from 2016 to 2021, according to the analyzed XRAIN data, follows the exact same timeline as the JMA values for these years: 1925 mm for 2016, 1359.5 mm for 2017, 1757 mm for 2018, 1215 mm for 2019, 1660 mm for 2020, and 1962 mm for 2021. The JMA rain gauge values for Kure City every year seem to be lower than the XRAIN radar mean annual values. This may be explained by the specific localization of the rain gauge measurement sampling area: JMA’s measurement station for Kure City is located in downtown Kure near the port, a low topographical area near sea level. As further discussed in this study, heavy rainfall usually accumulates in areas of elevated topography. Since the XRAIN-based mean annual rainfall calculation takes into consideration the whole study area, including mountainous regions of elevated topography, it is expected that that value would be higher than the one measured at the rain gauge measurement station in a lowland area.
Concerning localization aspects of the annual rainfall accumulation, all years present very similar spatial patterns where peak values are concentrated around Mt. Noro, at the central east part of the area, and subordinately Mt. Enofuji, at the central west part of the area. Minimum values, on the other hand, are concentrated in the topographically low valleys of central Kure City (Figure 7). The aspect that heavier rainfall volumes are concentrated in topographically elevated areas is quite noticeable when comparing localization patterns with topographical values. This relationship is illustrated in the graph and map of Figure 8.
Comparing the localized rainfall aspects and the occurrence of landslides in the area during the 2018 disasters, a relationship between intermediate rainfall values and landslide activity is noticeable, especially around the northern flank of Mt. Noro, and at Mt. Enofuji, where landslide occurrence was particularly significant.
The relationship between rainfall accumulation values and landslide occurrence is illustrated in Figure 7, where landslide density per precipitation class is compared to rainfall volumes in each specific precipitation class. The five precipitation classes were divided based on equal intervals. It is noticeable that landslide occurrence initially increases according to rainfall value, usually peaking around intermediate classes (9.2 landslides per km2 in the 2427.43 mm to 2628.42 mm precipitation class zone). However, there is a significant decrease in landslide density in classes of high precipitation volumes (3 landslides per km2 in 2628.42 mm to 2829.41 mm precipitation class zones and 2.2 landslides per km2 in the 2829.41 mm to 3030.39 mm precipitation class zone). This may be explained by the fact that high rainfall volumes are typically concentrated in high topographical areas (Figure 8), which are not so prone to landslides since the slopes in these regions are usually composed of summits or scarps, weathered down to hard bedrock, or composed of flat mountain peaks. This relationship is also reflected in the relationship between landslide occurrence and slope angle, where landslide activity peaks in intermediate slope angles but decreases in very high slope angles due to the hard material and low weathered layer thickness characteristics of high-angle slopes (Rodrigues Neto, 2020). This demonstrates that localized rainfall volume, even when analyzed in long ranges such as yearly volumes instead of in single event ranges, may be co-relatable with landslide occurrence. The relationship, however, is not a simple direct proportional relation (where landslide occurrence increases directly with mean annual precipitation) but more of a parabola with peak landslide activity observable in intermediate mean annual precipitation zones.

3.4. Event and Long-Term Rainfall Localization Patterns Correlation

3.4.1. Relative Mean Annual Precipitation Differences

When comparing the relative precipitation values and their differences in each XRAIN cell for event precipitation and mean annual precipitation (Table 3), it is observed that few cells present differences below −10% or above +30%, as illustrated in Figure 9. The average difference between cells is 13.83%, with a maximum positive difference of 45.37%, a maximum negative difference of −58.72%, and a minimum of no substantial difference.
The relative precipitation difference values are illustrated in map form, along with landslide points from the 2018 disasters in map form in Figure 10. It is noticed that landslide occurrence increases directly with a positive relative precipitation difference (Figure 11). That is, landslides occurred more frequently in areas where the 2018 disaster event precipitations were more intense than the usual mean annual precipitation, in what are called extreme precipitation anomalies. This result was also reached and presented by Marc et al. [34], who analyzed landslide inventory in relation to both event rainfall and long-term precipitation data, finding a much more compatible match of landslide occurrence with rainfall anomalies relative to 10-year-return rainfall events.

3.4.2. Pearson’s Product-Moment Correlation Coefficient

The calculation of PPMCC by comparing the relative precipitation percentage values of mean annual precipitation between 2016 and 2021 and event precipitation of the 2018 disasters for each XRAIN rainfall cell of the study area resulted in a coefficient value of 0.55, which in Pearson’s correlation scale is a value considered of moderate correlation. The relationship is illustrated in the graph of Figure 12, which shows a proportional relationship between the two analyzed datasets.

4. Conclusions

In order to better comprehend the relationships between precipitation and landslide occurrence and investigate the recurrency of rainfall localization patterns throughout the years, rainfall data were analyzed along different ranges of intervals in terms of intensity, volume, and localization using the landslide events around Kure City (Hiroshima Prefecture) during the July 2018 heavy rain disasters as a study case.
Considering the rainfall events of the July 2018 disasters, it was observed that Kure City experienced heavy continuous rainfall starting at 8:30 AM on 5 July, a condition which continued for about 47 h until the cessation of rainfall at 7:30 AM on 7 July. XRAIN data show that the precipitation accumulated up to 368 mm and that the mean rainfall intensity was 7.8 mm/h. There were two peaks of rainfall intensity, one 35 h into the event at 7:30 PM of 6 July, when rainfall intensity reached 47 mm/h, and another 44 h into the event, at 4:30 AM of 7 July, when rainfall intensity reached 40 mm/h. These peaks are associated with high landslide activity according to records of the disasters. Considering the rainfall localization during the July 2018 disasters in Kure City, it was observed that landslide density peaks in high precipitation class zones, with 16 landslides per km2 in the 403.10 mm to 434.45 mm precipitation zone. There is, however, a decrease in landslide activity in maximum precipitation zones, which is attributed to the flat mountain peak topography or hard rock material associated with elevated areas.
XRAIN data were also utilized together with reports of landslide occurrences in eight locations of Southern Hiroshima in order to calculate an intensity–duration threshold for the area, resulting in the threshold of I = 133.44 × D−0.841, where I is the average rainfall intensity until failure, and D is rainfall duration until failure. When compared with Guzzetti et al.’s [22] collections of rainfall thresholds for landslide activation throughout the world, it is noted that the calculated threshold for Southern Hiroshima is found slightly above the world average.
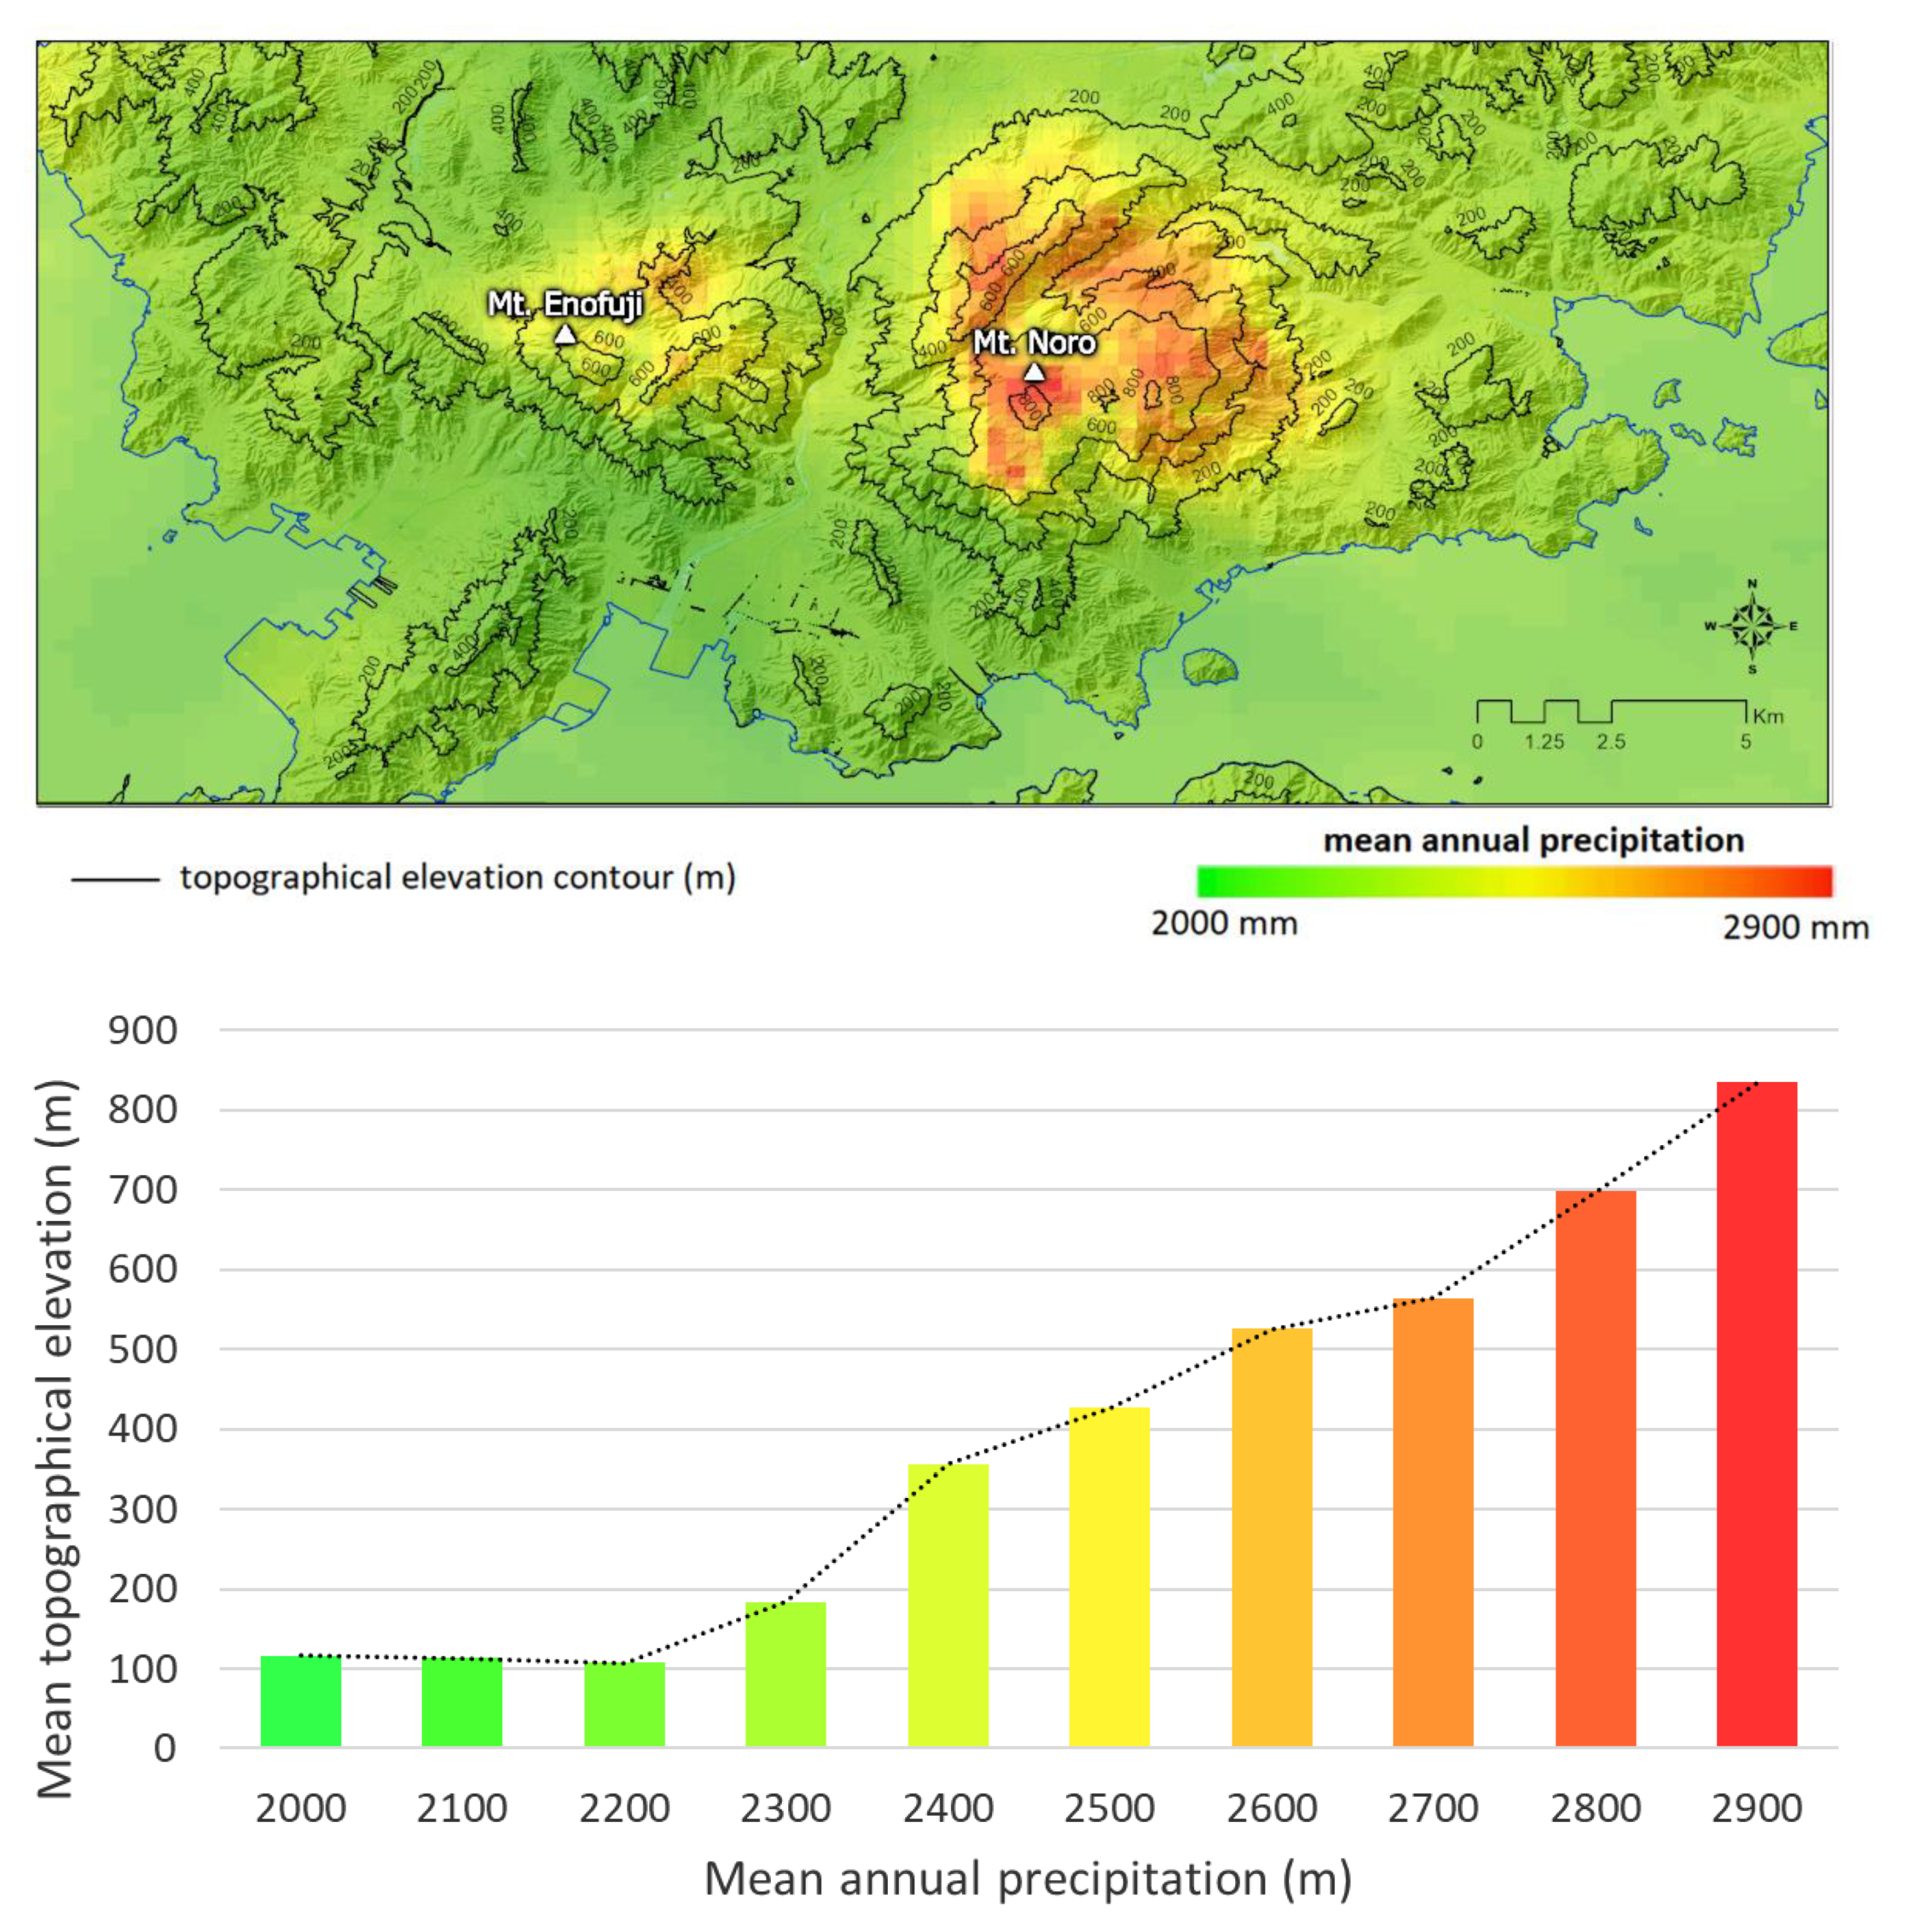
Analysis of rainfall data from 2016 to 2021 demonstrated that the mean annual precipitation amounts to about 2300 mm in the study area. Considering the spatial distribution of rainfall volumes around the study area, the XRAIN data show that precipitation volumes are highly localized, with intense rainfall values being concentrated in locations of elevated topography. However, peak landslide density is found in areas associated with intermediate precipitation volumes, peaking on 9.2 landslides per km2 in the 2427.43 mm to 2628.42 mm precipitation class zone. Maximum precipitation class zones, however, show decreased landslide activity when compared to the intermediate zones.
The decrease in landslide activity in maximum precipitation areas, observed in the mean annual precipitation localization maps and also, to some extent, in the event precipitation localization maps, may be explained by the fact that the maximum precipitation zones are associated with high topographical elevation areas, usually referent to bedrock-weathered mountain peaks and extremely steep slopes, which are not prone to landslide activity.
Comparing the rainfall localization patterns in the study area of the event precipitation during the 47 h of the July 2018 disasters and the mean annual precipitation from 2016 to 2021 by checking the relative precipitation differences in the two datasets indicates that although not many XRAIN cells show differences higher than 30%, particularly high landslide activity is closely related to areas of peak positive relative precipitation difference, that is, where event precipitation was more intense than mean annual precipitation. This conclusion of strong correlation between landslide occurrence and extreme rainfall anomalies is also pointed out by Marc et al. [34].
Using Pearson’s correlation coefficient, an r value of 0.55 was found, which is considered a moderate correlation. Although the correlation is not perfect or even very high, a positive relationship is found, which points out that mean annual precipitation localization patterns may indeed be used to forecast what the localized rainfall may be in a specific future event. It is judged that these patterns are controlled by the topographical features of the area (which is shown in this study by how maximum rainfall volumes are usually concentrated in peak topographical areas) or by meteorological dynamics of rainfall movement.
In this research, it was found that landslide activity is more co-relatable with high precipitation volumes in event rainfall and not so much with mean annual precipitation volumes, where peak landslide density is found in intermediate precipitation zones, though maximum rainfall volumes show a decrease in landslide activity in both observations. Relative precipitation difference, however, was found to be closely related to landslide activity in a directly proportional behavior. An ID rainfall threshold for landslide activation was calculated for the Southern Hiroshima area using XRAIN radar-acquired rainfall data. Finally, it was evidenced that long-range localized precipitation patterns are moderately co-relatable with event precipitation localization patterns. Recommendations for future studies on the subject include using mean annual precipitation data in landslide susceptibility mapping approaches, as well as further investigation into what factors influence rainfall localization.

Author Contributions

J.M.d.S.R.N. conducted all analyses and prepared the manuscript, while N.P.B. supervised the whole work, performed the final check, and helped bring the manuscript into submittable format and structure. N.P.B. also suggested that J.M.d.S.R.N. perform the necessary data analysis and prepare the manuscript text, necessary figures, and tabulated data. All authors have read and agreed to the published version of the manuscript.

Funding

This research received no external funding.

Data Availability Statement

Not applicable.

Acknowledgments

The immensely valuable free access to XRAIN data, widely utilized as a main item in this research, was kindly permitted by the Data Integration and Analysis System (DIAS) office of The University of Tokyo.

Conflicts of Interest

The authors declare no conflict of interest.

References

  1. Geertsema, M.; Highland, L.; Vaugeouis, L. Environmental impact of landslides. In Landslides–Disaster Risk Reduction; Springer: Berlin/Heidelberg, Germany, 2009; pp. 589–607. [Google Scholar]
  2. Yilmaz, I. Landslide susceptibility mapping using frequency ratio, logistic regression, artificial neural networks and their comparison: A case study from Kat landslides (Tokat—Turkey). Comput. Geosci. 2009, 35, 1125–1138. [Google Scholar] [CrossRef]
  3. Petley, D. Global patterns of loss of life from landslides. Geology 2012, 40, 927–930. [Google Scholar] [CrossRef]
  4. Centre for Research on the Epidemiology of Disasters. Economic Losses, Poverty & Disasters 1998–2017. United Nations Office for Disaster Risk Reduction. Available online: https://www.preventionweb.net/files/61119_credeconomiclosses.pdf (accessed on 27 July 2022).
  5. Guzzetti, F.; Cardinali, M.; Reichenbach, P. The Influence of Structural Setting and Lithology on Landslide Type and Pattern. Environ. Eng. Geosci. 1996, II, 531–555. [Google Scholar] [CrossRef]
  6. Dai, F.; Lee, C.; Ngai, Y. Landslide risk assessment and management: An overview. Eng. Geol. 2002, 64, 65–87. [Google Scholar] [CrossRef]
  7. Osanai, N.; Tomita, Y.; Akiyama, K.; Matsushita, T. Technical Note of National Institute for Land and Infrastructure Management No.530; National Institute for Land and Infrastructure Management, Ministry of Land, Infrastructure, Transport and Tourism: Tokyo, Japan, 2009. [Google Scholar]
  8. Canavesi, V.; Camarinha, P.I.M.; Algarve, V.R.; Carneiro, R.L.C.; Alvalá, R.C.S. Análise da susceptibilidade a deslizamentos de terra: Estudo de caso de Paraibuna, SP. In XVI Simpósio Brasileiro de Sensoriamento Remoto; SBSR: Foz do Iguaçu, Brazil, 2013. [Google Scholar]
  9. Matsushi, Y.; Matsuzaki, H.; Makino, H. Testing models of landform evolution by determining the denudation rates of mountainous watersheds using terrestrial cosmogenic nuclides. Trans. Jpn. Geomorphol. Union 2014, 35, 165–185. [Google Scholar]
  10. Geospatial Information Authority of Japan. Information on Heavy Rain in July 2018 (Translated Title). Ministry of Land, Infrastructure, Transport and Tourism. Available online: https://www.gsi.go.jp/BOUSAI/H30.taihuu7gou.html (accessed on 20 June 2020).
  11. Geospatial Information Authority of Japan. Database. Available online: https://www.gsi.go.jp/top.html (accessed on 13 June 2022).
  12. Japanese Meteorological Agency. Emergency Warning Issued to Kyoto and Hyogo Prefectures. Available online: http://www.jma.go.jp/jma/press/1807/06e/kaisetsu2018070623.pdf (accessed on 20 June 2020).
  13. Hiroshima Prefectural Government. July 2018 Heavy Rain Disasters (Translated Title). Available online: https://www.sabo.pref.hiroshima.lg.jp/portal/sonota/sabo/pdf/234_H30_7gouusaigai.pdf (accessed on 20 December 2021).
  14. Hirao, K.; Okubo, S. About the heavy rain disaster—Sediment flow out of Hamada River, Kure City—Some Aspects of the Dispersion Control for the Debris Arrestation. Jpn. Soc. Eros. Control Eng. 1970, 75. [Google Scholar]
  15. Chigira, M. Micro-sheeting of granite and its relationship with landsliding specifically after the heavy rainstorm in June 1999, Hiroshima Prefecture, Japan. Eng. Geol. 2001, 59, 219–231. [Google Scholar] [CrossRef]
  16. Ushiyama, M.; Ohido, S.; Takara, K. The critical line for sediment disaster warning based on precipitation data in Hiroshima Prefecture in June 1999. In Collection of River Technology Papers (Translated Title); Japan Society of Civil Engineers: Tokyo, Japan, 2001; Volume 7. [Google Scholar]
  17. Miura, K.; Anan, S.; Fujimoto, M.; Niimi, T.; Ueda, T.; Okamura, M. Hiroshima—Kure Soil and Sand Disaster Bulletin—Soil and sand damage in the granite area. J. Jpn. Soc. Eng. Geol. 1999, 40, 316–321. [Google Scholar] [CrossRef]
  18. Uchiyama, S.; Sugai, T. Damage characteristics of debris flow disasters caused by heavy rain in Hiroshima City in August 2014. Nat. Disaster Sci. J. 2019, 38. [Google Scholar]
  19. Highland, L.M.; Bobrowsky, P. The Landslide Handbook—A Guide to Understanding Landslides; Circular 1325; U.S. Geological Survey: Reston, VA, USA, 2008; 129p. [Google Scholar]
  20. Guidicini, G.; Iwasa, O.Y. Tentative correlation between rainfall and landslides in a humid tropical environment. Bull. Eng. Geol. Environ. 1977, 16, 13–20. [Google Scholar] [CrossRef]
  21. Caine, N. The Rainfall Intensity—Duration Control of Shallow Landslides and Debris Flows. Geogr. Ann. Ser. A Phys. Geogr. 1980, 62, 23–27. [Google Scholar]
  22. Guzzetti, F.; Peruccacci, S.; Rossi, M.; Stark, C.P. Rainfall thresholds for the initiation of landslides in central and southern Europe. Meteorol. Atmos. Phys. 2007, 98, 239–267. [Google Scholar] [CrossRef]
  23. Dahal, R.K.; Hasegawa, S. Representative rainfall thresholds for landslides in the Nepal Himalaya. Geomorphology 2008, 100, 429–443. [Google Scholar] [CrossRef]
  24. Dahal, R.K. Rainfall-induced Landslides in Nepal. Int. J. Eros. Control Eng. 2012, 5, 1–8. [Google Scholar] [CrossRef]
  25. Wang, F.; Wu, Y.-H.; Yang, H.; Tanida, Y.; Kamei, A. Preliminary investigation of the 20 August 2014 debris flows triggered by a severe rainstorm in Hiroshima City, Japan. Geoenviron. Disasters 2015, 2, 17. [Google Scholar] [CrossRef]
  26. Pennington, C.; Dijkstra, T.; Lark, M.; Dashwood, C.; Harrison, A.; Freeborough, K. Antecedent Precipitation as a Potential Proxy for Landslide Incidence in South West United Kingdom. In Landslide Science for Safer Geoenvironment; Springer: Cham, Switzerland, 2014; Volume 1, pp. 253–259. [Google Scholar]
  27. Wigley, T.M.L.; Lough, J.M.; Jones, P.D. Spatial patterns of precipitation in England and Wales and a revised, homogeneous England and Wales precipitation series. Int. J. Climatol. 1984, 4, 1–25. [Google Scholar] [CrossRef]
  28. Obled, C.; Wendling, J.; Beven, K. The sensitivity of hydrological models to spatial rainfall patterns: An evaluation using observed data. J. Hydrol. 1994, 159, 305–333. [Google Scholar] [CrossRef]
  29. Ito, M.; Mitchell, M.J.; Driscoll, C.T. Spatial patterns of precipitation quantity and chemistry and air temperature in the Adirondack region of New York. Atmos. Environ. 2002, 36, 1051–1062. [Google Scholar] [CrossRef]
  30. Kansakar, S.R.; Hannah, D.M.; Gerrard, J.; Rees, G. Spatial pattern in the precipitation regime of Nepal. Int. J. Clim. 2004, 24, 1645–1659. [Google Scholar] [CrossRef]
  31. Anders, A.; Roe, G.H.; Hallet, B.; Montgomery, D.R.; Finnegan, N.J.; Putkonen, J. Spatial patterns of precipitation and topography in the Himalaya. GSA Bull. Spec. Pap. 2006, 398, 39–53. [Google Scholar]
  32. Vélez, A.; Martin-Vide, J.; Royé, D. Spatial analysis of daily precipitation concentration in Puerto Rico. Theor. Appl. Climatol. 2019, 136, 1347–1355. [Google Scholar] [CrossRef]
  33. Yokoe, Y.; Kita, M.; Uchida, T.; Kawahara, Y. Characteristics of precipitation system in Hiroshima prefecture during the heavy rainfall event of July 2018 observed using XRAIN data. J. JSCE 2021, 9, 212–220. [Google Scholar] [CrossRef] [PubMed]
  34. Marc, O.; Gosset, M.; Saito, H.; Uchida, T.; Malet, J. Spatial Patterns of Storm-Induced Landslides and Their Relation to Rainfall Anomaly Maps. Geophys. Res. Lett. 2019, 46, 11167–11177. [Google Scholar] [CrossRef]
  35. Moriyama, T.; Hirano, M. Relationship between Maximum Three-Hour Cumulative Rainfall and Landslide Area. In Proceedings of the 21st IAHR-APD Congress, Yogyakarta, Indonesia, 2–5 September 2018. [Google Scholar]
  36. Cremonini, R.; Tiranti, D. The Weather Radar Observations Applied to Shallow Landslides Prediction: A Case Study From North-Western Italy. Front. Earth Sci. 2018, 6, 134. [Google Scholar] [CrossRef]
  37. Harjupa, W.; Nakakita, E.; Sumida, Y.; Yamaguchi, K. Fundamental investigation of generation of guerilla-heavy rainfall using himawari-8 and xrain information in kinki region. J. Jpn. Soc. Civil Eng. Ser. B1 Hydraul. Eng. 2018, 74, I_283–I_288. [Google Scholar] [CrossRef]
  38. Tsuchiya, S.; Kawasaki, M.; Godo, H. Improvement of the radar rainfall accuracy of xrain by modifying of rainfall attenuation correction and compositing radar rainfall. J. Jpn. Soc. Civil Eng. Ser. B1 Hydraul. Eng. 2015, 71, I_457–I_462. [Google Scholar]
  39. Masuda, Y.; Itado, M.; Taniguchi, K.; Sakai, K.; Ueda, H.; Yamashita, K.; Nakai, S. Improving of winter quantitative precipitation using XRAIN. J. Jpn. Soc. Civ. Eng. Ser. B1 Hydraul. Eng. 2018, 74, I_85–I_90. [Google Scholar] [CrossRef] [PubMed]
  40. Yamada, N.; Higashimoto, S.; Mizuno, K.; Hiroshima, T.; Suda, Y. Hiroshima 1:200,000 Geological Map; NI-53-33; Geological Survey of Japan: Tsukuba, Japan, 1986. [Google Scholar]
  41. Kamada, M.; Nakagoshi, N. Landscape structure and the disturbance regime at three rural regions in Hiroshima Prefecture, Japan. Lands. Ecol. 1996, 11, 15–25. [Google Scholar] [CrossRef]
  42. Japanese Meteorological Agency. Kure: Average Yearly and Monthly Values (Translated Title). Available online: http://www.data.jma.go.jp/ (accessed on 20 June 2020).
  43. Data Integration & Analysis System. XRAIN Realtime Precipitation Data. The University of Tokyo, Sponsored by the Ministry of Education, Culture, Sports, Science and Technology. Available online: https://diasjp.net/ (accessed on 20 June 2022).
  44. Jakob, M.; Hungr, O.; Wieczorek, G.F.; Glade, T. Climatic factors influencing occurrence of debris flows. In Debris-Flow Hazards and Related Phenomena; Springer: Berlin/Heidelberg, Germany, 2005; pp. 325–362. [Google Scholar]
  45. Pennsylvania State University. Pearson Correlation Coefficient R. Simple Linear Regression (SLR) Model. Applied Regression Analysis. 2018. Available online: https://online.stat.psu.edu/stat462/node/96/ (accessed on 20 June 2022).
Figure 1. Study area around Kure, Hiroshima Prefecture, Southwest Japan, illustrating topographical elevation and landslide occurrences in July 2018 disasters. Source: [10,11].
Geosciences 13 00245 g001
Figure 2. A typical aerial picture of the aftermath of multiple landslides occurred in the July 2018 heavy rain-induced disasters in Kure City, Hiroshima Prefecture. Source: [13].
Geosciences 13 00245 g002
Figure 3. General flow of the current research.
Geosciences 13 00245 g003
Figure 4. Localized accumulated precipitation between 5 July 8:30 AM and 7 July 7:30 AM in the study area (top) and accompanying bar graphs of landslide density per precipitation class (bottom). Precipitation classes were divided according to equal intervals in total precipitation volume. Values above each bar in the graph represent the number of landslides in the respective zone.
Geosciences 13 00245 g004
Figure 5. Graph illustrating the history of rainfall over the course of 47 h from 5 July 8:30 AM to 7 July 7:30 AM in the study area.”
Geosciences 13 00245 g005
Figure 6. Intensity–duration threshold for Southern Hiroshima in comparison with the Guzzetti et al. (2007) [22] collection of ID thresholds.
Geosciences 13 00245 g006
Figure 7. Localized mean annual precipitation for the years 2016 through 2021 (XRAIN radar-acquired data), along with landslide occurrence points recorded from the July 2018 disasters in the study area of Kure City (on top), as well as bar graphs indicating landslide density in each precipitation class (bottom). Precipitation classes were divided according to equal intervals in total precipitation volume. Values above each bar represent the number of landslides in the respective zone.
Geosciences 13 00245 g007
Figure 8. Relationship between MAP from 2016 to 2021 (represented by green-red color grading) and topographical elevation (represented by contour lines), as well as bar graphs indicating the mean topographical in relation to the mean annual precipitation. It is noticeable that high precipitation values are concentrated in peak elevation locations.
Geosciences 13 00245 g008
Figure 9. Number of XRAIN cells for relative precipitation difference classes. A concentration of cells near the 0% mark would indicate a good fit and not much change in localization patterns between event precipitation and mean annual precipitation.
Geosciences 13 00245 g009
Figure 10. Relative precipitation difference (amount in which event precipitation exceeds mean annual precipitation) seen in map form along with landslides from the 2018 disasters.
Geosciences 13 00245 g010
Figure 11. Graph showing the relationship between landslide density and relative precipitation difference. It is noticeable that high landslide activity takes place in areas where the relative event precipitation is more intense than the relative mean annual precipitation.
Geosciences 13 00245 g011
Figure 12. Pearson’s correlation coefficient graph for the correlation of mean annual precipitation and event precipitation localization values after being normalized to percentage values. The coefficient’s r value resulted in 0.55, which is considered representative of moderate correlation.
Geosciences 13 00245 g012
Table 1. Landslides events of the July 2018 Southern Hiroshima disasters reported by Hiroshima Prefecture Civil Engineering and Construction Bureau Erosion Control Division [13].
LocationEvent TimeDuration Until Event (h)Average Intensity (mm/h)
South Kuchida, Asakita Ward, Hiroshima City6 July 2018 18:4034:107.66
7-chome, Yanohigashi, Aki Ward, Hiroshima City6 July 2018 19:1034:407.22
Tenno, Kure City6 July 2018 19:1034:406.78
Koyaura, Sakamachi, Aki District6 July 2018 19:1534:457.73
5-chome, Kawakado, Kumano-cho, Aki-gun6 July 2018 19:5035:207.52
5-chome, Minatomachi, Takehara City6 July 2018 21:3037:006.43
6-chome, Kihara, Mihara City7 July 2018 0:4040:106.43
Sakuramachi, Onomichi7 July 2018 7:1046:406.73
Table 2. Spatial minimum, maximum, and average values of annual precipitation volumes between the years of 2016 and 2021 for the study area of Kure City, in Southern Hiroshima, acquired with XRAIN data.
Year/PeriodMinimum (mm)Maximum (mm)Average (mm)
20162336.93440.22620.3
20171861.03268.12125.4
20182166.73116.12467.9
20191503.32505.81852.7
20202067.83285.22383.3
20212039.33052.62352.5
2016–20212025.53030.42300.3
Table 3. Data on relative precipitation (percentage of maximum precipitation in the analyzed period) cells for the study area, XRAIN radar-acquired rainfall data. The difference represents the amount in which relative event precipitation exceeds (for positive values) or falls behind (for negative values) the relative mean annual precipitation.
Relative PrecipitationNumber of LandslidesNumber of XRAIN CellsLandslides Per Square km
−50%181.88
−40%0130
−30%0190
−20%91051.39
−10%1104833.95
0%1758033.47
+10%18610023.01
+20%2639764.15
+30%1926424.83
+40%19225911.76
+50%412524.74
Disclaimer/Publisher’s Note: The statements, opinions and data contained in all publications are solely those of the individual author(s) and contributor(s) and not of MDPI and/or the editor(s). MDPI and/or the editor(s) disclaim responsibility for any injury to people or property resulting from any ideas, methods, instructions or products referred to in the content.

