

Conceptual Model of Expansive Rock or Soil Swelling


Abstract
:1. Introduction
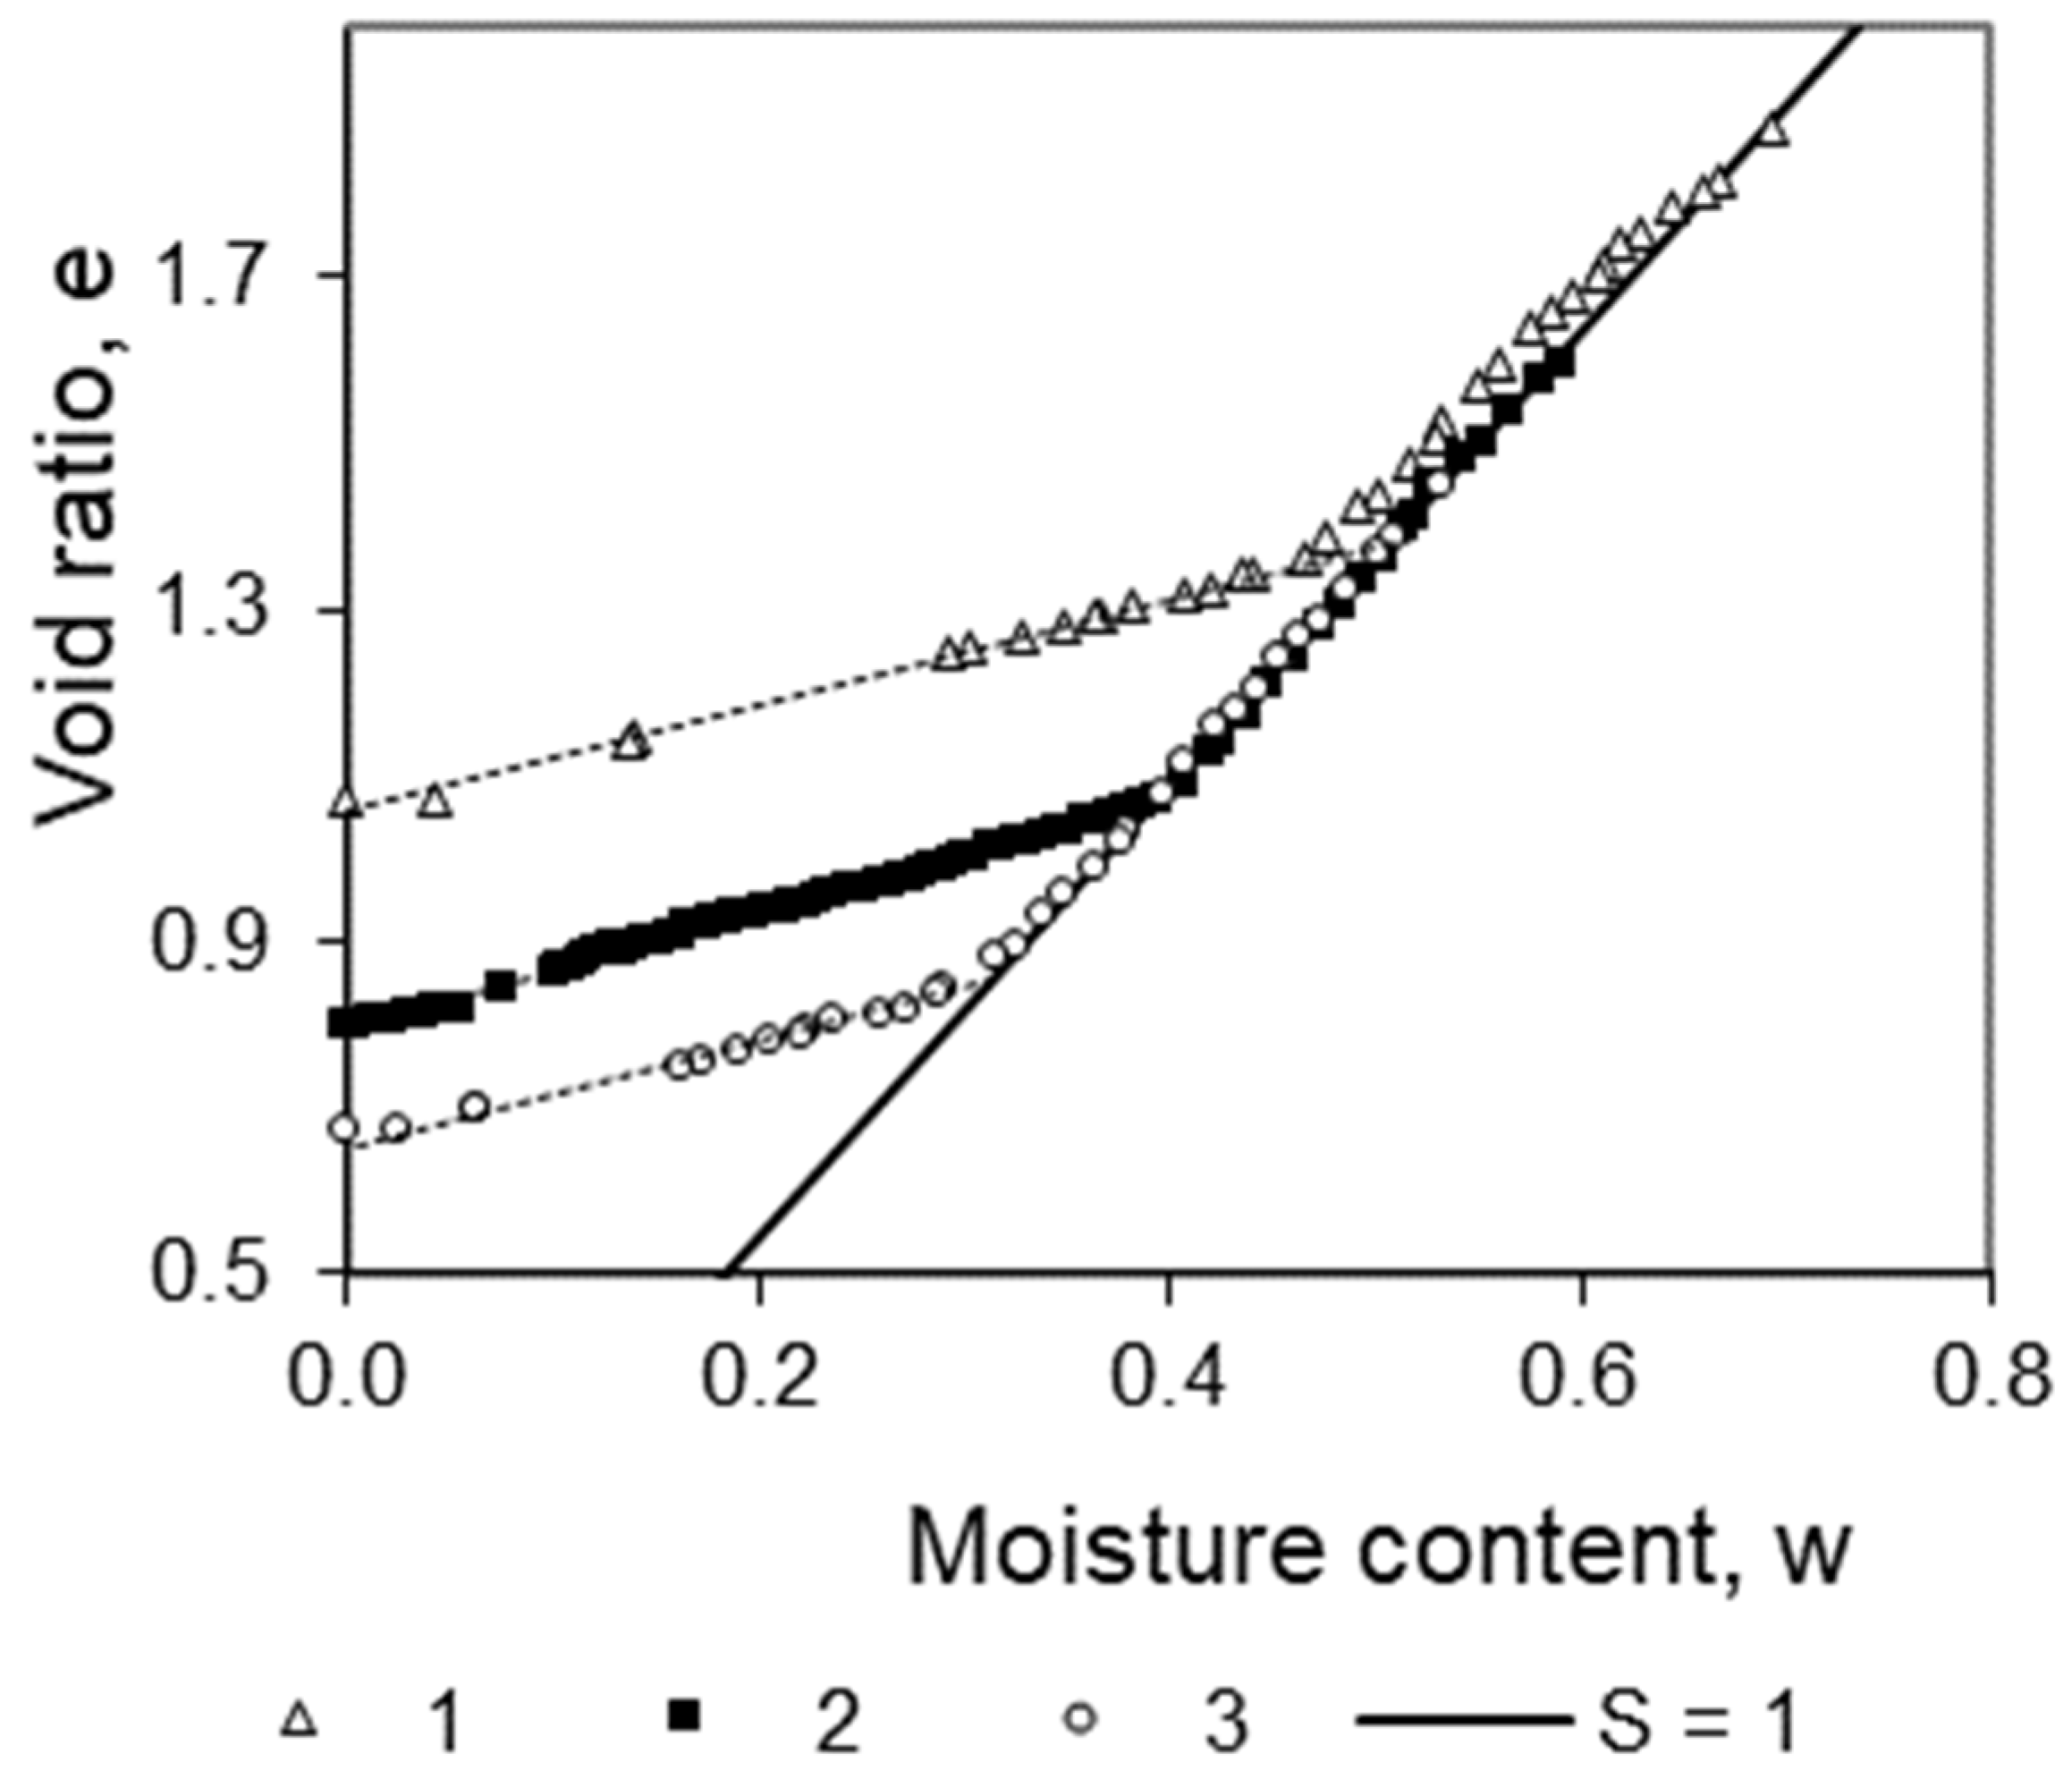
2. Shrinkage Curve
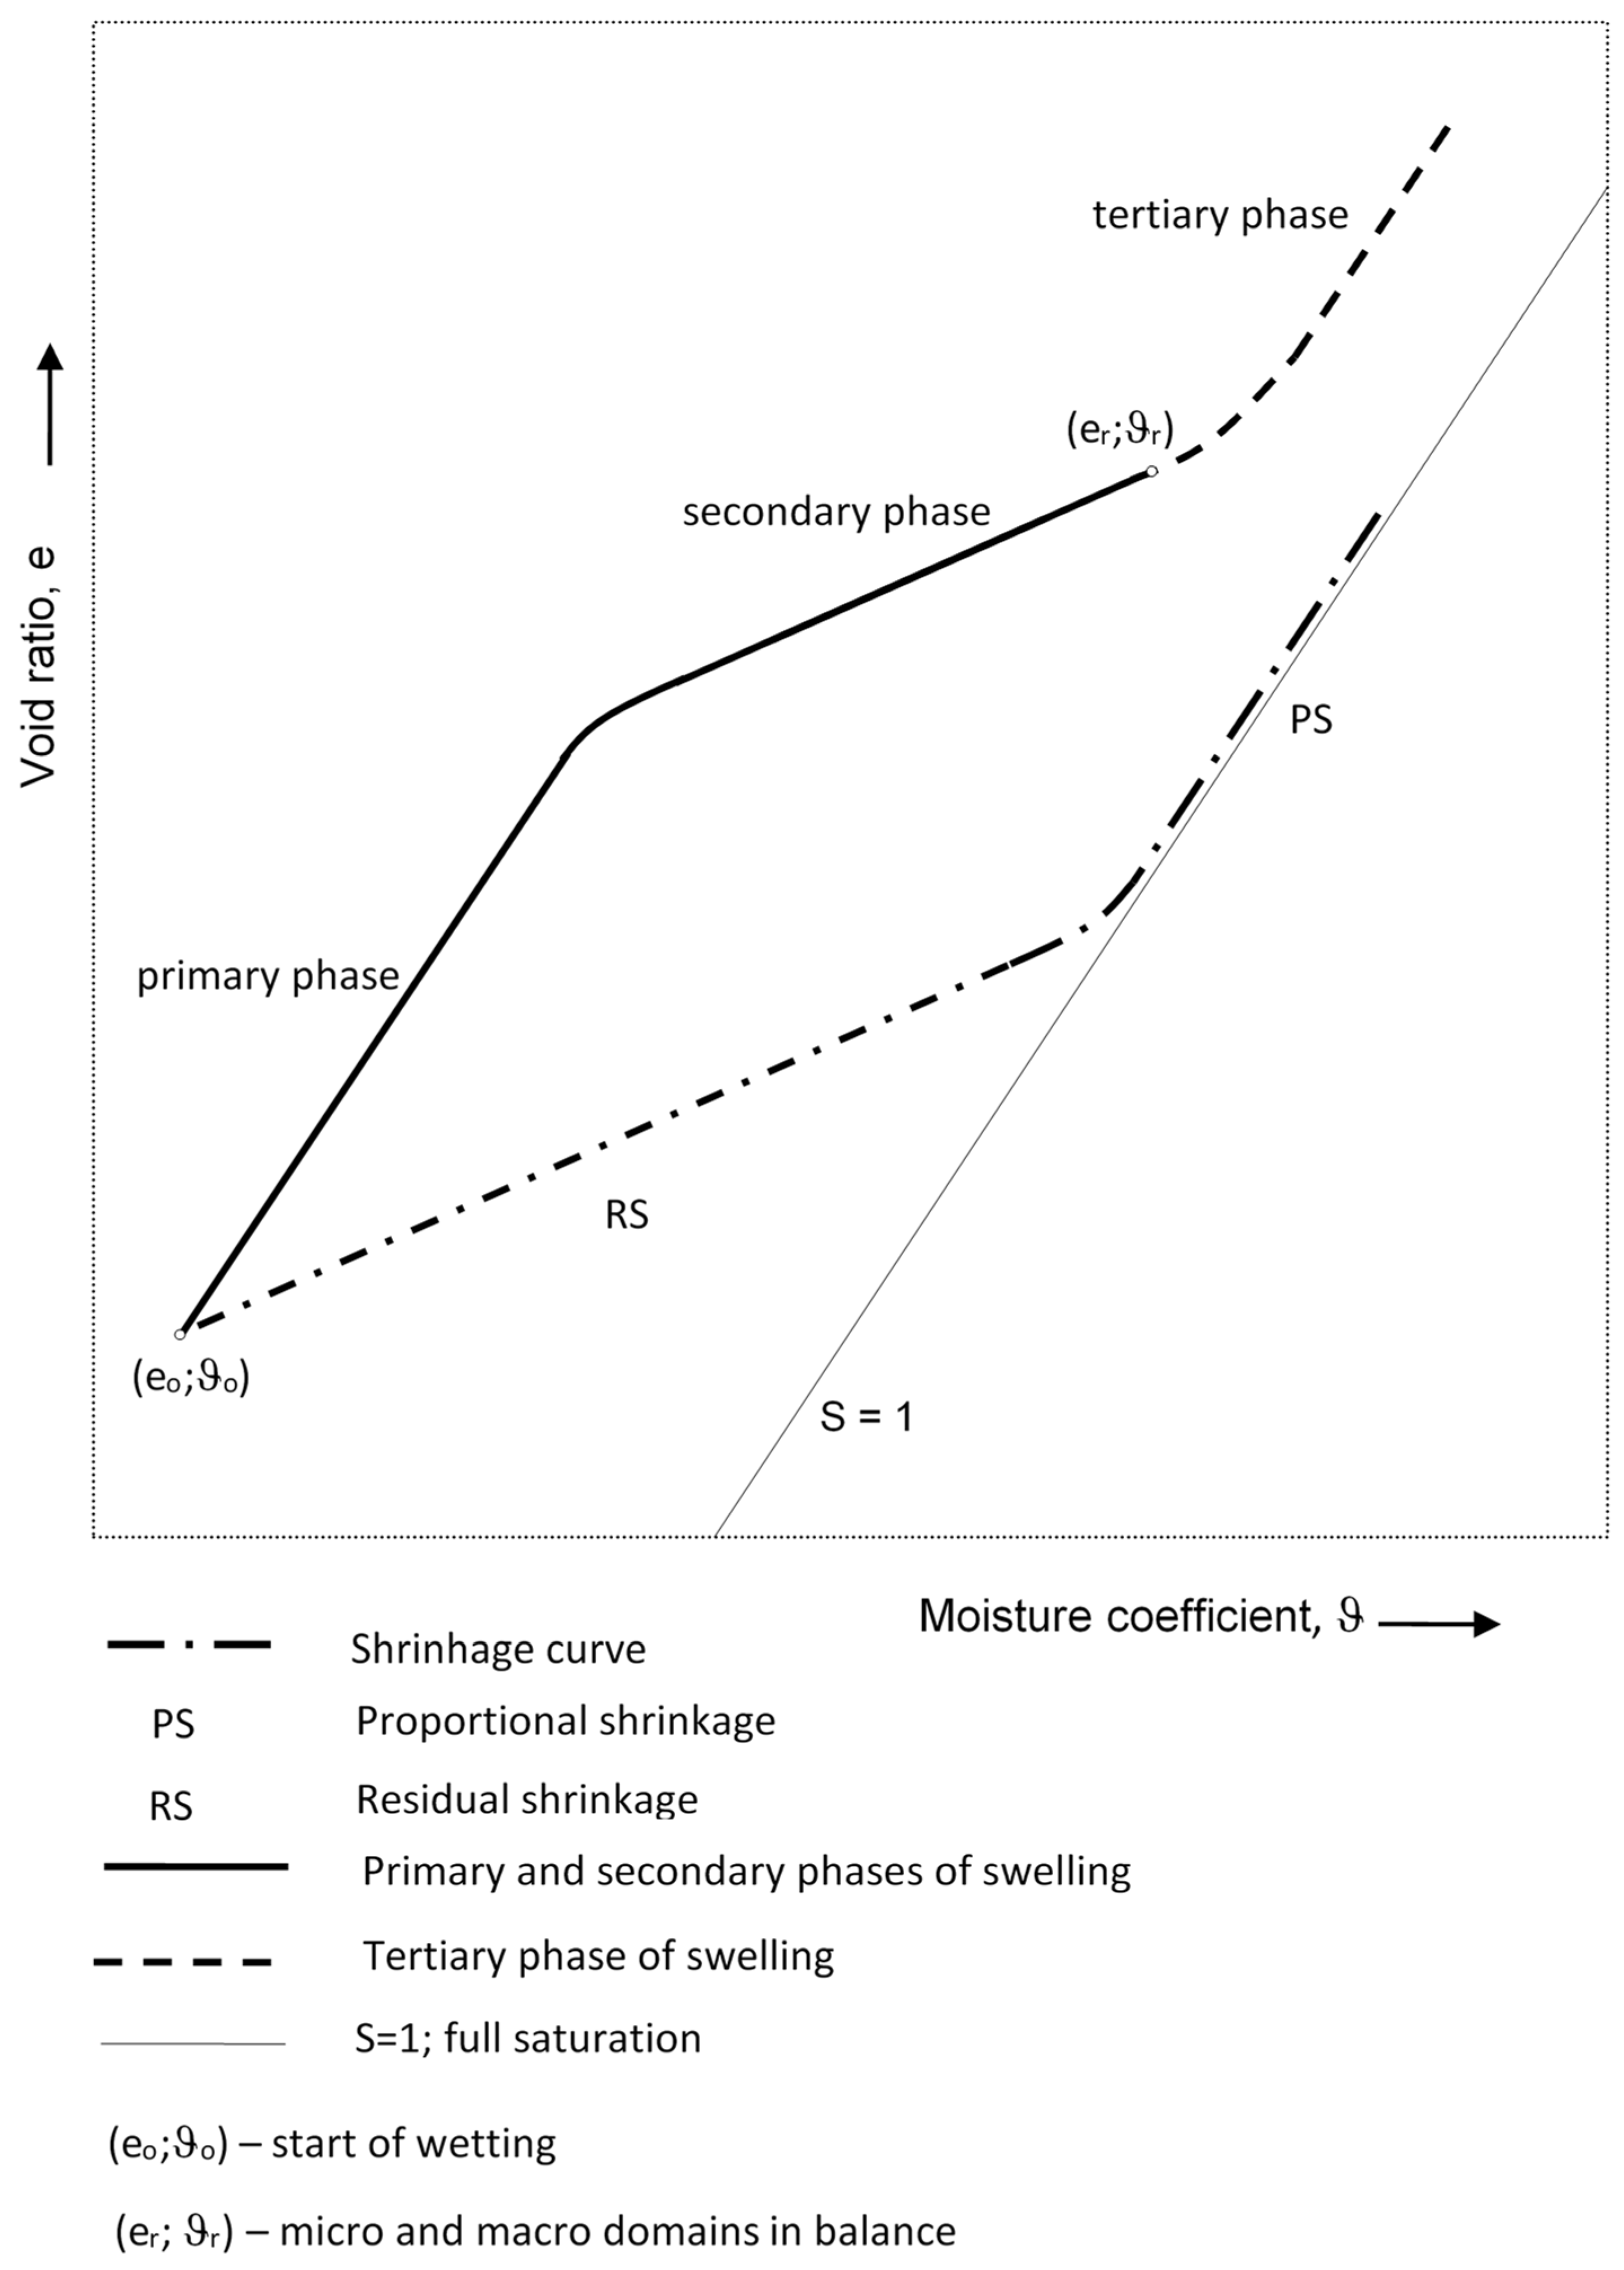
3. Conceptual Model of Swelling
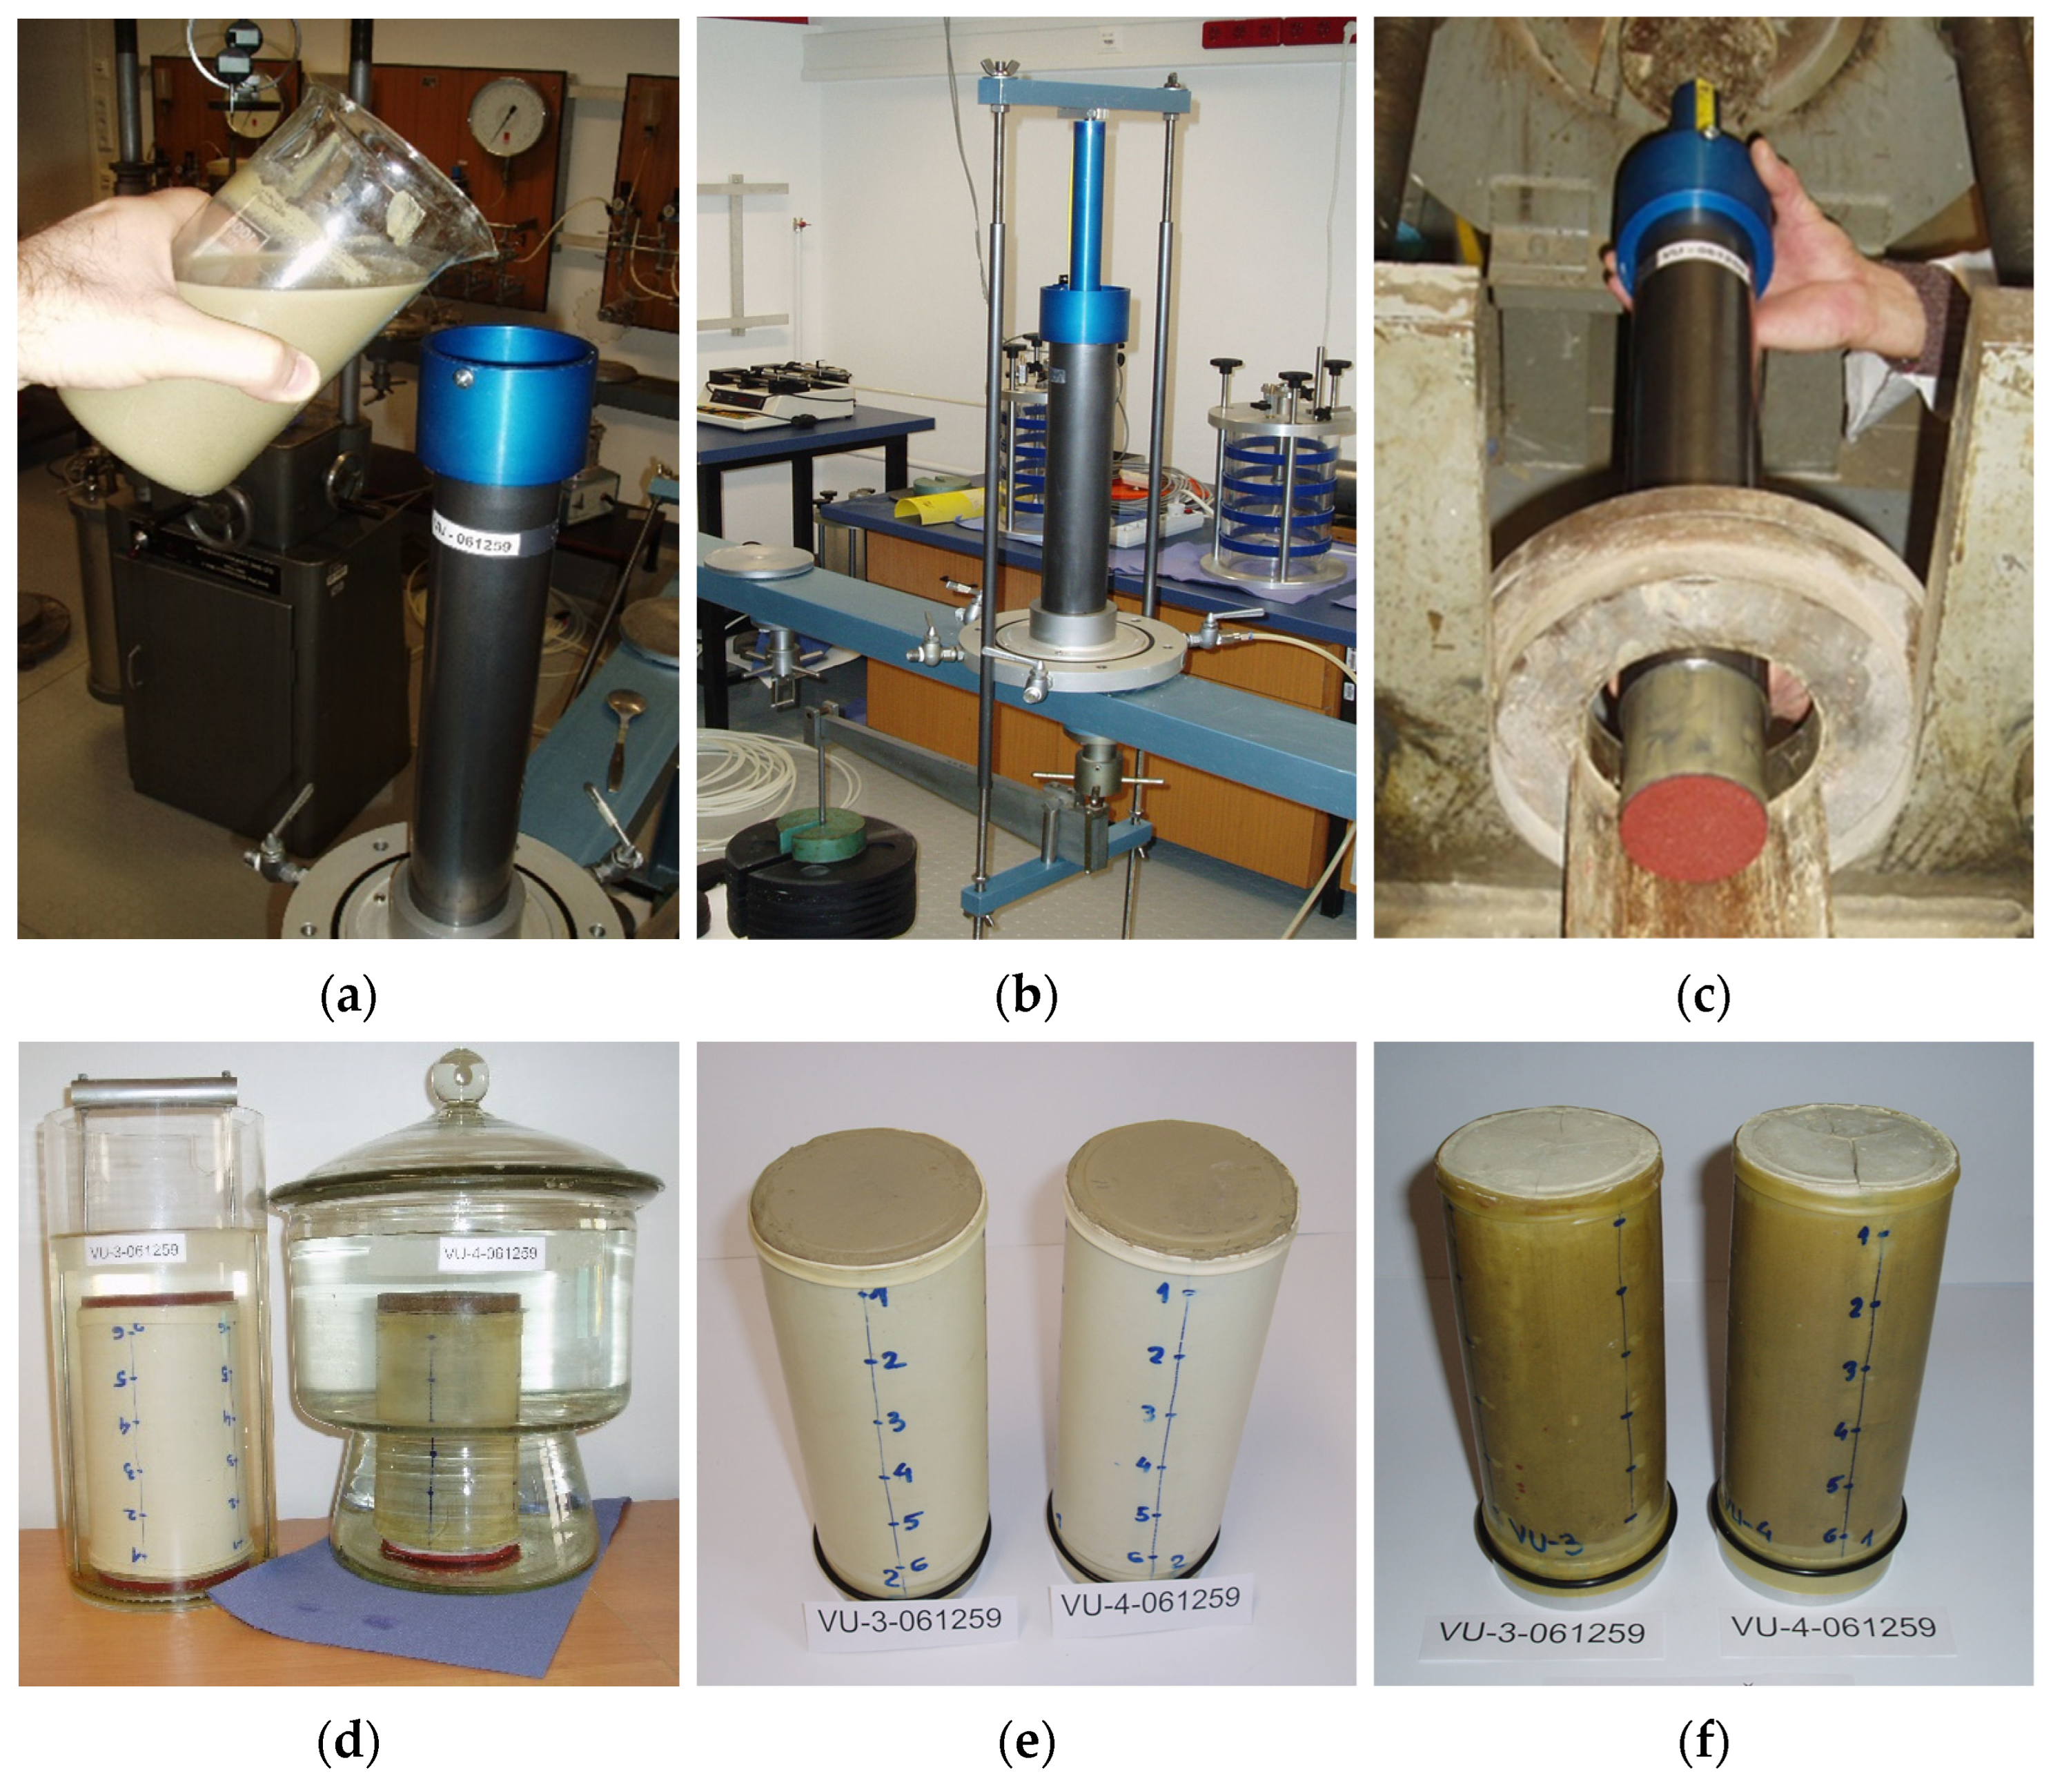
4. Material and Test Procedures
5. Test Results
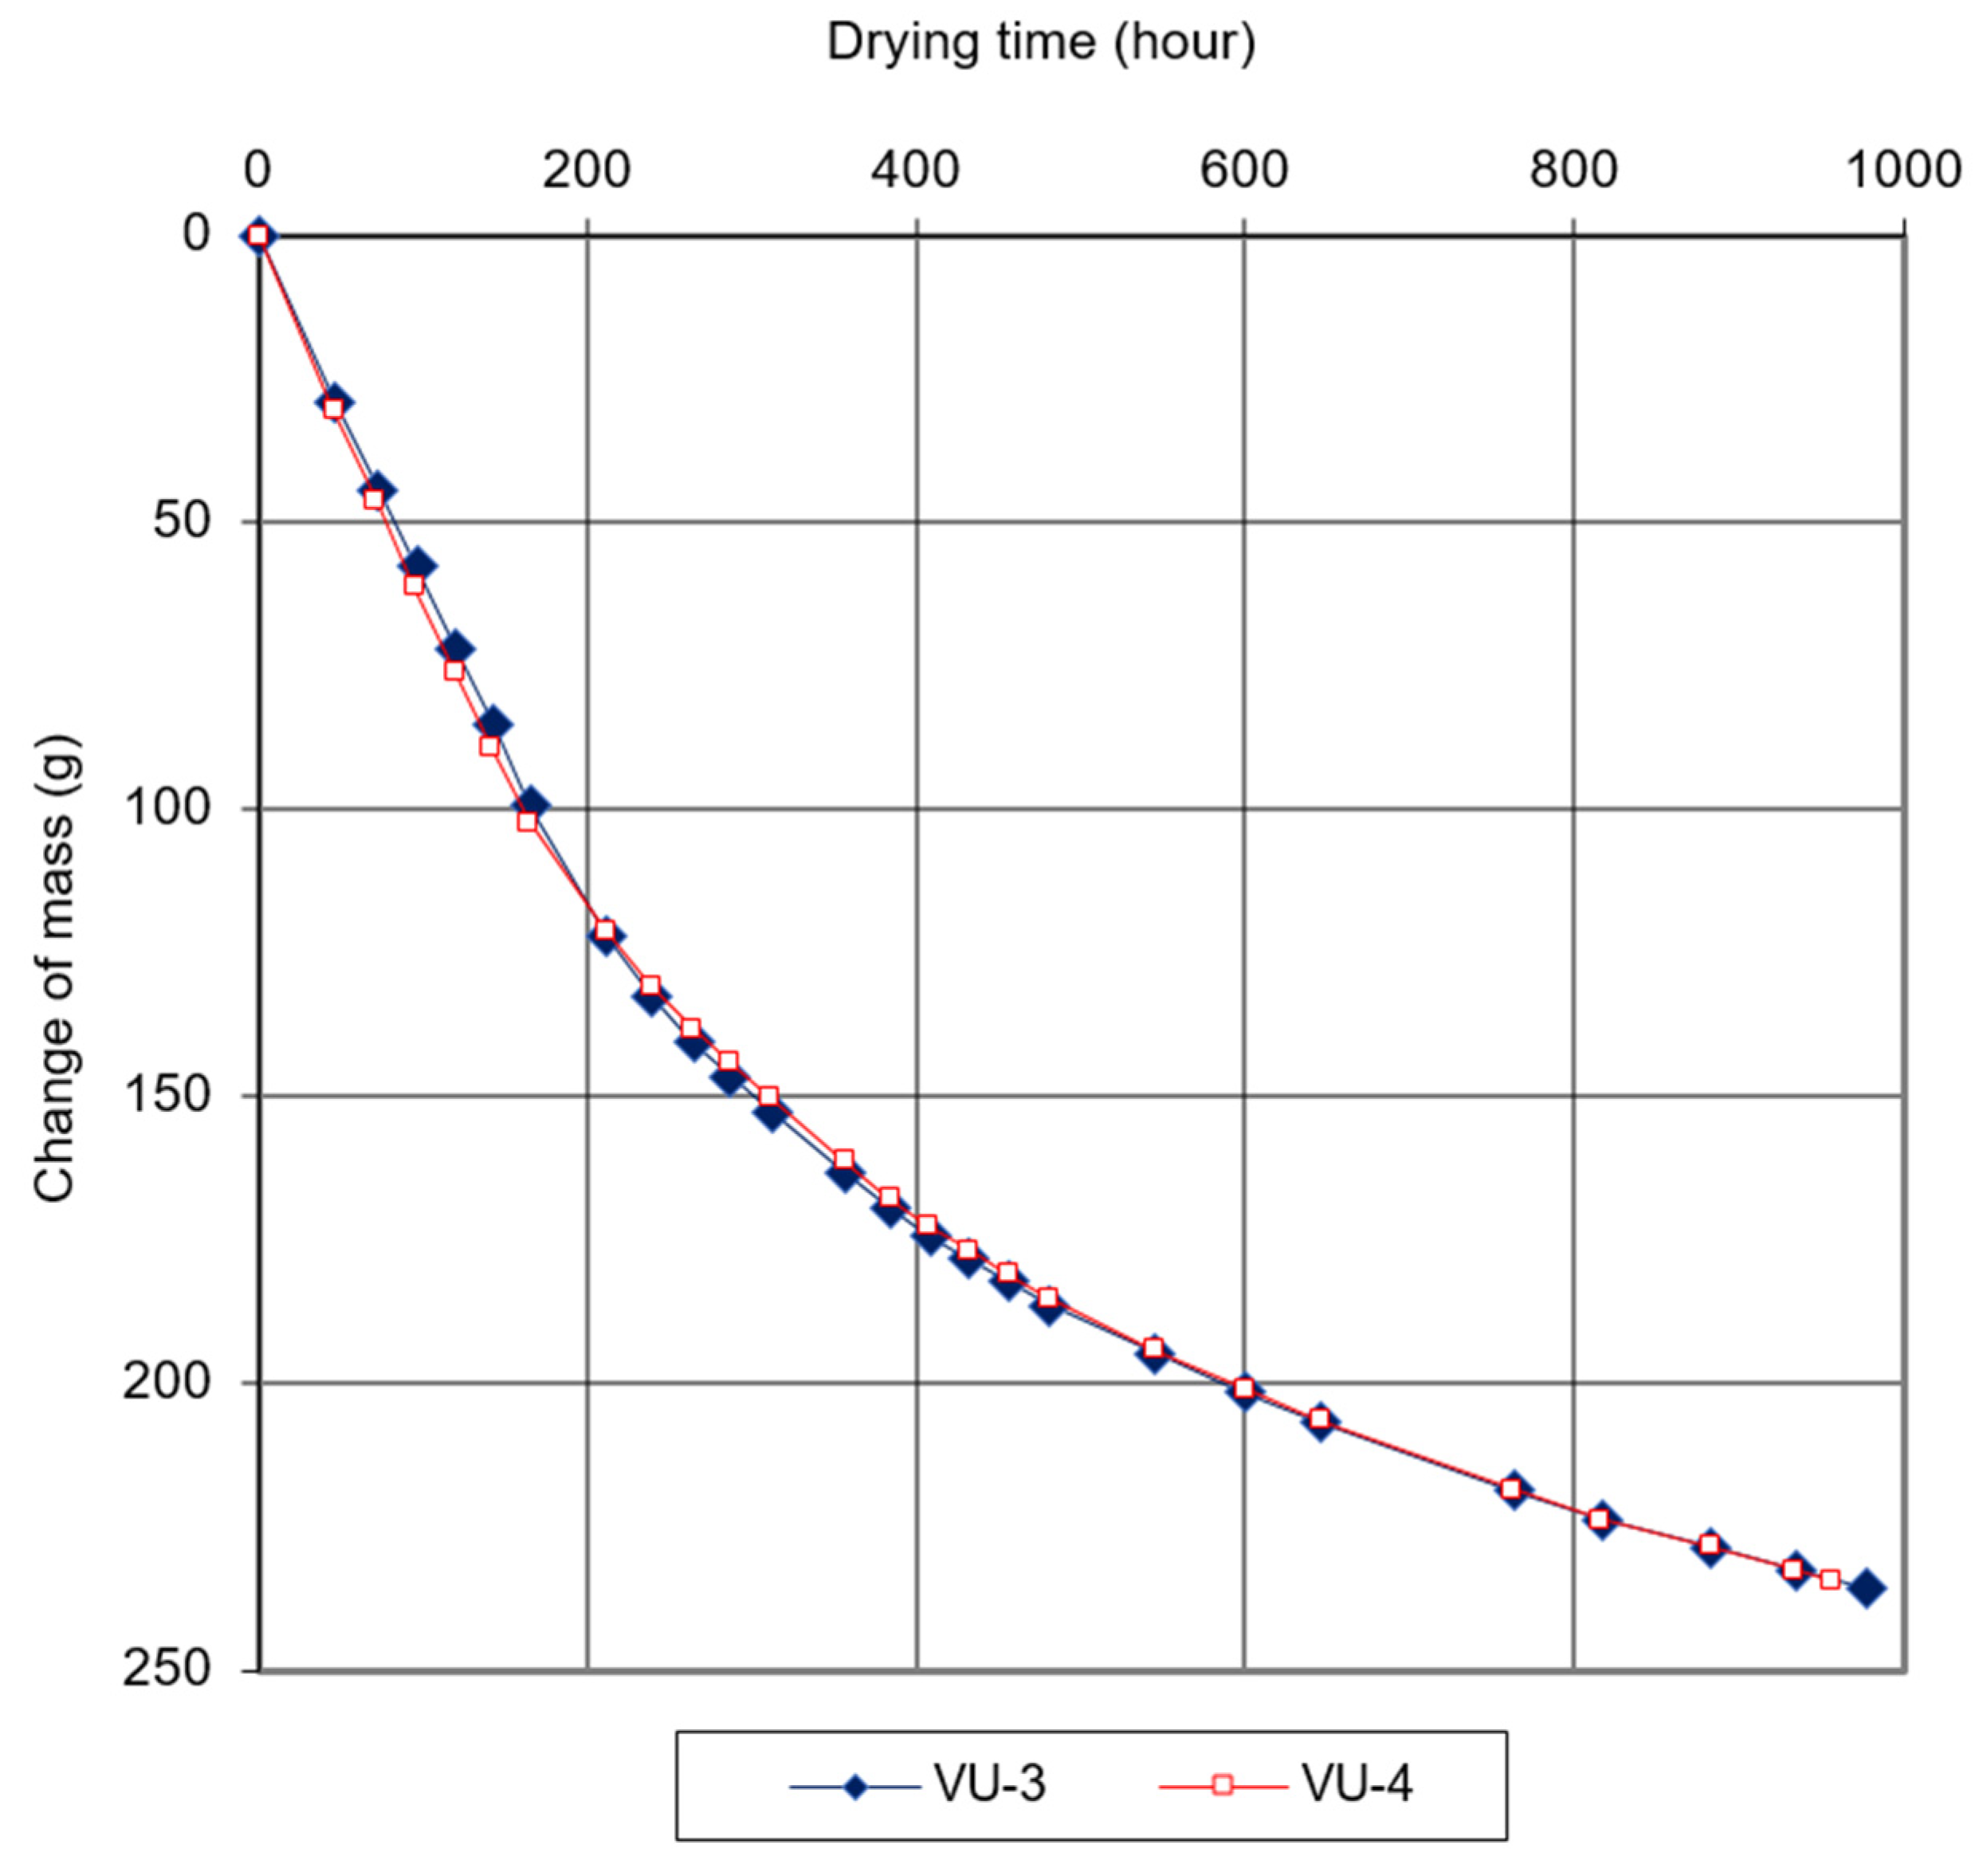
5.1. Drying of Twins (VU-3 and VU-4)
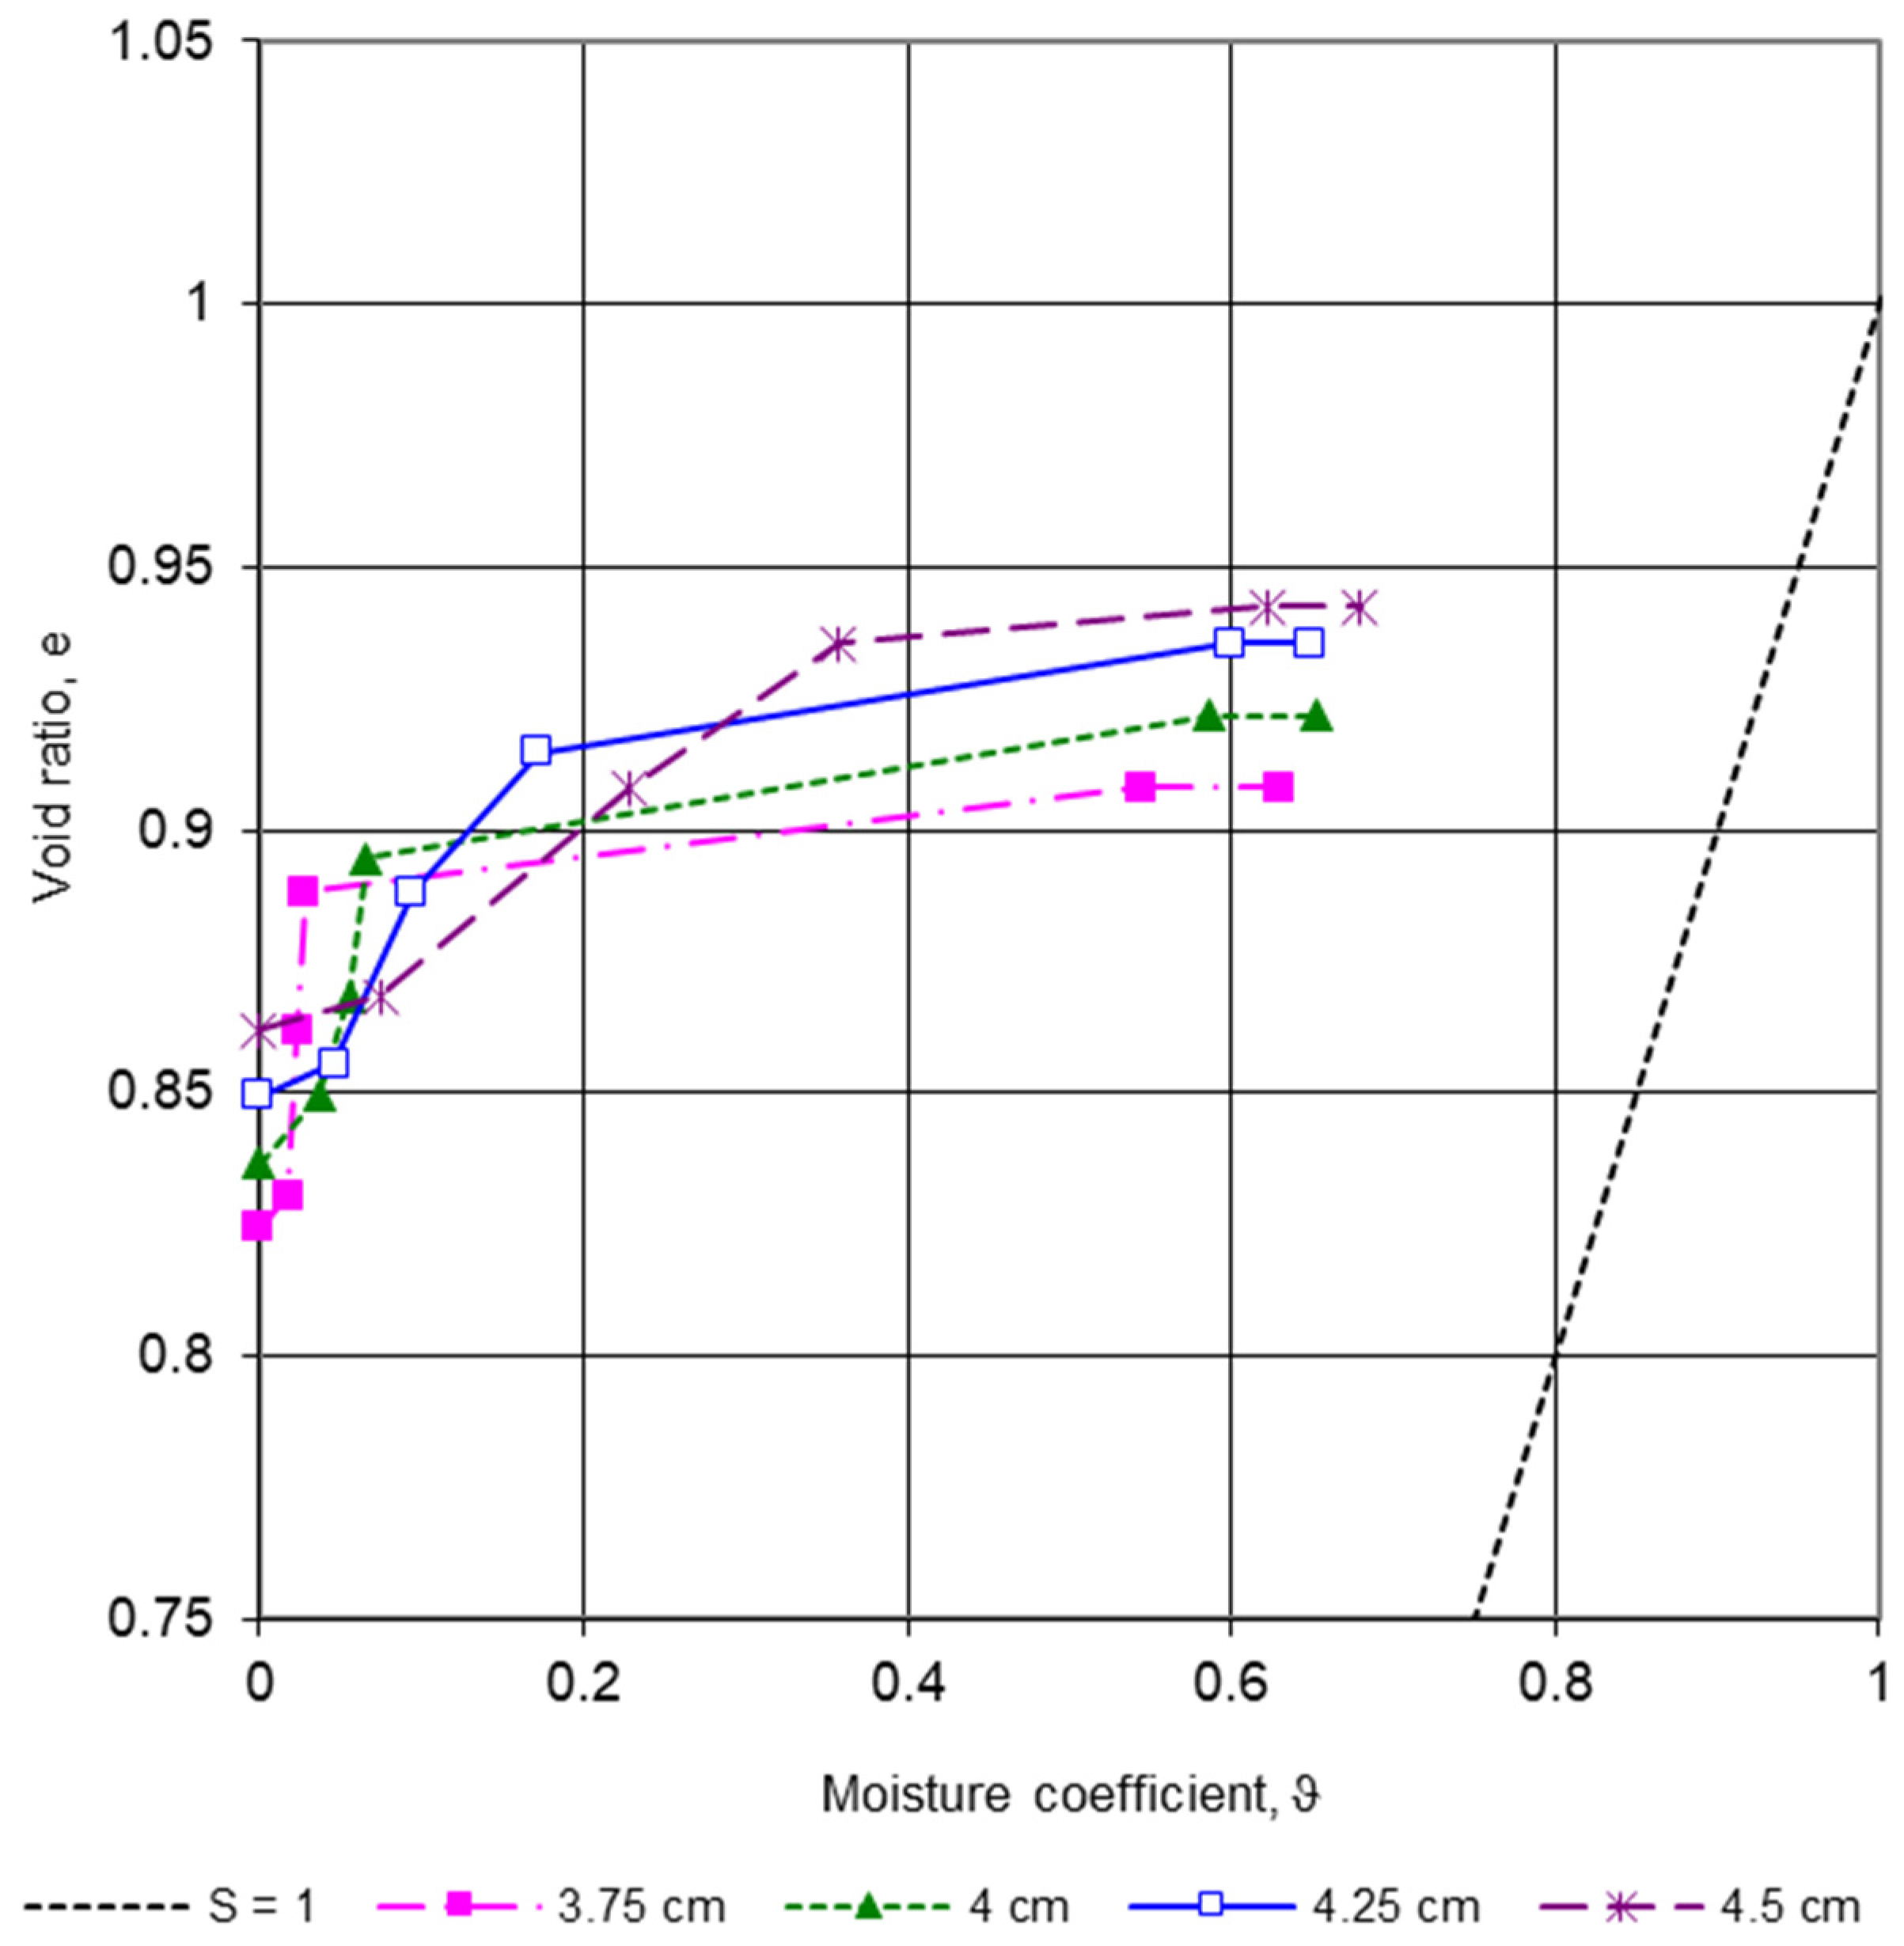
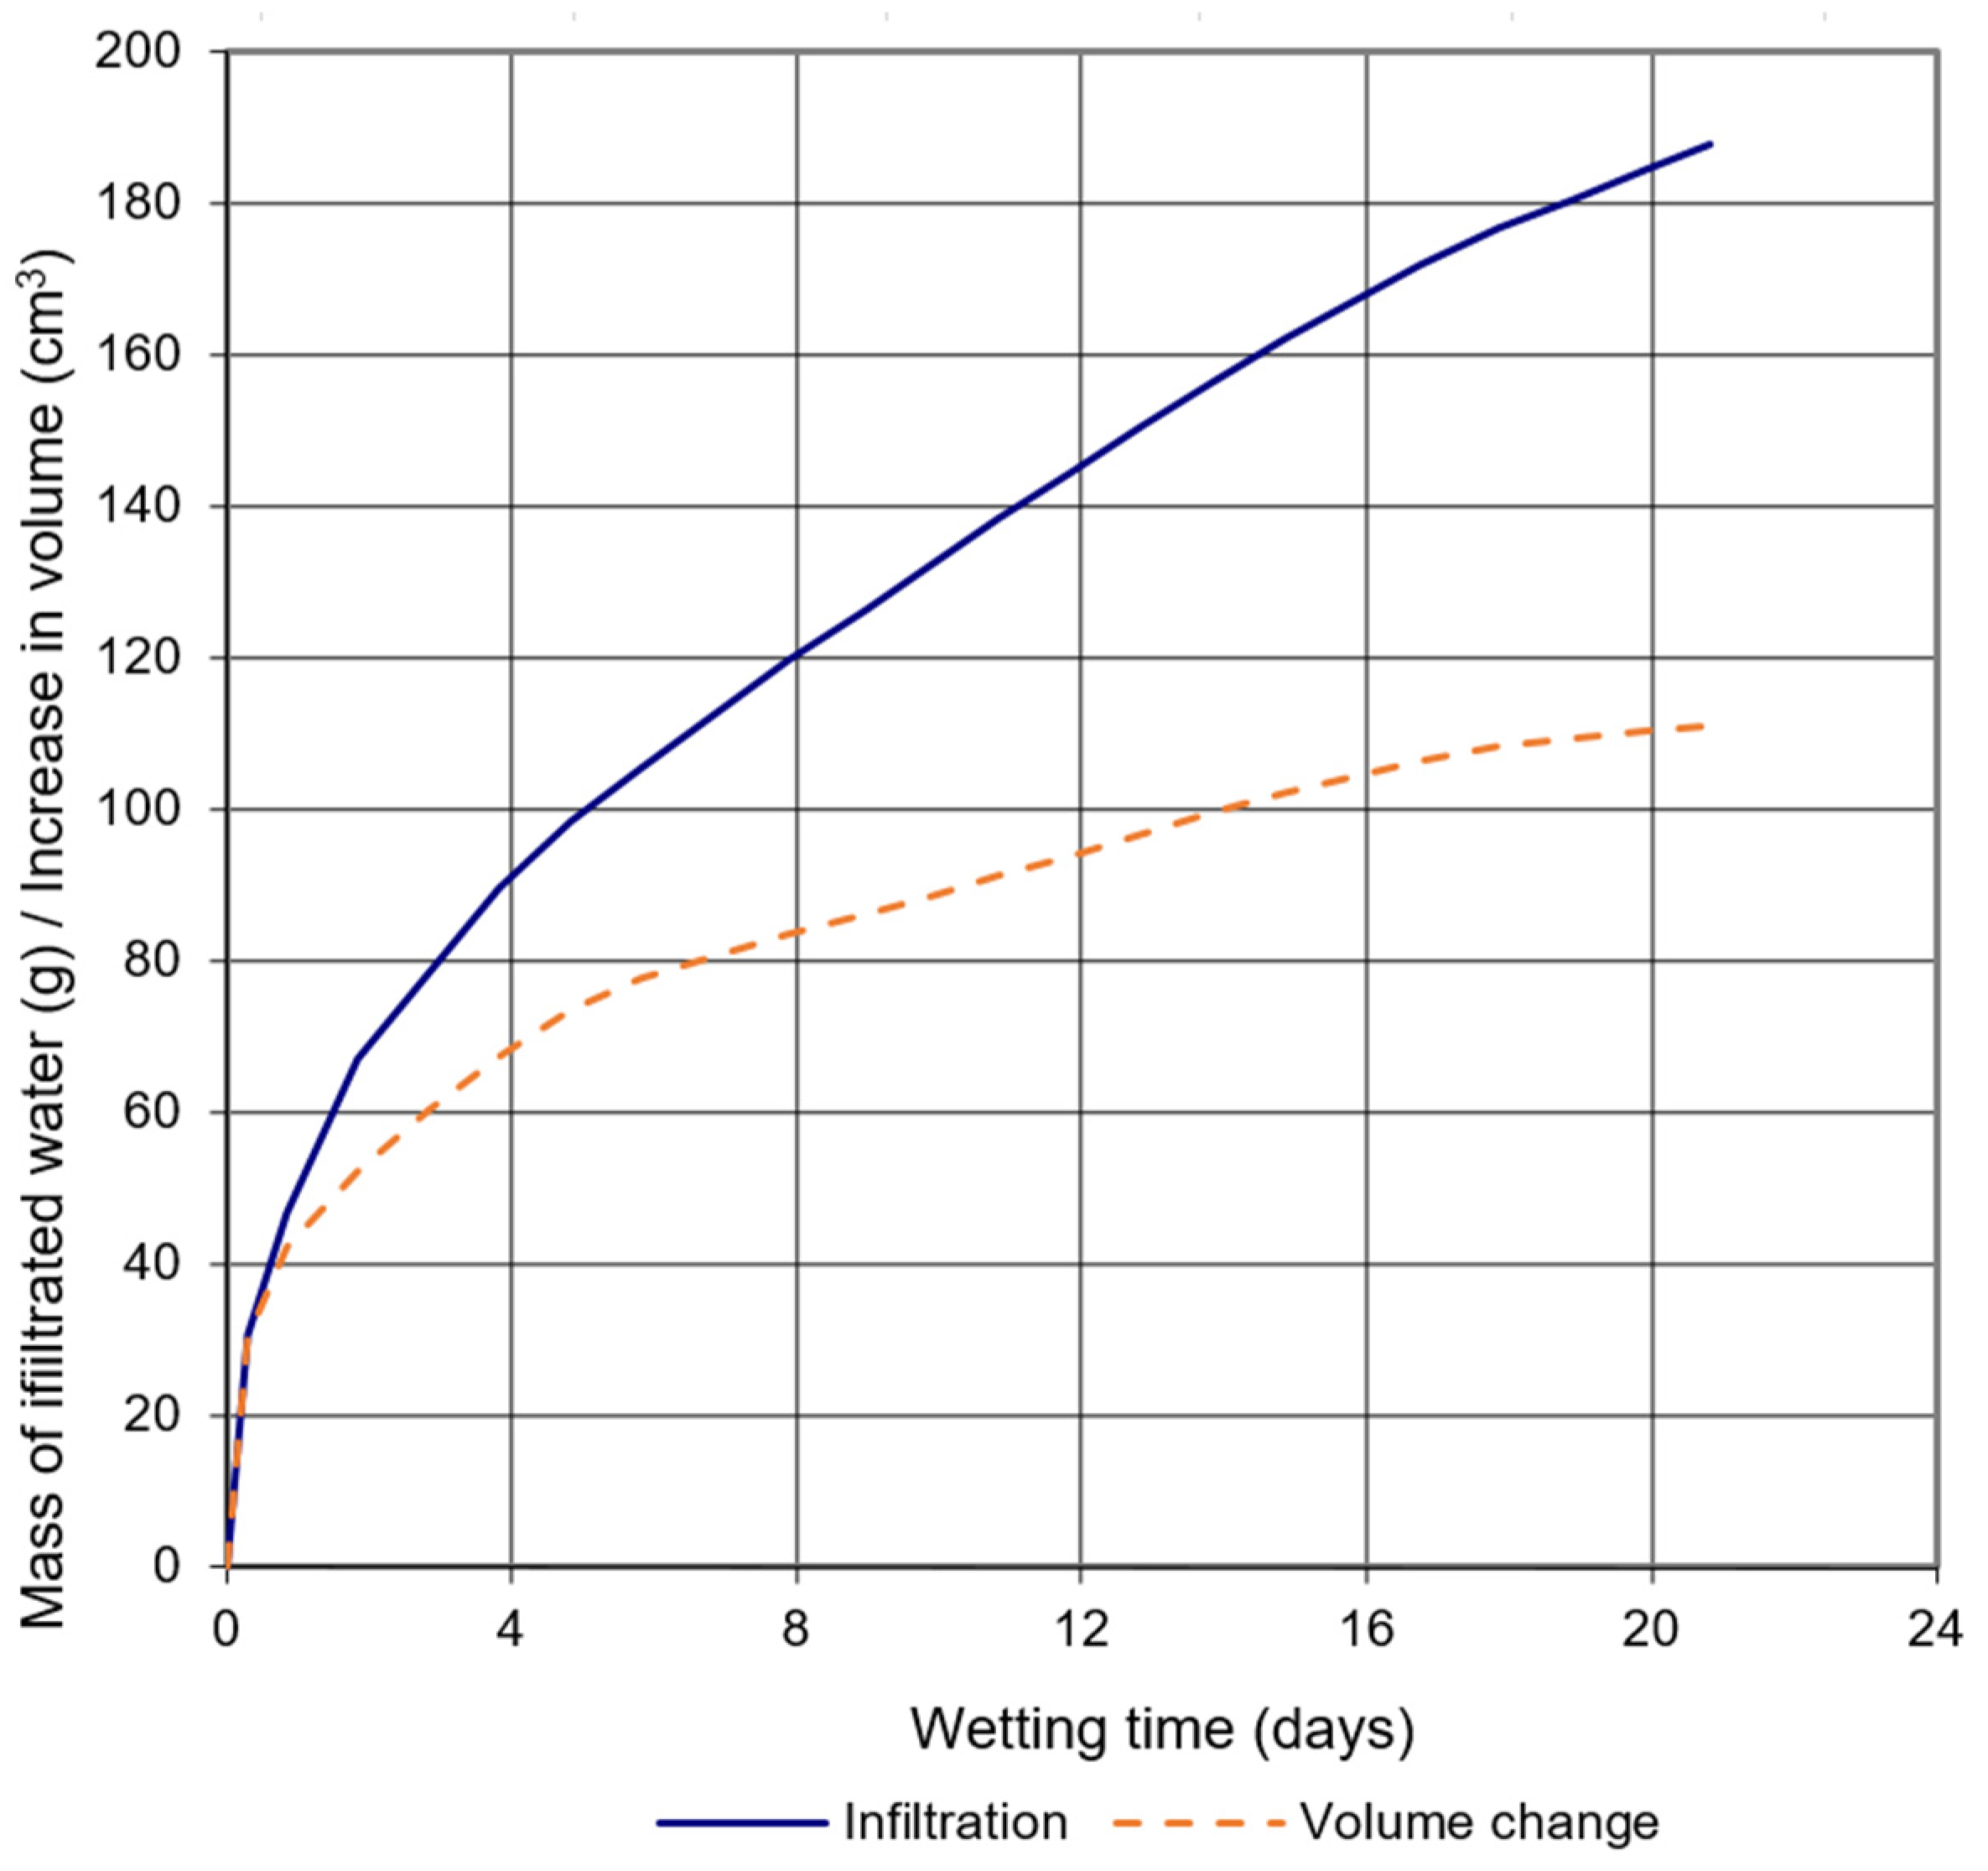
5.2. Wetting of VU-3
6. Discussion
7. Conclusions
Author Contributions
Funding
Data Availability Statement
Acknowledgments
Conflicts of Interest
References
- Grob, H. Swelling and Heave in Swiss tunnels. Bull. Int. Assoc. Eng. Geol. 1976, 13, 55–60. [Google Scholar] [CrossRef]
- Einstein, H.H. Tunnelling in swelling rock. Undergr. Space 1979, 4, 51–61. [Google Scholar]
- Houston, S.L.; Dye, H.B.; Zapata, C.E.; Walsh, K.D.; Houston, W.N. Study of expansive soils and residential foundations on expansive soils in Arizona. J. Od Perform. Constr. Facil. 2011, 25, 31–44. [Google Scholar] [CrossRef]
- Jones, L.D.; Jefferson, I. Expansive soils. In ICE Manual of Geotechnical Engineering, Volume 1 Geotechnical Engineering Principles, Problematic Soils and Site Investigation; Burland, J., Chapman, T., Skinner, H., Brown, M., Eds.; ICE Publishing: London, UK, 2012; pp. 413–441. [Google Scholar]
- Harrison, A.M.; Plim, J.; Harrison, M.; Jones, L.D.; Culshaw, M.G. The relationship between shrink–swell occurrence and climate in south-east England. Proc. Geol. Assoc. 2012, 123, 556–575. [Google Scholar] [CrossRef]
- Zheng, J.L.; Zheng, R.; Yang, H.P. Highway subgrade construction in expansive soil areas. J. Mater. Civ. Eng. 2009, 21, 154–162. [Google Scholar] [CrossRef]
- Bell, F.G.; Culshaw, M.G. Problem Soils: A review from a British perspective. In Problematic Soils Symposium; Jefferson, I., Murray, E.J., Faragher, E., Fleming, P.R., Eds.; Thomas Telford Publishing: Nottingham, UK, 2001; pp. 1–35. [Google Scholar]
- Driscoll, R.M.C.; Chown, R. Shrinking and swelling of clays. In Problematic Soils Symposium; Jefferson, I., Murray, E.J., Faragher, E., Fleming, P.R., Eds.; Thomas Telford Publishing: Nottingham, UK, 2001; pp. 53–66. [Google Scholar]
- Nelson, J.D.; Miller, D.J. Expansive Soils: Problems and Practice in Foundation and Pavement Engineering, 1st ed.; John Wiley and Sons Inc.: New York, NY, USA, 1992. [Google Scholar]
- Radevsky, R. Expansive clay problems–how are they dealt with outside the US? Expansive clay soils and vegetative influence on shallow foundations. ASCE Geotech. Spec. Publ. 2001, 115, 172–191. [Google Scholar]
- Vrkljan, I.; Kavur, B.; Znidarčić, D. Influence of desiccation on swelling behavior of initially saturated swelling rocks. In Proceedings of the XIIIth Danube-European Conference on Geotechnical Engineering, Ljubljana, Slovenia, 29 May–1 June 2006; Volume 2, pp. 159–164. [Google Scholar]
- Vrkljan, I. Bujanje Stijena i Njegov Utjecaj na Podzemne Objekte/Rock Swelling and Its Impact on Underground Construction. Ph.D. Thesis, Faculty of Civil Engineering, University of Zagreb, Zagreb, Croatia, 1997. [Google Scholar]
- Kavur, B.; Vrkljan, I.; Kovačević Zelić, B. Procjena hidrauličkih značajki nezasićenog ekspanzivnog tla/Analysis of hydraulic properties of unsaturated expansive soil. Građevinar J. Assoc. Civ. Eng. (HSGI) 2011, 3, 245–253. [Google Scholar]
- Znidarčić, D.; Schiffman, R.L.; Pane, V.; Croce, P.; Ko, H.Y.; Olsen, H.W. The Theory of One-Dimensional Consolidation of Saturated Clays: V, Constant Rate of Deformation Testing and Analysis. Geotechnique 1986, 36, 227–237. [Google Scholar] [CrossRef]
- Znidarčić, D.; Illangasekare, T.; Manna, M. Laboratory testing and parameter estimation for two-phase flow problems. ASCE Geotech. Spec. Publ. 1991, 27, 1089–1099. [Google Scholar]
- Znidarčić, D.; Hwang, C.; Bicalho, K.V. Experimental determination of hydraulic characteristics for unsaturated soils. In Unsaturated Soils; CRC Press: Boca Raton, FL, USA, 2021; Volume 3, pp. 1137–1141. [Google Scholar]
- Abu-Hejleh, A.N.; Znidarčić, D.; Illangasekare, T.H. Permeability Determination for Unsaturated Soils. Unsaturated Soils, ASCE Geotech. Spec. Publ. 1993, 39, 163–174. [Google Scholar]
- Abu-Hejleh, A.N.; Znidarčić, D. Consolidation Characteristics of Phosphatic Clays. ASCE J. Geotech. Eng. 1996, 122, 295–301. [Google Scholar] [CrossRef]
- Bicalho, K.V. Modeling Water Flow in an Unsaturated Compacted Soil. Ph.D. Thesis, University of Colorado, Boulder, CO, USA, 1999. [Google Scholar]
- Hwang, C. Determination of Material Functions for Unsaturated Flow. Ph.D. Thesis, University of Colorado, Boulder, CO, USA, 2002. [Google Scholar]
- Yao, D.T.C.; Oliveira-Filho, W.L.; Cai, X.C.; Znidarčić, D. Numerical solution for consolidation and desiccation of soft soils. Int. J. Numer. Anal. Methods Geomech. 2002, 26, 139–161. [Google Scholar] [CrossRef]
- Onyelowe, K.C.; Mojtahedi, F.F.; Azizi, S.; Mahdi, H.A.; Sujatha, E.R.; Ebid, A.M.; Darzi, A.G.; Aneke, F.I. Innovative Overview of SWRC Application in Modeling Geotechnical Engineering Problems. Designs 2022, 6, 69. [Google Scholar] [CrossRef]
- Garnier, P.; Angulo-Jaramillo, R.; DiCarlo, D.A.; Bauters, T.W.J.; Darnault, C.J.G.; Steenhuis, T.S.; Parlange, J.Y.; Baveye, P. Dual-energy synchrotron X ray measurements of rapid soil density and water content changes in swelling soils during infiltration. Water Resour. Res. 1998, 34, 2837–2842. [Google Scholar] [CrossRef]
- Kavur, B. Utjecaj Sušenja na Ponašanje Bubrive Stijene/Influence of Drying on Swelling Rock Behaviour. Ph.D. Thesis, Faculty of Mining, Geology and Petroleum Engineering, University of Zagreb, Zagreb, Croatia, 2009. [Google Scholar]
- Fredlund, D.G.; Xing, A. Equations for the soil-water characteristic curve. Can. Geotech. J. 1994, 31, 521–532. [Google Scholar] [CrossRef]
- Fredlund, D.G.; Rahardjo, H. Soil Mechanics for Unsaturated Soils, 1st ed.; John Wiley and Sons Inc.: New York, NY, USA, 1993. [Google Scholar]
- Peng, X.; Horn, R. Modelling soil shrinkage curve across a wide range of soil types. Soil Sci. Soc. Am. J. 2005, 69, 584–592. [Google Scholar] [CrossRef]
- Vrkljan, I.; Kavur, B. Some problems of swelling in geotechnical practice–influence of saturation on the behavior of argillaceous swelling rock (invited lecture). In Proceedings of the 5th Symposium of the Macedonian Association for Geotechnics, Ohrid, Macedonia, 23–25 June 2022; pp. 144–159. [Google Scholar]
- Smiles, D.E. Hydrology of swelling soils: A review. Aust. J. Soil Res. 2000, 38, 501–521. [Google Scholar] [CrossRef]
- McGarry, D.; Malafant, K.W.J. The analysis of volume change in unconfined units of soil. Soil Sci. Soc. Am. J. 1987, 51, 290–297. [Google Scholar] [CrossRef]
- Raats, P.A.C. Flow of Water in Rigid and Non-Rigid, Saturated and Unsaturated Soils. In Modeling and Mechanics of Granular and Porous Materials. Modeling and Simulation in Science, Engineering and Technology, 1st ed.; Capriz, G., Ghionna, V.N., Giovine, P., Eds.; Birkhäuser: Boston, MA, USA, 2002. [Google Scholar]
- Talsma, T. A note on the shrinkage behaviour of a clay paste under various loads. Aust. J. Soil Res. 1977, 15, 275–277. [Google Scholar] [CrossRef]
- Tariq, A.R.; Durnford, D.S. Analytical volume change model for swelling clay soils. Soil Sci. Soc. Am. J. 1993, 57, 1183–1187. [Google Scholar] [CrossRef]
- Braudeau, E.; Costantini, J.M.; Bellier, G.; Colleuille, H. New device and method for soil shrinkage curve measurement and characterization. Soil Sci. Soc. Am. J. 1999, 63, 525–535. [Google Scholar] [CrossRef]
- Groenevelt, P.H.; Grant, C.D. Re-evaluation of the structural properties of some British swelling soils. Eur. J. Soil Sci. 2001, 52, 469–477. [Google Scholar] [CrossRef]
- Boivin, P.; Garnier, P.; Tessier, D. Relationship between clay content, clay type and shrinkage properties of soil samples. Soil Sci. Soc. Am. J. 2004, 68, 1145–1153. [Google Scholar] [CrossRef]
- Puppala, A.J.; Manosuthikij, T.; Chittoori, B.C.S. Swell and shrinkage characterizations of unsaturated expansive clays from Texas. Eng. Geol. 2013, 164, 187–194. [Google Scholar] [CrossRef]
- Lu, N.; Dong, Y. Correlation between soil-shrinkage curve and water-retention characteristics. J. Geotech. Geoenviron. Eng. 2017, 143, 1–11. [Google Scholar] [CrossRef]
- Li, L.; Zhang, X. A New Approach to Measure Soil Shrinkage Curve. Geotech. Test. J. 2018, 42, 1–18. [Google Scholar] [CrossRef]
- Khan, S.; Ivoke, J.; Nobahar, M. Coupled Effect of Wet-Dry Cycles and Rainfall on Highway Slope Made of Yazoo Clay. Geosciences 2019, 9, 341. [Google Scholar] [CrossRef]
- Ahmed, A.; Hossain, M.S.; Pandey, P.; Sapkota, A.; Thian, B. Deformation Modeling of Flexible Pavement in Expansive Subgrade in Texas. Geosciences 2019, 9, 446. [Google Scholar] [CrossRef]
- Shrestha, A.; Jotisankasa, A.; Chaiprakaikeow, S.; Pramusandi, S.; Soralump, S.; Nishimura, S. Determining Shrinkage Cracks Based on the Small-Strain Shear Modulus–Suction Relationship. Geosciences 2019, 9, 362. [Google Scholar] [CrossRef]
- Vail, M.; Zhu, C.; Tang, C.-S.; Anderson, L.; Moroski, M.; Montalbo-Lomboy, M.T. Desiccation Cracking Behavior of MICP-Treated Bentonite. Geosciences 2019, 9, 385. [Google Scholar] [CrossRef]
- Menon, S.; Song, X. Coupled Analysis of Desiccation Cracking in Unsaturated Soils through a Non-Local Mathematical Formulation. Geosciences 2019, 9, 428. [Google Scholar] [CrossRef]
- Qi, W.; Wang, C.; Zhang, Z.; Huang, M.; Xu, J. Experimental Investigation on the Impact of Drying–Wetting Cycles on the Shrink–Swell Behavior of Clay Loam in Farmland. Agriculture 2022, 12, 245. [Google Scholar] [CrossRef]
- Ivoke, J.; Khan, M.S.; Nobahar, M. Unsaturated Hydraulic Conductivity Variation of Expansive Yazoo Clay with Wet-Dry Cycles. Transp. Res. Rec. 2021, 2675, 629–641. [Google Scholar] [CrossRef]
- Luo, Y.; Zhang, J.; Zhou, Z.; Aguilar-Lopez, J.P.; Greco, R.; Bogaard, T. Effects of dynamic changes of desiccation cracks on preferential flow: Experimental investigation and numerical modeling. Hydrol. Earth Syst. Sci. 2023, 27, 783–808. [Google Scholar] [CrossRef]
- Meshram, K.; Singh, N.; Jain, P.K. Estimation of swelling characteristics of expansive soils with influence of clay mineralogy. Acta Agric. Scand. Sect. B—Soil Plant Sci. 2021, 71, 202–207. [Google Scholar] [CrossRef]
- Rao, B.H.; Reddy, P.S.; Mohanty, B. Combined effect of mineralogical and chemical parameters on swelling behaviour of expansive soils. Sci Rep. 2021, 11, 16562. [Google Scholar] [CrossRef] [PubMed]
- Garnier, P.; Perrier, E.; Angulo Jaramillo, R.; Baveye, P. Numerical model of 3-dimensional anisotropic deformation and 1-dimensional water flow in swelling soils. Soil Sci. 1997, 162, 410–420. [Google Scholar] [CrossRef]
- Kim, D.J.; Jaramilo, R.A.; Vauclin, M.; Feyen, J.; Choi, S.I. Modeling of soil deformation and water flow in a swelling soil. Geoderma 1999, 92, 217–238. [Google Scholar] [CrossRef]
- Bronswijk, J.J.B. Modeling of water balance, cracking and subsidence of clay soils. J. Hydrol. 1988, 97, 199–212. [Google Scholar] [CrossRef]
- Bronswijk, J.J.B. Shrinkage geometry of a heavy clay soil at various stresses. Soil Sci. Soc. Am. J. 1990, 54, 1500–1502. [Google Scholar] [CrossRef]
- Bronswijk, J.J.B.; Evers-Vermeer, J.J. Shrinkage of Dutch clay soil aggregates. Neth. J. Agric. Sci. 1990, 38, 175–194. [Google Scholar] [CrossRef]
- Kim, D.J.; Vereecken, H.; Feyen, J.; Boels, D.; Bronswijk, J.J.B. On the characterization of properties of an unripe marine clay soil in relation to physical ripening. Soil Sci. 1992, 153, 471–481. [Google Scholar] [CrossRef]
- Kim, D.J.; Vereecken, H.; Feyen, J.; Vanclooster, M.; Stroosnijder, L. A numerical model of water movement and soil deformation in a ripening marine clay soil. Model. Geo Biosph. Process. 1992, 1, 185–203. [Google Scholar]
- Garnier, P.; Rieu, M.; Boivin, P.; Vauclin, M.; Baveye, P. Determining the hydraulic properties of a swelling soil from a transient evaporation experiment. Soil Sci. Soc. Am. J. 1997, 61, 1555–1563. [Google Scholar] [CrossRef]
- Angulo-Jaramillo, R. Caracterisation Hydrodynamique de Sols Deformables Partiellement Satures: Etude Experimentale à L’aide de la Spectrome´Trie Gamma Double Source. Ph.D. Thesis, Institut National Polytechnique de Grenoble-INPG, Grenoble, France, 1989. [Google Scholar]
- Barataud, F.; Stemmelen, D.; Moyne, C. Identification of the hydraulic diffusivity of a soil by inverse method with dual-energy gamma ray attenuation measurements. In Parameter Identification and Inverse Problems in Hydrology, Geology and Ecology; Gottlieb, J., Du Chateau, P., Eds.; Kluwer Academic Publisher: Norwell, MA, USA, 1996; pp. 123–132. [Google Scholar]
- Fredlund, D.; Fredlund, M. Application of ‘Estimation Procedures’ in Unsaturated Soil Mechanics. Geosciences 2020, 10, 364. [Google Scholar] [CrossRef]
- Sadeghi, H.; Golaghaei Darzi, A. A review of different approaches to analytical modeling of soil-water retention curves. Sharif J. Civ. Eng. 2021, 37, 111–123. [Google Scholar]
- Al-Mahbashi, A.M.; Elkady, T.Y.; Al-Shamrani, M.A. Hysteresis soil-water characteristic curves of highly expansive clay. Eur. J. Environ. Civ. Eng. 2018, 22, 1041–1059. [Google Scholar] [CrossRef]
- Dong, Y.; Lu, N. Measurement of suction-stress characteristic curve under drying and wetting conditions. Geotech. Test. J. 2017, 40, 107–121. [Google Scholar] [CrossRef]
- Burton, G.J.; Pineda, J.A.; Sheng, D.; Airey, D. Microstructural changes of an undisturbed, reconstituted and compacted high plasticity clay subjected to wetting and drying. Eng. Geol. 2015, 193, 363–373. [Google Scholar] [CrossRef]
- Yong, R.N. Soil suction and soil-water potentials in swelling clays in engineered clay barriers. Eng. Geol. 1999, 54, 3–13. [Google Scholar] [CrossRef]
- Kavur, B.; Vrkljan, I.; Znidarčić, D. Prediction of Rock Swelling Behaviour. In Proceedings of the Sri Lankan Geotechnical Society’s First International Conference on Soil & Rock Engineering, Colombo, Sri Lanka, 6–12 August 2007. [Google Scholar]


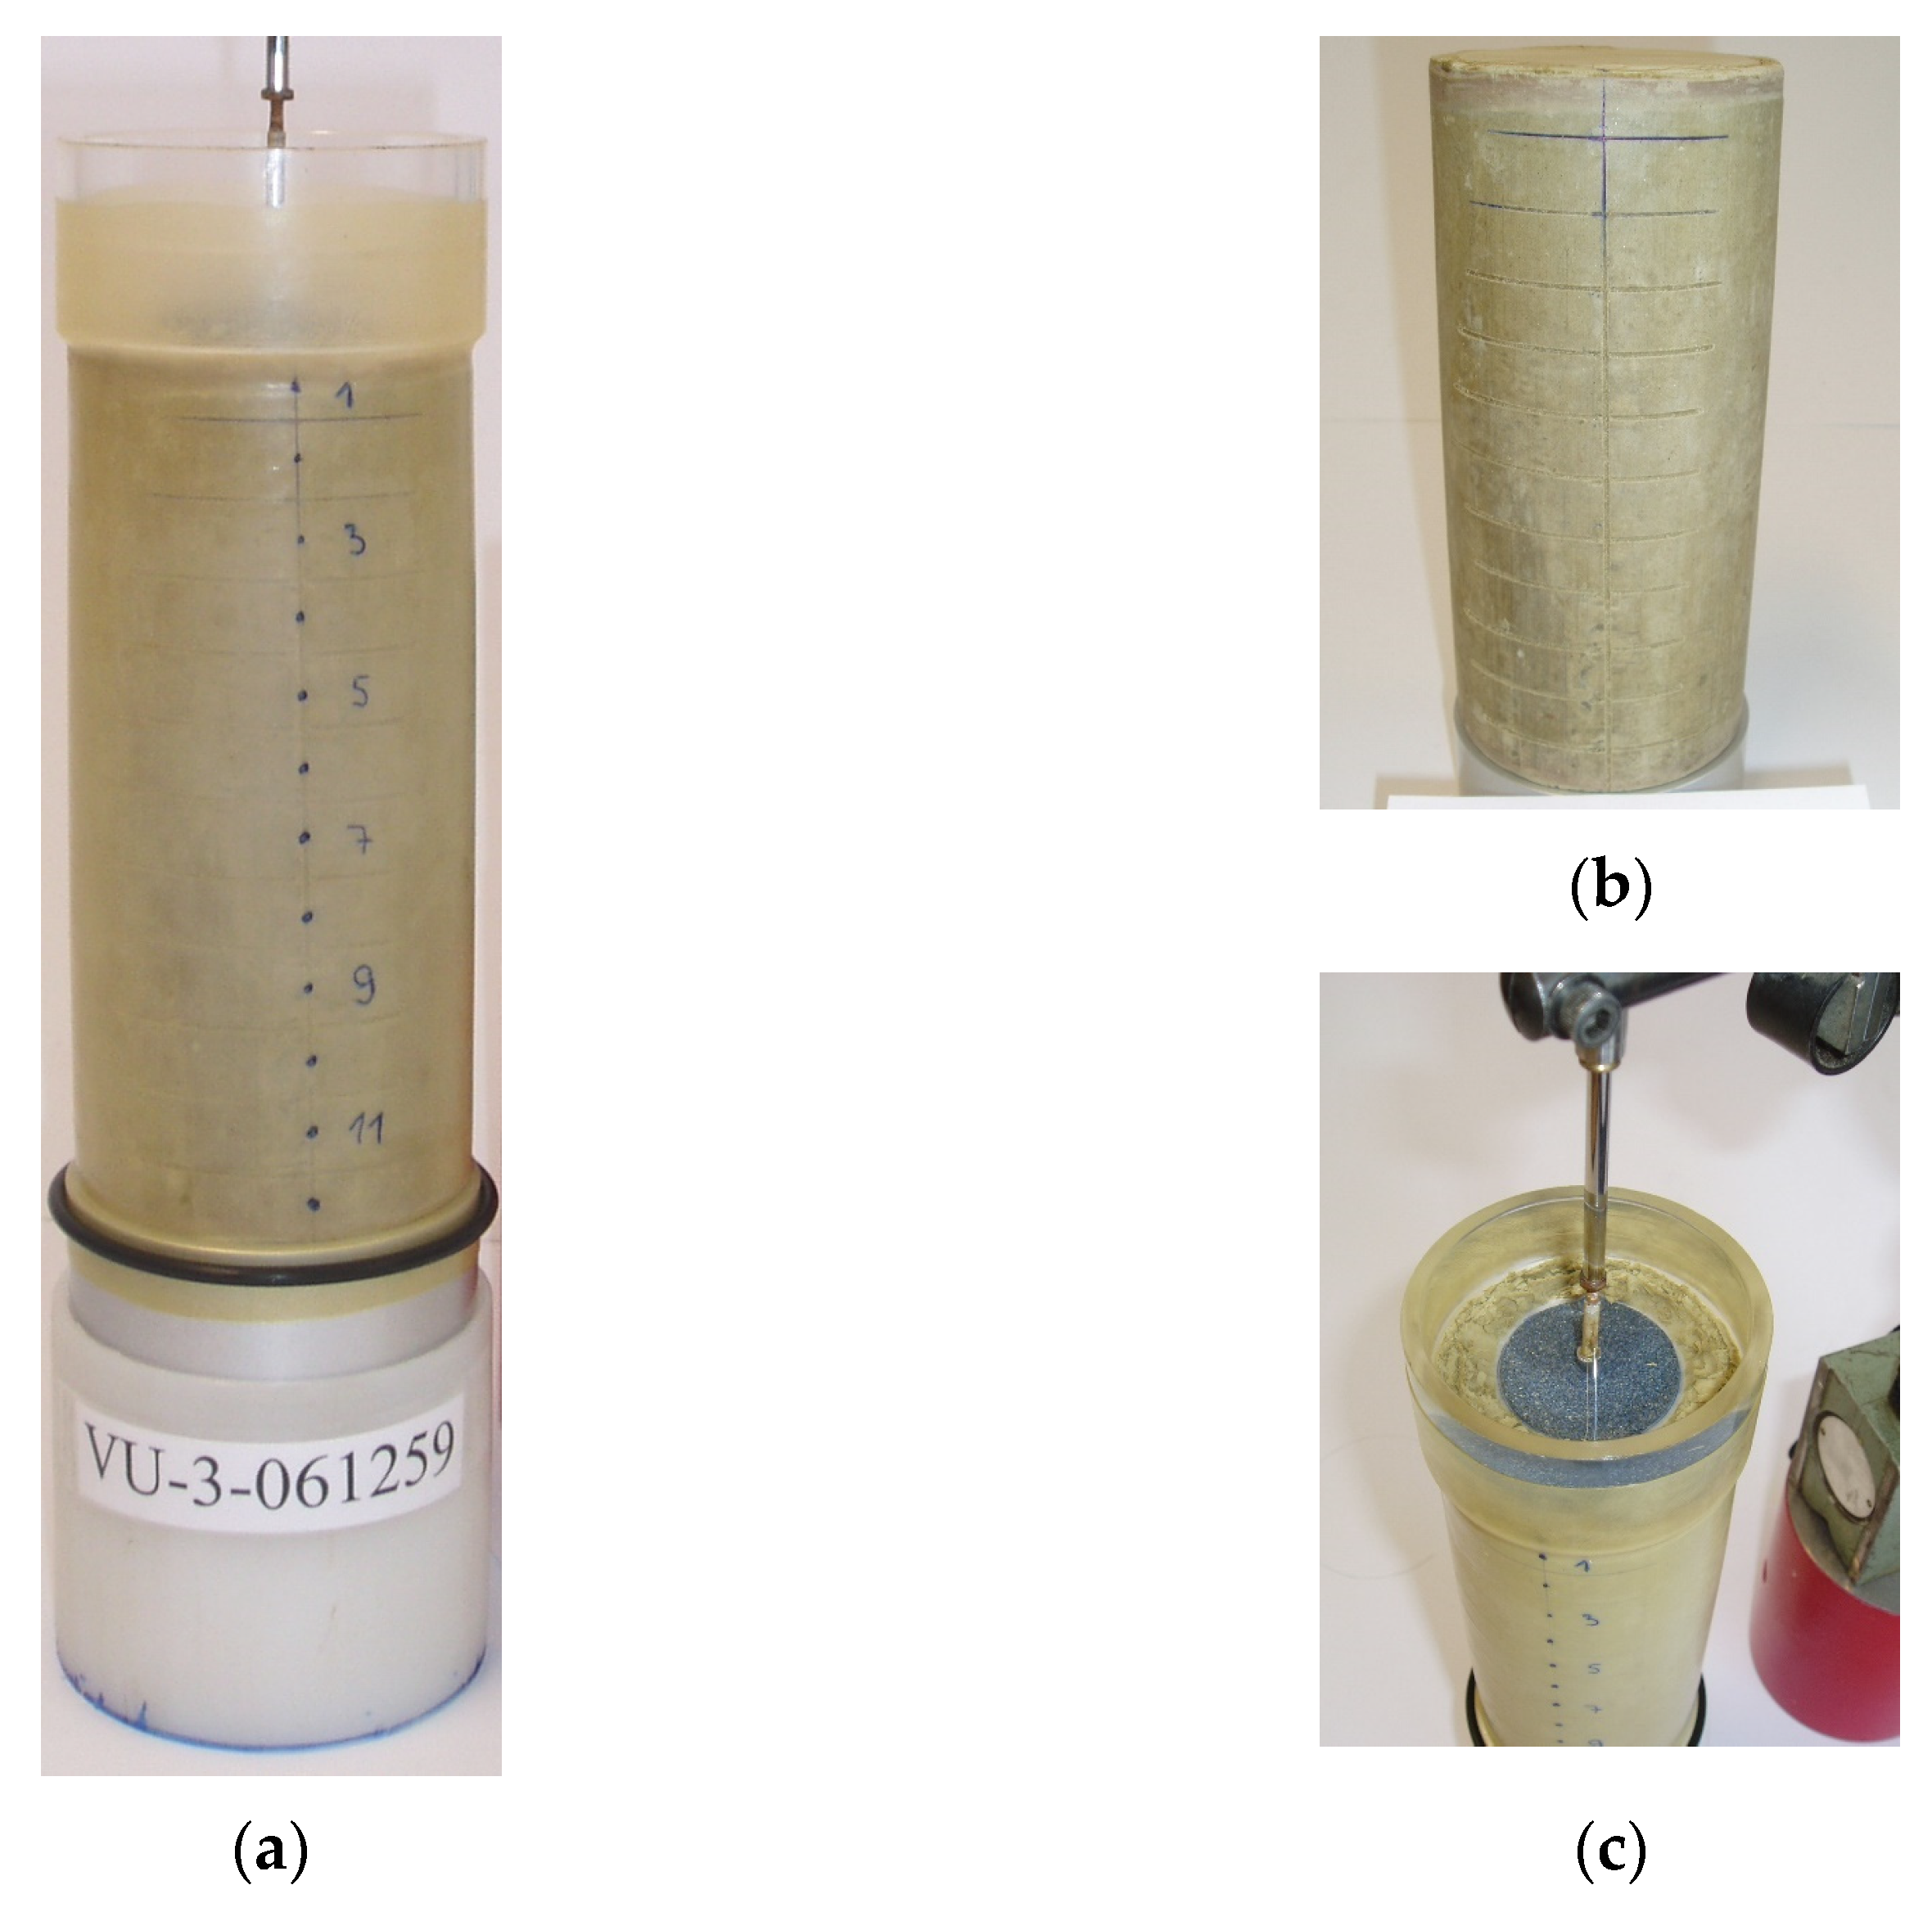
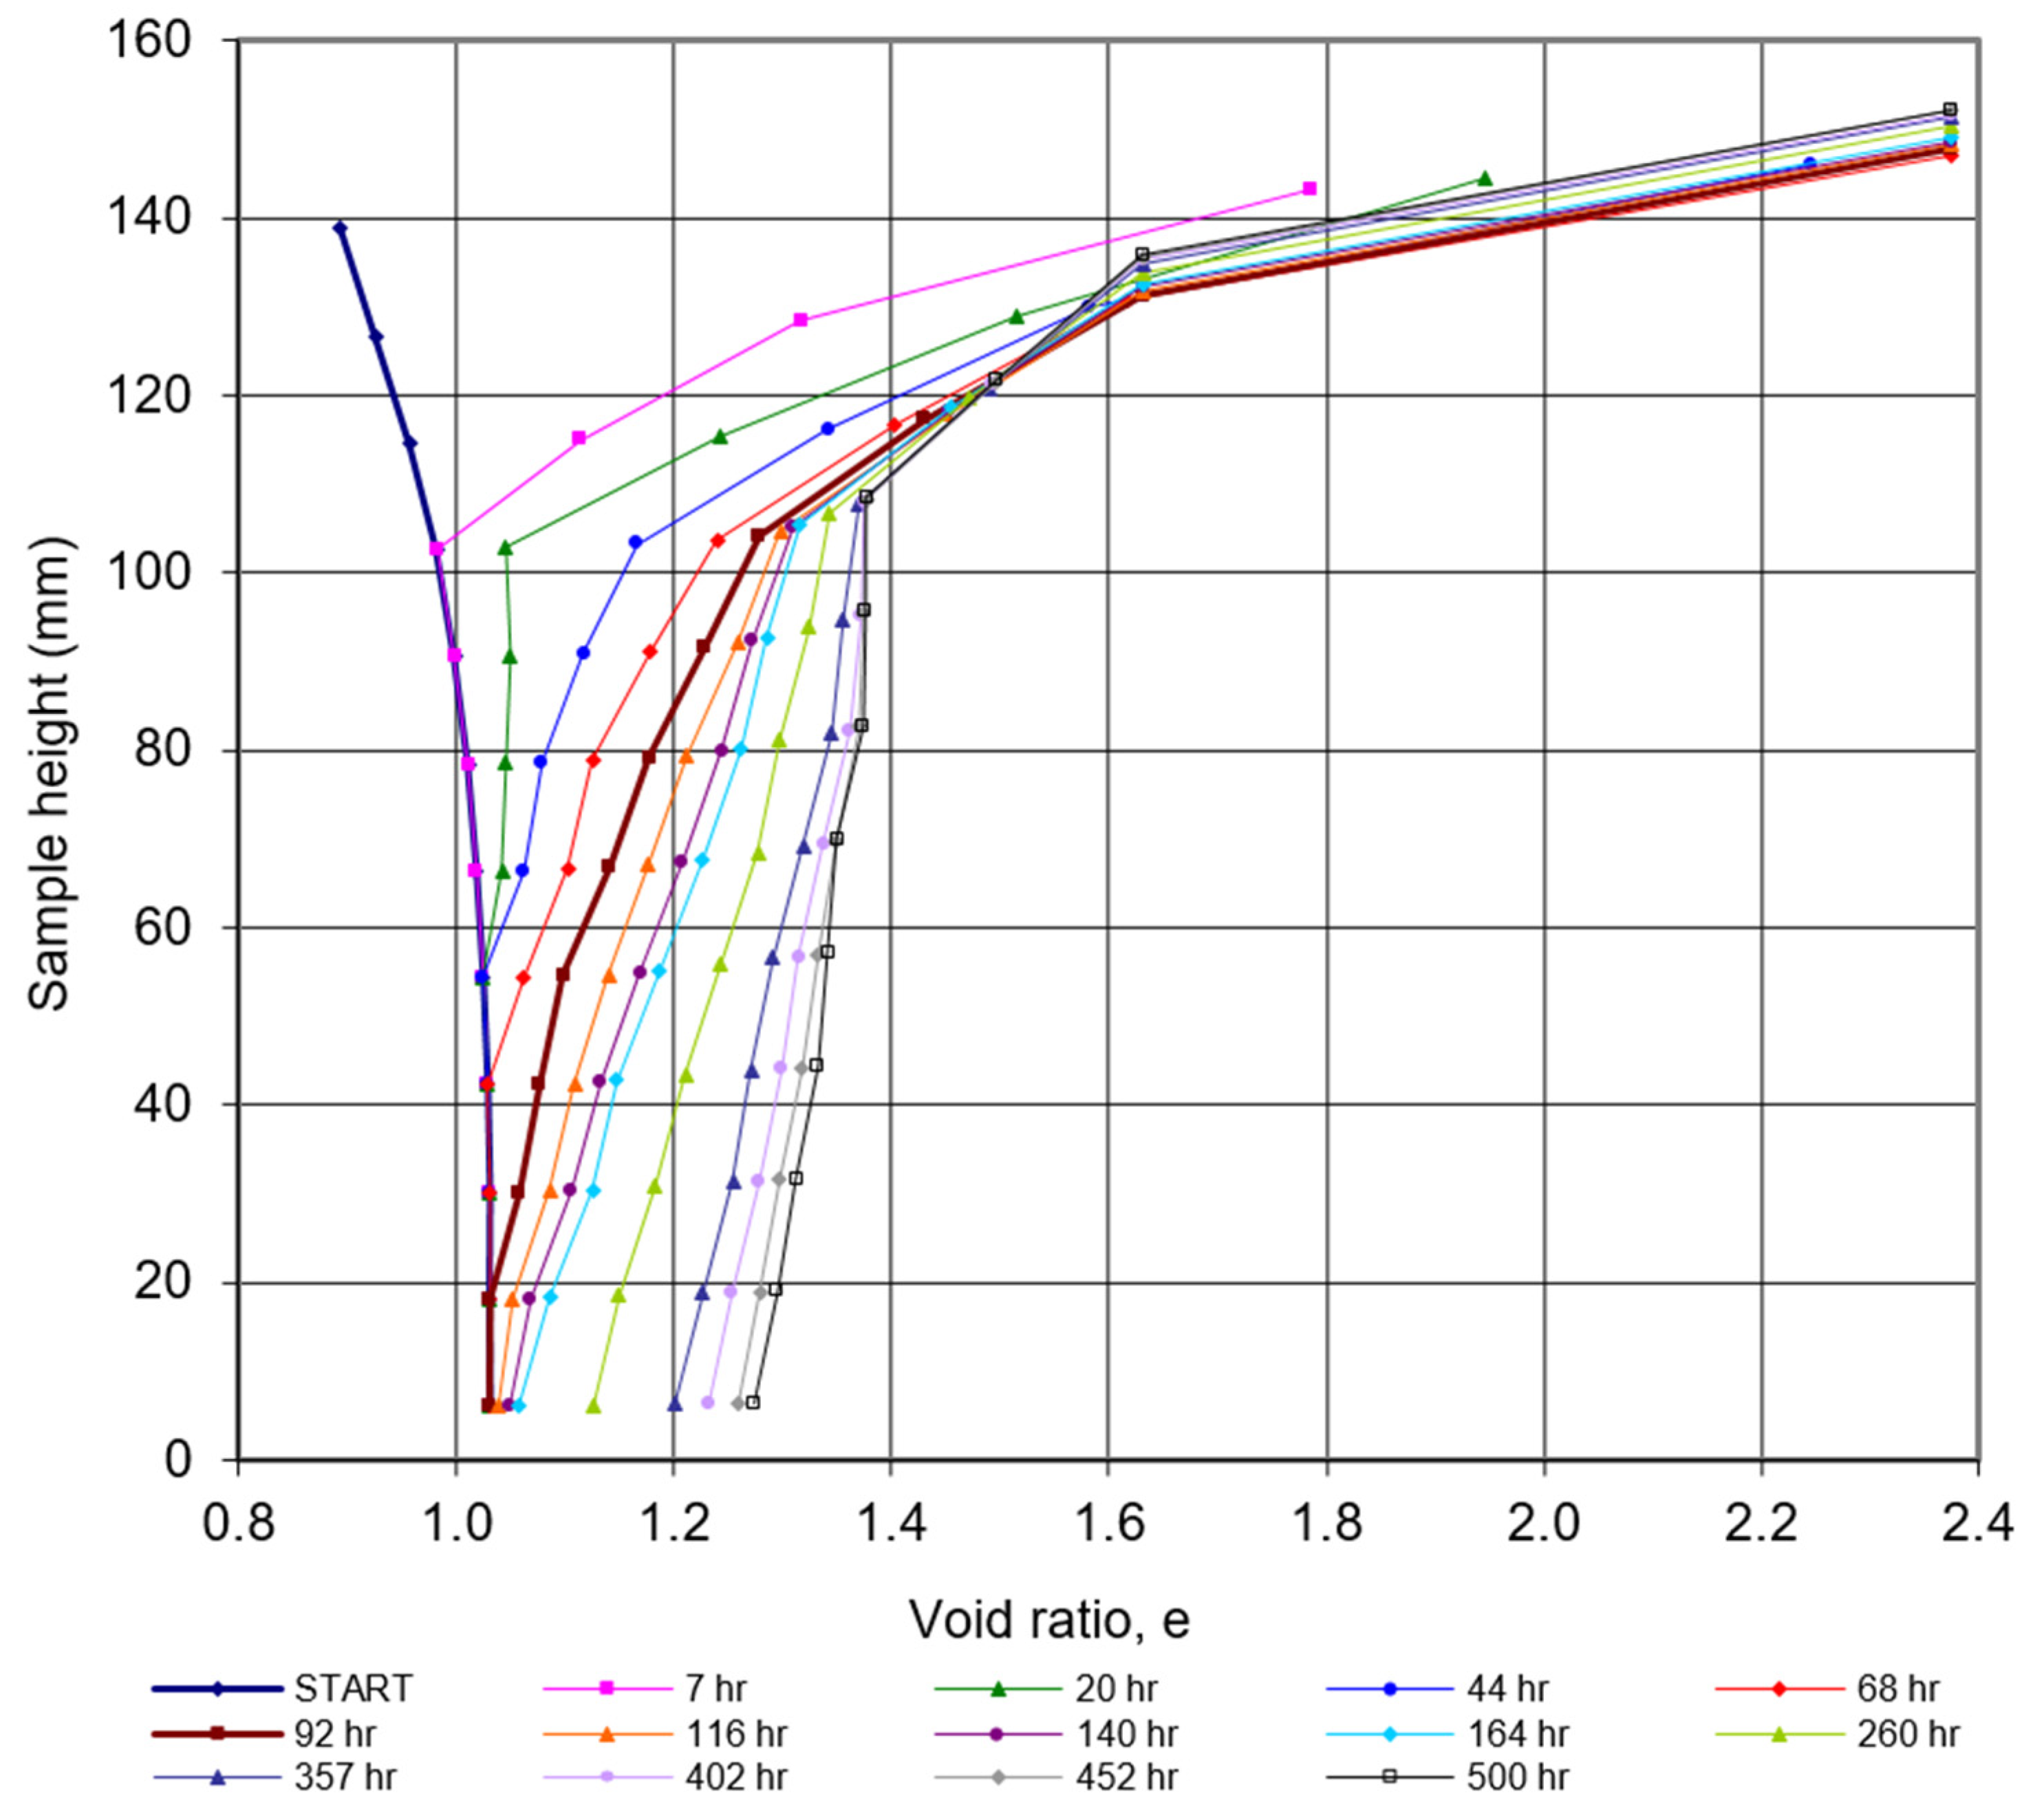
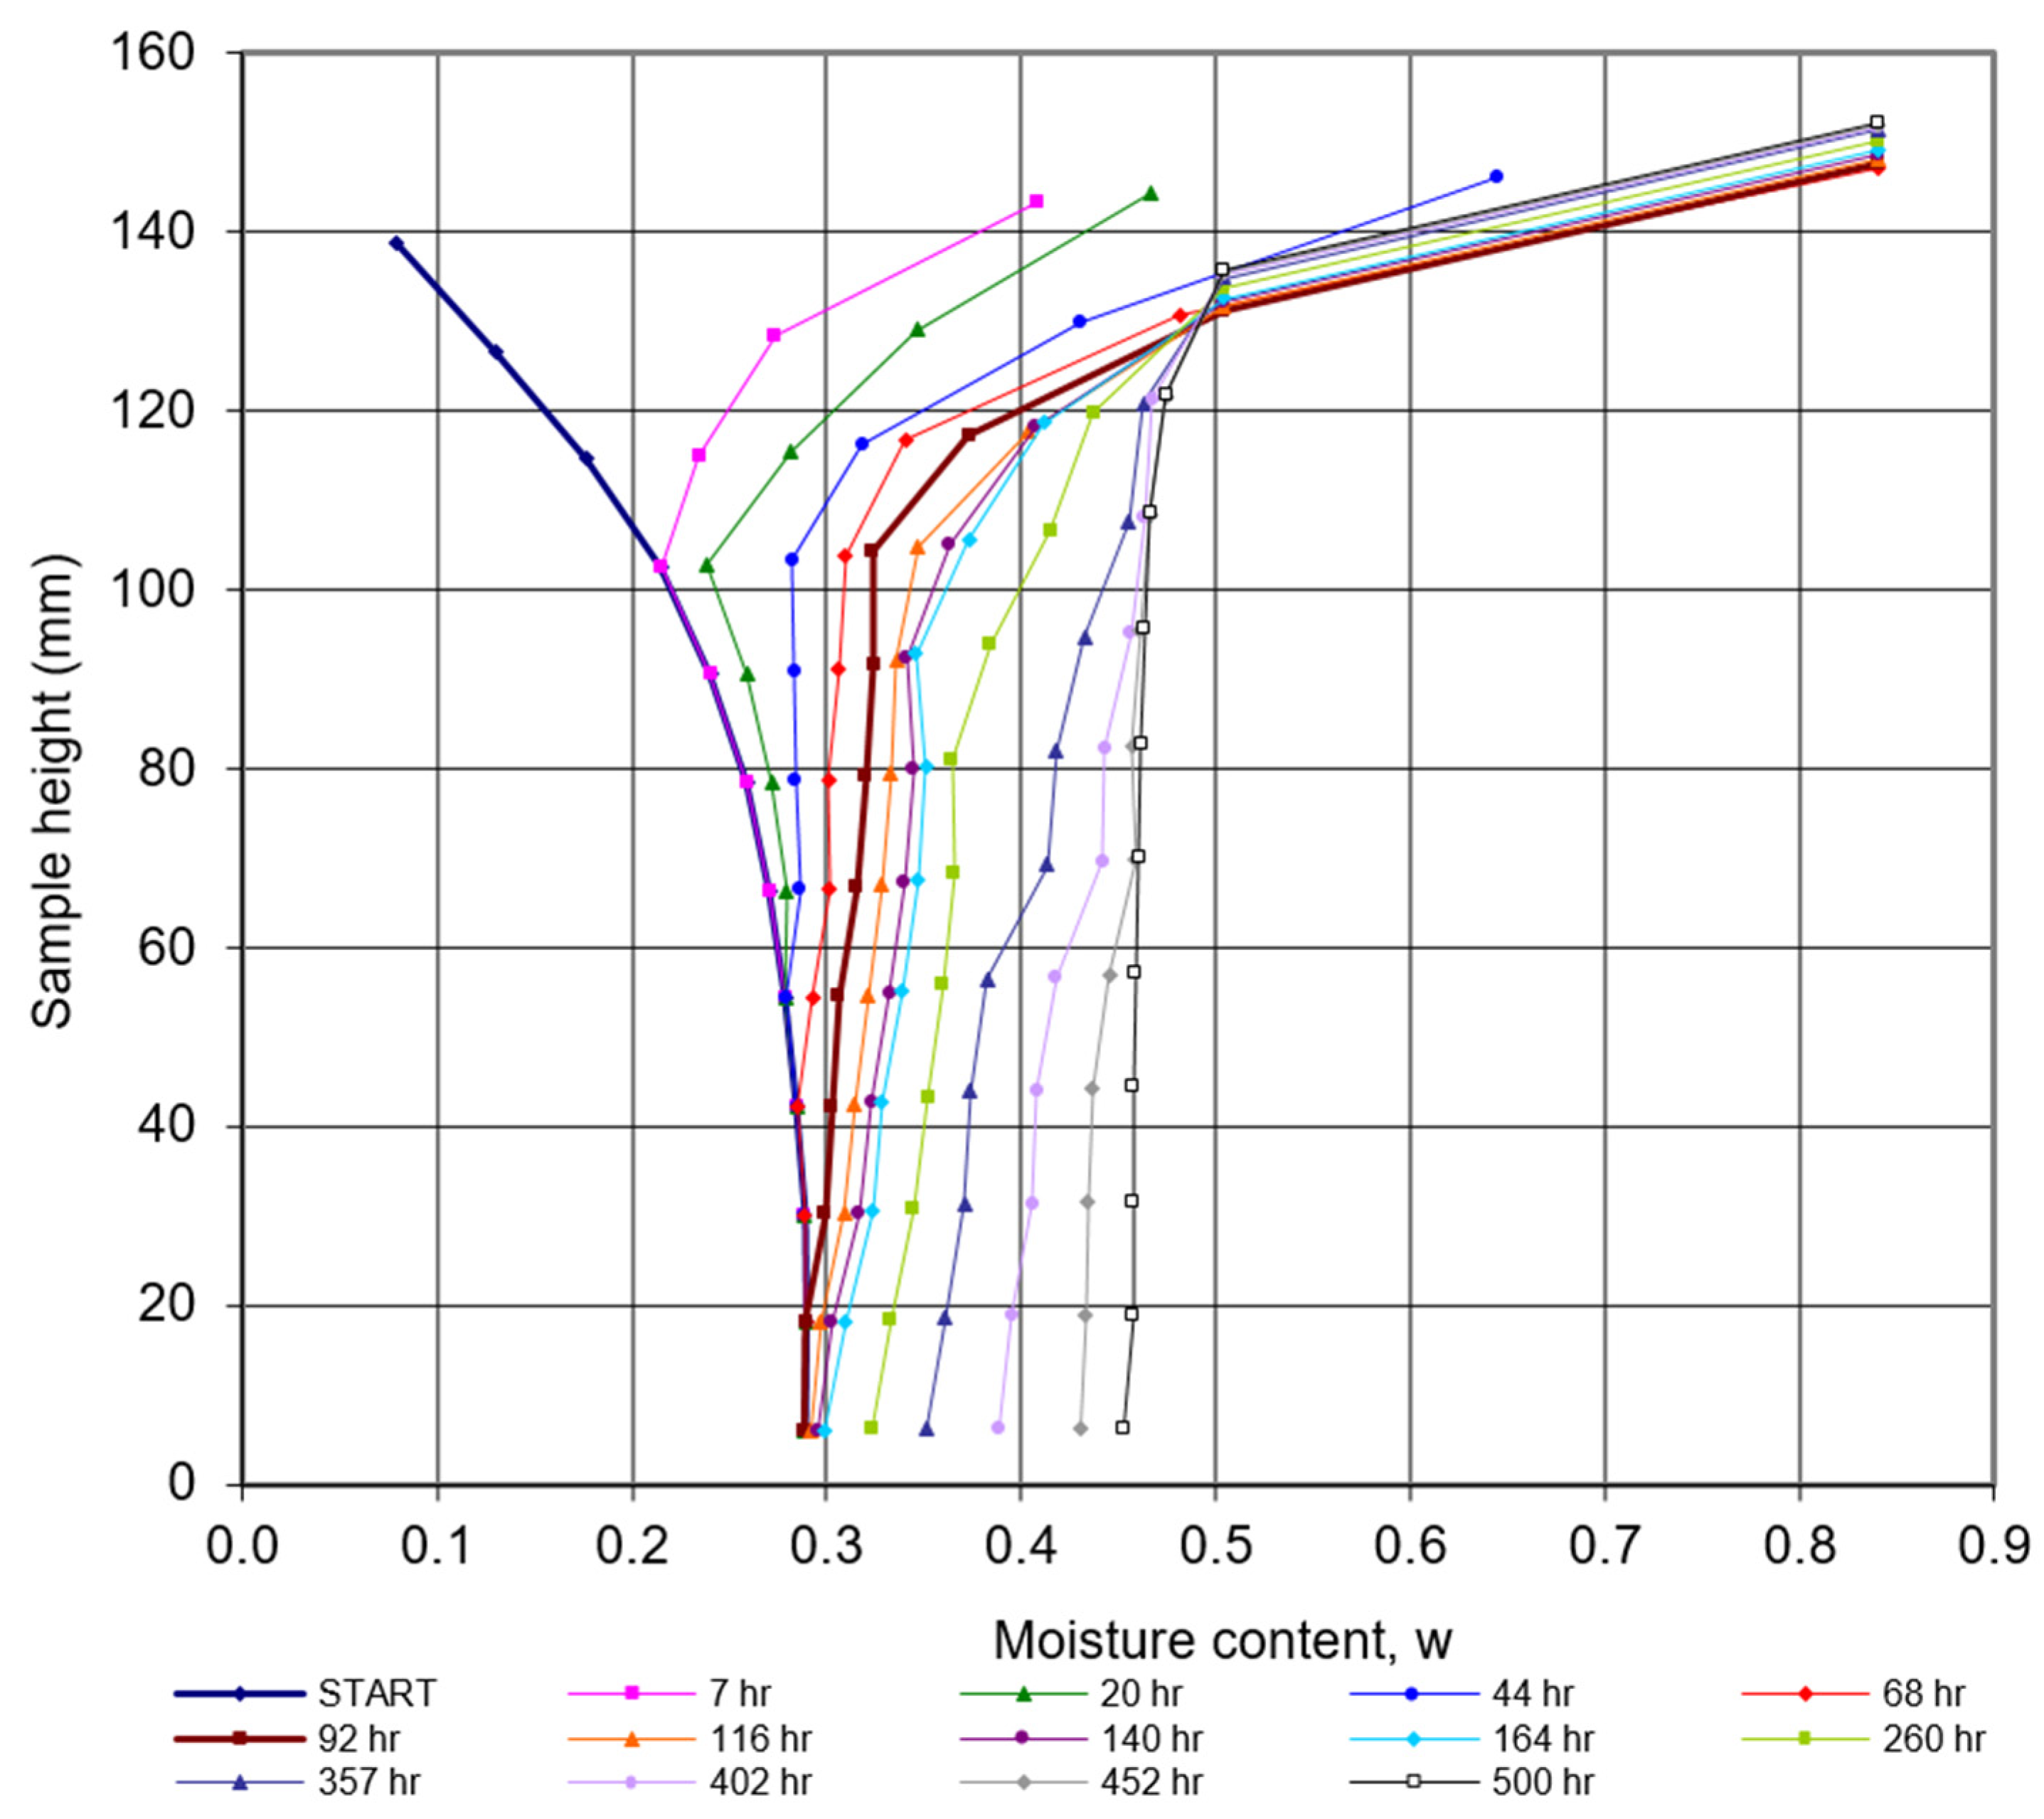
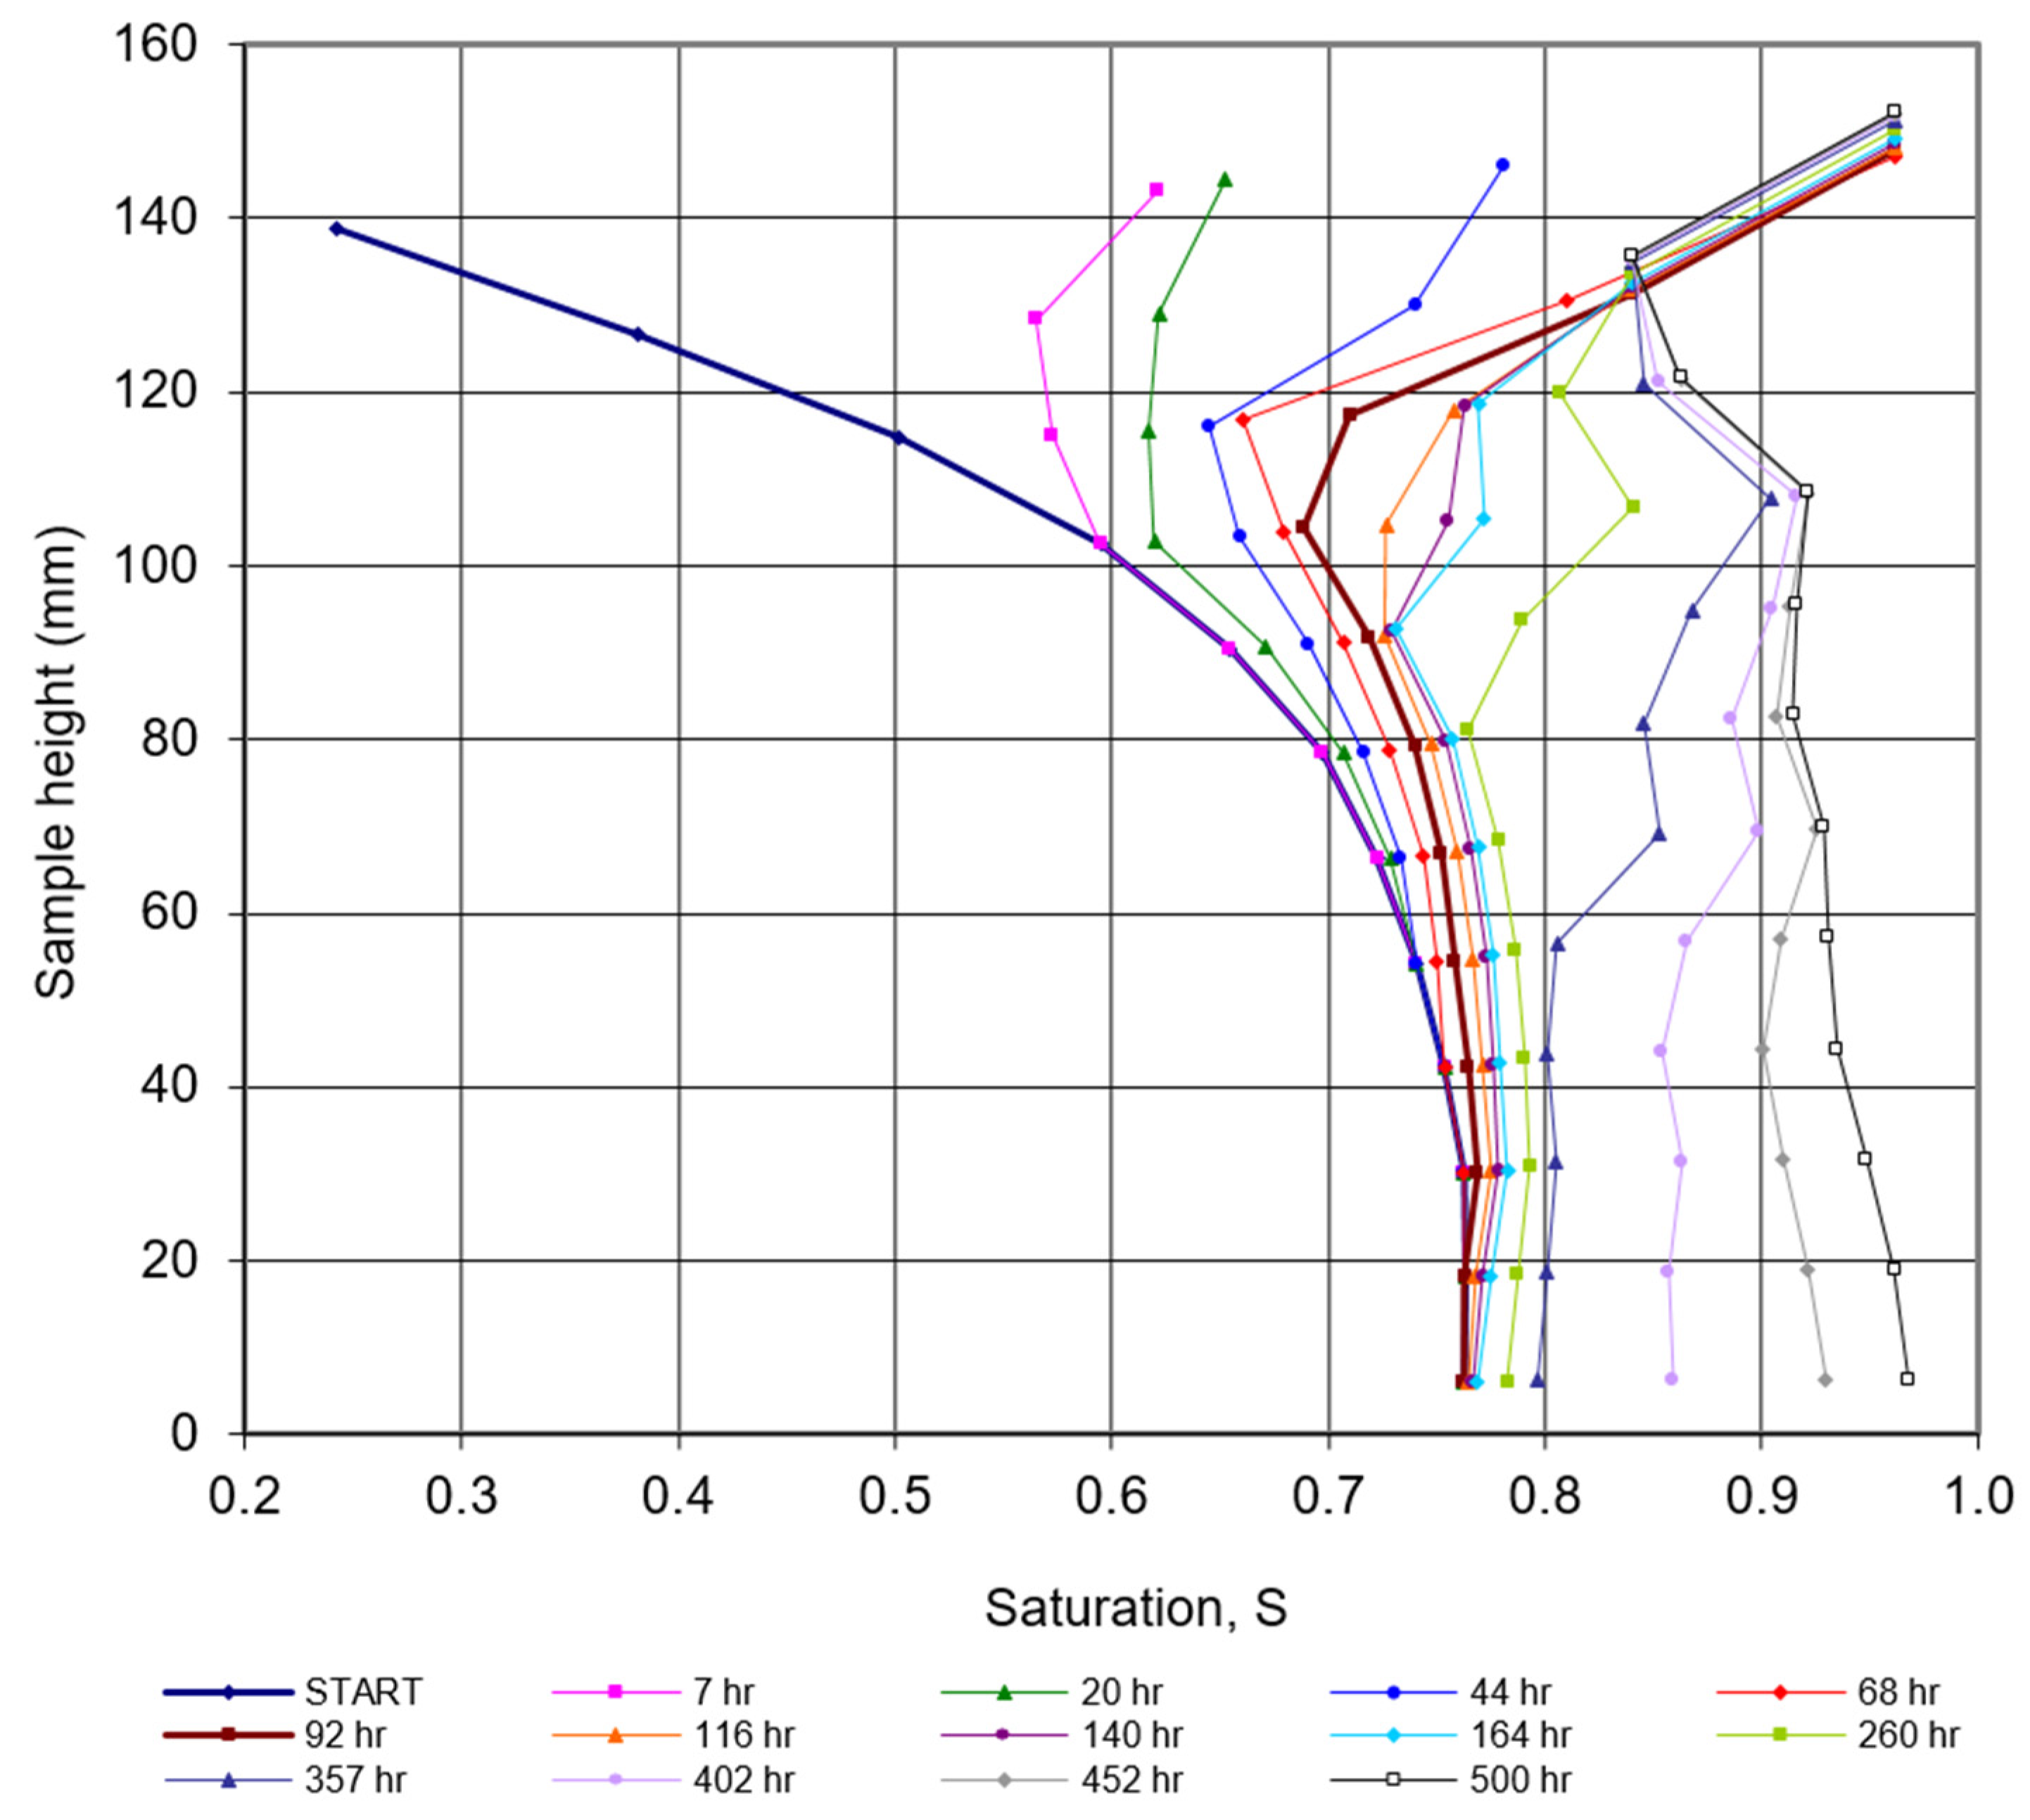
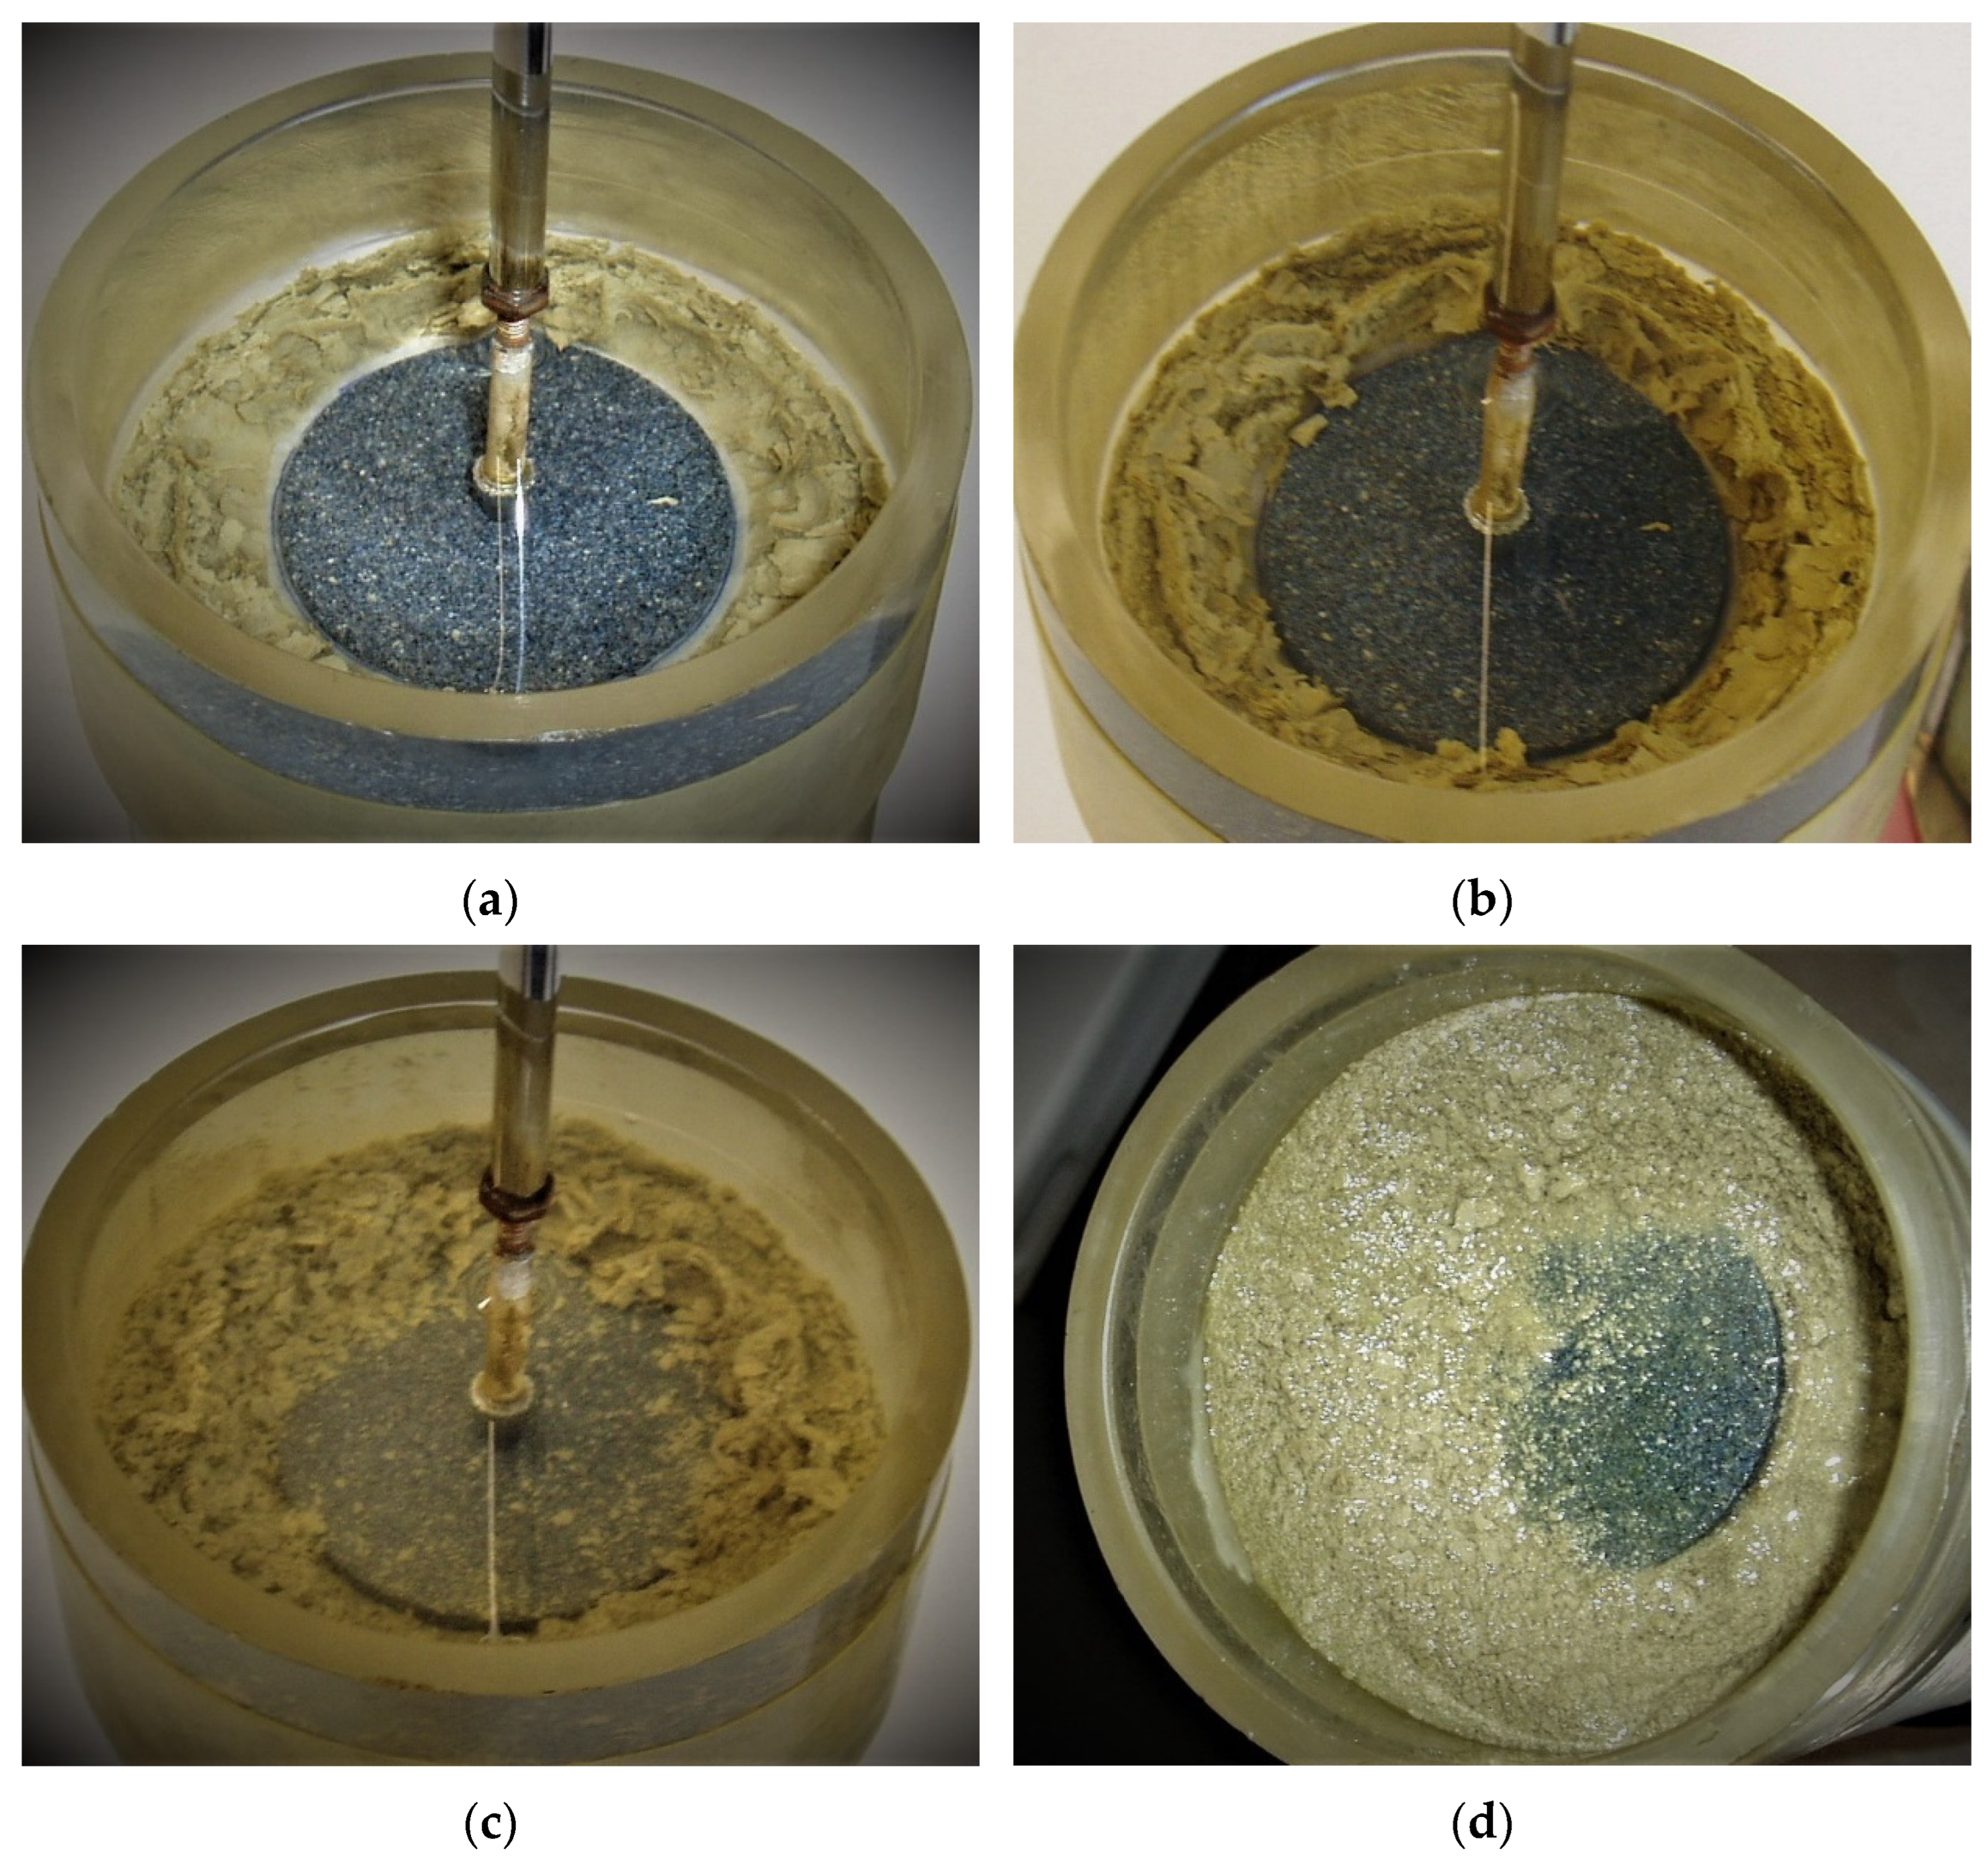
| After drying for 40 days, sample VU-4-was divided into 12 discs of equal height: 12.15 mm. Discs no. 1 to 10 were physically divided by cutting. During cutting, the material broke into pieces of irregular shapes. Discs no. 11 and 12 (bottom of the column) were not divided to preserve the integrity of that part of the sample. The preserved bottom of the sample made it possible to measure the volume before and after drying in a drying oven at 60 °C. Based on this, the following were determined: the void ratio (e) at the moisture content (w) found after drying, the shrinkage limit of the material (eo), and the slope of the residual shrinkage phase curve (krez). | |||||||||||
| At moisture content w = 0.289, the measured void ratio is e = 1.03. After drying in a drying oven at 60 °C to a constant mass, the void ratio (shrinkage limit) is eo = 0.84. The slope of the residual phase direction of the volume shrinkage . | |||||||||||
| Specific gravity of solid particles: 2.72 | |||||||||||
| Relation between moisture content and void ratio: for w > 0.408 → e = 2.72 w → proportional shrinkage phase for w < 0.408 → e = 0.66 w + 0.84 → residual shrinkage phase | |||||||||||
| VU-4 | Measured | Calculated | |||||||||
| Disc no. | H. of meas. point (mm) | Disc diam. (mm) | Disc volume (cm3) | Moisture content, w | Void ratio, e | Void volume (cm3) | Volume of solids (cm3) | Water mass (g) | Mass of solids (g) | Disc mass (g) | Degree of saturation, S |
| 1 | 139.7 | 66.10 | 41.7 | 0.079 | 0.89 | 19.7 | 22.0 | 4.76 | 59.92 | 64.68 | 0.24 |
| 2 | 127.6 | 66.13 | 41.7 | 0.130 | 0.93 | 20.1 | 21.7 | 7.64 | 58.94 | 66.58 | 0.38 |
| 3 | 115.4 | 66.37 | 42.0 | 0.177 | 0.96 | 20.5 | 21.5 | 10.32 | 58.43 | 68.75 | 0.50 |
| 4 | 103.3 | 66.66 | 42.4 | 0.215 | 0.98 | 21.0 | 21.4 | 12.49 | 58.19 | 70.69 | 0.59 |
| 5 | 91.1 | 66.84 | 42.6 | 0.240 | 1.00 | 21.3 | 21.3 | 13.93 | 58.02 | 71.95 | 0.65 |
| 6 | 79.0 | 67.04 | 42.9 | 0.259 | 1.01 | 21.6 | 21.3 | 15.03 | 58.00 | 73.03 | 0.70 |
| 7 | 66.8 | 67.10 | 43.0 | 0.271 | 1.02 | 21.7 | 21.3 | 15.66 | 57.89 | 73.55 | 0.72 |
| 8 | 54.7 | 67.09 | 42.9 | 0.279 | 1.02 | 21.7 | 21.2 | 16.09 | 57.71 | 73.80 | 0.74 |
| 9 | 42.5 | 67.10 | 43.0 | 0.285 | 1.03 | 21.8 | 21.2 | 16.41 | 57.62 | 74.02 | 0.75 |
| 10 | 30.4 | 67.12 | 43.0 | 0.289 | 1.03 | 21.8 | 21.2 | 16.64 | 57.57 | 74.21 | 0.76 |
| 11 | 18.2 | 67.10 | 43.0 | 0.289 | 1.03 | 21.8 | 21.2 | 16.64 | 57.54 | 74.17 | 0.76 |
| 12 | 6.1 | 67.14 | 43.0 | 0.289 | 1.03 | 21.8 | 21.2 | 16.65 | 57.61 | 74.26 | 0.76 |
| Calculated: | 162.25 | 697.44 | 859.69 | ||||||||
| Measured: | 168.22 | 698.88 | 867.10 | ||||||||
| Difference (g) (calc.-meas.): | −5.97 | −1.44 | −7.41 | ||||||||
| Difference (%): | −3.6 | −0.2 | −0.9 | ||||||||
| After drying for 41 days, sample VU-3 was divided into 12 discs of equal height: 12.07 mm | |||||||||||
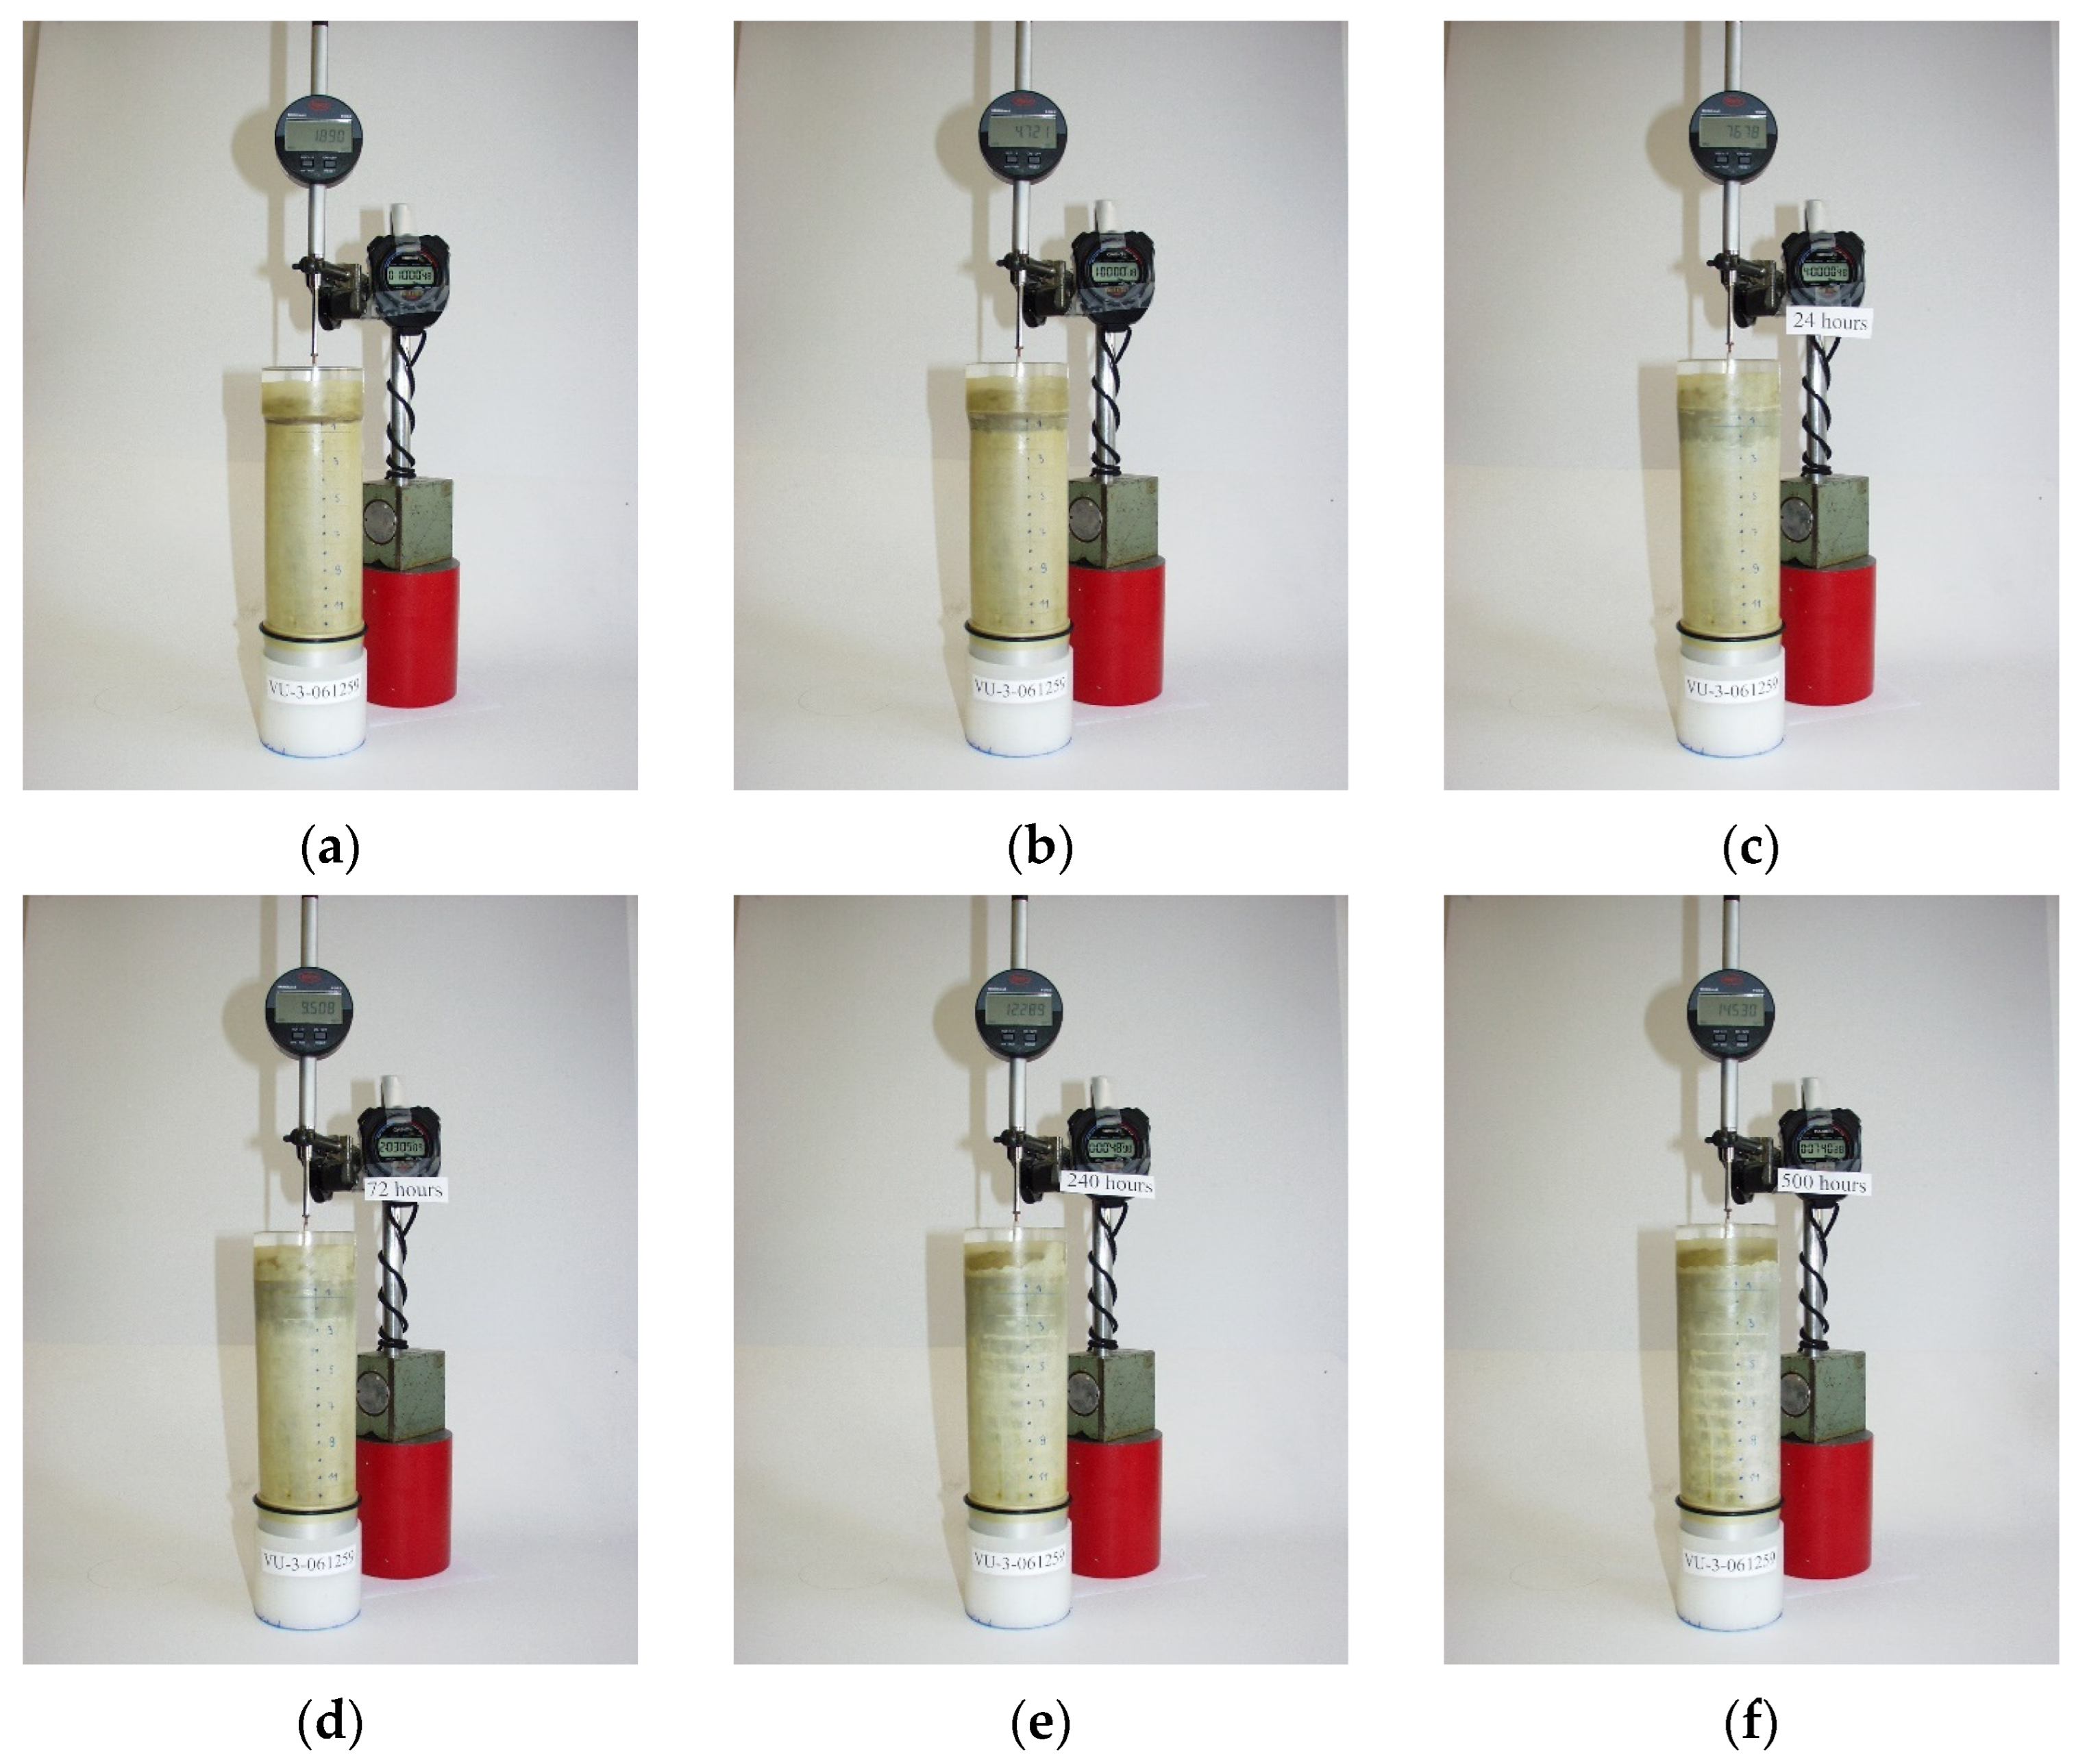
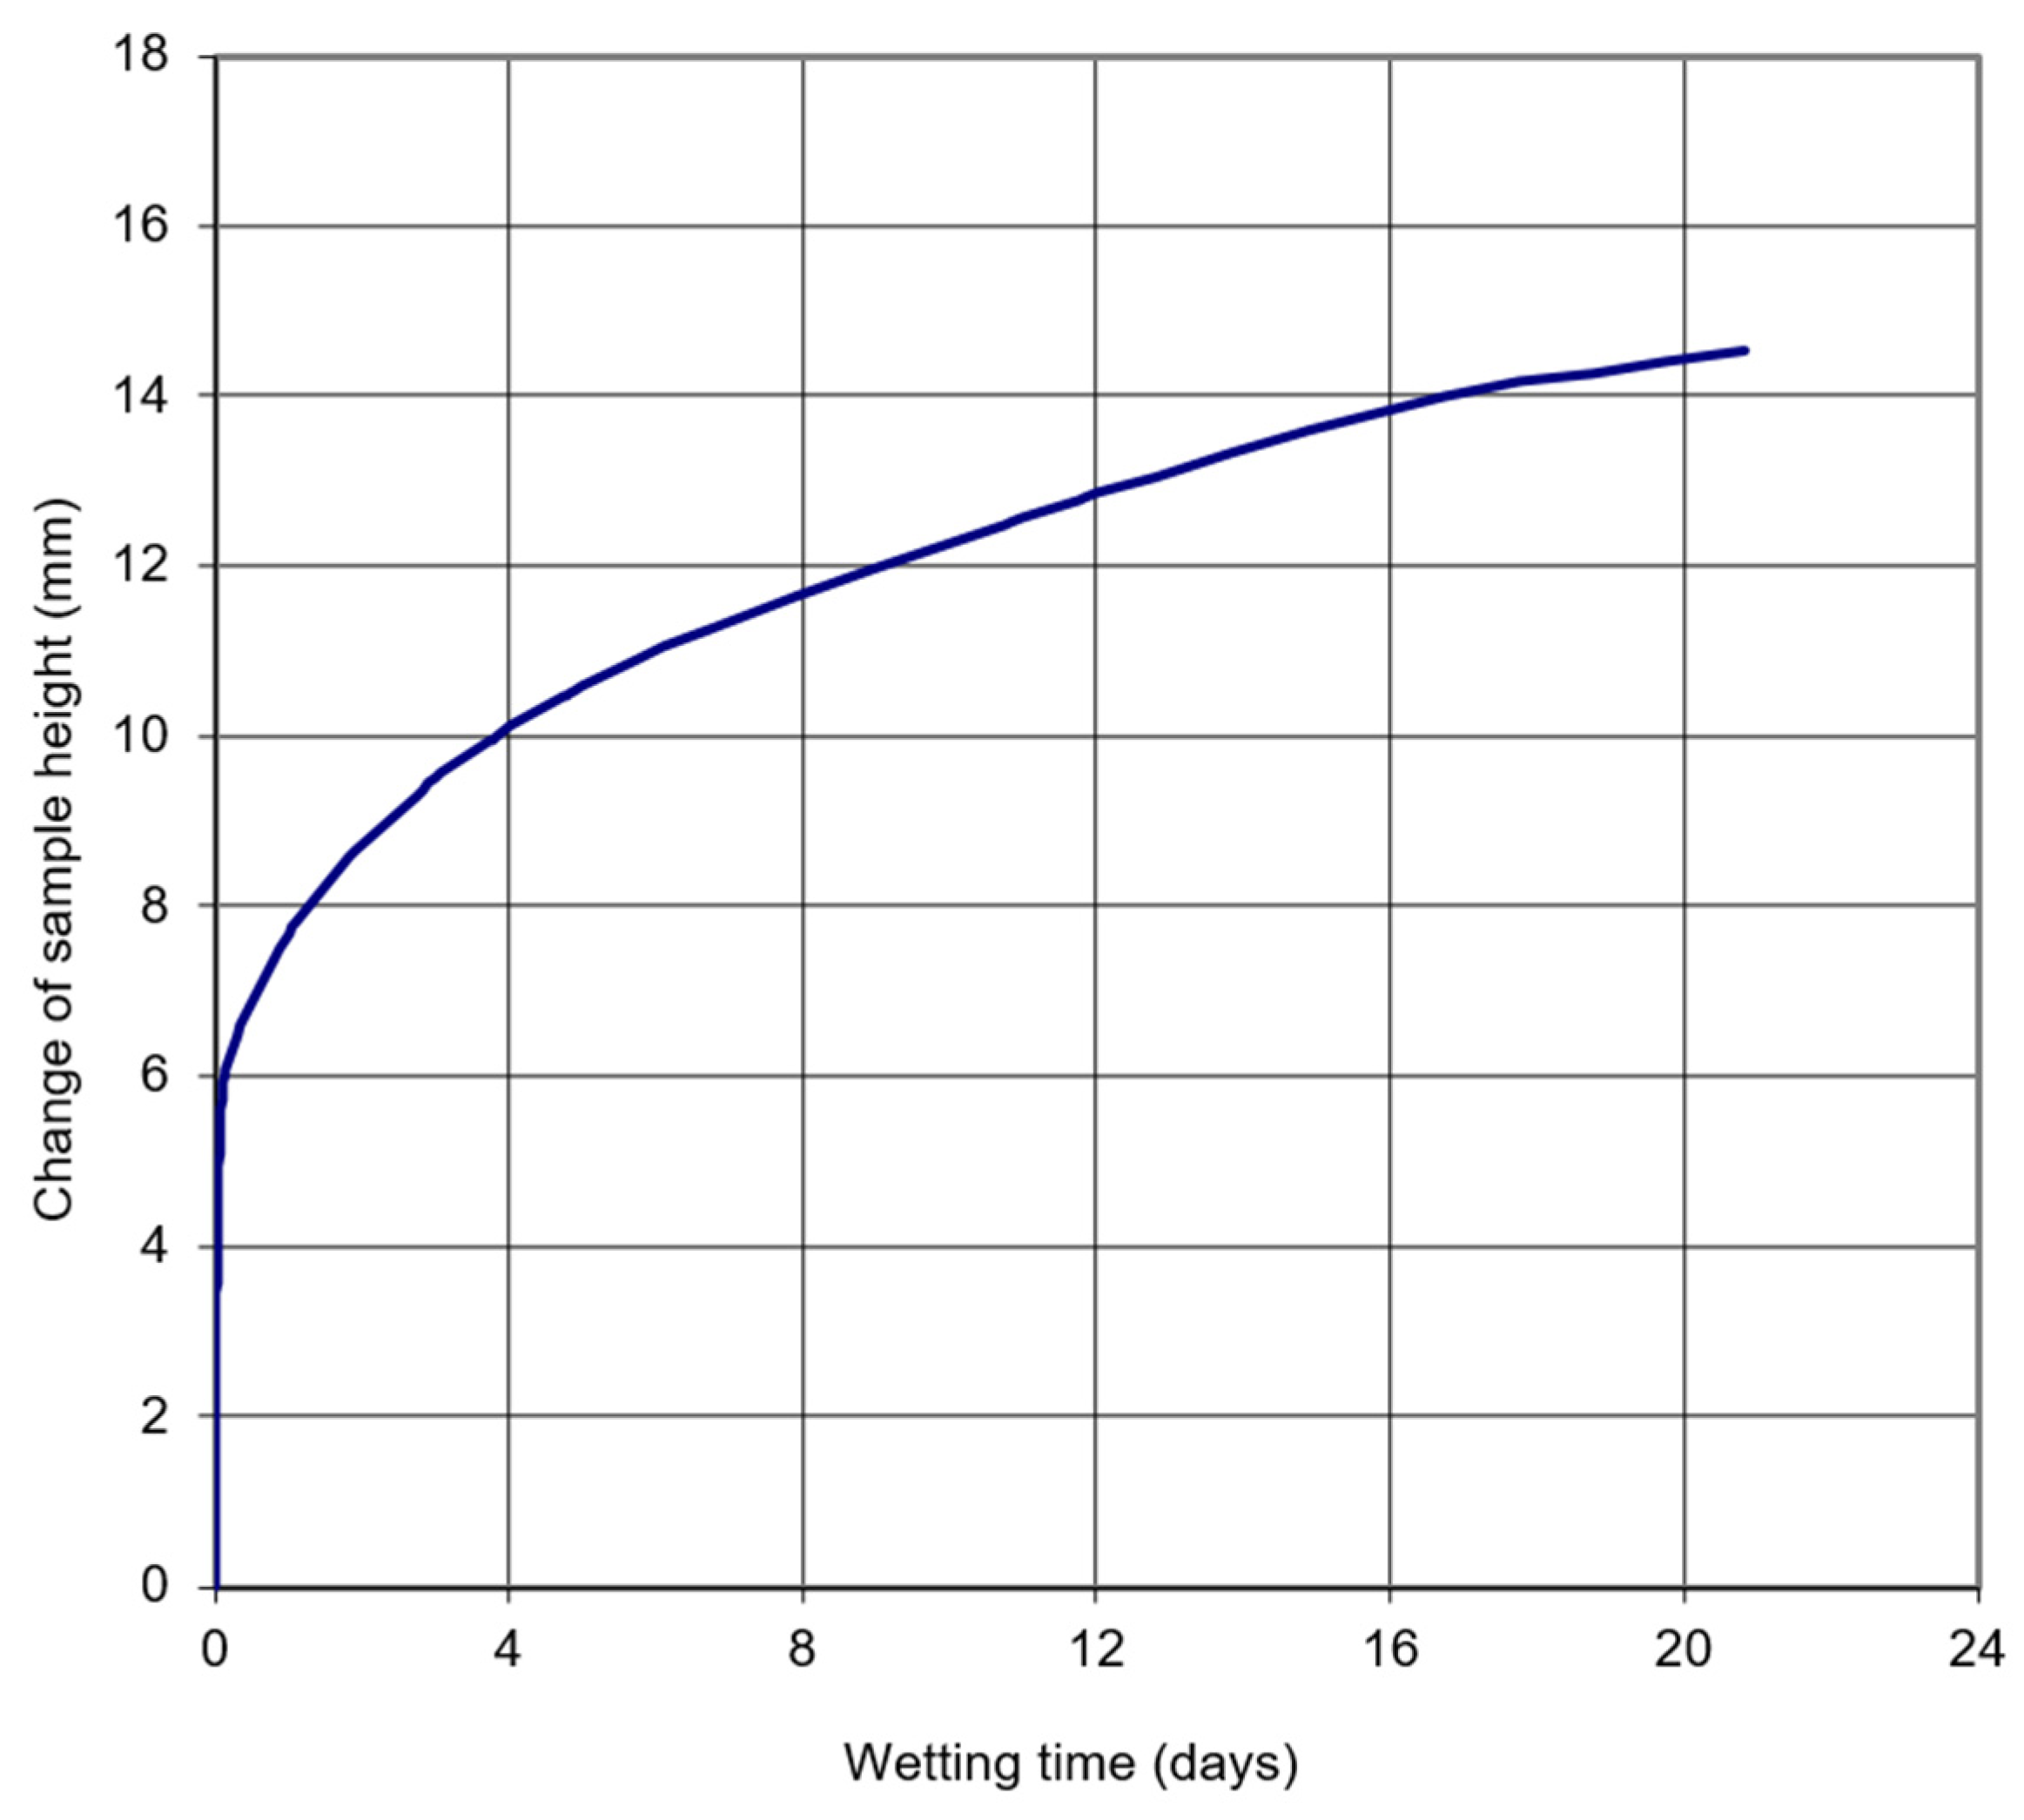
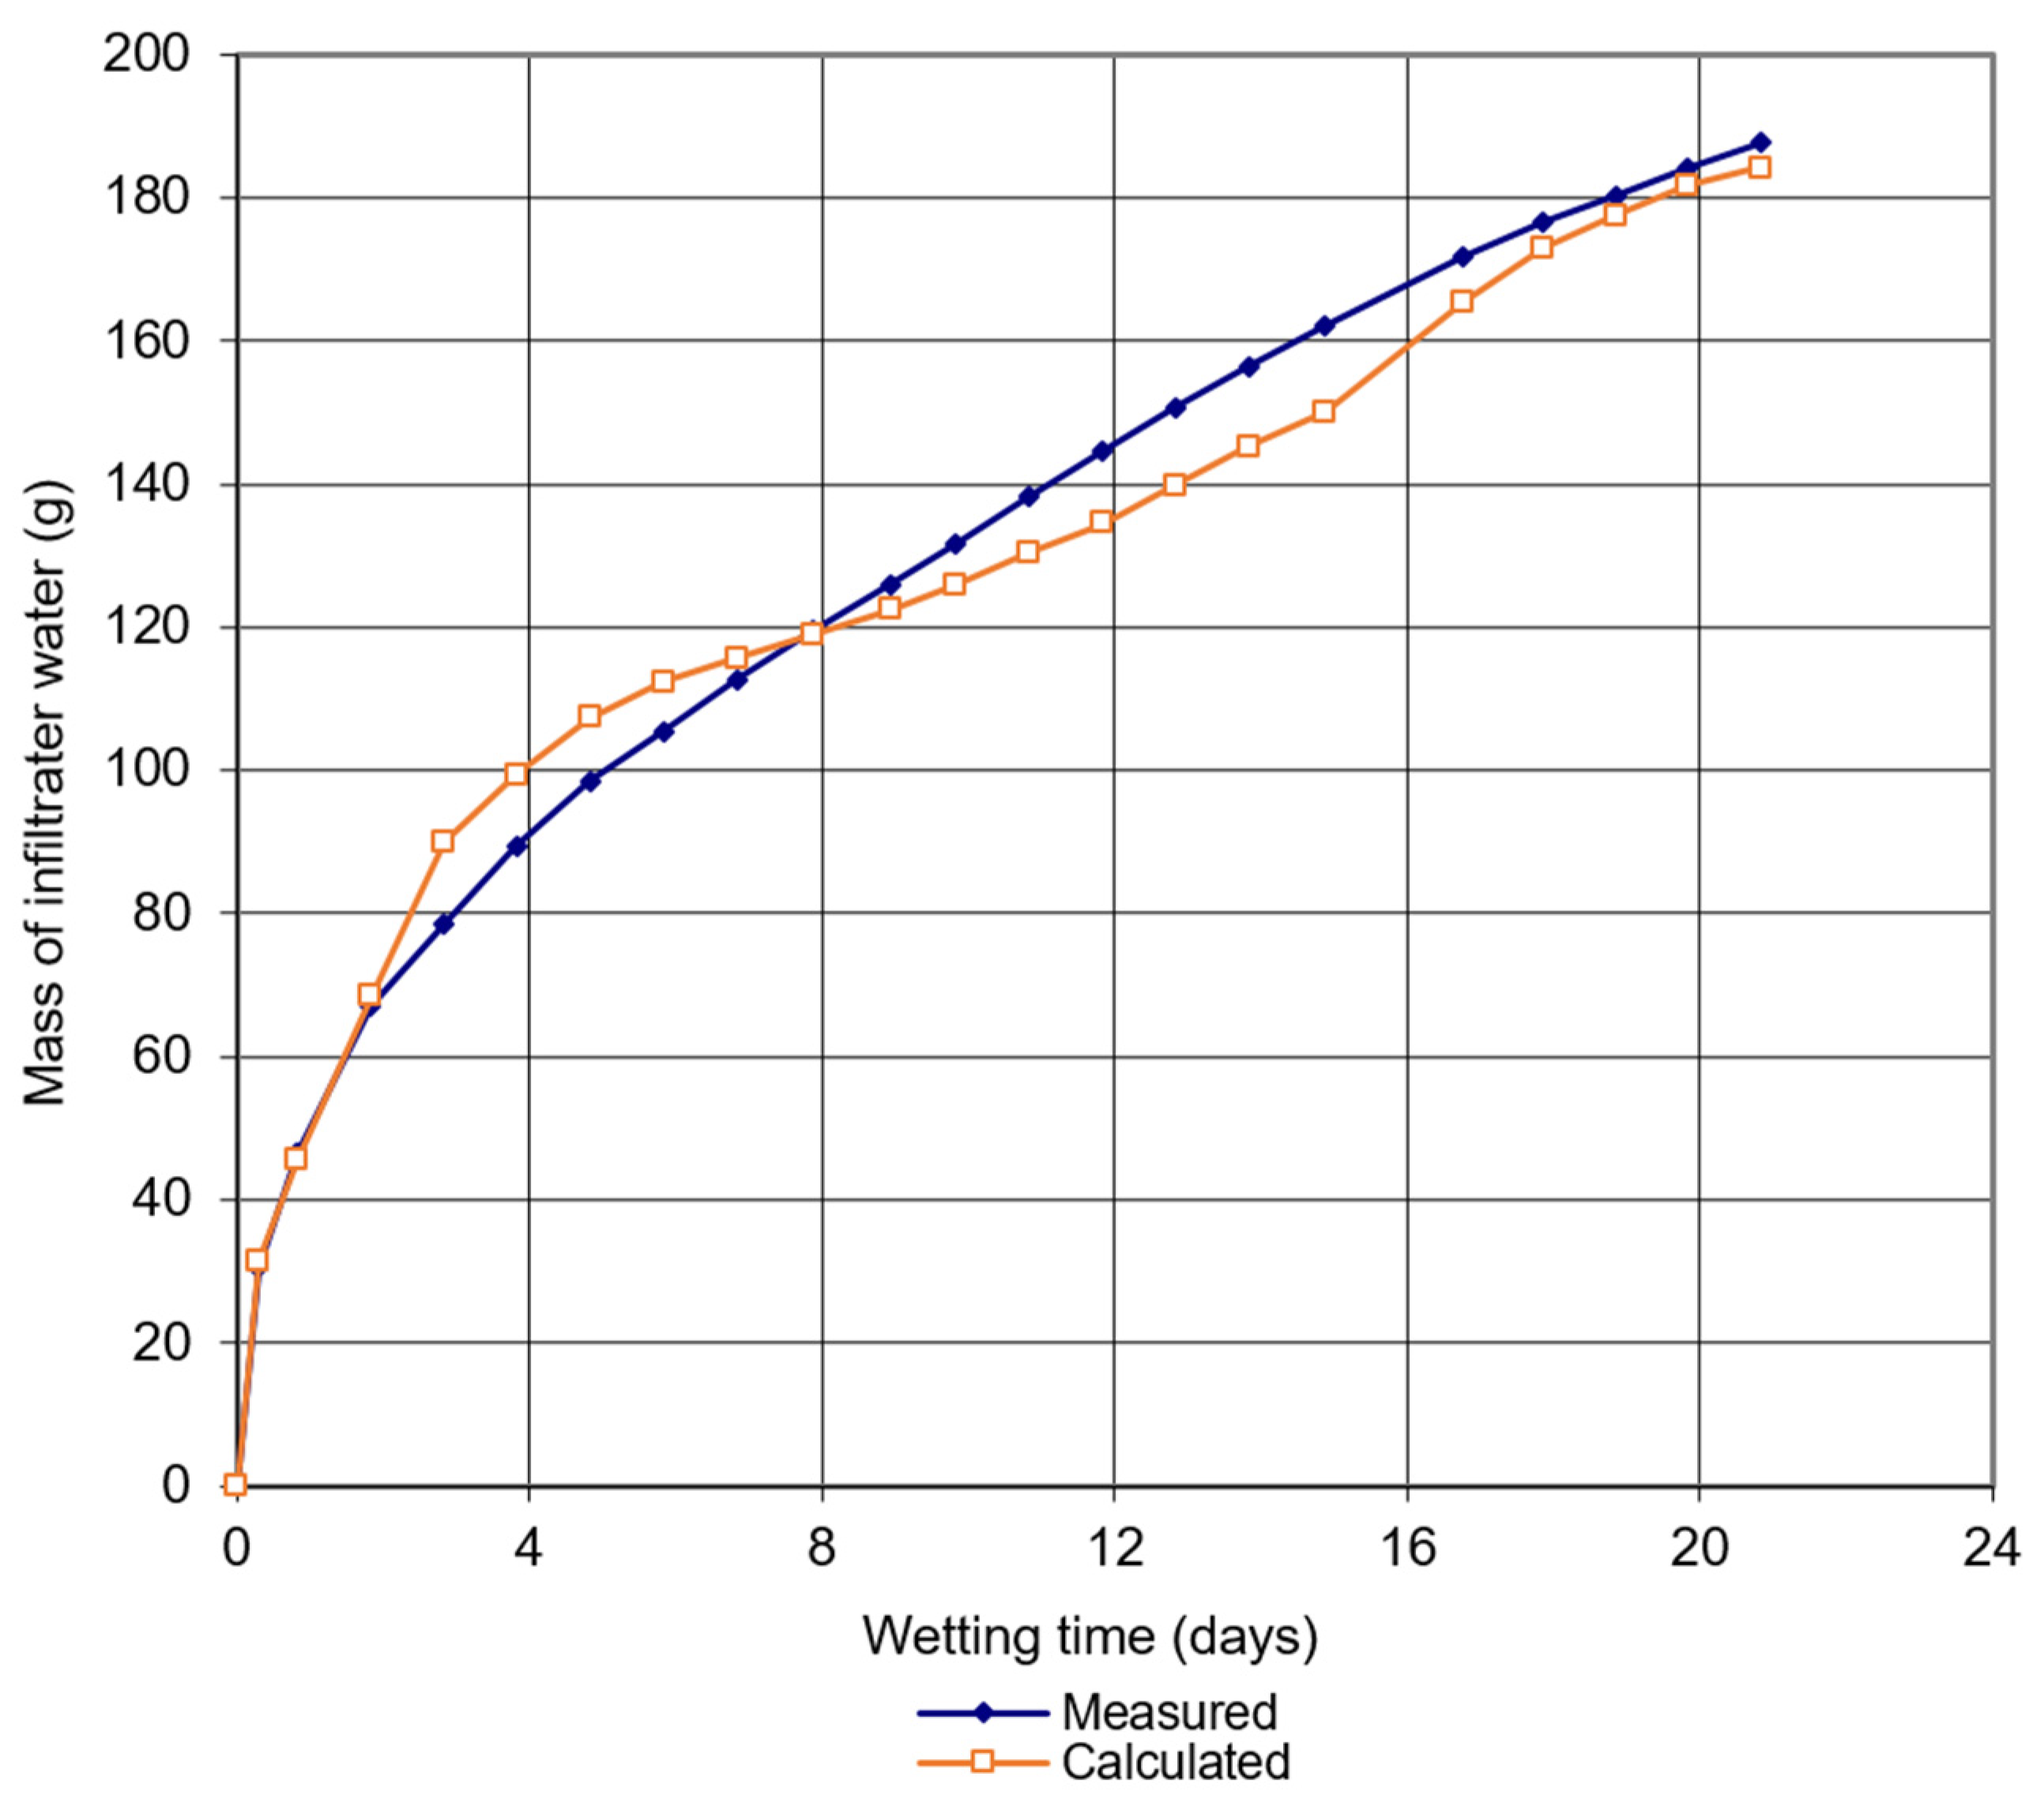
| After drying, the sample was subjected to one-dimensional wetting. | |||||||||||
| Specific gravity of solid particles: 2.72 | |||||||||||
| Relation between moisture content and void ratio: for w > 0.408 → e = 2.72 w → proportional shrinkage phase for w < 0.408 → e = 0.66 w + 0.84 → residual shrinkage phase | |||||||||||
| VU-3 | Measured | Assum. moisture content, w | Calculated | ||||||||
| Disc no. | Height of meas. point (mm) | Disc dia. (mm) | Disc volume (cm3) | Void ratio, e | Void volume (cm3) | Vol. of solids (cm3) | Water mass (g) | Mass of solids (g) | Disc mass (g) | Degree of satur. S | |
| 1 | 138.8 | 66.09 | 41.4 | 0.079 | 0.89 | 19.5 | 21.9 | 4.72 | 59.51 | 64.23 | 0.24 |
| 2 | 126.7 | 66.45 | 41.9 | 0.130 | 0.93 | 20.1 | 21.7 | 7.67 | 59.12 | 66.79 | 0.38 |
| 3 | 114.6 | 66.56 | 42.0 | 0.177 | 0.96 | 20.5 | 21.5 | 10.31 | 58.38 | 68.69 | 0.50 |
| 4 | 102.6 | 66.86 | 42.4 | 0.215 | 0.98 | 21.0 | 21.4 | 12.49 | 58.16 | 70.64 | 0.59 |
| 5 | 90.5 | 67.00 | 42.5 | 0.240 | 1.00 | 21.3 | 21.3 | 13.91 | 57.91 | 71.82 | 0.65 |
| 6 | 78.4 | 67.13 | 42.7 | 0.259 | 1.01 | 21.5 | 21.2 | 14.97 | 57.77 | 72.74 | 0.70 |
| 7 | 66.4 | 67.22 | 42.8 | 0.271 | 1.02 | 21.6 | 21.2 | 15.61 | 57.71 | 73.32 | 0.72 |
| 8 | 54.3 | 67.31 | 42.9 | 0.279 | 1.02 | 21.7 | 21.2 | 16.09 | 57.71 | 73.80 | 0.74 |
| 9 | 42.2 | 67.34 | 43.0 | 0.285 | 1.03 | 21.8 | 21.2 | 16.41 | 57.65 | 74.06 | 0.75 |
| 10 | 30.2 | 67.27 | 42.9 | 0.289 | 1.03 | 21.8 | 21.1 | 16.60 | 57.45 | 74.05 | 0.76 |
| 11 | 18.1 | 67.27 | 42.9 | 0.289 | 1.03 | 21.8 | 21.1 | 16.61 | 57.45 | 74.06 | 0.76 |
| 12 | 6.0 | 67.22 | 42.8 | 0.289 | 1.03 | 21.7 | 21.1 | 16.58 | 57.37 | 73.94 | 0.76 |
| Calculated: | 161.97 | 696.18 | 858.15 | ||||||||
| Measured: | 168.20 | 699.00 | 867.20 | ||||||||
| Difference (g) (calc.-meas.): | −6.23 | −2.82 | −9.05 | ||||||||
| Difference (%): | −3.7 | −0.4 | −1.0 | ||||||||
| After 1D wetting for 21 days, sample VU-3 was divided into 12 discs according to the previously engraved marks. During cutting, the material broke into pieces of irregular shapes. The moisture content of the material from each disc was determined by drying in a drying oven at 60 °C until it reached a constant mass. Based on the measured dimensions, the volume of each disc was determined, and the mass of solids in each disc was determined before wetting, i.e., at the end of drying. | |||||||||||
| Specific gravity of solid particles: 2.72 | |||||||||||
| VU-3 | Measured | Calculated | |||||||||
| Disc no. | Height of meas. point (mm) | Disc dia. (mm) | Disc volume (cm3) | Moisture content, w | Void ratio, e | Void volume (cm3) | Volume of solids (cm3) | Water mass (g) | Mass of solids (g) | Disc mass (g) | Degree of saturation, S |
| 1 | 152.3 | 71.10 | 73.8 | 0.840 | 2.38 | 52.0 | 21.9 | 49.99 | 59.51 | 109.50 | 0.96 |
| 2 | 135.8 | 71.09 | 57.2 | 0.504 | 1.63 | 35.5 | 21.7 | 29.79 | 59.12 | 88.91 | 0.84 |
| 3 | 121.8 | 70.96 | 53.6 | 0.475 | 1.50 | 32.1 | 21.5 | 27.71 | 58.38 | 86.08 | 0.86 |
| 4 | 108.6 | 70.77 | 50.8 | 0.466 | 1.38 | 29.4 | 21.4 | 27.13 | 58.16 | 85.28 | 0.92 |
| 5 | 95.7 | 70.73 | 50.6 | 0.463 | 1.38 | 29.3 | 21.3 | 26.83 | 57.91 | 84.74 | 0.92 |
| 6 | 82.8 | 70.68 | 50.4 | 0.462 | 1.37 | 29.2 | 21.2 | 26.67 | 57.77 | 84.44 | 0.91 |
| 7 | 70.0 | 70.45 | 49.9 | 0.461 | 1.35 | 28.6 | 21.2 | 26.59 | 57.71 | 84.30 | 0.93 |
| 8 | 57.2 | 70.36 | 49.7 | 0.459 | 1.34 | 28.5 | 21.2 | 26.48 | 57.71 | 84.19 | 0.93 |
| 9 | 44.4 | 70.24 | 49.4 | 0.458 | 1.33 | 28.2 | 21.2 | 26.39 | 57.65 | 84.04 | 0.93 |
| 10 | 31.7 | 69.94 | 48.9 | 0.458 | 1.31 | 27.7 | 21.1 | 26.30 | 57.45 | 83.75 | 0.95 |
| 11 | 19.0 | 69.73 | 48.5 | 0.458 | 1.30 | 27.4 | 21.1 | 26.28 | 57.45 | 83.73 | 0.96 |
| 12 | 6.3 | 69.48 | 48.0 | 0.453 | 1.27 | 26.9 | 21.1 | 25.99 | 57.37 | 83.36 | 0.97 |
| Calculated: | 346.15 | 696.18 | 1042.33 | ||||||||
| Measured: | 354.35 | 699.00 | 1053.35 | ||||||||
| Difference (g) (calc.-meas.): | −8.20 | −2.82 | −11.02 | ||||||||
| Difference (%): | −2.3 | −0.4 | −1.0 | ||||||||
Disclaimer/Publisher’s Note: The statements, opinions and data contained in all publications are solely those of the individual author(s) and contributor(s) and not of MDPI and/or the editor(s). MDPI and/or the editor(s) disclaim responsibility for any injury to people or property resulting from any ideas, methods, instructions or products referred to in the content. |
© 2023 by the authors. Licensee MDPI, Basel, Switzerland. This article is an open access article distributed under the terms and conditions of the Creative Commons Attribution (CC BY) license (https://creativecommons.org/licenses/by/4.0/).
Share and Cite
Kavur, B.; Štambuk Cvitanović, N.; Jug, J.; Vrkljan, I. Conceptual Model of Expansive Rock or Soil Swelling. Geosciences 2023, 13, 141. https://doi.org/10.3390/geosciences13050141
Kavur B, Štambuk Cvitanović N, Jug J, Vrkljan I. Conceptual Model of Expansive Rock or Soil Swelling. Geosciences. 2023; 13(5):141. https://doi.org/10.3390/geosciences13050141
Chicago/Turabian StyleKavur, Boris, Nataša Štambuk Cvitanović, Jasmin Jug, and Ivan Vrkljan. 2023. "Conceptual Model of Expansive Rock or Soil Swelling" Geosciences 13, no. 5: 141. https://doi.org/10.3390/geosciences13050141