
Vadose Zone Transport of Tritium and Nitrate under Ponded Water Conditions

 ,
,
Abstract
:1. Introduction
2. Materials and Methods
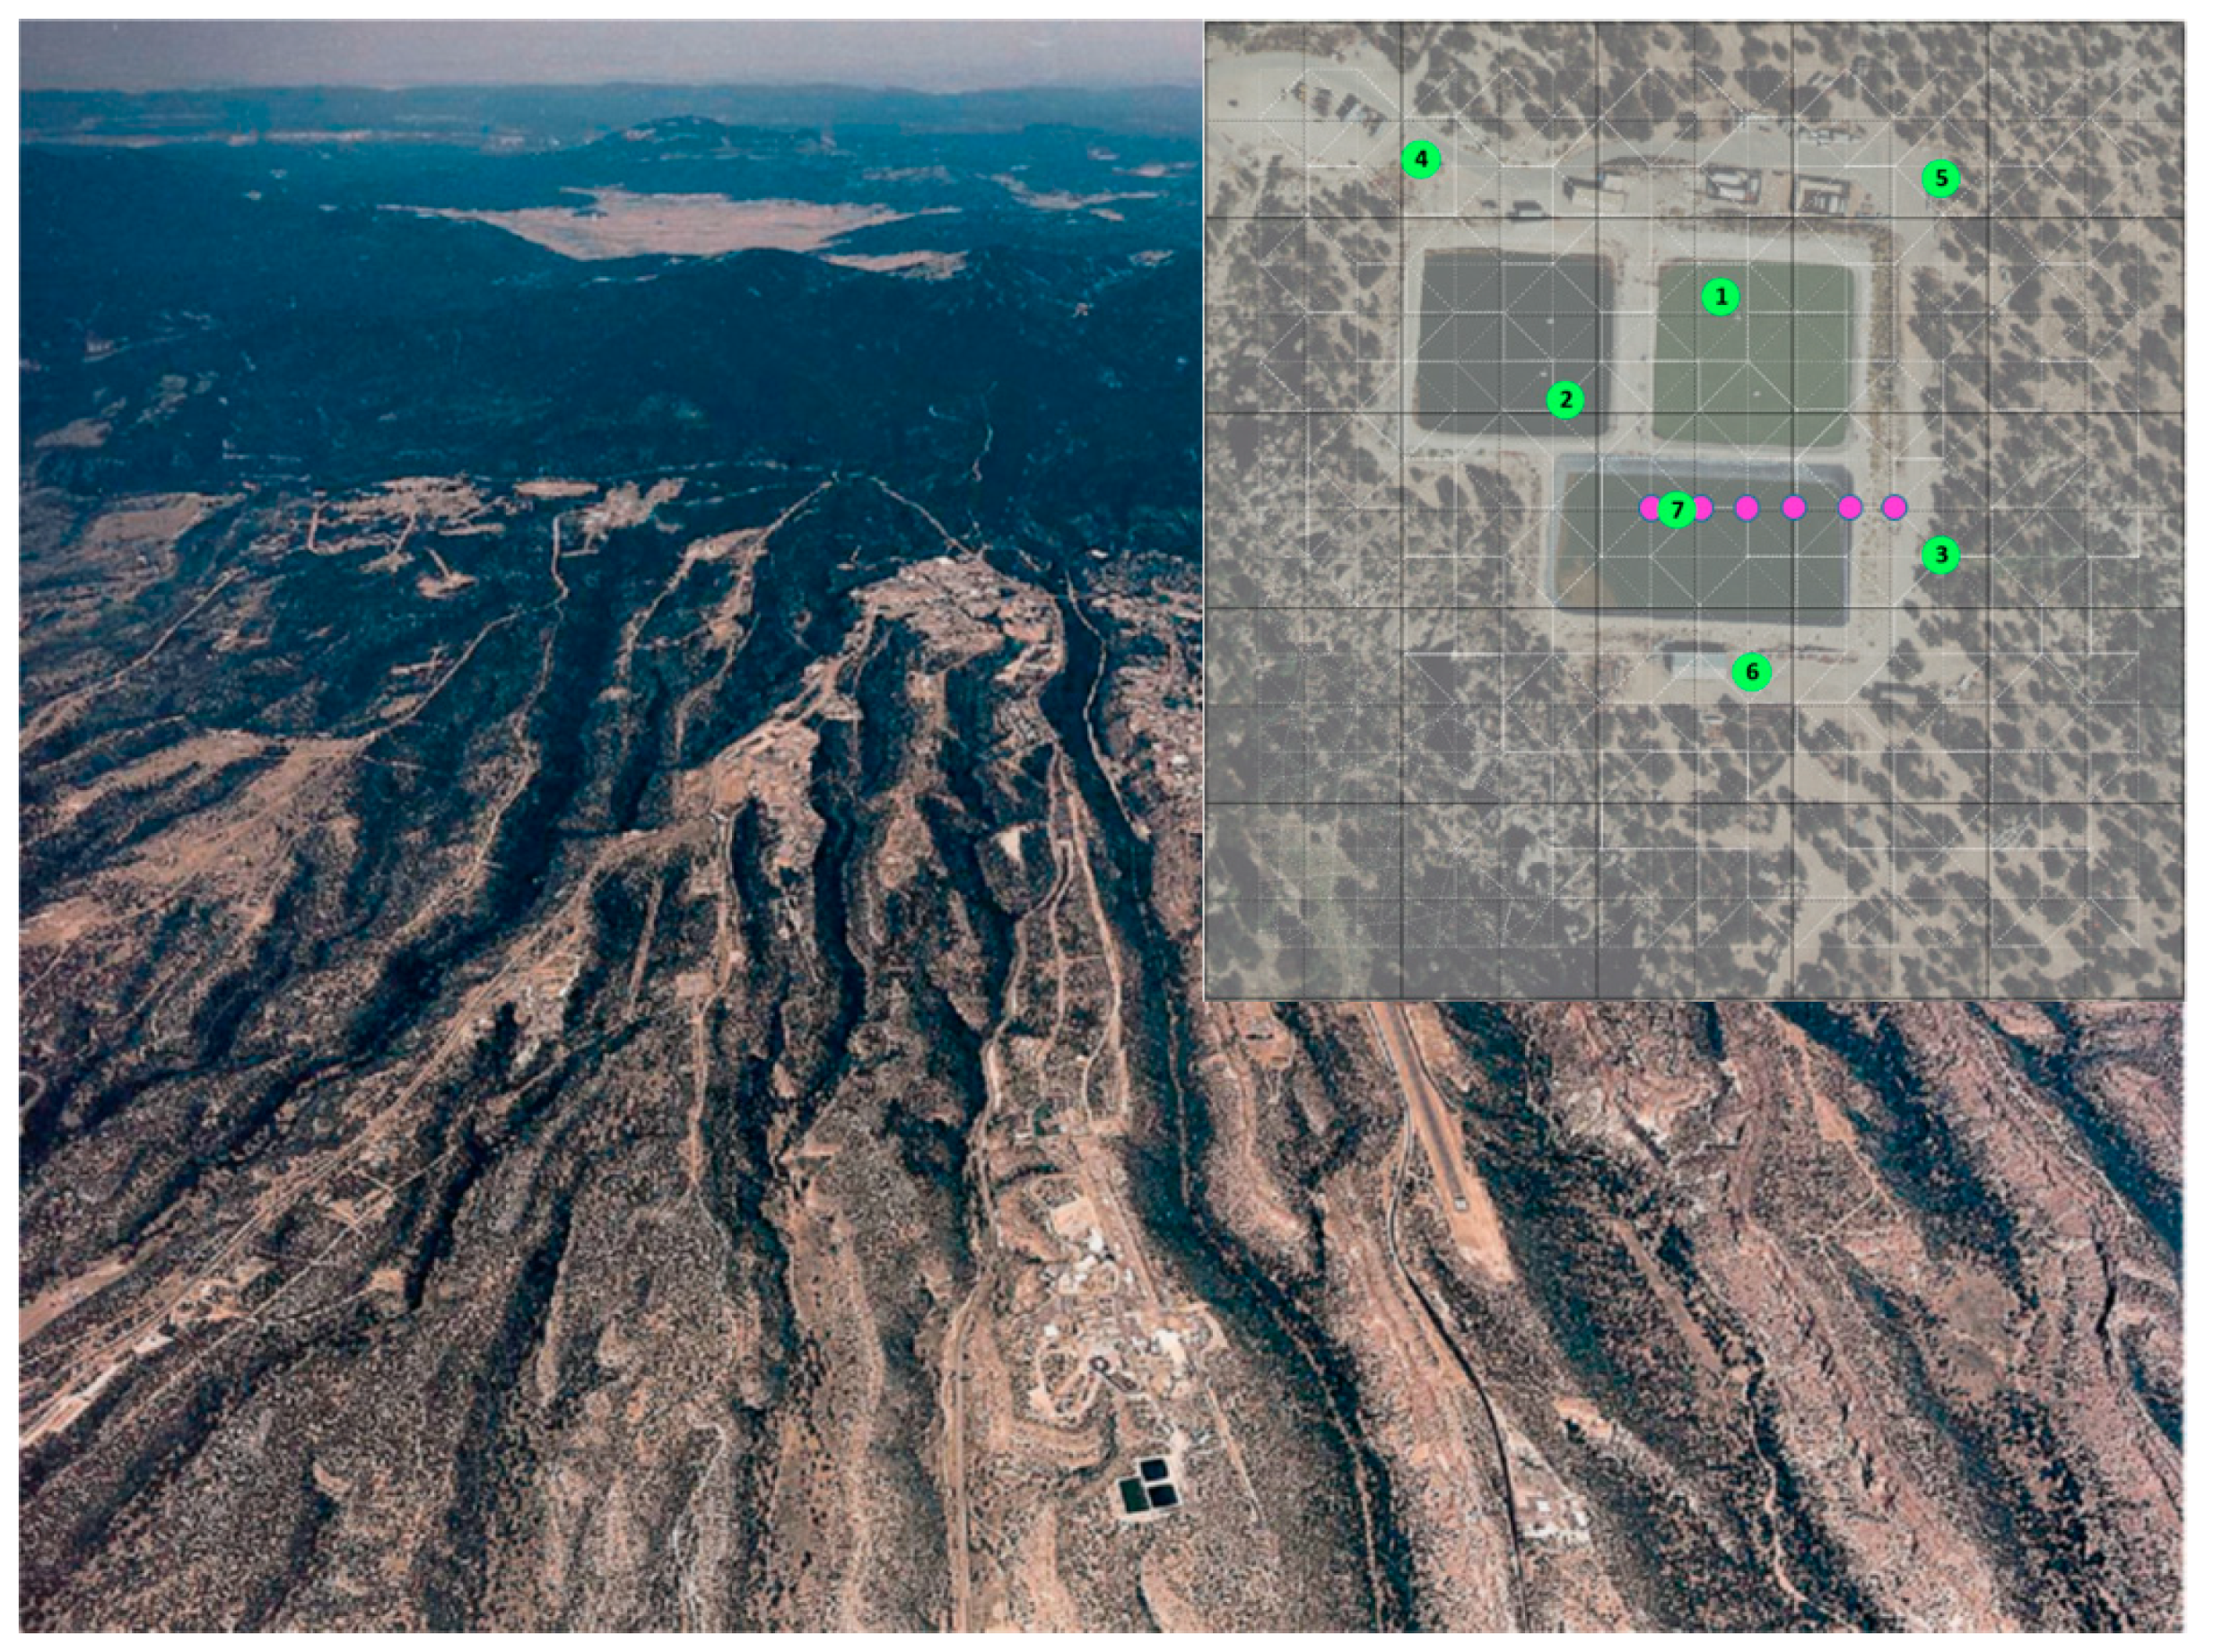
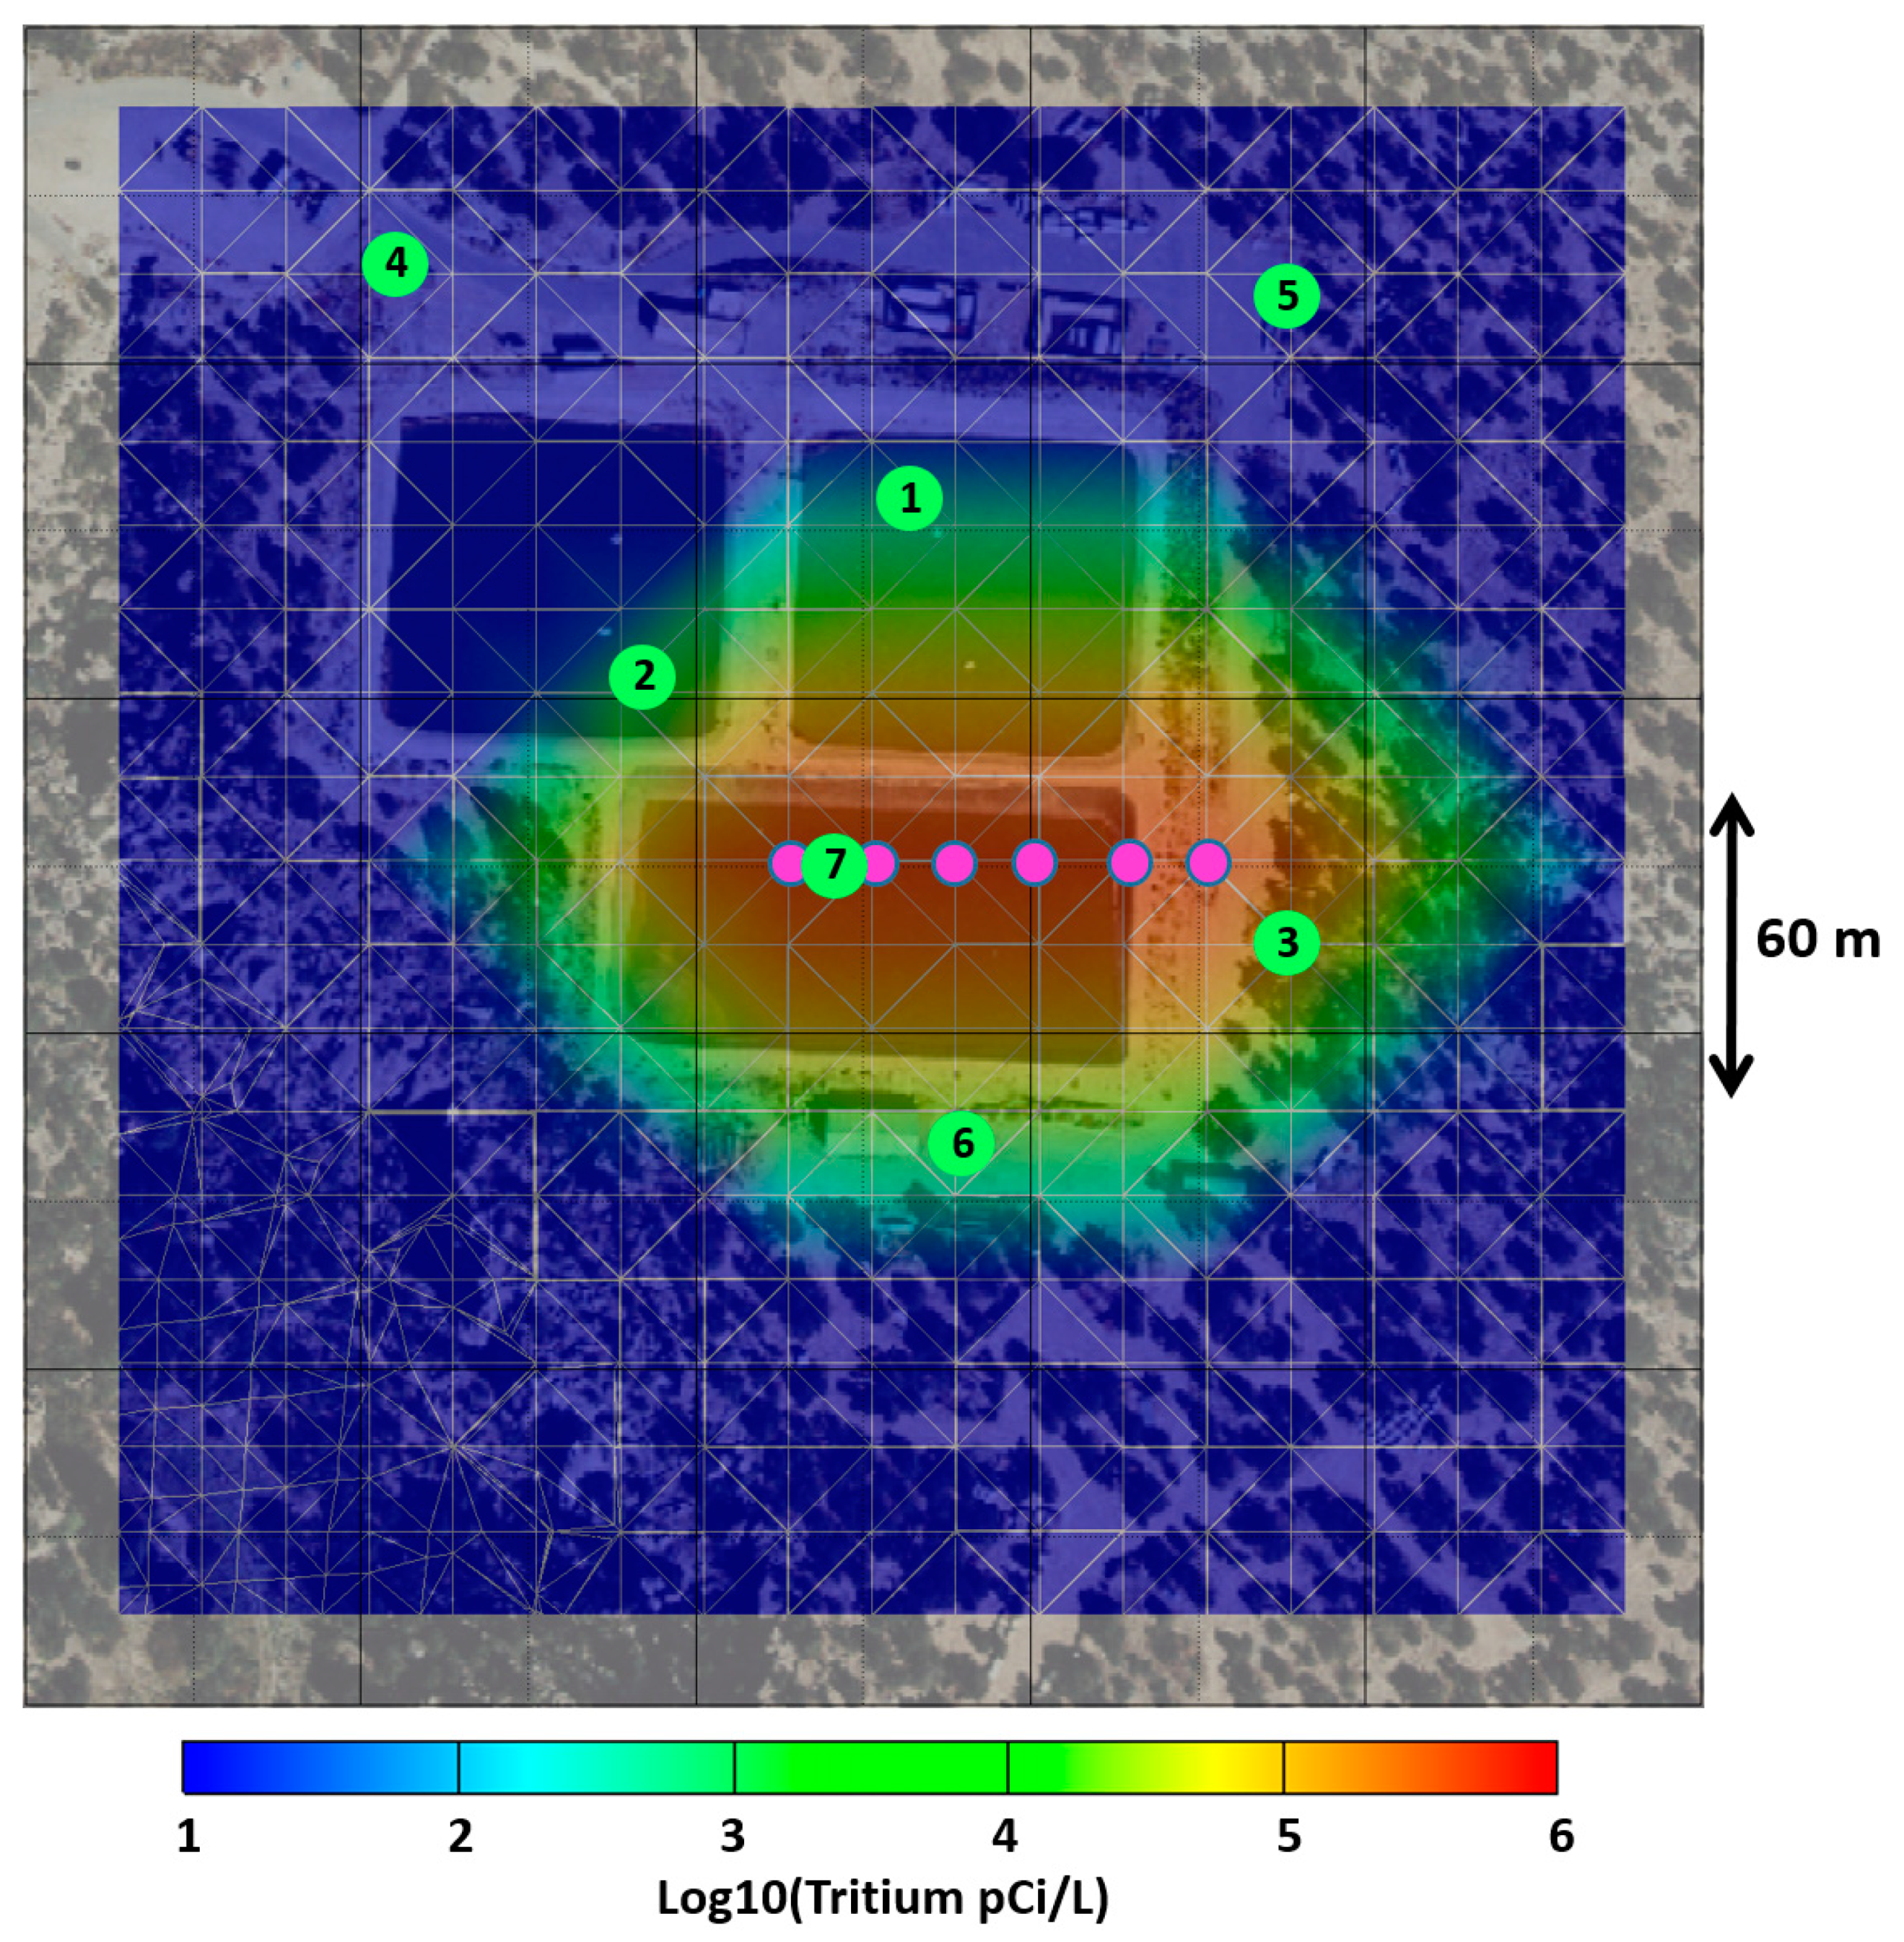
2.1. Site Description
2.2. Conceptual Model of Transport beneath the TA-53 Surface Impoundments and Drainage Ditch
2.3. Field Methods
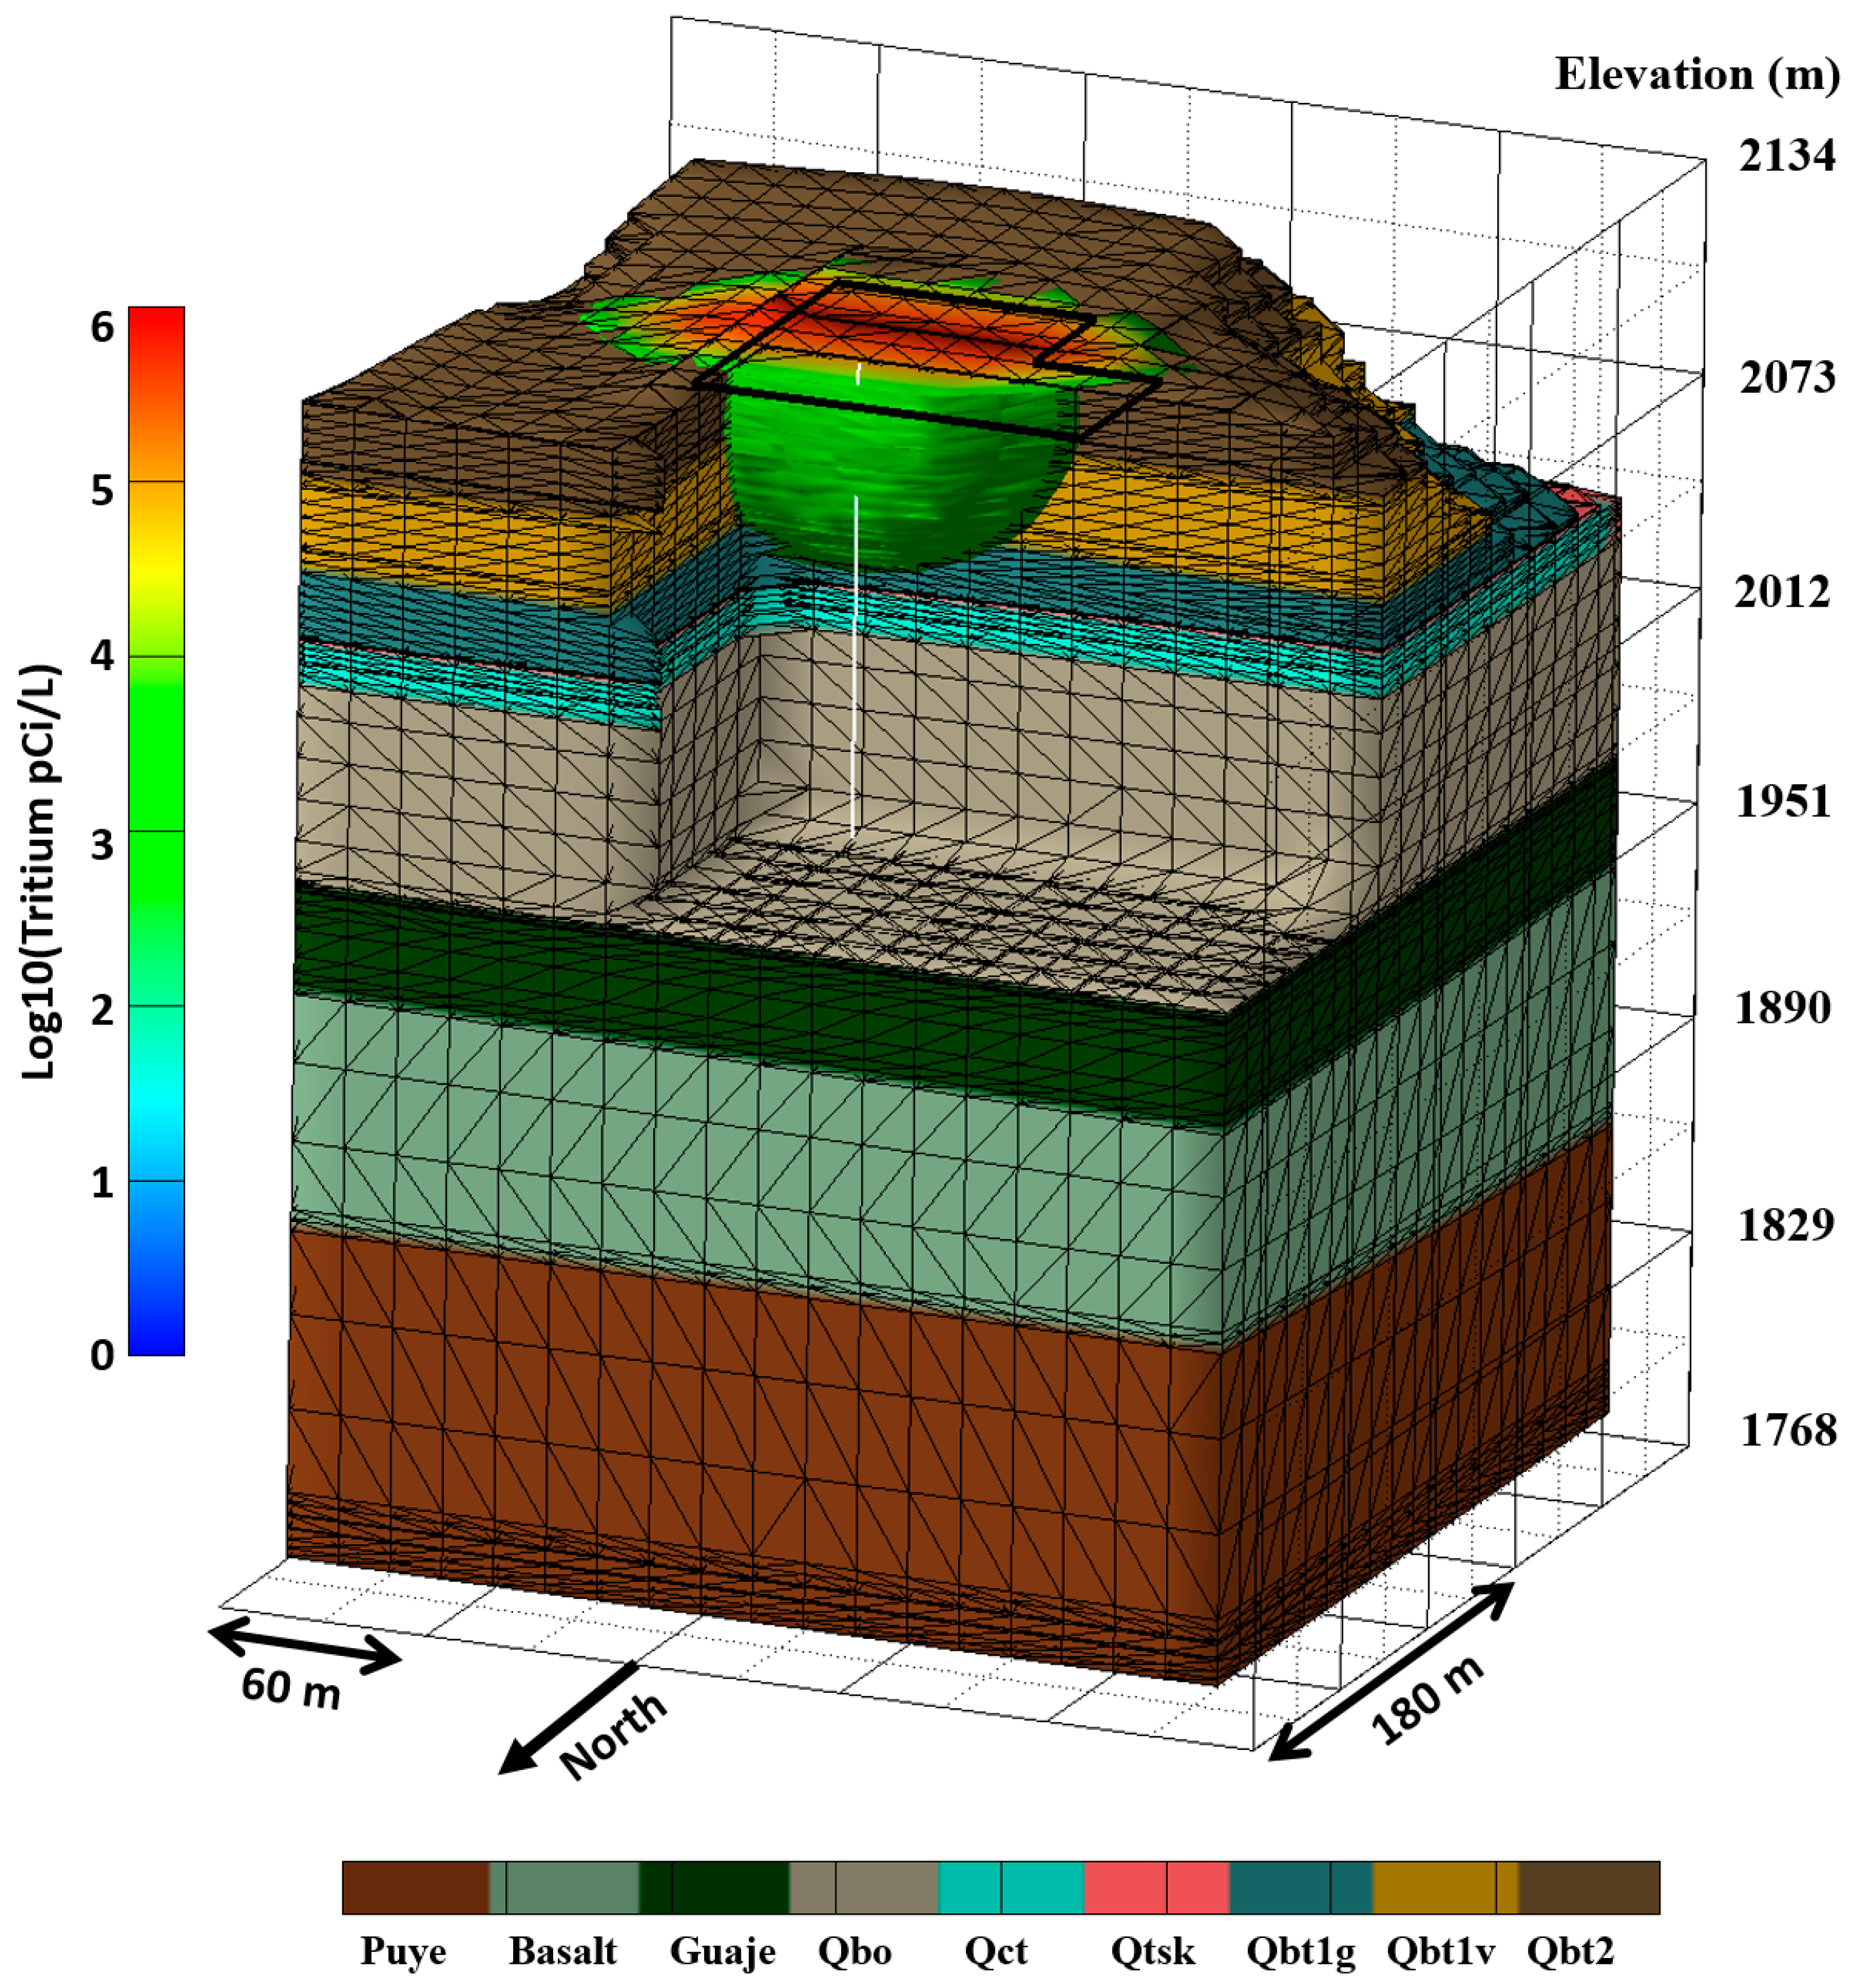
2.4. Numerical Model of Tritium Transport
3. Results
3.1. Field/Core Analysis Results
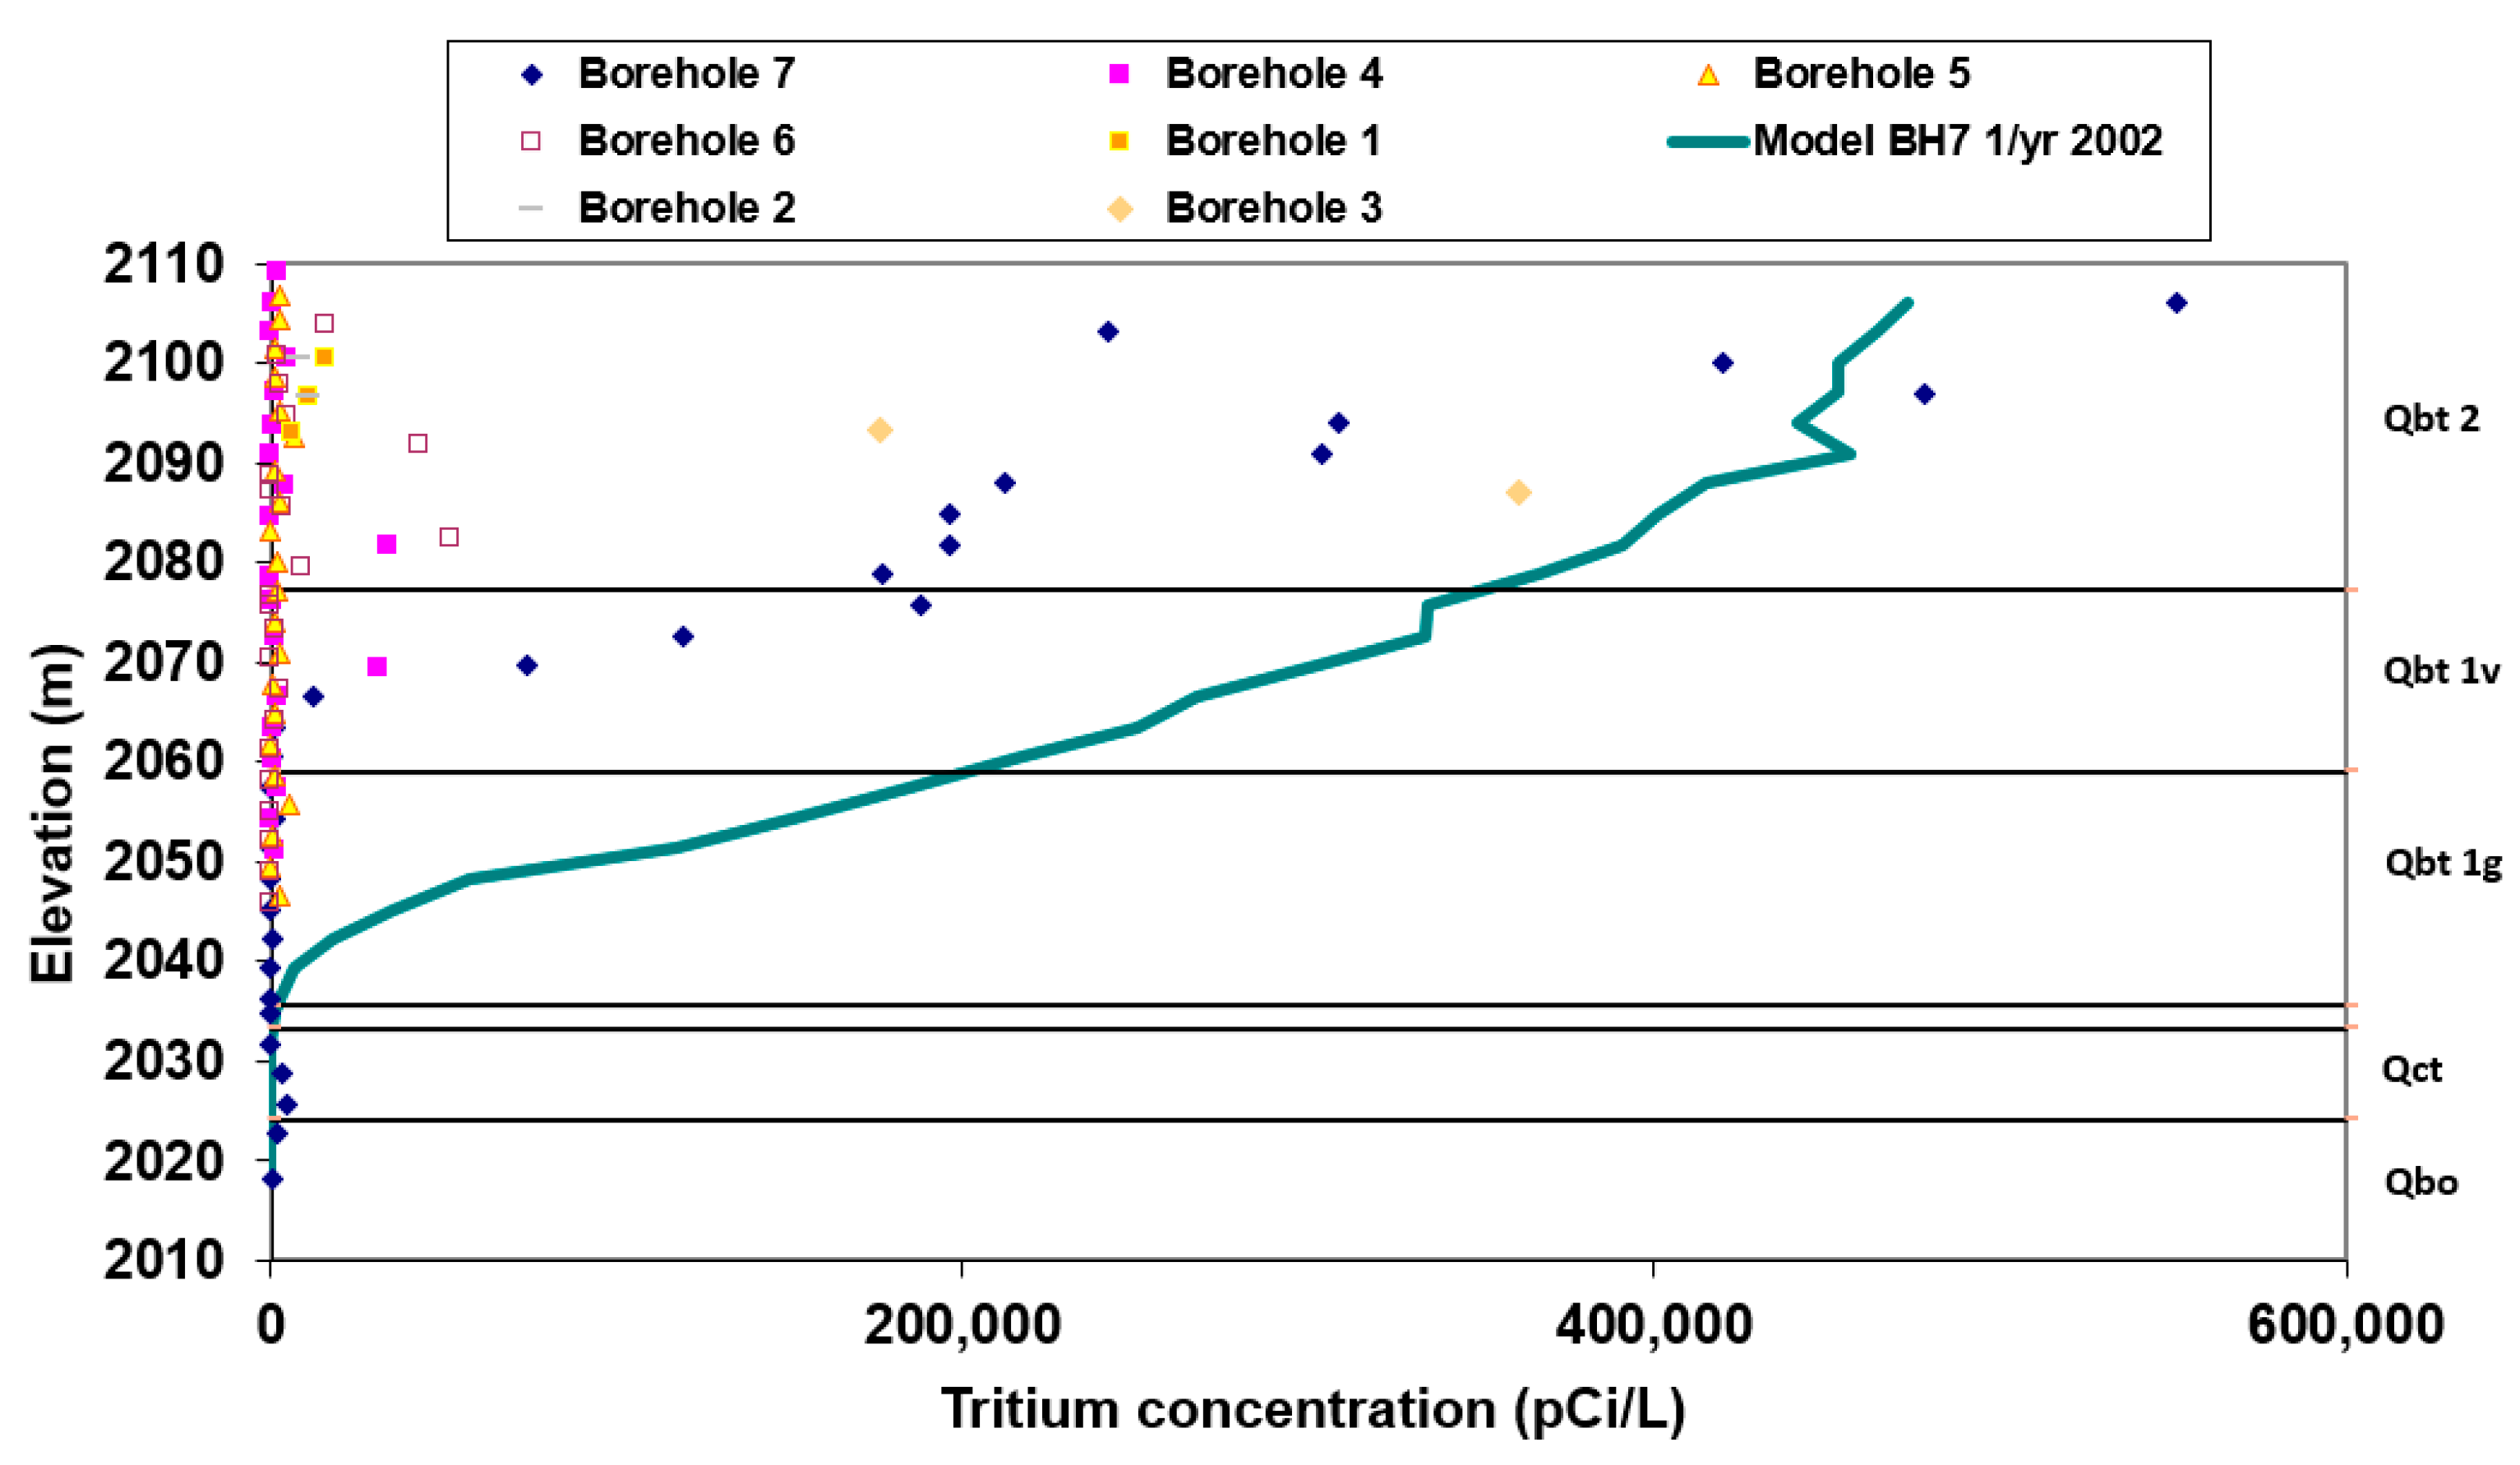
3.1.1. Moisture Content and Tritium Data from Borehole 7
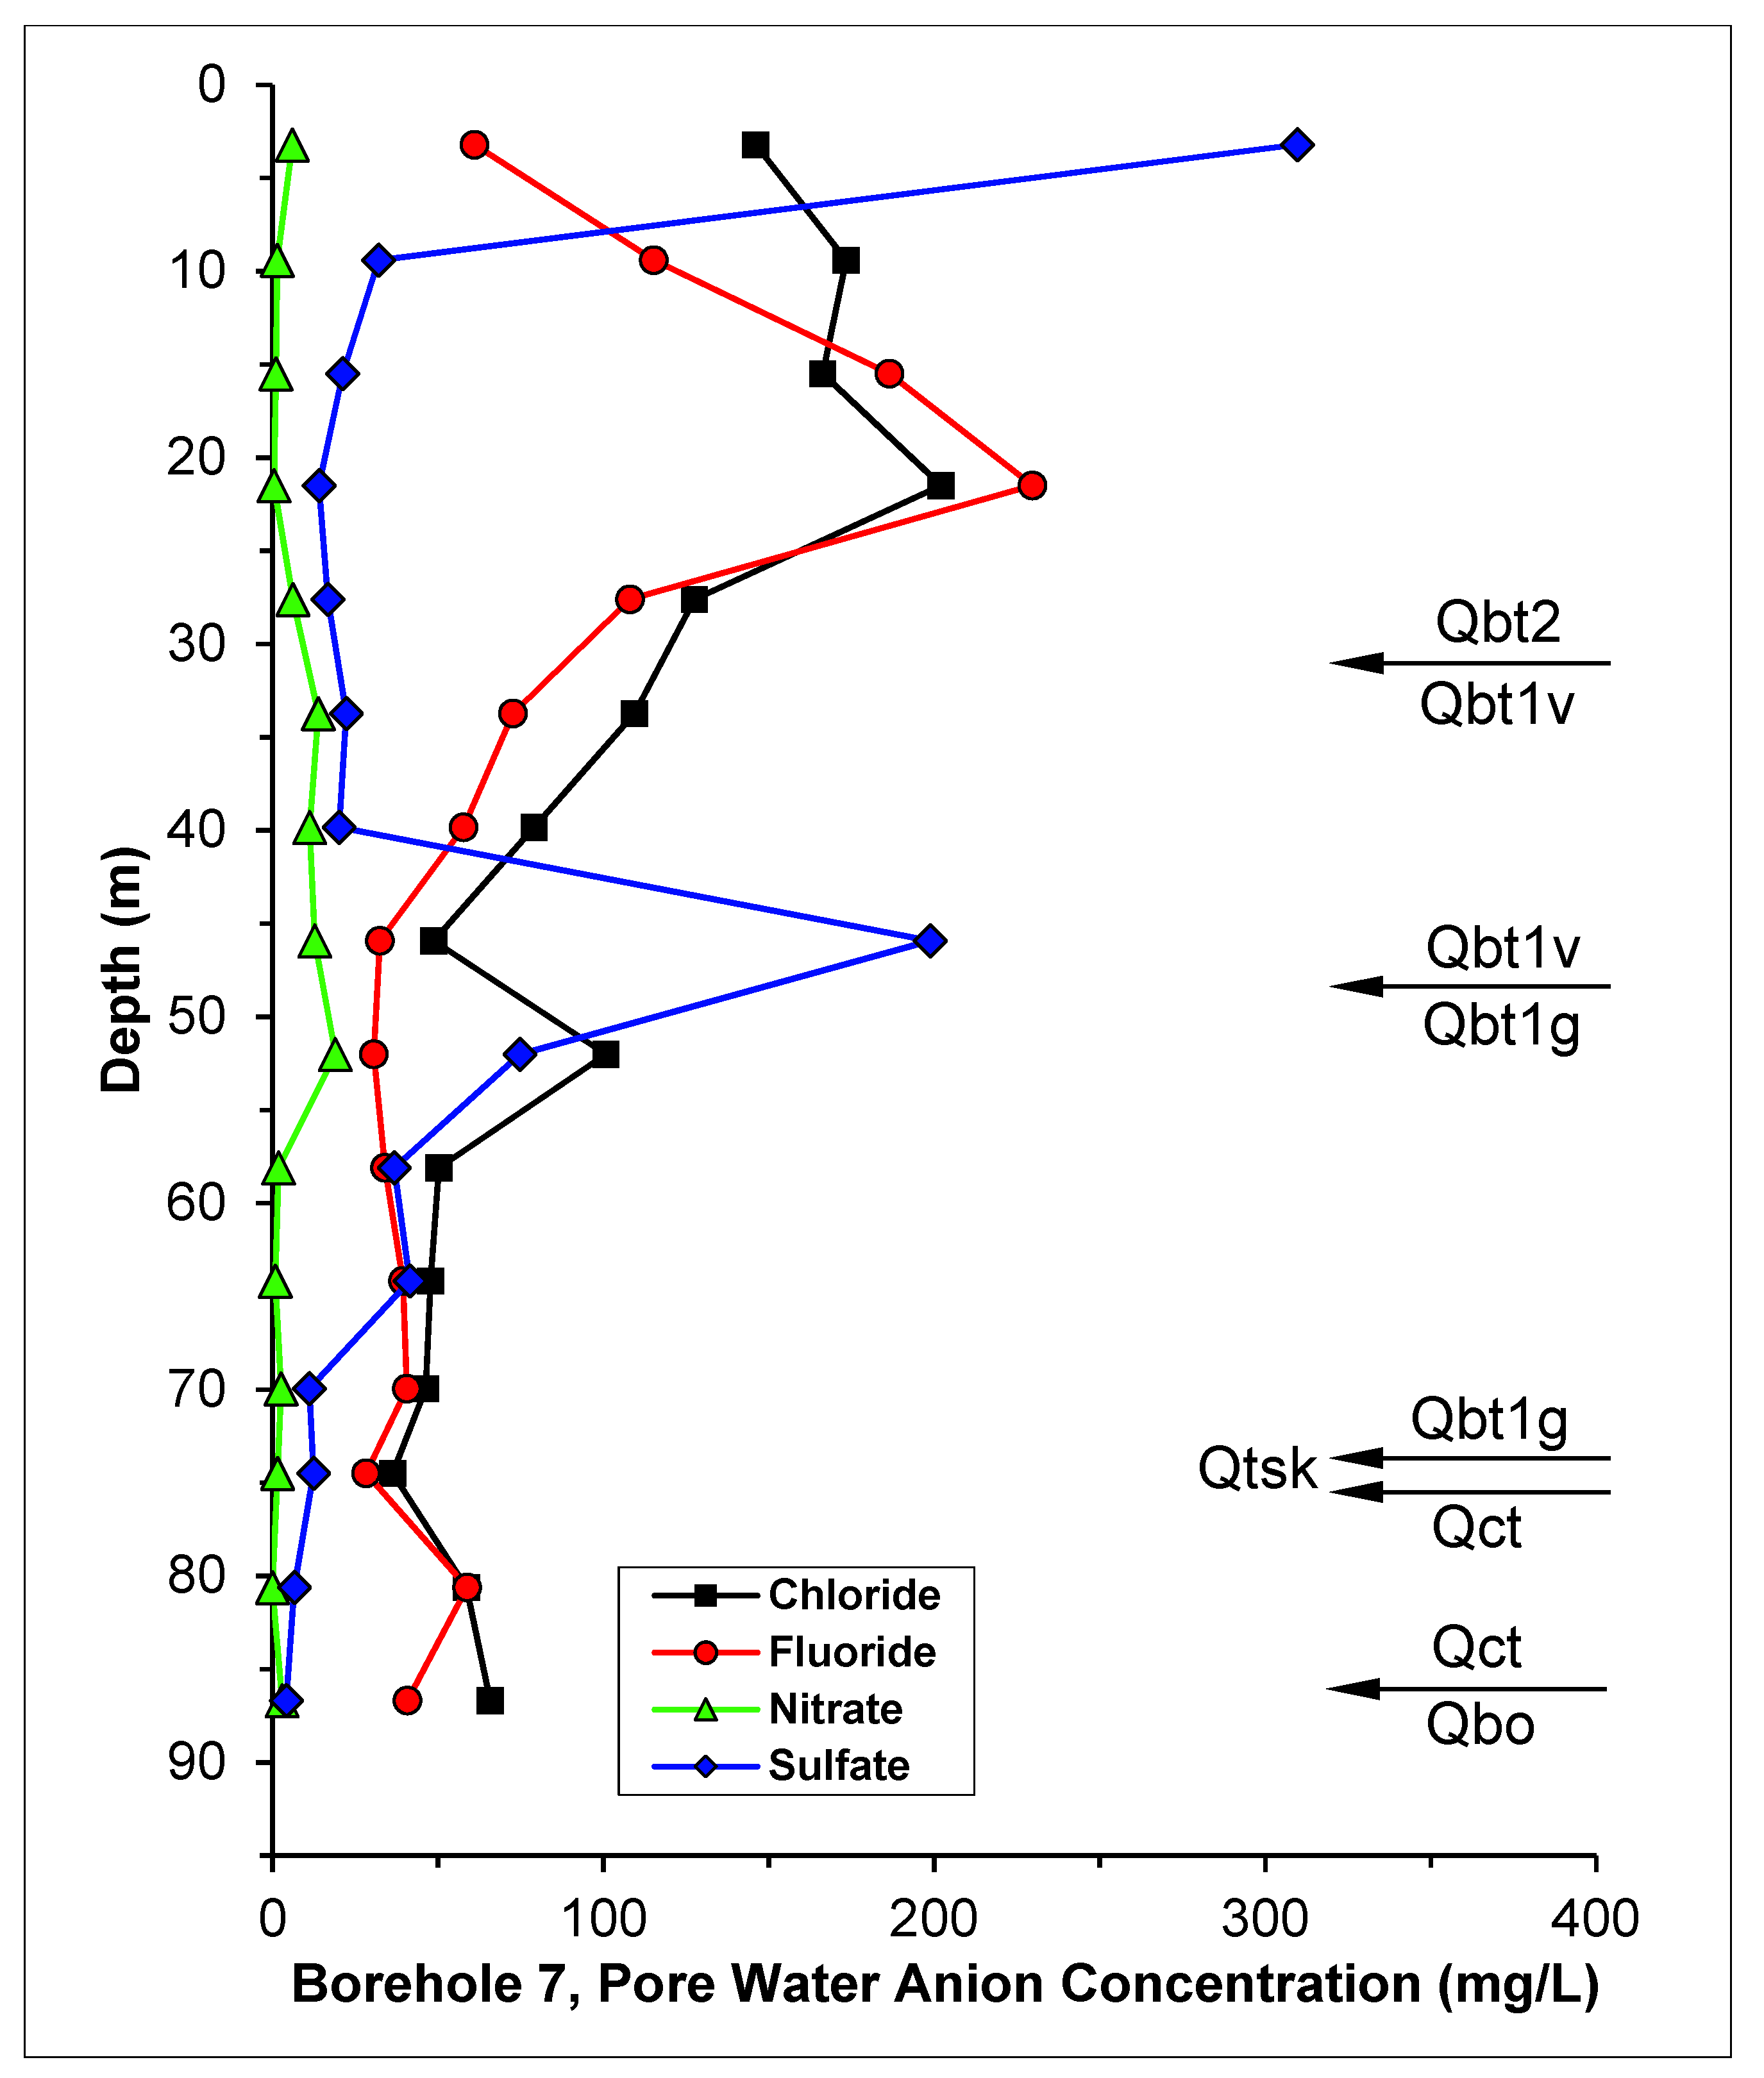
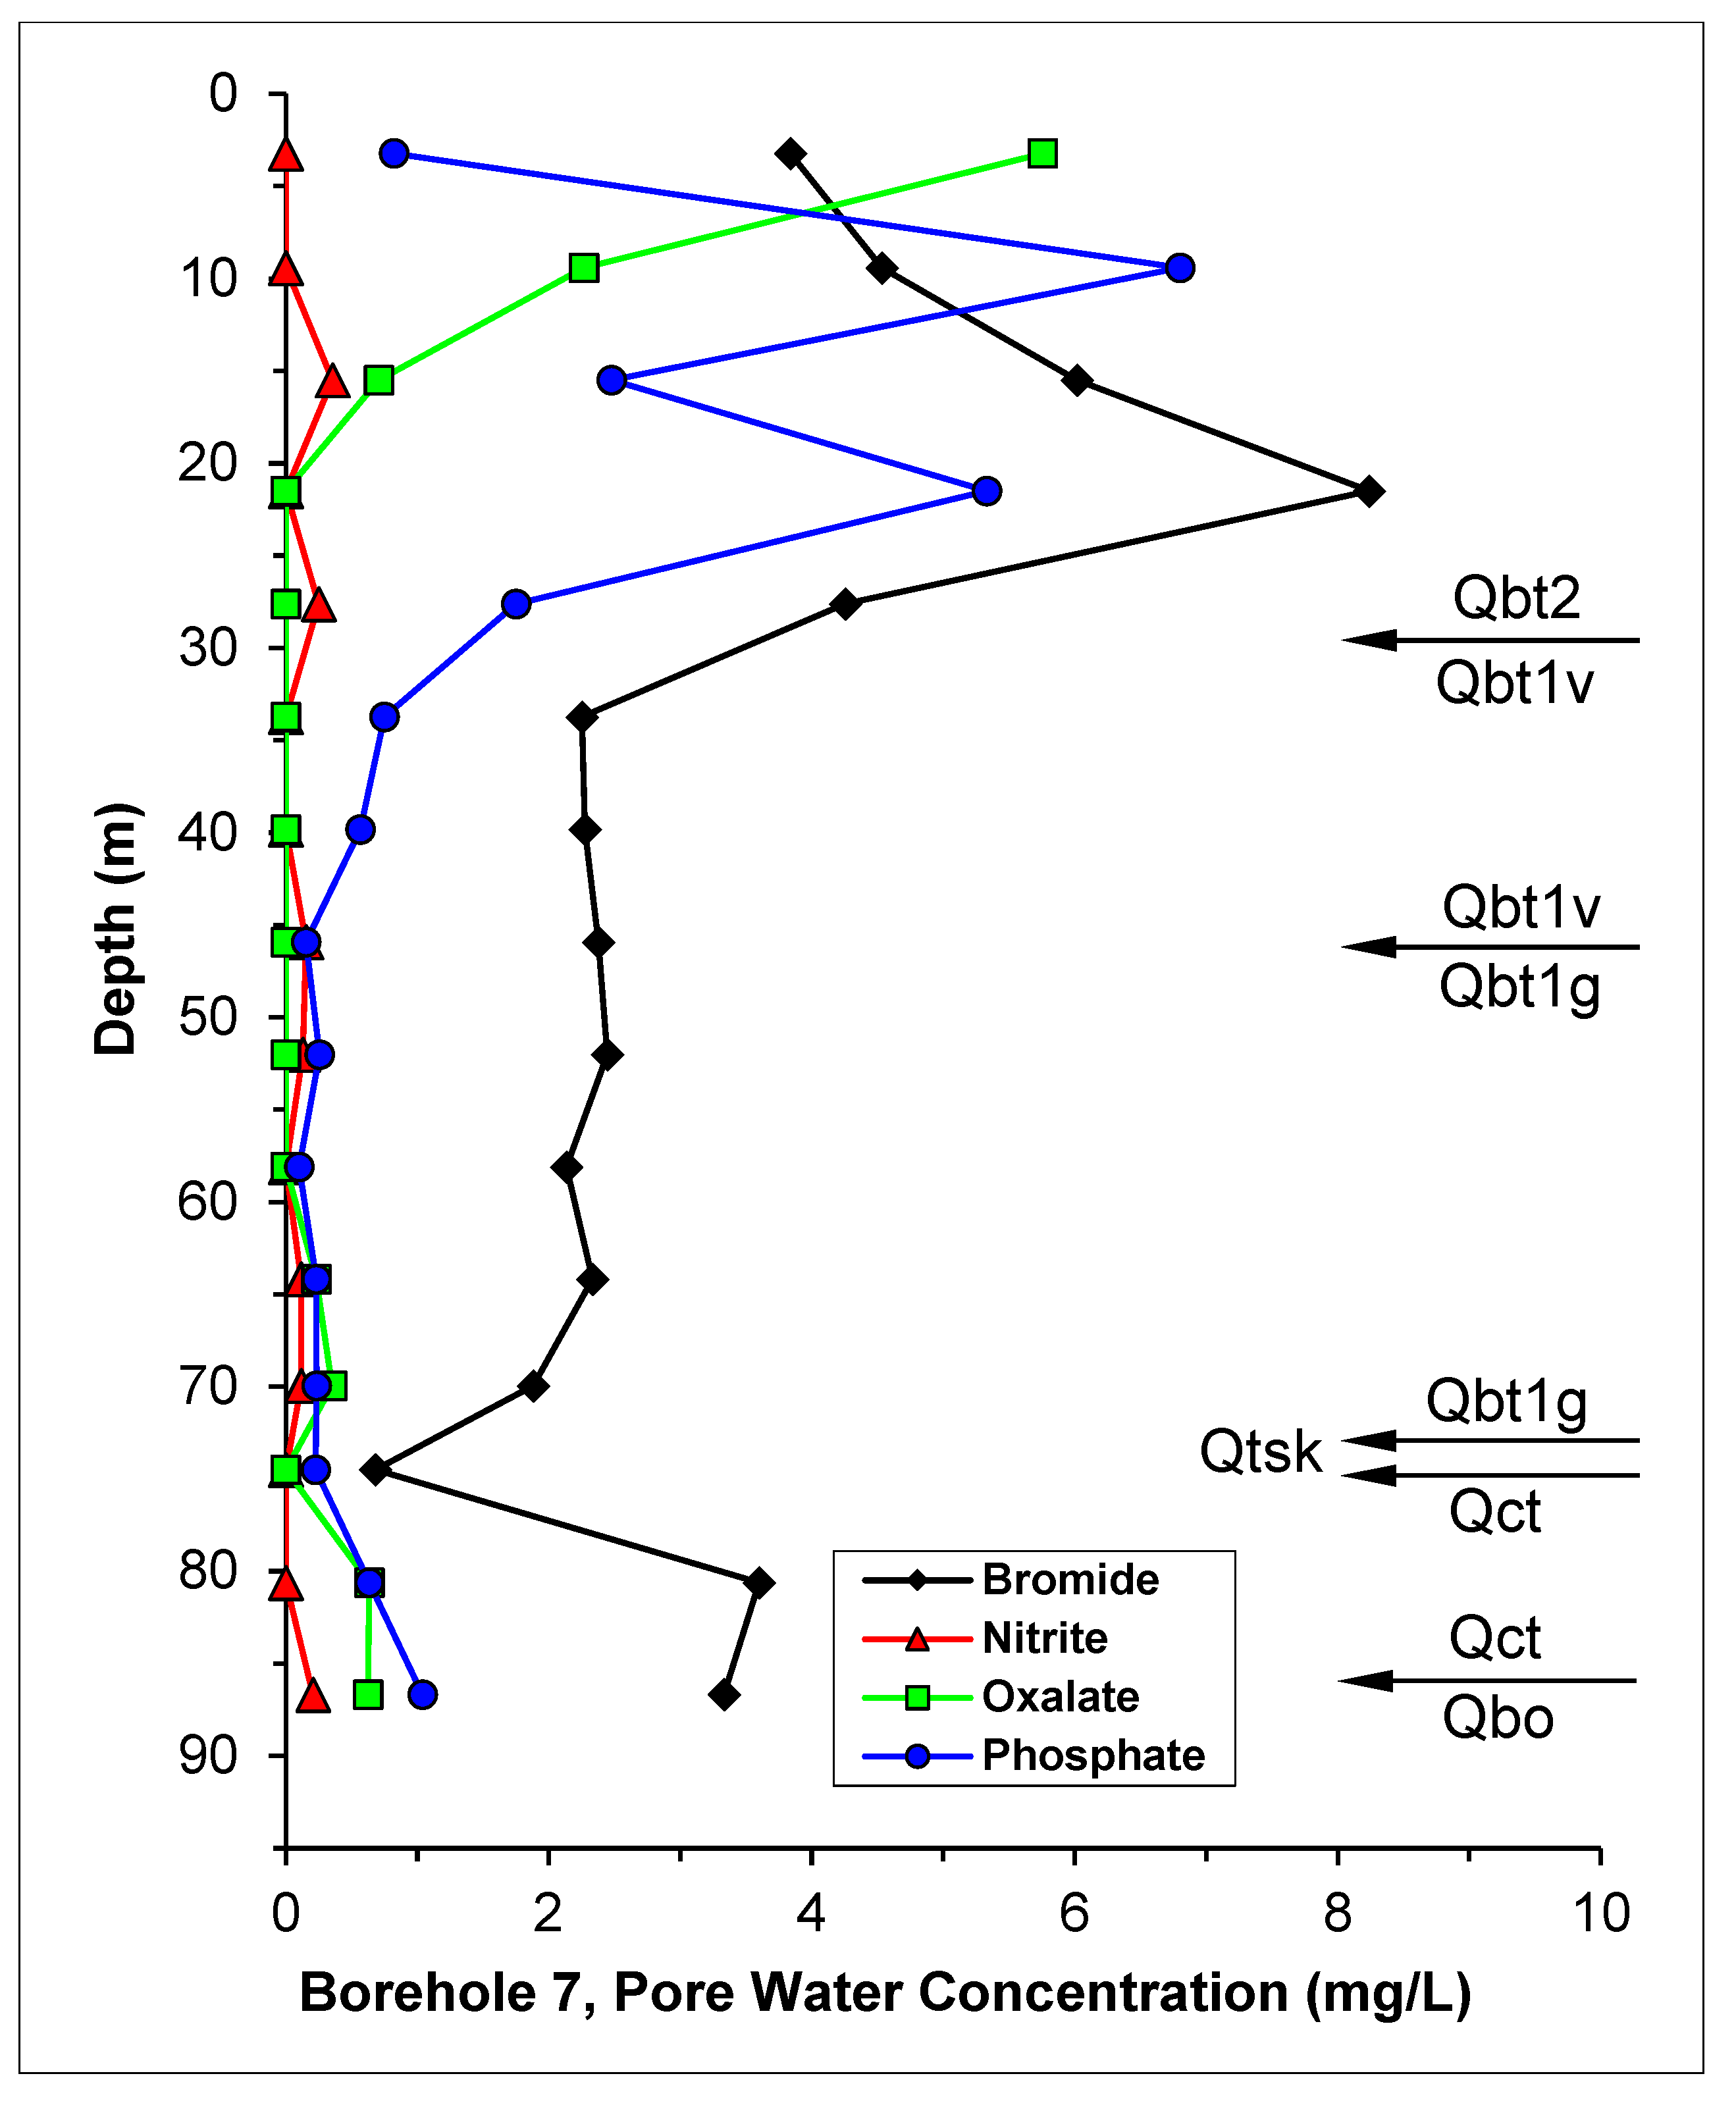
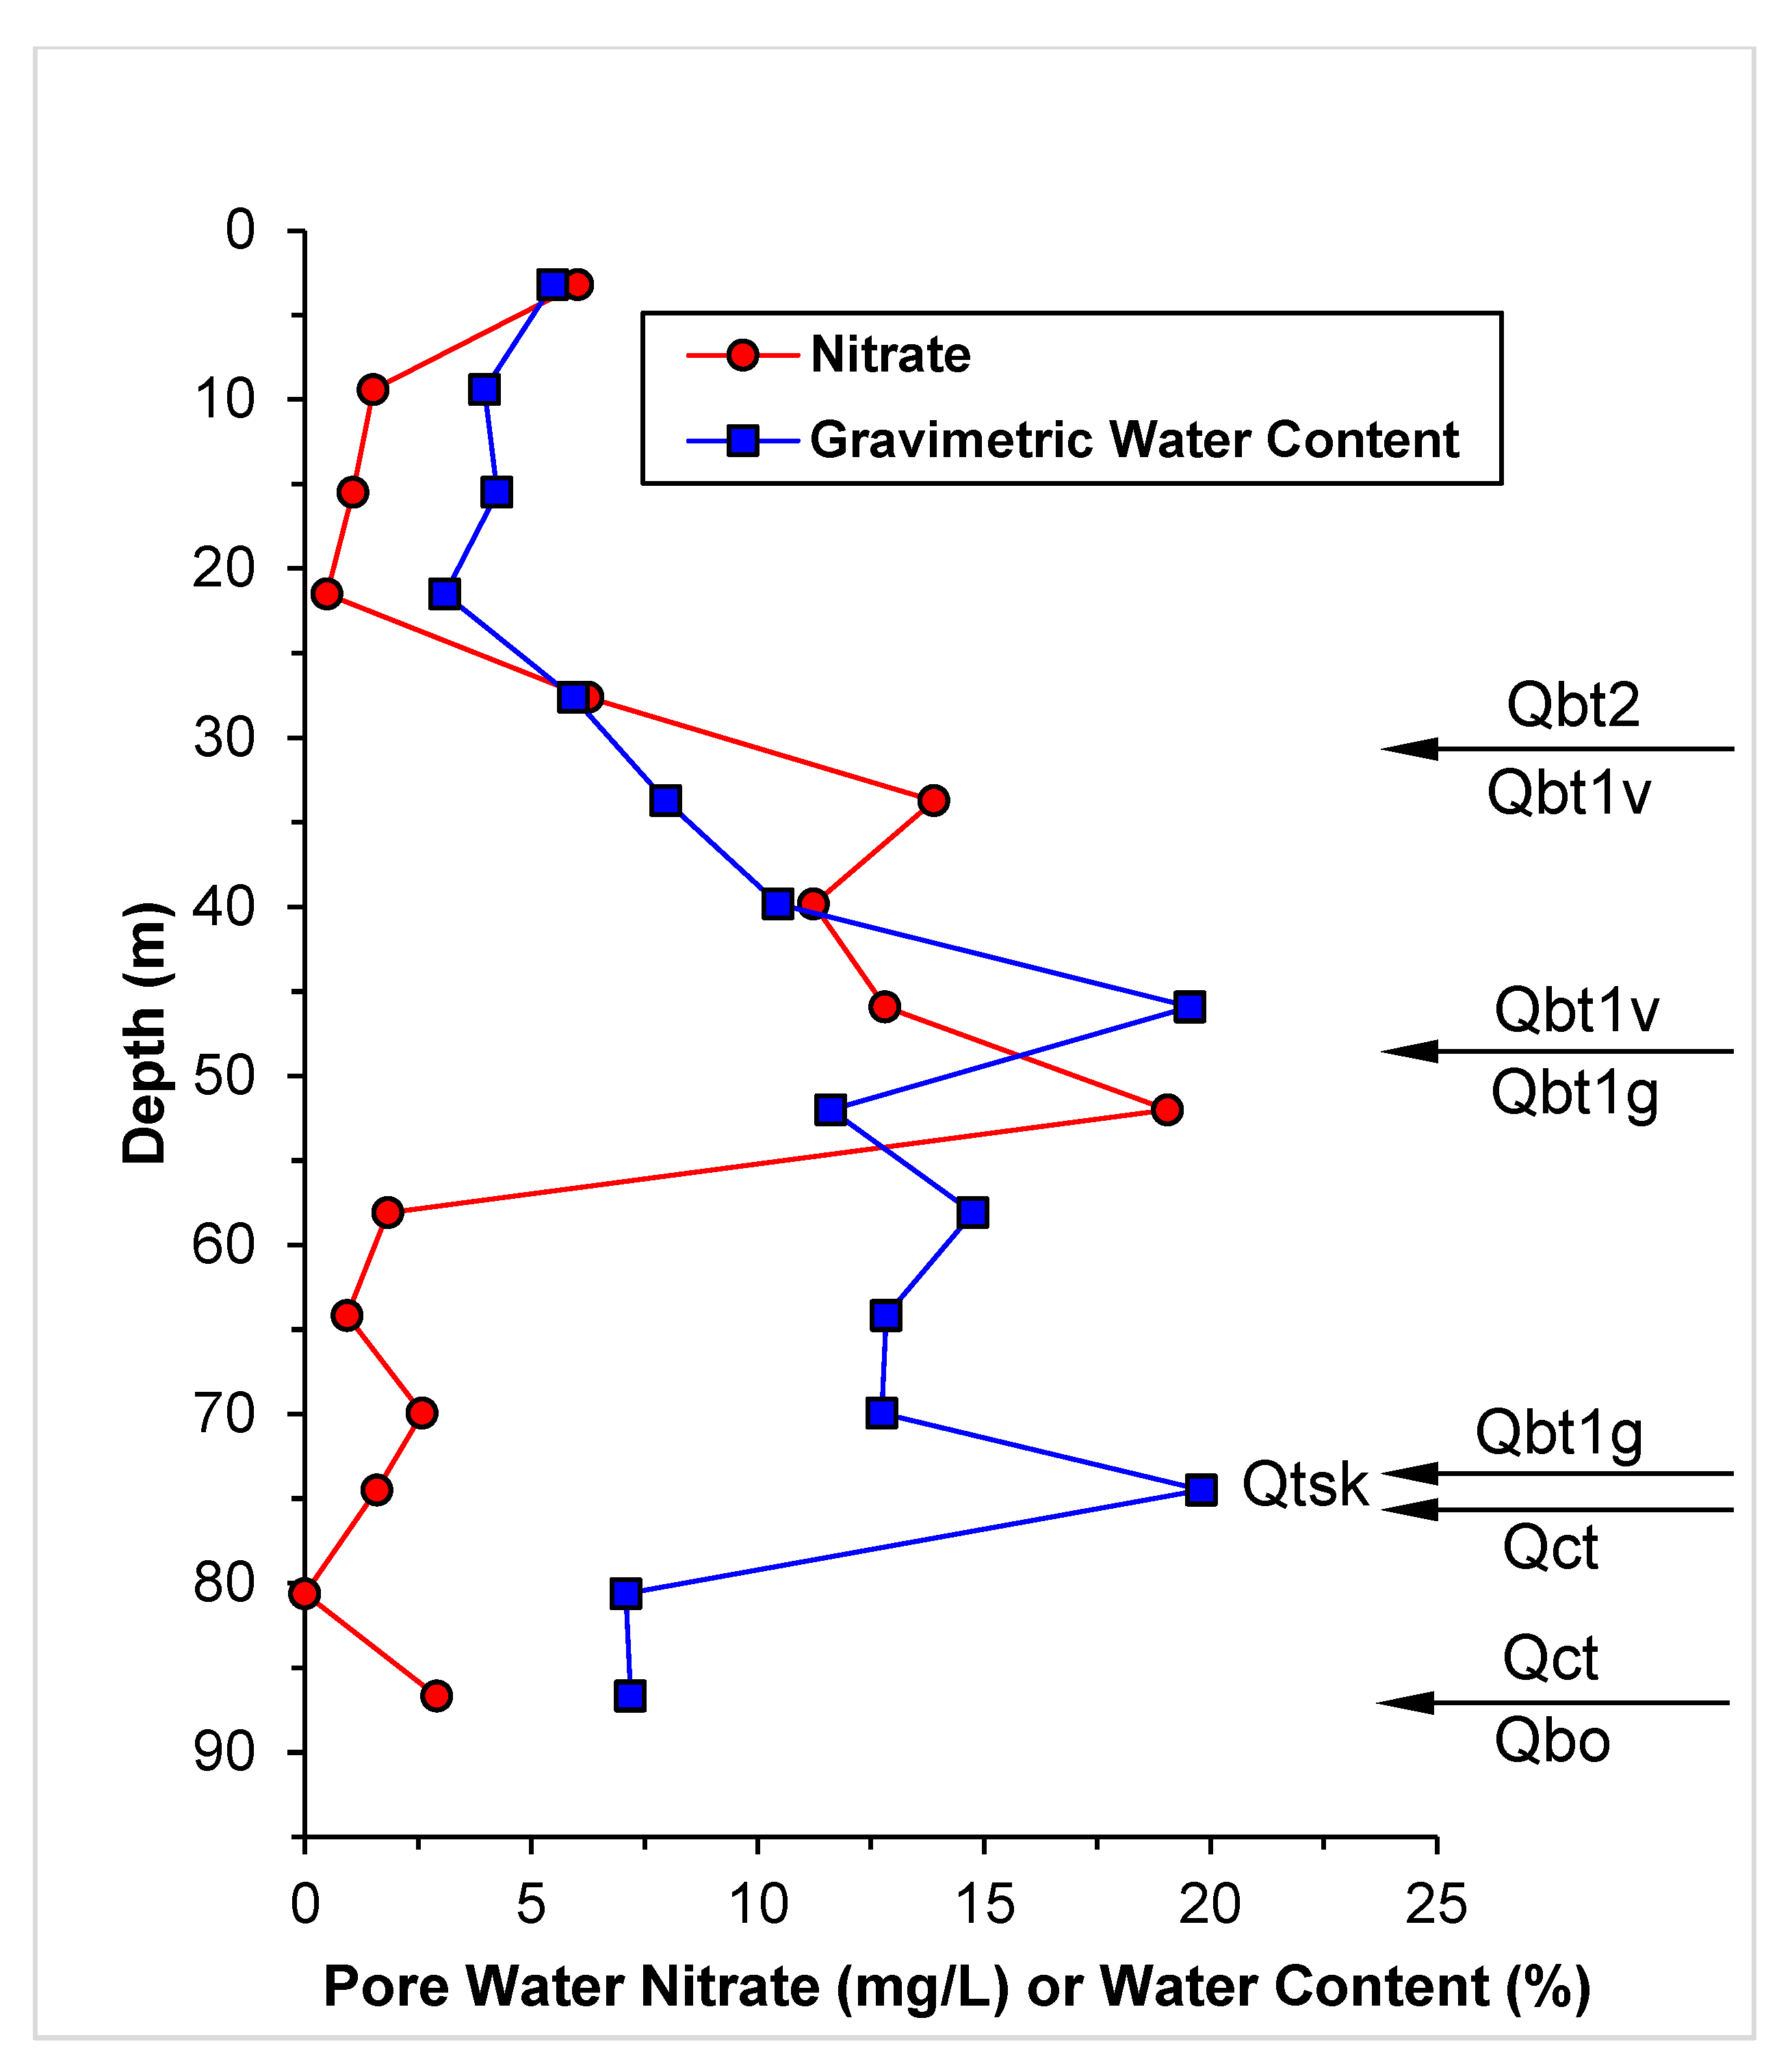
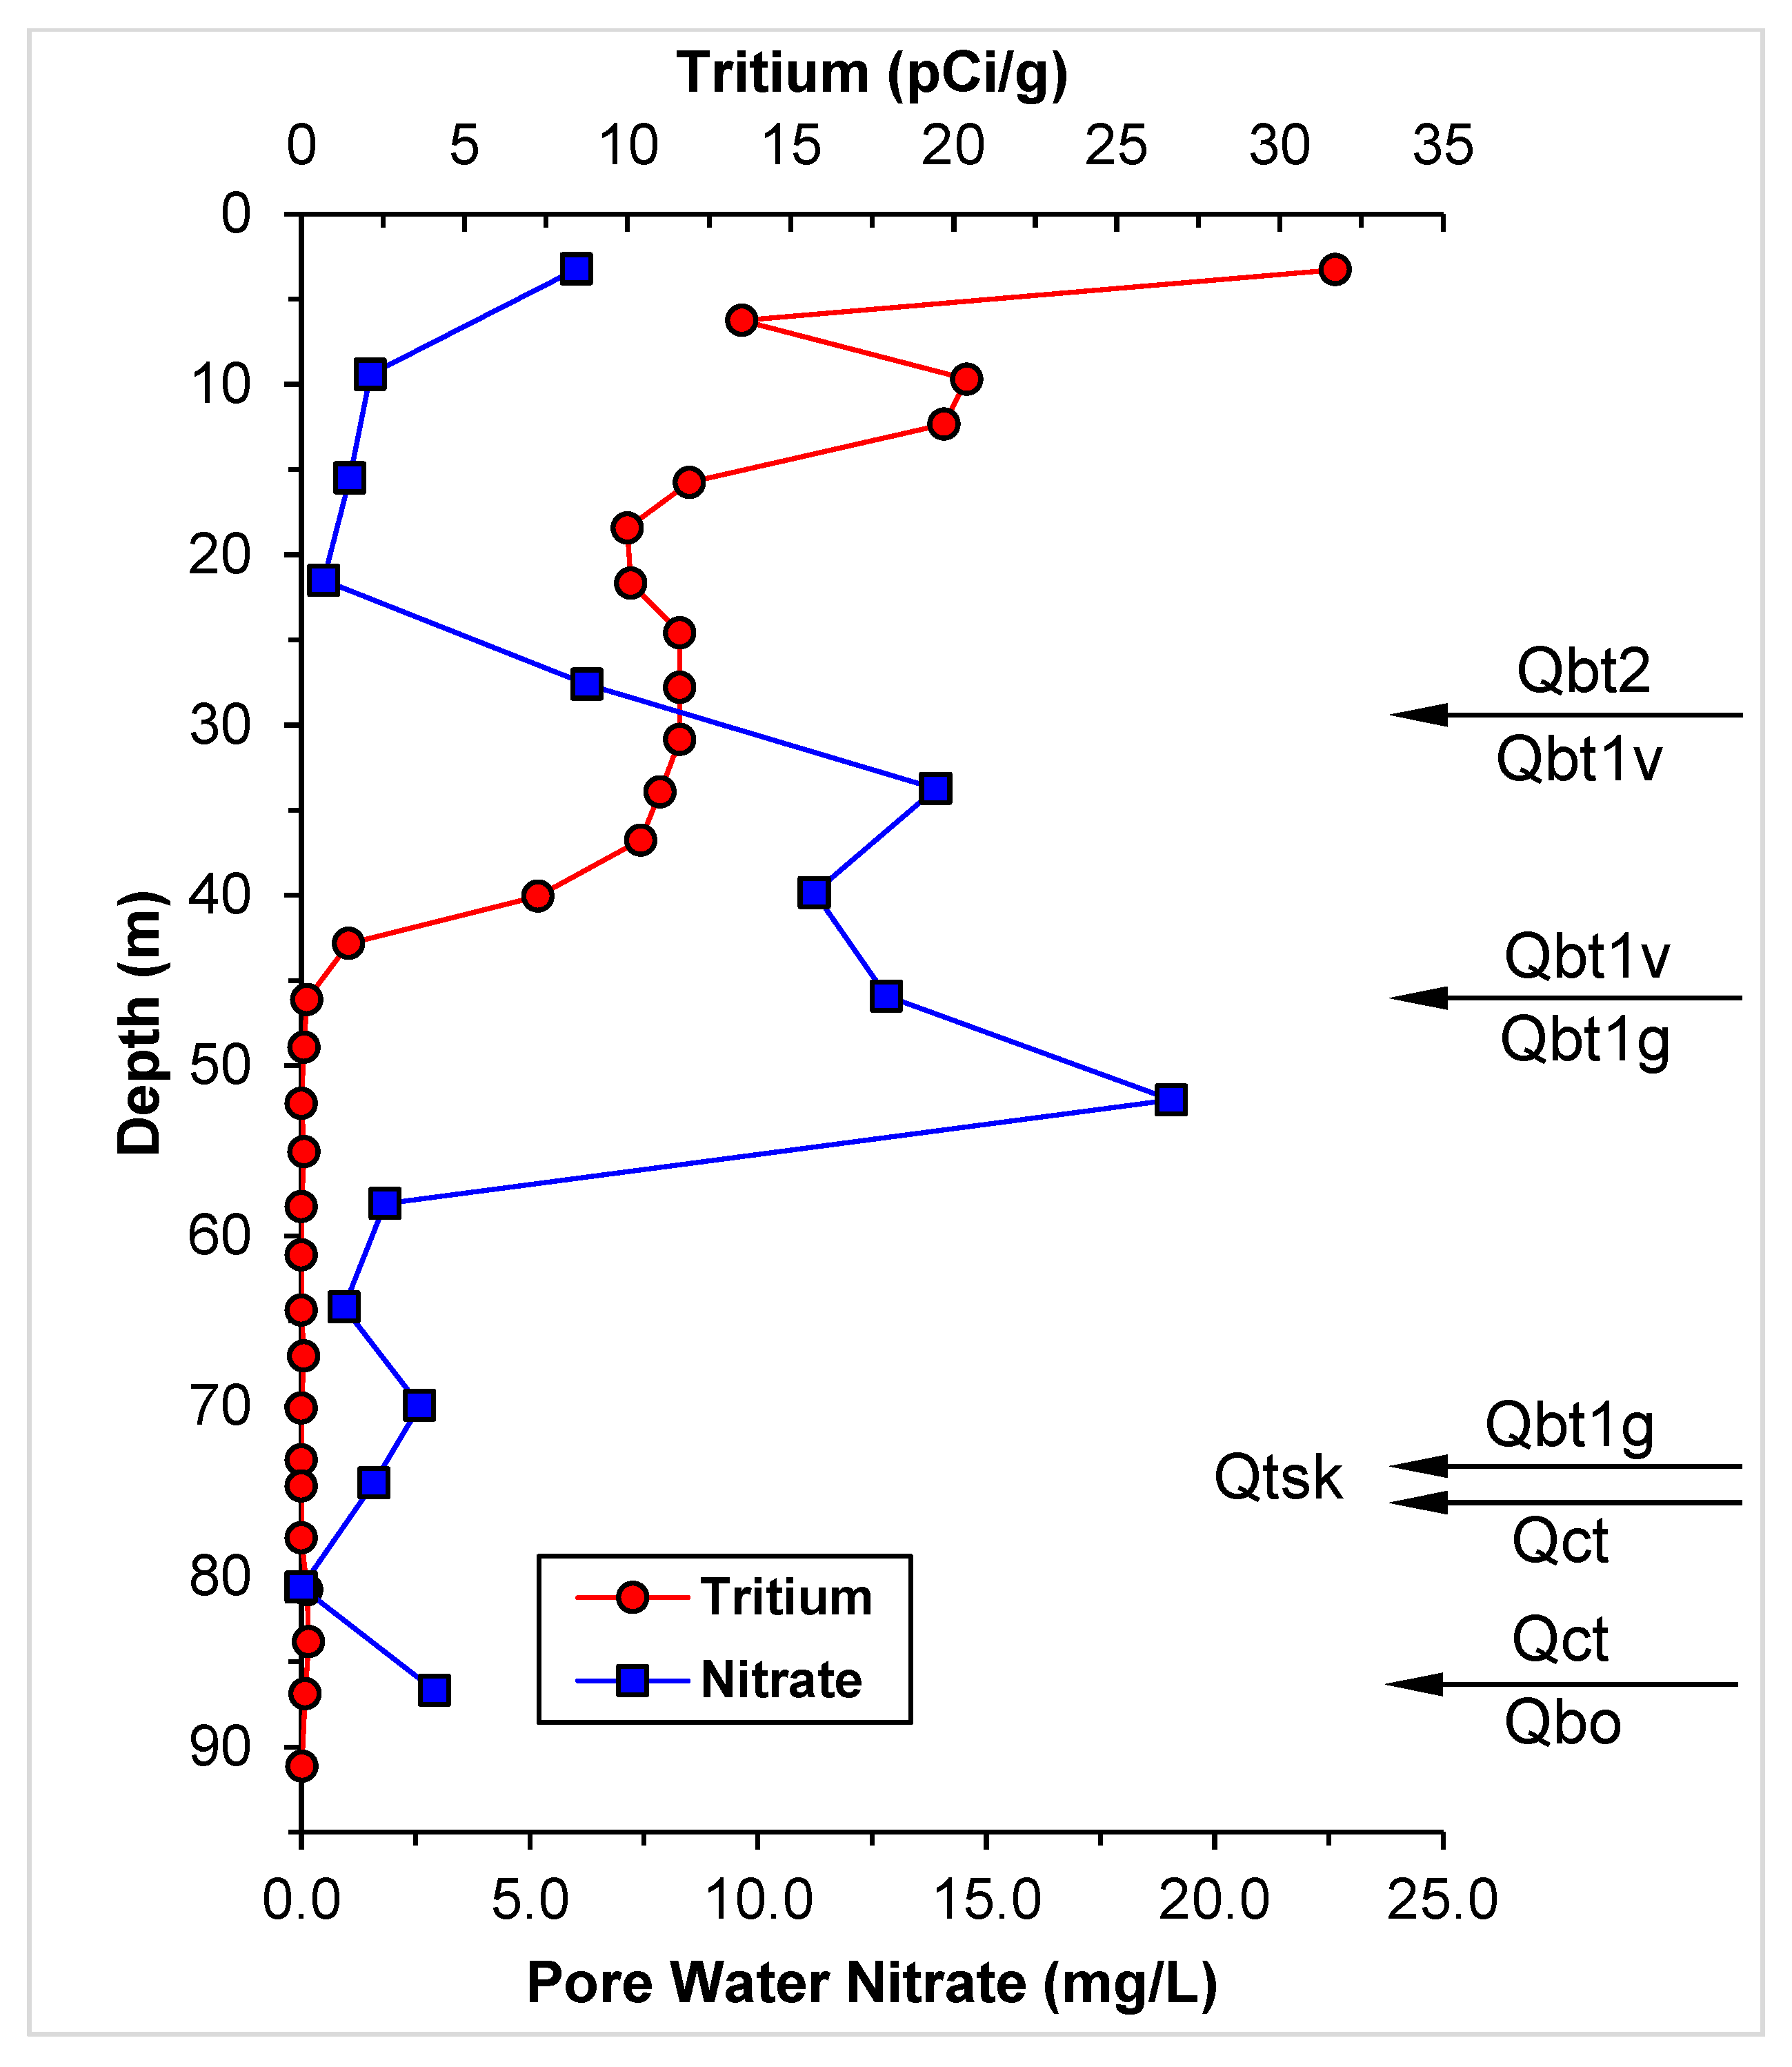
3.1.2. Anion Profiles from Borehole 7
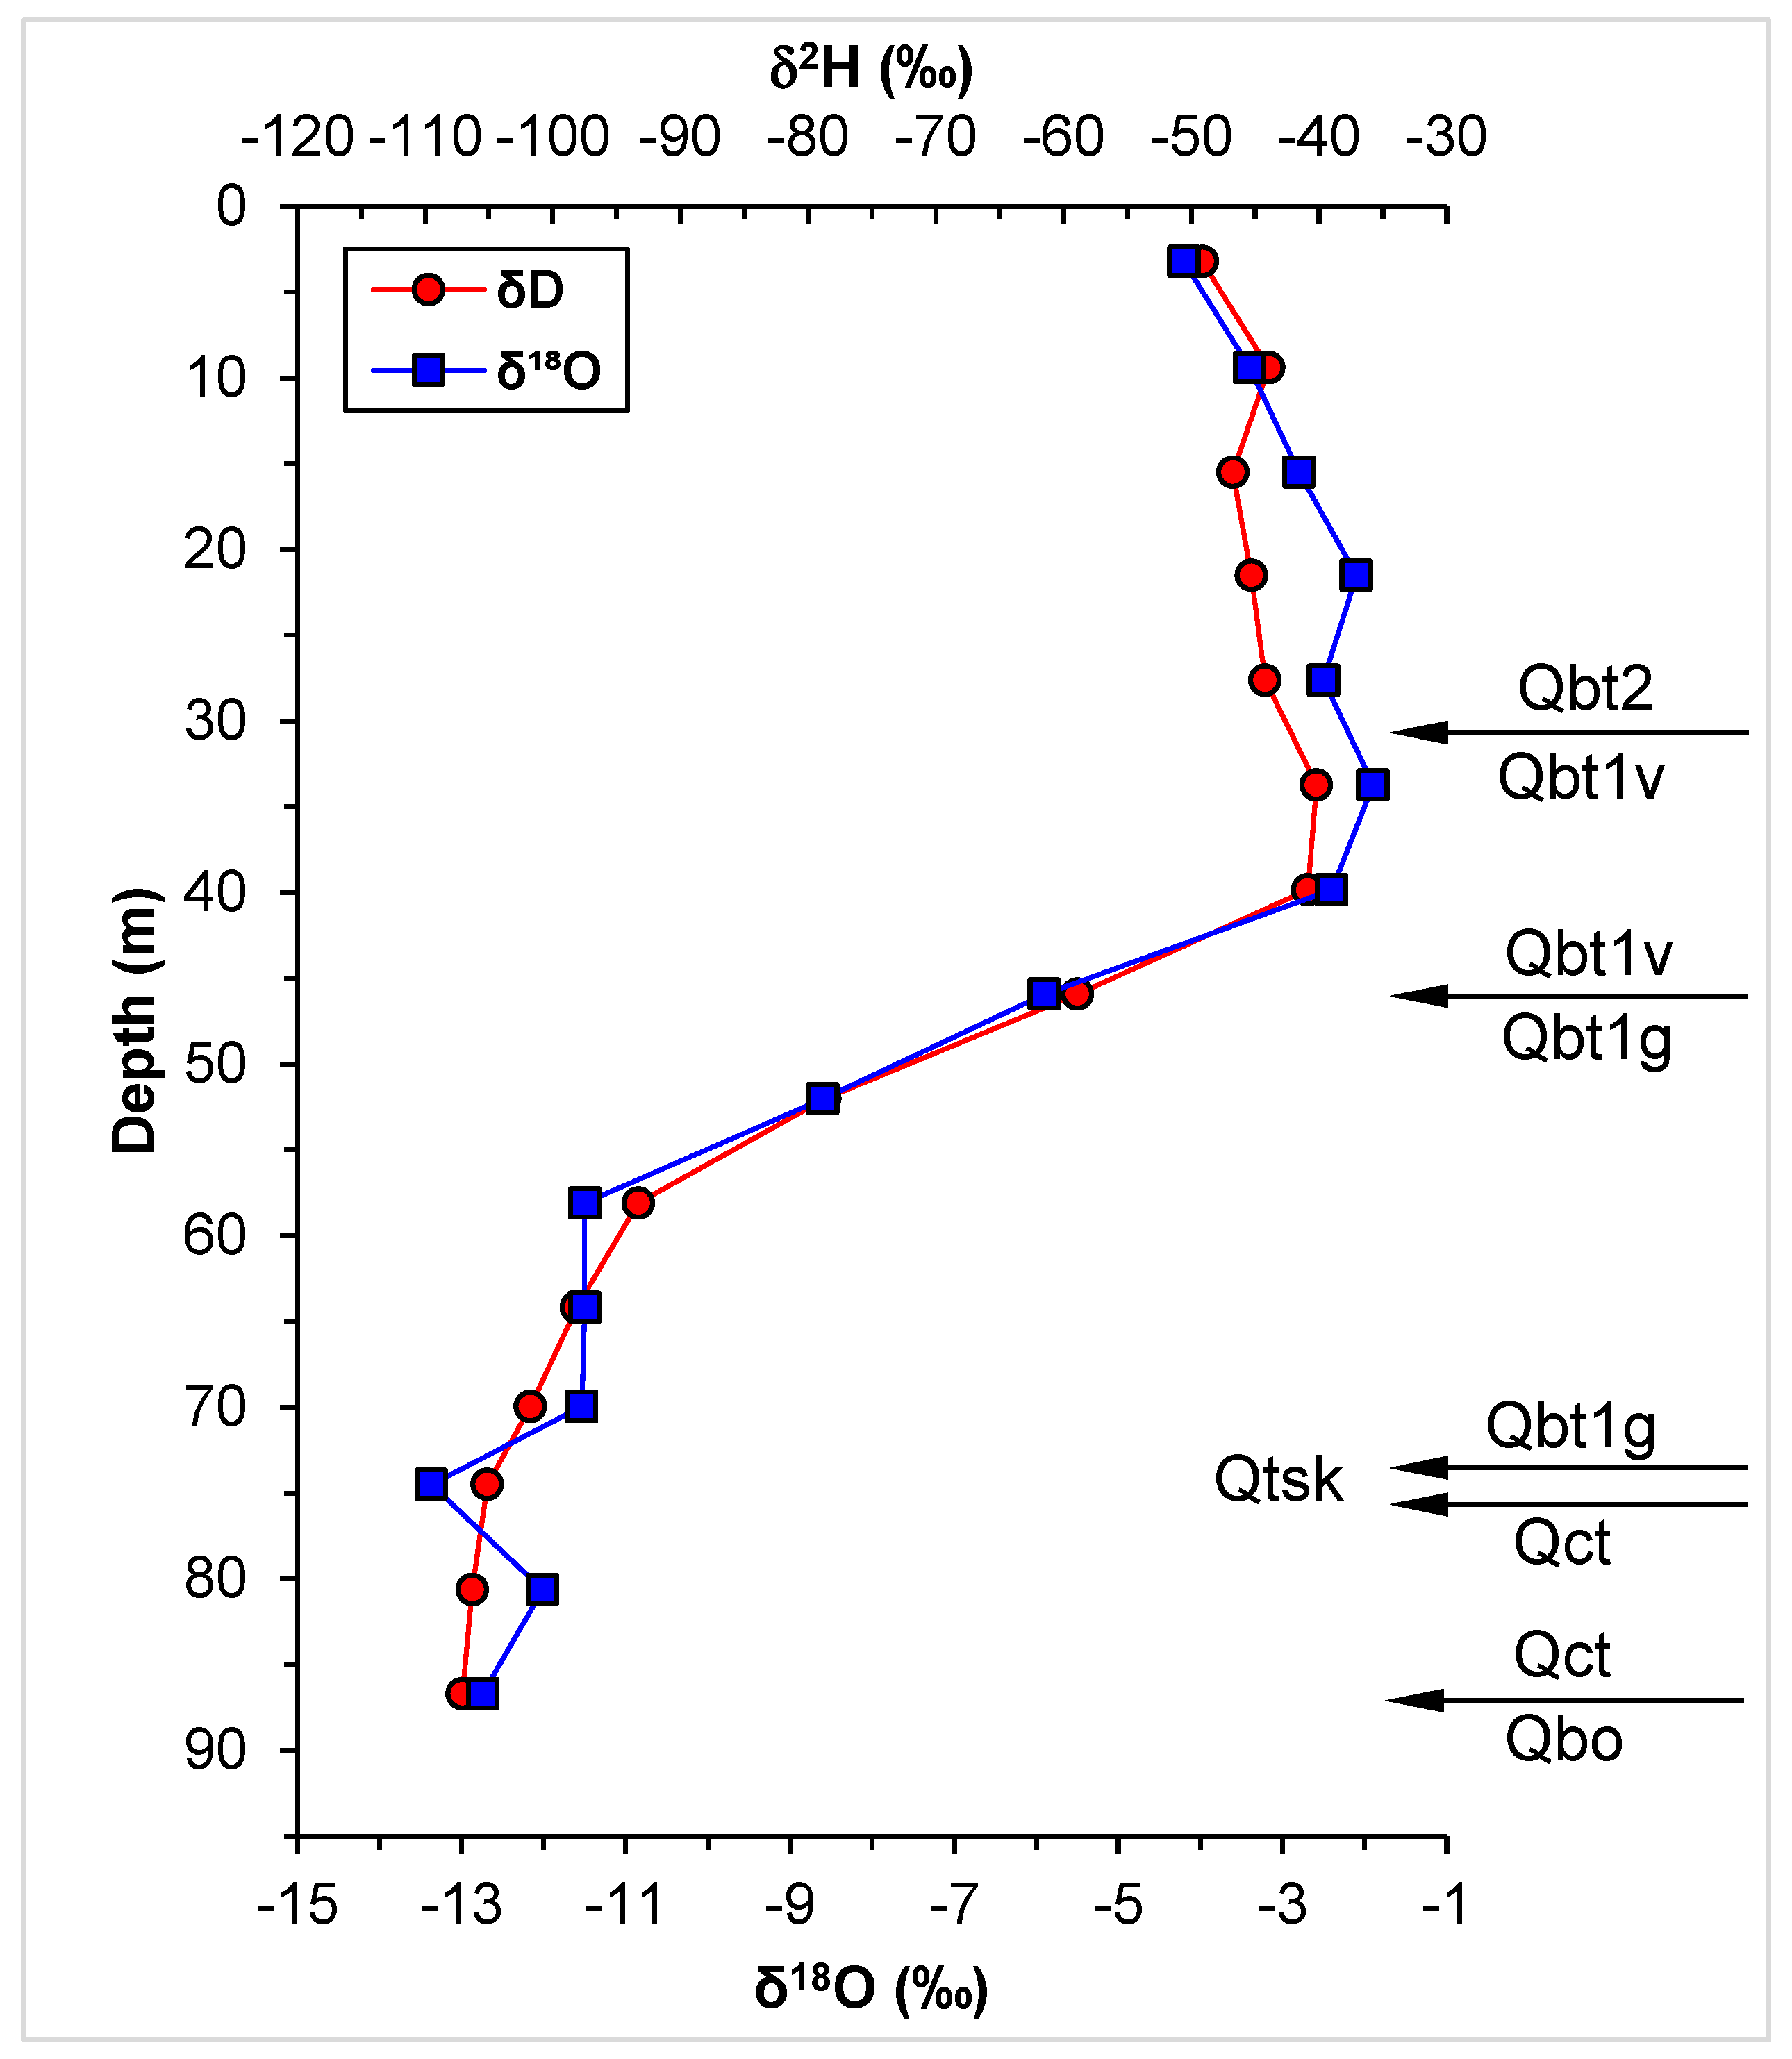
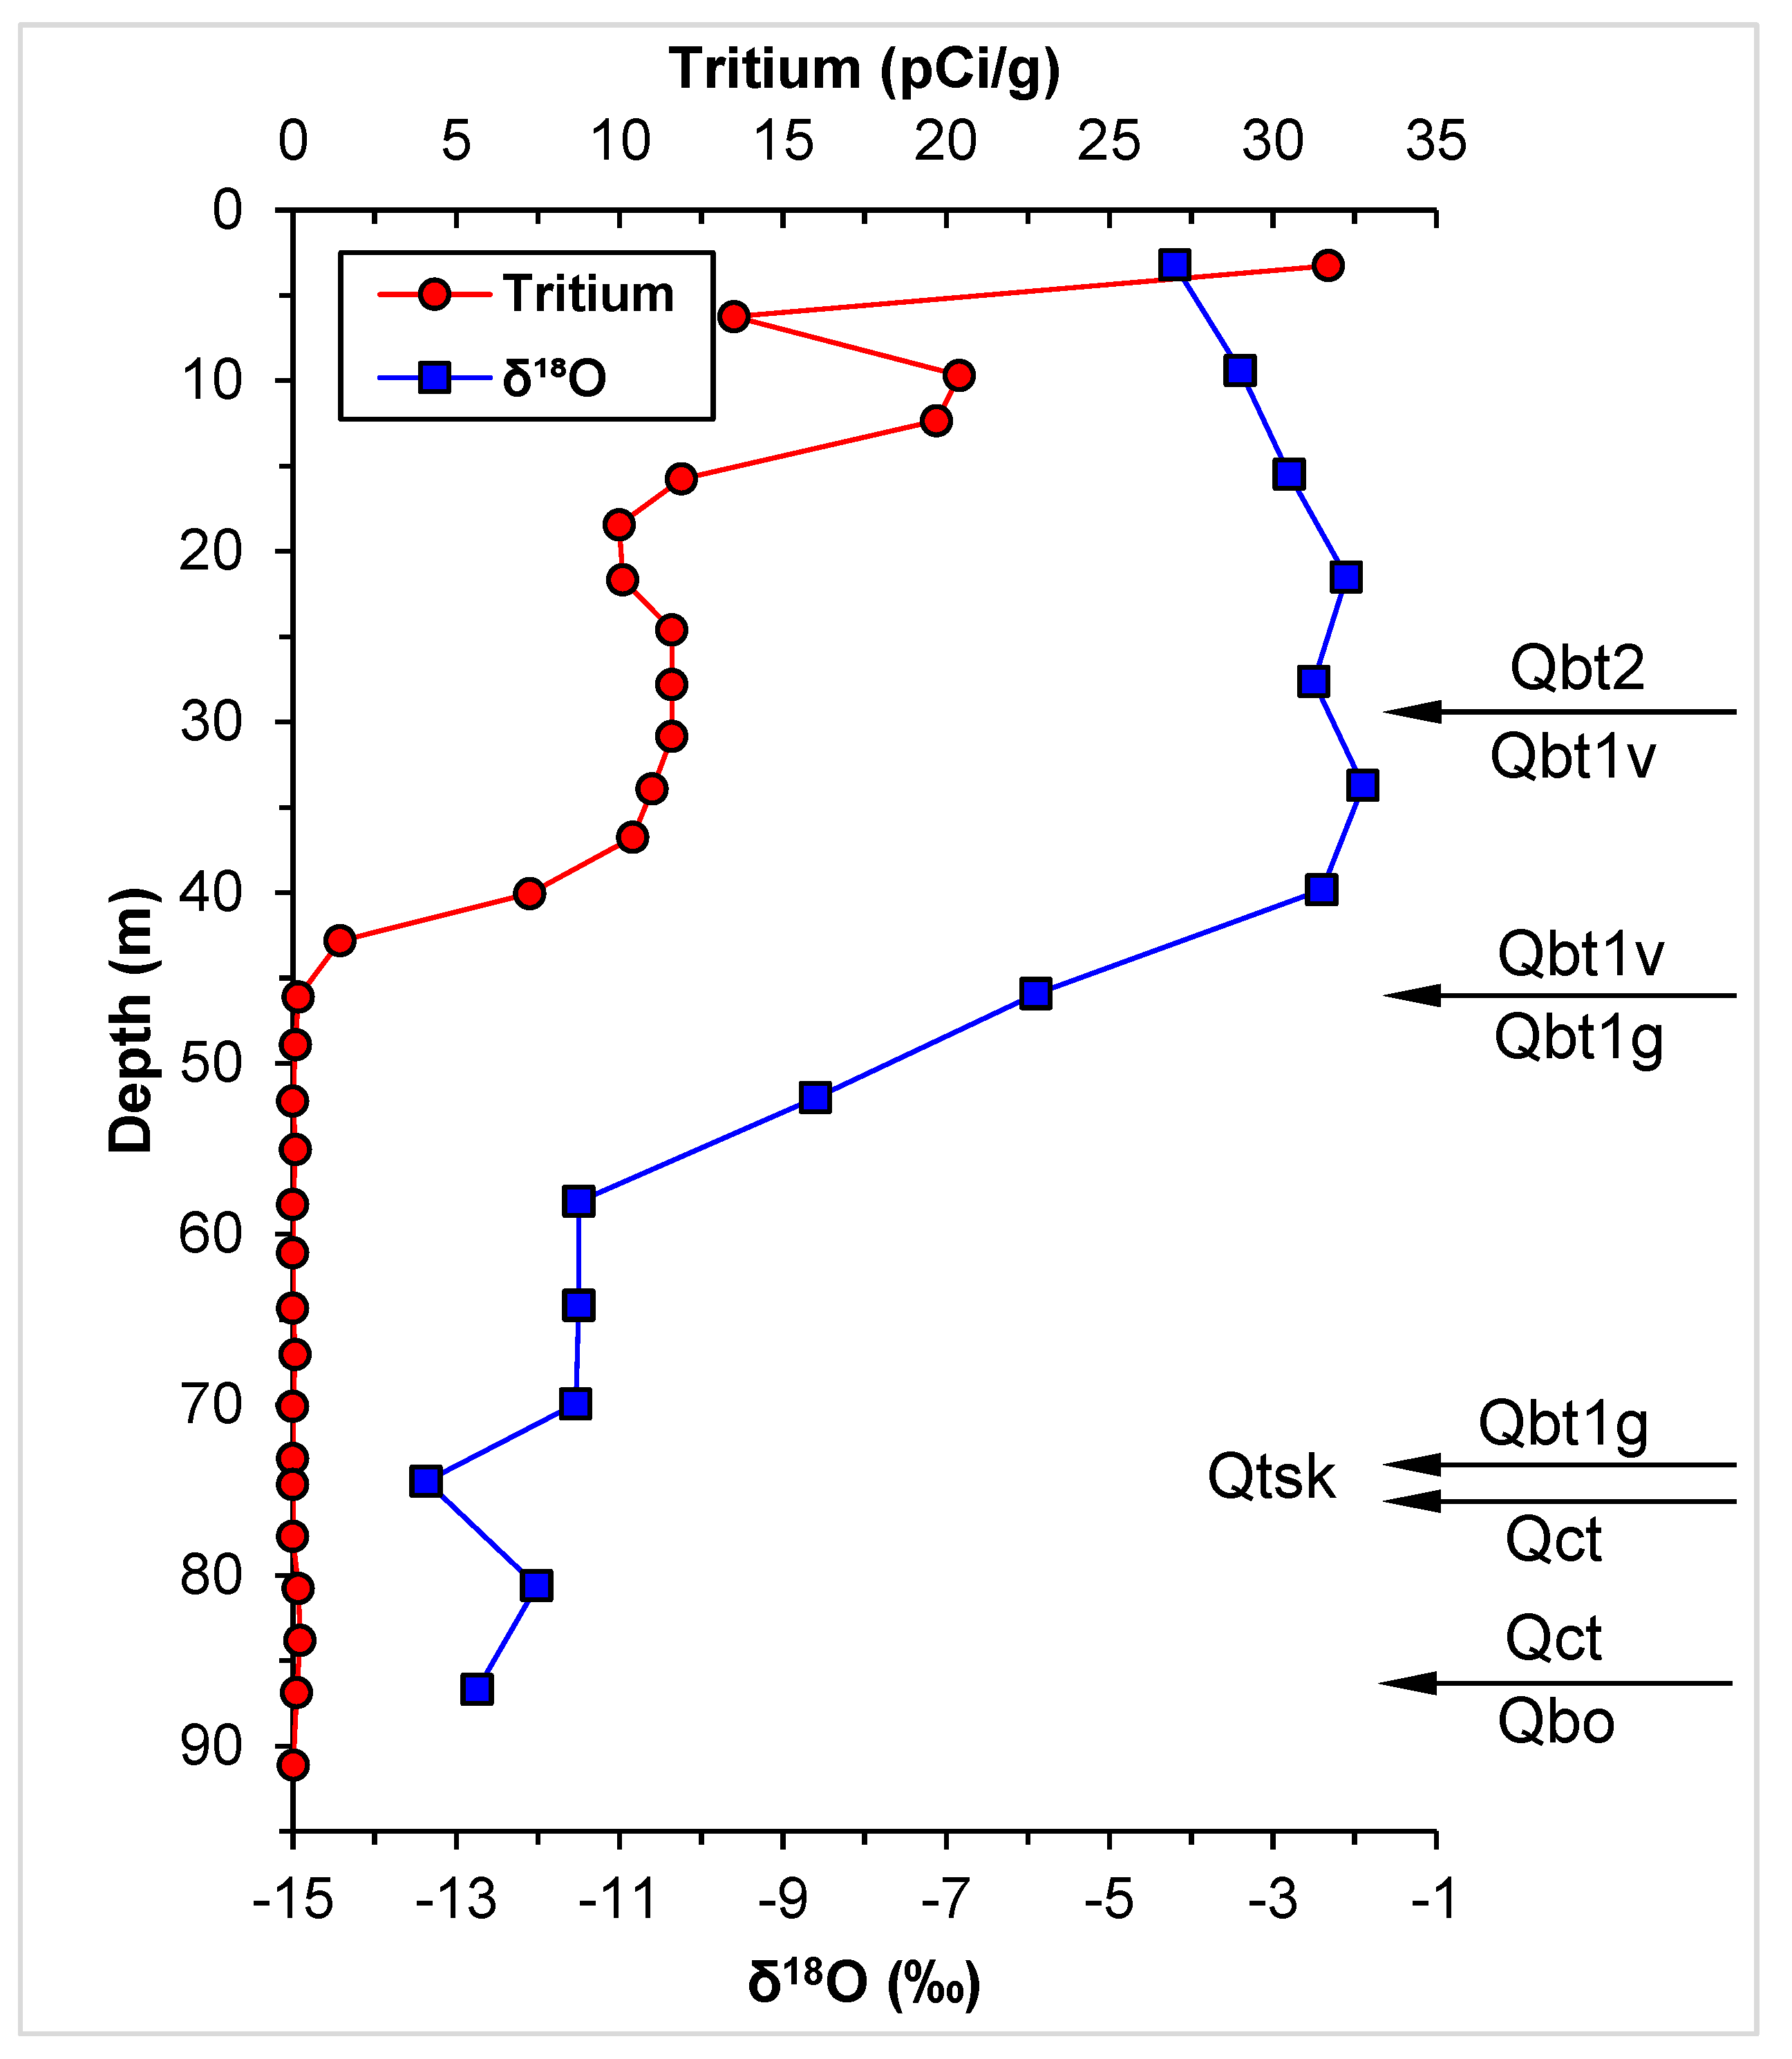
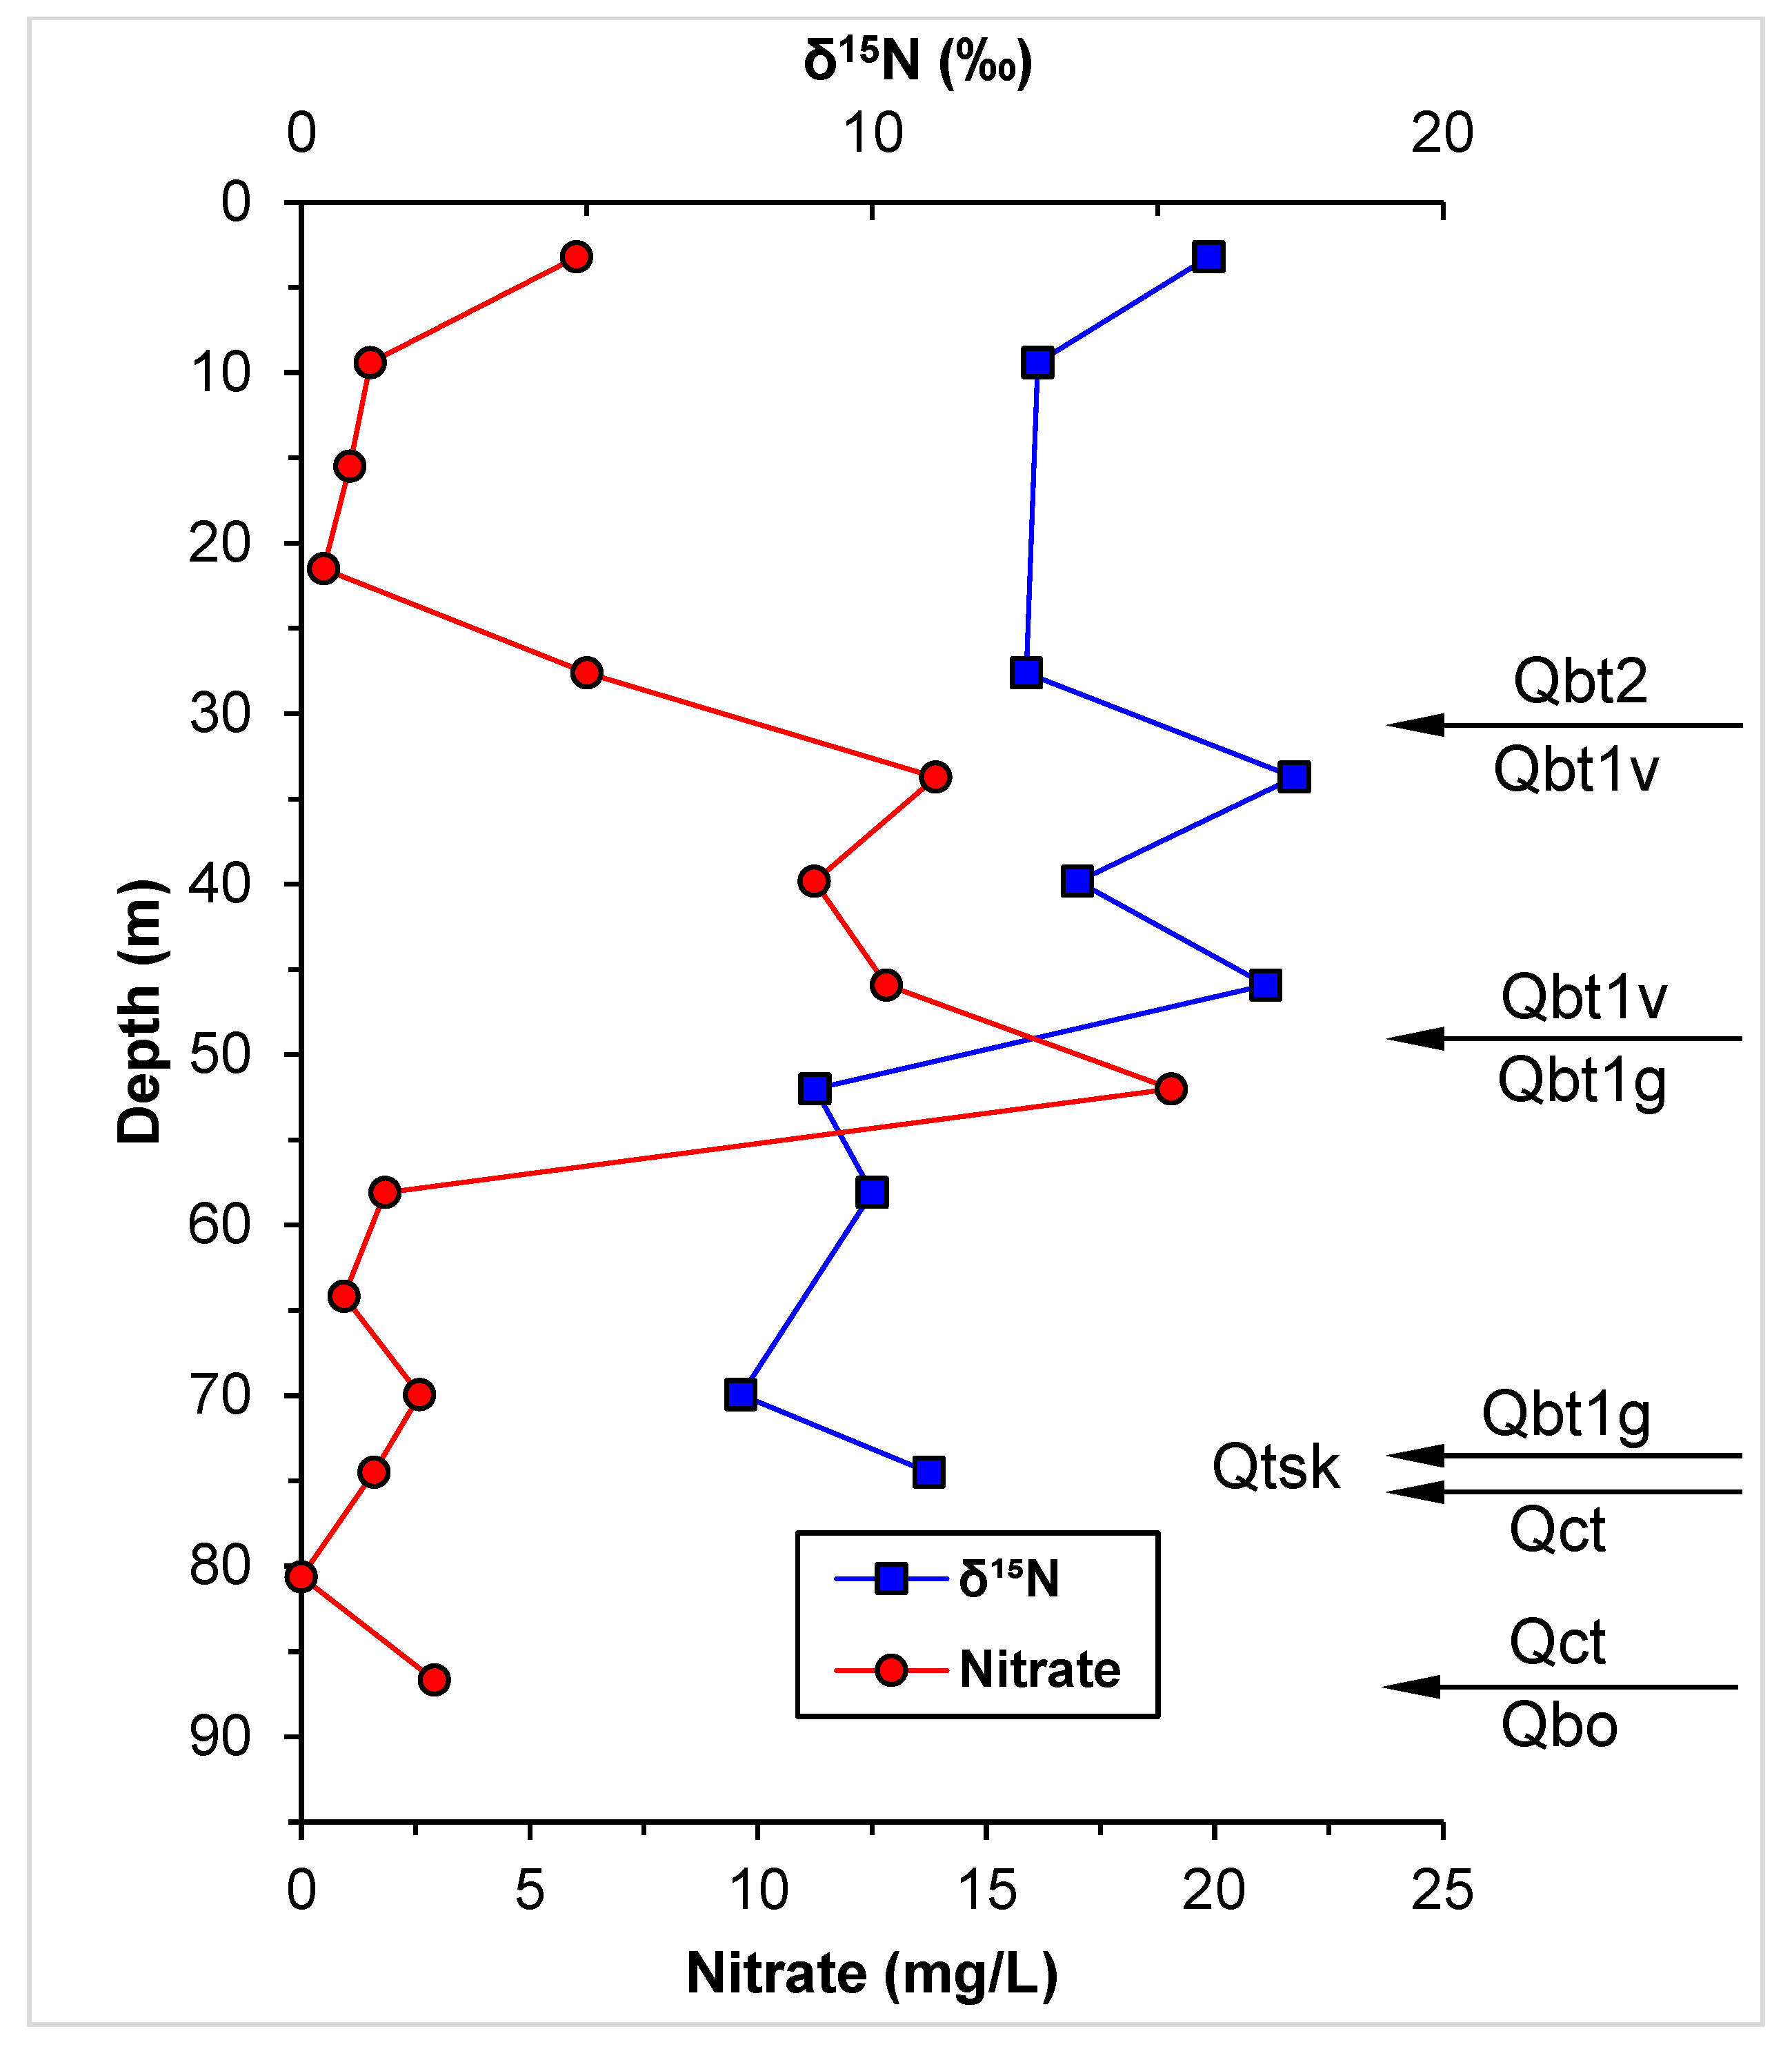
3.1.3. Stable Isotope Profiles from Borehole 7
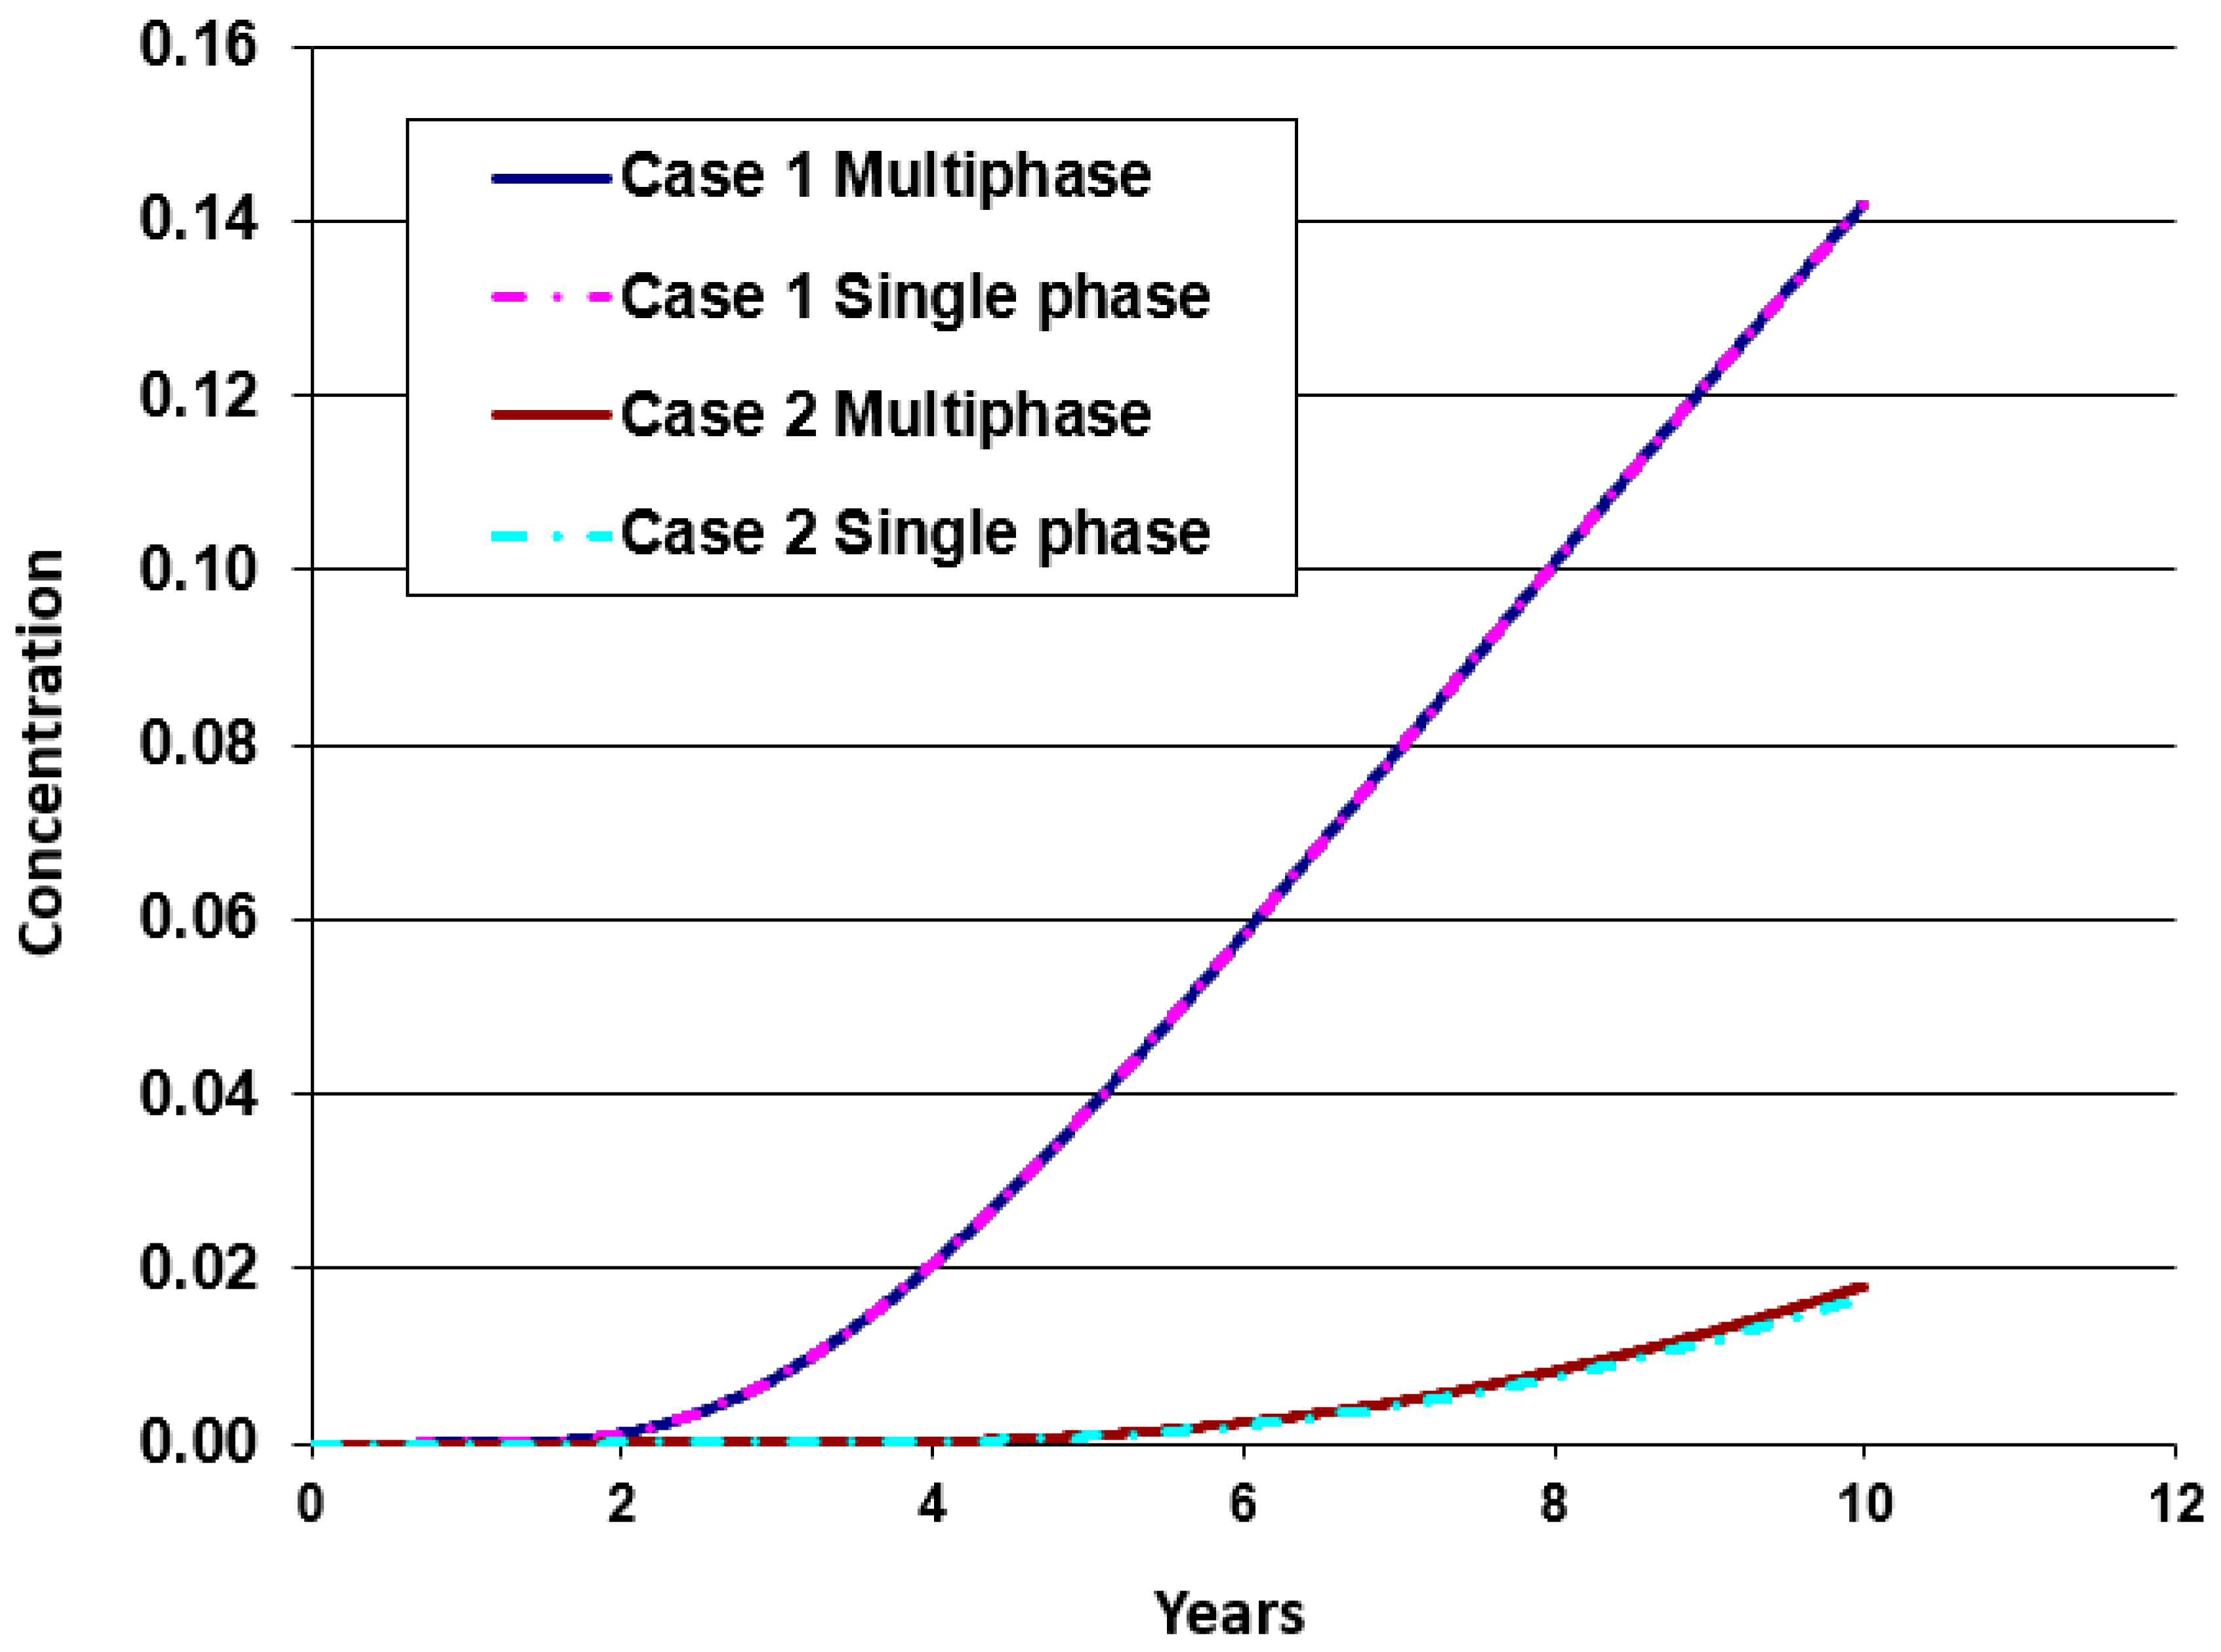
3.2. Bounding Case Simulation Results
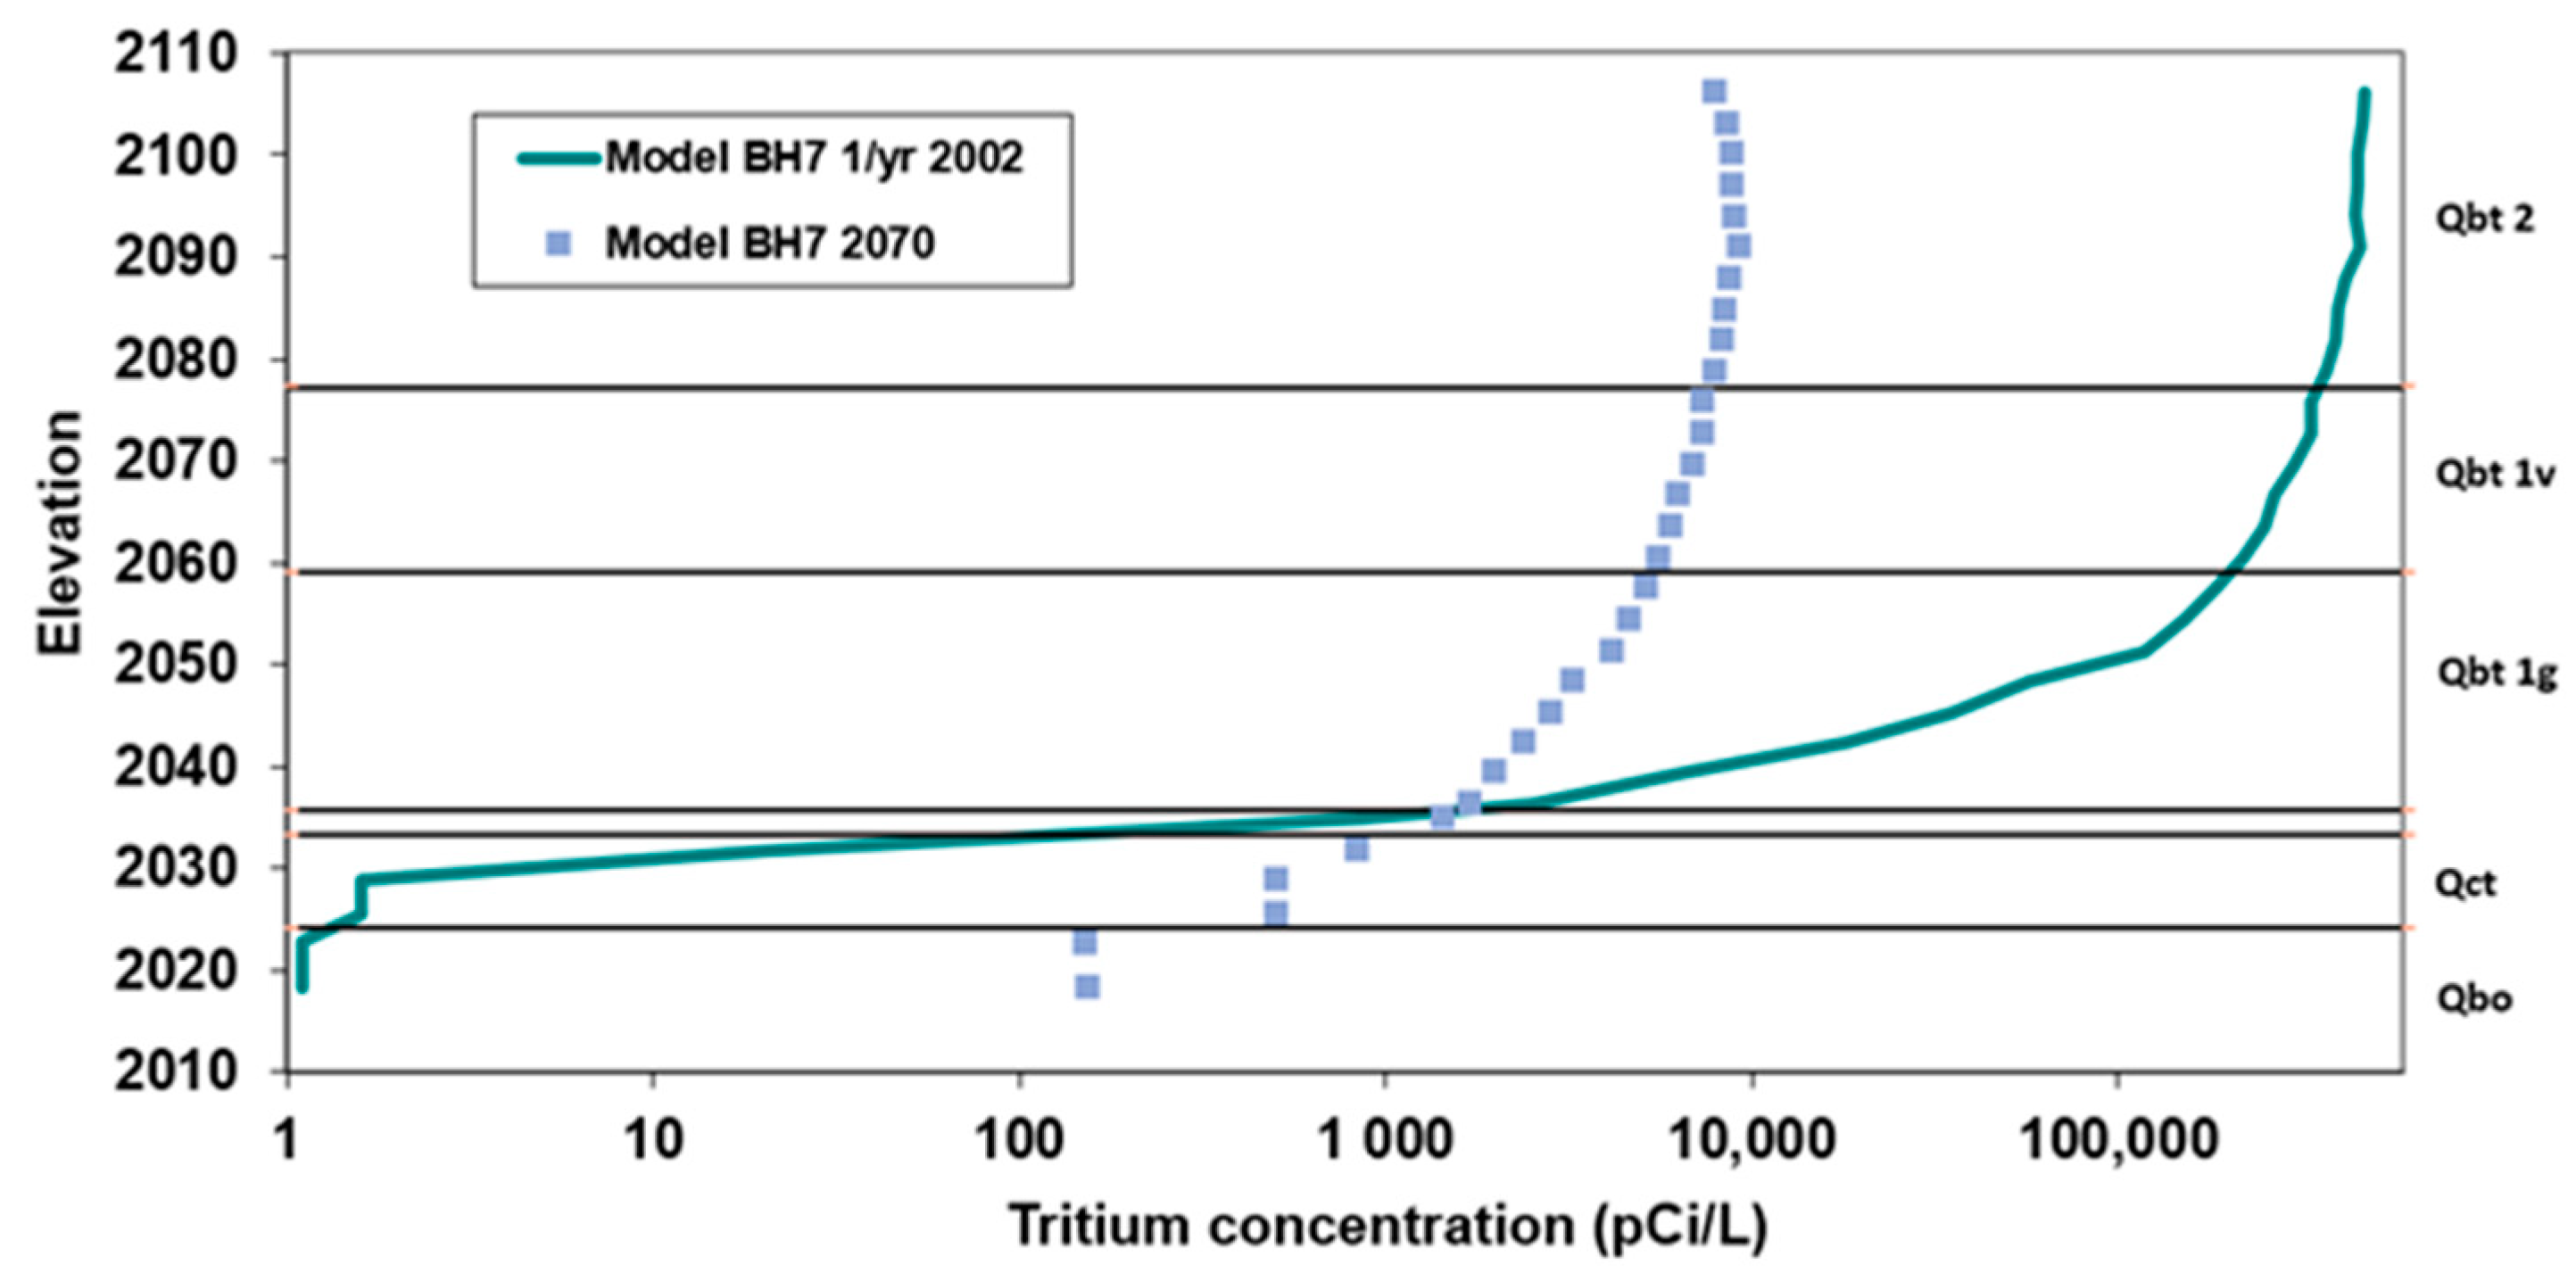
3.2.1. Tritium
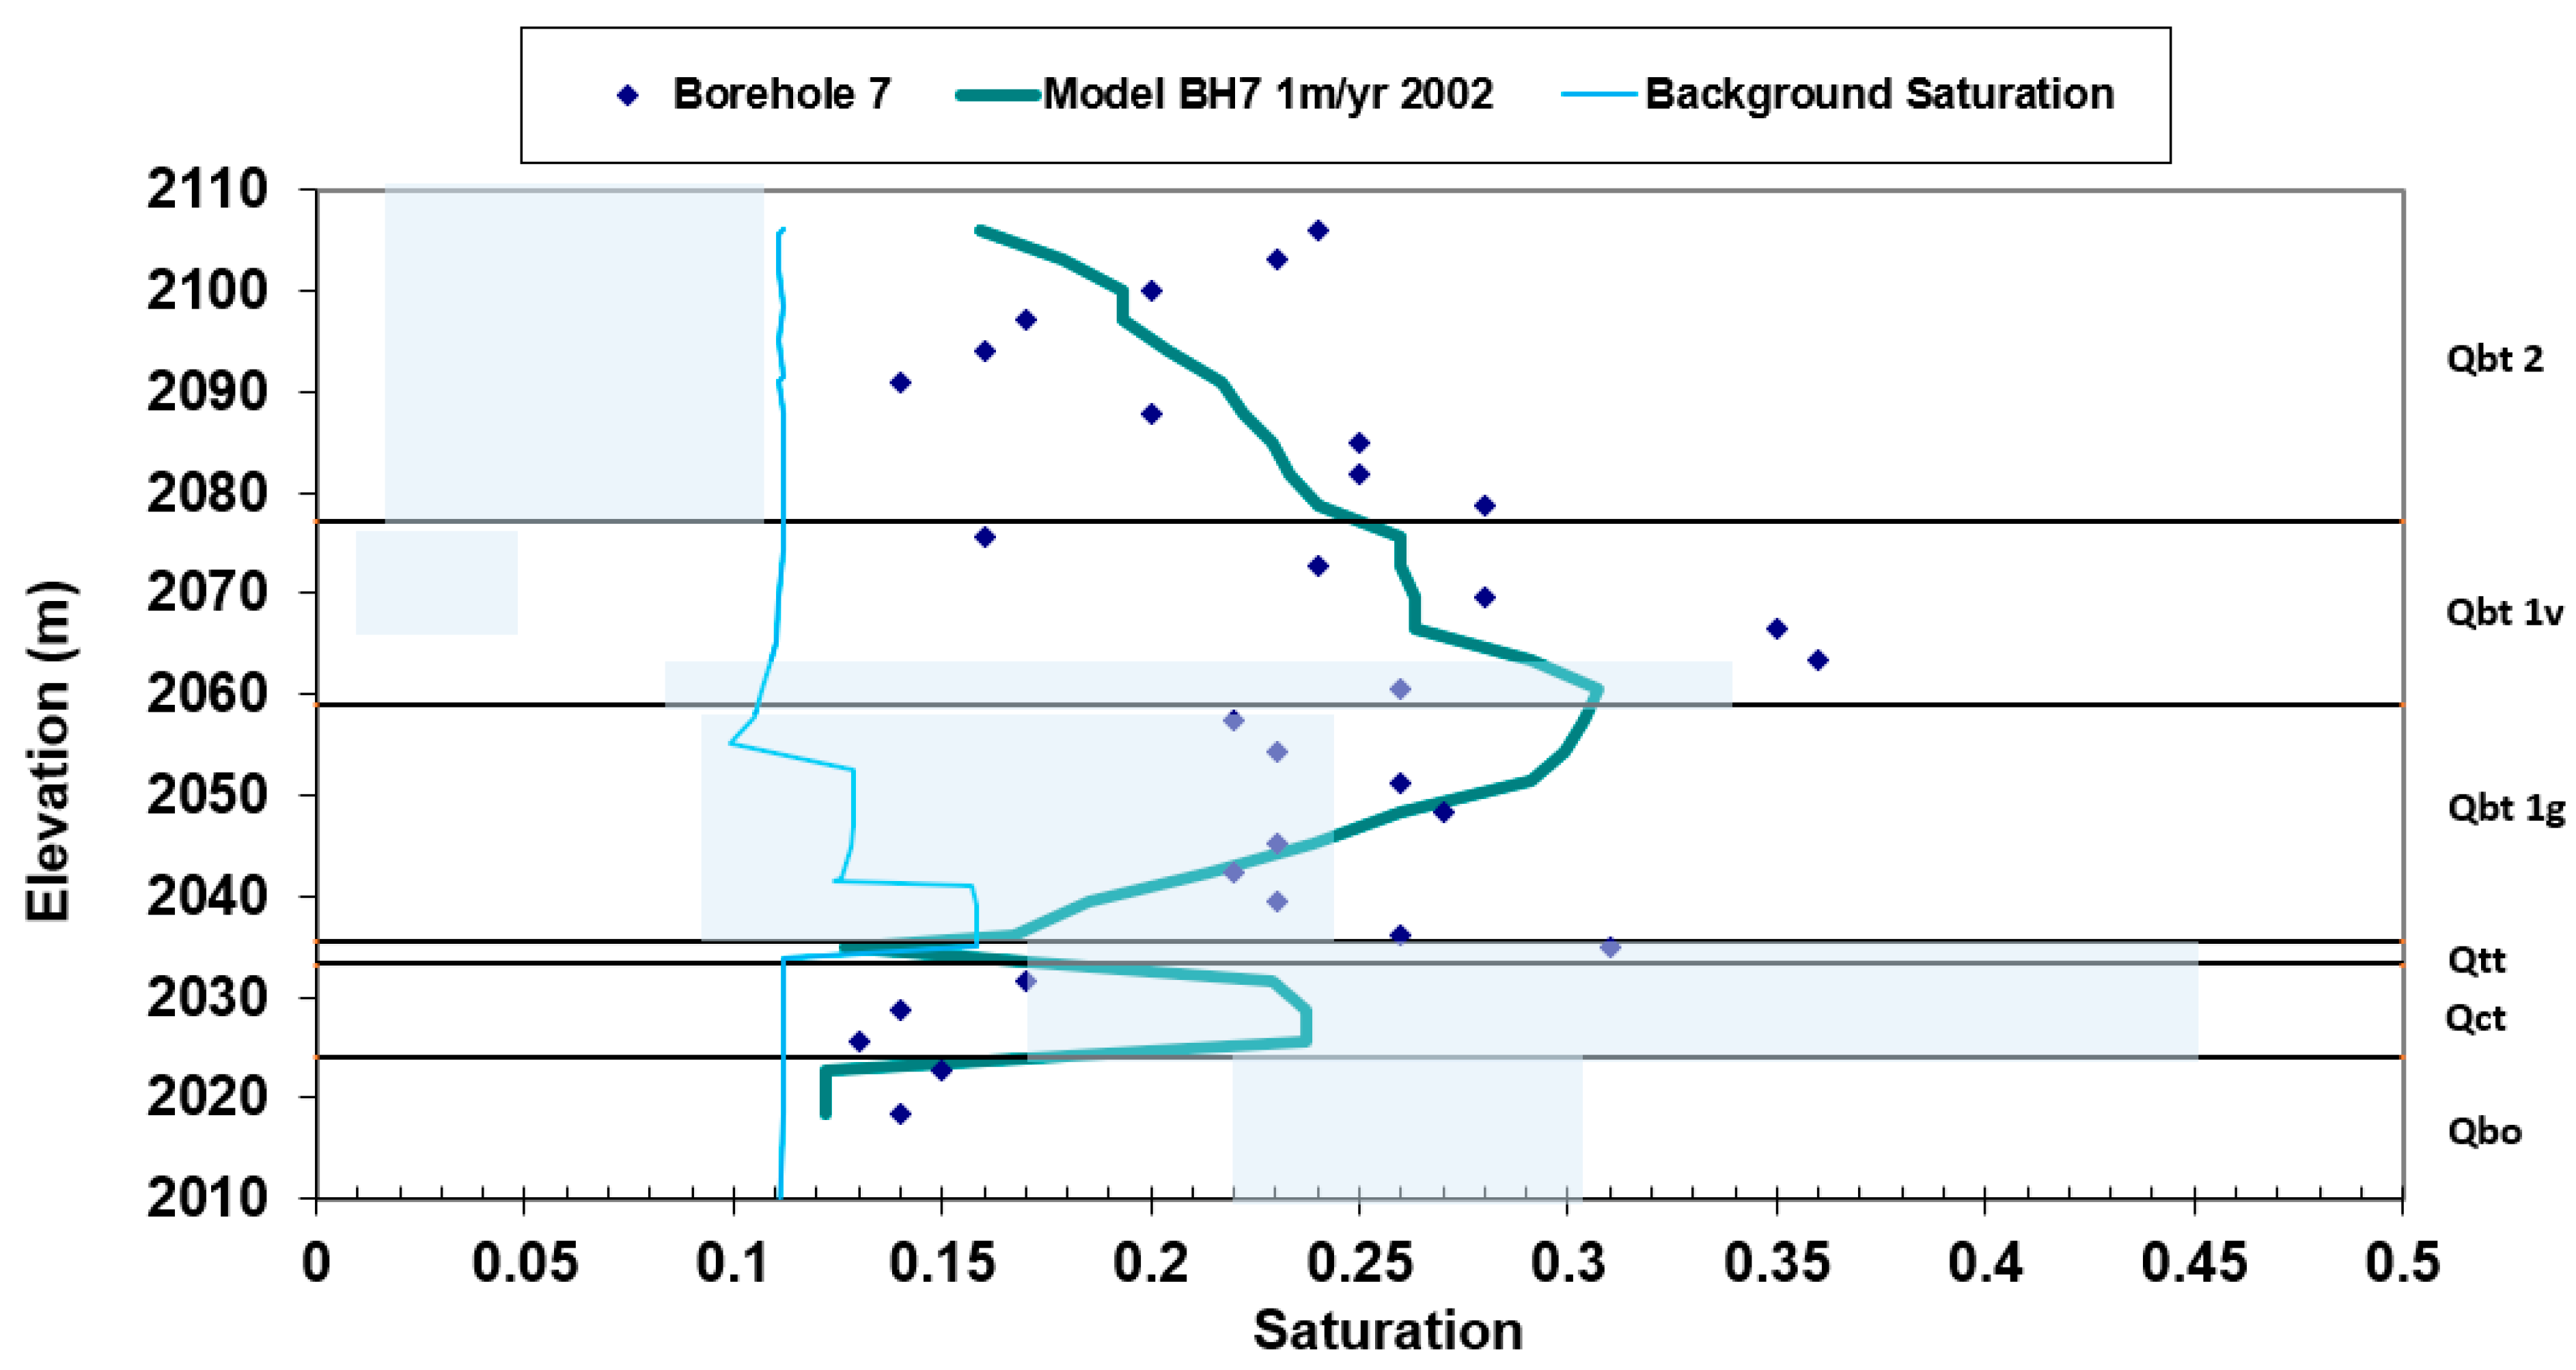
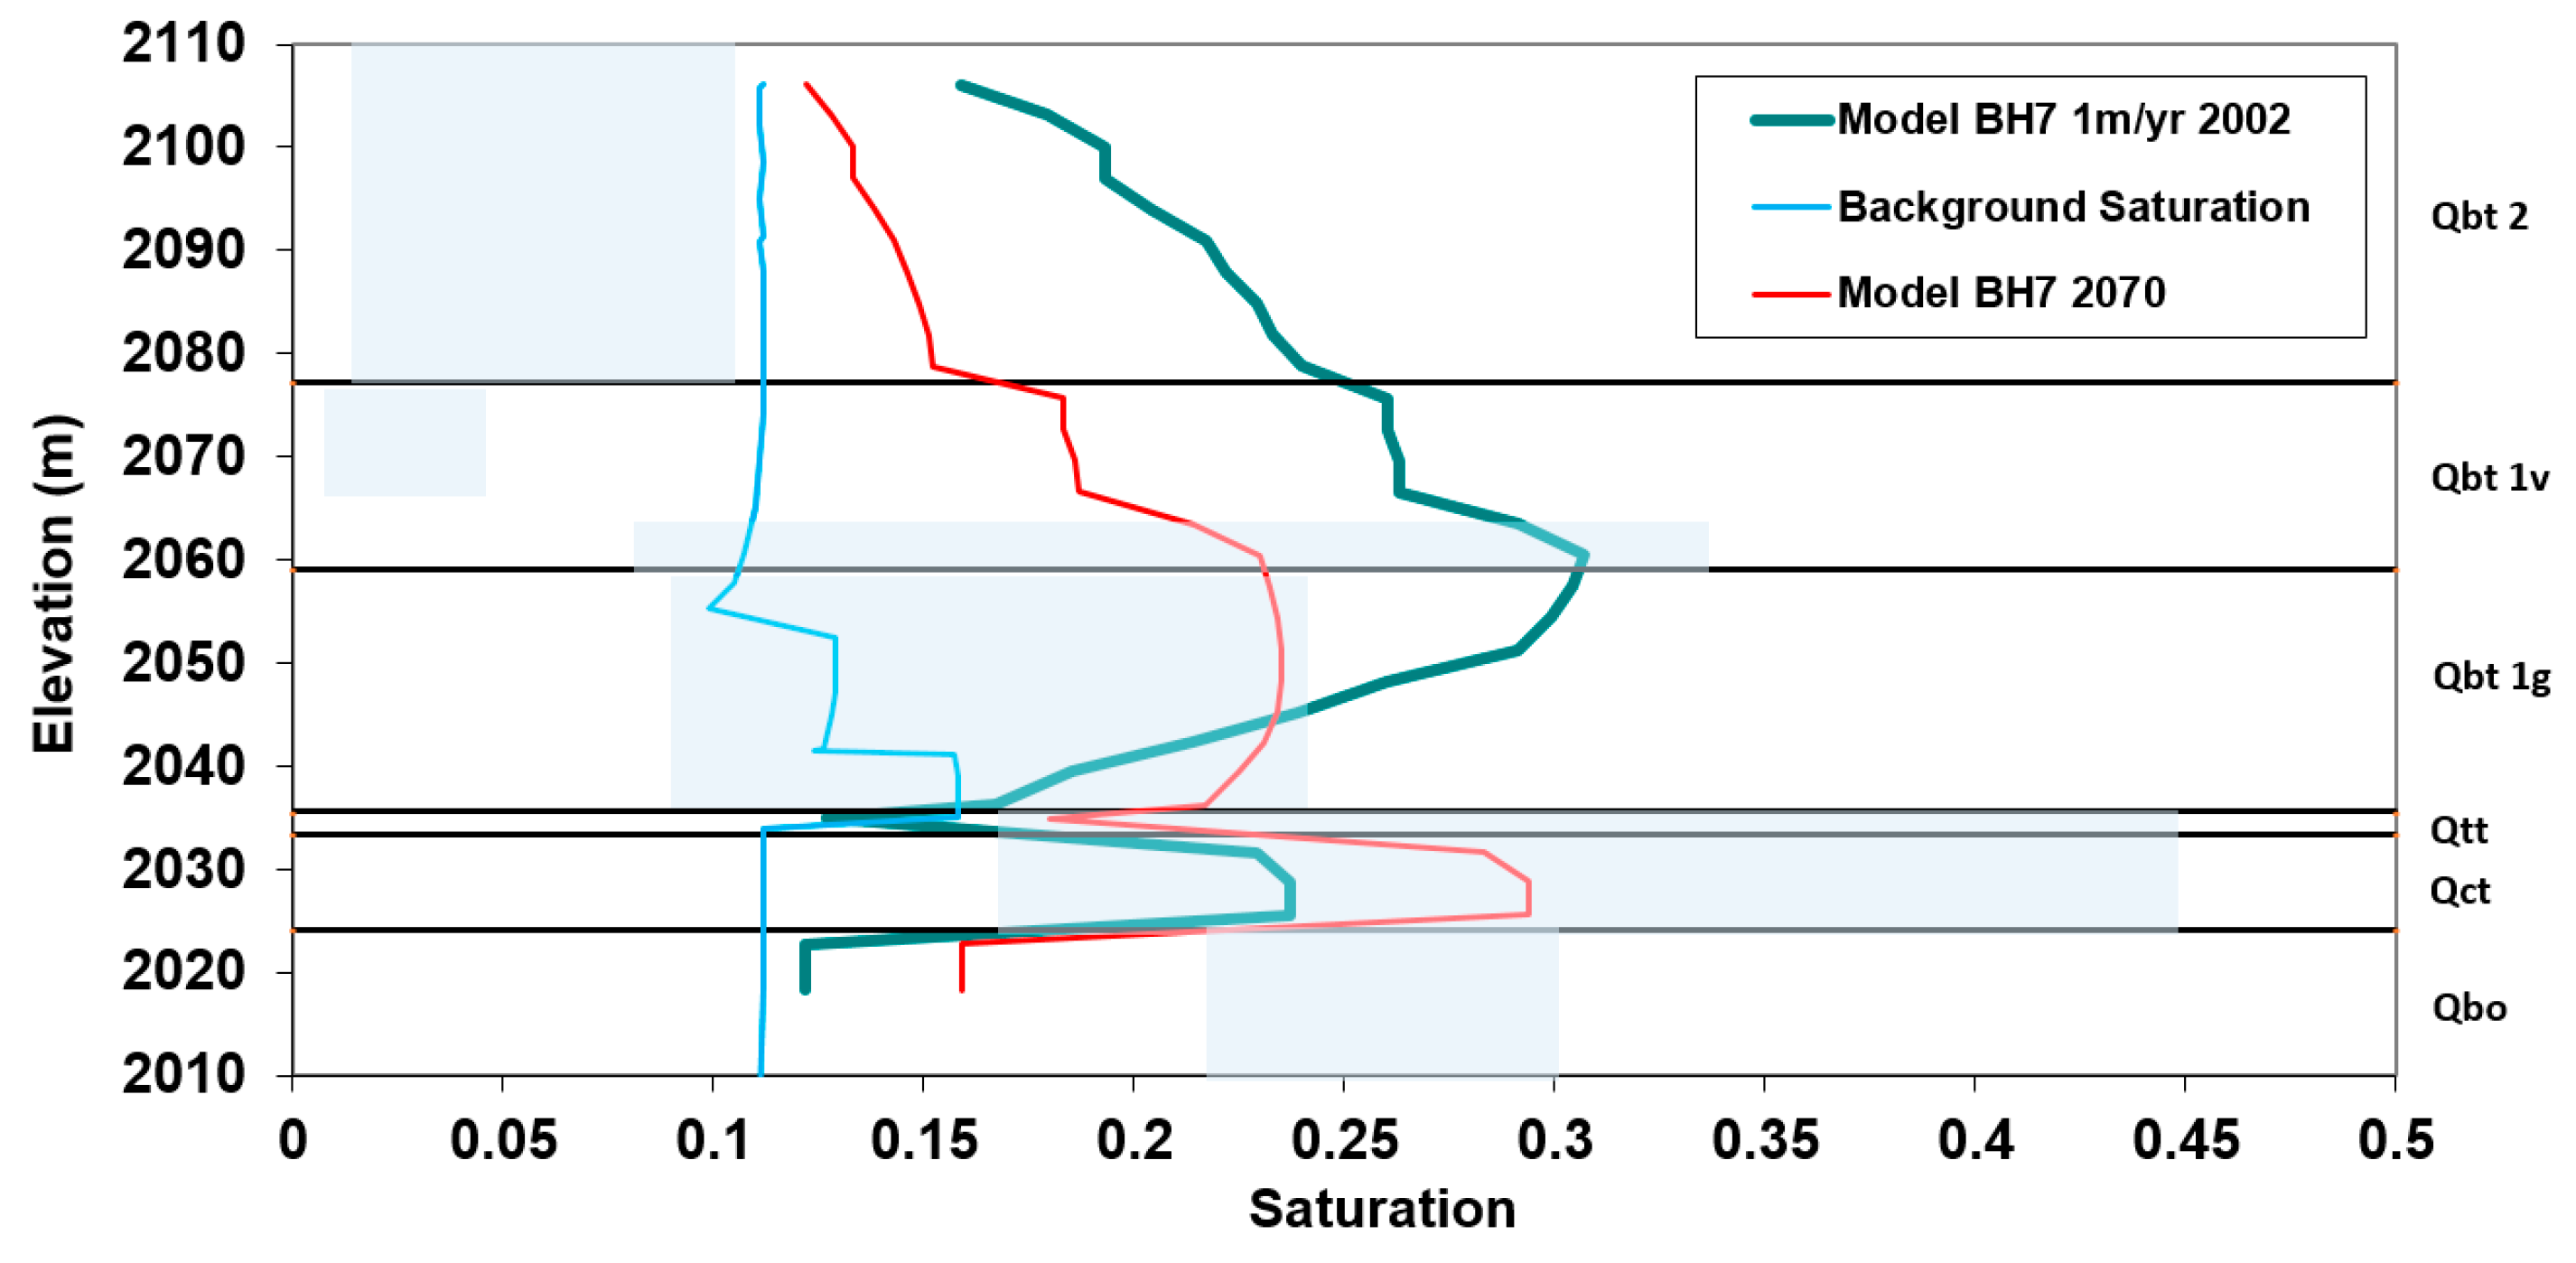
3.2.2. Saturation
4. Discussion
4.1. Implications of the Anion Profiles
4.2. Implications of the δ18O and δ2H Profiles
4.3. Implications of the Nitrate, Nitrite, δ15N, and Tritium Data
4.4. Implications for Long-Term Risk of Tritium
5. Conclusions
Author Contributions
Funding
Institutional Review Board Statement
Informed Consent Statement
Data Availability Statement
Acknowledgments
Conflicts of Interest
References
- Newman, B.D.; Breshears, D.D.; Gard, M.O. Evapotranspiration partitioning in a semiarid woodland: Ecohydrologic heterogeneity and connectivity of vegetation patches. Vadose Zone J. 2010, 9, 561–572. [Google Scholar] [CrossRef]
- Phillips, F.M. Environmental tracers for water movement in desert soils of the American Southwest. Soil Sci. Soc. Am. J. 1994, 58, 15–24. [Google Scholar] [CrossRef]
- Aggarwal, P.K.; Gat, J.R.; Froehlich, K.F.O. Isotopes in the Water Cycle, Past, Present, and Future of a Developing Science; International Atomic Energy Agency (IAEA): Vienna, Austria, 2005; ISBN 10 1-4020-3010-X (HB). [Google Scholar]
- Cauquoin, A.; Jean-Baptiste, P.; Risi, C.; Fourre, E.; Stenni, B.; Landais, A. The global distribution of natural tritium in precipitation simulated with an Atmospheric General Circulation Model and comparison with observations. Earth Planet. Sci. Lett. 2015, 427, 160–170. [Google Scholar] [CrossRef]
- Maxwell, R.M.; Tompson, A.F.B.; Kollet, S. A serendipitous, long-term infiltration experiment: Water and tritium circulation beneath the CAMBRIC trench at the Nevada Test Site. J. Cont. Hydrol. 2009, 108, 12–28. [Google Scholar] [CrossRef]
- Maples, S.R.; Andraski, B.J.; Stonestrom, D.A.; Cooper, C.A.; Pohll, G.M.; Michel, R.L. Tritium plume dynamics in the shallow unsaturated zone in an arid environment. Vadose Zone J. 2013, 12, 4. [Google Scholar] [CrossRef]
- EPA. Interim Primary Drinking Water Regulations: Proposed Maximum Contaminant Levels for Radioactivity. Fed. Regist. 1975, 40, 34324–34328. [Google Scholar]
- EPA. Drinking Water Regulations: Radionuclides. Fed. Regist. 1976, 41, 28402–28409. [Google Scholar]
- Garcia, A.; Andraski, B.J.; Stonestrom, D.A.; Cooper, C.A.; Johnson, M.J.; Michel, R.L.; Wheatcraft, S.W. Transport of tritium contamination to the atmosphere in an arid environment. Vadose Zone J. 2009, 8, 450–461. [Google Scholar] [CrossRef]
- Hodges, R.A.; Cooper, C.A.; Falta, R.W. Modeling of flow and transport by production of hydrofracture-stimulated gas wells near the Rulison nuclear test. Transp. Porous Media 2015, 108, 23–42. [Google Scholar] [CrossRef]
- Clark, I.D.; Fritz, P. Environmental Isotopes in Hydrogeology; Lewis Publishers: Boca Raton, FL, USA, 1997; p. 149. [Google Scholar]
- Cappa, C.D.; Hendricks, M.B.; DePaolo, D.J.; Cohen, R.C. Isotopic fractionation of water during evaporation. J. Geophys. Res. 2003, 108, D16. [Google Scholar] [CrossRef]
- Isotope Tracers in Catchment Hydrology; Kendall, C.; McDonnell, J. (Eds.) Elsevier: Amsterdam, The Netherlands, 1998; p. 839. [Google Scholar]
- Allison, G.B.; Barnes, C.J.; Hughes, M.W. The distribution of deuterium and 18O in dry soils: 2. Experimental. J. Hydrol. 1983, 64, 377–397. [Google Scholar] [CrossRef]
- Barnes, C.J.; Allison, G.B. The distribution of deuterium and 18O in dry soils: 1. Theory J. Hydrol. 1983, 64, 141–156. [Google Scholar] [CrossRef]
- Newman, B.D.; Campbell, A.R.; Wilcox, B.P. Tracer-based studies of soil water movement in semi-arid forests of New Mexico. J. Hydrol. 1997, 196, 251–270. [Google Scholar] [CrossRef]
- Walvoord, M.A.; Phillips, F.M.; Stonestrom, D.A.; Evans, R.D.; Hartsough, P.C.; Newman, B.D.; Striegl, R.G. A Reservoir of Nitrate Beneath Desert Soils. Science 2003, 302, 1021–1024. [Google Scholar] [CrossRef] [PubMed]
- LANSCE. Available online: https://lansce.lanl.gov/facilities/linac.php (accessed on 19 July 2022).
- Newman, B.D.; Robinson, B.A. The hydrogeology of Los Alamos National Laboratory: Site history and overview of vadose zone and groundwater contamination issues. Vadose Zone J. 2005, 4, 614–619. [Google Scholar] [CrossRef]
- Broxton, D.E.; Vaniman, D.T. Geologic Framework of a Groundwater System on the Margin of a Rift Basin, Pajarito Plateau, North-Central New Mexico. Vadose Zone J. 2005, 4, 522–550. [Google Scholar] [CrossRef]
- Los Alamos National Laboratory. RFI Work Plan and SAP for Potential Release Sites 53-002(a), 53-002(b), and Associated Piping and Drainages at TA-53; Los Alamos National Laboratory Report, LA-UR-98-2547; Los Alamos National Laboratory: Los Alamos, NM, USA, 1998.
- Los Alamos National Laboratory. Addendum II to RFI Work Plan and SAP for Potential Release Sites 53-002(a), 53-002(b), and Associated Piping and Drainages at TA-53; Los Alamos National Laboratory report, LA-UR-02, 4013; Los Alamos National Laboratory: Los Alamos, NM, USA, 2002.
- Los Alamos National Laboratory. Investigation and Remediation Report for Consolidated SWMU 53-002(a)-99, Inactive Wastewater Impoundments, and AOC 53-008, Storage Area; at Technical Area 53, Revision 1, Los Alamos National Laboratory report, LA-UR-05, 6373; Los Alamos National Laboratory: Los Alamos, NM, USA, 2005.
- Stauffer, P.H.; Levitt, D.G.; Miller, T.A.; Jordan, A.; Chu, S.; Dash, Z. Groundwater Pathway Model for the Los Alamos National Laboratory Technical Area 21, Material Disposal Area T; Los Alamos National Laboratory report, LA-UR-17-21054; Los Alamos National Laboratory: Los Alamos, NM, USA, 2017.
- Stauffer, P.H.; Birdsell, K.H.; Dai, Z.; Levitt, D.; Atchley, A.; Pawar, R.J.; Chu, S.P.; French, S.B. Simulated Impacts of Water Introduced into Pits 37 and 38 at Technical Area 54, Area G; Los Alamos National Laboratory report, LA-UR-16-29480; Los Alamos National Laboratory: Los Alamos, NM, USA, 2017.
- Birdsell, K.H.; Wolfsberg, A.V.; Hollis, D.; Cherry, T.A.; Bower, K.M. Groundwater Flow and Radionuclide Transport Calculations for a Performance assessment of a Low-Level Waste Site. J. Contam. Hydrol. 2000, 46, 99–129. [Google Scholar] [CrossRef]
- Turin, H.J.; Rosenberg, N. A Conceptual Model for Flow in the Vadose Zone Beneath Finger Mesas of the Pajarito Plateau. In Proceedings of the New Mexico Geological Society 47th Annual Field Conference, Socorro, NM, USA, 25–28 September 1996; Goff, F., Kues, B.S., Rogers, M.A., McFadden, L.D., Gardner, J.N., Eds.; NM Bureau of Geology & Mineral Resources: Socorro, NM, USA, 1996. 484p. [Google Scholar]
- Birdsell, K.H.; Newman, B.D.; Broxton, D.E.; Robinson, B.A. Conceptual models of vadose zone flow and transport beneath the Pajarito Plateau, Los Alamos, NM. Vadose Zone J. 2005, 4, 620–636. [Google Scholar] [CrossRef]
- Robinson, B.A.; McLin, S.G.; Viswanathan, H.S. Hydrologic Behavior of Unsaturated, Fractured Tuff: Interpretation and Modeling of a Wellbore Injection Test. Vadose Zone J. 2005, 4, 694–707. [Google Scholar] [CrossRef]
- Cooper, C.A.; Chapman, J.B. Radionuclide Migration at the Gasbuggy Underground Nuclear Test Site; LMS/GSB/S13226, DRI Report No. 41262; DRI: Alexandria, VA, USA, 2015. [Google Scholar]
- Knight, J.H. An Improved Approximation of Spherical Diffusion of Tritium in Relatively Dry Soil. Water Resour. 1996, 32, 349–354. [Google Scholar] [CrossRef]
- Smiles, D.E.; Gardner, W.R.; Shultz, R.K. Diffusion of Tritium in Arid Disposal Sites. Water Resour. Res. 1995, 31, 1438–1488. [Google Scholar] [CrossRef]
- Zyvoloski, G.A.; Robinson, B.A.; Dash, Z.V.; Trease, L.L. Summary of the Models and Methods for the FEHM Application—A Finite-Element Heat- and Mass-Transfer Code; Los Alamos National Laboratory report LA-13307-MS; Los Alamos National Laboratory: Los Alamos, NM, USA, 1997.
- Zyvoloski, G.A.; Robinson, B.A.; Dash, Z.V.; Kelkar, S.; Viswanathan, H.S.; Pawar, R.J.; Stauffer, P.H.; Miller, T.A.; Chu, S.P. Software Users Manual (UM) for the FEHM Application Version 3.1–3.X.; Los Alamos National Laboratory Report, LA-UR-12-24493; Los Alamos National Laboratory: Los Alamos, NM, USA, 2015.
- Available online: https://fehm.lanl.gov/ (accessed on 19 July 2022).
- Rogers, D.B.; Gallaher, B.M. The Unsaturated Hydraulic Characteristics of the Bandelier Tuff; Los Alamos National Laboratory Report, LA-12968-MS; Los Alamos National Laboratory: Los Alamos, NM, USA, 1995.
- Shurbaji, A.R.; Campbell, A.R. A study of evaporation and recharge in desert soils using environmental tracers, New Mexico, USA. Environ. Geol. 1997, 29, 147–151. [Google Scholar] [CrossRef]
- Socki, R.A.; Karlsson, H.R.; Gibson, E.K. Extraction technique for determination of oxygen-18 in water using preevacuated glass vials. Anal. Chem. 1992, 64, 829–831. [Google Scholar] [CrossRef]
- Kendall, C.; Coplen, T.B. Multisample conversion of water to hydrogen by zinc for stable isotope determination. Anal. Chem. 1985, 57, 1437–1446. [Google Scholar] [CrossRef]
- Chang, C.C.Y.; Langston, J.; Riggs, M.; Campbell, D.H.; Silva, S.R.; Kendall, C. A method for nitrate collection for delta N-15 and delta O-18 analysis from waters with low nitrate concentrations. Can. J. Fish. Aquat. Sci. 1999, 56, 1856–1864. [Google Scholar] [CrossRef]
- Silva, S.R.; Kendall, C.; Wilkison, D.H.; Ziegler, A.C.; Chang, C.C.Y.; Avanzino, R.J. A new method for collection of nitrate from fresh water and the analysis of nitrogen and oxygen isotope ratios. J. Hydrol. 2000, 228, 22–36. [Google Scholar] [CrossRef]
- Stauffer, P.H. Tritium Transport Beneath Surface Impoundments at TA-53 Modeling and Analysis in Support of Data Needs; Los Alamos National Laboratory Report, LA-UR-02-5321; Los Alamos National Laboratory: Los Alamos, NM, USA, 2002.
- Viswanathan, H.S.; Robinson, B.A.; Valocchi, A.J.; Triay, I.R. A reactive transport model of neptunium migration from the potential repository at Yucca Mountain. J. Hydrol. 1998, 209, 251–280. [Google Scholar] [CrossRef]
- Stauffer, P.H.; Vrugt, J.A.; Turin, H.J.; Gable, C.W.; Soll, W.E. Untangling diffusion from advection in unsaturated porous media: Experimental data, modeling, and parameter uncertainty assessment. Vadose Zone J. 2009, 8, 510–522. [Google Scholar] [CrossRef]
- Robinson, B.A.; Chu, S.; Lu, Z. Simulation of Radionuclide Transport through Unsaturated, Fractured Rock: Application to Yucca Mountain, Nevada. Vadose Zone J. 2012, 11, 15. [Google Scholar] [CrossRef]
- Stauffer, P.H.; Birdsell, K.H.; Witkowski, M.S.; Hopkins, J.K. Vadose Zone Transport of 1,1,1-Trichloroethane: Conceptual Model Validation through Numerical Simulation. Vadose Zone J. 2005, 4, 760–773. [Google Scholar] [CrossRef]
- Neeper, D.A.; Stauffer, P.H. Transport by oscillatory flow in soils with kinetic mass transfer I. Theory Vadose Zone J. 2012, 11, 14. [Google Scholar] [CrossRef]
- Neeper, D.A.; Stauffer, P.H. Transport by oscillatory flow in soils with kinetic mass transfer II. Field Experiment. Vadose Zone J. 2012, 11, 14. [Google Scholar] [CrossRef]
- Kwicklis, E.M.; Wolfsberg, A.V.; Stauffer, P.H.; Walvroord, M.A.; Sully, M.J. Multiphase Multicomponent Parameter Estimation for Liquid and Vapor Flu. Vadose Zone J. 2006, 5, 934–950. [Google Scholar] [CrossRef]
- LaGrit. Los Alamos Grid Toolbox. Available online: https://lagrit.lanl.gov/ (accessed on 19 July 2022).
- Carey, B.; Cole, G.; Lewis, C.; Tsai, F.; Warren, R.; WoldeGabriel, G. Revised Site-Wide-Geologic Model for Los Alamos National Laboratory (FY99); Los Alamos National Laboratory Report LA-UR-00-2056; Los Alamos National Laboratory: Los Alamos, NM, USA, 1999; p. 66782.
- Miller, T.A.; Vessilinov, V.V.; Stauffer, P.H.; Birdsell, K.H.; Gable, C.W. Integration of Geologic Frameworks in Meshing and Setup of Computational Hydrogeologic Models, Pajarito Plateau, New Mexico. In New Mexico Geological Society Guide Book 58th Field Conference, Geology of the Jemez Mountains Region III, USA, 2007; New Mexico Bureau of Geology and Mine: Socorro, NM, USA, 2007. [Google Scholar]
- Stauffer, P.H.; Rosenberg, N.D. Vapor phase transport at a hillside landfill. Environ. Eng. Geosci. 2000, 6, 71–84. [Google Scholar] [CrossRef]


| Geologic Unit | Bulk Density (kg/m3) | Permeability (m2) | φ | Van Genuchten Parameters | |||
|---|---|---|---|---|---|---|---|
| Horiz. | Vert. | Satres | α(1/m) | n | |||
| Tshirege Qbt2 | 1.6 × 10³ | 1.2 × 10⁻¹³ | 1.2 × 10⁻¹³ | 0.40 | 0.017 | 0.30 | 2.2 |
| Tshirege Qbt1v | 1.3 × 10³ | 5.1 × 10⁻¹³ | 5.1 × 10⁻¹³ | 0.51 | 0.004 | 0.54 | 1.7 |
| Tshirege Qbt1g | 1.2 × 10³ | 6.8 × 10⁻¹³ | 6.8 × 10⁻¹³ | 0.56 | 0.00 | 0.63 | 1.6 |
| Tsankawi Pumice | ND | 2.2 × 10⁻¹² | 2.2 × 10⁻¹² | 0.59 | 0.00 | 0.43 | 1.9 |
| Cerro Toledo interval | 1.2 × 10³ | 7.1 × 10⁻¹³ | 7.1 × 10⁻¹³ | 0.51 | 0.00 | 0.53 | 1.4 |
| Otowi | 1.2 × 10³ | 9.8 × 10⁻¹⁴ | 9.8 × 10⁻¹⁴ | 0.53 | 0.008 | 0.30 | 2.0 |
| Guaje Pumice | 8.4 × 10² | 1.6 × 10⁻¹³ | 1.6 × 10⁻¹³ | 0.66 | 0.00 | 0.28 | 2.5 |
| Cerros del Rio basalt | ND | 1.0 × 10⁻¹² | 1.0 × 10⁻¹² | 0.001 | 0.001 | 3.8 | 1.5 |
| Puye Formation | 2.6 × 10³ | 8.7 × 10⁻¹³ | 4.1 × 10⁻¹⁴ | 0.21/0.40 | 0.0012 | 0.85 | 2.3 |
| Depth (m) | Percent Moisture (θw) | pCi/g Wet | Porosity | Saturation (s) | pCi/L |
|---|---|---|---|---|---|
| 3.2 | 6.1 | 31.7 | 0.4 | 0.24 | 551,372 |
| 6.1 | 5.9 | 13.5 | 0.4 | 0.23 | 242,314 |
| 9.1 | 5.1 | 20.4 | 0.4 | 0.20 | 420,400 |
| 12.2 | 4.3 | 19.7 | 0.4 | 0.17 | 477,840 |
| 15.2 | 4 | 11.9 | 0.4 | 0.16 | 309,400 |
| 18.3 | 3.4 | 9.99 | 0.4 | 0.14 | 303,814 |
| 21.3 | 5 | 10.1 | 0.4 | 0.20 | 212,100 |
| 24.4 | 6.3 | 11.6 | 0.4 | 0.25 | 195,727 |
| 27.4 | 6.3 | 11.6 | 0.4 | 0.25 | 195,727 |
| 30.5 | 7 | 11.6 | 0.4 | 0.28 | 177,314 |
| 33.5 | 6.2 | 11 | 0.51 | 0.16 | 188,419 |
| 36.6 | 9.6 | 10.4 | 0.51 | 0.24 | 118,733 |
| 39.6 | 10.9 | 7.25 | 0.51 | 0.28 | 73,764 |
| 42.7 | 13.6 | 1.45 | 0.51 | 0.35 | 12,112 |
| 45.7 | 17.2 | 0.17 | 0.56 | 0.36 | 1158 |
| 48.8 | 12.3 | 0.077 | 0.56 | 0.26 | 703 |
| 51.8 | 10.7 | −0.065 | 0.56 | 0.22 | BD |
| 54.9 | 11.2 | 0.085 | 0.56 | 0.23 | 844 |
| 57.9 | 12.5 | −0.038 | 0.56 | 0.26 | BD |
| 61.0 | 12.8 | −0.091 | 0.56 | 0.27 | BD |
| 64.0 | 11 | −0.128 | 0.56 | 0.23 | BD |
| 66.9 | 10.6 | 0.07 | 0.56 | 0.22 | 730 |
| 69.8 | 11 | −0.116 | 0.56 | 0.23 | BD |
| 73.0 | 12.5 | −0.122 | 0.56 | 0.26 | BD |
| 74.3 | 17 | −0.1 | 0.59 | 0.31 | BD |
| 77.6 | 6.6 | −0.085 | 0.51 | 0.17 | BD |
| 80.5 | 5.6 | 0.169 | 0.51 | 0.14 | 3187 |
| 83.7 | 5.3 | 0.22 | 0.51 | 0.13 | 4371 |
| 86.5 | 6.3 | 0.115 | 0.53 | 0.15 | 1940 |
| 90.9 | 5.9 | 0.014 | 0.53 | 0.14 | 251 |
| Depth (m) | Grav. Water (%) | Br− (mg/L) | Cl− (mg/L) | F (mg/L) | NO2− (mg/L) | NO3− (mg/L) | Oxalate (mg/L) | PO4− (mg/L) | SO4− (mg/L) |
|---|---|---|---|---|---|---|---|---|---|
| 3.2 | 5 | 3.8 | 146 | 61 | BD | 6.0 | 5.8 | 0.82 | 310 |
| 9.4 | 4 | 4.5 | 173 | 115 | BD | 1.5 | 2.3 | 6.8 | 32 |
| 15.5 | 4 | 6.0 | 166 | 186 | 0.4 | 1.1 | 0.7 | 2.5 | 21 |
| 21.5 | 3 | 8.2 | 202 | 230 | BD | 0.5 | BD | 5.3 | 14 |
| 27.6 | 6 | 4.3 | 128 | 108 | 0.3 | 6.3 | BD | 1.8 | 17 |
| 33.7 | 8 | 2.3 | 109 | 73 | BD | 14 | BD | 0.75 | 22 |
| 39.8 | 10 | 2.3 | 79 | 58 | BD | 11 | BD | 0.57 | 20 |
| 45.9 | 20 | 2.4 | 49 | 32 | 0.2 | 13 | BD | 0.15 | 199 |
| 52.0 | 12 | 2.4 | 101 | 31 | 0.1 | 19 | BD | 0.26 | 75 |
| 58.1 | 15 | 2.1 | 50 | 34 | BD | 1.8 | BD | 0.10 | 37 |
| 64.2 | 13 | 2.3 | 48 | 39 | 0.1 | 0.9 | 0.2 | 0.23 | 42 |
| 70.0 | 13 | 1.9 | 46 | 41 | 0.1 | 2.6 | 0.4 | 0.24 | 11 |
| 74.5 | 20 | 0.7 | 36 | 28 | BD | 1.6 | BD | 0.23 | 12 |
| 80.6 | 7 | 3.6 | 59 | 59 | BD | BD | 0.64 | 0.64 | 6.6 |
| 86.7 | 7 | 3.3 | 66 | 41 | 0.2 | 2.9 | 0.6 | 1.0 | 4.2 |
| Depth (m) | δ18O (‰) | δ2H (‰) | δ15N (‰) |
|---|---|---|---|
| 3.2 | −4.2 | −49 | 15.9 |
| 9.4 | −3.4 | −44 | 12.9 |
| 15.5 | −2.8 | −47 | NA |
| 21.5 | −2.1 | −45 | NA |
| 27.6 | −2.5 | −44 | 12.7 |
| 33.7 | −1.9 | −40 | 17.4 |
| 39.8 | −2.4 | −41 | 13.6 |
| 45.9 | −5.9 | −59 | 16.9 |
| 52.0 | −8.6 | −79 | 9 |
| 58.1 | −11.5 | −93 | 10 |
| 64.2 | −11.5 | −98 | NA |
| 70.0 | −11.5 | −102 | 7.7 |
| 74.5 | −13.4 | −105 | 11 |
| 80.6 | −12.0 | −106 | NA |
| 86.7 | −12.7 | −107 | NA |
Publisher’s Note: MDPI stays neutral with regard to jurisdictional claims in published maps and institutional affiliations. |
© 2022 by the authors. Licensee MDPI, Basel, Switzerland. This article is an open access article distributed under the terms and conditions of the Creative Commons Attribution (CC BY) license (https://creativecommons.org/licenses/by/4.0/).
Share and Cite
Stauffer, P.H.; Newman, B.D.; Birdsell, K.H.; Gard, M.O.; Heikoop, J.M.; Kluk, E.C.; Miller, T.A. Vadose Zone Transport of Tritium and Nitrate under Ponded Water Conditions. Geosciences 2022, 12, 294. https://doi.org/10.3390/geosciences12080294
Stauffer PH, Newman BD, Birdsell KH, Gard MO, Heikoop JM, Kluk EC, Miller TA. Vadose Zone Transport of Tritium and Nitrate under Ponded Water Conditions. Geosciences. 2022; 12(8):294. https://doi.org/10.3390/geosciences12080294
Chicago/Turabian StyleStauffer, Philip H., Brent D. Newman, Kay H. Birdsell, Marvin O. Gard, Jeffrey M. Heikoop, Emily C. Kluk, and Terry A. Miller. 2022. "Vadose Zone Transport of Tritium and Nitrate under Ponded Water Conditions" Geosciences 12, no. 8: 294. https://doi.org/10.3390/geosciences12080294