Article

Integrative Analyses of Antler Cartilage Transcriptome and Proteome of Gansu Red Deer (Cervus elaphus kansuensis) at Different Growth Stages

1
College of Eco–Environment Engineering, Qinghai University, Xining 810016, China
2
Qinghai Academy of Animal Science and Veterinary Medicine, Qinghai University, Xining 810016, China
3
Research Monitoring and Evaluation Center of Qinghai National Park, Xining 810016, China
*
Authors to whom correspondence should be addressed.
These authors contributed equally to this work.
Animals 2022, 12(7), 934; https://doi.org/10.3390/ani12070934
Submission received: 9 February 2022 / Revised: 22 March 2022 / Accepted: 1 April 2022 / Published: 6 April 2022
(This article belongs to the Section Animal Genetics and Genomics)

Abstract

:

Simple Summary

Velvet antler is the only organ in mammals that can completely and circularly regenerate, which involves the co-development of a variety of tissues including cartilage. Thus, velvet antler can provide an ideal model for studying chondrogenesis, endochondral ossification and rapid tissue growth. However, the mechanism of rapid growth and regeneration of velvet antler is still unclear. In this study, we conducted integrated analysis of the transcriptome and proteome of antler cartilage tissues at different growth stages. The results showed that gene13546 and its coding protein rna13546 were annotated in Wnt signaling pathway. They may play roles in antler rapid growth and regeneration.

Abstract

The velvet antler is a unique model for cancer and regeneration research due to its periodic regeneration and rapid growth. Antler growth is mainly triggered by the growth center located in its tip, which consists of velvet skin, mesenchyme and cartilage. Among them, cartilage accounts for most of the growth center. We performed an integrative analysis of the antler cartilage transcriptome and proteome at different antler growth stages. RNA-seq results revealed 24,778 unigenes, 19,243 known protein-coding genes, and 5535 new predicted genes. Of these, 2722 were detected with differential expression patterns among 30 d, 60 d, and 90 d libraries, and 488 differentially expressed genes (DEGs) were screened at 30 d vs. 60 d and 60 d vs. 90 d but not at 30 d vs. 90 d. Proteomic data identified 1361 known proteins and 179 predicted novel proteins. Comparative analyses showed 382 differentially expressed proteins (DEPs), of which 16 had differential expression levels at 30 d vs. 60 d and 60 d vs. 90 d but not at 30 d vs. 90 d. An integrated analysis conducted for DEGs and DEPs showed that gene13546 and its coding protein protein13546 annotated in the Wnt signaling pathway may possess important bio-logical functions in rapid antler growth. This study provides in-depth characterization of candidate genes and proteins, providing further insights into the molecular mechanisms controlling antler development.

1. Introduction

Gansu red deer (Cervus elaphus kansuensis) is commonly known as the white rump deer or Qilian red deer. It is an endemic species of the deer family in China and is mainly distributed in the forest areas of the Qilian Mountains. Research on C. elaphus kansuensis is limited with the focus on ecology, production performance, active substances, and functional gene cloning; however, omics studies are rare [1].
Deer antler is a unique cranial appendage derived from the forehead of male deer. It is attached to the skull by a tissue called the pedicle, from which the antler grows. Deer antler growth is relatively slow in the first month after the base shedding (30 d). Two months later (60 d), antler enters a rapid growth phase, which is the fastest growth rate of any mammal. At this stage, antler can grow up to 2 cm per day, and antler cells can reach more than 30 times faster than the proliferation of cancer cells, but no cancerous changes occur. At 90 days, the growth rate of velvet antler slows down and gradually ossifies, entering the ossification stage [2]. Histologically, deer antler is made up of several tissues such as velvet-like skin, cartilage, bone, nerves, and blood vessels [3]. Deer antleris the only mammalian organs that iscapable of annual regeneration and rapid growth [4]. Therefore, it is a premier model organ for cancer and regeneration research. The underlying molecular mechanisms involved in antler regeneration and rapid growth are the focus of attention of many biologists.
Advances in high-throughput technologies, including genomics, transcriptomics, proteomics, and metabolomics, have provided powerful methods to study antler development [5,6,7]. However, few studies have used an integrated multi-omics approach to characterize antlers in greater detail and comprehensively [8,9,10,11]. It is difficult to explain the biological regulatory networks of complex traits using only a single omics approach [12]. Integrative transcriptomics and proteomics analysis are more conducive to studying models of the regulatory mechanisms underlying the biological processes [13].
Transcriptomic and proteomic techniques have provided promising and powerful tools for mechanistic investigation as reflected in the increasing number of studies [13,14,15]. In addition, integrated transcriptomic and proteomic analyses comprehensively explain the influencing factors through experimentally observed differences in messenger ribonucleic acid (mRNA) and protein expression.
In this study, we combined mRNA sequencing with isobaric tags for relative and absolute quantitation (iTRAQ) to generate datasets encompassing primary (30 d), rapid (60 d), and ossified (90 d) stages of antler development. Our results provide a deeper understanding of rapid antler growth and cartilage development. To the best of our knowledge, this is the first study comprising genetic research on C. elaphus kansuensis the results of which provide a molecular basis for the further study of this species.

2. Materials and Methods

2.1. Animals, Sample Collection, and Preparation

In this study, C. elaphus kansuensis were fed on a semi-wild Shandan horse farm. Velvet antlers at different growth stages (30 d, 60 d, and 90 d) were collected from three adult male deer at each time point. Before we collecting antlers, the male deers were were anaesthetized with Mian Naining (Lu Mian ning, Beijing, China). After the velvet antlers were sawed off from the antler pedicle, potassium permanganate was used to stop the bleeding immediately. Then Lu xingling (Beijing, China) was injected to wake up red deers and release them into the wild. Cartilage parts in the antler tip were separated for transcriptome and proteome analyses and data verification. All samples were stored in liquid nitrogen tanks, brought back to the laboratory, and stored at −80 °C. All experimental protocols were approved by the Institutional Animal Care and Use Committee of Qinghai University (Xining, China), and all methods were carried out in accordance with approved guidelines and regulations (Code: SL-2022024).

2.2. RNA Extraction and Sequencing

Total RNA from the antler cartilage tissues of three Gansu red deer was extracted using The TRIzol reagent (Thermo Fisher Scientific, Waltham, MA, USA), and the extraction procedure was performed according to the manufacturer’s instructions. The extracted total RNA was quality checked using Agilent Bioanalyzer 2100 (Agilent, Santa Clara, CA, USA) and quantified using NanoDrop 2000 spectrophotometer (Thermo Fisher Scientific, Waltham, MA, USA). The RNA samples with RNA Integrity Number (RIN) ≥ 8 were selected for preparing libraries.
In total, 1 μg of RNA per sample was used as the input material for the RNA sample preparations. The NEBNext9 UltraTM RNA Library Preparation Kit for Illumina (NEB, USA) was used to conduct sequencing libraries according to the manufacturer’s procedures, and index codes were added to attribute sequences to each sample. Sequencing was performed using an Illumina HiSeq 2500 system (Illumina).

2.3. Protein Extraction, iTRAQ Labeling, and Liquid Chromatography-Electrospray Ionization-Tandem Mass Spectrometry Analysis

Total proteins of each sample were extracted using lysis buffer (7 M urea, 2 M thiourea, 2% CHAPS, proteasome inhibitor). The Qubit fluorescent protein quantification kit (Invitrogen) was used to quantify the protein concentration according to the manufacturer’s instructions. Protein peptides (100 μg) from each sample were labeled using the 8plex iTRAQ reagents multiplex kit (ABI, Foster City, CA, USA).
The iTRAQ-labeled samples were analyzed using a Q-Exactive mass spectrometer (Thermo Fisher Scientific) coupled with a nano high-performance liquid chromatography system (UltiMate 3000 LC Dionex; Thermo Fisher Scientific).
Peak recognition was performed on the peptide obtained by mass spectrometry, and a reference database was established. Then, Mascot 2.3.02 and Proteome Discoverer 1.4 (Thermo Fisher Scientific) were used for library search identification and quantitative analysis. Finally, the obtained peptides and proteins were analyzed using Uniport and NCBI databases, and their functions and metabolic pathways were annotated by Gene ontology (GO) annotation (q < 0.05) and Kyoto Encyclopedia of Genes and Genomes (KEGG) annotation (q < 0.05). The p value was adjusted using q value.

2.4. Transcriptome and Proteome Data Analysis

Transcriptome data were analyzed in accordance with RNA-Seq workflow (https://github.com/twbattaglia/RNAseq-workflow (accessed on 15 February 2017)). Raw data (raw reads, FASTQ files) from each library were preprocessed using in-house Perl scripts. Briefly, the adapters, sequences with unknown nucleotides larger than 10% (poly-N, N% > 10%) and low-quality reads (quality score < 20) were filtered from raw data. Concurrently, the sequences quality including Q20, Q30, GC content, were calculated. All downstream analyses were based on high-quality clean data. Hisat2 [16] was used to verify reads with a perfect match or one mismatch were further analyzed and annotated based on the reference genome of C. elaphus (https://www.ncbi.nlm.nih.gov/genome/?term=red+deer (accessed on 2 January 2018)). Then, clean reads were assembled and quantified using StringTie [17] to obtain contigs and unigenes. Differential expression analysis was performed using the EBSeq (default parameters, qtrm = 0.5) [18].
Significant differentially expressed genes (DEGs) among three groups were screened with the threshold of fold change ≥ 2 and false discovery rate (FDR) < 0.01 [19,20]. FDR was adjusted p value [7]. Only DEGs were subjected to further analyses.
For proteome analysis, the raw mass data were processed for peptide data analysis using Proteome Discoverer 1.4 (Thermo Fisher Scientific) with FDR = N(decoy) ∗ 2/(N(decoy)+ N(target) of < 1% and expected cutoff or ion score of < 0.05 with 95% confidence to search the Uniprot Human Complete Proteome database. Protein probabilities were assigned using the Protein Prophet algorithm [21], and proteins with at least two unique peptides were identified. Differential expression levels of proteins were calculated using the Mann–Whitney test and calibrated using the Benjamini–Hochberg correction. Only proteins with p value < 0.05 and fold-change ≥ 1.5 were defined as significant differentially expressed proteins (DEPs). The mass spectrometry proteomics data have been deposited to the ProteomeXchange Consortium via the PRIDE [22] partner repository.

2.5. Gene Functional Annotation of DEGs and DEPs

Based onClusters of Orthologous Genes (COG) [23], GO [24] and the KEGG database [25], the functions of DEGs and DEPs were annotated.
The Database of Clusters of Orthologous Genes (COGs) [23] is a Database of homeologous protein information maintained by NCBI. A protein can be compared to all the proteins in COGs and grouped into the appropriate COG cluster.
GOseq software was used for GO enrichment analysis of differential genes based on the Wallenius noncentral hypergeometric distribution mathematical model [26]. GO terms were considered to be significantly enriched with q < 0.05.
KEGG [25] is a database that integrates genomic, chemical, and phylogenetic information. The core of them are KEGG PATHWAY and KEGG ORTHOLOGY databases. In the KEGG PATHWAY database, biological metabolic pathways are classified into six categories of processing: cellular, environmental information, genetic information, human diseases, metabolism, and organismal systems. We used KOBAS software [27] to test the statistical enrichment of DEGs and DEPs in the KEGG pathways. KEGG pathways were considered to be significantly enriched with q < 0.05

2.6. Integrated Analysis of Transcriptomic and Proteomic Data

Integrated analysis was conducted to explore the consistency between proteome and transcriptome levels of antler cartilage at 30 d, 60 d, and 90 d. Spearman’s correlation test [28] was used to assess the correlation between gene expression levels in the transcriptome and corresponding proteins in the proteome. The results were divided into three categories: DEGs and DEPs had the same expression trend, DEGs and DEPs had reverse expression trend, and DEGs and DEPs had no expression difference.

3. Results

3.1. Data Availability

Raw FASTQ files of the transcriptome were submitted to the National Center for Biotechnology Information Sequence Read Archive (NCBI SRA) database under the BioProject Accession Number PRJNA772802 [29](Transcriptome profiles of velvet antler in Gansu red deer. Available online: http://www.ncbi.nlm.nih.gov/bioproject/772802 (accessed on 19 October 2021)). Proteomic data have not been submitted. The mass spectrometry proteomics data have been deposited to the ProteomeXchange Consortium (http://www.proteomexchange.org (accessed on 19 October 2021)) with the dataset identifier PXD032668.

3.2. RNA Sequencing and Assembly

We performed RNA-seq to investigate the mRNA expression profiles of cartilage in antler tips of C. elaphus kansuensis at different growth stages. After sequencing and filtration, we generated 50,552,622, 69,330,832, and 44,833,400 clean reads of the antler growth center for 30 d, 60 d, and 90 d stages, respectively. We obtained 40,317,002, 56,820,843, and 35,010,141 mapped reads after alignment to the reference genome, accounting for 79.75%, 81.96%, and 78.09% of clean reads from the three libraries, respectively. After mapping the read assembly using StringTie software, we obtained 24,778 unigenes. The lengths of the assembled unigenes ranged from 90 bp to 82,366 bp, with an average of 2269 bp and N50 of 3894 bp. Of these 24,778 unigenes, 19,243 were mapped to known protein-coding genes and 5535 were mapped to new predicted genes. After applying the fragments per kilobase of transcript per million mapped reads (FPKM) filter (FPKM = 0), 18,707, 19,694, and 18,985 unigenes were detected in 30 d, 60 d, and 90 d libraries, respectively. Among these genes, 17,527, 18,307, and 18,004 were detected (FPKM ≥ 0.1), whereas the remaining 7251, 6471, and 6774 genes were considered to be very low in expression or not expressed (FPKM < 0.1) in the three libraries.
Expression analysis showed that gene4406 and gene13363 were the most highly expressed in all three libraries (Table 1). The co-expressed gene7568, gene2851, and gene21360 also had higher expression levels. Among the most highly expressed genes, most were known genes; hence, only one and three predicted novel genes were selected in the 30 d and 90 d antler growth centers, respectively.

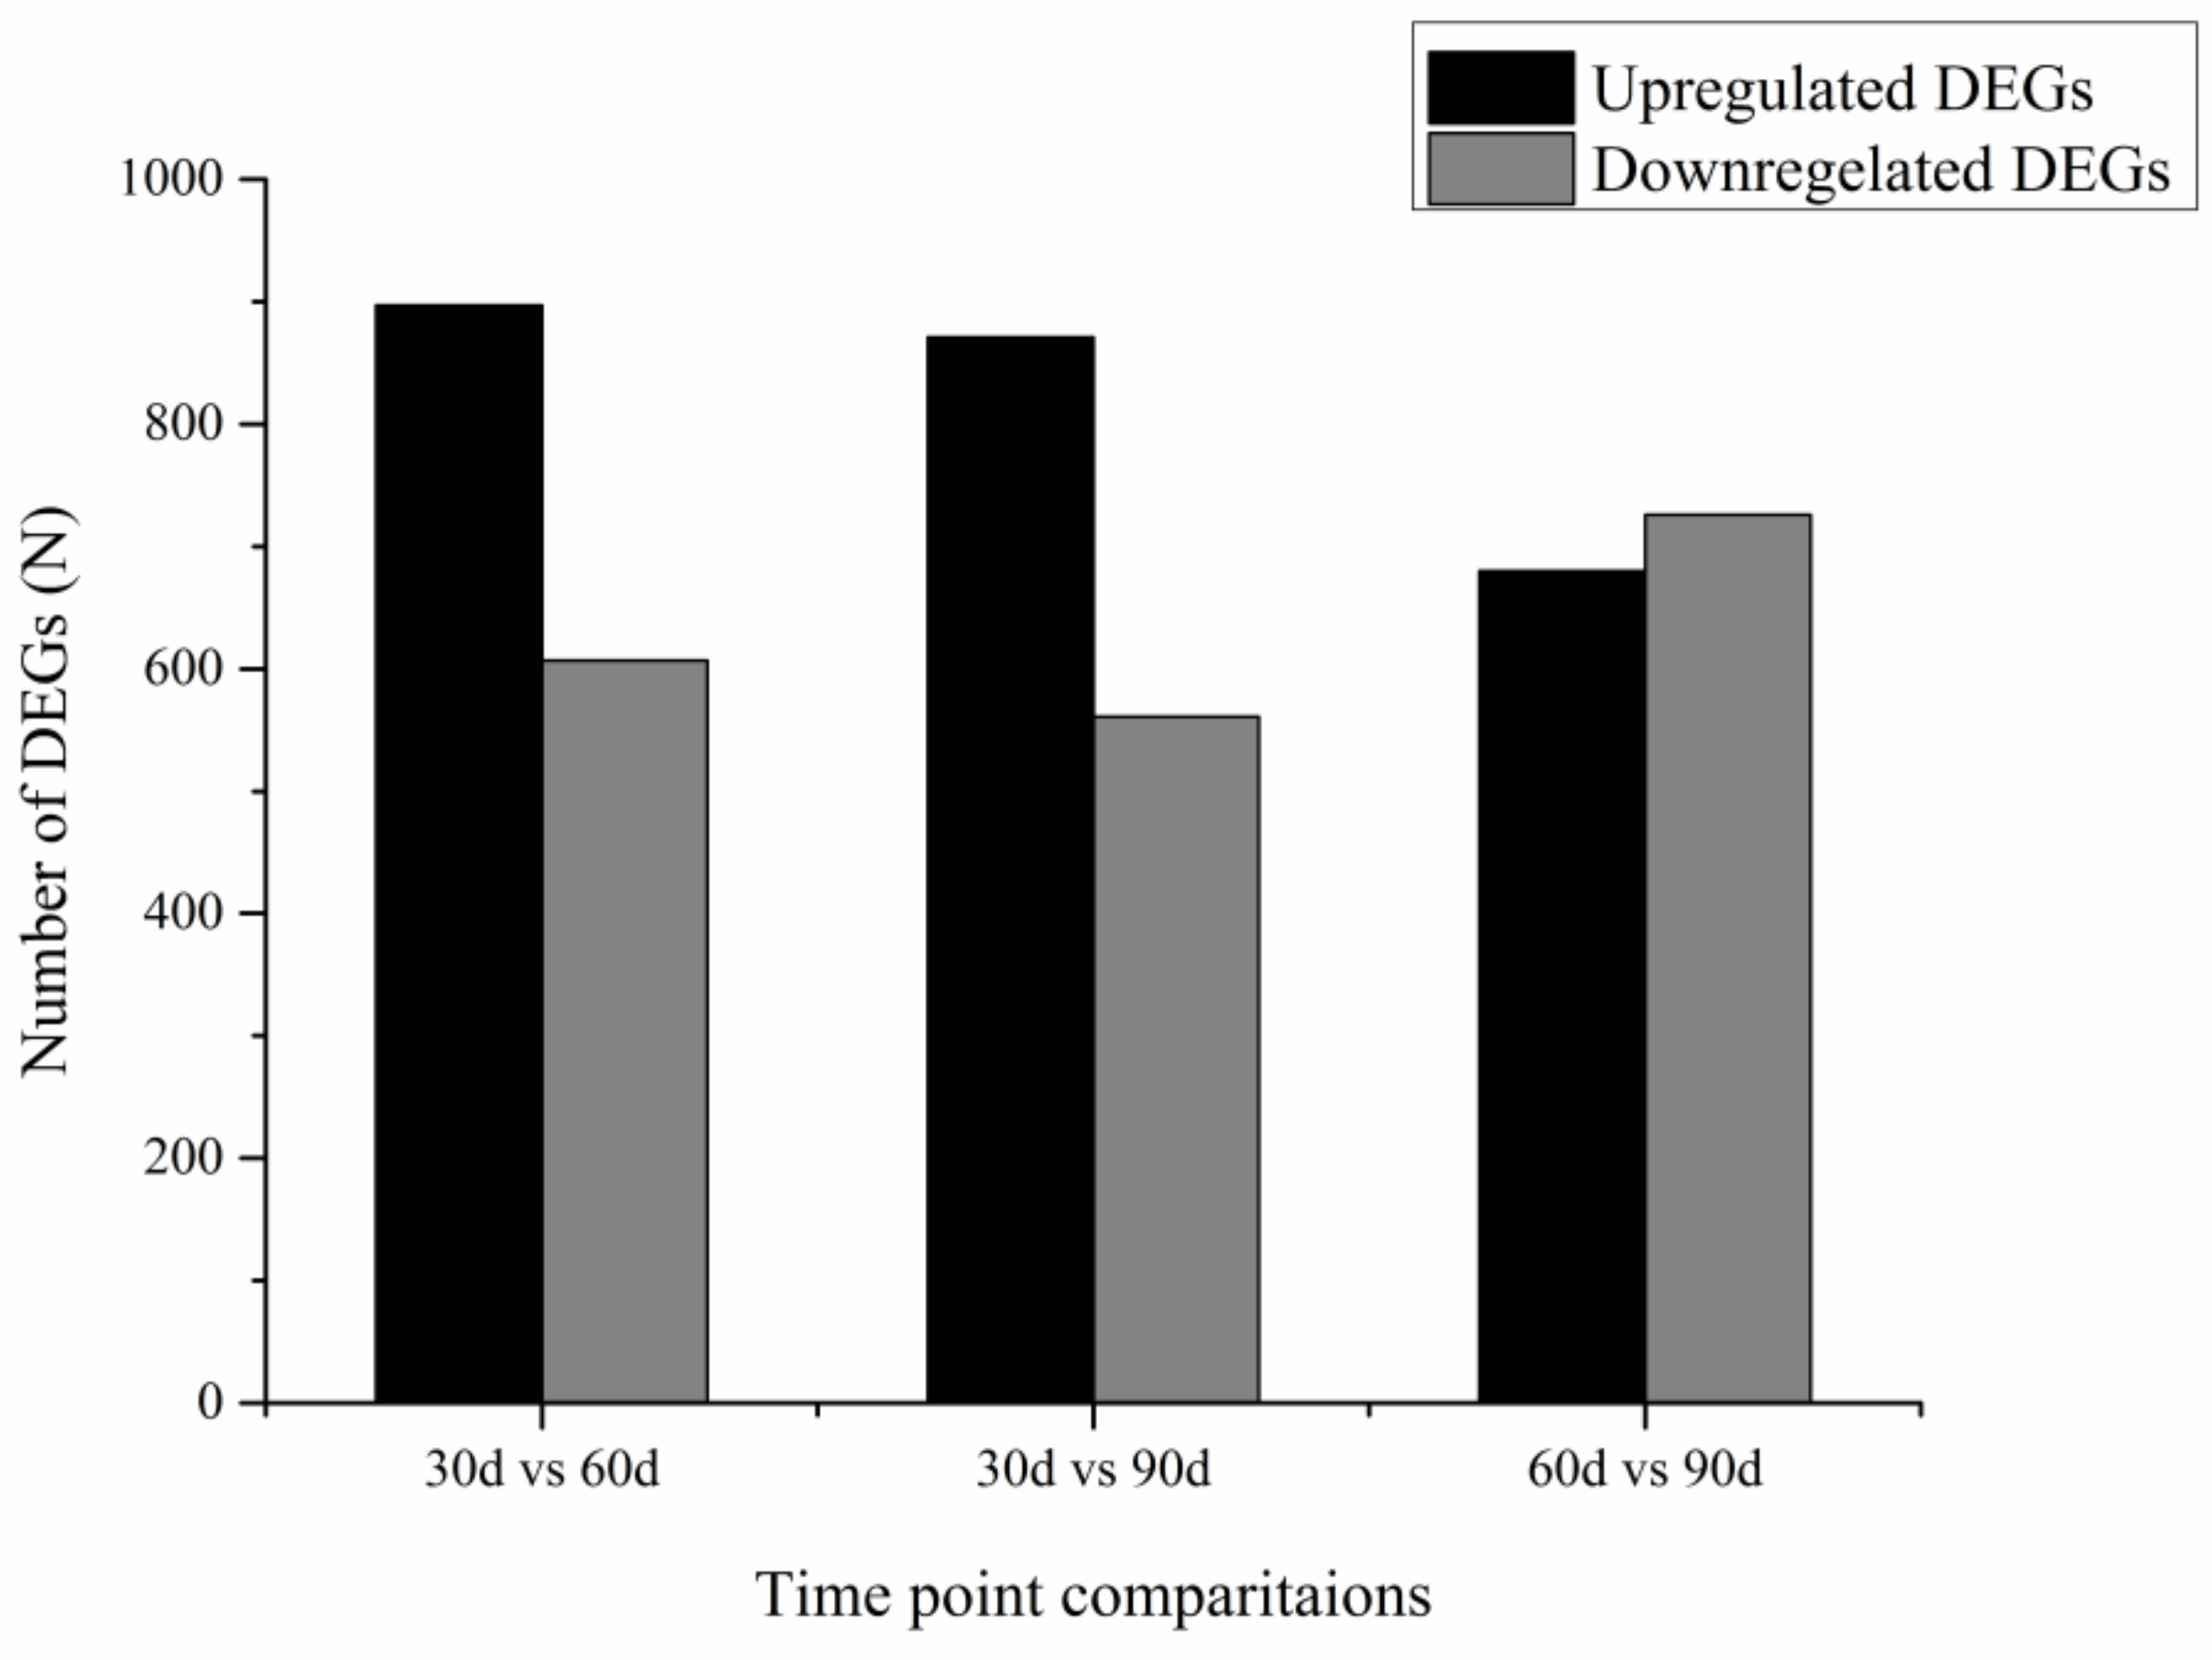
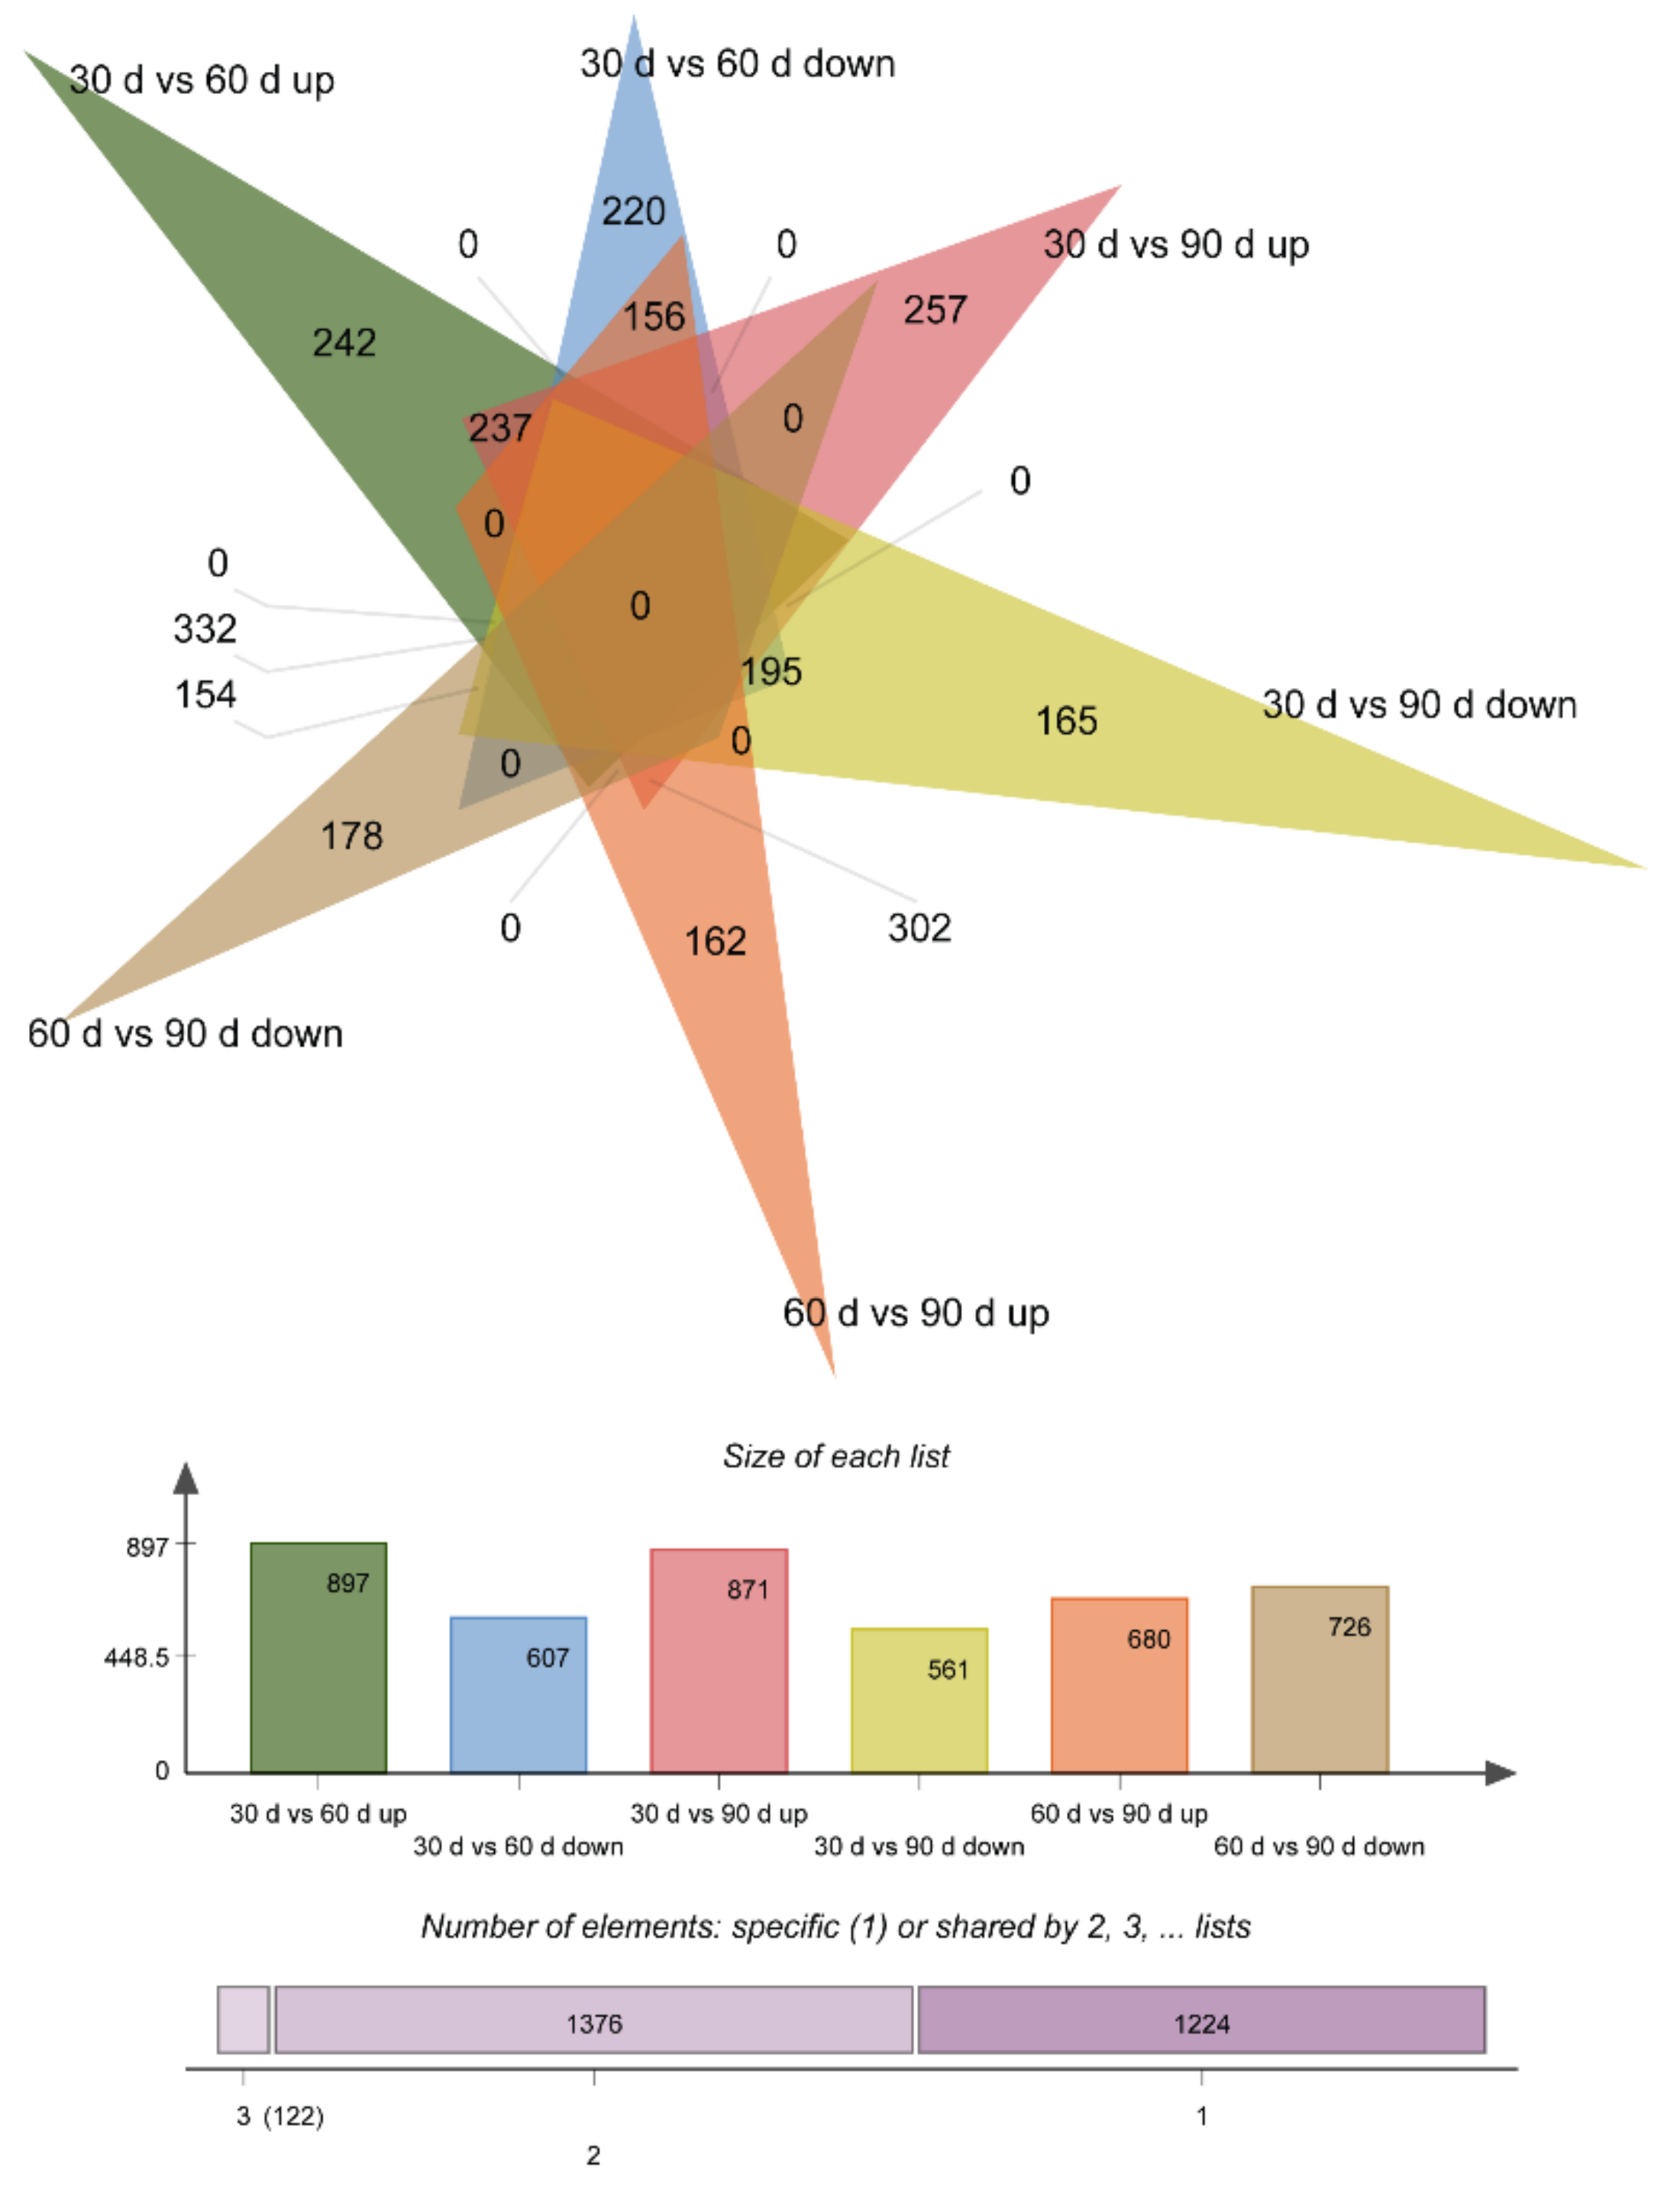
3.3. Differentially Expressed Genes

Gene expression levels were calculated according to FPKM arithmetic; FDR < 0.01 and |log2 (foldchange)| ≥ 2 were set as the threshold for significantly differential expression. Finally, we generated 2722 differentially expressed genes (DEGs) among 30 d, 60 d, and 90 d libraries. Of these, 122 DEGs were co-expressed in the three libraries, 1504 DEGs in 30 d vs. 60 d (897 upregulated and 607 downregulated), 1432 DEGs in 30 d vs. 90 d (871 upregulated and 561 downregulated), and 1406 DEGs in 60 d vs. 90 d (680 upregulated and 726 downregulated) (Figure 1 and Figure 2).

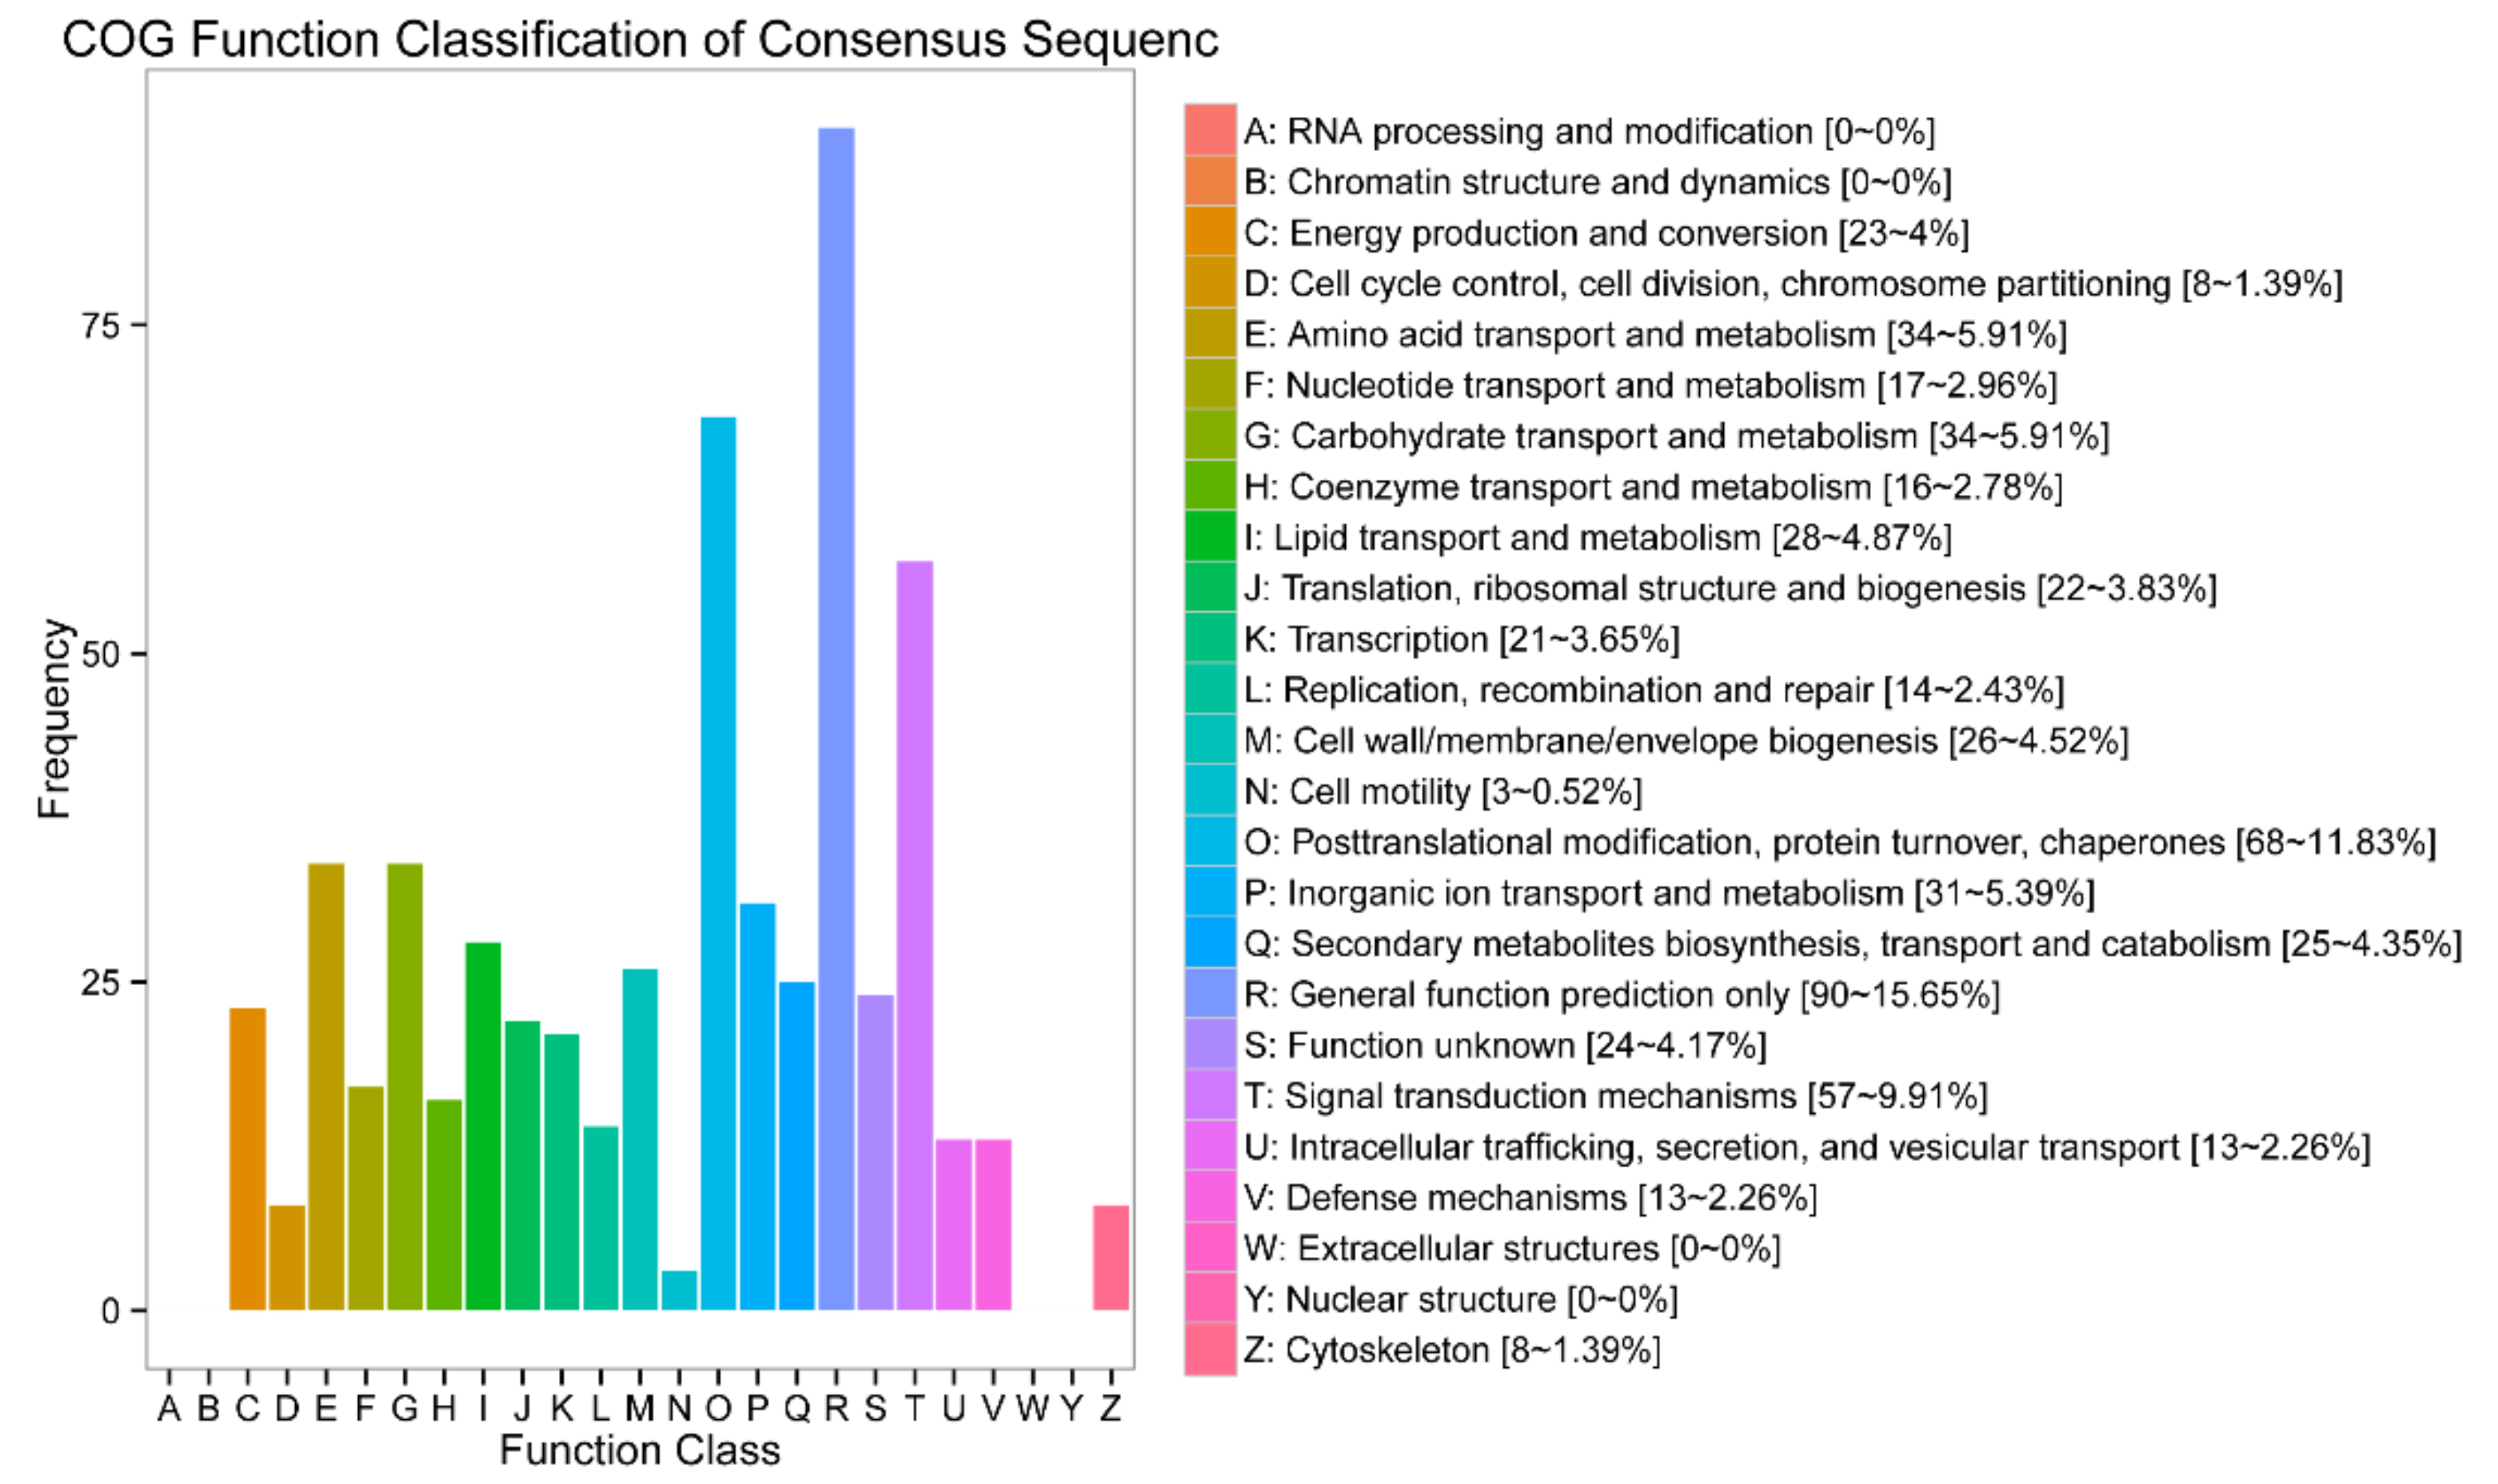
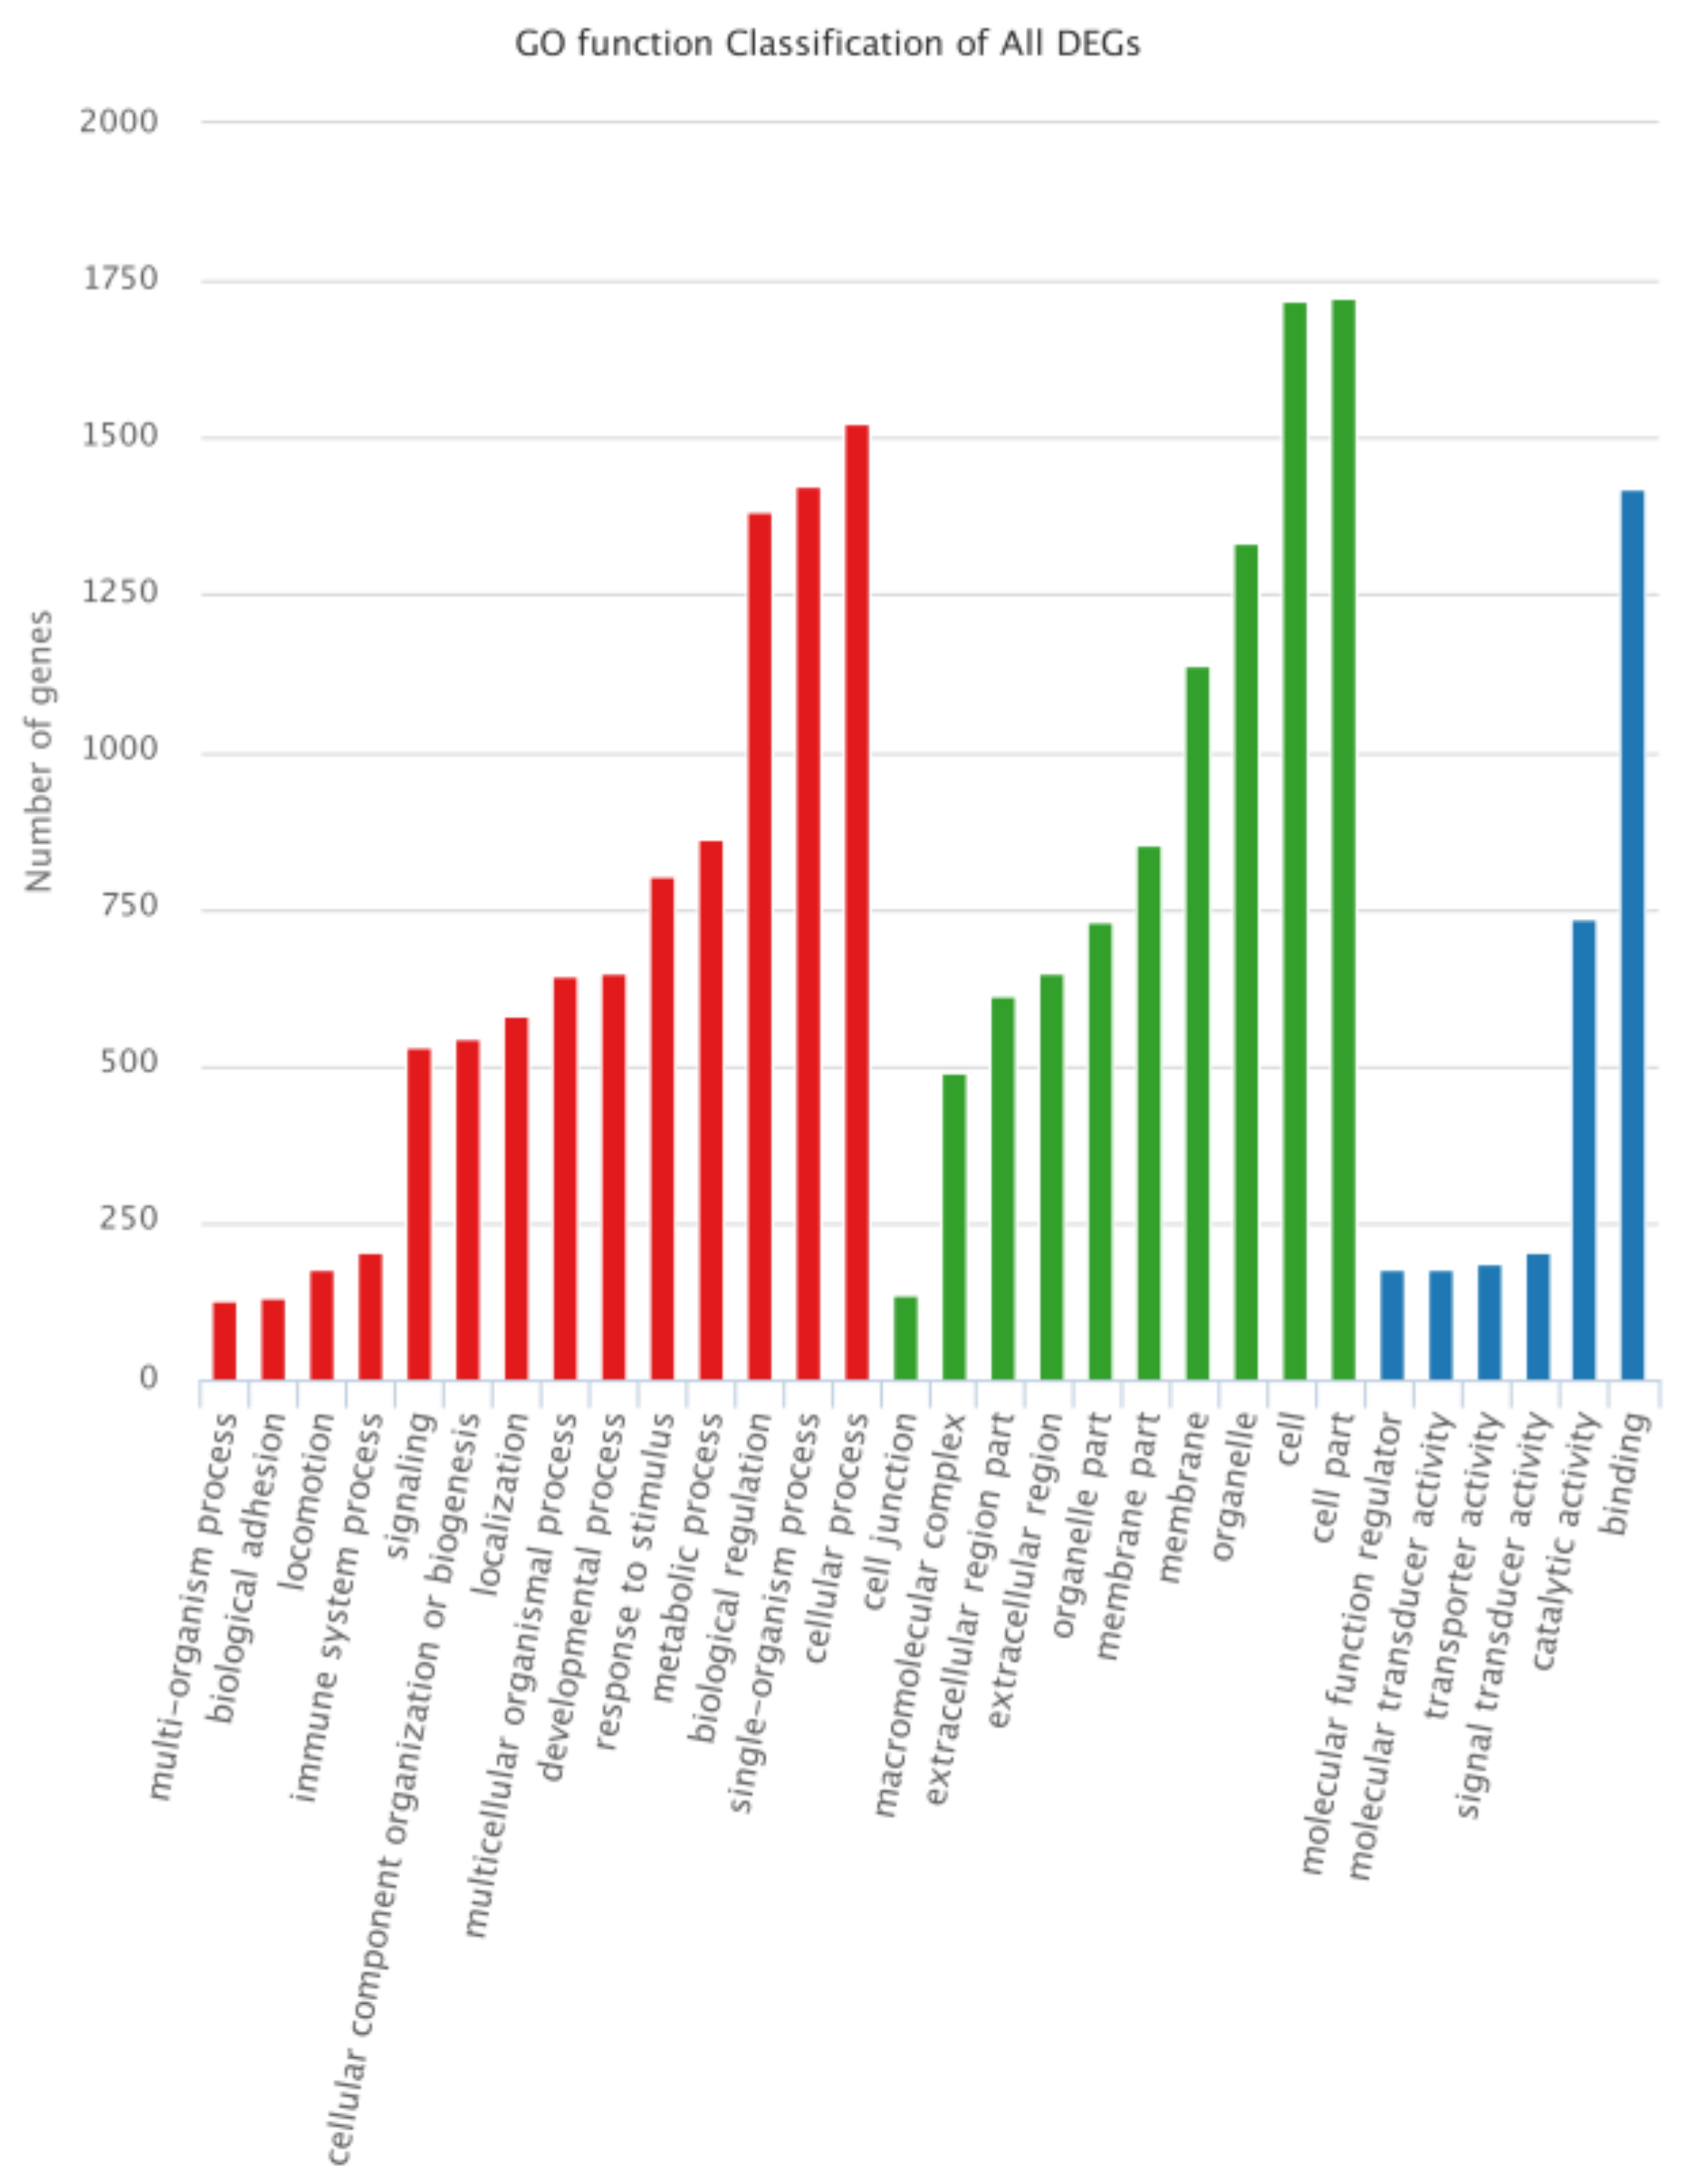
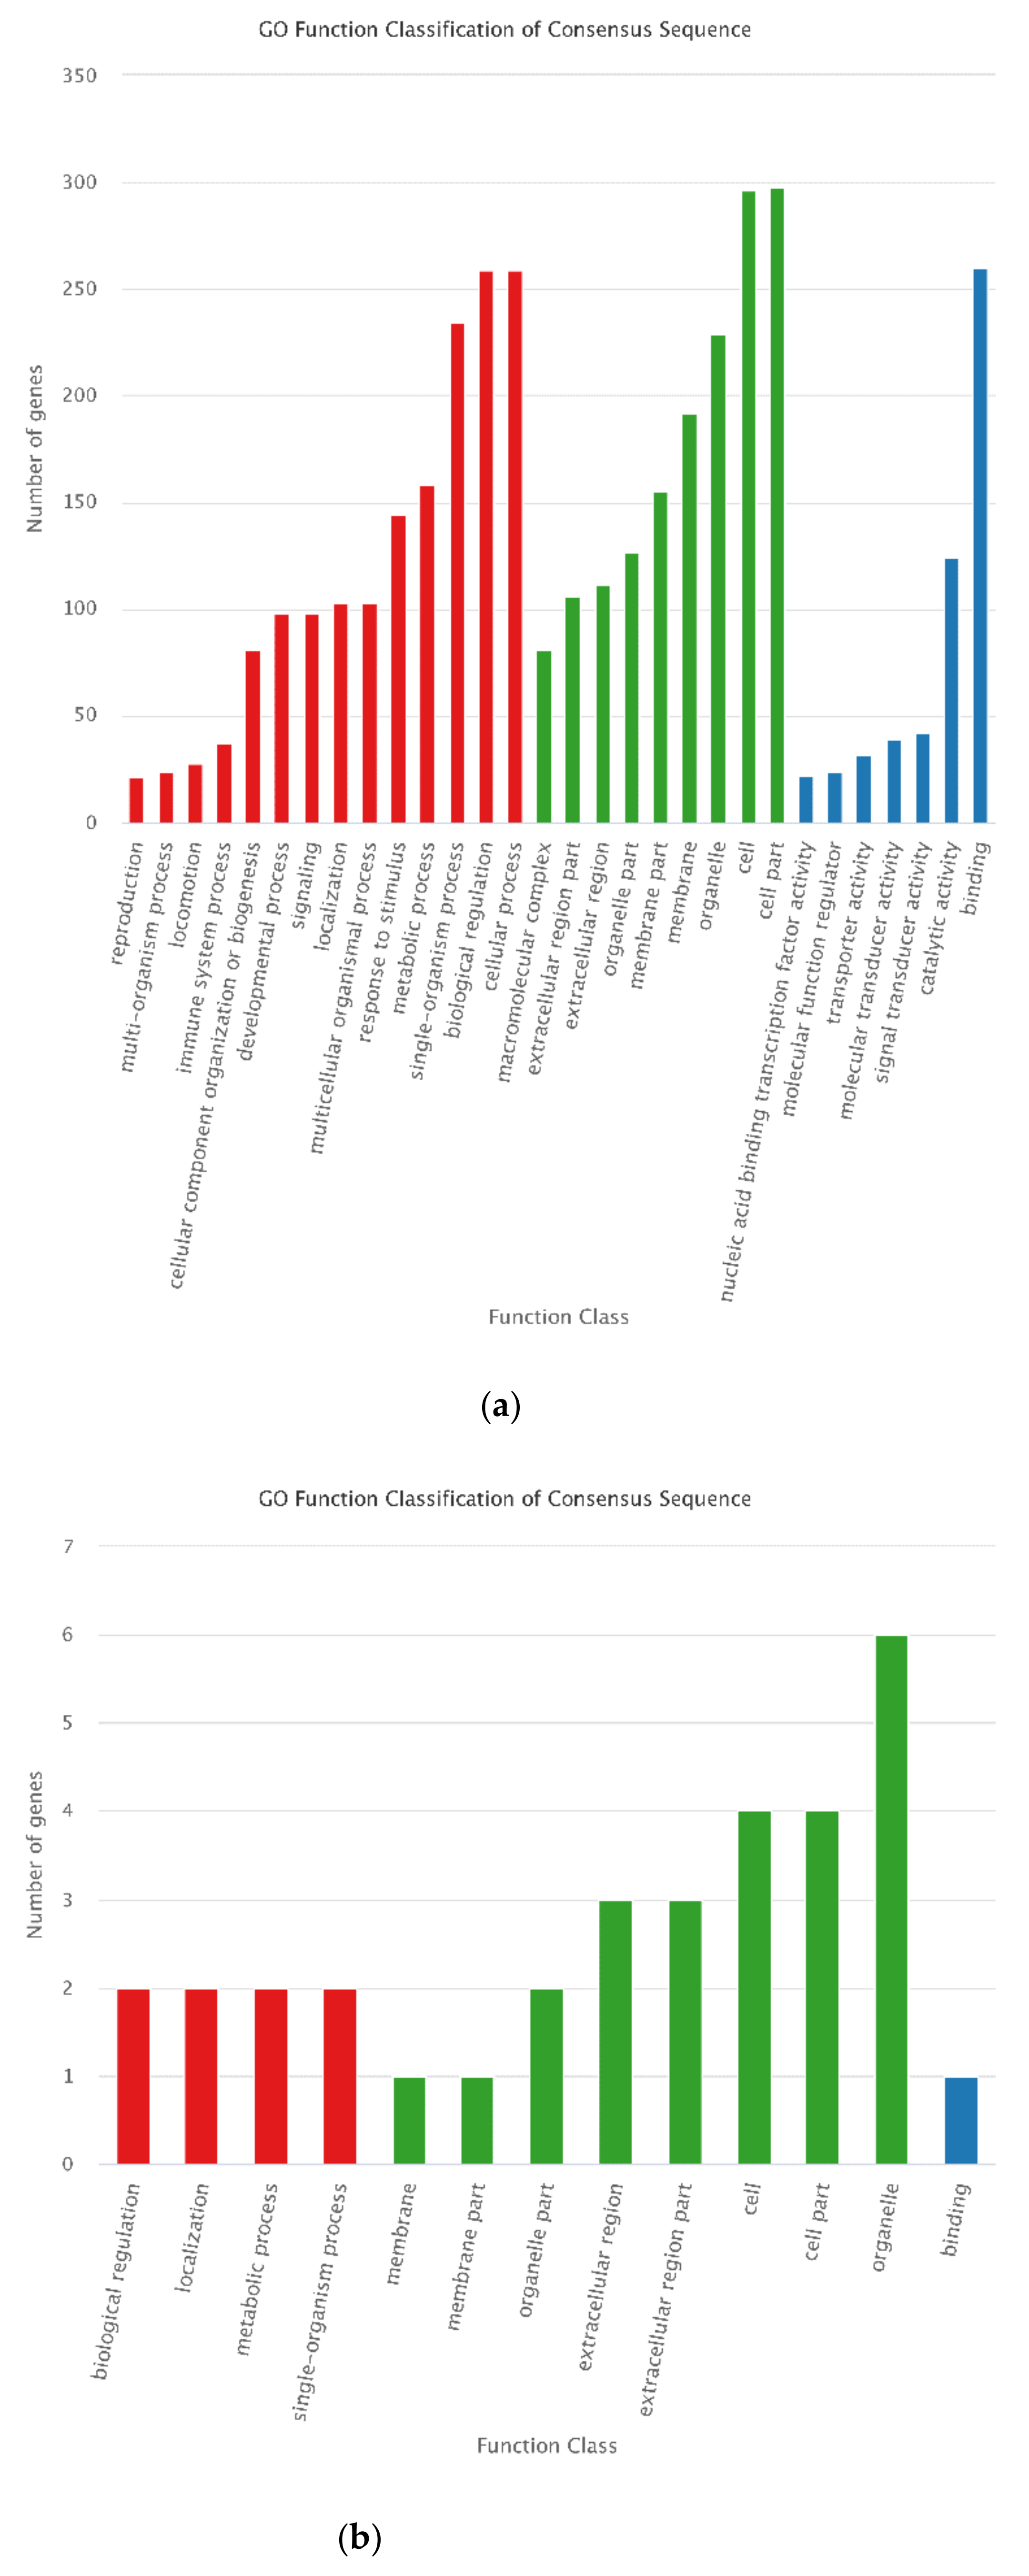
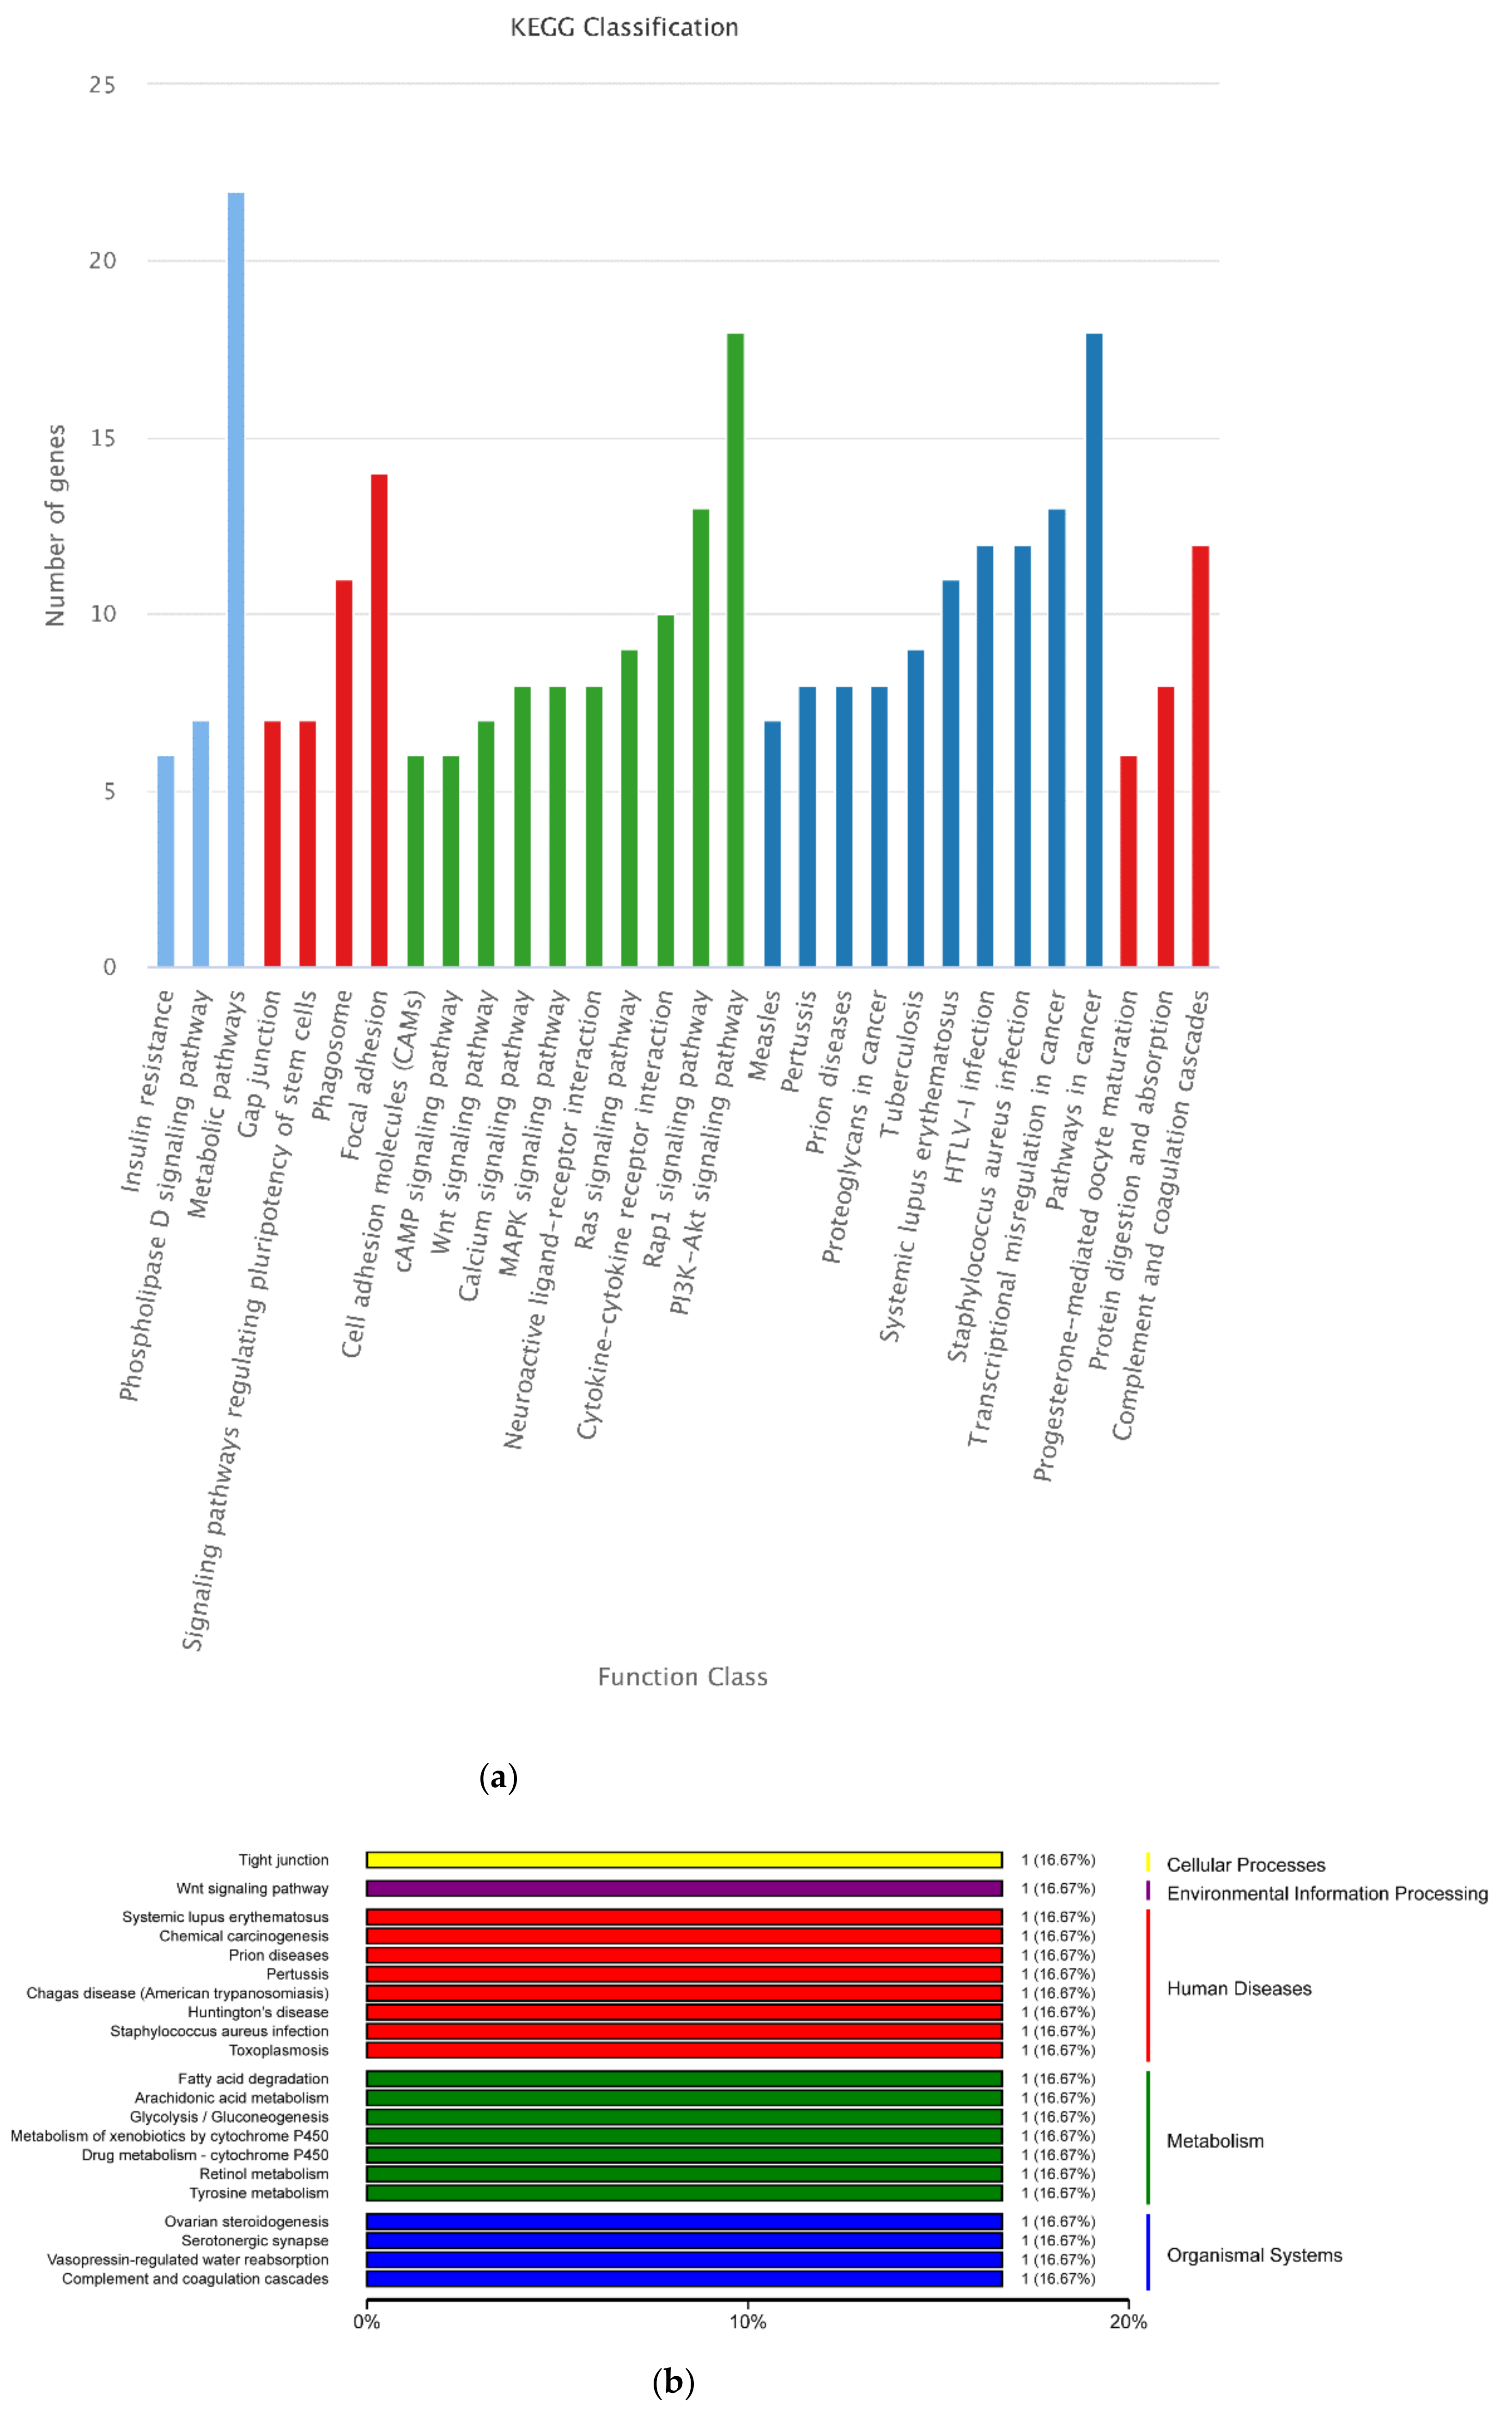
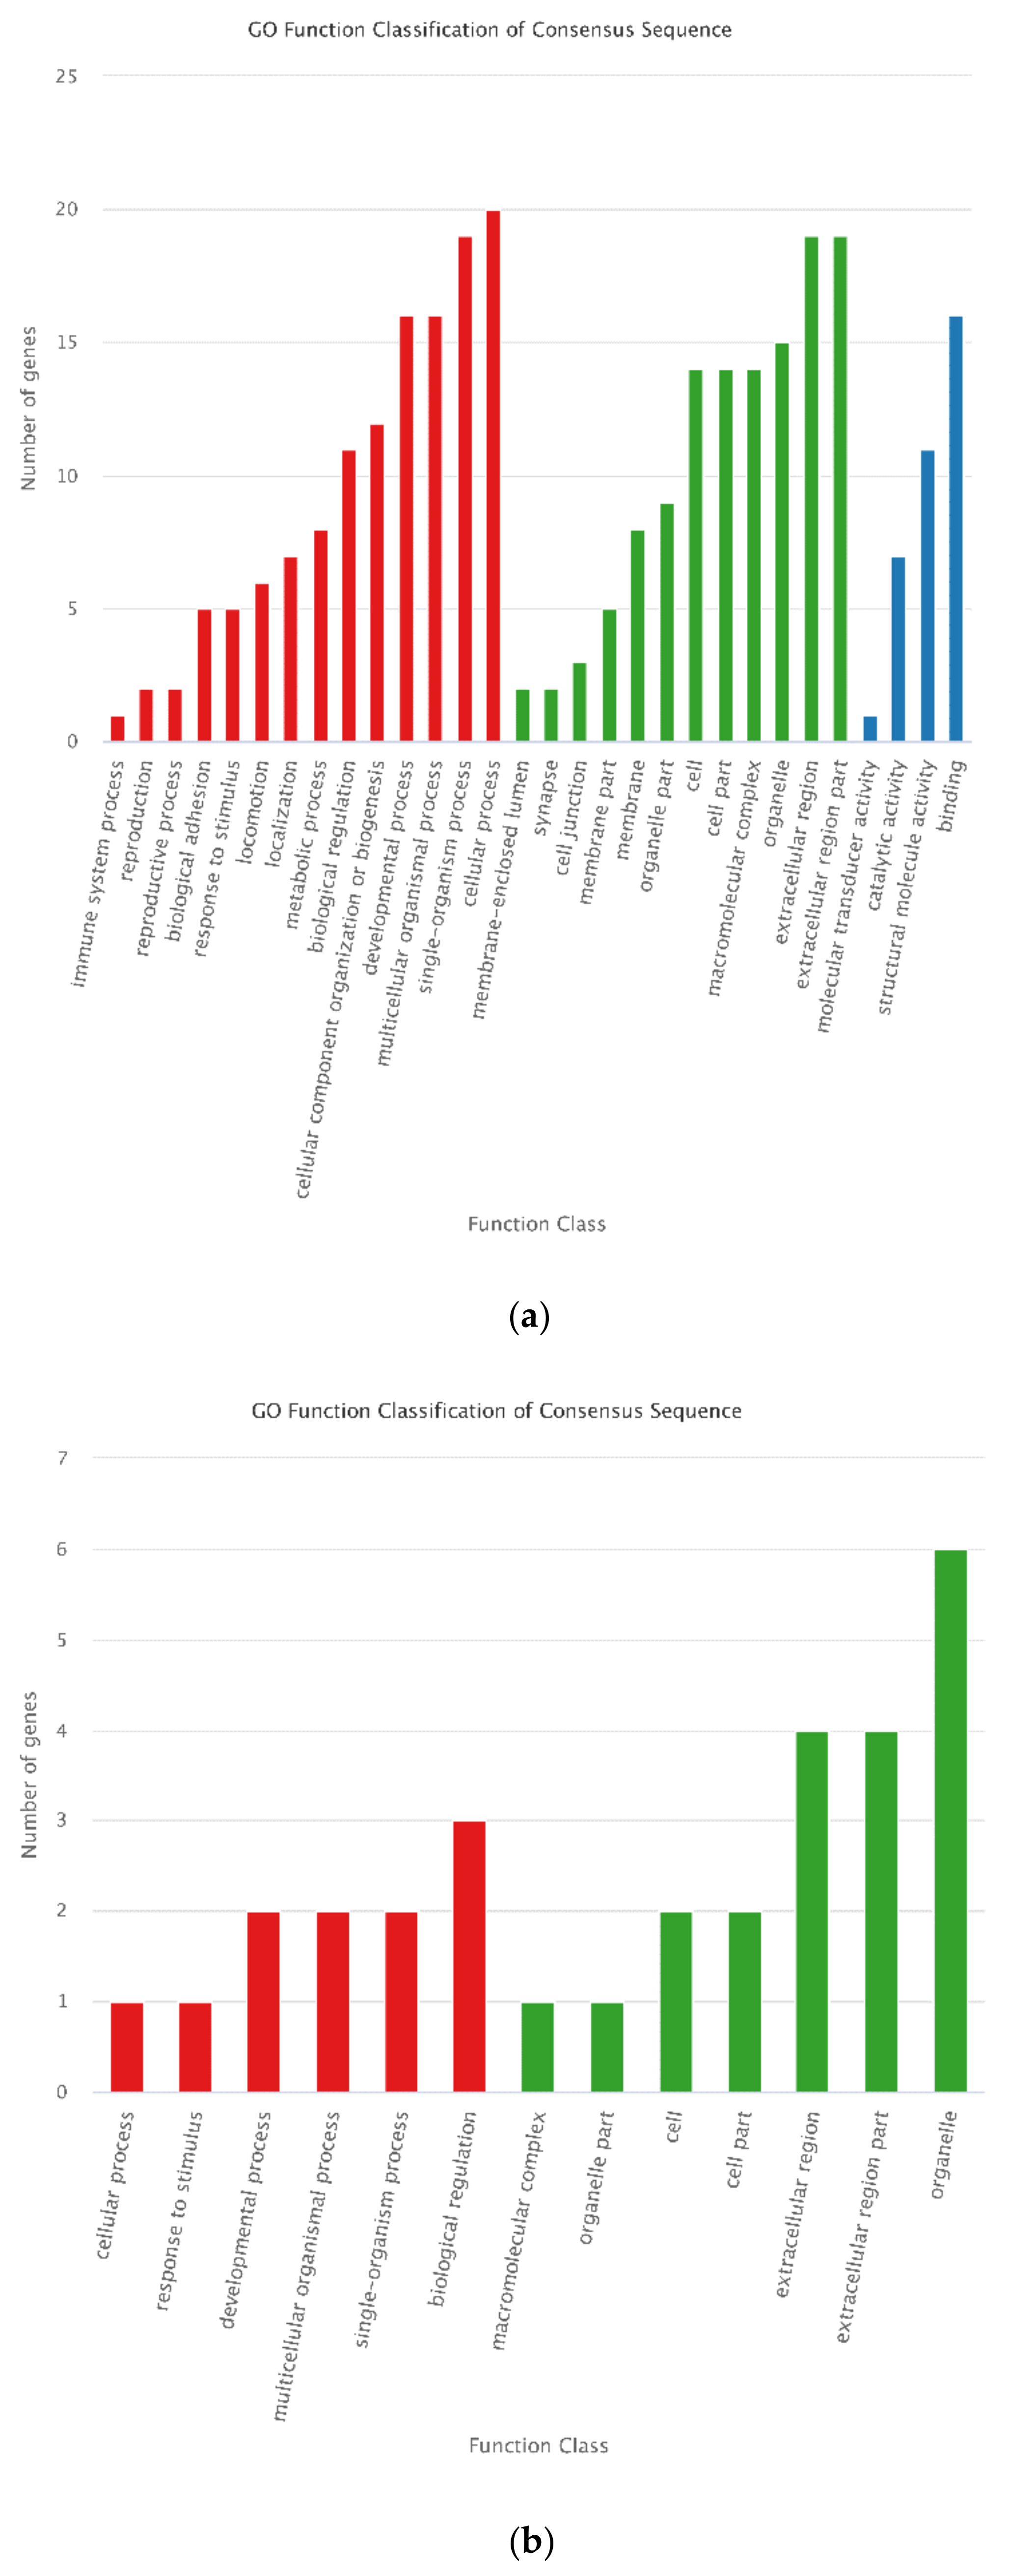
3.4. Functional Annotation of DEGs

Basic Local Aalignment Search Tool (BLAST) [30] software was used to align DEGs to COG [23], GO [24], and KEGG [25] databases using an E value cut-off of 10−5. The results indicated that among 2722 DEGs, 2290 were annotated against the GO database, 1705 against the KEGG database, and 529 against the COG database. Annotation of DEGs showed that 529 DEGs were predicted and classified into 25 functional categories after COG annotation (Figure 3). Most DEGs were classified into “R: General function prediction only,” followed by “O: Posttranslational modification, protein turnover, chaperones” and “T: Signal transduction mechanisms”.
In the GO annotation (Figure 4), “cellular process” (1525 DEGs), “single-organism process” (1425 DEGs), and “biological regulation” (1385 DEGs) were dominant in the biological process category; “cell part” (1722 DEGs), “cell” (1718 DEGs), “organelle” (1335 DEGs), and “membrane” (1139 DEGs) were dominant in the cellular component category, and “binding” (1418 DEGs) and “catalytic activity” (736 DEGs) were dominant in the molecular function category.
According to the KEGG annotation results (Supplementary Figures S1), the most classifications include “Pathway in cancer” (82 DEGs), “P13K-Akt signaling pathway” (76 DEGs), “Focal adhesion” (54 DEGs), “Rap1 signaling pathway” (53 DEGs), “HTLV-I infection” (51 DEGs), “Protein digestion and absorption” (51 DEGs), “Axon guidance” (51 DEGs), and “Proteoglycans in cancer” (50 DEGs).
The KEGG analysis showed that DEGs were mainly associated with the “Pathways in cancer” and “PI3K-Akt signaling pathway”, followed by pathways of “Proteoglycans in cancer”, “Rap 1 signaling pathway”, “Axon guidance” and “Protein digestion and absorption” (Figure 5).
In addition, GO and KEGG annotations for DEGs in the comparisons of 30 d vs. 60 d, 30 d vs. 90 d, and 60 d vs. 90 d were also performed (Supplementary Figures S2 and S3).

3.5. Antler Proteins Revealed by iTRAQ Analysis

Proteome profiles of deer antlers were obtained by using the iTRAQ method. In total, 1540 proteins were identified, and all these proteins were expressed in 30 d, 60 d, and 90 d libraries (Table 2). Of these predicted proteins, 1361 were partially sequenced similar to known proteins, and 179 proteins were predicted as novel proteins.

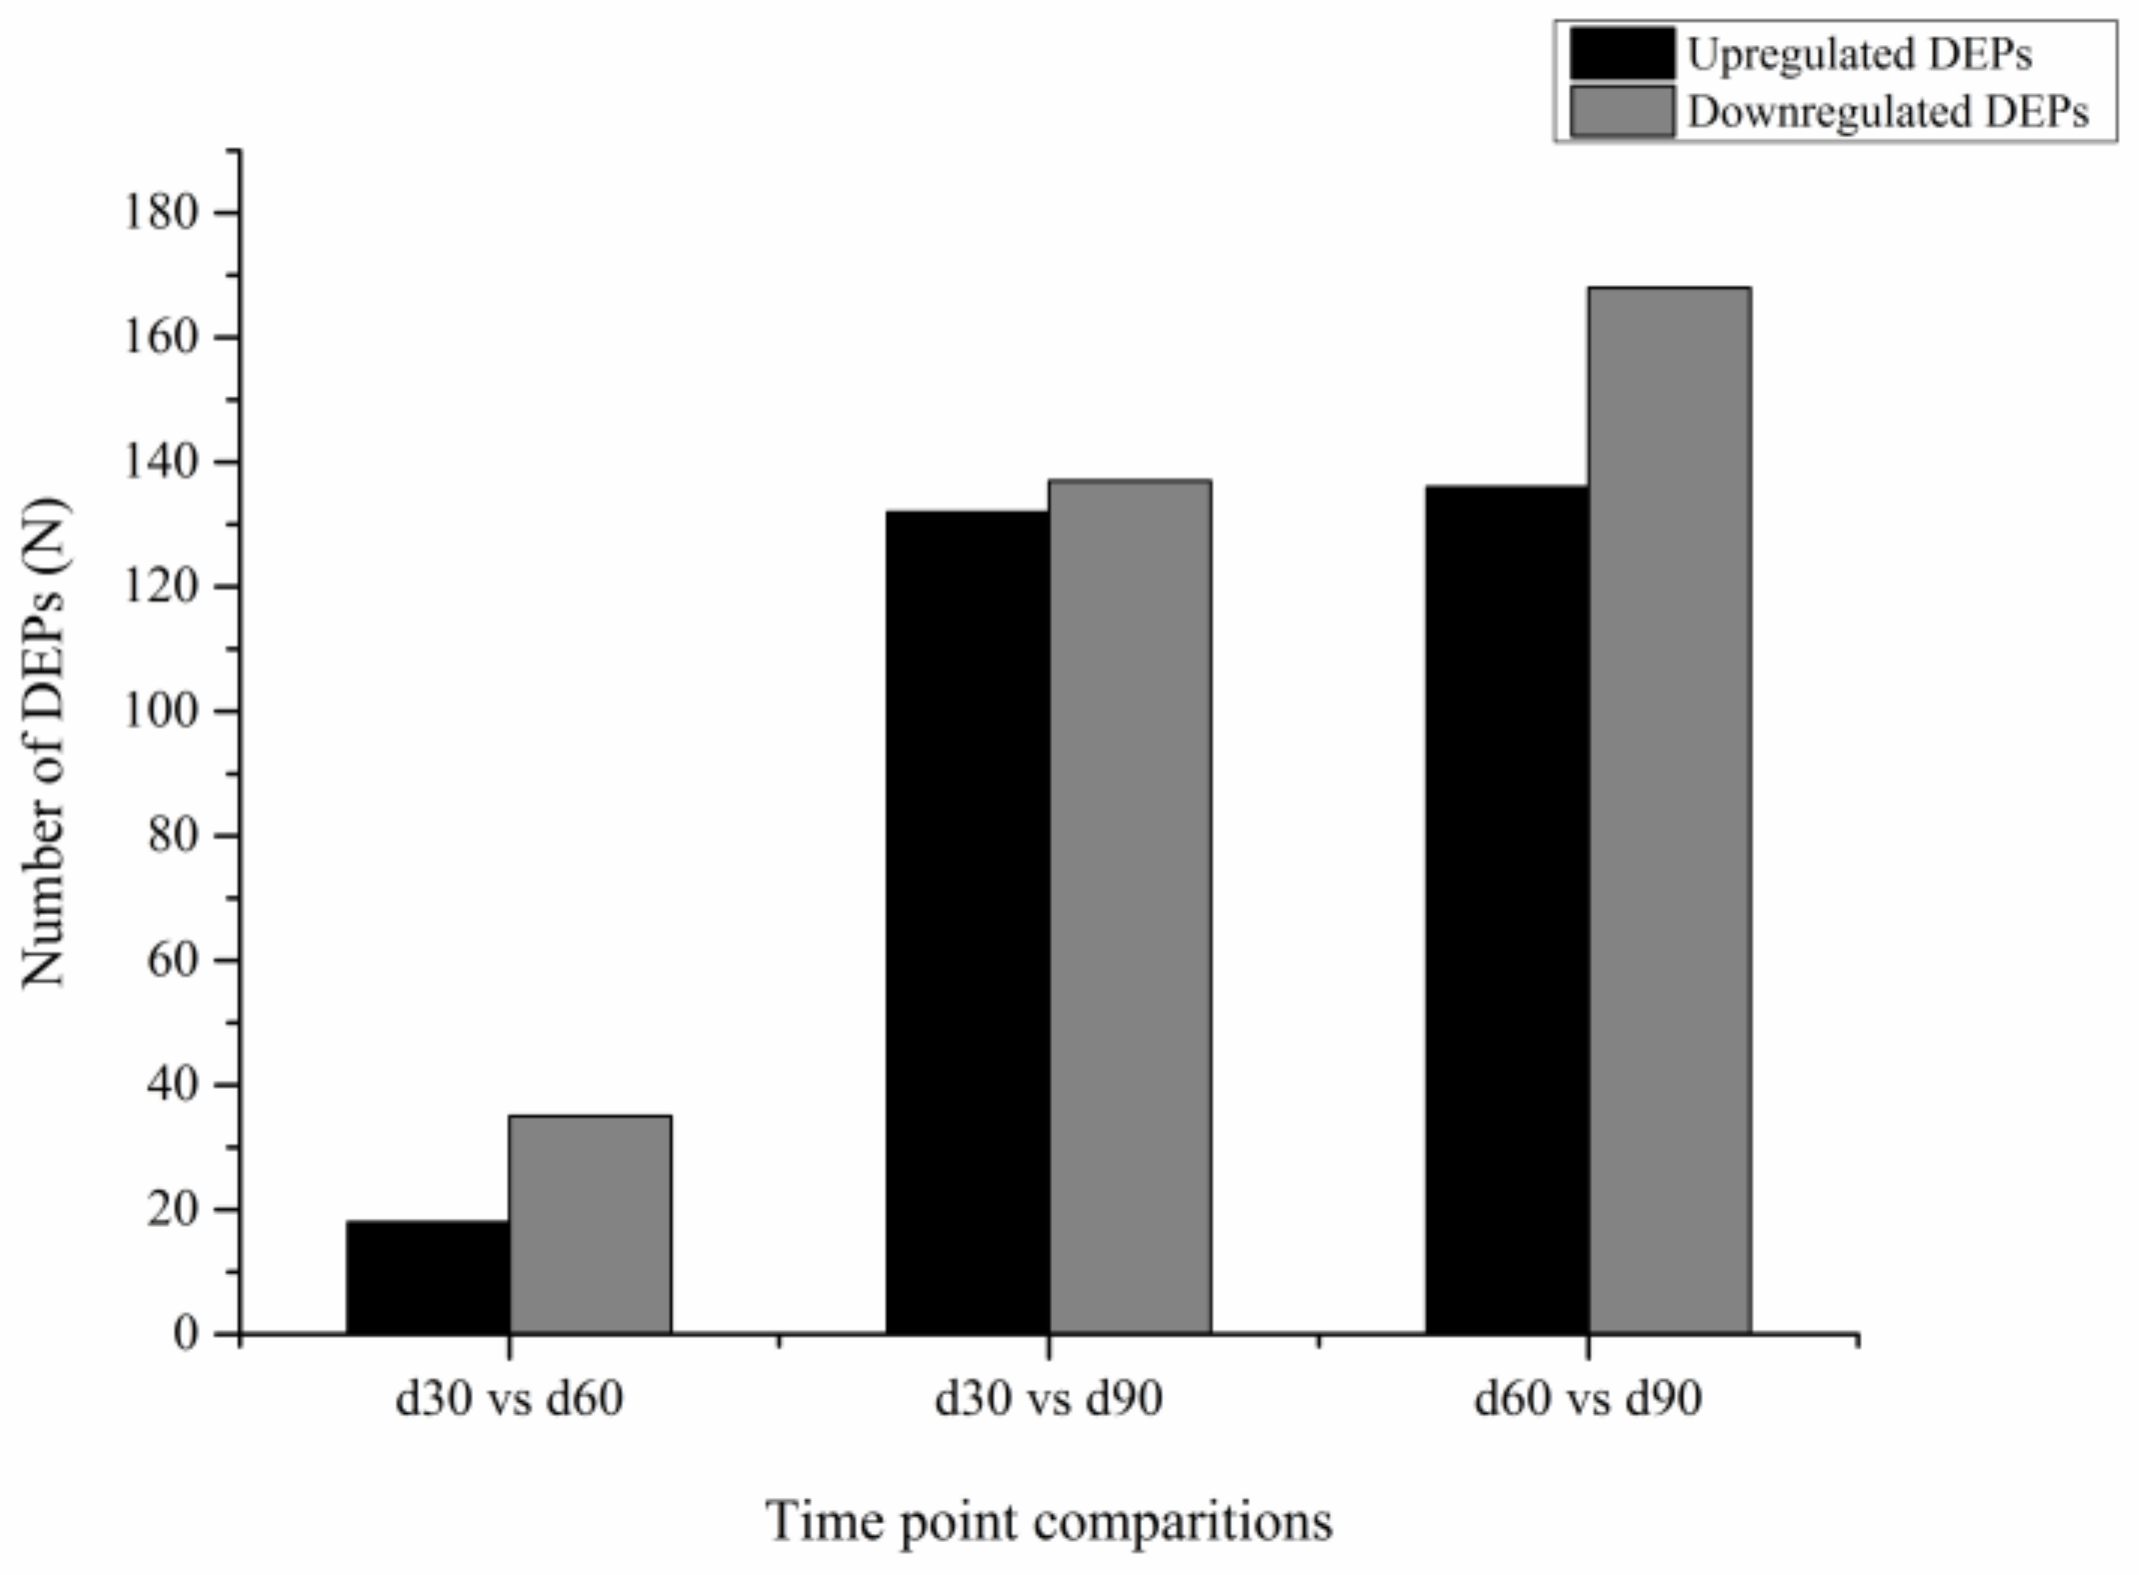
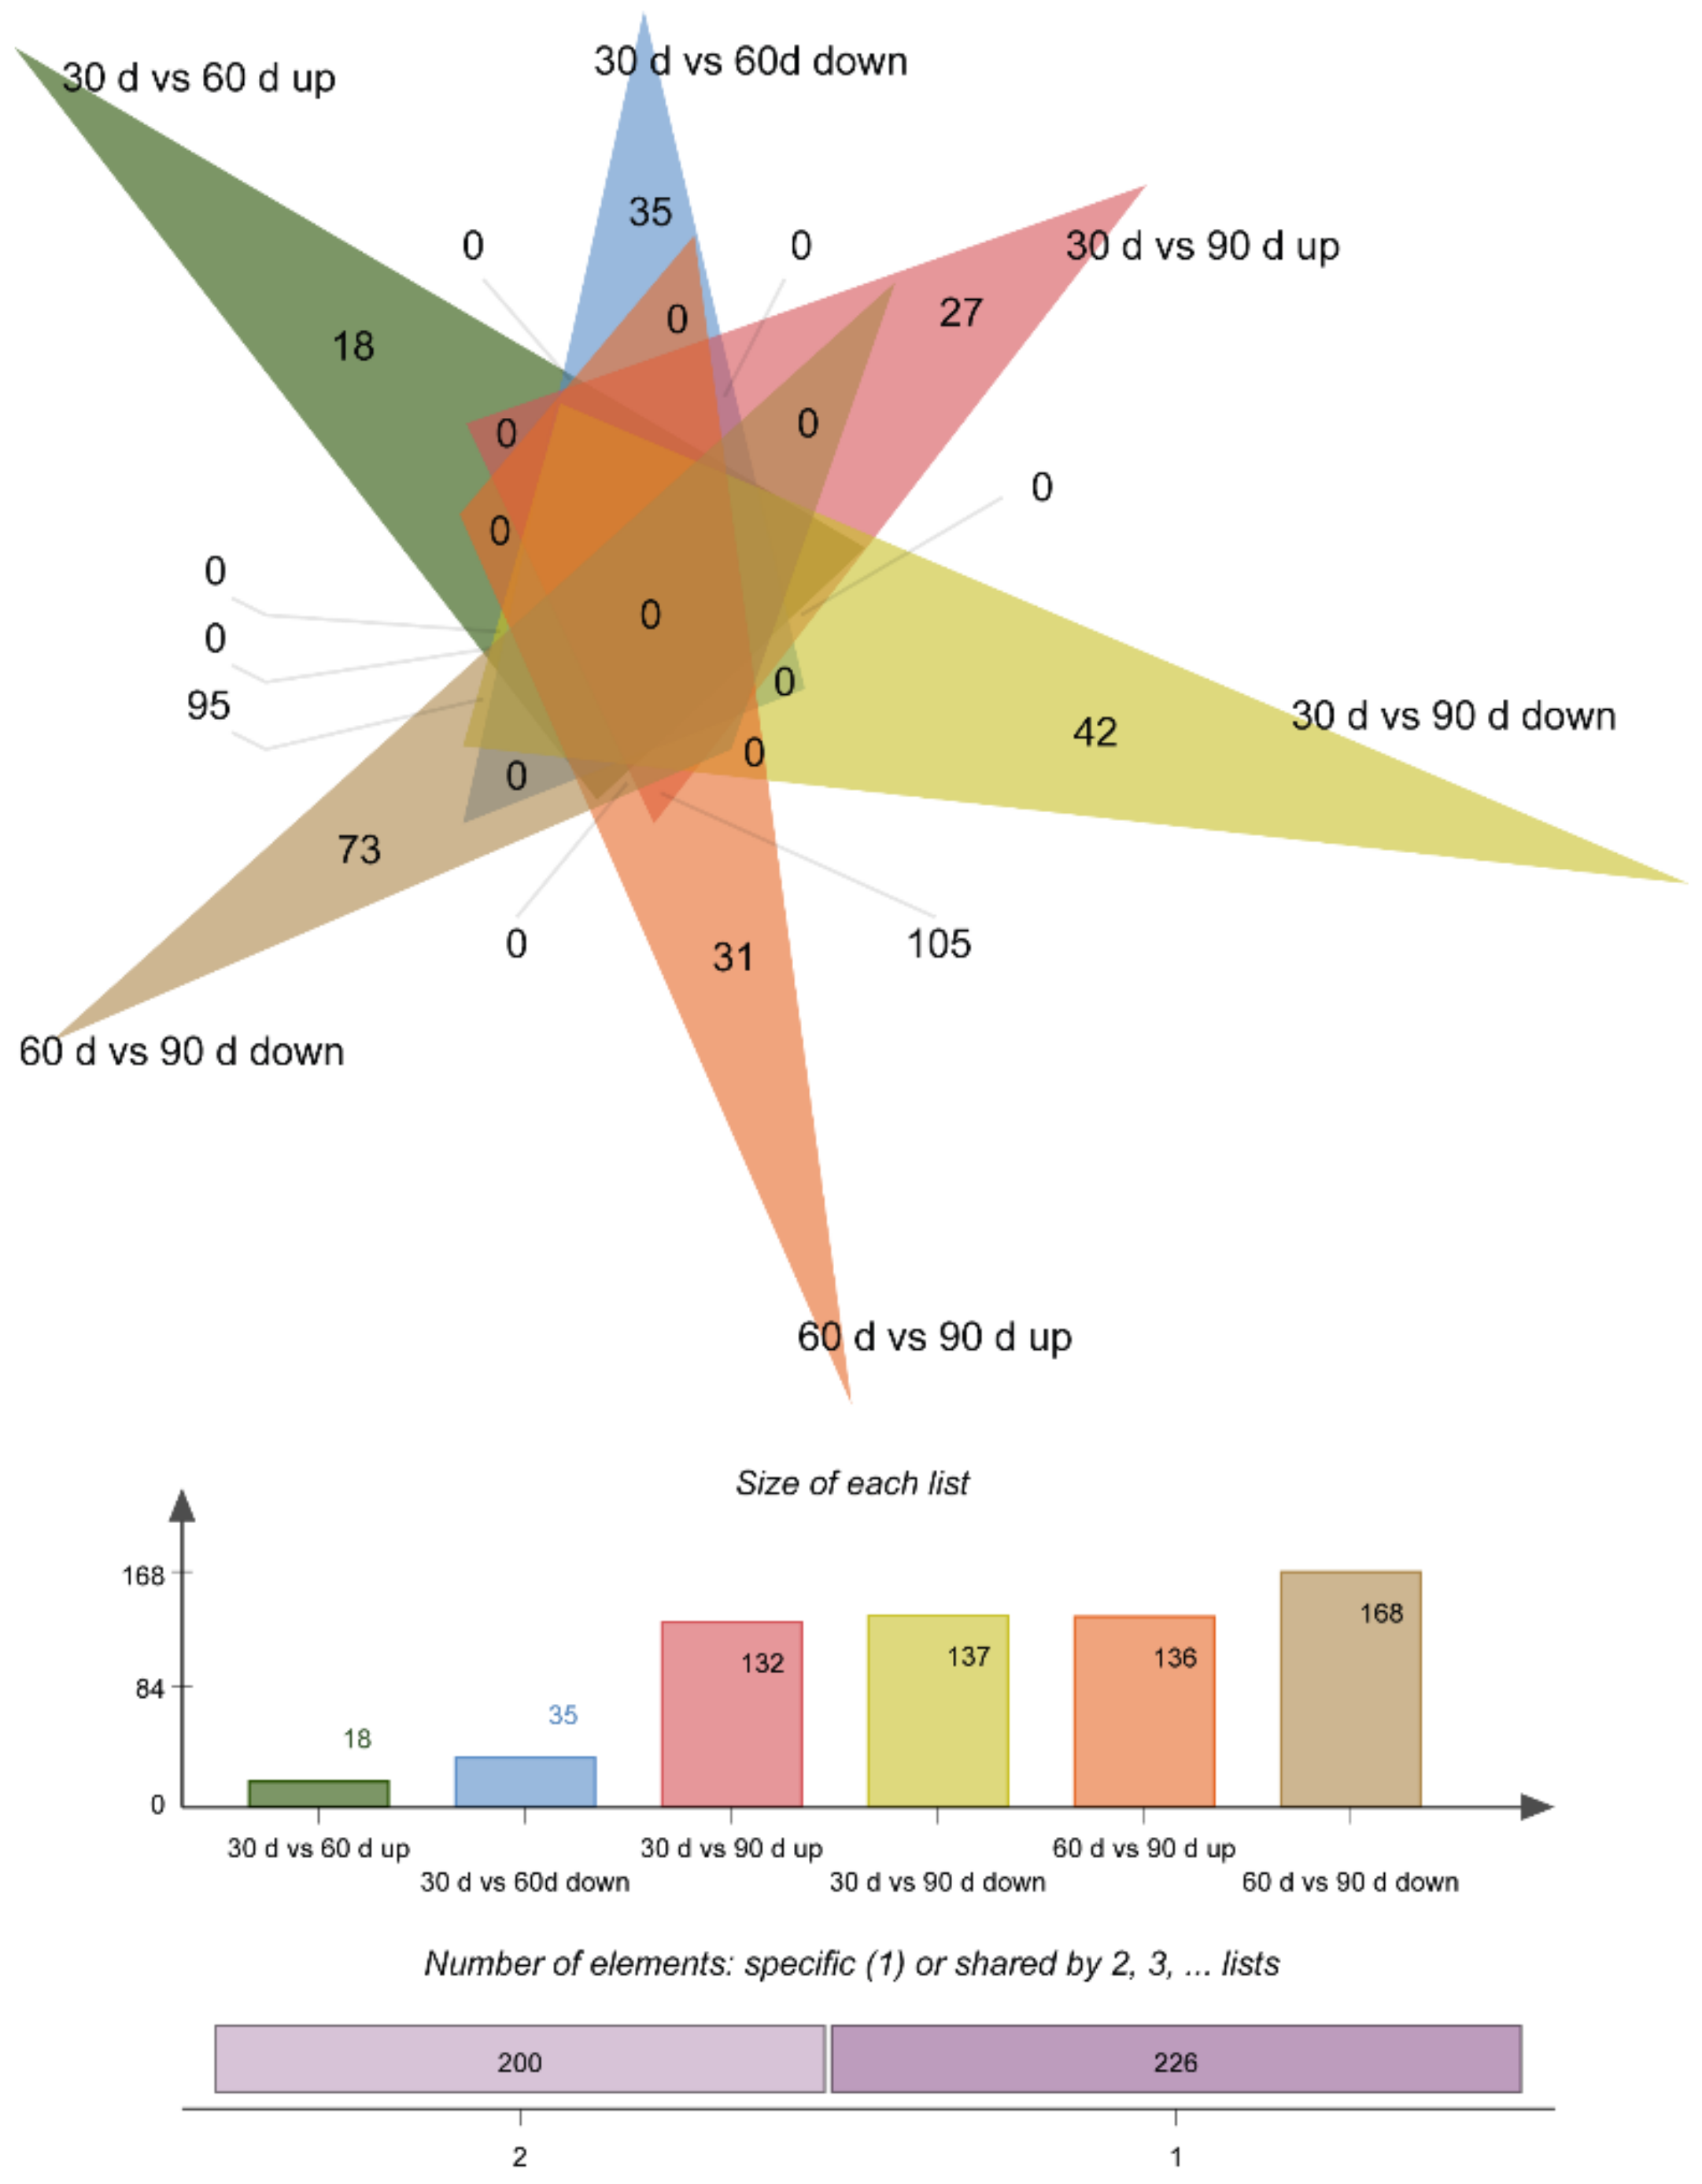
3.6. Differential Expression of Proteins

In total, 382 DEPs were screened in the three comparative analyses, of which 53 DEPs were expressed in 30 d vs. 60 d (18 upregulated and 35 downregulated), 269 DEPs in 30 d vs. 90 d (132 upregulated and 137 downregulated), and 304 DEPs in 60 d vs. 90 d (136 upregulated and 168 downregulated) (Figure 6 and Figure 7).

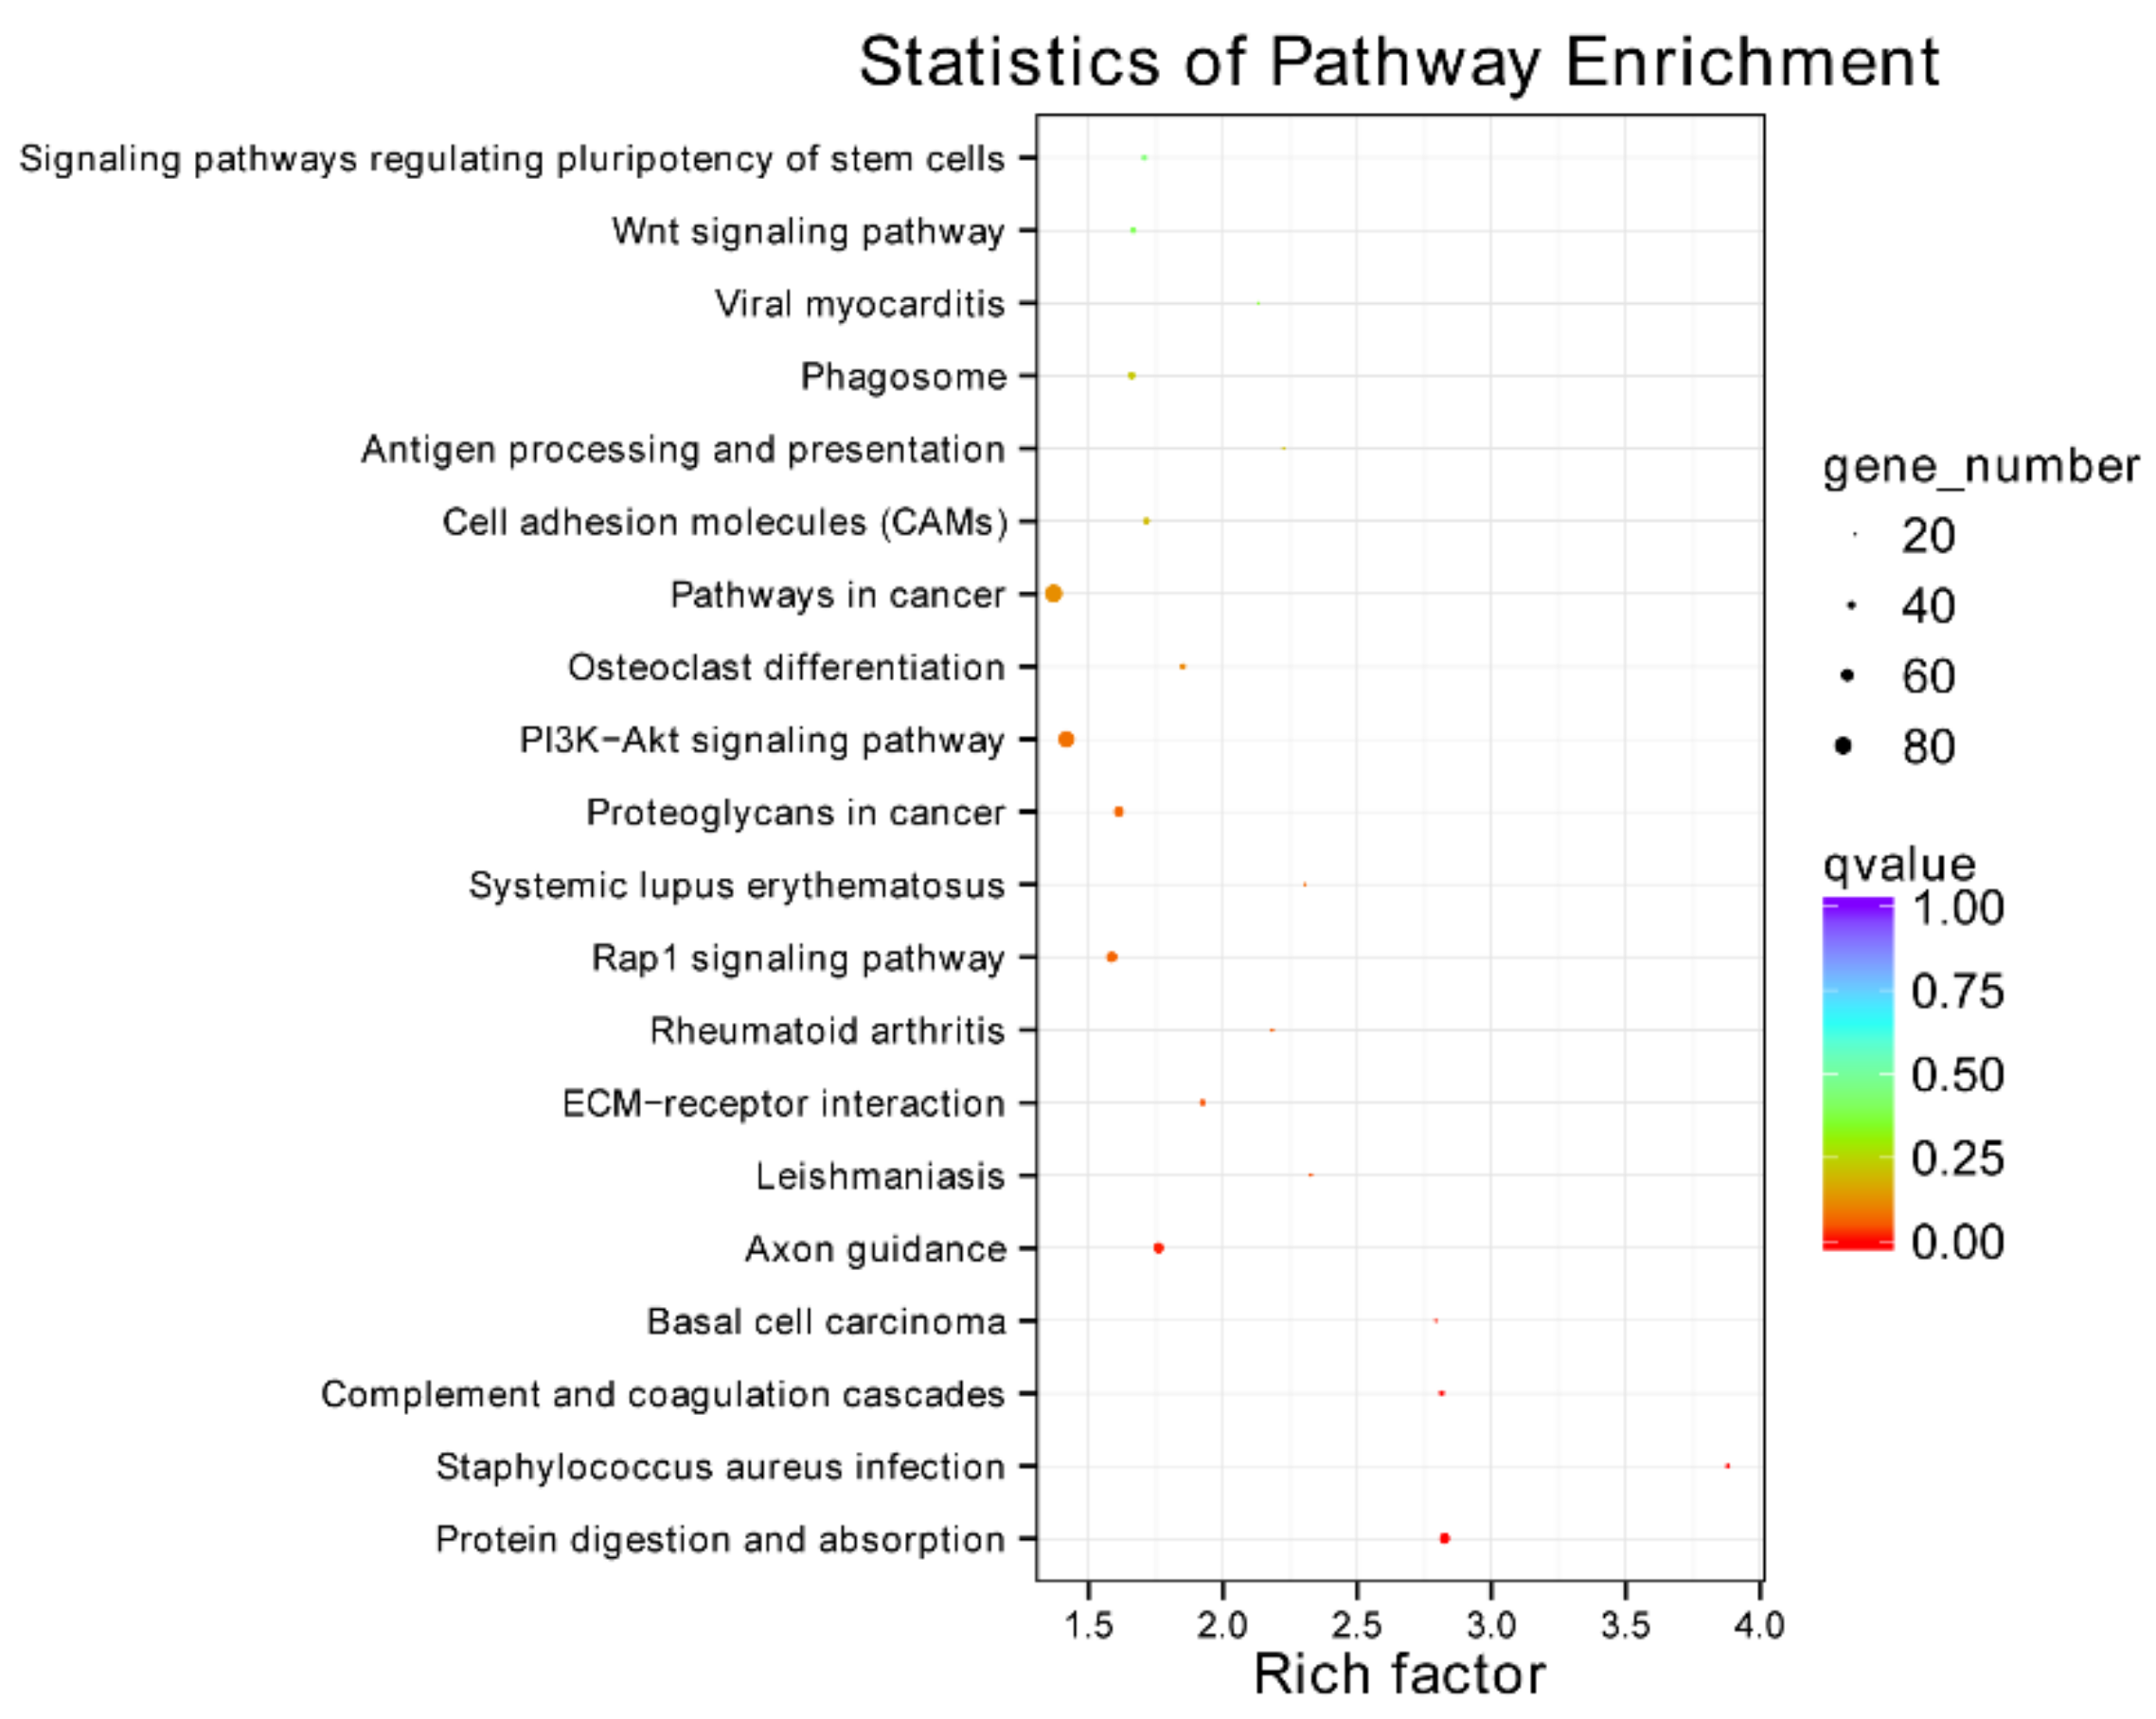
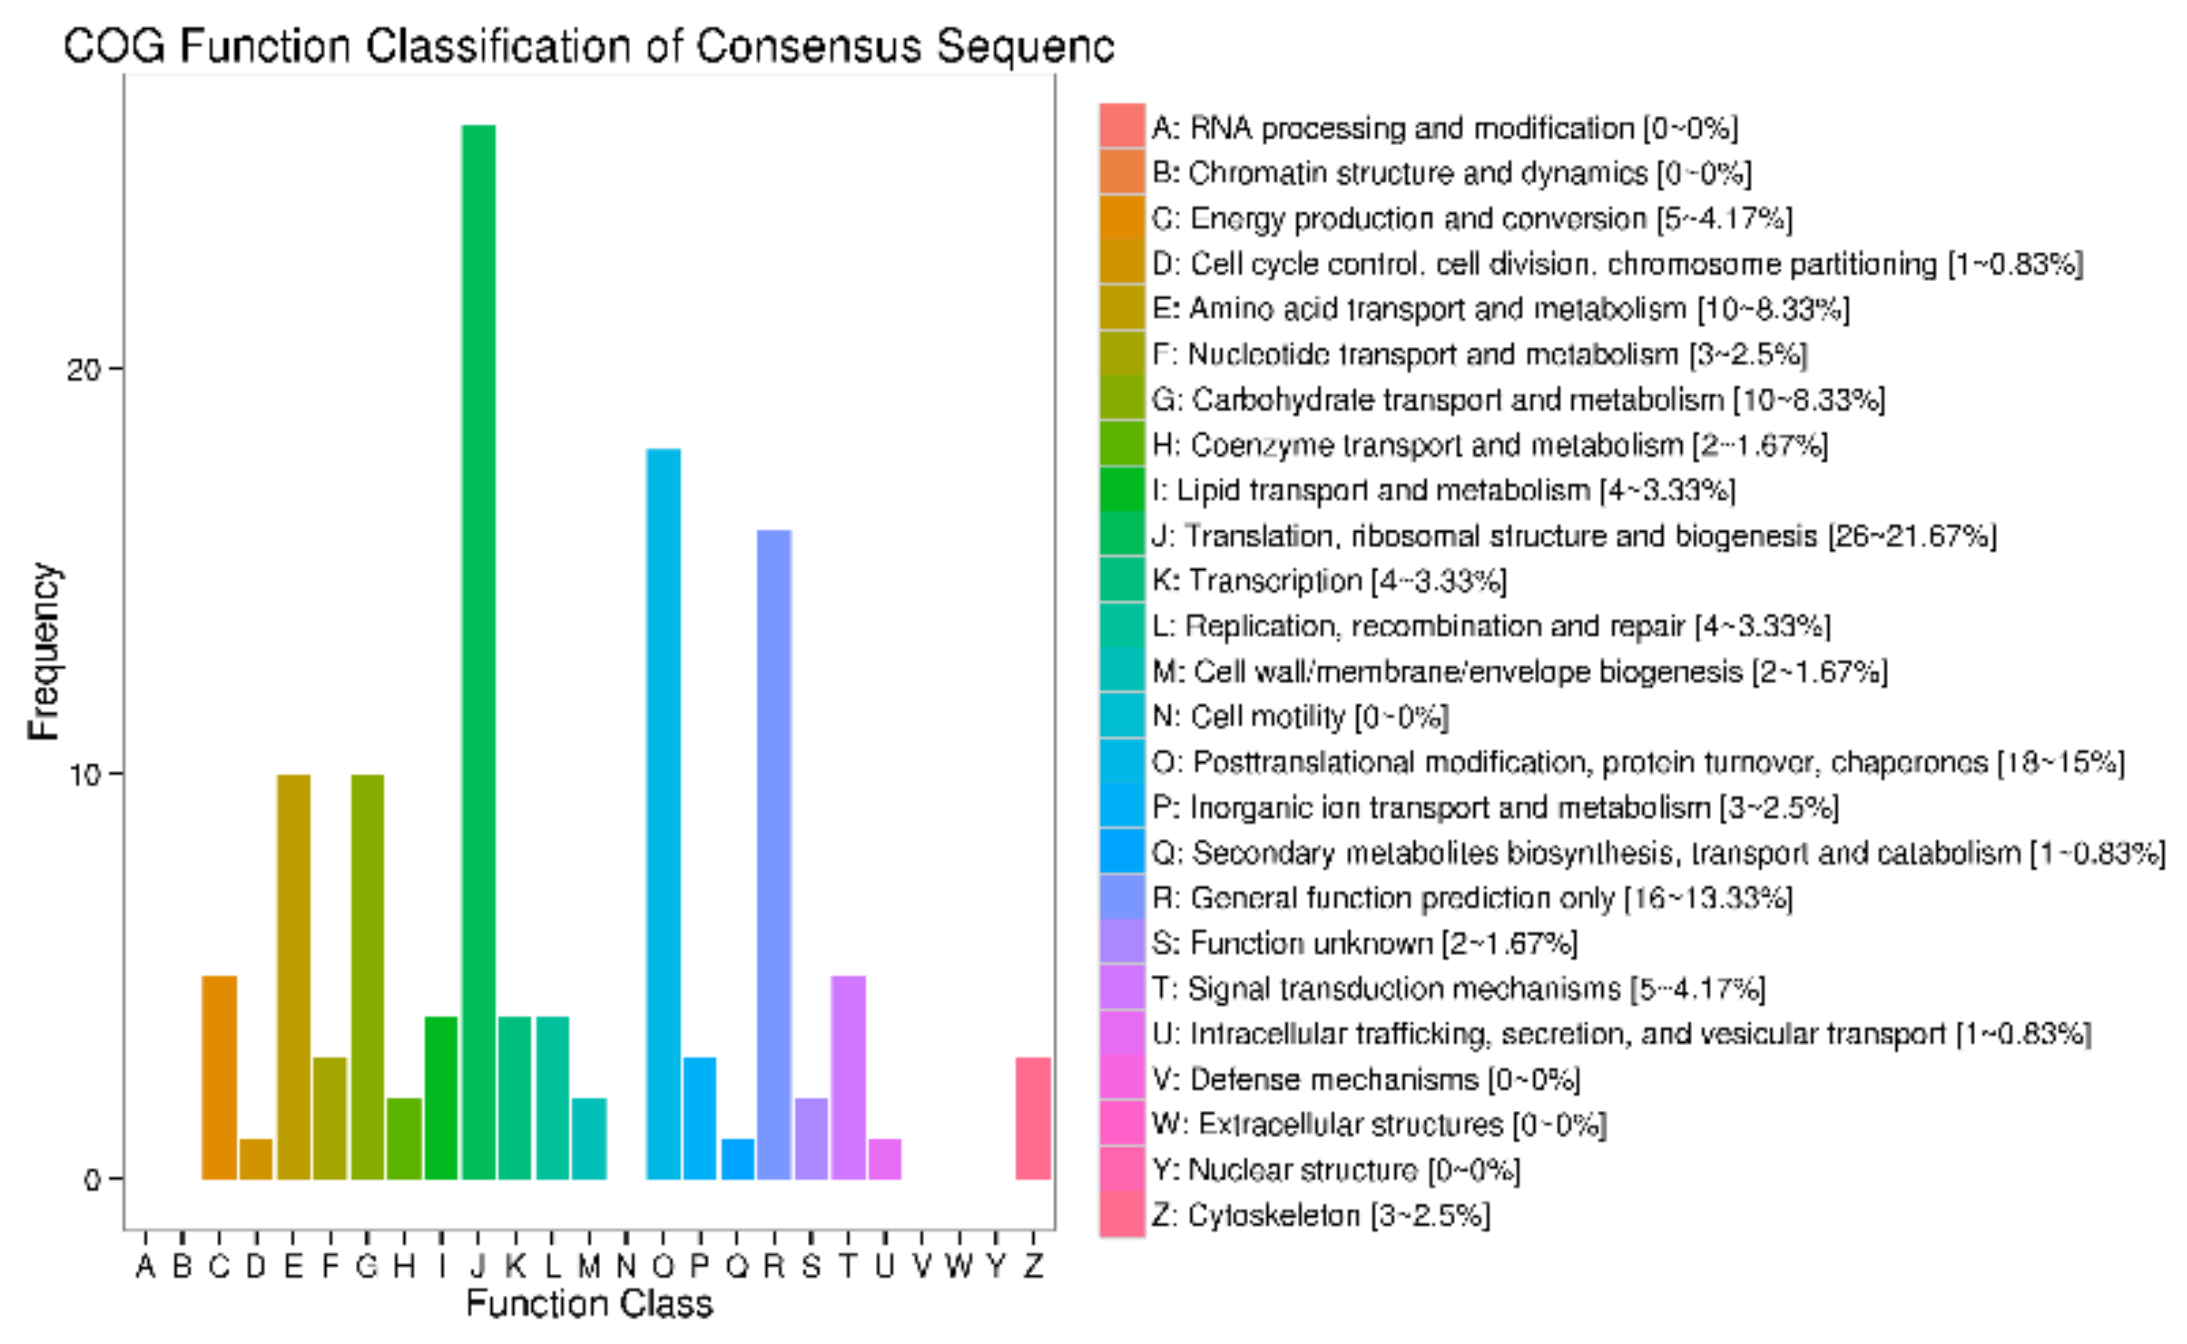
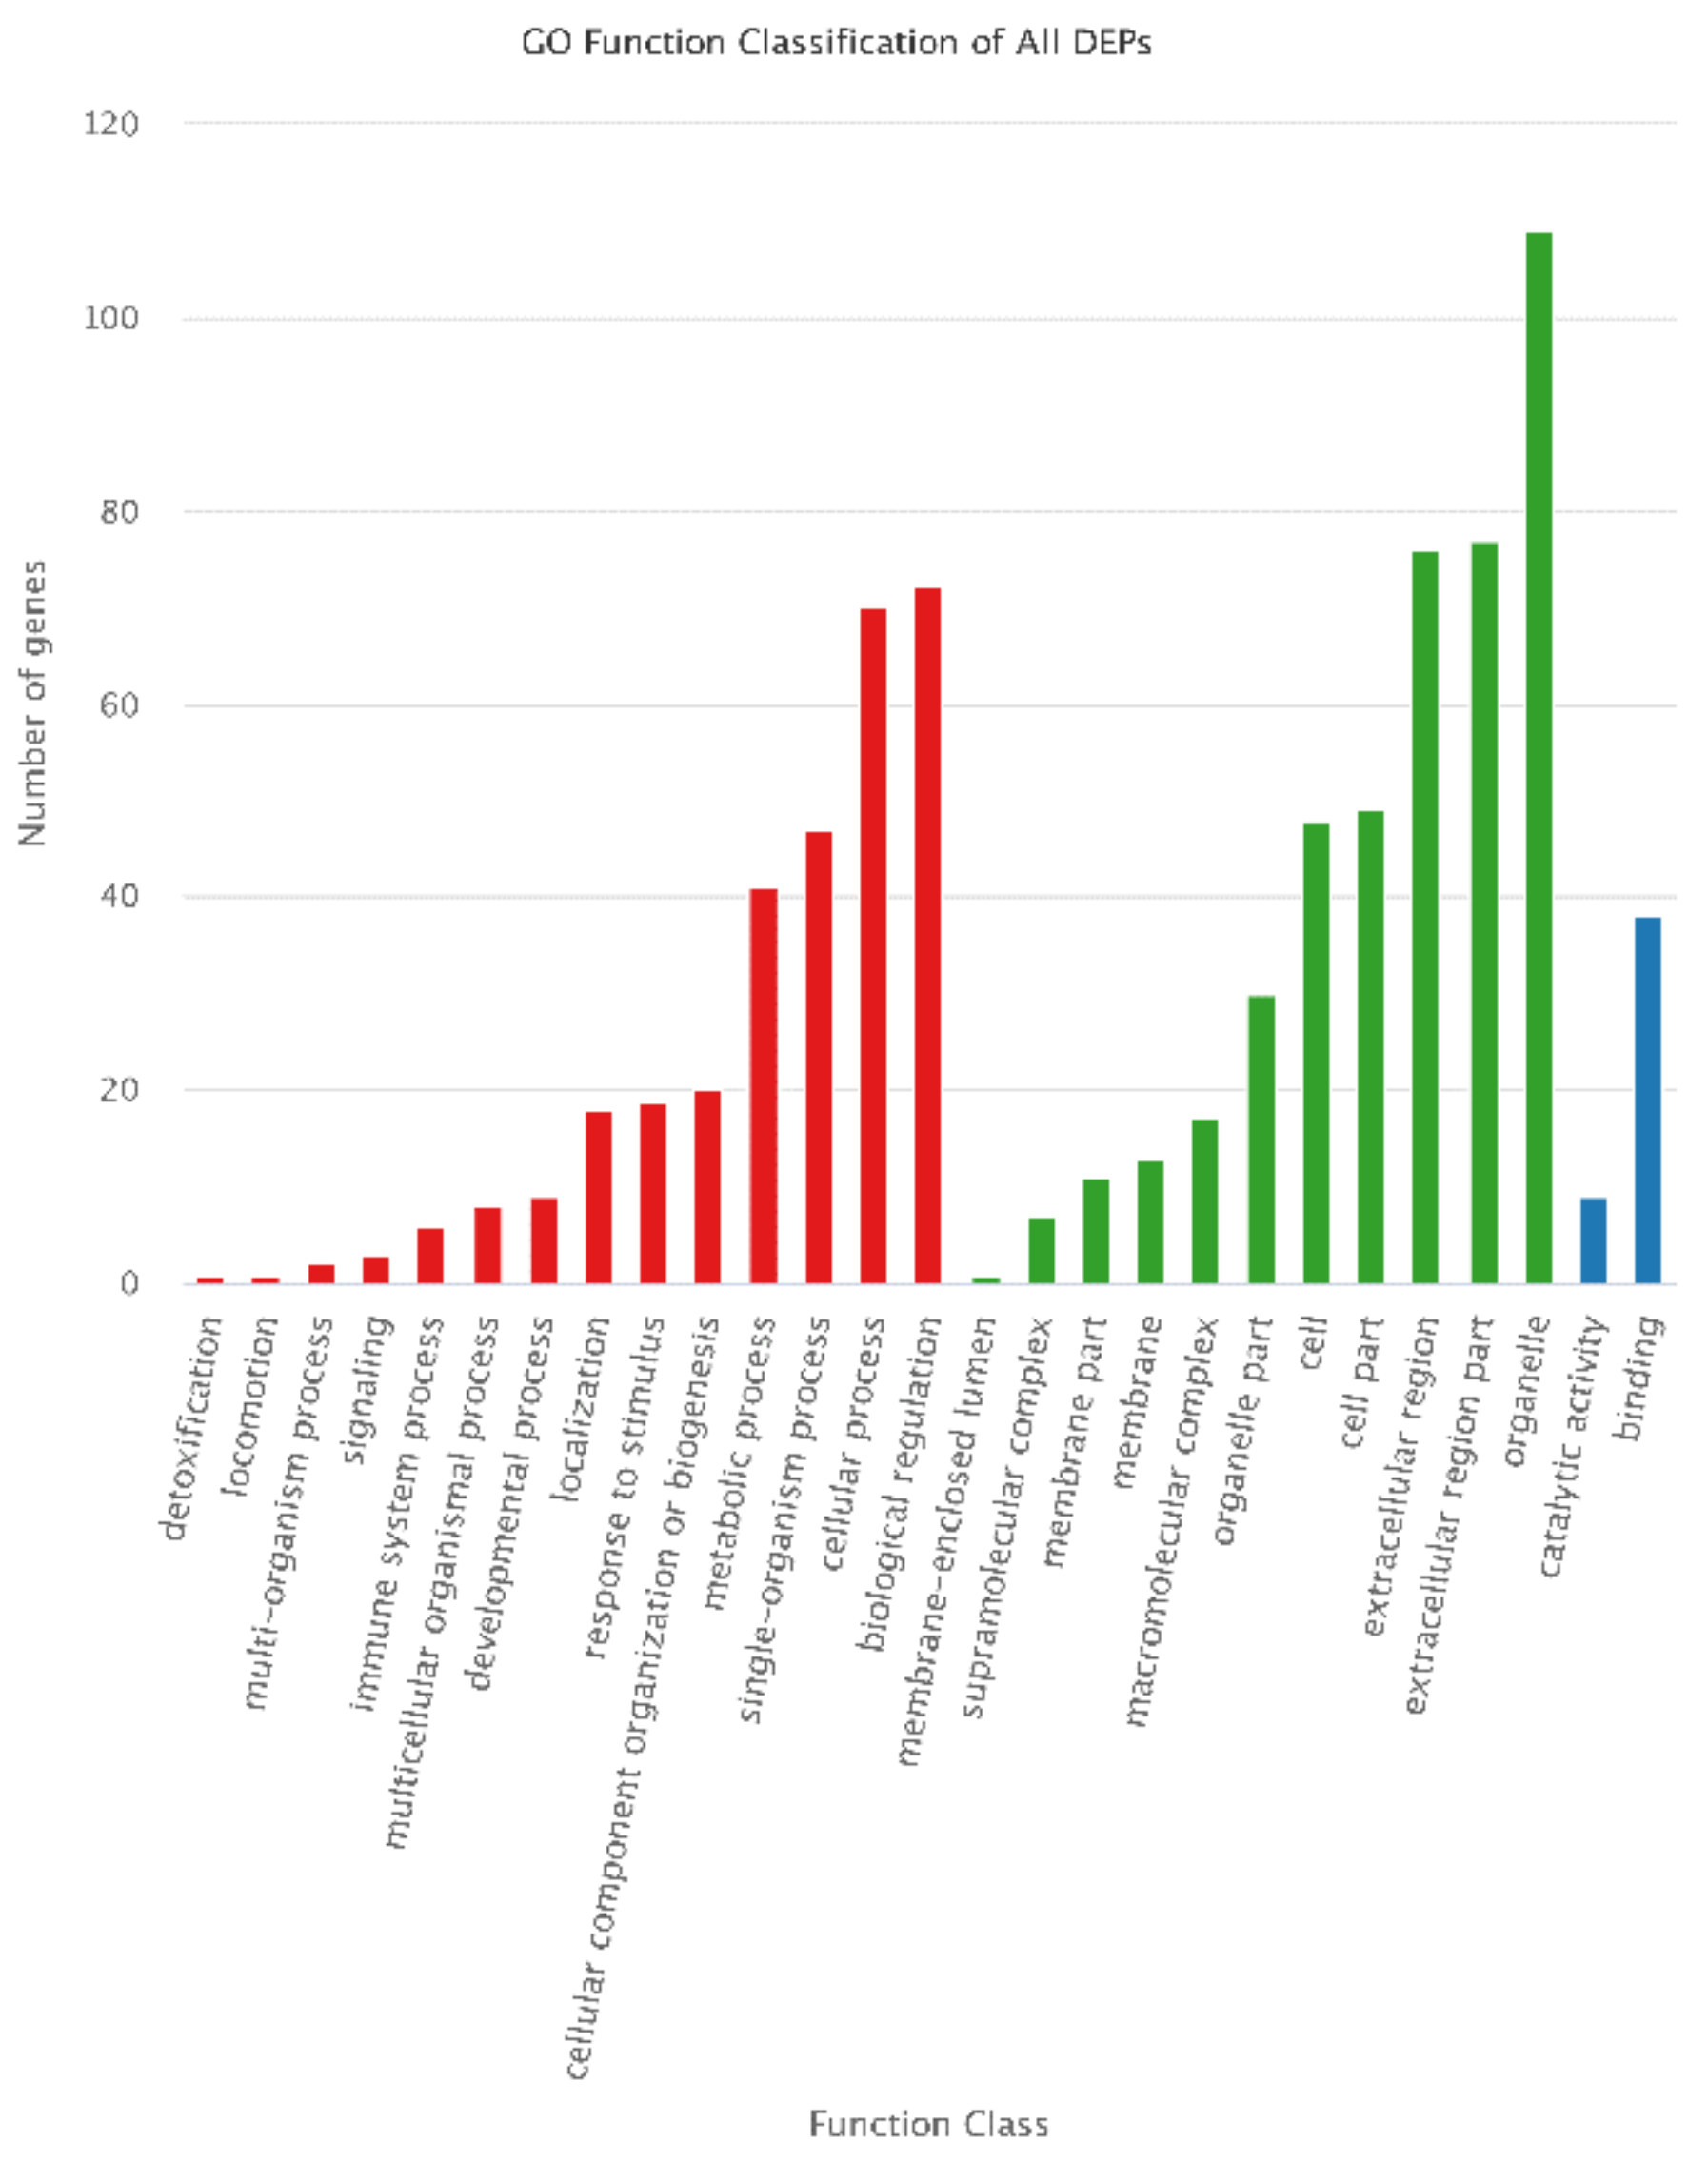
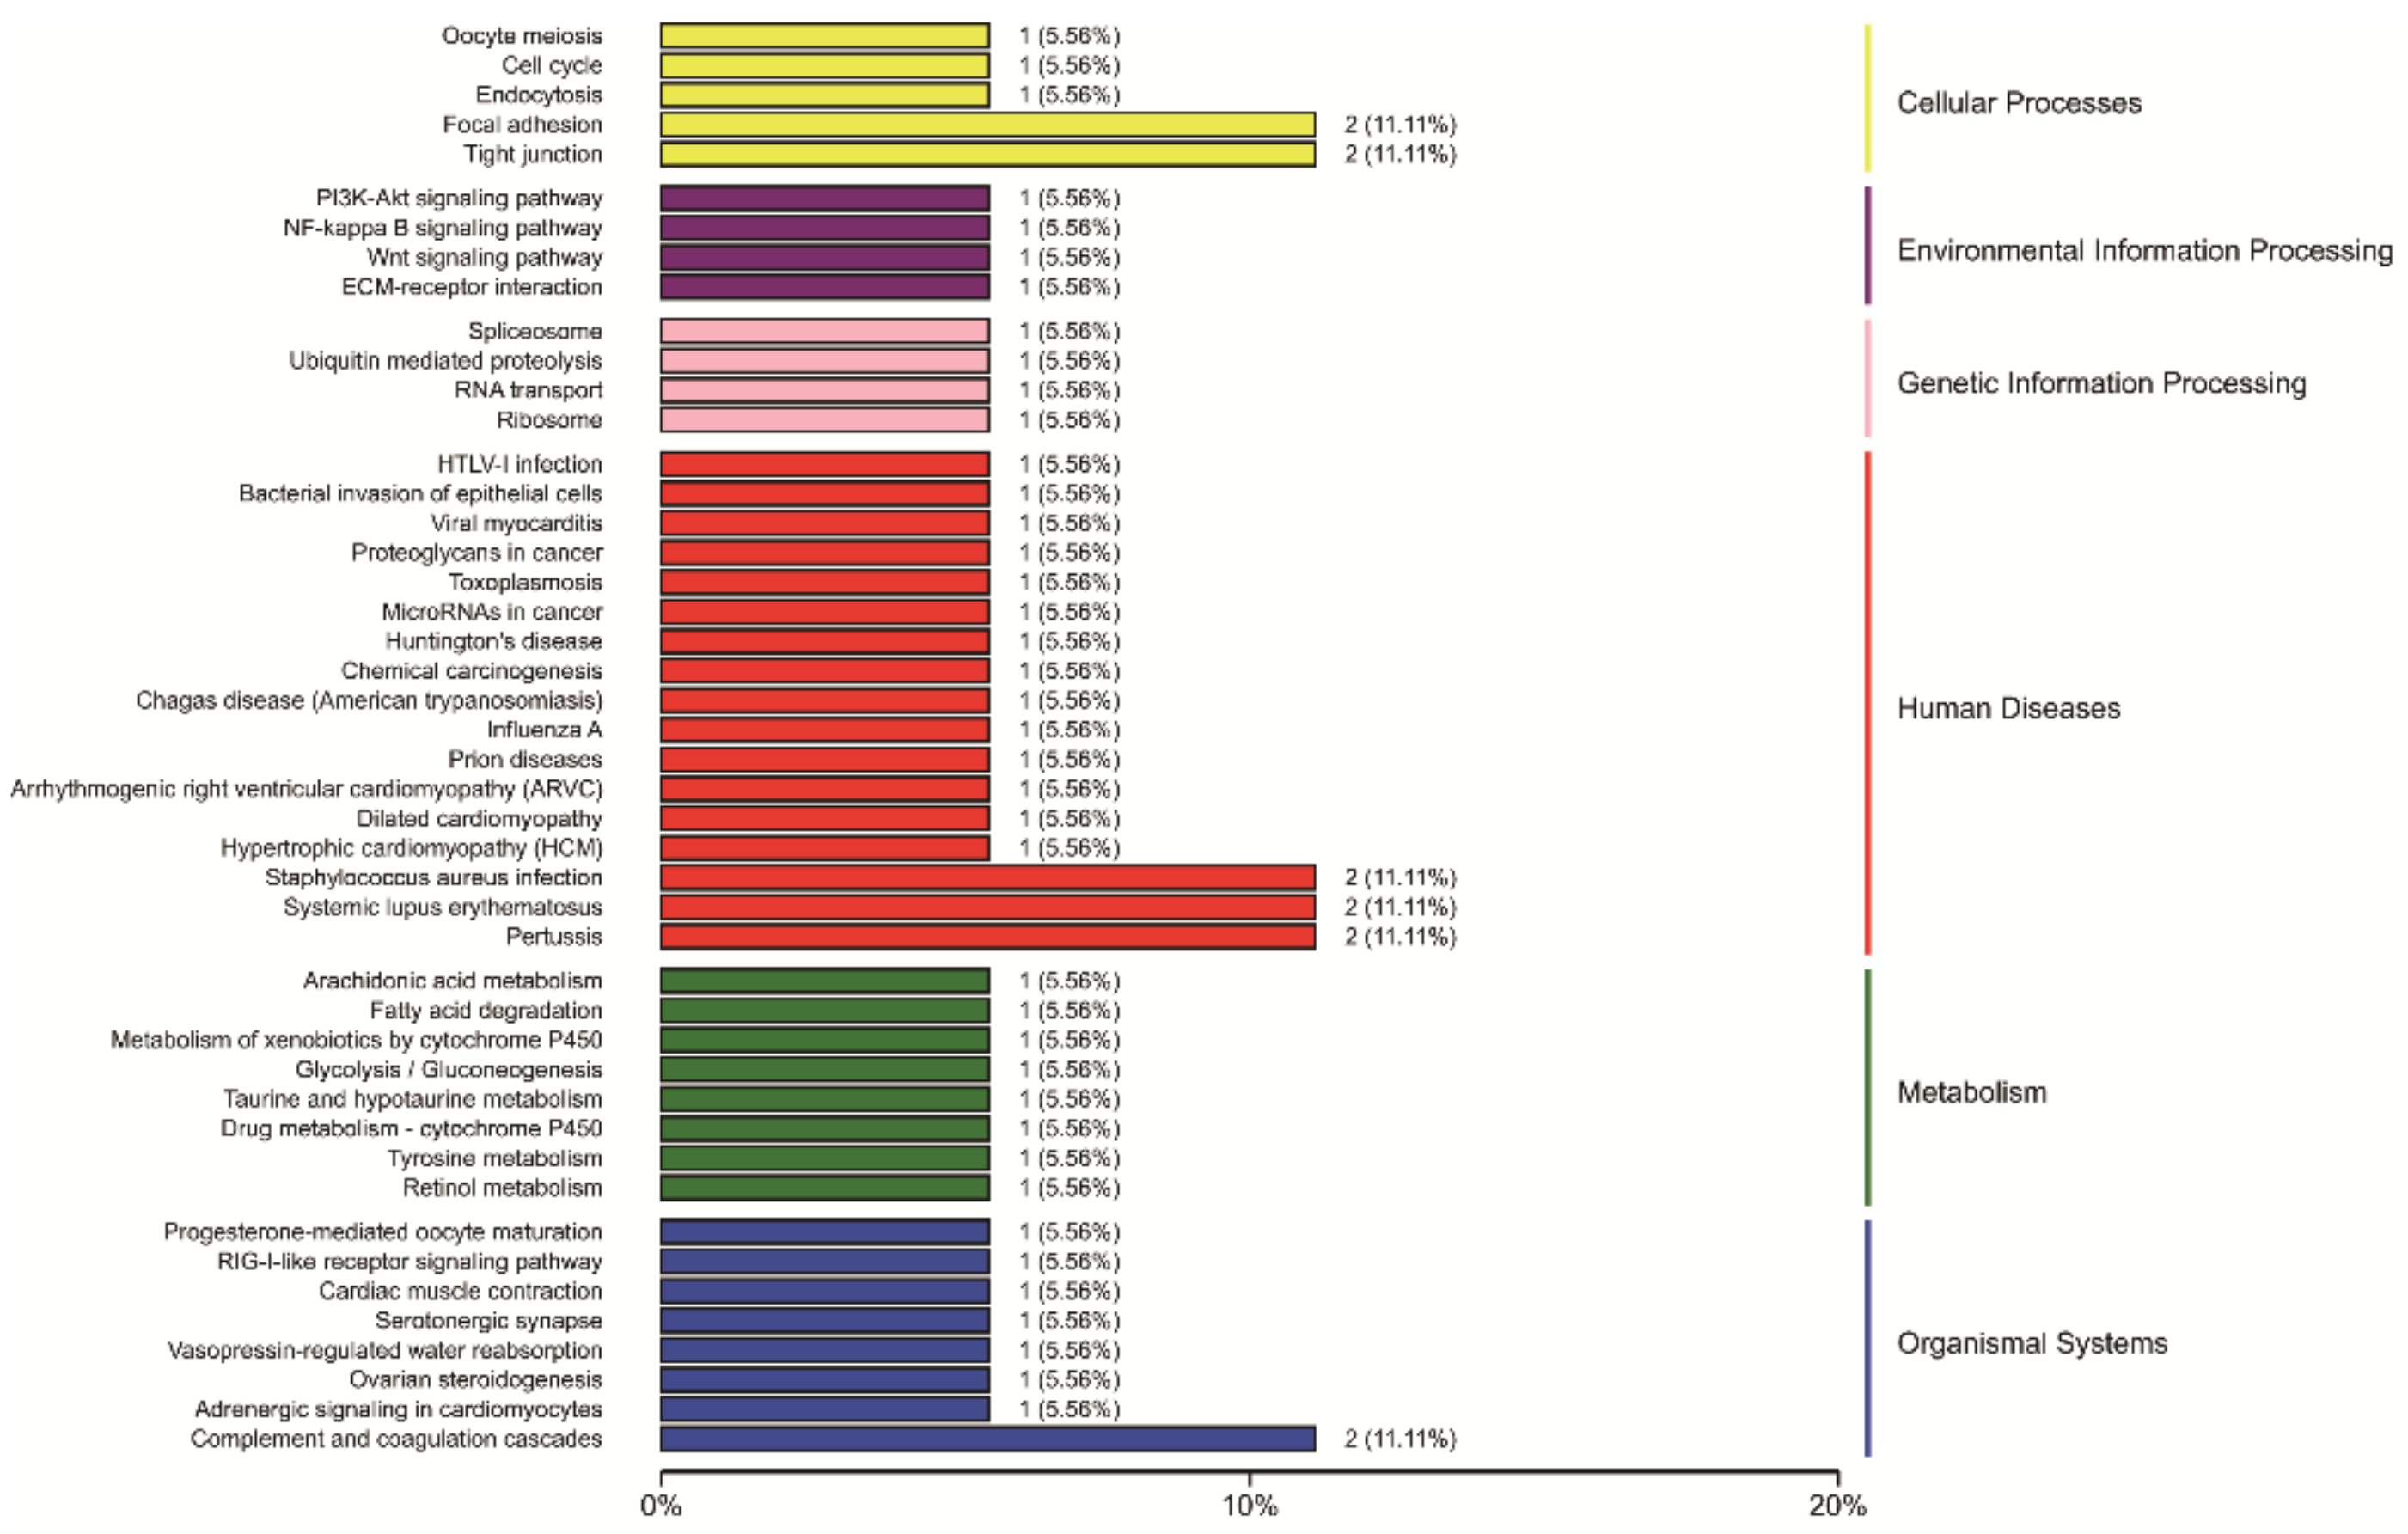
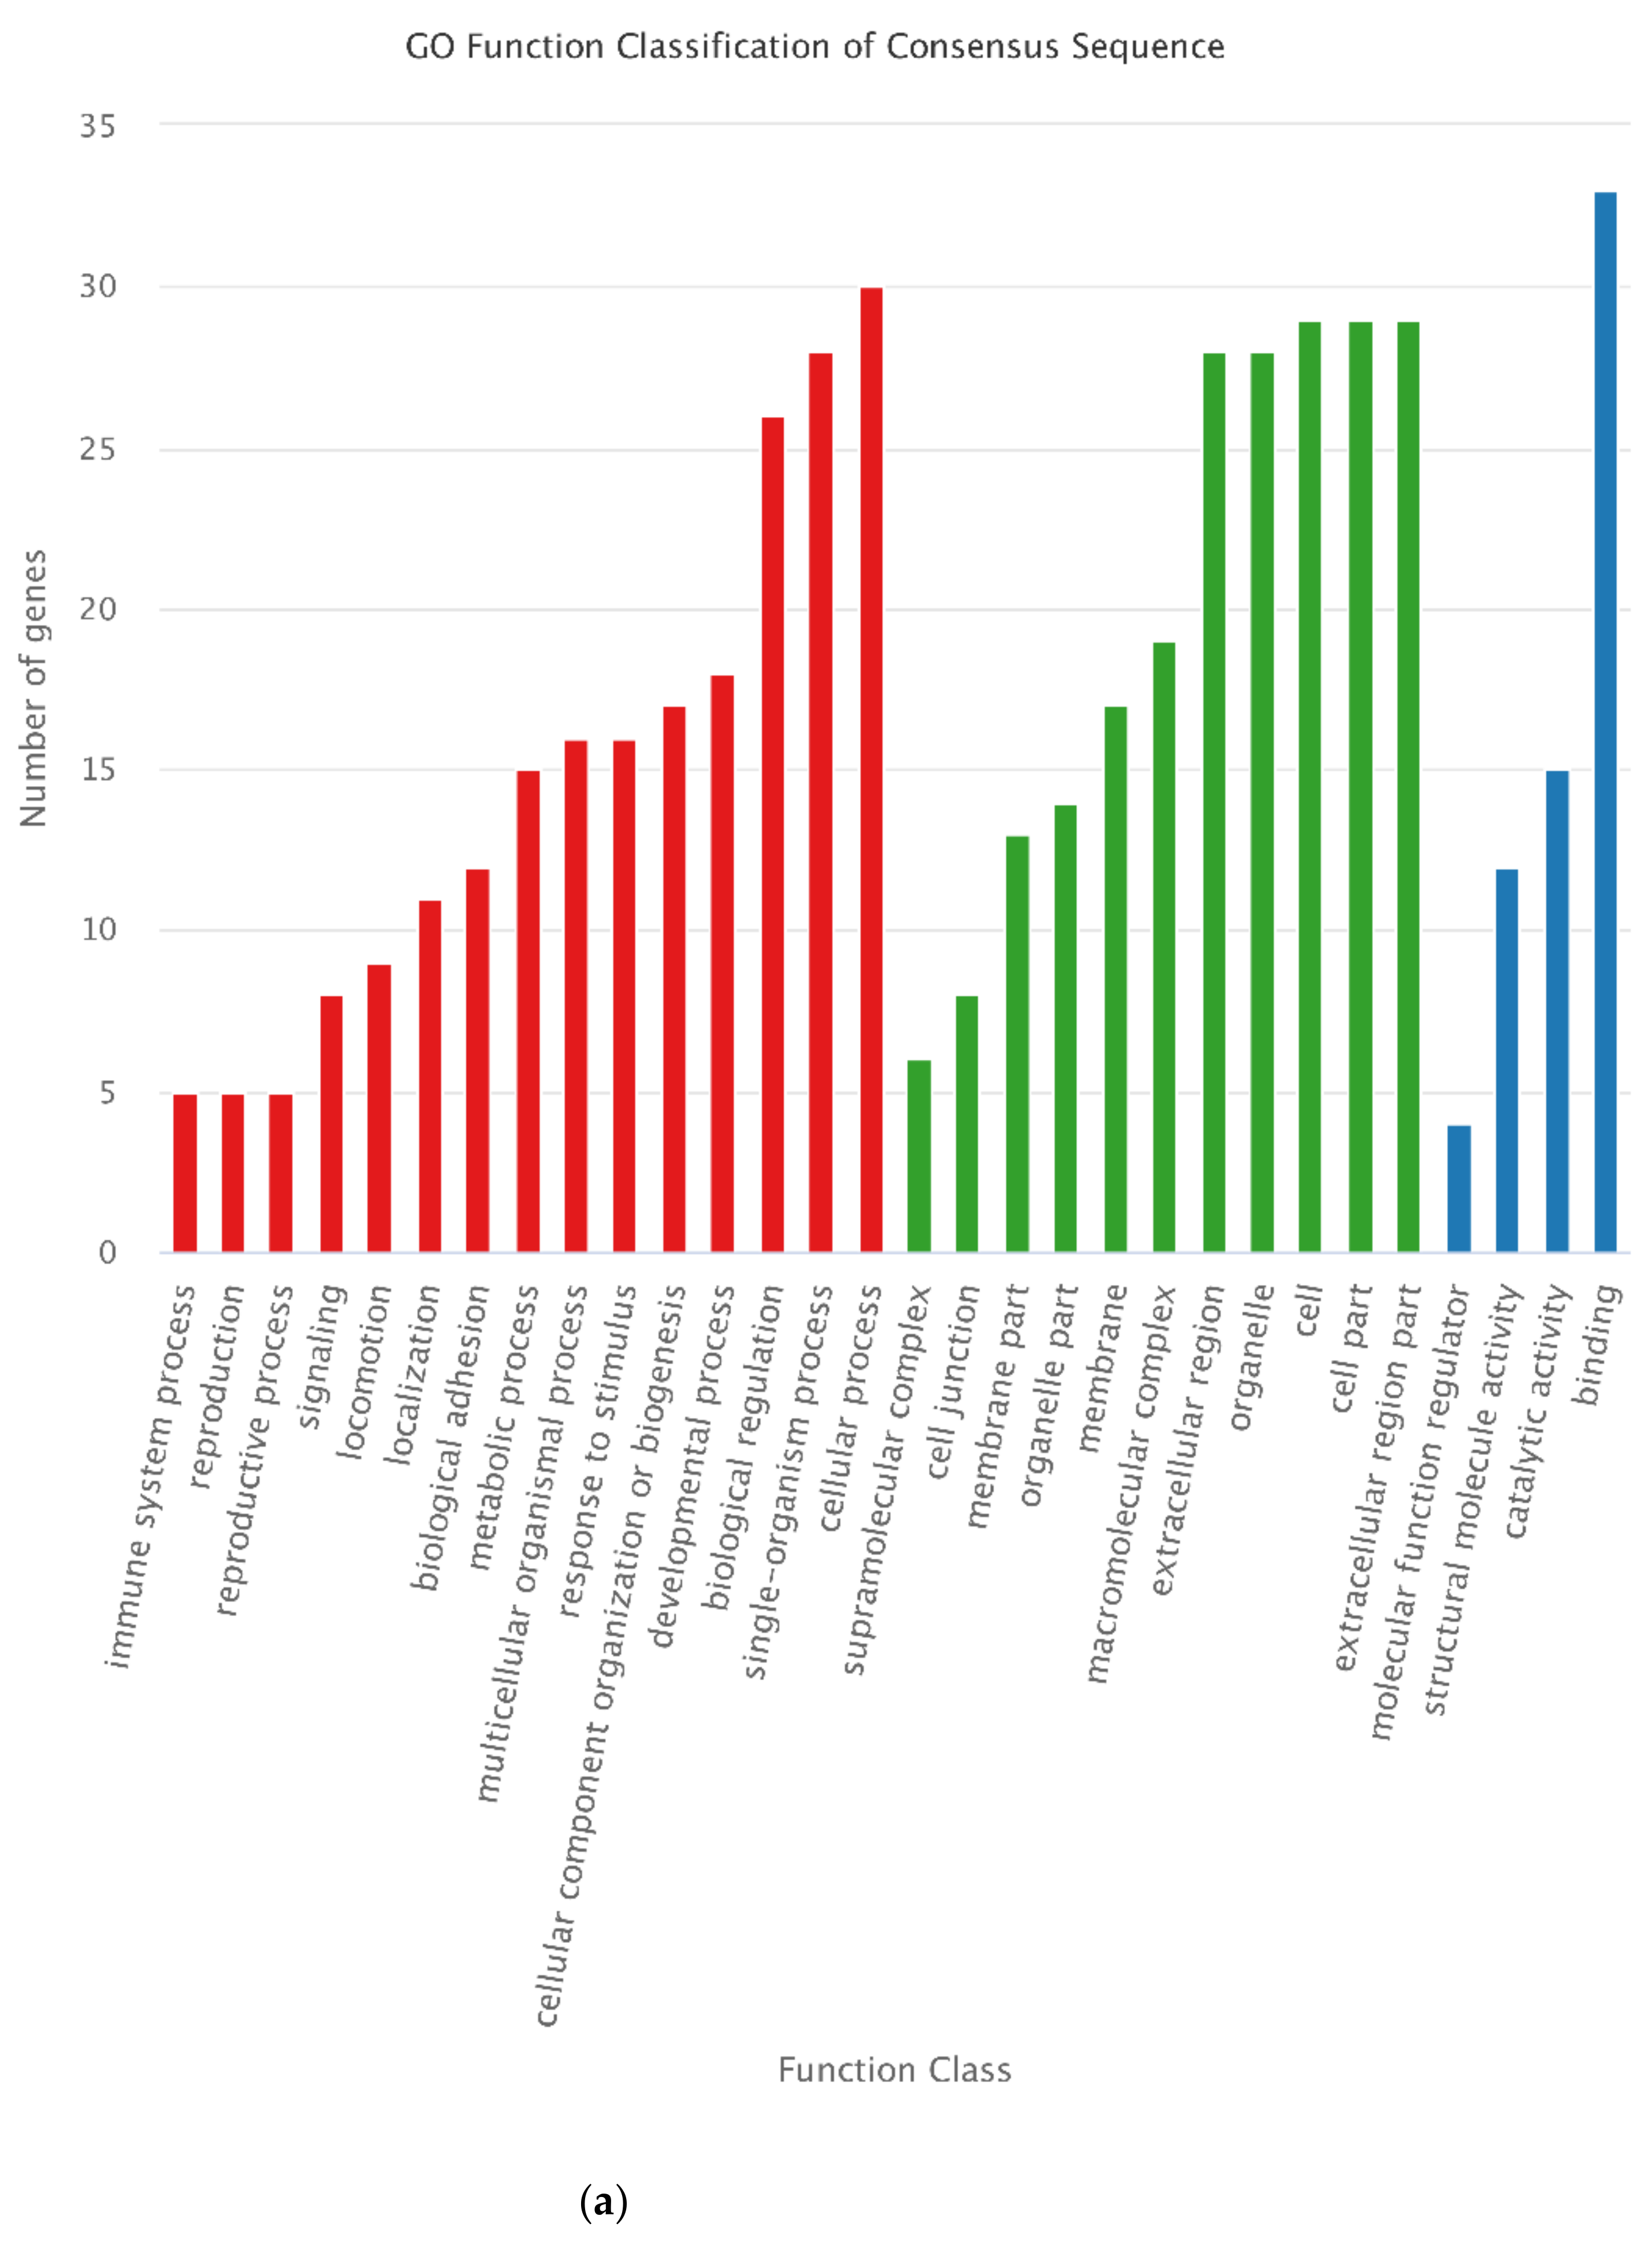
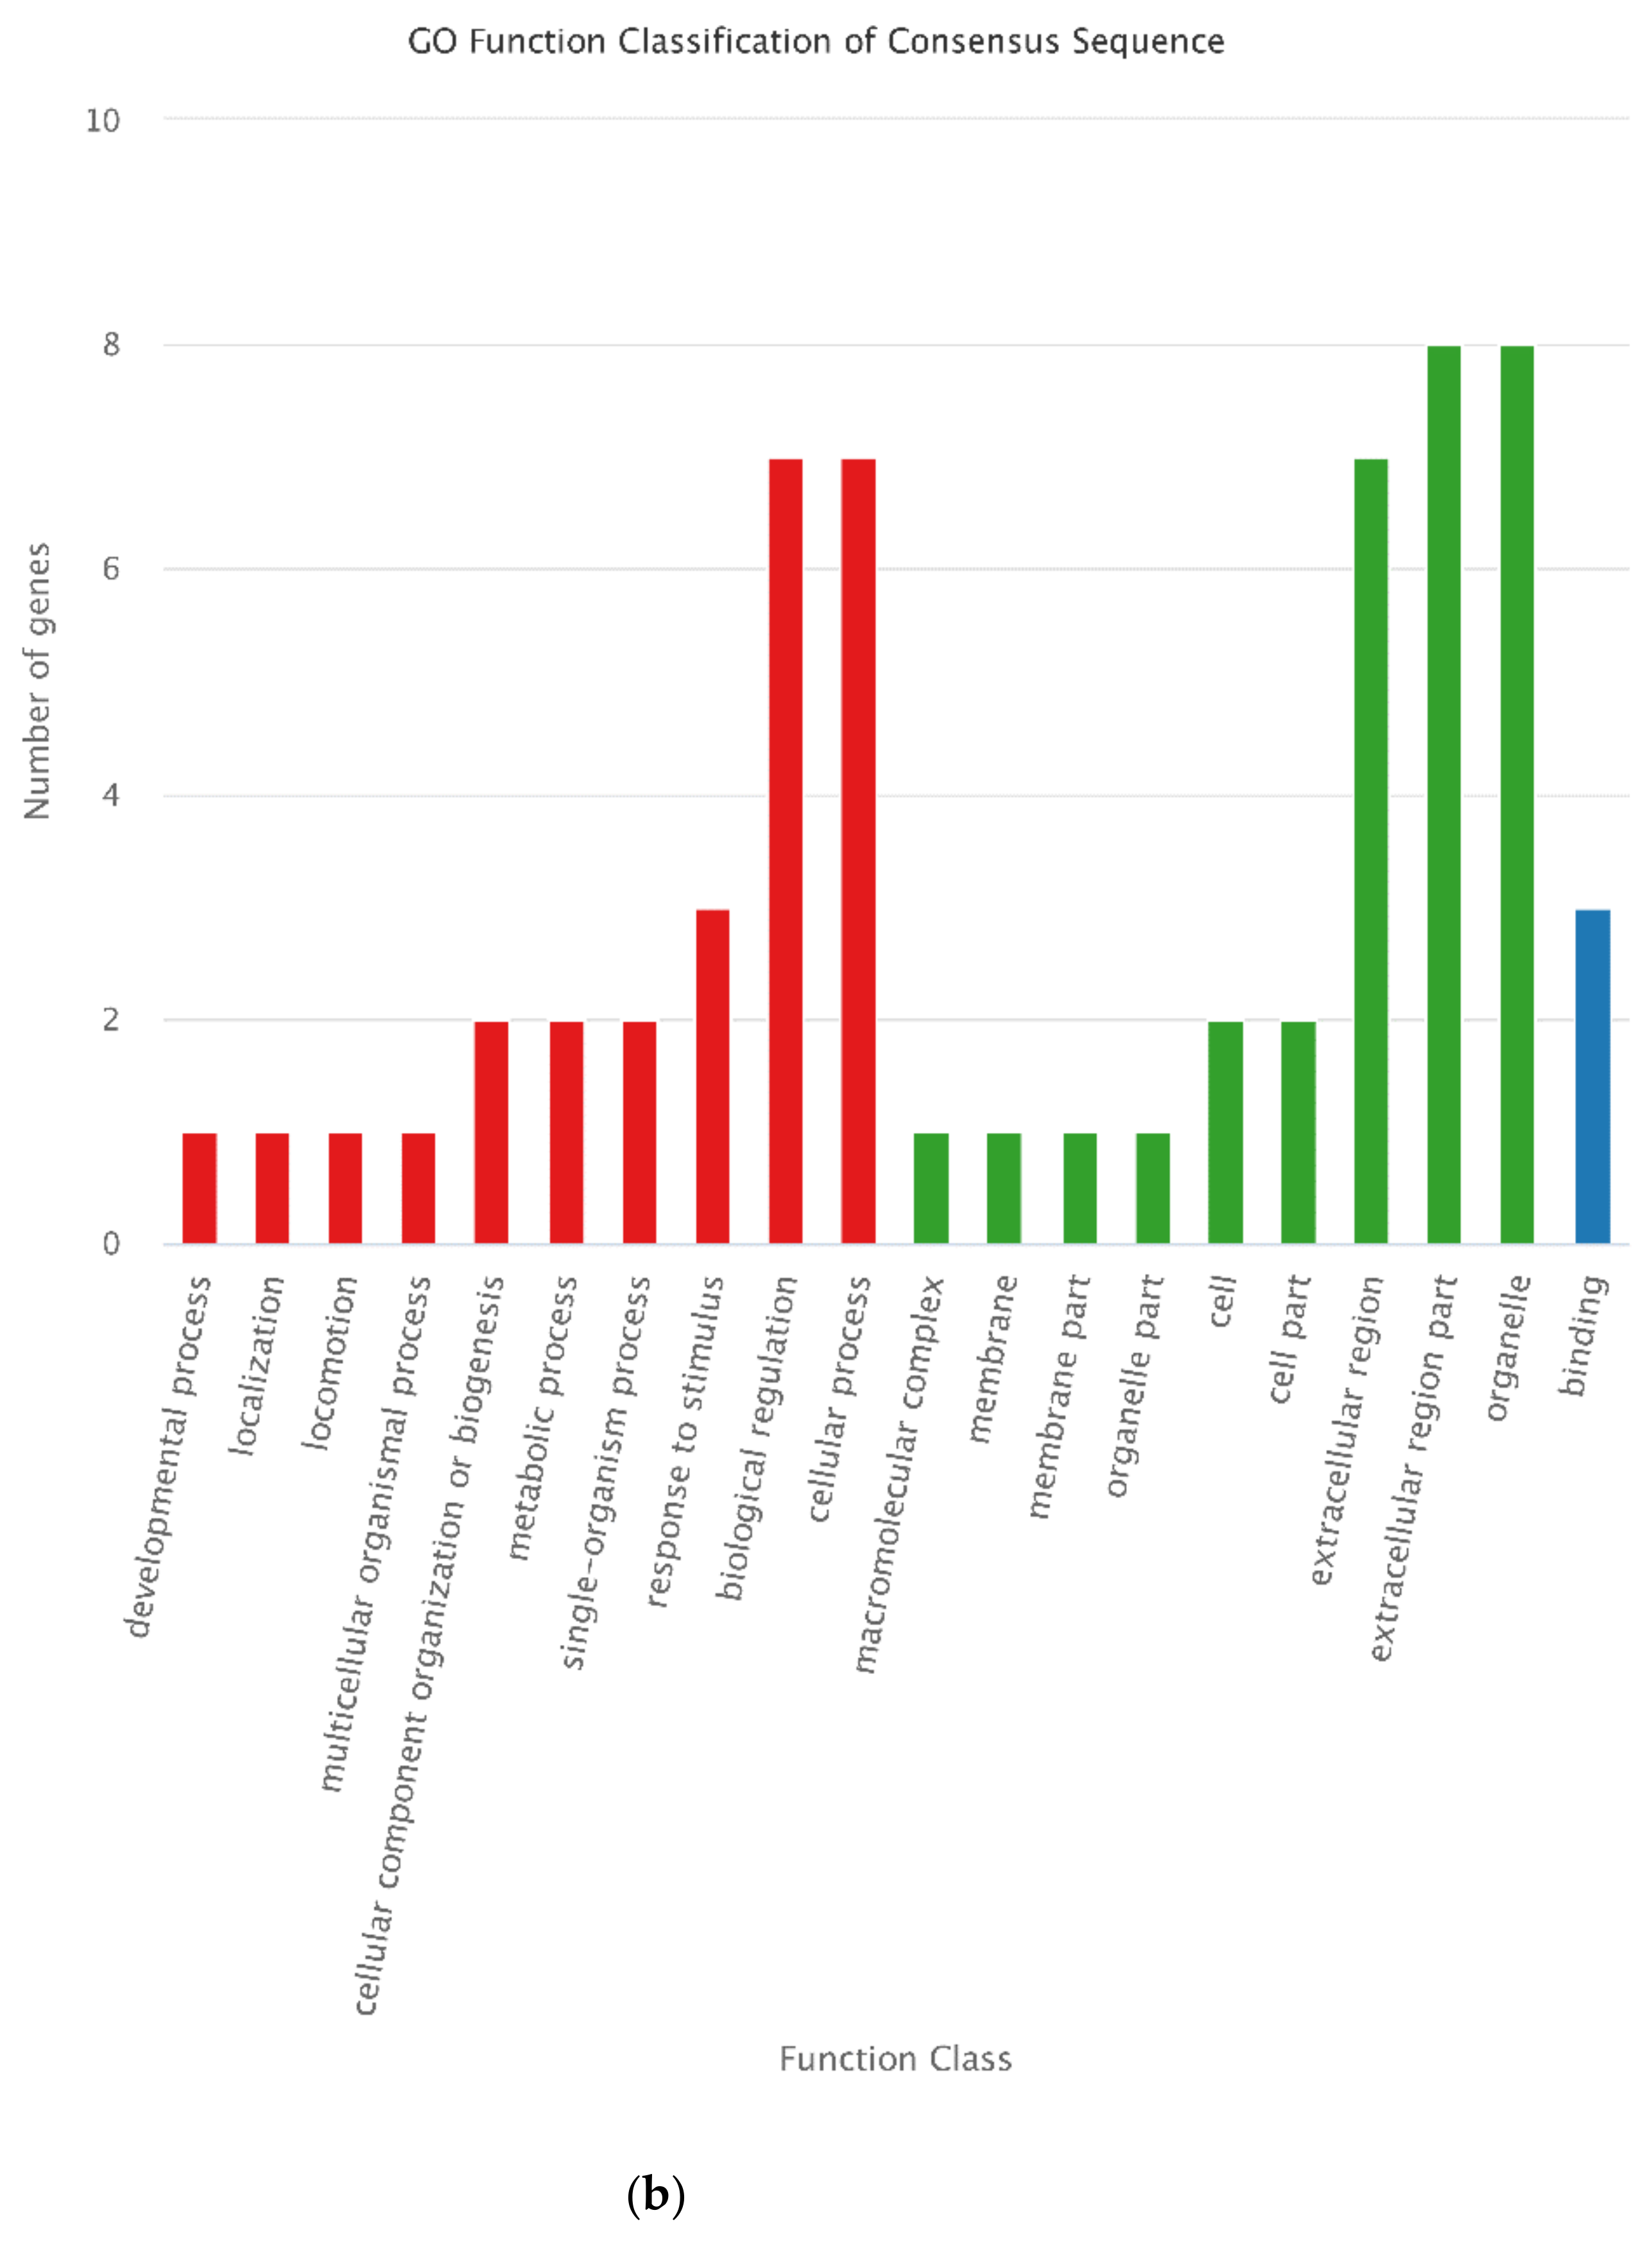
3.7. Annotation of DEPs

Based on the COG annotation, DEPs were classified into 19 functional categories (Figure 8). “Translation, ribosomal structure, and biogenesis” was the most popular group, followed by “Posttranslational modification, protein turnover, chaperones” and “General function prediction only.”
In the GO annotation, “biological regulation” and “cellular process” were dominant in biological process’s category. In cellular component category, “organelle,” “extracellular region part,” and “extracellular region” were dominant. Furthermore, “Binding” was dominant in molecular function category (Figure 9). The results were different from those of DEGs.
According to the KEGG annotation results (Figure 10), DEPs were annotated and assigned to 46 KEGG pathways. The pathways of “Tight junction,” “Focal adhesion,” “Pertussis,” “Staphylococcus aureus infection,” “Systemic lupus erythematosus,” and “Complement and coagulation cascades” classified two DEPs. In addition, other pathways only classified one DEP.
GO and KEGG annotations of DEPs at 30 d vs. 60 d, 30 d vs. 90 d, and 60 d vs. 90 d were also performed (Supplementary Figures S3 and S4).
In addition, we found 34 DEGs and 5 DEPs classified into the “Wnt signaling pathway,” and 82 DEGs and 7 DEPs classified into “Pathway in cancer.” These DEGs and DEPs require further study.
The rapid growth period (60 d) is a special physiological period in the growth process of the velvet antler, during which the growth rate of velvet antler cells was much higher than that of cancer cells. Moreover, the ordered tissue structure is still maintained without cancerization, and complete ossification eventually occurs, resulting in the death of velvet antler tissues and effectively preventing the growth of velvet without restriction. As velvet antler cell proliferation can be stopped eventually, the relationship between the growth and development mechanism of velvet antler and the malignant proliferation of cancer cells has been an attractive research topic. Furthermore, the velvet antler growth mechanism can be used to identify new ideas for cancer treatment. Thus, in the present study, we focused mainly on the DEGs and DEPs that had differential expression levels at 30 d vs. 60 d and 60 d vs. 90 d but had no differential expression at 30 d vs. 90 d. Finally, 488 DEGs and 16 DEPs with these characteristics were selected.
To comprehensively understand the functions of the selected DEGs and DEPs, GO and KEGG functional enrichment analysis was conducted for the 488 DEGs and 16 DEPs. “cellular process” and “biological regulation” in biological process category, “cell” and “cell part” in cellular component category, and “binding” in molecular function category were the most enriched GO terms for the 488 DEGs. For the 16 DEPs, “organelle” classified most proteins (Figure 11). KEGG analysis showed that most of the selected DEGs were annotated in “metabolic pathway,” and then in “PI3K-Akt signaling pathway” and “pathways in cancer.” However, all KEGG pathways classified only one of the selected DEPs (Figure 12).

3.8. Integrated Analysis of Transcriptome and Proteome Data and Integrated Analysis of DEPs and DEG during Antler Growth

Integrated analysis of DEGs and DEPs during antler growth was performed. For integrated analysis, if a gene was detected to be expressed at the mRNA and protein levels simultaneously, there is a correlation between the mRNA and protein of the gene. The relationships between the number of proteins and genes were shown in Table 3.
Compared datasets of proteomics and transcriptomics showed that in 30 d vs. 60 d comparison, 108 proteins conjoined with their corresponding mRNAs. Among them, 76 NDEPs (Non-differentially expressed proteins) conjoined with DEGs, 24 DEPs conjoined with NDEPs, while 8 DEPs conjoined with DEGs. The eight identified DEGs/DEPs had reversed expression trends, which meant that the eight genes collectively exhibited up- or down-regulated expression profiles at mRNA and protein levels. In the 30 d vs. 90 d comparison, 314 proteins or transcripts were identified. Among them, 76 NDEPs conjoined with DEGs, 213 DEPs conjoined with NDEPs, and 25 DEPs conjoined with DEGs, of which 9 DEPs and DEGs had the same expression trend and 16 DEPs and DEGs had the reverse expression trend. In addition, 382 proteins or transcripts were identified in the 60 d vs. 90 d comparison. Among them, 80 NDEPs conjoined with DEGs, 257 DEPs conjoined with NDEPs, and 45 DEPs conjoined with DEGs, of which 16 DEPs and DEGs had the same expression trend and 29 DEPs and DEGs had the reverse expression tend.
In the three comparison groups, the number of conjoined DEPs/DEGs was lower than that of DEPs/NDEGs and NDEPs/DEGs. Therefore, integrative DEGs and DEPs were used for further analyses.
We performed GO classification for DEPs and their corresponding DEGs with the same expression trends in the three libraries. In total, 22 DEPs and 12 DEGs were selected after filtering the repeat ID. Then, these DEPs and DEGs were classified into GO terms (Figure 13). The term “cellular process” classified the most DEGs but “organelle” classified the most DEPs. All terms annotated by DEPs were also annotated by DEGs, but some terms were annotated only by DEGs.
Then, GO classification for DEPs and their corresponding DEGs with the reverse expression trend in the three libraries was conducted; we screened 40 DEPs and 29 DEGs. For GO classification (Figure 14), the term “binding” classified the most DEGs but “extracellular region part” and “organelle” classified the most DEPs. Similar to the DEGs and DEPs, DEGs also annotated all terms annotated by DEPs, but some terms were only annotated by DEGs.
Among the 488 DEGs, 2 genes (gene13546 and gene6151) encode proteins (protein13546 and protein6151) in the 16 selected DEPs. Gene13546 (protein13546) was annotated in “Wnt signaling pathway” and gene6151 (protein6151) was annotated in “complement and coagulation cascades,” “Prion diseases, Pertussis,” “Chagas disease (American trypanosomiasis),” “Staphylococcus aureus infection,” and “Systemic lupus erythematosus” KEGG pathways. It has been reported that the Wnt signaling pathway participates in antler development [31]. Thus, gene13546 and its encoding protein (protein13546) may play important roles in rapid antler growth. Unfortunately, owing to the incomplete genome of red deer, detailed gene names were not annotated in the transcriptome data. However, BLAST results showed that gene13546 was similar to the SFRP4 gene in other mammals and humans, which could be predicted as the SFRP4 gene in Gansu red deer. A phylogenetic tree was constructed on SFRP4 amino acid sequence of C. elaphus kansuensis and 18 other species including Cervus elaphus and Bos tauus (Figure 15). The results showed that C. elaphus kansuensis was closest to Cervidae, followed by bovidae, and furthest to the fish. This was similar to the results of previous studies [32,33].

4. Discussion

Deer antler cells are normal, non-cancerous cells but can proliferate and differentiate rapidly. This property makes the antler a valuable model for studying potent growth factors, unique signaling pathways, and novel regulatory systems [9]. The growth center of the antler tip determines the rapid growth rate of the antler and is precisely regulated so that the antler does not become cancerous [35]. The antler tip region is referred to as the proliferation zone [36]. The rapid growth of antlers is mainly achieved through the activity of cells residing in the proliferation zone [37]. Therefore, the apical tissue is often used as the research object to study the rapid growth and endochondral ossification mechanisms of deer antlers. Presently, the molecular mechanism of antler regeneration and rapid growth needs further study.

4.1. General Features of the Transcriptomes and Proteomes of Antlers at Different Growth Stages

In this study, transcriptomic and proteomic analyses were performed on the antler cartilage tissue of Gansu red deer grown at 30 d, 60 d, and 90 d, and DEGs and DEPs were screened at different growth stages. For RNA-seq, clean reads as a percentage of total raw reads, Q30 values, and GC content are often used to assess the quality of transcriptome sequencing [4]. The Q30 values were 94.50%, 95.31%, and 94.15% at 30 d, 60 d, and 90 d antler cartilage tissues, respectively. The GC content was 56.66%, 55.32%, and 55.37% in the three samples, respectively. These data indicate that the transcriptome sequencing quality was qualified for subsequent analysis in this study. After assembly, we obtained a total of 24,778 unigenes, with an average of 2269 bp and an N50 of 3894 bp, which is longer than the previous transcriptome studies of deer antler [38,39]. Proteins expressed in antlers at different growth stages were also identified by the iTRAQ method in this study. There were previous studies have reported differentially expressed proteins involved in antler regeneration [8,11]. How our data differ from the reported findings has not been analyzed. Proteins that regulate rapid antler growth and chondrogenesis require further exploration.
In this study, 3 male red deer were selected to collect antler samples at about 30 d, 60 d and 90 d growth stages, so that there were 3 samples from different individuals at each time point. In high-throughput sequencing, every sample pool was a mix of equal amount of RNAs from three individual male deer, as was the case in other studies [7,40,41,42], which indicated that this method was acceptable. However, studies with at least biological replicates may be more meaningful and acceptable compared with RNA pools, though each pool is collected with at least three samples. To explore the moleculars involved in rapid antler growth, integrative analysis of transcriptomic and proteomic data was meaningful, which helped us to screen a set of genes and proteins that may be related to antler rapid growth.

4.2. Analysis of Expression of Key DEGs and DEPs Involved in Rapid Antler Growth

High neuralization and vascularization are important tissue characteristics of the velvet antler [43]. The velvet antler enters the rapid growth stage from the beginning to about 60 days [44]. At the rapid growth stage, the growth rate of the velvet antler reaches 2 cm/d. Many scholars call this phenomenon cancer-like growth [45,46]. The behavior of the velvet antler is very similar to the expansion of cancer cells, but the fascination is that it does not become cancerous. During the ossification period, the growth rate begins to slow down again. This unique growth process makes the rapid growth and ossification mechanism of the velvet antler a major focus of biological research. In our study, comparative transcriptome analysis showed that DEGs in comparisons of 30 d vs. 60 d, 30 d vs. 90 d, and 60 d vs. 90 d were mainly classified in “pathways in cancer” and “PI3K-Akt signaling pathway.” This was consistent with the enrichment of DEGs. As antler growth is a tumor-like development, the genes classified in pathways in cancer may be potential regulators in antler development. The PI3K-Akt signaling pathway can be activated by a variety of factors and has a wide range of biological functions, such as transcription, translation, cell cycle, proliferation, differentiation, survival, apoptosis, metabolism, angiogenesis, and migration [47,48]. It has been implicated in various cancers, such as gynecological tumors [49], prostate cancer [50], medulloblastoma [51], and gastric cancer [52]. In addition, the PI3K-Akt signaling pathway participates in chondrocyte proliferation, apoptosis, autophagy [53,54], cartilage protection [55,56], cartilage degeneration [57], cartilage cell apoptosis [58], and osteoarthritis cartilage regeneration [59]. Liu [60] found that the PI3K/Akt pathway affects the generation and regeneration of antler stem cells in vitro. Dong [61] predicted that the PI3K-Akt signaling pathway plays an important role in regulating the regeneration of antlers. Furthermore, proteomic analysis of velvet cartilage showed that DEPs were classified in the “PI3K-Akt signaling pathway” and “Wnt signaling pathway.” Thus, the genes and proteins involved in the development of cartilage tissue in the growth center of deer antlers at the fast growth stage require further study.
Integrated analysis showed that among the 488 DEGs and 16 DEPs, 2 genes (gene13546 and gene6151) and proteins (protein13546 and protein6151) corresponded to each other. Gene13546 and its encoding protein protein13546 were both annotated in the “Wnt signaling pathway.” Wnt signaling plays a crucial role in embryogenesis [62]. In adults, Wnt is mainly involved in cell proliferation and differentiation [62]. Clinical findings suggest that Wnt signaling is critical for trabecular and cortical bone mass [63]. The Wnt signaling pathway has been reported to regulate antler regeneration [31,64]. Secreted frizzled-related proteins (SFRPs), a family of tumor suppressor candidate genes, act as Wnt antagonists in the Wnt signaling pathway [65]. SFRP4 is a member of the SFRP family of proteins. SFRP4-dependent Wnt signaling modulation has been reported to be essential for bone remodeling [66]. The sequence of gene13546 was analyzed with ORF Finder [67] and other online softwares [68,69]. Bioinformatics analysis showed that the ORF of C. elaphus kansuensis SFRP4 was 624 bp, encoding 207 amino acids. The molecular weight of C. elaphus kansuensis SFRP4 protein was 23.37 Kda. The theoretical isoelectric point (pI) was 6.74. The SFRP4 protein contains a conserved domain, CRD_FZ, belonging to the CRD_FZ superfamily.
The higher expression of gene13546 and lower expression of protein13546 in the rapid growth stage indicate that certain factors inhibit the translation of gene13546, which in turn activates the Wnt signaling pathway and promotes the rapid growth of the velvet antler. In the ossification stage, this inhibitory effect is relieved, protein13546 protein accumulates and inhibits the activity of the Wnt signaling pathway, and the growth rate of velvet antler slows down and gradually ossifies. This may explain the timely cessation of deer antlers during proliferation without unlimited growth or cancerization.
GO and KEGG annotations provide useful resources for the further identification of specific cellular structures, pathways, processes, and protein functions in antlers. Our data revealed that many DEGs and DEPs in the cartilage tissue of antlers at different growth stages. Thus, the genes involved in cancer, angiogenesis, and chondrogenesis may play key roles in antler development during the rapid growth stage.

5. Conclusions

The selected 488 DEGs and 16 DEPs that had differential expression levels at 30 d vs. 60 d and 60 d vs. 90 d but not at 30 d vs. 90 d may have research potential in regeneration of velvet antler. The gene13546 and its coding protein protein13546 annotated in the Wnt signaling pathway may possess important biological functions in rapid antler growth.

Supplementary Materials

The following supporting information can be downloaded at: https://www.mdpi.com/article/10.3390/ani12070934/s1, Figure S1. KEGG classification of all DEGs; Figure S2. GO classification of DEGs in 30 d vs. 60 d, 30 d vs. 90 d, and 60 d vs. 90 d; Figure S3. KEGG classification of DEGs in 30 d vs. 60 d, 30 d vs. 90 d, and 60 d vs. 90 d; Figure S4. GO classification of DEPs in 30 d vs. 60 d, 30 d vs. 90 d, and 60 d vs. 90 d; Figure S5. KEGG classification of DEPs in 30 d vs. 60 d, 30 d vs. 90 d, and 60 d vs. 90 d.

Author Contributions

Conceptualization, Y.C. and Z.Z.; methodology, Y.C. and Z.Z.; software, W.J.; validation, Z.L., C.B. and C.H.; formal analysis, Y.C. and Z.Z.; investigation, W.J.; resources, Y.G.; data curation, Y.C. and Z.Z.; writing—original draft preparation, Y.C. and Z.Z.; writing—review and editing, Y.C. and Z.Z.; visualization, W.J.; supervision, C.L.; project administration, Y.C.; funding acquisition, Y.C. All authors have read and agreed to the published version of the manuscript.

Funding

This research was funded by Science and Technology Innovation Project of Three River Source First-class Discipline, College of Eco–Environment Engineering, Qinghai University, grant number 2021-JS-02 and The Doctoral Scientific Research Start-up Foundation of Qinghai University.

Institutional Review Board Statement

The animal study protocol was approved. All experimental protocols were approved by the Institutional Animal Care and Use Committee of Qinghai University (Xining, China), and all methods were carried out in accordance with approved guidelines and regulations (Code: SL-2022024). All procedures involving animals were conducted in accordance with the U.S. National Institutes of Health: Guide for the Care and Use of Laboratory Animals (NIH Publication 85-23, revised 2011) [70]. This study was conducted in compliance with the ARRIVE guidelines for animal research [71].

Informed Consent Statement

Not applicable.

Data Availability Statement

The transcriptomes generated and analyzed in this study are available in the NCBI SRA database under BioProject Accession Numbers PRJNA772802 (Transcriptome profiles of velvet antler in Gansu red deer. Available online: http://www.ncbi.nlm.nih.gov/bioproject/772802 (accessed on 19 March 2022)). Readers can access the proteome data, supporting the conclusions of the study by requesting them from the authors. The mass spectrometry proteomics data have been deposited to the ProteomeXchange Consortium (http://www.proteomexchange.org (accessed on 19 October 2021)) with the dataset identifier PXD032668.

Acknowledgments

We would like to thank Shandan horse farm for providing animal samples.

Conflicts of Interest

The authors declare no conflict of interest.

References

  1. Hu, P.; Shao, Y.; Xu, J.; Wang, T.; Li, Y.; Liu, H.; Rong, M.; Su, W.; Chen, B.; Cui, S.; et al. Genome-wide study on genetic diversity and phylogeny of five species in the genus Cervus. BMC Genom. 2019, 20, 384. [Google Scholar] [CrossRef] [PubMed]
  2. Li, X.; Liu, M.; Bai, X.; Li, Y.; Zhao, Y.; Wang, S.; Wang, J. Molecular cloning, recombinant expression, and purification of osteocalcin in sika deer (Cervus nippon) antler. Pol. J. Vet. Sci. 2019, 22, 143–150. [Google Scholar] [CrossRef] [PubMed]
  3. Sui, Z.; Weng, Y.; Zhao, Q.; Deng, N.; Fang, F.; Zhu, X.; Shan, Y.; Zhang, L.; Zhang, Y. Ionic liquid-based method for direct proteome characterization of velvet antler cartilage. Talanta 2016, 161, 541–546. [Google Scholar] [CrossRef] [PubMed]
  4. Han, R.; Han, L.; Wang, S.; Li, H. Whole transcriptome analysis of mesenchyme tissue in sika deer antler revealed the CeRNAs regulatory network associated with antler development. Front. Genet. 2019, 10, 1403. [Google Scholar] [CrossRef] [Green Version]
  5. Yao, B.; Zhang, M.; Liu, M.; Liu, Y.; Hu, Y.; Zhao, Y. Transcriptomic characterization elucidates a signaling network that controls antler growth. Genome 2018, 61, 829–841. [Google Scholar] [CrossRef]
  6. Park, H.J.; Lee, D.H.; Park, S.G.; Lee, S.C.; Cho, S.; Kim, H.K.; Kim, J.J.; Bae, H.; Park, B.C. Proteome analysis of red deer antlers. Proteomics 2004, 4, 3642–3653. [Google Scholar] [CrossRef]
  7. Hu, P.; Wang, T.; Liu, H.; Xu, J.; Wang, L.; Zhao, P.; Xing, X. Full-length transcriptome and microRNA sequencing reveal the specific gene-regulation network of velvet antler in sika deer with extremely different velvet antler weight. Mol. Genet. Genom. MGG 2019, 294, 431–443. [Google Scholar] [CrossRef]
  8. Akhtar, R.W.; Liu, Z.; Wang, D.; Ba, H.; Shah, S.A.H.; Li, C. Identification of proteins that mediate the role of androgens in antler regeneration using label free proteomics in sika deer (Cervus nippon). Gen. Comp. Endocrinol. 2019, 283, 113235. [Google Scholar] [CrossRef]
  9. Ba, H.; Wang, D.; Yau, T.O.; Shang, Y.; Li, C. Transcriptomic analysis of different tissue layers in antler growth center in Sika Deer (Cervus nippon). BMC Genom. 2019, 20, 173. [Google Scholar] [CrossRef] [Green Version]
  10. Dong, Z.; Haines, S.; Coates, D. Proteomic profiling of stem cell tissues during regeneration of deer antler: A model of mammalian organ regeneration. J. Proteome Res. 2020, 19, 1760–1775. [Google Scholar] [CrossRef]
  11. Sui, Z.; Sun, H.; Weng, Y.; Zhang, X.; Sun, M.; Sun, R.; Zhao, B.; Liang, Z.; Zhang, Y.; Li, C.; et al. Quantitative proteomics analysis of deer antlerogenic periosteal cells reveals potential bioactive factors in velvet antlers. J. Chromatogr. A 2020, 1609, 460496. [Google Scholar] [CrossRef] [PubMed]
  12. Félix, C.; Meneses, R.; Gonçalves, M.F.M.; Tilleman, L.; Duarte, A.S.; Jorrín-Novo, J.V.; Van de Peer, Y.; Deforce, D.; Van Nieuwerburgh, F.; Esteves, A.C.; et al. A multi-omics analysis of the grapevine pathogen Lasiodiplodia theobromae reveals that temperature affects the expression of virulence- and pathogenicity-related genes. Sci. Rep. 2019, 9, 13144. [Google Scholar] [CrossRef] [PubMed] [Green Version]
  13. Wang, Z.; Hua, J.; Yin, Y.; Gu, C.; Yu, C.; Shi, Q.; Guo, J.; Xuan, L.; Yu, F. An integrated transcriptome and proteome analysis reveals putative regulators of adventitious root formation in Taxodium ‘Zhongshanshan’. Int. J. Mol. Sci. 2019, 20, 1225. [Google Scholar] [CrossRef] [Green Version]
  14. Ye, X.; Wang, H.; Chen, P.; Fu, B.; Zhang, M.; Li, J.; Zheng, X.; Tan, B.; Feng, J. Combination of iTRAQ proteomics and RNA-seq transcriptomics reveals multiple levels of regulation in phytoplasma-infected Ziziphus jujuba Mill. Hortic. Res. 2017, 4, 17080. [Google Scholar] [CrossRef] [PubMed] [Green Version]
  15. Zeng, N.; Yang, Z.; Zhang, Z.; Hu, L.; Chen, L. Comparative transcriptome combined with proteome analyses revealed key factors involved in Alfalfa (Medicago sativa) response to waterlogging stress. Int. J. Mol. Sci. 2019, 20, 1359. [Google Scholar] [CrossRef] [PubMed] [Green Version]
  16. Kim, D.; Langmead, B.; Salzberg, S.L. HISAT: A fast spliced aligner with low memory requirements. Nat. Methods 2015, 12, 357–360. [Google Scholar] [CrossRef] [Green Version]
  17. Pertea, M.; Pertea, G.M.; Antonescu, C.M.; Chang, T.C.; Mendell, J.T.; Salzberg, S.L. StringTie enables improved reconstruction of a transcriptome from RNA-seq reads. Nat. Biotechnol. 2015, 33, 290–295. [Google Scholar] [CrossRef] [Green Version]
  18. Leng, N.; Dawson, J.A.; Thomson, J.A.; Ruotti, V.; Rissman, A.I.; Smits, B.M.; Haag, J.D.; Gould, M.N.; Stewart, R.M.; Kendziorski, C. EBSeq: An empirical Bayes hierarchical model for inference in RNA-seq experiments. Bioinformatics 2013, 29, 1035–1043. [Google Scholar] [CrossRef] [Green Version]
  19. Sun, X.; Cai, R.; Jin, X.; Shafer, A.B.A.; Hu, X.; Yang, S.; Li, Y.; Qi, L.; Liu, S.; Hu, D. Blood transcriptomics of captive forest musk deer (Moschus berezovskii) and possible associations with the immune response to abscesses. Sci. Rep. 2018, 8, 599. [Google Scholar] [CrossRef] [Green Version]
  20. Li, J.N.; Zhao, Y.T.; Cao, S.L.; Wang, H.; Zhang, J.J. Integrated transcriptomic and proteomic analyses of grass carp intestines after vaccination with a double-targeted DNA vaccine of Vibrio mimicus. Fish Shellfish Immunol. 2020, 98, 641–652. [Google Scholar] [CrossRef]
  21. Medina, I.; Montaner, D.; Tárraga, J.; Dopazo, J. Prophet, a web-based tool for class prediction using microarray data. Bioinformatics 2007, 23, 390–391. [Google Scholar] [CrossRef] [PubMed] [Green Version]
  22. Perez-Riverol, Y.; Bai, J.; Bandla, C.; Garcia-Seisdedos, D.; Hewapathirana, S.; Kamatchinathan, S.; Kundu, D.J.; Prakash, A.; Frericks-Zipper, A.; Eisenacher, M.; et al. The PRIDE database resources in 2022: A hub for mass spectrometry-based proteomics evidences. Nucleic Acids Res. 2022, 50, D543–D552. [Google Scholar] [CrossRef]
  23. Tatusov, R.L.; Galperin, M.Y.; Natale, D.A.; Koonin, E.V. The COG database: A tool for genome-scale analysis of protein functions and evolution. Nucleic Acids Res. 2000, 28, 33–36. [Google Scholar] [CrossRef] [PubMed] [Green Version]
  24. Ashburner, M.; Ball, C.A.; Blake, J.A.; Botstein, D.; Butler, H.; Cherry, J.M.; Davis, A.P.; Dolinski, K.; Dwight, S.S.; Eppig, J.T.; et al. Gene ontology: Tool for the unification of biology. The Gene Ontology Consortium. Nat. Genet. 2000, 25, 25–29. [Google Scholar] [CrossRef] [PubMed] [Green Version]
  25. Kanehisa, M.; Goto, S. KEGG: Kyoto encyclopedia of genes and genomes. Nucleic Acids Res. 2000, 28, 27–30. [Google Scholar] [CrossRef]
  26. Li, Y.; Wang, M.; Li, Q.; Gao, Y.; Li, Q.; Li, J.; Cao, Y. Transcriptome profiling of longissimus lumborum in Holstein bulls and steers with different beef qualities. PloS ONE 2020, 15, e0235218. [Google Scholar] [CrossRef]
  27. Wu, J.; Mao, X.; Cai, T.; Luo, J.; Wei, L. KOBAS server: A web-based platform for automated annotation and pathway identification. Nucleic Acids Res. 2006, 34, W720–W724. [Google Scholar] [CrossRef]
  28. Xiao, C.; Ye, J.; Esteves, R.M.; Rong, C. Using Spearman’s correlation coefficients for exploratory data analysis on big dataset. Concurr. Comput. Pract. Exp. 2016, 28, 3866–3878. [Google Scholar] [CrossRef]
  29. Chen, Y. Transcriptome Profiles of Velvet Antler in Gansu Red Deer. 2021. Available online: https://www.ncbi.nlm.nih.gov/bioproject/772802 (accessed on 19 October 2021).
  30. Altschul, S.F.; Madden, T.L.; Schäffer, A.A.; Zhang, J.; Zhang, Z.; Miller, W.; Lipman, D.J. Gapped BLAST and PSI-BLAST: A new generation of protein database search programs. Nucleic Acids Res. 1997, 25, 3389–3402. [Google Scholar] [CrossRef] [Green Version]
  31. Mount, J.G.; Muzylak, M.; Allen, S.; Althnaian, T.; McGonnell, I.M.; Price, J.S. Evidence that the canonical Wnt signalling pathway regulates deer antler regeneration. Dev. Dyn. Off. Publ. Am. Assoc. Anat. 2006, 235, 1390–1399. [Google Scholar] [CrossRef]
  32. Zhao, Y.; Yao, B.; Zhang, M.; Wang, S.; Zhang, H.; Xiao, W. Comparative analysis of differentially expressed genes in Sika deer antler at different stages. Mol. Biol. Rep. 2013, 40, 1665–1676. [Google Scholar] [CrossRef] [PubMed]
  33. Bana, N.A.; Nyiri, A.; Nagy, J.; Frank, K.; Nagy, T.; Steger, V.; Schiller, M.; Lakatos, P.; Sugar, L.; Horn, P.; et al. The red deer Cervus elaphus genome CerEla1.0: Sequencing, annotating, genes, and chromosomes. Mol. Genet. Genom. MGG 2018, 293, 665–684. [Google Scholar] [CrossRef] [PubMed]
  34. Kumar, S.; Stecher, G.; Tamura, K. MEGA7: Molecular evolutionary genetics analysis version 7.0 for bigger datasets. Mol. Biol. Evol. 2016, 33, 1870–1874. [Google Scholar] [CrossRef] [PubMed] [Green Version]
  35. Chapman, D.I. Antlers–bones of contention. Mammal Rev. 1975, 5, 121–172. [Google Scholar] [CrossRef]
  36. Price, J.S.; Allen, S.; Faucheux, C.; Althnaian, T.; Mount, J.G. Deer antlers: A zoological curiosity or the key to understanding organ regeneration in mammals? J. Anat. 2005, 207, 603–618. [Google Scholar] [CrossRef]
  37. Li, C.; Clark, D.E.; Lord, E.A.; Stanton, J.A.; Suttie, J.M. Sampling technique to discriminate the different tissue layers of growing antler tips for gene discovery. Anat. Rec. 2002, 268, 125–130. [Google Scholar] [CrossRef]
  38. Yao, B.; Zhao, Y.; Zhang, H.; Zhang, M.; Liu, M.; Liu, H.; Li, J. Sequencing and de novo analysis of the Chinese Sika deer antler-tip transcriptome during the ossification stage using Illumina RNA-Seq technology. Biotechnol. Lett. 2012, 34, 813–822. [Google Scholar] [CrossRef]
  39. Yang, X.G.; Chen, Y.X.; Liu, X.D.; Liu, Q.Z.; Pi, X.M.; Liu, Y.H.; Dong, Z. De novo characterization of velvet skin transcriptome at the antlers tips of red deer (Cervus elaphus) and analysis of growth factors and their receptors related to regeneration. Pak. J. Zool. 2016, 48, 151–157. [Google Scholar]
  40. Jia, B.; Liu, Y.; Li, Q.; Zhang, J.; Ge, C.; Wang, G.; Chen, G.; Liu, D.; Yang, F. Altered miRNA and mRNA Expression in Sika Deer Skeletal Muscle with Age. Genes 2020, 11, 172. [Google Scholar] [CrossRef] [Green Version]
  41. Jia, B.; Zhang, L.; Zhang, Y.; Ge, C.; Yang, F.; Du, R.; Ba, H. Integrated analysis of miRNA and mRNA transcriptomic reveals antler growth regulatory network. Mol. Genet. Genom. MGG 2021, 296, 689–703. [Google Scholar] [CrossRef]
  42. Wu, B.; Li, Y.; Li, J.; Xie, Z.; Luan, M.; Gao, C.; Shi, Y.; Chen, S. Genome-wide analysis of alternative splicing and non-coding RNAs reveal complicated transcriptional regulation in Cannabis sativa L. Int. J. Mol. Sci. 2021, 22, 11989. [Google Scholar] [CrossRef] [PubMed]
  43. Venkatachalam, D.; Chambers, J.P.; Kongara, K.; Singh, P. Analgesic efficacy of articaine hydrochloride for velvet antler removal in red deer (Cervus elaphus) and analysis of drug residues in the harvested velvet antlers. N. Z. Vet. J. 2019, 67, 228–233. [Google Scholar] [CrossRef] [PubMed]
  44. Bi, X.; Zhai, J.; Xia, Y.; Li, H. Analysis of genetic information from the antlers of Rangifer tarandus (reindeer) at the rapid growth stage. PLoS ONE 2020, 15, e0230168. [Google Scholar] [CrossRef] [PubMed] [Green Version]
  45. Li, C.; Waldrup, K.A.; Corson, I.D.; Littlejohn, R.P.; Suttie, J.M. Histogenesis of antlerogenic tissues cultivated in diffusion chambers in vivo in red deer (Cervus elaphus). J. Exp. Zool. 1995, 272, 345–355. [Google Scholar] [CrossRef] [PubMed]
  46. Goss, R.J. Tumor-like growth of antlers in castrated fallow deer: An electron microscopic study. Scanning Microsc. 1990, 4, 715–720; discussion 720–721. [Google Scholar] [PubMed]
  47. Rodon, J.; Dienstmann, R.; Serra, V.; Tabernero, J. Development of PI3K inhibitors: Lessons learned from early clinical trials. Nat. Rev. Clin. Oncol. 2013, 10, 143–153. [Google Scholar] [CrossRef]
  48. Xu, W.; Yang, Z.; Lu, N. A new role for the PI3K/Akt signaling pathway in the epithelial-mesenchymal transition. Cell Adhes. Migr. 2015, 9, 317–324. [Google Scholar] [CrossRef] [Green Version]
  49. Ediriweera, M.K.; Tennekoon, K.H.; Samarakoon, S.R. Role of the PI3K/AKT/mTOR signaling pathway in ovarian cancer: Biological and therapeutic significance. Semin. Cancer Biol. 2019, 59, 147–160. [Google Scholar] [CrossRef]
  50. Chang, L.; Graham, P.H.; Ni, J.; Hao, J.; Bucci, J.; Cozzi, P.J.; Li, Y. Targeting PI3K/Akt/mTOR signaling pathway in the treatment of prostate cancer radioresistance. Crit. Rev. Oncol./Hematol. 2015, 96, 507–517. [Google Scholar] [CrossRef]
  51. Dimitrova, V.; Arcaro, A. Targeting the PI3K/AKT/mTOR signaling pathway in medulloblastoma. Curr. Mol. Med. 2015, 15, 82–93. [Google Scholar] [CrossRef]
  52. Ye, B.; Jiang, L.L.; Xu, H.T.; Zhou, D.W.; Li, Z.S. Expression of PI3K/AKT pathway in gastric cancer and its blockade suppresses tumor growth and metastasis. Int. J. Immunopathol. Pharmacol. 2012, 25, 627–636. [Google Scholar] [CrossRef] [PubMed] [Green Version]
  53. Feng, F.B.; Qiu, H.Y. Effects of Artesunate on chondrocyte proliferation, apoptosis and autophagy through the PI3K/AKT/mTOR signaling pathway in rat models with rheumatoid arthritis. Biomed. Pharmacother. 2018, 102, 1209–1220. [Google Scholar] [CrossRef] [PubMed]
  54. Xu, K.; Sha, Y.; Wang, S.; Chi, Q.; Liu, Y.; Wang, C.; Yang, L. Effects of Bakuchiol on chondrocyte proliferation via the PI3K-Akt and ERK1/2 pathways mediated by the estrogen receptor for promotion of the regeneration of knee articular cartilage defects. Cell Prolif. 2019, 52, e12666. [Google Scholar] [CrossRef] [PubMed] [Green Version]
  55. Huang, X.; Ni, B.; Mao, Z.; Xi, Y.; Chu, X.; Zhang, R.; Ma, X.; You, H. NOV/CCN3 induces cartilage protection by inhibiting PI3K/AKT/mTOR pathway. J. Cell. Mol. Med. 2019, 23, 7525–7534. [Google Scholar] [CrossRef] [Green Version]
  56. Zhang, Q.; Lai, S.; Hou, X.; Cao, W.; Zhang, Y.; Zhang, Z. Protective effects of PI3K/Akt signal pathway induced cell autophagy in rat knee joint cartilage injury. Am. J. Transl. Res. 2018, 10, 762–770. [Google Scholar]
  57. Huang, X.; Xi, Y.; Mao, Z.; Chu, X.; Zhang, R.; Ma, X.; Ni, B.; Cheng, H.; You, H. Vanillic acid attenuates cartilage degeneration by regulating the MAPK and PI3K/AKT/NF-κB pathways. Eur. J. Pharmacol. 2019, 859, 172481. [Google Scholar] [CrossRef]
  58. Tao, H.; Cheng, L.; Yang, R. Downregulation of miR-34a promotes proliferation and inhibits apoptosis of rat osteoarthritic cartilage cells by activating PI3K/Akt pathway. Clin. Interv. Aging 2020, 15, 373–385. [Google Scholar] [CrossRef] [Green Version]
  59. Wu, Z.; Lu, H.; Yao, J.; Zhang, X.; Huang, Y.; Ma, S.; Zou, K.; Wei, Y.; Yang, Z.; Li, J.; et al. GABARAP promotes bone marrow mesenchymal stem cells-based the osteoarthritis cartilage regeneration through the inhibition of PI3K/AKT/mTOR signaling pathway. J. Cell. Physiol. 2019, 234, 21014–21026. [Google Scholar] [CrossRef]
  60. Liu, Z.; Zhao, H.; Wang, D.; McMahon, C.; Li, C. Differential effects of the PI3K/AKT pathway on antler stem cells for generation and regeneration of antlers in vitro. Front Biosci Landmark Ed. 2018, 23, 1848–1863. [Google Scholar] [CrossRef]
  61. Dong, Z.; Ba, H.; Zhang, W.; Coates, D.; Li, C. iTRAQ-based quantitative proteomic analysis of the potentiated and dormant antler stem cells. Int. J. Mol. Sci. 2016, 17, 1778. [Google Scholar] [CrossRef] [Green Version]
  62. Clevers, H. Wnt/beta-catenin signaling in development and disease. Cell 2006, 127, 469–480. [Google Scholar] [CrossRef] [PubMed] [Green Version]
  63. Lerner, U.H.; Ohlsson, C. The WNT system: Background and its role in bone. J. Int. Med. 2015, 277, 630–649. [Google Scholar] [CrossRef]
  64. Zhang, H.L.; Yang, Z.Q.; Duan, C.C.; Geng, S.; Wang, K.; Yu, H.F.; Yue, Z.P.; Guo, B. WNT4 acts downstream of BMP2 to mediate the regulation of ATRA signaling on RUNX1 expression: Implications for terminal differentiation of antler chondrocytes. J. Cell. Physiol. 2018, 233, 1129–1145. [Google Scholar] [CrossRef] [PubMed]
  65. Yin, P.; Wang, W.; Zhang, Z.; Bai, Y.; Gao, J.; Zhao, C. Wnt signaling in human and mouse breast cancer: Focusing on Wnt ligands, receptors and antagonists. Cancer Sci. 2018, 109, 3368–3375. [Google Scholar] [CrossRef] [PubMed] [Green Version]
  66. Haraguchi, R.; Kitazawa, R.; Mori, K.; Tachibana, R.; Kiyonari, H.; Imai, Y.; Abe, T.; Kitazawa, S. sFRP4-dependent Wnt signal modulation is critical for bone remodeling during postnatal development and age-related bone loss. Sci. Rep. 2016, 6, 25198. [Google Scholar] [CrossRef] [PubMed]
  67. Wang, T.; Gao, X.; Chen, S.; Li, D.; Chen, S.; Xie, M.; Xu, Z.; Yang, G. Genome-wide identification and expression analysis of ethylene responsive factor family transcription factors in Juglans regia. PeerJ 2021, 9, e12429. [Google Scholar] [CrossRef] [PubMed]
  68. Liu, M.; Yan, C.; Liu, Y.; Wu, Z.; Zhang, J.; Sun, Y. Cloning, expression analysis and RNAi of farnesoic acid O-methylransferase gene from Neocaridina denticulata sinensis. Comp. Biochem. Physiol. B Biochem. Mol. Biol. 2022, 259, 110719. [Google Scholar] [CrossRef]
  69. Lu, S.; Wang, J.; Chitsaz, F.; Derbyshire, M.K.; Geer, R.C.; Gonzales, N.R.; Gwadz, M.; Hurwitz, D.I.; Marchler, G.H.; Song, J.S.; et al. CDD/SPARCLE: The conserved domain database in 2020. Nucleic Acids Res. 2020, 48, D265–D268. [Google Scholar] [CrossRef] [Green Version]
  70. National Research Council (US) Committee for the Update of the Guide for the Care and Use of Laboratory Animals. Guide for the Care and Use of Laboratory Animals, 8th ed.; The National Academies Press: Washington, DC, USA, 2011. [Google Scholar] [CrossRef]
  71. Percie du Sert, N.; Ahluwalia, A.; Alam, S.; Avey, M.T.; Baker, M.; Browne, W.J.; Clark, A.; Cuthill, I.C.; Dirnagl, U.; Emerson, M.; et al. Reporting animal research: Explanation and elaboration for the ARRIVE guidelines 2.0. PLoS Biol. 2020, 18, e3000411. [Google Scholar] [CrossRef]
Figure 1. Statistical histogram of upregulated DEGs and downregulated DEGs in the three libraries. DEGs in the cartilage tissue of the velvet antler at the three time points were analyzed. There were more upregulated DEGs than downregulated DEGs at 30 d vs. 60 d and 30 d vs. 90 d, whereas there were fewer upregulated DEGs than down-regulated DEGs at 60 d vs. 90 d.
Animals 12 00934 g001
Figure 2. Venn diagram of differentially expressed genes. In the Venn diagram, each triangle represents the differential genes in a comparison combination (30 d vs. 60 d, 30 d vs. 90 d, and 60 d vs. 90 d), the number of overlapping triangular regions represents the number of common differential genes among the corresponding comparison combinations, and the non-overlapping region represents the unique differential genes in each comparison combination. A histogram corresponding to the Venn diagram can identify upregulated and downregulated genetic information for comparison combinations. Venn results showed that 30 d vs. 60 d had the maximum number of DEGs (1504), and 30 d vs. 90 d (1432) and 60 d vs. 90 d (1406) had the lowest number of DEGs.
Animals 12 00934 g002
Figure 3. COG classification of all DEGs. COG classification is an important aspect of the functional annotation of DEGs. Among all COG terms, “R: General function prediction only” (90 DEGs, 15.65%), “O: Posttranslational modification, protein tumor, chaperones” (68 DEGs, 11.83%), and “T: Signal transduction mechanisms” (57 DEGs, 9.91%) classified the most DEGs.
Animals 12 00934 g003
Figure 4. GO classification of all DEGs. For GO annotation, the abscissa is the GO term, and the ordinate indicates the number of DEGs annotated to GO terms.
Animals 12 00934 g004
Figure 5. KEGG classification of all DEGs. For KEGG annotation, each circle represents a pathway, the ordinate indicates the name of the pathway, and the abscissa is the enrichment factor. The color of the circle represents the q value, which is the p value after multiple hypothesis test correction. The circle size indicates the number of target genes enriched in the pathway. Pathways with redder colors and larger circles had greater reference values. Twenty pathways with minimum q values are displayed in this study.
Animals 12 00934 g005
Figure 6. Statistical histogram of DEPs in three libraries. The DEPs in the cartilage tissue of the velvet antler at three time points were analyzed. There were more downregulated DEPs than upregulated DEPs in the 30 d vs. 60 d, 30 d vs. 90 d, and 60 d vs. 90 d comparisons.
Animals 12 00934 g006
Figure 7. Venn diagram of DEPs. In the Venn diagram, each triangle represents the differential proteins in a comparison combination (30 d vs. 60 d, 30 d vs. 90 d, and 60 d vs. 90 d), the number of overlapping triangular regions represents the number of common differential genes among the corresponding comparison combinations, and the non-overlapping region represents the unique differential genes in each comparison. A histogram corresponding to the Venn diagram can identify upregulated and downregulated DEPs in each comparison. Venn results showed that 60 d vs. 90 d had the maximum number of DEPs (304), and 30 d vs. 90 d (269) and 30 d vs. 60 d had the lowest number of DEPs (53).
Animals 12 00934 g007
Figure 8. COG classification of all DEPs. Among all COG terms, “J: Translation, ribosomal structure, and biogenesis” (26 DEPs, 21.67%), “O: Posttranslational modi-fication, protein tumor, chaperones” (18 DEPs, 15%), and “R: General function pre-diction only” (16 DEPs, 13%) classified the most DEGs. The COG results of DEPs showed some differences compared with those of DEGs.
Animals 12 00934 g008
Figure 9. GO classification of all DEPs. For GO annotation, the abscissa is the GO term, and the ordinate indicates the number of DEGs annotated to GO terms.
Animals 12 00934 g009
Figure 10. KEGG classification of all DEPs. For KEGG annotation, the ordinate in-dicates the name of the pathways, and the abscissa is the number and percentage of DEPs classified into the pathways. Owing to the small number of screened DEPs, few DEPs were annotated to each signaling pathway.
Animals 12 00934 g010
Figure 11. GO classification of the 488 DEGs and 16 DEPs. For GO annotation, the abscissa is the GO term, and the ordinate indicates the number of DEGs annotated to GO terms. (a) GO classification of the 488 DEGs. (b) GO classification of the 16 se-lected DEPs.
Animals 12 00934 g011
Figure 12. KEGG classification of the 488 DEGs and 16 DEPs. (a) KEGG classifica-tion of the 488 DEGs. “Metabolic pathways,” “PI3K-Akt signaling pathway,” and “Pathways in cancer” classified the most DEGs. (b) KEGG classification of 16 DEPs. Only one DEP annotated to each pathway.
Animals 12 00934 g012
Figure 13. GO classification of DEGs and DEPs with the same trend. For GO anno-tation, the abscissa is the GO term, and the ordinate indicates the number of DEGs annotated to GO terms. (a) GO classification of DEGs with the same trends to DEPs. (b) GO classification of DEPs with the same trends to DEGs.
Animals 12 00934 g013
Figure 14. GO classification of DEGs and DEPs with the reverse trend. For GO an-notation, the abscissa is the GO term, and the ordinate indicates the number of DEGs annotated to GO terms. (a) GO classification of DEGs with the reverse trend to DEPs. (b) GO classification of DEPs with the reverse trend to DEGs.
Animals 12 00934 g014aAnimals 12 00934 g014b
Figure 15. Phylogenetic tree analysis of C. elaphus kansuensis SFRP4 with other species. The tree was constructed using a matrix based on protein sequences and the program MEGA 7 [34].
Animals 12 00934 g015
Table 1. Top unigenes with highest expression in three libraries.
d30 d60 d90
Gene IDFPKMGene IDFPKMGene IDFPKM
gene440621762.164gene440622433.19609gene440618476.40401
gene133639940.114655gene1336317511.18606gene1336313310.13206
gene75686636.798024gene75687031.922373gene16299726.051422
gene28513166.407348gene213603111.317734gene75688106.755774
gene213603036.281532gene28513085.655884gene213603165.661509
gene78422921.125488gene28522773.071777gene28512506.976623
gene73232801.431152gene73232708.365234gene173812460.772705
gene28522557.674316gene173812611.812988gene78422424.758789
gene73812540.665881gene103812538.190388gene28522174.088867
gene103812413.023017gene78422481.294678gene73232160.519531
gene197322199.416988gene16292477.907784gene33362003.781029
gene33362107.003662gene94872229.203369gene103811976.832594
gene169312031.898727gene33362209.905213gene197321887.025254
gene173812001.166626gene158882127.262207newGene_157081807.805496
gene94871994.406006gene181212125.092085newGene_298451741.988892
gene221811956.759766gene197321942.814499newGene_28051664.798706
gene181211939.410617gene33511925.796814gene33511636.892456
gene7231862.862183gene169311909.572655gene158881556.295532
newGene_28051826.791504gene131271883.147461gene169311527.461914
gene158881821.269531gene181311821.30127gene7231490.671143
Table 2. Top proteins with highest expression in three libraries.
d30d60d90
Protein IDExpressionProtein IDExpressionProtein IDExpression
protein73611.686protein11741.719protein34193.398
protein147041.666protein190351.691protein175933.243
protein15191.664protein116701.6protein167933.082
protein45971.66protein109841.596protein93562.86
protein45761.648protein15171.5protein101942.786
protein15211.635protein116981.496protein117902.785
protein116861.592protein131271.464protein44702.669
protein24271.543protein4571.425protein66462.177
protein15121.497protein100131.417protein81352.087
protein151471.443protein147291.416protein102062.007
protein46021.412protein165761.405newProtein_14627.31.908
protein18751.389protein111691.403protein14931.899
newProtein_6084.11.386protein25381.402protein33251.867
protein37881.371protein131911.401protein84621.828
protein46041.369protein100141.393protein26901.827
protein15141.367protein19821.383protein169501.805
protein6291.353protein77651.362protein68001.775
newProtein_16623.21.348protein147301.359protein131641.68
newProtein_20523.11.348protein71421.354protein60201.66
protein152921.345protein58711.352protein165691.66
Table 3. Integrative analysis of transcriptome and proteome.
d30 vs. d60d30 vs. d90d60 vs. d90
mRNAProteinmRNAProteinmRNAProtein
TotalUpDownUpDownTotalUpDownUpDownTotalUpDownUpDown
NDEPs_DEGs764432007636400080185200
DEPs_NDEGs24001113213001179625700125132
DEPs_DEGs853352510151694513323015
DEPs_DEGs same tend0000095454167979
DEPs_DEGs reverse tend853351651111529623236
Abbreviations: DEGs = differentially expressed genes; DEPs = differentially expressed proteins; NDEPs, non-differentially expressed proteins; NDEGs, non-differentially expressed genes.
Publisher’s Note: MDPI stays neutral with regard to jurisdictional claims in published maps and institutional affiliations.

