
Effects of Postbiotics and Paraprobiotics as Replacements for Antibiotics on Growth Performance, Carcass Characteristics, Small Intestine Histomorphology, Immune Status and Hepatic Growth Gene Expression in Broiler Chickens

 , , ,
, , , 
Abstract
:Simple Summary
Abstract
1. Introduction
2. Materials and Methods
2.1. Postbiotic and Paraprobiotic Preparations
2.2. Broiler Chicken Management and Experimental Design
2.3. Sampling and Data Collection
2.4. Carcass Characteristics and Internal Organs
2.5. Small Intestine Histomorphology
2.6. Immunoglobulins Determination
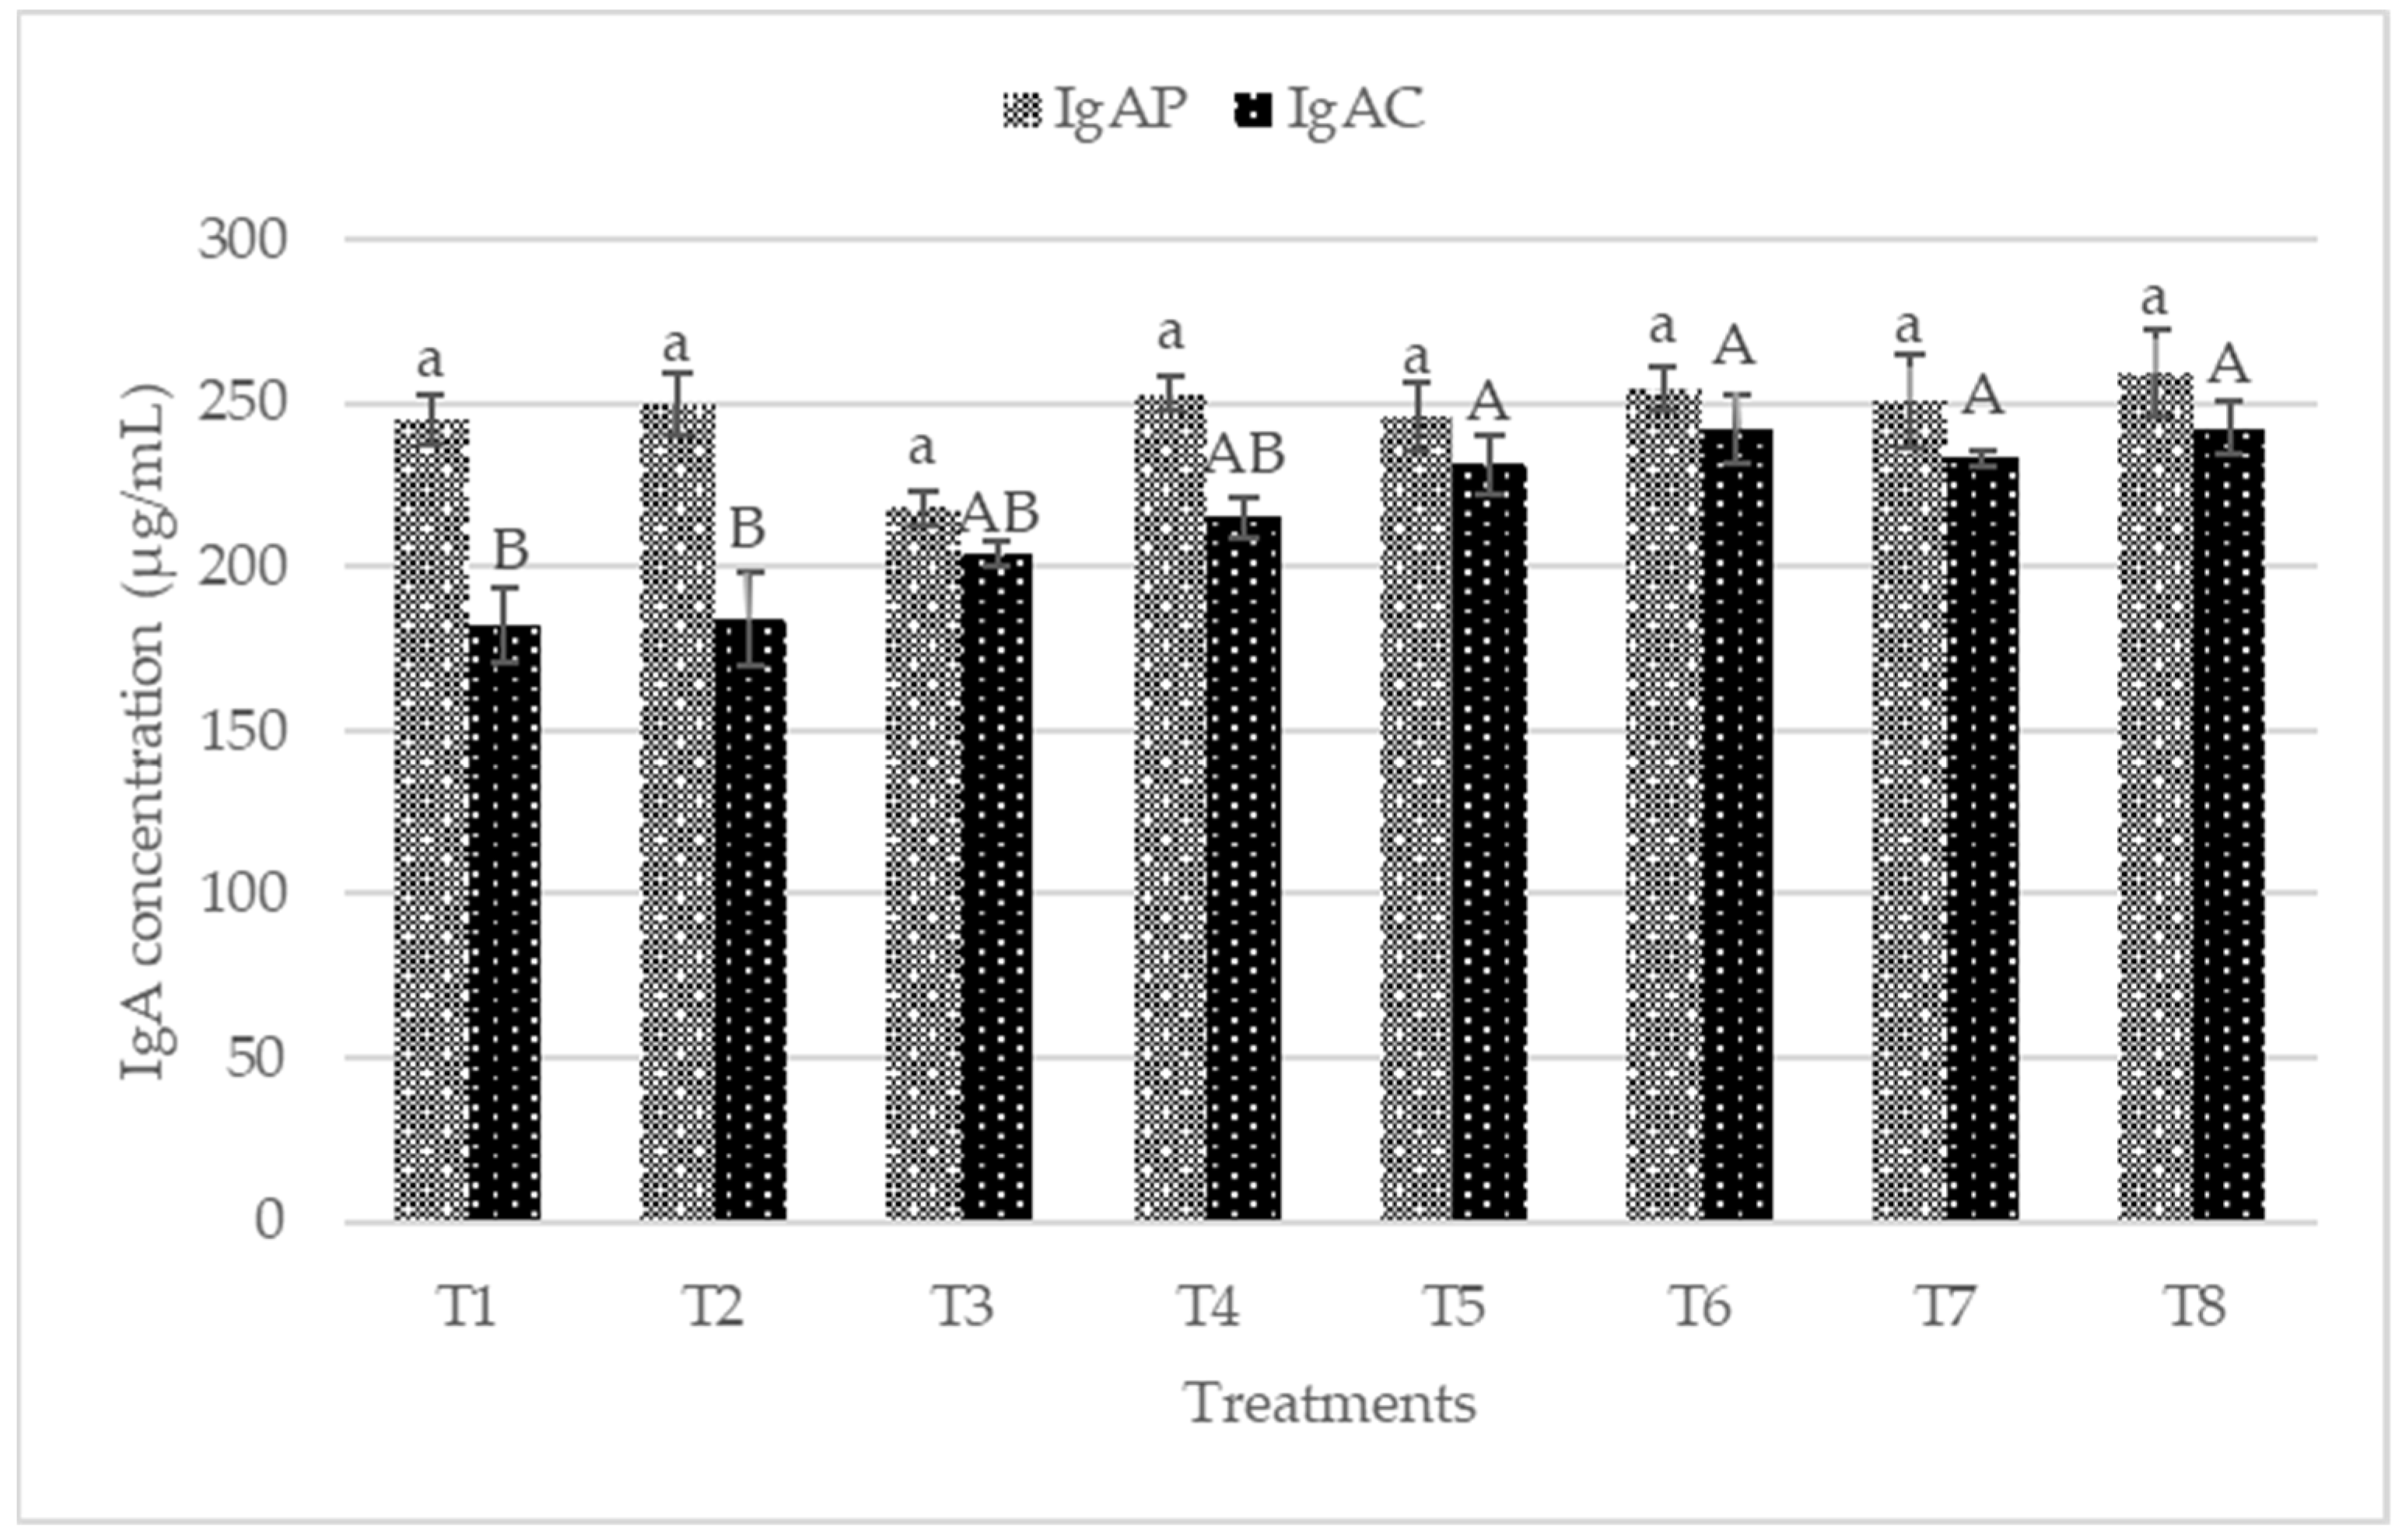
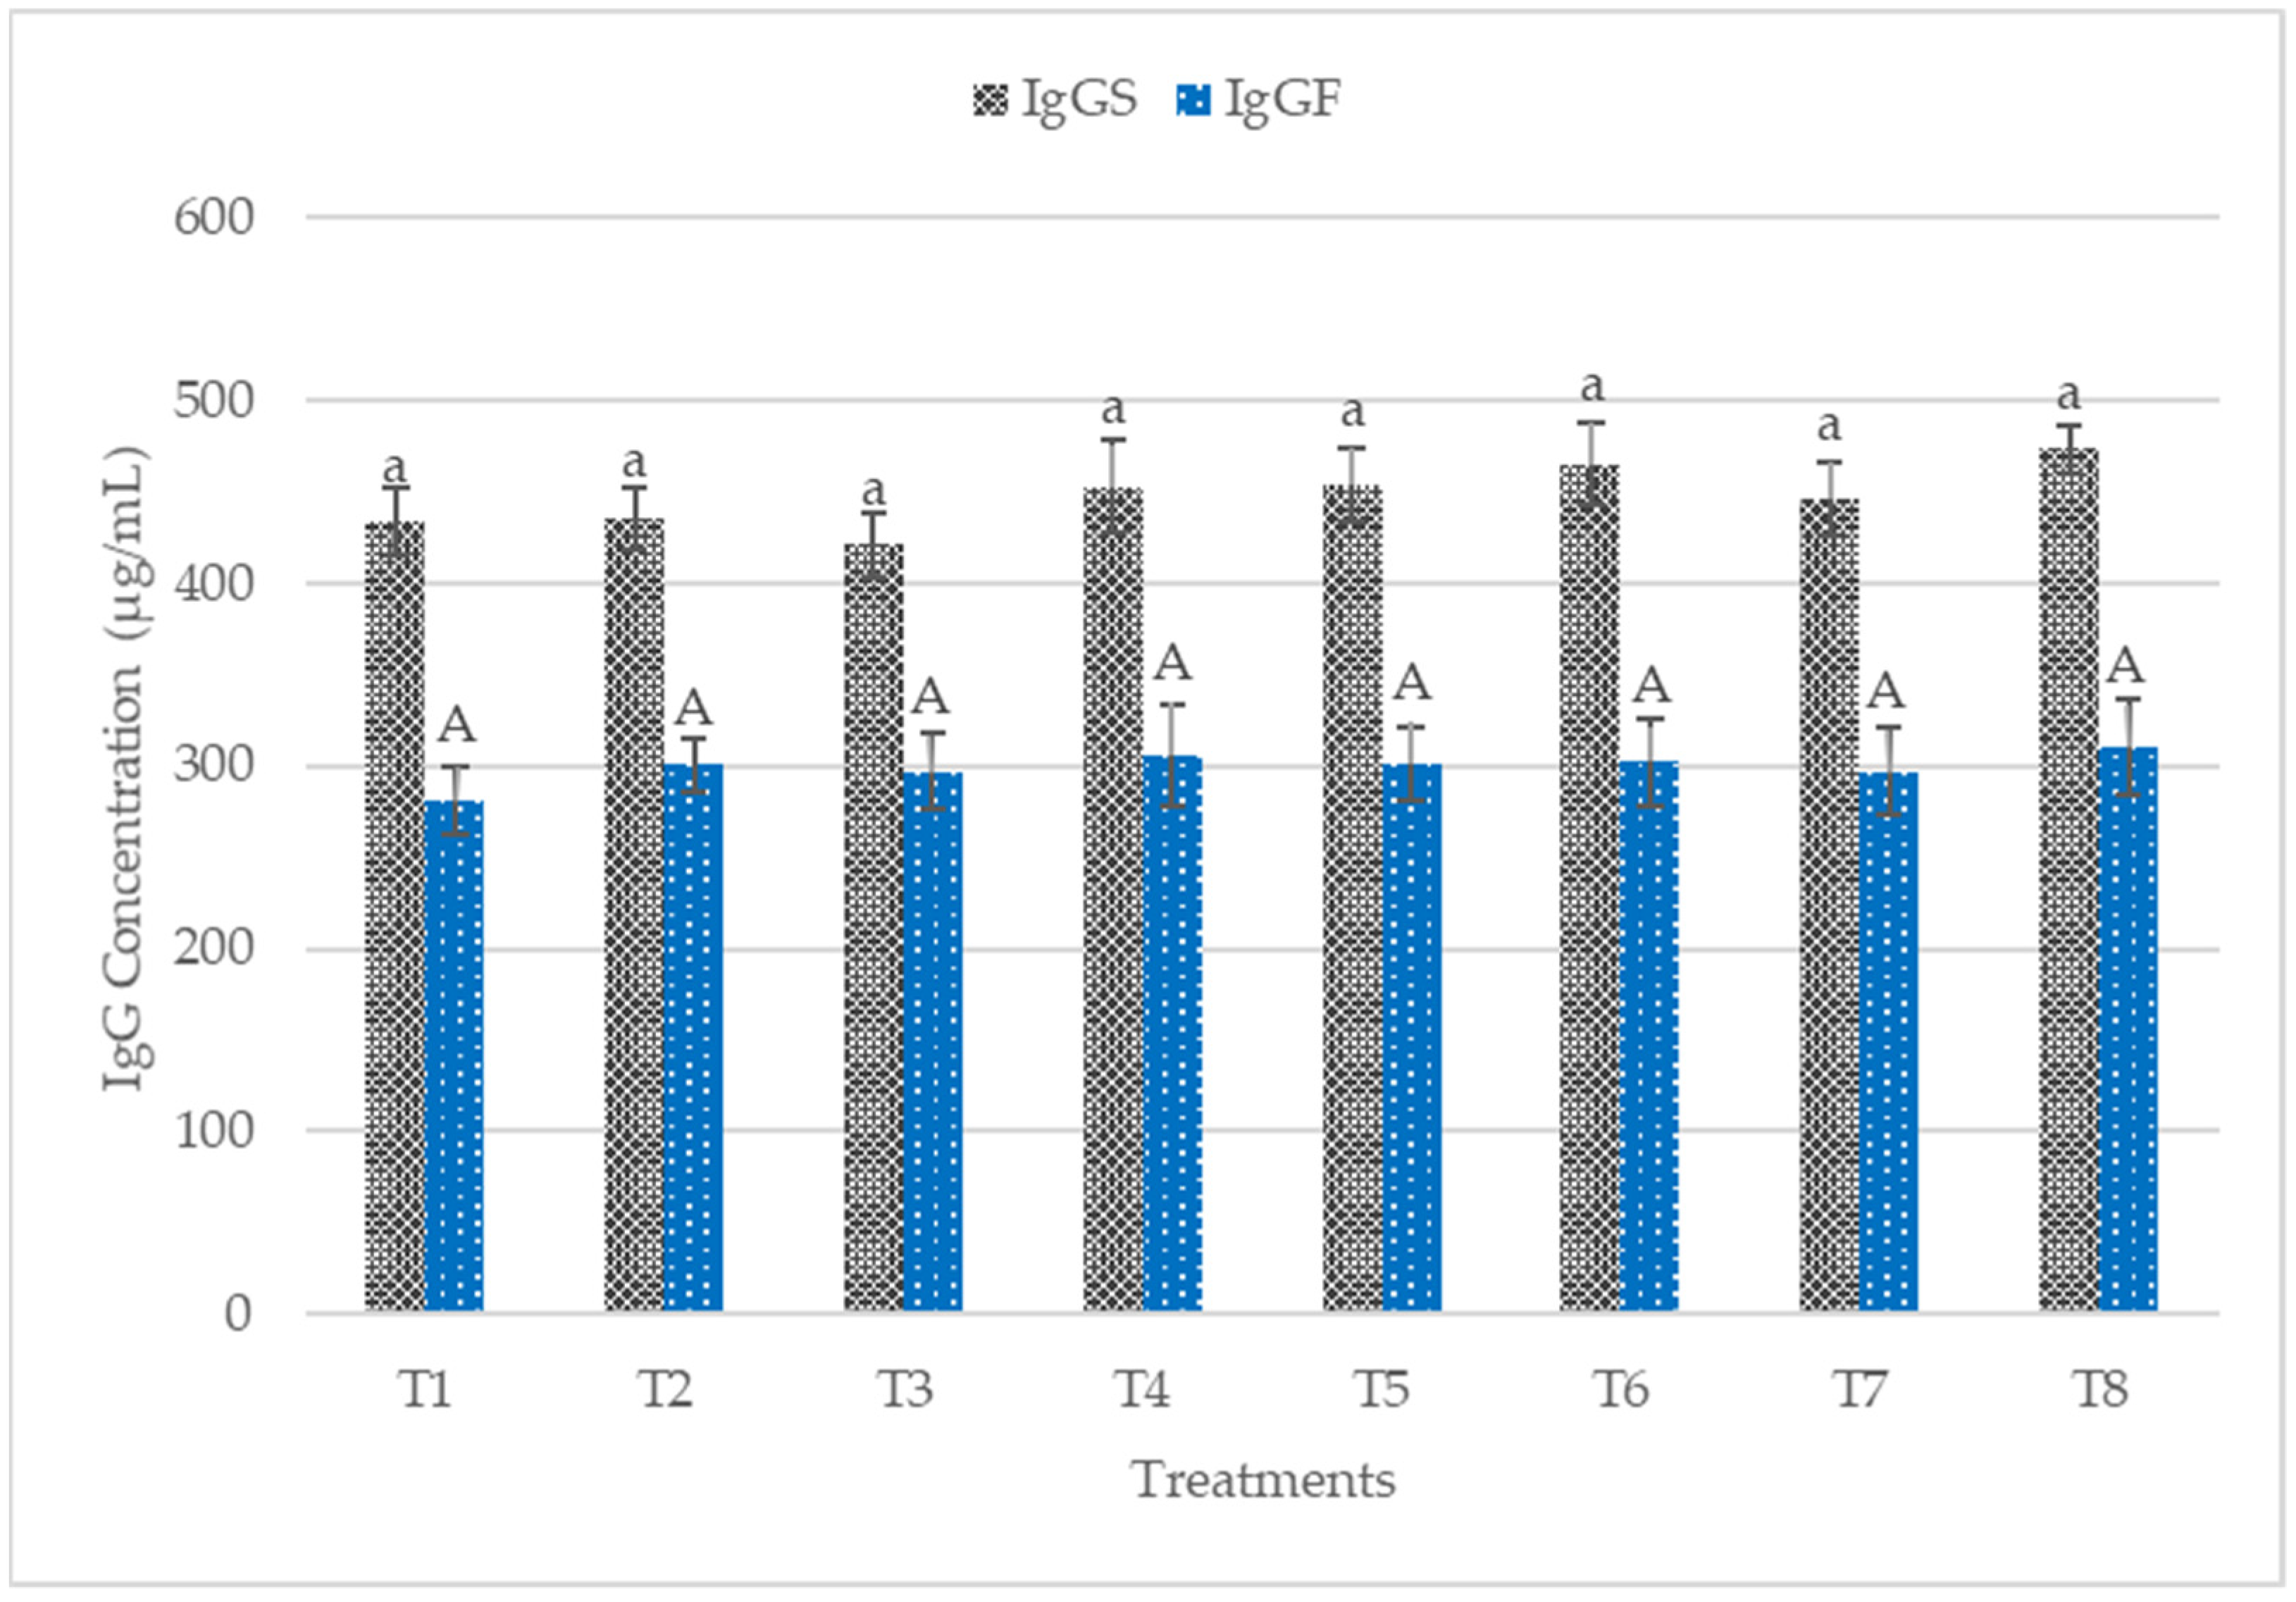
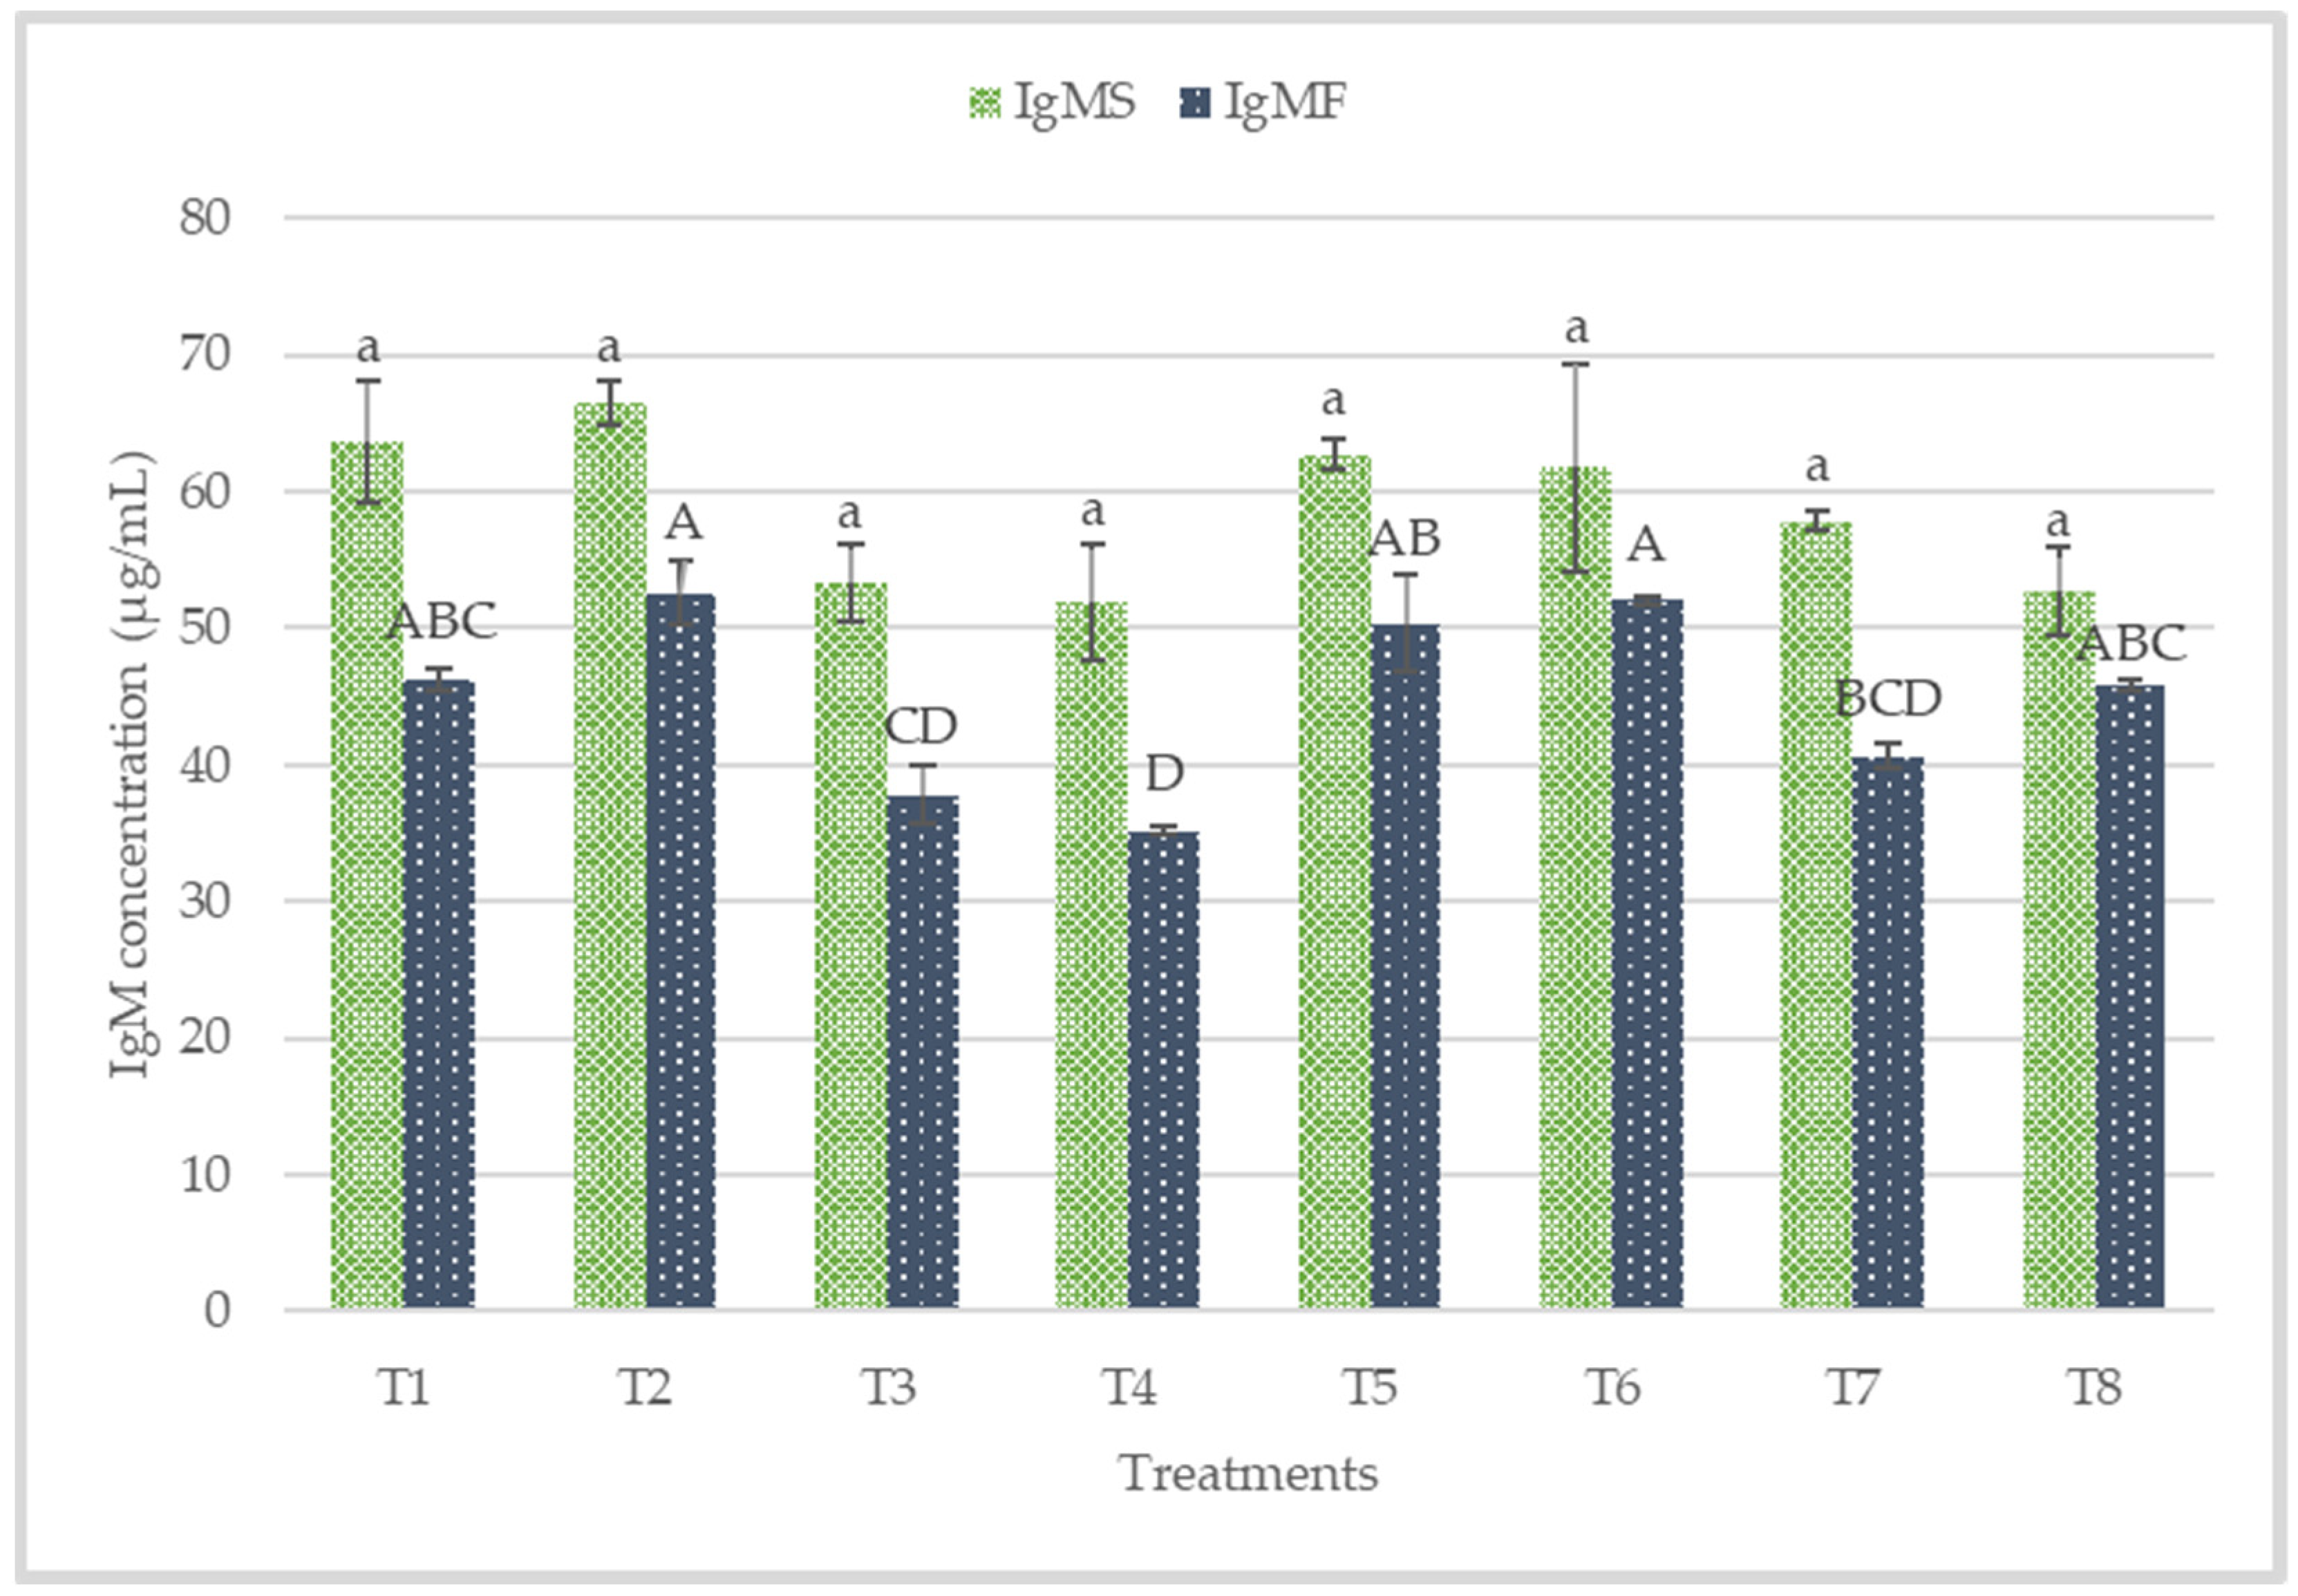
Plasma IgA, IgG, IgM and Colon Mucosa sIgA
2.7. RNA Isolation and Real Time-PCR Analysis for Hepatic IGF-1 and GHR
2.8. Statistical Analysis
3. Results
3.1. Growth Performance of Broilers Fed Postbiotics and Paraprobiotics
3.2. Carcass Characteristics and Internal Organs of Broiler Chicken Fed Postbiotics and Paraprobiotics
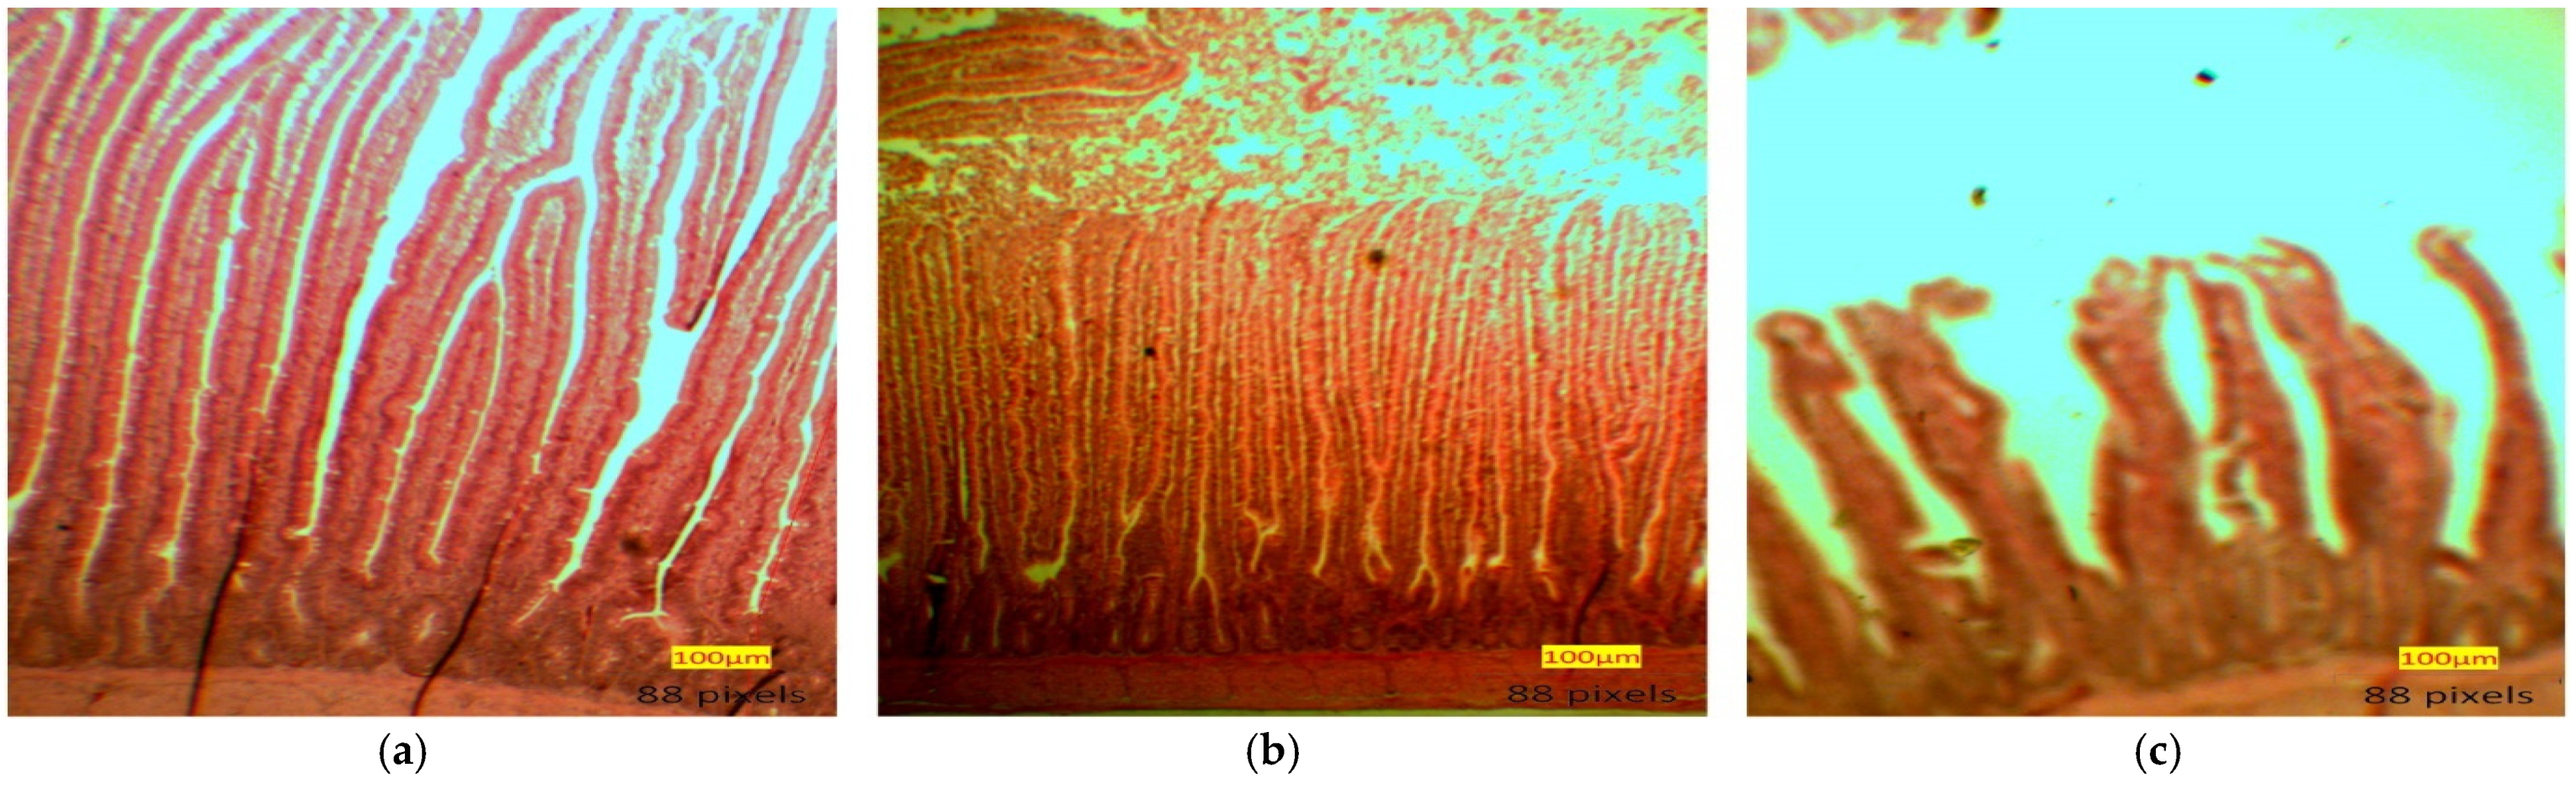
3.3. Small Intestine Histomorphology
3.4. Plasma IgA, IgG, IgM and Colon Mucosa sIgA
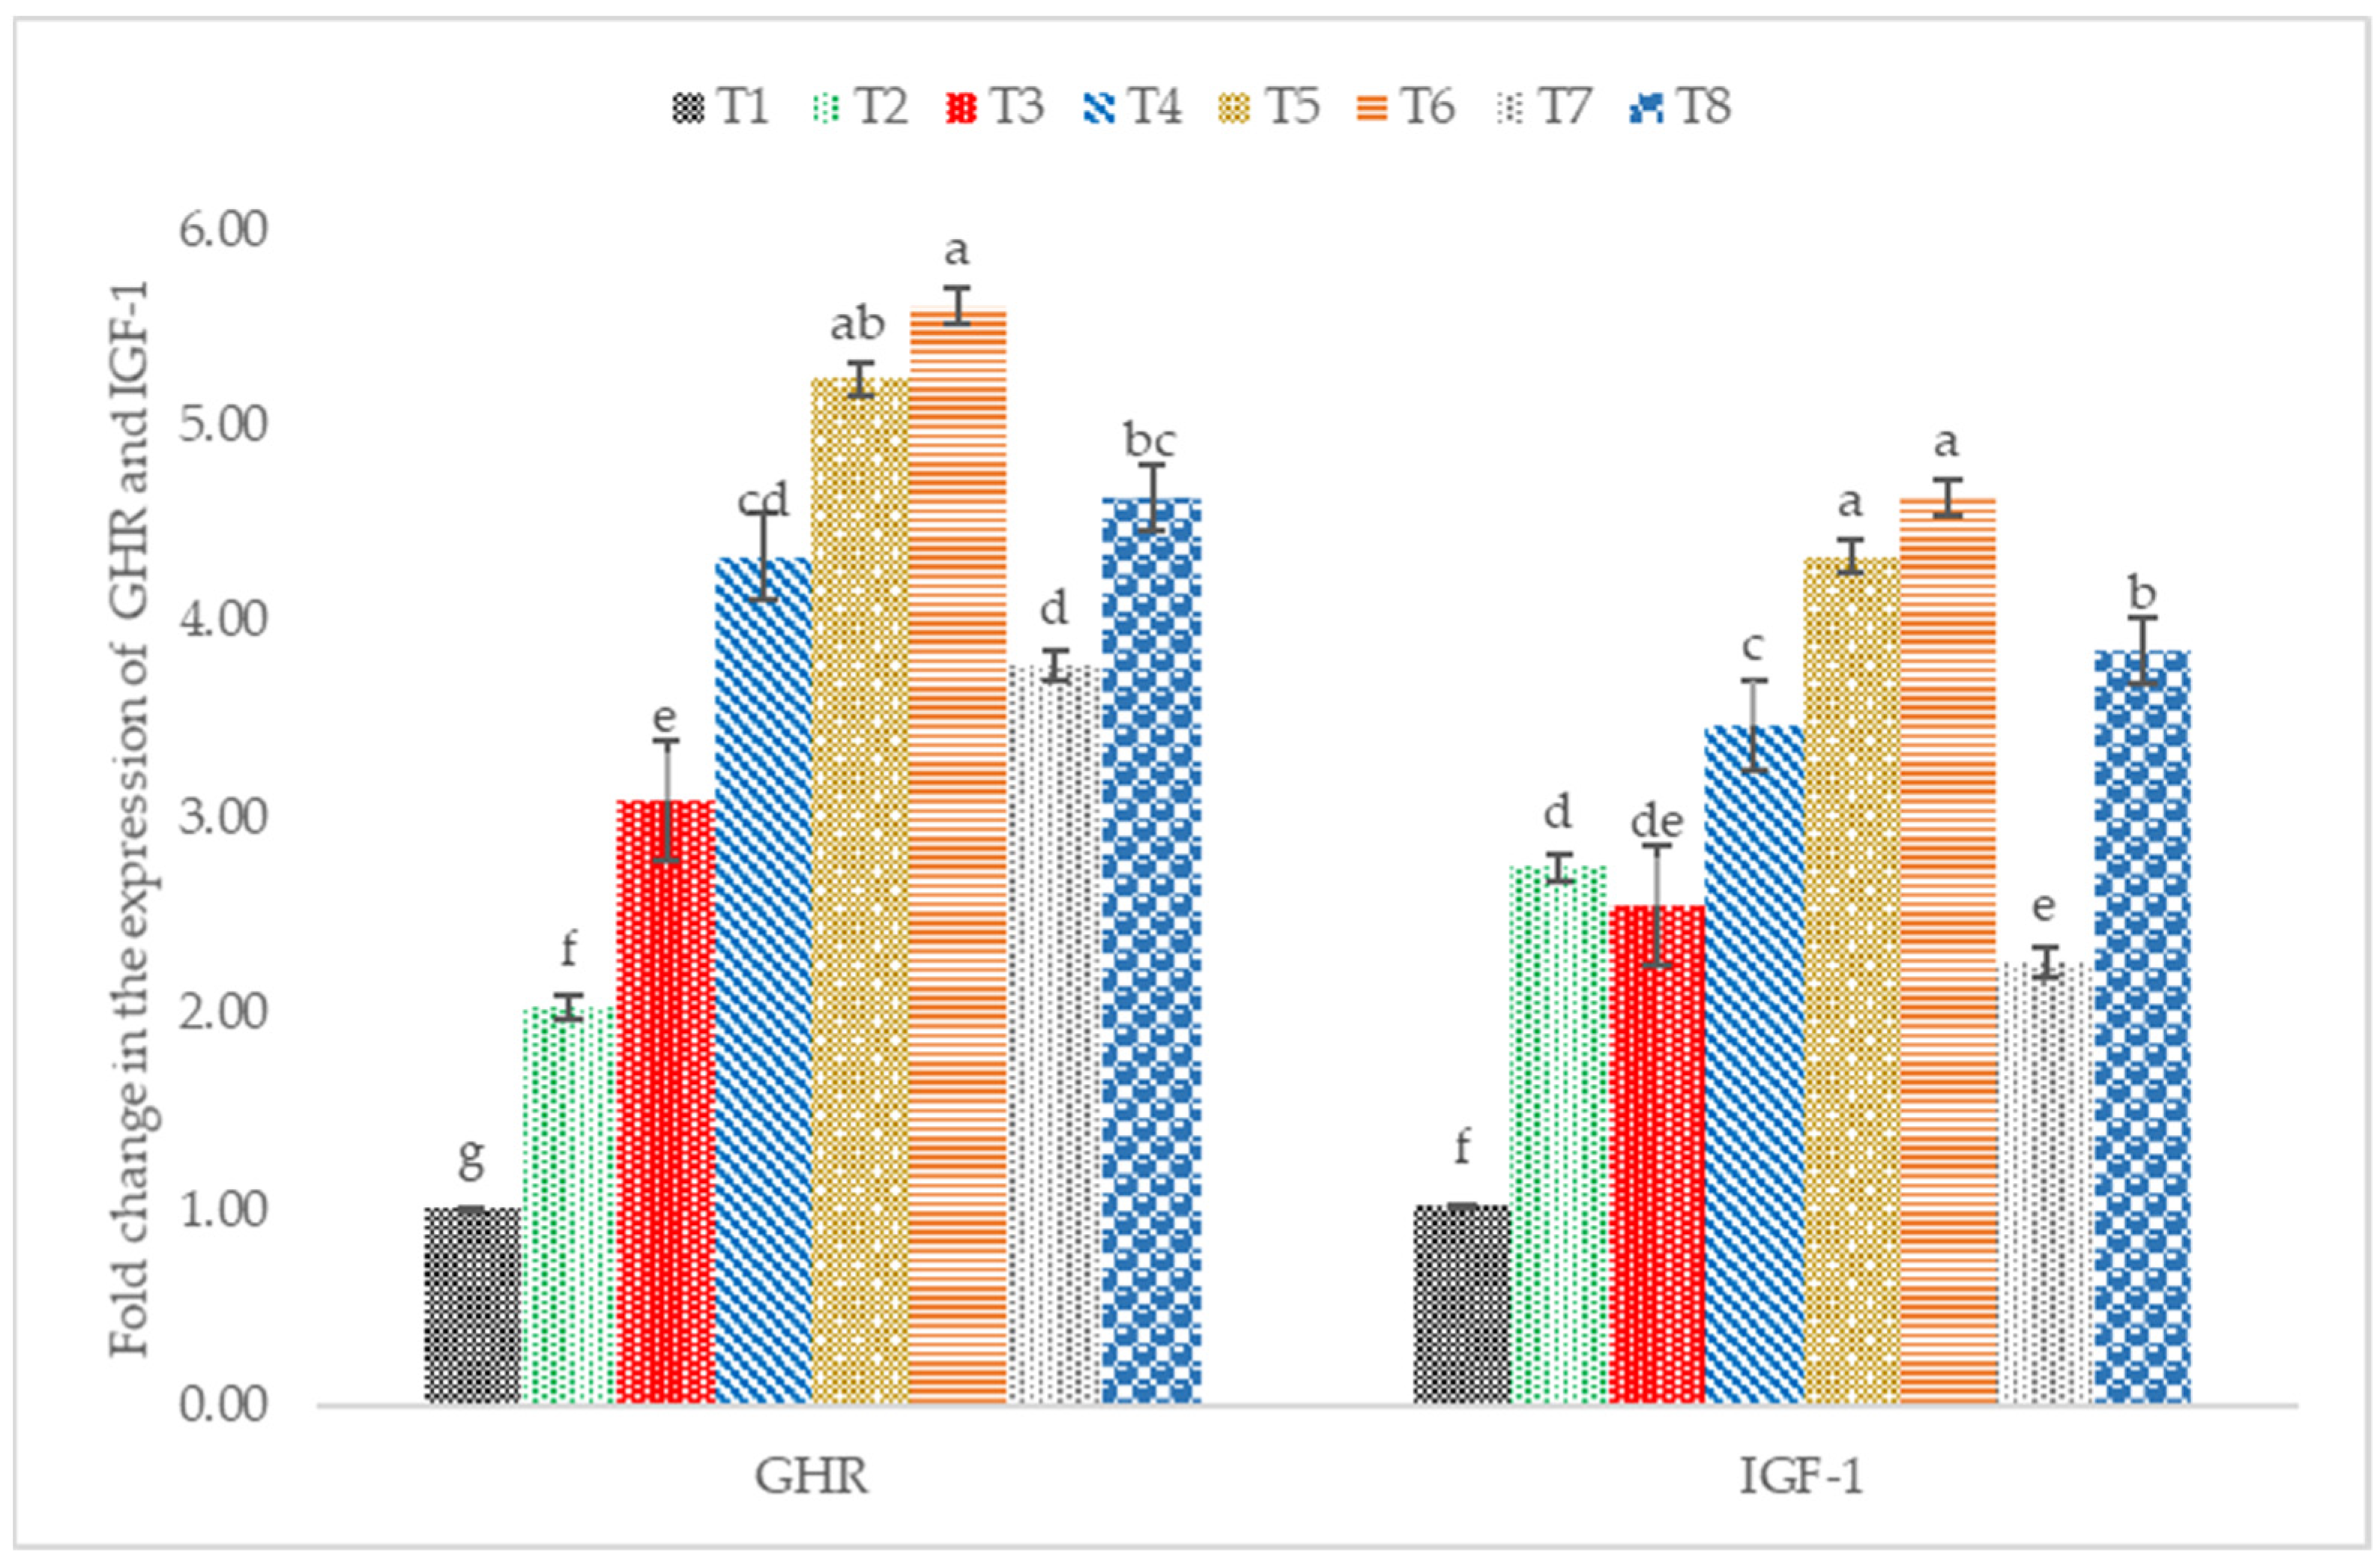
3.5. IGF-1 and GHR mRNA Expression
4. Discussion
4.1. Growth Performance and Carcass Characteristics
4.2. Small Intestine Histomorphology
4.3. Immune Status
4.4. IGF1 and GHR mRNA Expression
5. Conclusions
Author Contributions
Funding
Institutional Review Board Statement
Data Availability Statement
Conflicts of Interest
References
- Mehdi, Y.; Létourneau-Montminy, M.P.; Gaucher, L.M.; Chorfi, Y.; Suresh, G.; Rouissi, T.; Kaur Brar, S.; Côté, C.; Avalos Ramirez, A.; Godbout, S. Use of antibiotics in broiler production: Global impacts and alternatives. Anim. Nutr. 2018, 4, 170–178. [Google Scholar] [CrossRef] [PubMed]
- Lee, K.W.; Ho Hong, Y.; Lee, S.H.; Jang, S.I.; Park, M.S.; Bautista, D.A.; Ritte, G.D.; Jeong, W.; Jeoung, H.; An, D.; et al. Effects of anticoccidial and antibiotic growth promoter programs on broiler performance and immune status. Res. Vet. Sci. 2012, 93, 721–728. [Google Scholar] [CrossRef] [PubMed]
- Diarra, M.S.; Silversides, F.G.; Diarrassouba, F.; Pritchard, J.; Masson, L.; Brousseau, R.; Bonnet, C.; Delaquis, P.; Bach, S.; Skura, B.J.; et al. Impact of feed supplementation with antimicrobial agents on growth performance of broiler chickens, Clostridium perfringens and Enterococcus counts, and antibiotic resistance phenotypes and distribution of antimicrobial resistance determinants in Escherichia. Appl. Environ. Microbiol. 2007, 73, 6566–6576. [Google Scholar] [CrossRef] [PubMed] [Green Version]
- Gonzalez Ronquillo, M.; Angeles Hernandez, J.C. Antibiotic and synthetic growth promoters in animal diets: Review of impact and analytical methods. Food Control 2017, 72, 255–267. [Google Scholar] [CrossRef]
- Diarra, M.S.; Malouin, F. Antibiotics in Canadian poultry productions and anticipated alternatives. Front. Microbiol. 2014, 5, 1–15. [Google Scholar] [CrossRef] [Green Version]
- Vanbelle, M.; Teller, E.; Focant, M. Archiv für Tierernaehrung Probiotics in Animal Nutrition: A Review. Arch. Anim. Nutr. 1990, 40, 543–567. [Google Scholar]
- Loh, T.C.; Choe, D.W.; Foo, H.L.; Sazili, A.Q.; Bejo, M.H. Effects of feeding different postbiotic metabolite combinations produced by Lactobacillus plantarum strains on egg quality and production performance, faecal parameters and plasma cholesterol in laying hens. BMC Vet. Res. 2014, 10, 1–9. [Google Scholar] [CrossRef] [Green Version]
- Kareem, K.Y.; Loh, T.C.; Foo, H.L.; Asmara, S.A.; Akit, H.; Abdulla, N.R.; Foongooi, M. Carcass, meat and bone quality of broiler chickens fed with postbiotic and prebiotic combinations. Int. J. Probiot. Prebiot. 2015, 10, 23–30. [Google Scholar]
- Loh, T.C. Animal Feed The Way Forward; Penerbit UPM: Seri Kembangan, Malaysia, 2017. [Google Scholar]
- Rasko, D.A.; Sperandio, V. Anti-virulence strategies to combat bacteria-mediated disease. Nat. Rev. Drug Discov. 2010, 9, 117–128. [Google Scholar] [CrossRef]
- FAO/WHO. Guidelines for the Evaluation of Probiotics in Food; Joint FAO/WHO Working Group: London, ON, Canada, 2002; pp. 1–11. [Google Scholar]
- Tsilingiri, K.; Rescigno, M. Postbiotics: What else? Benef. Microbes 2013, 4, 101–107. [Google Scholar] [CrossRef]
- Vandenbergh, P.A. Lactic acid bacteria, their metabolic products and interference with microbial growth. FEMS Microbiol. Rev. 1993, 12, 221–237. [Google Scholar] [CrossRef]
- Brandão, R.L.; Castro, I.M.; Bambirra, E.A.; Amaral, S.C.; Fietto, L.G.; Tropia, M.J.M.; José Neves, M.; Dos Santos, R.G.; Gomes, N.C.M.; Nicoli, J.R. Intracellular signal triggered by cholera toxin in Saccharomyces boulardii and Saccharomyces cerevisiae. Appl. Environ. Microbiol. 1998, 64, 564–568. [Google Scholar] [CrossRef] [PubMed] [Green Version]
- Isolauri, E.; Sütas, Y.; Kankaanpää, P.; Arvilommi, H.; Salminen, S. Probiotics: Effects on immunity. Am. J. Clin. Nutr. 2001, 73 (Suppl. 2), 444–450. [Google Scholar] [CrossRef] [PubMed] [Green Version]
- Marteau, P.; Shanahan, F. Basic aspects and pharmacology of probiotics: An overview of pharmacokinetics, mechanisms of action and side-effects. Best Pract. Res. Clin. Gastroenterol. 2003, 17, 725–740. [Google Scholar] [CrossRef]
- Huang, M.K.; Choi, Y.J.; Houde, R.; Lee, J.W.; Lee, B.; Zhao, X. Effects of lactobacilli and an acidophilic fungus on the production performance and immune responses in broiler chickens. Poult. Sci. 2004, 83, 788–795. [Google Scholar] [CrossRef]
- Rijkers, G.T.; Bengmark, S.; Enck, P.; Haller, D.; Herz, U.; Kalliomaki, M.; Kudo, S.; Lenoir-Wijnkoop, I.; Mercenier, A.; Myllyluoma, E.; et al. Guidance for substantiating the evidence for beneficial effects of probiotics: Current status and recommendations for future research. J. Nutr. 2010, 140, 671–676. [Google Scholar] [CrossRef] [Green Version]
- Hossain, M.E.; Kim, G.M.; Lee, S.K.; Yang, C.J. Growth Performance, Meat Yield, Oxidative Stability, and Fatty Acid Composition of Meat from Broilers Fed Diets Supplemented with a Medicinal Plant and Probiotics. Asian-Australas. J. Anim. Sci. 2012, 25, 1159–1168. [Google Scholar] [CrossRef]
- Nayak, S.K. Probiotics and immunity: A fish perspective. Fish Shellfish Immunol. 2010, 29, 2–14. [Google Scholar] [CrossRef]
- Ottesen, O.H.; Olafsen, J.A. Effects on survival and mucous cell proliferation of Atlantic halibut, Hippoglossus, L., larvae following microflora manipulation. Aquaculture 2000, 187, 225–238. [Google Scholar] [CrossRef]
- Adams, C.A. The probiotic paradox: Live and dead cells are biological response modifiers. Nutr. Res. Rev. 2010, 23, 37–46. [Google Scholar] [CrossRef] [Green Version]
- Fuller, R.; Fuller, R. History and development of probiotics. Probiotics 1992, 1–8. [Google Scholar] [CrossRef]
- Ringø, E.; Gatesoupe, F.J. Lactic acid bacteria in fish: A review. Aquaculture 1998, 160, 177–203. [Google Scholar] [CrossRef]
- Balcázar, J.L.; de Blas, I.; Ruiz-Zarzuela, I.; Cunningham, D.; Vendrell, D.; Múzquiz, J.L. The role of probiotics in aquaculture. Vet. Microbiol. 2006, 114, 173–186. [Google Scholar] [CrossRef] [PubMed]
- Newaj-Fyzul, A.; Al-Harbi, A.H.; Austin, B. Review: Developments in the use of probiotics for disease control in aquaculture. Aquaculture 2014, 431, 1–11. [Google Scholar] [CrossRef]
- Thanh, N.T.; Loh, T.C.; Foo, H.L.; Azhar, B.K. Effects of feeding metabolite combinations produced by Lactobacillus plantarum on growth performance, faecal microbial population, small intestine villus height and faecal volatile fatty acids in broilers. Br. Poult. Sci. 2009, 50, 298–306. [Google Scholar] [CrossRef] [PubMed]
- Loh, T.C.; Thanh, N.T.; Foo, H.L.; Hair-Bejo, M.; Azhar, B.K. Feeding of different levels of metabolite combinations produced by Lactobacillus plantarum on growth performance, fecal microflora, volatile fatty acids and villi height in broilers. Anim. Sci. J. 2010, 81, 205–214. [Google Scholar] [CrossRef]
- Thu, T.V.; Loh, T.C.; Foo, H.L.; Yaakub, H.; Bejo, M.H. Effects of liquid metabolite combinations produced by Lactobacillus plantarum on growth performance, faeces characteristics, intestinal morphology and diarrhoea incidence in postweaning piglets. Trop. Anim. Health Prod. 2011, 43, 69–75. [Google Scholar] [CrossRef] [Green Version]
- Choe, D.W.; Loh, T.C.; Foo, H.L.; Hair-Bejo, M.; Awis, Q.S. Egg production, faecal pH and microbial population, small intestine morphology, and plasma and yolk cholesterol in laying hens given liquid metabolites produced by Lactobacillus plantarum strains. Br. Poult. Sci. 2012, 53, 106–115. [Google Scholar] [CrossRef]
- Choe, D.W.; Foo, H.L.; Loh, T.C.; Hair-Bejo, M.; Awis, Q.S. Inhibitory property of metabolite combinations produced from lactobacillus plantarum strains. Pertanika J. Trop. Agric. Sci. 2013, 36, 79–88. [Google Scholar]
- Thanh, N.T.; Chwen, L.T.; Foo, H.L.; Hair-bejo, M.; Kasim, A.B. Inhibitory activity of metabolites produced by strains of Lactobacillus plantarum isolated from Malaysian fermented food. Int. J. Probiot. Prebiot. 2010, 5, 37–44. [Google Scholar]
- Kareem, K.Y.; Ling, F.H.; Chwen, L.T.; Foong, O.M.; Asmara, S.A. Inhibitory activity of postbiotic produced by strains of Lactobacillus plantarum using reconstituted media supplemented with inulin. Gut Pathog. 2014, 6, 1–7. [Google Scholar] [CrossRef] [PubMed] [Green Version]
- Taverniti, V.; Guglielmetti, S. The immunomodulatory properties of probiotic microorganisms beyond their viability (ghost probiotics: Proposal of paraprobiotic concept). Genes Nutr. 2011, 6, 261–274. [Google Scholar] [CrossRef] [PubMed] [Green Version]
- de Almada, C.N.; Almada, C.N.; Martinez, R.C.R.; Sant’Ana, A.S. Paraprobiotics: Evidences on their ability to modify biological responses, inactivation methods and perspectives on their application in foods. Trends Food Sci. Technol. 2016, 58, 96–114. [Google Scholar] [CrossRef]
- Choudhury, T.G.; Kamilya, D. Paraprobiotics: An aquaculture perspective. Rev. Aquac. 2018, 11, 1–13. [Google Scholar] [CrossRef]
- Fujiki, T.; Hirose, Y.; Yamamoto, Y.; Murosaki, S. Enhanced immunomodulatory activity and stability in simulated digestive juices of Lactobacillus plantarum L-137 by heat treatment. Biosci. Biotechnol. Biochem. 2012, 76, 918–922. [Google Scholar] [CrossRef] [Green Version]
- Ou, C.C.; Lin, S.L.; Tsai, J.J.; Lin, M.Y. Heat-Killed Lactic Acid Bacteria Enhance Immunomodulatory Potential by Skewing the Immune Response toward Th1 Polarization. J. Food Sci. 2011, 76, M260–M267. [Google Scholar] [CrossRef]
- Villena, J.; Barbieri, N.; Salva, S.; Herrera, M.; Alvarez, S. Enhanced immune response to pneumococcal infection in malnourished mice nasally treated with heat-killed Lactobacillus casei. Microbiol. Immunol. 2009, 53, 636–646. [Google Scholar] [CrossRef]
- Grześkowiak, L.; Collado, M.C.; Beasley, S.; Salminen, S. Pathogen exclusion properties of canine probiotics are influenced by the growth media and physical treatments simulating industrial processes. J. Appl. Microbiol. 2014, 116, 1308–1314. [Google Scholar] [CrossRef]
- Shin, H.S.; Park, S.Y.; Lee, D.K.; Kim, S.A.; An, H.M.; Kim, J.R.; Kim, M.J.; Cha, M.G.; Lee, S.W.; Kim, K.J.; et al. Hypocholesterolemic effect of sonication-killed Bifidobacterium longum isolated from healthy adult Koreans in high cholesterol fed rats. Arch. Pharmacal Res. 2010, 33, 1425–1431. [Google Scholar] [CrossRef]
- Zheng, J.; Wittouck, S.; Salvetti, E.; Franz, C.M.A.P.; Harris, H.M.B.; Mattarelli, P.; O’Toole, P.W.; Pot, B.; Vandamme, P.; Walter, J.; et al. A taxonomic note on the genus Lactobacillus: Description of 23 novel genera, emended description of the genus Lactobacillus beijerinck 1901, and union of Lactobacillaceae and Leuconostocaceae. Int. J. Syst. Evol. Microbiol. 2020, 70, 2782–2858. [Google Scholar] [CrossRef]
- Thu, T.V.; Foo, H.L.; Loh, T.C.; Bejo, M.H. Inhibitory activity and organic acid concentrations of metabolite combinations produced by various strains of Lactobacillus plantarum. Afr. J. Biotechnol. 2011, 10, 1359–1363. [Google Scholar]
- Humam, A.M.; Loh, T.C.; Foo, H.L.; Samsudin, A.A.; Mustapha, N.M.; Zulkifli, I.; Izuddin, W.I. Effects of feeding different postbiotics produced by Lactobacillus plantarum on growth performance, carcass yield, intestinal morphology, gut microbiota composition, immune status, and growth gene expression in broilers under heat stress. Animals 2019, 9, 644. [Google Scholar] [CrossRef] [PubMed] [Green Version]
- Mohamad, Z.N.A.; Foo, H.L.; Loh, T.C.; Mohamad, R.; Rahim, R.A. Enhancement of Versatile Extracellular Cellulolytic and Hemicellulolytic Enzyme Productions by Lactobacillus plantarum RI 11 Isolated from Malaysian Food Using Renewable Natural Polymers. Molecules 2020, 25, 2607. [Google Scholar] [CrossRef] [PubMed]
- Ooi, M.F.; Nurzafirah, M.; Hooi, L.F.; Teck, C.L.; Rosfarizan, M.; Raha, A.R.; Arbakariya, A. Effects of carbon and nitrogen sources on bacteriocin-inhibitory activity of postbiotic metabolites produced by Lactobacillus plantarum I-UL4. Malays. J. Microbiol. 2015, 11, 176–184. [Google Scholar] [CrossRef]
- SAS/STAT User’s Guide: Version 9.0; SAS, Institute Inc.: Cary, NC, USA, 2003.
- Kareem, K.Y.; Loh, T.C.; Foo, H.L.; Asmara, S.A.; Akit, H. Influence of postbiotic RG14 and inulin combination on cecal microbiota, organic acid concentration, and cytokine expression in broiler chickens. Poult. Sci. 2017, 96, 966–975. [Google Scholar] [CrossRef]
- Alayande, K.A.; Aiyegoro, O.; Ateba, C.N. Probiotics in animal husbandry: Applicability and associated risk factors. Sustainability 2020, 12, 1087. [Google Scholar] [CrossRef] [Green Version]
- Slavin, J. Fiber and prebiotics: Mechanisms and health benefits. Nutrients 2013, 5, 1417–1435. [Google Scholar] [CrossRef] [Green Version]
- Konstantinov, S.R.; Kuipers, E.J.; Peppelenbosch, M.P. Functional genomic analyses of the gut microbiota for crc screening. Nat. Rev. Gastroenterol. Hepatol. 2013, 10, 741–745. [Google Scholar] [CrossRef]
- Sánchez, B.; Delgado, S.; Blanco-Míguez, A.; Lourenço, A.; Gueimonde, M.; Margolles, A. Probiotics, gut microbiota, and their influence on host health and disease. Mol. Nutr. Food Res. 2017, 61, 1–15. [Google Scholar] [CrossRef] [Green Version]
- Markowiak, P.; Ślizewska, K. Effects of probiotics, prebiotics, and synbiotics on human health. Nutrients 2017, 9, 1021. [Google Scholar] [CrossRef]
- Wegh, C.A.M.; Schoterman, M.H.C.; Vaughan, E.E.; Belzer, C.; Benninga, M.A. The effect of fiber and prebiotics on children’s gastrointestinal disorders and microbiome. Expert Rev. Gastroenterol. Hepatol. 2017, 11, 1031–1045. [Google Scholar] [CrossRef] [PubMed] [Green Version]
- O’Grady, J.; O’Connor, E.M.; Shanahan, F. Review article: Dietary fibre in the era of microbiome science. Aliment. Pharmacol. Ther. 2019, 49, 506–515. [Google Scholar] [CrossRef] [PubMed] [Green Version]
- Wegh, C.A.M.; Geerlings, S.Y.; Knol, J.; Roeselers, G.; Belzer, C. Postbiotics and their potential applications in early life nutrition and beyond. Int. J. Mol. Sci. 2019, 20, 4673. [Google Scholar] [CrossRef] [PubMed] [Green Version]
- Ho, Y.W.; Kalavathy, R.; Abdullah, N.; Jalaludin, S. Effects of Probiotic on Fat Deposition, Serum Lipids and Cholesterol in Broilers. UPM Research Report 1997–2000, Section 2, Extended Abstract. 109–110.
- Jha, R.; Das, R.; Oak, S.; Mishra, P. Probiotics (Direct-Fed Microbials) in Poultry Nutrition and Their Effects on Nutrient Utilization, Growth and Laying Performance, and Gut Health: A Systematic Review. Animals 2020, 10, 1863. [Google Scholar] [CrossRef] [PubMed]
- Uni, Z.; Noy, Y.; Sklan, D. Posthatch changes in morphology and function of the small intestines in heavy- and light-strain chicks. Poult. Sci. 1995, 74, 1622–1629. [Google Scholar] [CrossRef] [PubMed]
- Kareem, K.Y.; Loh, T.C.; Foo, H.L.; Akit, H.; Samsudin, A.A. Effects of dietary postbiotic and inulin on growth performance, IGF1 and GHR mRNA expression, faecal microbiota and volatile fatty acids in broilers. BMC Vet. Res. 2016, 12, 8–17. [Google Scholar] [CrossRef] [PubMed] [Green Version]
- Xu, Z.R.; Hu, C.H.; Xia, M.S.; Zhan, X.A.; Wang, M.Q. Effects of dietary fructooligosaccharide on digestive enzyme activities, intestinal microflora and morphology of male broilers. Poult. Sci. 2003, 82, 1030–1036. [Google Scholar] [CrossRef]
- Bucław, M. The use of inulin in poultry feeding: A review. J. Anim. Physiol. Anim. Nutr. 2016, 100, 1015–1022. [Google Scholar] [CrossRef] [PubMed] [Green Version]
- Macpherson, A.J.; Yilmaz, B.; Limenitakis, J.P.; Ganal-Vonarburg, S.C. IgA Function in Relation to the Intestinal Microbiota. Annu. Rev. Immunol. 2018, 36, 359–381. [Google Scholar] [CrossRef]
- Palm, N.W.; De Zoete, M.R.; Cullen, T.W.; Barry, N.A.; Stefanowski, J.; Hao, L.; Degnan, P.H.; Hu, J.; Peter, I.; Zhang, W.; et al. Immunoglobulin A coating identifies colitogenic bacteria in inflammatory bowel disease. Cell 2014, 158, 1000–1010. [Google Scholar] [CrossRef] [Green Version]
- Xiao, D.; Tang, Z.; Yin, Y.; Zhang, B.; Hu, X.; Feng, Z.; Wang, J. Effects of dietary administering chitosan on growth performance, jejunal morphology, jejunal mucosal sIgA, occluding, claudin-1 and TLR4 expression in weaned piglets challenged by enterotoxigenic Escherichia coli. Int. Immunopharmacol. 2013, 17, 670–676. [Google Scholar] [CrossRef] [PubMed]
- Wu, M.; Xiao, H.; Liu, G.; Chen, S.; Tan, B.; Ren, W.; Bazer, F.W.; Wu, G.; Yin, Y. Glutamine promotes intestinal SIgA secretion through intestinal microbiota and IL-13. Mol. Nutr. Food Res. 2016, 60, 1637–1648. [Google Scholar] [CrossRef] [PubMed]
- Hand, T.W. All Bacteroides Are Equal but Some Are More Equal than Others For the Induction of IgA. Cell Host Microbe 2020, 27, 319–321. [Google Scholar] [CrossRef] [PubMed]
- Bienenstock, J.; Gauldie, J.; Perey, D.Y. Synthesis of IgG, IgA, IgM by chicken tissues: Immunofluorescent and 14C amino acid incorporation studies. J. Immunol. 1973, 111, 1112–1118. [Google Scholar]
- Del Vesco, A.P.; Gasparino, E.; Oliveira Neto, A.R.; Guimarães, S.E.F.; Marcato, S.M.M.; Voltolini, D.M. Dietary methionine effects on IGF-I and GHR mRNA expression in broilers. Genet. Mol. Res. 2013, 12, 6414–6423. [Google Scholar] [CrossRef]
- Gasparino, E.; Guimarães, S.E.F.; Neto, A.R.O.; Martins, E.N.; Lopes, P.S.; Batista, E.; Vesco, A.P.D. The effect of glycerol on mRNA expression of growth hormone, insulin-like growth factor, and mitochondrial breast muscle genes of Japanese quail. Br. Poult. Sci. 2012, 53, 497–507. [Google Scholar] [CrossRef]
- Yan, J.; Herzog, J.W.; Tsang, K.; Brennan, C.A.; Bower, M.A.; Garrett, W.S.; Sartorb, B.R.; Aliprantisa, A.; Charles, J.F. Gut microbiota induce IGF-1 and promote bone formation and growth. Proc. Natl. Acad. Sci. USA 2016, 113, E7554–E7563. [Google Scholar] [CrossRef] [Green Version]


| Ingredients | Treatment diets | |||||||
|---|---|---|---|---|---|---|---|---|
| T1 | T2 | T3 | T4 | T5 | T6 | T7 | T8 | |
| Corn | 47.50 | 47.49 | 47.20 | 47.20 | 47.20 | 47.20 | 47.20 | 47.20 |
| Soybean Meal | 40.10 | 40.10 | 40.20 | 40.20 | 40.20 | 40.20 | 40.20 | 40.20 |
| Wheat pollard | 1.50 | 1.50 | 1.60 | 1.60 | 1.60 | 1.60 | 1.60 | 1.60 |
| CPO | 6.00 | 6.00 | 5.90 | 5.90 | 5.90 | 5.90 | 5.90 | 5.90 |
| L-Lysine | 0.50 | 0.50 | 0.50 | 0.50 | 0.50 | 0.50 | 0.50 | 0.50 |
| DL-Methionine | 0.50 | 0.50 | 0.50 | 0.50 | 0.50 | 0.50 | 0.50 | 0.50 |
| Dicalcium Phosphate | 2.50 | 2.50 | 2.50 | 2.50 | 2.50 | 2.50 | 2.50 | 2.50 |
| Calcium carbonate | 0.45 | 0.45 | 0.45 | 0.45 | 0.45 | 0.45 | 0.45 | 0.45 |
| Choline chloride | 0.10 | 0.10 | 0.10 | 0.10 | 0.10 | 0.10 | 0.10 | 0.10 |
| Salt | 0.35 | 0.35 | 0.35 | 0.35 | 0.35 | 0.35 | 0.35 | 0.35 |
| Mineral Mix | 0.15 | 0.15 | 0.15 | 0.15 | 0.15 | 0.15 | 0.15 | 0.15 |
| Vitamin Mix | 0.15 | 0.15 | 0.15 | 0.15 | 0.15 | 0.15 | 0.15 | 0.15 |
| Antioxidant | 0.10 | 0.10 | 0.10 | 0.10 | 0.10 | 0.10 | 0.10 | 0.10 |
| Toxin binder | 0.10 | 0.10 | 0.10 | 0.10 | 0.10 | 0.10 | 0.10 | 0.10 |
| Antibiotics | 0.00 | 0.01 | 0.00 | 0.00 | 0.00 | 0.00 | 0.00 | 0.00 |
| Postbiotic TL1 | 0.00 | 0.00 | 0.20 | 0.00 | 0.00 | 0.00 | 0.00 | 0.00 |
| Postbiotic RS5 | 0.00 | 0.00 | 0.00 | 0.20 | 0.00 | 0.00 | 0.00 | 0.00 |
| Paraprobiotic RG11 | 0.00 | 0.00 | 0.00 | 0.00 | 0.20 | 0.00 | 0.00 | 0.00 |
| Postbiotic RI11 | 0.00 | 0.00 | 0.00 | 0.00 | 0.00 | 0.20 | 0.00 | 0.00 |
| Paraprobiotic RG14 | 0.00 | 0.00 | 0.00 | 0.00 | 0.00 | 0.00 | 0.20 | 0.00 |
| Paraprobiotic RI11 | 0.00 | 0.00 | 0.00 | 0.00 | 0.00 | 0.00 | 0.00 | 0.20 |
| Total | 100 | 100 | 100 | 100 | 100 | 100 | 100 | 100 |
| Calculated analysis | ||||||||
| ME (Kcal/Kg) | 3215.70 | 3215.70 | 3201.40 | 3201.40 | 3201.40 | 3201.40 | 3201.40 | 3201.40 |
| Protein (%) | 22.00 | 22.00 | 22.03 | 22.03 | 22.03 | 22.03 | 22.03 | 22.03 |
| Fat (%) | 7.99 | 7.99 | 7.88 | 7.88 | 7.88 | 7.88 | 7.88 | 7.88 |
| Fibre (%) | 4.11 | 4.11 | 4.12 | 4.12 | 4.12 | 4.12 | 4.12 | 4.12 |
| Calcium (%) | 1.08 | 1.08 | 1.08 | 1.08 | 1.08 | 1.08 | 1.08 | 1.08 |
| Total Phos(%) | 0.89 | 0.89 | 0.89 | 0.89 | 0.89 | 0.89 | 0.89 | 0.89 |
| Avail. P (%) | 0.48 | 0.48 | 0.48 | 0.48 | 0.48 | 0.48 | 0.48 | 0.48 |
| Ingredients | Treatment Diets | |||||||
|---|---|---|---|---|---|---|---|---|
| T1 | T2 | T3 | T4 | T5 | T6 | T7 | T8 | |
| Corn | 51.60 | 51.59 | 51.60 | 51.60 | 51.60 | 51.60 | 51.60 | 51.60 |
| Soybean Meal | 33.50 | 33.50 | 33.50 | 33.50 | 33.50 | 33.50 | 33.50 | 33.50 |
| Wheat pollard | 4.80 | 4.80 | 4.60 | 4.60 | 4.60 | 4.60 | 4.60 | 4.60 |
| CPO | 5.20 | 5.20 | 5.20 | 5.20 | 5.20 | 5.20 | 5.20 | 5.20 |
| L-Lysine | 0.50 | 0.50 | 0.50 | 0.50 | 0.50 | 0.50 | 0.50 | 0.50 |
| DL-Methionine | 0.50 | 0.50 | 0.50 | 0.50 | 0.50 | 0.50 | 0.50 | 0.50 |
| Dicalcium Phosphate | 2.50 | 2.50 | 2.50 | 2.50 | 2.50 | 2.50 | 2.50 | 2.50 |
| Calcium carbonate | 0.45 | 0.45 | 0.45 | 0.45 | 0.45 | 0.45 | 0.45 | 0.45 |
| Choline chloride | 0.10 | 0.10 | 0.10 | 0.10 | 0.10 | 0.10 | 0.10 | 0.10 |
| Salt | 0.35 | 0.35 | 0.35 | 0.35 | 0.35 | 0.35 | 0.35 | 0.35 |
| Mineral Mix | 0.15 | 0.15 | 0.15 | 0.15 | 0.15 | 0.15 | 0.15 | 0.15 |
| Vitamin Mix | 0.15 | 0.15 | 0.15 | 0.15 | 0.15 | 0.15 | 0.15 | 0.15 |
| Antioxidant | 0.10 | 0.10 | 0.10 | 0.10 | 0.10 | 0.10 | 0.10 | 0.10 |
| Toxin binder | 0.10 | 0.10 | 0.10 | 0.10 | 0.10 | 0.10 | 0.10 | 0.10 |
| Antibiotics | 0.00 | 0.01 | 0.00 | 0.00 | 0.00 | 0.00 | 0.00 | 0.00 |
| Postbiotic TL1 | 0.00 | 0.00 | 0.20 | 0.00 | 0.00 | 0.00 | 0.00 | 0.00 |
| Postbiotic RS5 | 0.00 | 0.00 | 0.00 | 0.20 | 0.00 | 0.00 | 0.00 | 0.00 |
| Paraprobiotic RG11 | 0.00 | 0.00 | 0.00 | 0.00 | 0.20 | 0.00 | 0.00 | 0.00 |
| Postbiotic RI11 | 0.00 | 0.00 | 0.00 | 0.00 | 0.00 | 0.20 | 0.00 | 0.00 |
| Paraprobiotic RG14 | 0.00 | 0.00 | 0.00 | 0.00 | 0.00 | 0.00 | 0.20 | 0.00 |
| Paraprobiotic RI11 | 0.00 | 0.00 | 0.00 | 0.00 | 0.00 | 0.00 | 0.00 | 0.20 |
| Total | 100 | 100 | 100 | 100 | 100 | 100 | 100 | 100 |
| Calculated analysis | ||||||||
| ME (Kcal/Kg) | 3180.83 | 3180.83 | 3176.68 | 3176.68 | 3176.68 | 3176.68 | 3176.68 | 3176.68 |
| Protein (%) | 19.92 | 19.92 | 19.89 | 19.89 | 19.89 | 19.89 | 19.89 | 19.89 |
| Fat (%) | 7.29 | 7.29 | 7.29 | 7.29 | 7.29 | 7.29 | 7.29 | 7.29 |
| Fibre (%) | 4.01 | 4.01 | 3.99 | 3.99 | 3.99 | 3.99 | 3.99 | 3.99 |
| Calcium (%) | 1.06 | 1.06 | 1.06 | 1.06 | 1.06 | 1.06 | 1.06 | 1.06 |
| Total Phos(%) | 0.89 | 0.89 | 0.88 | 0.88 | 0.88 | 0.88 | 0.88 | 0.88 |
| Avail. P (%) | 0.48 | 0.48 | 0.48 | 0.48 | 0.48 | 0.48 | 0.48 | 0.48 |
| Target Gene | Primer Sequence 5′-3′ | Product Size (bp) | Accession No |
|---|---|---|---|
| GHR | F—AACACAGATACCCAACAGCC R—AGAAGTCAGTGTTTGTCAGGG | 145 | NM_001001293.1 |
| IGF-1 | F—CACCTAAATCTGCACGCT R—CTTGTGGATGGCATGATCT | 140 | NM_001004384.2 |
| GAPDH | F—CTGGCAAAGTCCAAGTGGTG R—AGCACCACCCTTCAGATGAG | 275 | NM_204305.1 |
| Parameter | Dietary Treatments | |||||||||
|---|---|---|---|---|---|---|---|---|---|---|
| T1 | T2 | T3 | T4 | T5 | T6 | T7 | T8 | SEM | p-Value | |
| 0–3 weeks (starter) | ||||||||||
| Initial BW | 43.62 | 43.52 | 43.14 | 42.76 | 43.52 | 44.52 | 42.90 | 43.95 | 0.54 | 0.389 |
| FBW (g) | 895.00 | 856.20 | 847.30 | 844.20 | 900.00 | 1087.20 | 902.60 | 886.00 | 41.63 | 0.423 |
| CBWG (g) | 851.33 | 812.67 | 804.15 | 801.48 | 856.43 | 830.81 | 859.71 | 842.05 | 16.58 | 0.055 |
| CFI (g) | 1080.95 a | 1073.81 a | 999.65 c | 1028.91 bc | 1088.10 a | 1080.95 a | 1055.05 ab | 1066.32 a | 10.23 | <0.0001 |
| FCR (g:g) | 1.29 | 1.35 | 1.27 | 1.30 | 1.29 | 1.32 | 1.26 | 1.30 | 0.03 | 0.554 |
| 4–5 Weeks (Finisher) | ||||||||||
| FBW (g) | 2482.39 | 2419.22 | 2367.66 | 2345.17 | 2420.97 | 2437.56 | 2409.2 | 2471.47 | 39.61 | 0.213 |
| CBWG (g) | 1563.83 | 1541.22 | 1493.03 | 1487.39 | 1503.43 | 1544.33 | 1490.00 | 1558.00 | 29.73 | 0.332 |
| CFI (g) | 2400.00 a | 2269.45 b | 2234.29 b | 2244.45 b | 2371.91 a | 2272.22 b | 2408.57 a | 2400.00 a | 15.71 | <0.0001 |
| FCR (g:g) | 1.55 abc | 1.49 c | 1.52 c | 1.55 abc | 1.62 ab | 1.49 c | 1.63 a | 1.55 abc | 0.33 | 0.0223 |
| Overall | ||||||||||
| FBW (g) | 2482.39 | 2419.22 | 2367.66 | 2345.17 | 2420.97 | 2437.56 | 2409.2 | 2471.47 | 39.61 | 0.213 |
| CBWG (g) | 2438.44 | 2375.44 | 2324.40 | 2302.33 | 2377.66 | 2392.72 | 2366.17 | 2427.18 | 39.51 | 0.223 |
| CFI (g) | 3480.95 a | 3343.25 b | 3234.29 c | 3273.41 c | 3460.88 a | 3353.17 b | 3464.08 a | 3465.59 a | 21.55 | <0.0001 |
| FCR (g:g) | 1.44 | 1.42 | 1.41 | 1.46 | 1.47 | 1.41 | 1.47 | 1.44 | 0.03 | 0.431 |
| Mortality (n) | 0/42 | 0/42 | 1/42 | 0/42 | 1/42 | 0/42 | 1/42 | 2/42 | 0.517 | |
| EBI | 483.80 b | 478.00 c | 459.80 d | 450.60 g | 451.10 f | 484.80 a | 448.90 h | 458.70 e | <0.0001 | |
| Parameter | Dietary Treatments | |||||||||
|---|---|---|---|---|---|---|---|---|---|---|
| T1 | T2 | T3 | T4 | T5 | T6 | T7 | T8 | SEM | p-Value | |
| Carcass weight (g) | 1994.50 | 1834.33 | 1829.50 | 1949.83 | 1824.50 | 1880.17 | 1855.33 | 2019.33 | 52.04 | 0.056 |
| Carcass (%) | 76.01 | 74.44 | 73.75 | 75.07 | 73.64 | 74.09 | 74.00 | 76.08 | 0.91 | 0.414 |
| Breast (%) | 36.84 | 39.99 | 38.86 | 35.55 | 40.14 | 40.14 | 37.89 | 40.49 | 1.68 | 0.643 |
| Drumsticks (%) | 11.99 | 12.80 | 13.26 | 12.07 | 13.14 | 13.40 | 12.56 | 12.32 | 0.41 | 0.158 |
| Thigh (%) | 14.53 | 13.59 | 16.31 | 13.84 | 15.44 | 16.31 | 14.68 | 14.45 | 0.74 | 0.168 |
| Wings (%) | 9.49 | 10.20 | 10.37 | 9.23 | 9.63 | 9.72 | 9.39 | 9.14 | 0.35 | 0.287 |
| Back (%) | 23.03 | 24.06 | 25.03 | 22.81 | 21.96 | 23.07 | 22.02 | 23.14 | 0.86 | 0.394 |
| Shanks (%) | 4.68 | 4.93 | 5.08 | 4.56 | 5.18 | 4.97 | 5.33 | 5.09 | 0.15 | 0.067 |
| Abdominal fat (%) | 1.08 a | 1.28 ab | 0.93 abc | 0.80 bc | 0.90 abc | 0.89 abc | 0.33 d | 0.55 cd | 0.12 | <0.0001 |
| Gizzard (%) | 3.14 | 3.09 | 3.54 | 3.49 | 3.46 | 3.24 | 3.28 | 3.77 | 0.19 | 0.316 |
| Liver (%) | 3.10 | 3.10 | 2.91 | 2.86 | 3.51 | 3.03 | 3.42 | 3.08 | 0.19 | 0.332 |
| Spleen (%) | 0.14 | 0.22 | 0.26 | 0.20 | 0.15 | 0.20 | 0.29 | 0.21 | 0.04 | 0.297 |
| Intestine (%) | 4.82 a | 5.42 a | 5.06 a | 4.77 a | 4.72 a | 4.78 a | 3.97 b | 4.86 a | 0.24 | 0.032 |
| Heart (%) | 0.84 | 0.94 | 1.39 | 0.90 | 0.83 | 0.89 | 0.90 | 0.89 | 0.13 | 0.638 |
| Parameter | Dietary Treatments | |||||||||
|---|---|---|---|---|---|---|---|---|---|---|
| T1 | T2 | T3 | T4 | T5 | T6 | T7 | T8 | SEM | p-Value | |
| Villi height Wk 3, µm | ||||||||||
| Duodenal | 604.30 c | 605.4 c | 814.10 abc | 977.60 ab | 1174.10 a | 1064.6 ab | 791.70 bc | 857 abc | 78.58 | 0.0212 |
| Jejunal | 691.52 a | 518.30 b | 664.41 a | 714.08 a | 779.16 a | 812.56 a | 745.01 a | 759.27 a | 43.42 | 0.0146 |
| Ileal | 549.4 ab | 575.21 a | 382.37 cd | 313.23 d | 580.98 a | 530.4 abc | 403.1 bcd | 601.81 a | 47.74 | 0.0050 |
| Crypt depth Wk 3, µm | ||||||||||
| Duodenal | 153.36 | 139.26 | 149.13 | 126.34 | 122.83 | 125.37 | 159.87 | 127.21 | 10.85 | 0.4196 |
| Jejunal | 123.91 abc | 110.55 c | 115.16 bc | 152.04 a | 101.07 c | 143.22 ab | 141.51 ab | 147.75 a | 8.13 | 0.0080 |
| Ileal | 99.49 ab | 101.77 ab | 105.22 a | 73.97c | 100.48 ab | 98.54 ab | 78.50 ac | 121.15 a | 6.70 | 0.0117 |
| Villi height: Crypt depth | ||||||||||
| Duodenal | 4.01 c | 4.97 bc | 5.50 c | 7.75 ab | 9.68 a | 8.63 a | 5.00 bc | 6.705 ab | 0.84 | 0.0057 |
| Jejunal | 5.60 b | 4.77 b | 5.77 b | 4.70 b | 7.70 a | 5.68 b | 5.27 b | 5.30 b | 0.33 | 0.0025 |
| Ileal | 5.53 | 5.71 | 3.75 | 4.24 | 5.78 | 5.36 | 5.29 | 5.15 | 0.44 | 0.0908 |
| Villi height Wk 5, µm | ||||||||||
| Duodenal | 906.86 b | 944.93 b | 905.21 b | 854.12 b | 813.36 b | 1145.04 a | 1116.48 a | 948.74 b | 43.51 | 0.0008 |
| Jejunal | 823.96 bc | 547.32 d | 848.86 bc | 787.94 c | 872.22 bc | 928.32 ab | 760.69 c | 1036.25 a | 30.42 | <0.0001 |
| Ileal | 554.61 b | 645.09 b | 618.35 b | 692.09 b | 648.04 b | 717.18 b | 622.60 b | 927.37 a | 50.51 | 0.0162 |
| Crypt depth Wk 5, µm | ||||||||||
| Duodenal | 153.83 | 142.25 | 131.36 | 139.10 | 110.67 | 137.76 | 132.21 | 134.55 | 11.50 | 0.5842 |
| Jejunal | 164.12 ab | 172.96 a | 132.51 bcd | 112.33 d | 122.02 cd | 135.01 bcd | 141.63 abcd | 154.09 abc | 9.94 | 0.0212 |
| Ileal | 154.31 a | 143.34 ab | 130.40 abc | 125.92 abc | 118.07 bc | 138.09 ab | 132.30 abc | 107.00 c | 8.80 | 0.0501 |
| Villi height: Crypt depth | ||||||||||
| Duodenal | 6.22 | 6.66 | 6.96 | 6.20 | 7.39 | 8.95 | 8.43 | 7.20 | 0.77 | 0.3957 |
| Jejunal | 5.13 c | 3.18 d | 6.41 abc | 7.05 ab | 7.17 a | 6.92 ab | 5.49 bc | 6.87 ab | 0.43 | 0.0003 |
| Ileal | 3.62b | 4.52 b | 4.79 b | 5.56 b | 5.42 b | 5.22 b | 4.66 b | 8.85 a | 0.48 | 0.0006 |
Publisher’s Note: MDPI stays neutral with regard to jurisdictional claims in published maps and institutional affiliations. |
© 2022 by the authors. Licensee MDPI, Basel, Switzerland. This article is an open access article distributed under the terms and conditions of the Creative Commons Attribution (CC BY) license (https://creativecommons.org/licenses/by/4.0/).
Share and Cite
Danladi, Y.; Loh, T.C.; Foo, H.L.; Akit, H.; Md Tamrin, N.A.; Naeem Azizi, M. Effects of Postbiotics and Paraprobiotics as Replacements for Antibiotics on Growth Performance, Carcass Characteristics, Small Intestine Histomorphology, Immune Status and Hepatic Growth Gene Expression in Broiler Chickens. Animals 2022, 12, 917. https://doi.org/10.3390/ani12070917
Danladi Y, Loh TC, Foo HL, Akit H, Md Tamrin NA, Naeem Azizi M. Effects of Postbiotics and Paraprobiotics as Replacements for Antibiotics on Growth Performance, Carcass Characteristics, Small Intestine Histomorphology, Immune Status and Hepatic Growth Gene Expression in Broiler Chickens. Animals. 2022; 12(7):917. https://doi.org/10.3390/ani12070917
Chicago/Turabian StyleDanladi, Yohanna, Teck Chwen Loh, Hooi Ling Foo, Henny Akit, Nur Aida Md Tamrin, and Mohammad Naeem Azizi. 2022. "Effects of Postbiotics and Paraprobiotics as Replacements for Antibiotics on Growth Performance, Carcass Characteristics, Small Intestine Histomorphology, Immune Status and Hepatic Growth Gene Expression in Broiler Chickens" Animals 12, no. 7: 917. https://doi.org/10.3390/ani12070917