
G0S2 Gene Polymorphism and Its Relationship with Carcass Traits in Chicken


Abstract
:Simple Summary
Abstract
1. Introduction
2. Materials and Methods
2.1. Experimental Animals and Determination of Their Carcass Traits
2.2. DNA Extraction
2.3. G0S2 Fragment Amplification
2.4. Statistics and Analysis
3. Results
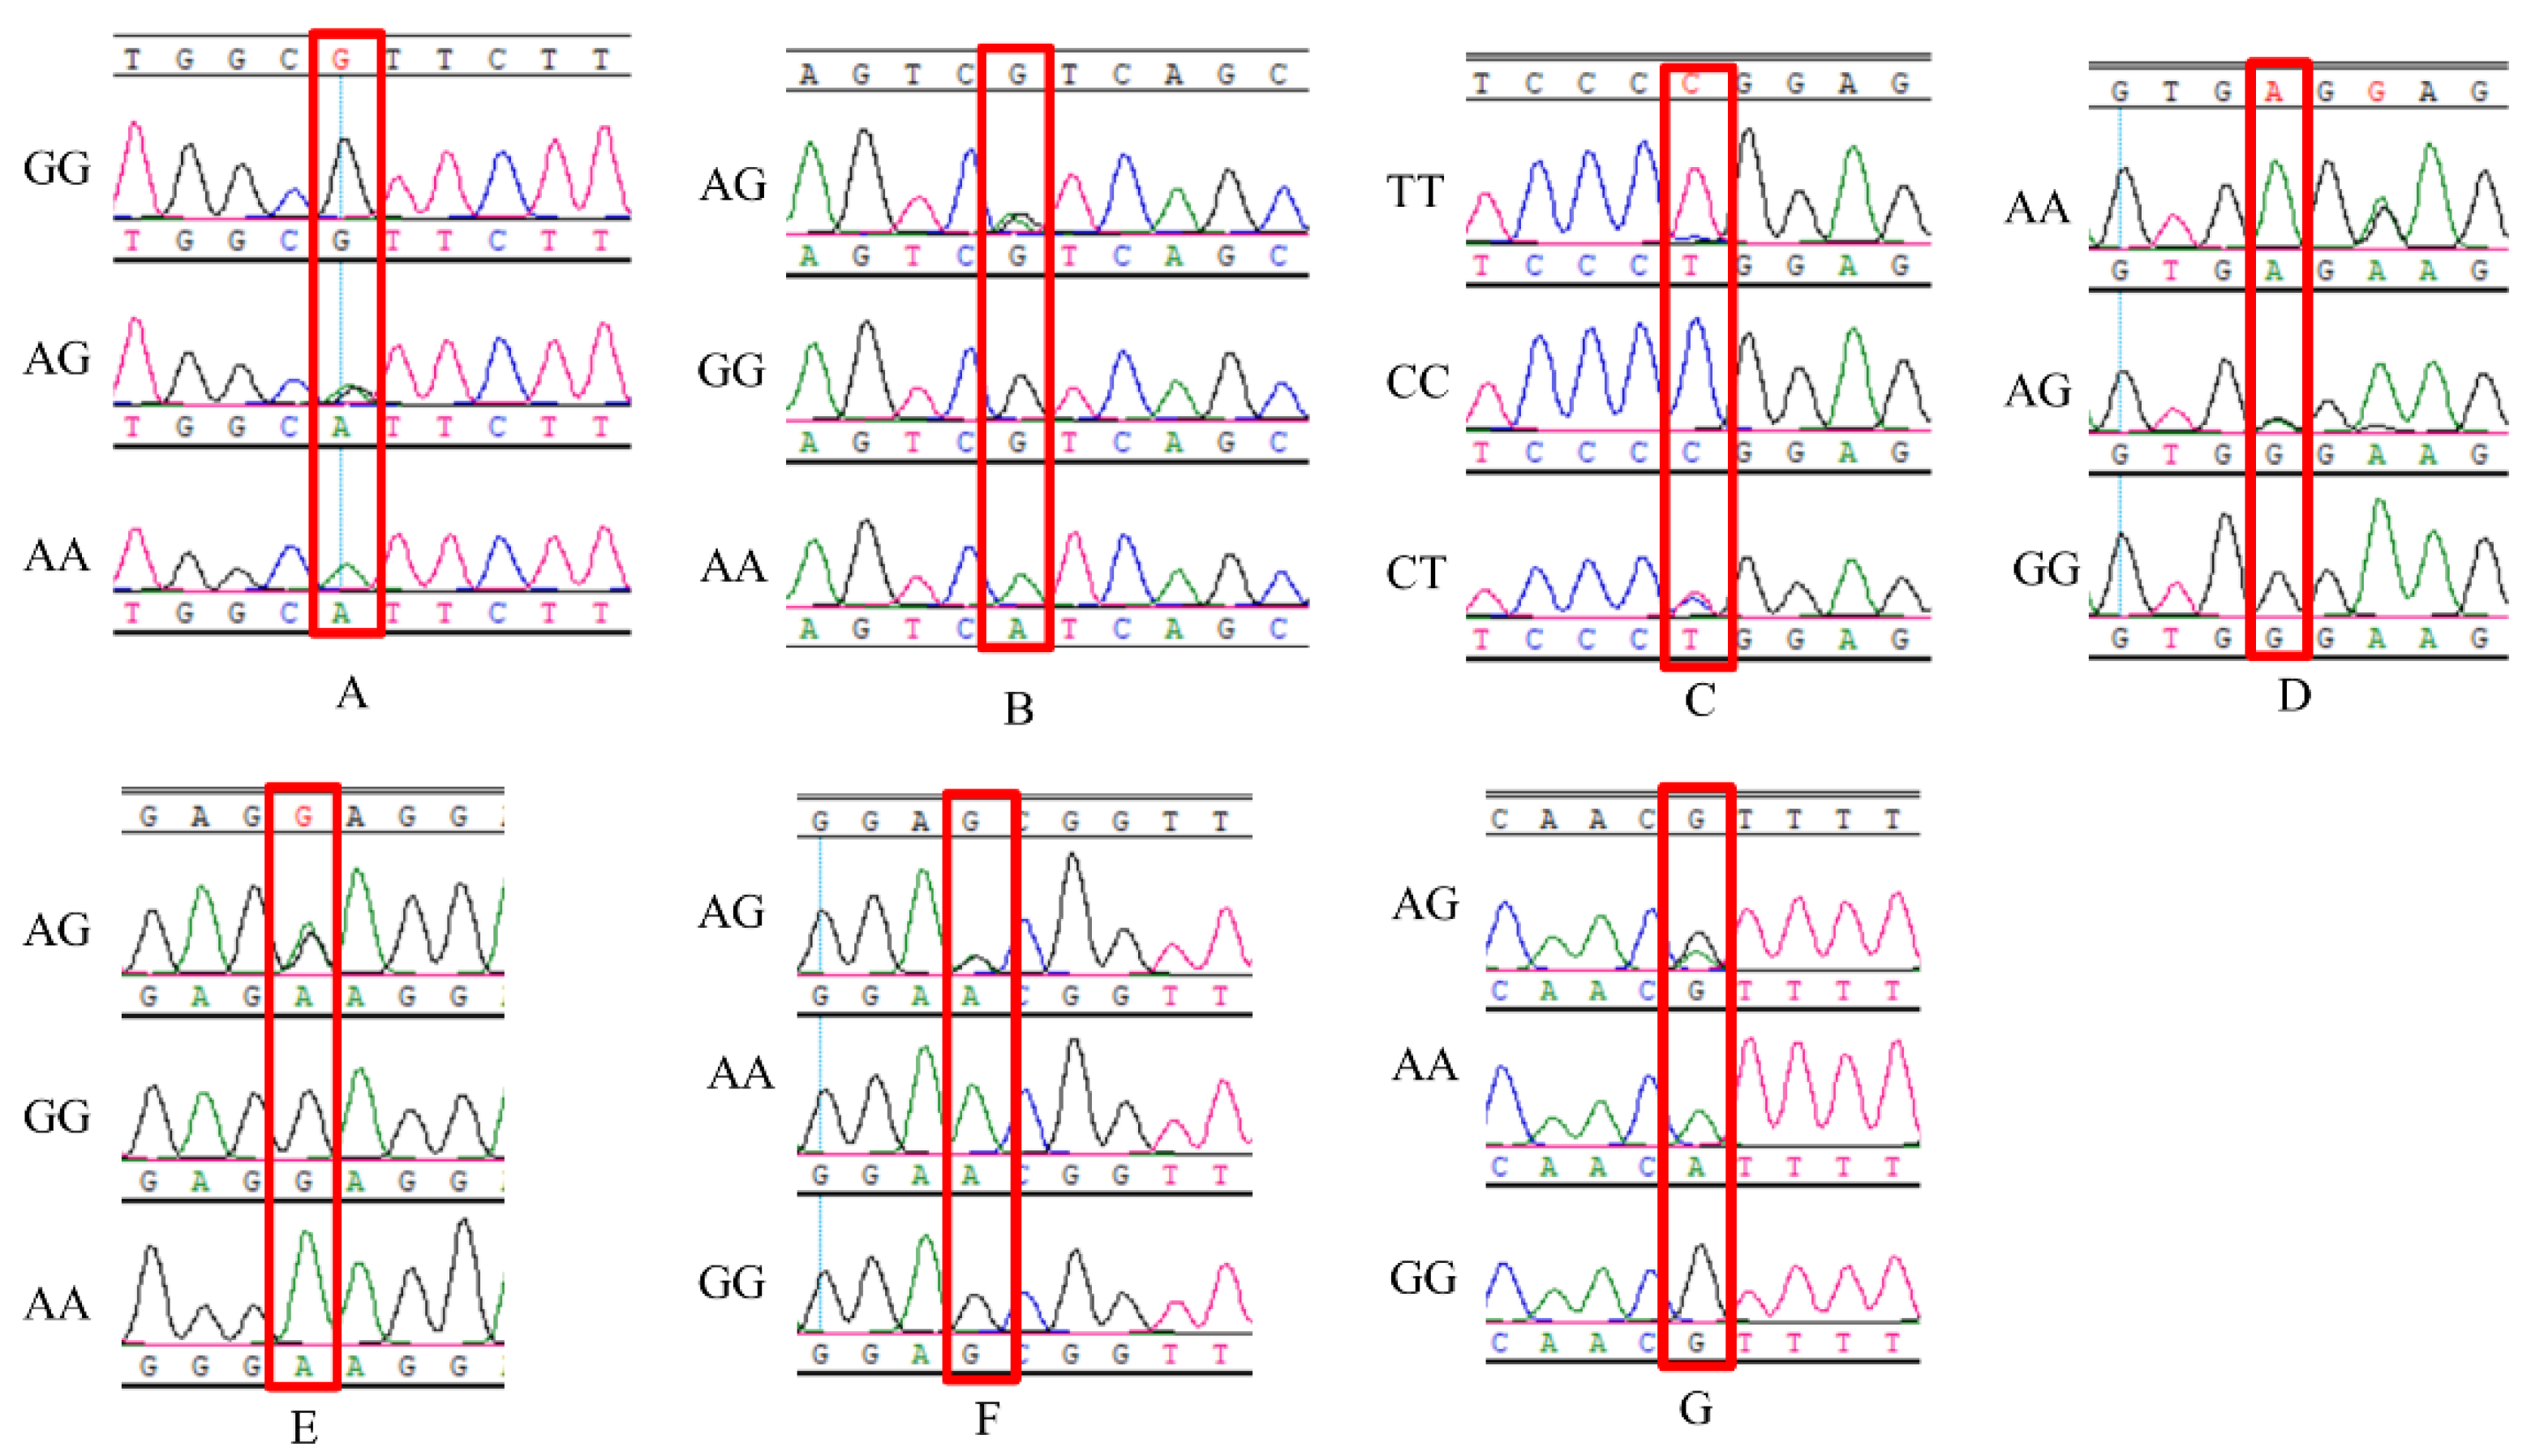
3.1. SNP and Genotyping of G0S2 Gene
3.2. Correlation Analysis of Chicken Carcass Traits
3.3. Association Analysis of G0S2 Gene SNPs and Carcass Traits
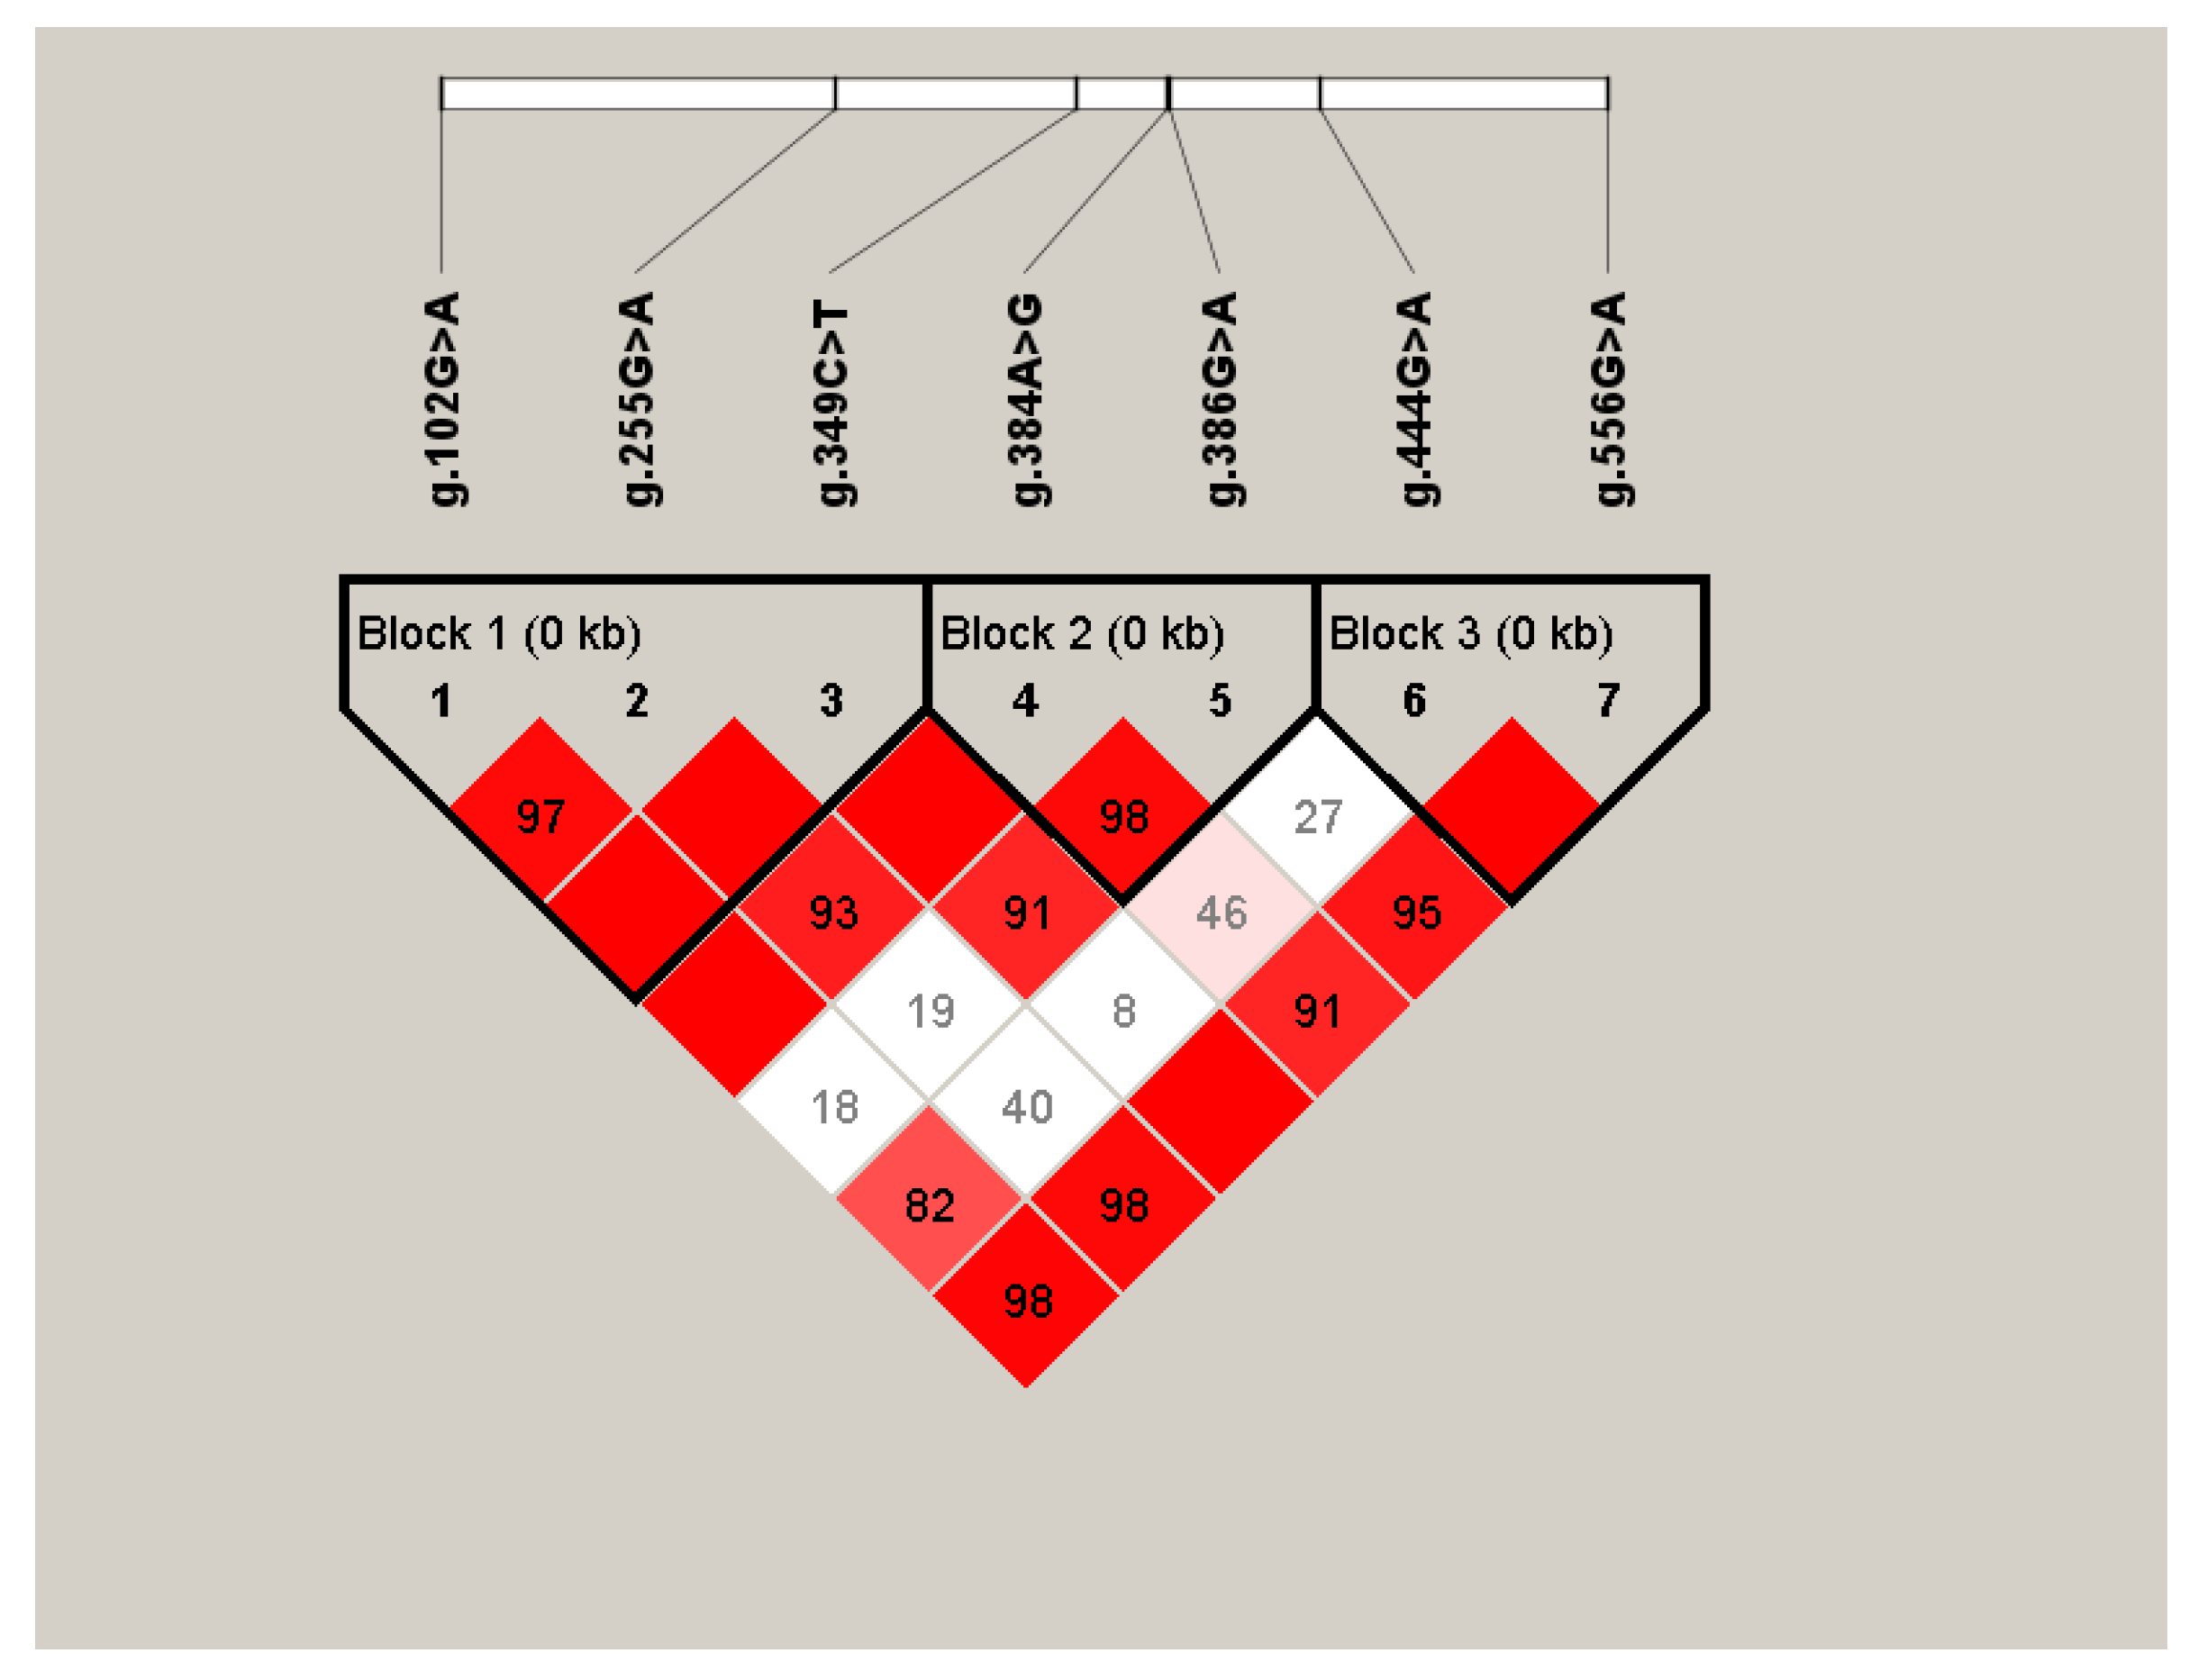
3.4. Linkage Disequilibrium Analysis and Haplotype Analysis of SNPs of G0S2 Gene
4. Discussion
5. Conclusions
Author Contributions
Funding
Institutional Review Board Statement
Data Availability Statement
Acknowledgments
Conflicts of Interest
References
- Nematbakhsh, S.; Pei Pei, C.; Selamat, J.; Nordin, N.; Idris, L.H.; Abdull Razis, A.F. Molecular Regulation of Lipogenesis, Adipogenesis and Fat Deposition in Chicken. Genes 2021, 12, 414. [Google Scholar] [CrossRef] [PubMed]
- Godfray, H.C.J.; Aveyard, P.; Garnett, T.; Hall, J.W.; Key, T.J.; Lorimer, J.; Pierrehumbert, R.T.; Scarborough, P.; Springmann, M.; Jebb, S.A. Meat consumption, health, and the environment. Science 2018, 361, eaam5324. [Google Scholar] [CrossRef] [PubMed] [Green Version]
- Haemmerle, G.; Lass, A.; Zimmermann, R.; Gorkiewicz, G.; Meyer, C.; Rozman, J.; Heldmaier, G.; Maier, R.; Theussl, C.; Eder, S.; et al. Defective Lipolysis and Altered Energy Metabolism in Mice Lacking Adipose Triglyceride Lipase. Science 2006, 312, 734–737. [Google Scholar] [CrossRef] [PubMed]
- Yang, X.; Lu, X.; Lombes, M.; Rha, G.B.; Chi, Y.I.; Guerin, T.M.; Smart, E.J.; Liu, J. The G(0)/G(1) switch gene 2 regulates adipose lipolysis through association with adipose triglyceride lipase. Cell Metab. 2010, 11, 194–205. [Google Scholar] [CrossRef] [PubMed] [Green Version]
- Ahn, J.; Li, X.; Choi, Y.M.; Shin, S.; Oh, S.A.; Suh, Y.; Nguyen, T.H.; Baik, M.; Hwang, S.; Lee, K. Differential expressions of G0/G1 switch gene 2 and comparative gene identification-58 are associated with fat content in bovine muscle. Lipids 2014, 49, 1–14. [Google Scholar] [CrossRef]
- Jiang, Y.; Cen, W.; Xing, S.; Chen, J.; Xu, H.; Wen, A.; Zhu, L.; Tang, G.; Li, M.; Jiang, A.; et al. Tissue expression pattern and polymorphism of G0S2 gene in porcine. Gene 2014, 539, 173–179. [Google Scholar] [CrossRef]
- Oh, S.A.; Suh, Y.; Pang, M.G.; Lee, K. Cloning of avian G(0)/G(1) switch gene 2 genes and developmental and nutritional regulation of G(0)/G(1) switch gene 2 in chicken adipose tissue. J. Anim. Sci. 2011, 89, 367–375. [Google Scholar] [CrossRef] [Green Version]
- Park, T.S.; Park, J.; Lee, J.H.; Park, J.W.; Park, B.C. Disruption of G0/G1 switch gene 2 (G0S2) reduced abdominal fat deposition and altered fatty acid composition in chicken. FASEB J. 2019, 33, 1188–1198. [Google Scholar] [CrossRef]
- Ukropec, J.; Ukropcova, B.; Kurdiova, T.; Gasperikova, D.; Klimes, I. Adipose tissue and skeletal muscle plasticity modulates metabolic health. Arch. Physiol. Biochem. 2008, 114, 357–368. [Google Scholar] [CrossRef]
- Laurens, C.; Badin, P.M.; Louche, K.; Mairal, A.; Tavernier, G.; Marette, A.; Tremblay, A.; Weisnagel, S.J.; Joanisse, D.R.; Langin, D.; et al. G0/G1 Switch Gene 2 controls adipose triglyceride lipase activity and lipid metabolism in skeletal muscle. Mol. Metab. 2016, 5, 527–537. [Google Scholar] [CrossRef]
- Ma, T.; Lopez-Aguiar, A.G.; Li, A.; Lu, Y.; Sekula, D.; Nattie, E.E.; Freemantle, S.; Dmitrovsky, E. Mice lacking G0S2 are lean and cold-tolerant. Cancer Biol. Ther. 2014, 15, 643–650. [Google Scholar] [CrossRef] [PubMed] [Green Version]
- China National Commission of Animal Genetic Resources. Animal Genetic Resources in China: Poultry; China Agriculture Press: Beijing, China, 2011. [Google Scholar]
- Li, J. Introduction to Animal Husbandry; China Agriculture Ture Press: Beijing, China, 2010. [Google Scholar]
- State Administration for Market Regulation; Standardization Administration. Chicken Carcass Segmentation. GB/T 24864-2010; China Quality and Standards Publishing & Media Co., Ltd.: Beijing, China, 2010. [Google Scholar]
- Barrett, J.C.; Fry, B.; Maller, J.; Daly, M.J. Haploview: Analysis and visualization of LD and haplotype maps. Bioinformatics 2005, 21, 263–265. [Google Scholar] [CrossRef] [PubMed] [Green Version]
- Venturini, G.C.; Cruz, V.A.; Rosa, J.O.; Baldi, F.; El Faro, L.; Ledur, M.C.; Peixoto, J.O.; Munari, D.P. Genetic and phenotypic parameters of carcass and organ traits of broiler chickens. Genet. Mol. Res. 2014, 13, 10294–10300. [Google Scholar] [CrossRef] [PubMed]
- Cruz, V.A.R.; Grupioni, N.V.; Mendonca, G.G.; Venturini, G.C.; Ledur, M.C.; Peixoto, J.O.; Munari, D.P. Genetic parameters for performance and carcass traits in a paternal 1 lineage of broiler. An. Acad. Bras. Ciências 2020, 92 (Suppl. 1), e20180697. [Google Scholar] [CrossRef]
- Fang, M.; Nie, Q.; Luo, C.; Zhang, D.; Zhang, X. Associations of GHSR gene polymorphisms with chicken growth and carcass traits. Mol. Biol. Rep. 2010, 37, 423–428. [Google Scholar] [CrossRef]
- Demeure, O.; Duclos, M.J.; Bacciu, N.; Mignon, G.L.; Filangi, O.; Pitel, F.; Boland, A.; Lagarrigue, S.; Cogburn, L.A.; Simon, J. Genome-wide interval mapping using SNPs identifies new QTL for growth, body composition and several physiological variables in an F2 intercross between fat and lean chicken lines. Genet. Sel. Evol. 2013, 45, 36. [Google Scholar] [CrossRef] [Green Version]
- Sun, Y.; Liu, R.; Lu, X.; Hu, Y.; Zhao, G.; Zheng, M.; Chen, J.; Wang, H.; Wen, J. Associations of polymorphisms in four candidate genes with carcass and/or meat-quality traits in two meat-type chicken lines. Anim. Biotechnol. 2013, 24, 53–65. [Google Scholar] [CrossRef]
- Raeesi, V.; Ehsani, A.; Torshizi, R.V.; Sargolzaei, M.; Masoudi, A.A.; Dideban, R. Genome-wide association study of cell-mediated immune response in chicken. J. Anim. Breed. Genet. 2017, 134, 405–411. [Google Scholar] [CrossRef]
- Zhang, H.; Shen, L.Y.; Xu, Z.C.; Kramer, L.M.; Yu, J.Q.; Zhang, X.Y.; Na, W.; Yang, L.L.; Cao, Z.P.; Luan, P.; et al. Haplotype-based genome-wide association studies for carcass and growth traits in chicken. Poult. Sci. 2020, 99, 2349–2361. [Google Scholar] [CrossRef]
- Cao, H.; Zhou, W.; Tan, Y.; Xu, X.; Mao, H.; Dong, X.; Xu, N.; Yin, Z. Chronological Expression of PITX2 and SIX1 Genes and the Association between Their Polymorphisms and Chicken Meat Quality Traits. Animals 2021, 11, 445. [Google Scholar] [CrossRef]
- Choi, H.; Lee, H.; Kim, T.H.; Kim, H.J.; Lee, Y.J.; Lee, S.J.; Yu, J.H.; Kim, D.; Kim, K.S.; Park, S.W.; et al. G0/G1 switch gene 2 has a critical role in adipocyte differentiation. Cell Death Differ. 2014, 21, 1071–1080. [Google Scholar] [CrossRef] [PubMed] [Green Version]
- Zhang, X.; Xie, X.; Heckmann, B.L.; Saarinen, A.M.; Gu, H.; Zechner, R.; Liu, J. Identification of an intrinsic lysophosphatidic acid acyltransferase activity in the lipolytic inhibitor G0/G1 switch gene 2 (G0S2). FASEB J. 2019, 33, 6655–6666. [Google Scholar] [CrossRef] [PubMed]
- Zeng, F.; Xie, L.; Pang, X.; Liu, W.; Nie, Q.; Zhang, X. Complementary deoxyribonucleic acid cloning of avian G0/G1 switch gene 2, and its expression and association with production traits in chicken. Poult. Sci. 2011, 90, 1548–1554. [Google Scholar] [CrossRef] [PubMed]
- Li, Z.; Zheng, M.; Mo, J.; Li, K.; Yang, X.; Guo, L.; Zhang, X.; Abdalla, B.A.; Nie, Q. Single-cell RNA sequencing of preadipocytes reveals the cell fate heterogeneity induced by melatonin. J. Pineal Res. 2021, 70, e12725. [Google Scholar] [CrossRef] [PubMed]
- Cornaciu, I.; Boeszoermenyi, A.; Lindermuth, H.; Nagy, H.M.; Cerk, I.K.; Ebner, C.; Salzburger, B.; Gruber, A.; Schweiger, M.; Zechner, R.; et al. The minimal domain of adipose triglyceride lipase (ATGL) ranges until leucine 254 and can be activated and inhibited by CGI-58 and G0S2, respectively. PLoS ONE 2011, 6, e26349. [Google Scholar] [CrossRef] [Green Version]
- Le Bihan-Duval, E.; Debut, M.; Berri, C.M.; Sellier, N.; Sante-Lhoutellier, V.; Jego, Y.; Beaumont, C. Chicken meat quality: Genetic variability and relationship with growth and muscle characteristics. BMC Genet. 2008, 9, 53. [Google Scholar] [CrossRef] [Green Version]
- Baeza, E.; Le Bihan-Duval, E. Chicken lines divergent for low or high abdominal fat deposition: A relevant model to study the regulation of energy metabolism. Animal 2013, 7, 965–973. [Google Scholar] [CrossRef] [Green Version]


| SNPs | Chromosome Position | Location | Amino Acid Change |
|---|---|---|---|
| g.102G > A | 3176848 | Exon | Synonymous mutation |
| g.255G > A | 3177001 | Exon | Synonymous mutation |
| g.349C > T | 3177095 | 3′-UTR | Untranslated point mutation |
| g.384A > G | 3177130 | 3′-UTR | Untranslated point mutation |
| g.386G > A | 3177132 | 3′-UTR | Untranslated point mutation |
| g.444G > A | 3177190 | 3′-UTR | Untranslated point mutation |
| g.556G > A | 3177302 | 3′-UTR | Untranslated point mutation |
| Gene | SNPs | Genotype Frequency | Allelic Frequency | p-Value 1 | Ho | He | PIC 2 | Ne | |||
|---|---|---|---|---|---|---|---|---|---|---|---|
| G0S2 | GG | AG | AA | G | A | ||||||
| g.102G > A | 0.630 | 0.281 | 0.089 | 0.770 | 0.230 | 0.000 | 0.281 | 0.354 | 0.291 | 1.390 | |
| g.255G > A | 0.613 | 0.274 | 0.113 | 0.750 | 0.250 | 0.000 | 0.274 | 0.375 | 0.305 | 1.377 | |
| g.384A > G | 0.385 | 0.380 | 0.235 | 0.575 | 0.425 | 0.000 | 0.380 | 0.489 | 0.369 | 1.613 | |
| g.386G > A | 0.029 | 0.292 | 0.679 | 0.175 | 0.825 | 0.967 | 0.292 | 0.289 | 0.247 | 1.412 | |
| g.444G > A | 0.047 | 0.140 | 0.813 | 0.117 | 0.883 | 0.000 | 0.140 | 0.207 | 0.186 | 1.162 | |
| g.556G > A | 0.447 | 0.366 | 0.187 | 0.630 | 0.370 | 0.000 | 0.366 | 0.466 | 0.358 | 1.577 | |
| CC | CT | TT | C | T | |||||||
| g.349C > T | 0.941 | 0.049 | 0.010 | 0.964 | 0.034 | 0.000 | 0.049 | 0.069 | 0.067 | 1.051 | |
| LW | DW | HBW | FBW | BMW | TW | WW | FW | HW | HEW | LIW | SW | AFW | SL | SC | BOL | |
|---|---|---|---|---|---|---|---|---|---|---|---|---|---|---|---|---|
| LW | 1 | |||||||||||||||
| DW | 0.973 ** | 1 | ||||||||||||||
| HBW | 0.977 ** | 0.970 ** | 1 | |||||||||||||
| FBW | 0.973 ** | 0.968 ** | 0.985 ** | 1 | ||||||||||||
| BMW | 0.363 ** | 0.357 ** | 0.362 ** | 0.373 ** | 1 | |||||||||||
| TW | 0.909 ** | 0.910 ** | 0.926 ** | 0.933 ** | 0.326 ** | 1 | ||||||||||
| WW | 0.889 ** | 0.885 ** | 0.900 ** | 0.908 ** | 0.315 ** | 0.867 ** | 1 | |||||||||
| FW | 0.834 ** | 0.847 ** | 0.851 ** | 0.848 ** | 0.234 ** | 0.853 ** | 0.833 ** | 1 | ||||||||
| HW | 0.720 ** | 0.743 ** | 0.755 ** | 0.749 ** | 0.208 ** | 0.760 ** | 0.740 ** | 0.849 ** | 1 | |||||||
| HEW | 0.737 ** | 0.716 ** | 0.721 ** | 0.701 ** | 0.206 ** | 0.646 ** | 0.642 ** | 0.626 ** | 0.538 ** | 1 | ||||||
| LIW | 0.695 ** | 0.675 ** | 0.660 ** | 0.630 ** | 0.193 ** | 0.579 ** | 0.588 ** | 0.562 ** | 0.449 ** | 0.601 ** | 1 | |||||
| SW | 0.472 ** | 0.456 ** | 0.422 ** | 0.395 ** | 0.122 ** | 0.367 ** | 0.385 ** | 0.408 ** | 0.325 ** | 0.352 ** | 0.354 ** | 1 | ||||
| AFW | 0.263 ** | 0.219 ** | 0.238 ** | 0.198 ** | 0.161 ** | 0.110 ** | 0.06 | −0.115 ** | −0.186 ** | 0.227 ** | 0.168 ** | −0.005 | 1 | |||
| SL | 0.831 ** | 0.793 ** | 0.803 ** | 0.797 ** | 0.274 ** | 0.730 ** | 0.731 ** | 0.674 ** | 0.509 ** | 0.656 ** | 0.619 ** | 0.376 ** | 0.290 ** | 1 | ||
| SC | 0.452 ** | 0.490 ** | 0.493 ** | 0.501 ** | 0.089 * | 0.536 ** | 0.529 ** | 0.722 ** | 0.697 ** | 0.320 ** | 0.252 ** | 0.190 ** | −0.344 ** | 0.263 ** | 1 | |
| BOL | 0.774 ** | 0.771 ** | 0.775 ** | 0.778 ** | 0.300 ** | 0.755 ** | 0.712 ** | 0.686 ** | 0.559 ** | 0.535 ** | 0.499 ** | 0.381 ** | 0.183 ** | 0.668 ** | 0.370 ** | 1 |
| Genotypes | SNP | AA/TT (MEAN ± SEM) | AG/CT (MEAN ± SEM) | GG/CC (MEAN ± SEM) |
|---|---|---|---|---|
| LW | g.102G > A | 1782.42 + 173.25 A | 1710.32 + 202.16 A | 1597.43 + 224.22 B |
| g.255G > A | 1762.28 + 161.52 A | 1716.50 + 205.67 A | 1592.51 + 224.69 B | |
| g.384A > G | 1721.36 + 196.17 A | 1672.64 + 214.79 A | 1572.98 + 227.45 B | |
| g.386G > A | 1628.14 + 224.32 a | 1681.26 + 219.27 b | 1696.66 + 212.00 ab | |
| g.444G > A | 1621.14 + 226.80 a | 1755.30 + 181.44 b | 1742.94 + 151.23 b | |
| g.556G > A | 1557.91 + 227.15 A | 1588.35 + 226.97 A | 1729.32 + 188.50 B | |
| g.349C > T | 1672.85 + 115.57 ab | 1768.28 + 190.60 b | 1639.01 + 224.43 a | |
| DW | g.102G > A | 1566.95 + 157.32 A | 1503.19 + 180.07 A | 1412.25 + 197.23 B |
| g.255G > A | 1547.52 + 147.36 A | 1509.11 + 183.44 B | 1408.24 + 197.69 B | |
| g.384A > G | 1511.77 + 174.53 A | 1472.31 + 190.71 A | 1394.58 + 200.63 B | |
| g.386G > A | 1439.13 + 197.96 | 1476.33 + 192.06 | 1494.26 + 188.95 | |
| g.444G > A | 1432.59 + 199.14 a | 1535.56 + 170.41 b | 1530.25 + 134.11 b | |
| g.556G > A | 1388.19 + 201.80 A | 1403.61 + 201.09 A | 1517.46 + 169.22 B | |
| g.349C > T | 1464.57 + 93.83 ab | 1544.42 + 176.23 b | 1446.65 + 197.33 a | |
| HBW | g.102G > A | 1417.60 + 145.15 a | 1355.63 + 162.44 b | 1274.83 + 180.57 c |
| g.255G > A | 1400.72 + 135.24 A | 1360.23 + 165.90 B | 1271.28 + 180.97 B | |
| g.384A > G | 1364.07 + 159.06 A | 1330.03 + 173.06 A | 1258.06 + 183.98 B | |
| g.386G > A | 1299.42 + 180.55 | 1332.31 + 176.19 | 1342.23 + 165.58 | |
| g.444G > A | 1292.47 + 181.88 a | 1386.47 + 151.39 b | 1390.95 + 125.50 b | |
| g.556G > A | 1248.63 + 184.01 A | 1268.03 + 184.54 A | 1370.68 + 152.91 B | |
| g.349C > T | 1316.28 + 80.88 ab | 1400.89 + 162.22 b | 11305.51 + 179.81 a | |
| FBW | g.102G > A | 1171.10 + 123.91 a | 1120.60 + 135.91 b | 1055.40 + 149.83 c |
| g.255G > A | 1157.34 + 115.17 A | 1124.75 + 139.07 B | 1052.35 + 149.99 B | |
| g.384A > G | 1129.26 + 134.46 A | 1099.20 + 144.10 A | 1041.60 + 151.80 B | |
| g.386G > A | 1074.61 + 149.28 | 1103.46 + 148.24 | 1109.13 + 136.47 | |
| g.444G > A | 1070.32 + 151.56 a | 1141.46 + 125.43 b | 1150.17 + 109.59 b | |
| g.556G > A | 1034.45 + 149.81 A | 1050.00 + 153.88 A | 1132.70 + 129.28 B | |
| g.349C > T | 1081.88 + 70.32 ab | 1158.89 + 133.36 b | 1080.18 + 149.52 a | |
| BMW | g.102G > A | 89.10 + 10.47 | 86.86 + 12.17 | 83.55 + 31.54 |
| g.255G > A | 88.84 + 9.94 | 87.17 + 12.46 | 83.28 + 31.89 | |
| g.384A > G | 86.37 + 11.44 | 86.14 + 12.52 | 82.98 + 39.12 | |
| g.386G > A | 84.78 + 30.50 | 85.21 + 12.75 | 87.13 + 9.69 | |
| g.444G > A | 83.13 + 12.56 a | 94.22 + 62.08 b | 89.39 + 8.98 ab | |
| g.556G > A | 79.29 + 12.33 a | 85.11 + 40.17 ab | 87.24 + 11.17 b | |
| g.349C > T | 84.20 + 7.71 | 90.11 + 12.36 | 84.72 + 26.72 | |
| TW | g.102G > A | 210.70 + 28.00 a | 200.20 + 29.81 b | 190.20 + 29.95 c |
| g.255G > A | 207.08 + 26.22 A | 200.96 + 30.48 A | 189.85 + 30.06 B | |
| g.384A > G | 202.54 + 27.39 A | 196.79 + 30.81 A | 188.22 + 30.55 B | |
| g.386G > A | 193.31 + 30.64 | 197.85 + 30.05 | 200.18 + 27.88 | |
| g.444G > A | 187.54 + 31.09 A | 188.94 + 30.84 A | 202.72 + 27.97 B | |
| g.556G > A | 187.54 + 31.09 A | 188.94 + 30.84 A | 202.72 + 27.97 B | |
| g.349C > T | 191.19 + 7.88 ab | 209.79 + 28.71 b | 194.10 + 30.49 a | |
| WW | g.102G > A | 68.90 + 9.37 A | 66.22 + 8.05 A | 62.64 + 9.14 B |
| g.255G > A | 67.99 + 8.66 A | 66.54 + 8.53 A | 62.47 + 9.02 B | |
| g.384A > G | 66.79 + 8.69 A | 65.00 + 8.71 A | 61.86 + 9.23 B | |
| g.386G > A | 63.66 + 9.06 | 65.24 + 9.28 | 66.66 + 7.84 | |
| g.444G > A | 63.50 + 9.22 a | 67.20 + 8.01 b | 67.47 + 8.02 b | |
| g.556G > A | 61.48 + 9.40 A | 62.30 + 8.98 A | 66.91 + 8.37 B | |
| g.349C > T | 61.59 + 4.37 | 67.63 + 8.88 | 64.06 + 9.13 | |
| FW | g.102G > A | 75.84 + 14.98 a | 72.77 + 14.03 a | 69.82 + 13.94 b |
| g.255G > A | 74.10 + 13.83 a | 73.49 + 14.65 a | 69.62 + 13.83 b | |
| g.384A > G | 73.058 + 13.96 a | 71.68 + 13.84 ab | 69.56 + 14.51 b | |
| g.386G > A | 70.80 + 14.15 | 72.03 + 14.24 | 71.73 + 14.51 | |
| g.444G > A | 70.64 + 14.31 | 73.93 + 13.94 | 72.40 + 11.73 | |
| g.556G > A | 69.89 + 14.87 a | 69.10 + 13.97 a | 73.43 + 13.76 b | |
| g.349C > T | 65.37 + 7.73 | 74.20 + 14.97 | 71.09 + 14.17 | |
| HW | g.102G > A | 50.10 + 8.63 | 49.14 + 9.09 | 48.21 + 9.84 |
| g.255G > A | 49.19 + 8.23 | 49.55 + 9.31 | 48.13 + 9.84 | |
| g.384A > G | 48.70 + 8.44 | 48.73 + 9.51 | 48.51 + 10.20 | |
| g.386G > A | 48.66 + 9.71 | 48.83 + 9.32 | 46.37 + 7.37 | |
| g.444G > A | 48.46 + 9.78 | 49.19 + 8.46 | 50.05 + 8.39 | |
| g.556G > A | 49.64 + 11.38 | 47.38 + 9.31 | 49.25 + 8.77 | |
| g.349C > T | 43.89 + 2.80 | 49.04 + 9.38 | 48.67 + 9.59 | |
| HEW | g.102G > A | 8.37 + 1.83 A | 7.87 + 1.84 A | 7.09 + 1.81 B |
| g.255G > A | 8.39 + 1.75 A | 7.85 + 1.83 A | 7.06 + 1.81 B | |
| g.384A > G | 8.05 + 1.82 A | 7.57 + 1.82 A | 6.90 + 1.82 B | |
| g.386G > A | 7.29 + 1.88 a | 7.70 + 1.83 b | 7.71 + 1.95 ab | |
| g.444G > A | 7.21 + 1.86 a | 8.35 + 1.72 b | 8.35 + 1.43 b | |
| g.556G > A | 6.69 + 1.76 A | 7.00 + 1.80 A | 8.08 + 1.77 B | |
| g.349C > T | 7.53 + 1.18 ab | 8.35 + 1.74 b | 7.37 + 1.88 a | |
| LIW | g.102G > A | 35.22 + 4.51 A | 34.31 + 5.94 | 31.51 + 6.26 B |
| g.255G > A | 34.70 + 4.33 A | 34.43 + 6.04 A | 31.44 + 6.29 B | |
| g.384A > G | 34.38 + 5.88 A | 33.38 + 6.18 A | 30.82 + 5.98 B | |
| g.386G > A | 32.15 + 6.00 a | 33.59 + 6.51 b | 34.11 + 6.71 ab | |
| g.444G > A | 32.13 + 6.26 a | 34.72 + 5.65 b | 35.10 + 4.88 b | |
| g.556G > A | 30.43 + 5.79 A | 31.22 + 6.21 A | 34.70 + 5.73 B | |
| g.349C > T | 33.51 + 8.49 ab | 35.84 + 6.82 b | 32.45 + 6.11 a | |
| SW | g.102G > A | 32.65 + 5.77 a | 32.30 + 5.91 a | 30.38 + 6.05 b |
| g.255G > A | 32.61 + 5.83 a | 32.26 + 6.03 a | 30.34 + 6.00 b | |
| g.384A > G | 30.98 + 5.89 a | 31.46 + 6.38 a | 31.38 + 6.43 b | |
| g.386G > A | 30.92 + 5.91 | 31.57 + 6.36 | 31.38 + 6.44 | |
| g.444G > A | 30.69 + 5.86 a | 33.27 + 7.00 b | 32.13 + 5.04 b | |
| g.556G > A | 29.81 + 5.62 | 30.26 + 5.61 | 32.38 + 6.36 | |
| g.349C > T | 32.49 + 5.50 | 33.41 + 7.98 | 30.99 + 5.93 | |
| AFW | g.102G > A | 45.14 + 13.74 A | 41.39 + 14.62 A | 35.13 + 15.45 B |
| g.255G > A | 45.18 + 13.53 A | 41.58 + 14.50 A | 34.72 + 15.43 B | |
| g.384A > G | 43.05 + 14.24 A | 39.12 + 15.10 A | 33.25 + 15.36 B | |
| g.386G > A | 36.68 + 15.60 a | 40.02 + 14.84 b | 40.95 + 16.89 ab | |
| g.444G > A | 35.81 + 15.16 A | 46.34 + 14.74 B | 46.25 + 11.52 B | |
| g.556G > A | 31.33 + 13.78 A | 34.55 + 15.85 A | 43.12 + 14.07 B | |
| g.349C > T | 49.19 + 15.81 | 43.57 + 14.59 | 37.36 + 15.44 | |
| SL | g.102G > A | 73.65 + 5.51 A | 72.12 + 6.38 A | 68.53 + 7.06 B |
| g.255G > A | 73.48 + 5.08 A | 72.29 + 6.48 A | 68.33 + 7.04 B | |
| g.384A > G | 72.46 + 6.11 A | 71.01 + 6.87 A | 67.50 + 6.92 B | |
| g.386G > A | 69.33 + 6.94 a | 71.37 + 7.06 b | 71.81 + 6.33 ab | |
| g.444G > A | 69.00 + 7.01 A | 74.25 + 5.55 B | 74.48 + 4.12 B | |
| g.556G > A | 66.25 + 6.53 a | 68.09 + 7.02 a | 73.12 + 5.79 c | |
| g.349C > T | 72.70 + 3.97 ab | 74.10 + 5.39 b | 69.75 + 7.05 a | |
| SC | g.102G > A | 11.18 + 1.22 | 11.10 + 0.98 | 11.28 + 1.06 |
| g.255G > A | 11.03 + 1.13 | 11.15 + 1.00 | 11.25 + 1.06 | |
| g.384A > G | 11.08 + 1.03 | 11.17 + 1.07 | 11.29 + 1.04 | |
| g.386G > A | 11.19 + 1.03 | 11.24 + 1.09 | 10.97 + 1.15 | |
| g.444G > A | 11.23 + 1.03 | 11.07 + 1.16 | 10.91 + 1.05 | |
| g.556G > A | 11.40 + 1.07 a | 11.20 + 0.99 ab | 11.11 + 1.08 b | |
| g.349C > T | 10.24 + 0.61 b | 10.98 + 0.99 ab | 11.22 + 1.05 a | |
| BOL | g.102G > A | 20.05 + 1.10 A | 19.74 + 1.09 A | 19.30 + 1.16 B |
| g.255G > A | 19.95 + 1.04 A | 19.76 + 1.12 A | 19.29 + 1.16 B | |
| g.384A > G | 19.84 + 1.12 A | 19.62 + 1.10 A | 19.15 + 1.17 B | |
| g.386G > A | 19.39 + 1.16 | 19.69 + 1.14 | 19.71 + 1.10 | |
| g.444G > A | 19.40 + 1.18 | 19.92 + 1.01 | 19.79 + 0.89 | |
| g.556G > A | 19.14 + 1.19 A | 19.25 + 1.16 A | 19.83 + 1.06 B | |
| g.349C > T | 19.40 + 0.72 ab | 20.23 + 1.01 b | 19.45 + 1.16 a |
| Block | Haplotype | SNPs | Haplotype Frequency | ||
|---|---|---|---|---|---|
| g.102G > A | g.255G > A | g.349C > T | |||
| Block1 | H1 | G | G | C | 0.712 |
| H2 | G | G | T | 0.034 | |
| H3 | G | A | C | 0.024 | |
| H4 | A | G | C | 0.003 | |
| H5 | A | A | C | 0.226 | |
| g.384A > G | g.386G > A | ||||
| Block2 | H6 | G | A | 0.574 | |
| H7 | G | G | 0.001 | ||
| H8 | A | A | 0.251 | ||
| H9 | A | G | 0.174 | ||
| g.444G > A | g.556G > A | ||||
| Block3 | H10 | A | A | 0.370 | |
| H11 | A | G | 0.513 | ||
| H12 | G | G | 0.117 | ||
| Carcass Traits | Haplotype | MEAN ± SEM | Haplotype | MEAN ± SEM | Haplotype | MEAN ± SEM |
|---|---|---|---|---|---|---|
| LW | H1H1 | 1582.65 + 225.36 A | H6H6 | 1572.15 ± 227.92 A | H10H10 | 1557.91 ± 227.15 A |
| H1H5 | 1709.21 ± 207.92 B | H6H8 | 1688.99 ± 205.91 B | H10H11 | 1576.54 ± 227.56 A | |
| H5H5 | 1782.42 ± 173.25 B | H6H9 | 1652.84 ± 224.32 B | H11H11 | 1712.67 ± 195.34 B | |
| H8H8 | 1727.77 ± 175.65 B | H11H12 | 1768.5 ± 179.91 B | |||
| H8H9 | 1722.73 ± 208.24 B | |||||
| DW | H1H1 | 1401.00 ± 198.86 A | H6H6 | 1393.97 ± 201.02 A | H10H10 | 1388.19 ± 201.80 A |
| H1H5 | 1503.14 ± 185.41 B | H6H8 | 1488.67 ± 186.27 B | H10H11 | 1395.35 ± 202.87 A | |
| H5H5 | 1566.96 ± 157.32 B | H6H9 | 1452.5 ± 194.87 AB | H11H11 | 1503.63 ± 172.36 B | |
| H8H8 | 1518.41 ± 156.51 B | H11H12 | 1549.35 ± 171.59 B | |||
| H8H9 | 1511.17 ± 185.13 B | |||||
| HBW | H1H1 | 1264.33 ± 182.17 A | H6H6 | 1257.5 ± 184.38 A | H10H10 | 1248.63 ± 184.01 A |
| H1H5 | 1354.50 ± 167.24 B | H6H8 | 1344.55 ± 168.17 B | H10H11 | 1260.46 ± 186.17 A | |
| H5H5 | 1417.61 ± 145.15 B | H6H9 | 1312.45 ± 177.90 AB | H11H11 | 1357.18 ± 156.43 B | |
| H8H8 | 1374.99 ± 139.01 B | H11H12 | 1398.37 ± 151.25 B | |||
| H8H9 | 1361.35 ± 172.17 B | |||||
| FBW | H1H1 | 1046.59 ± 151.07 A | H6H6 | 1041.16 ± 152.11 A | H10H10 | 1034.45 ± 149.81 A |
| H1H5 | 1119.86 ± 140.32 B | H6H8 | 1110.51 ± 140.42 B | H10H11 | 1044.91 ± 155.86 A | |
| H5H5 | 1171.10 ± 123.918 B | H6H9 | 1085.5 ± 147.87 AB | H11H11 | 1122.38 ± 133.12 B | |
| H8H8 | 1135.21 ± 116.67 B | H11H12 | 1152.99 ± 124.85 B | |||
| H8H9 | 1129.82 ± 146.95 B | |||||
| BMW | H1H1 | 82.9 ± 33.08 | H6H6 | 83.01 ± 39.26 | H10H10 | 79.29 ± 12.33 |
| H1H5 | 86.69 ± 12.33 | H6H8 | 87.09 ± 12.46 | H10H11 | 82.43 ± 12.67 | |
| H5H5 | 89.1 ± 10.47 | H6H9 | 84.98 ± 12.56 | H11H11 | 86.38 ± 11.80 | |
| H8H8 | 86.99 ± 9.40 | H11H12 | 88.63 ± 10.08 | |||
| H8H9 | 85.71 ± 13.19 | |||||
| TW | H1H1 | 188.89 ± 30.22 A | H6H6 | 188.19 ± 30.61 A | H10H10 | 187.54 ± 31.09 A |
| H1H5 | 200.12 ± 30.69 B | H6H8 | 198.36 ± 30.97 B | H10H11 | 187.96 ± 31.23 A | |
| H5H5 | 210.7 ± 28.00 B | H6H9 | 194.89 ± 30.63 AB | H11H11 | 201.22 ± 27.32 B | |
| H8H8 | 203.64 ± 25.34 B | H11H12 | 205.44 ± 30.94 B | |||
| H8H9 | 202.31 ± 28.99 B | |||||
| WW | H1H1 | 62.28 ± 9.11 A | H6H6 | 61.83 ± 9.22 A | H10H10 | 61.48 ± 9.40 A |
| H1H5 | 66.26 ± 8.23 B | H6H8 | 65.76 ± 8.18 B | H10H11 | 62.08 ± 9.07 A | |
| H5H5 | 68.90 ± 9.37 B | H6H9 | 64.08 ± 9.26 AB | H11H11 | 66.42 ± 8.56 B | |
| H8H8 | 66.61 ± 8.57 B | H11H12 | 67.99 ± 7.97 B | |||
| H8H9 | 66.95 ± 9.07 B | |||||
| FW | H1H1 | 69.62 ± 13.98 | H6H6 | 69.54 ± 14.52 | H10H10 | 69.89 ± 14.87 AB |
| H1H5 | 73.18 ± 14.44 | H6H8 | 72.41 ± 13.84 | H10H11 | 69.07 ± 14.17 A | |
| H5H5 | 75.84 ± 14.98 | H6H9 | 70.79 ± 13.84 | H11H11 | 72.92 ± 13.87 AB | |
| H8H8 | 72.47 ± 12.87 | H11H12 | 75.29 ± 14.26 B | |||
| H8H9 | 73.82 ± 14.71 | |||||
| HW | H1H1 | 48.25 ± 10.02 | H6H6 | 48.45 ± 10.18 | H10H10 | 49.64 ± 11.38 |
| H1H5 | 49.43 ± 9.27 | H6H8 | 48.87 ± 9.43 | H10H11 | 47.39 ± 9.53 | |
| H5H5 | 50.1 ± 8.63 | H6H9 | 48.56 ± 9.66 | H11H11 | 48.93 ± 8.82 | |
| H8H8 | 49.04 ± 8.35 | H11H12 | 49.76 ± 8.86 | |||
| H8H9 | 49.03 ± 8.74 | |||||
| HEW | H1H1 | 6.99 ± 1.81 A | H6H6 | 6.88 ± 1.82 A | H10H10 | 6.69 ± 1.76 A |
| H1H5 | 7.78 ± 1.81 B | H6H8 | 7.7 ± 1.80 B | H10H11 | 6.9 ± 1.77 A | |
| H5H5 | 8.37 ± 1.83 B | H6H9 | 7.41 ± 1.83 AB | H11H11 | 7.91 ± 1.81 B | |
| H8H8 | 8.11 ± 1.85 B | H11H12 | 8.43 ± 1.74 B | |||
| H8H9 | 8.09 ± 1.78 B | |||||
| LIW | H1H1 | 31.17 ± 6.17 A | H6H6 | 30.82 ± 6.00 A | H10H10 | 30.43 ± 5.79 A |
| H1H5 | 34.29 ± 5.98 B | H6H8 | 33.66 ± 5.87 B | H10H11 | 31.17 ± 6.33 A | |
| H5H5 | 35.22 ± 4.51 B | H6H9 | 33.04 ± 6.54 B | H11H11 | 34.3 ± 5.89 B | |
| H8H8 | 34.35 ± 4.76 B | H11H12 | 35.6 ± 5.59 B | |||
| H8H9 | 34.48 ± 6.47 B | |||||
| SW | H1H1 | 30.09 ± 5.74 A | H6H6 | 29.97 ± 5.69 A | H10H10 | 29.81 ± 5.62 A |
| H1H5 | 32.10 ± 6.04 B | H6H8 | 31.71 ± 5.78 AB | H10H11 | 29.97 ± 5.61 A | |
| H5H5 | 32.65 ± 5.77 AB | H6H9 | 31.28 ± 6.73 AB | H11H11 | 32.09 ± 6.06 B | |
| H8H8 | 33.16 ± 6.36 B | H11H12 | 33.29 ± 7.57 B | |||
| H8H9 | 31.96 ± 5.81 AB | |||||
| AFW | H1H1 | 34.05 ± 15.32 A | H6H6 | 33.27 ± 15.30 A | H10H10 | 31.33 ± 13.78 A |
| H1H5 | 41.00 ± 14.63 B | H6H8 | 39.76 ± 14.53 B | H10H11 | 32.7 ± 14.64 A | |
| H5H5 | 45.14 ± 13.74 B | H6H9 | 38.34 ± 15.79 AB | H11H11 | 42.25 ± 14.47 B | |
| H8H8 | 44.19 ± 15.40 B | H11H12 | 44.12 ± 13.87 B | |||
| H8H9 | 42.73 ± 12.64 B | |||||
| SL | H1H1 | 67.96 ± 7.00 A | H6H6 | 67.47 ± 6.93 A | H10H10 | 66.25 ± 6.53 A |
| H1H5 | 72.1 ± 6.47 B | H6H8 | 71.41 ± 6.49 B | H10H11 | 67.78 ± 7.13 A | |
| H5H5 | 73.65 ± 5.51 B | H6H9 | 70.52 ± 7.30 B | H11H11 | 72.16 ± 5.92 B | |
| H8H8 | 72.46 ± 5.37 B | H11H12 | 75.12 ± 5.50 B | |||
| H8H9 | 72.62 ± 6.61 B | |||||
| SC | H1H1 | 11.3 ± 1.05 | H6H6 | 11.29 ± 1.04 | H10H10 | 11.4 ± 1.07 |
| H1H5 | 11.14 ± 1.01 | H6H8 | 11.11 ± 1.01 | H10H11 | 11.23 ± 0.99 | |
| H5H5 | 11.18 ± 1.22 | H6H9 | 11.24 ± 1.13 | H11H11 | 11.13 ± 1.03 | |
| H8H8 | 10.92 ± 0.99 | H11H12 | 11.13 ± 1.23 | |||
| H8H9 | 11.22 ± 1.03 | |||||
| BOL | H1H1 | 19.24 ± 1.15 A | H6H6 | 19.15 ± 1.17 A | H10H10 | 19.14 ± 1.192 A |
| H1H5 | 19.73 ± 1.10 B | H6H8 | 19.68 ± 1.07 B | H10H11 | 19.22 ± 1.19 A | |
| H5H5 | 20.05 ± 1.10 B | H6H9 | 19.55 ± 1.12 B | H11H11 | 19.77 ± 1.08 B | |
| H8H8 | 19.79 ± 1.10 B | H11H12 | 20.01 ± 1.06 B | |||
| H8H9 | 19.90 ± 1.15 B |
Publisher’s Note: MDPI stays neutral with regard to jurisdictional claims in published maps and institutional affiliations. |
© 2022 by the authors. Licensee MDPI, Basel, Switzerland. This article is an open access article distributed under the terms and conditions of the Creative Commons Attribution (CC BY) license (https://creativecommons.org/licenses/by/4.0/).
Share and Cite
Yang, X.; Xian, Y.; Li, Z.; Wang, Z.; Nie, Q. G0S2 Gene Polymorphism and Its Relationship with Carcass Traits in Chicken. Animals 2022, 12, 916. https://doi.org/10.3390/ani12070916
Yang X, Xian Y, Li Z, Wang Z, Nie Q. G0S2 Gene Polymorphism and Its Relationship with Carcass Traits in Chicken. Animals. 2022; 12(7):916. https://doi.org/10.3390/ani12070916
Chicago/Turabian StyleYang, Xin, Yuanrong Xian, Zhenhui Li, Zhijun Wang, and Qinghua Nie. 2022. "G0S2 Gene Polymorphism and Its Relationship with Carcass Traits in Chicken" Animals 12, no. 7: 916. https://doi.org/10.3390/ani12070916