
Differential Expression Analysis of tRNA-Derived Small RNAs from Subcutaneous Adipose Tissue of Obese and Lean Pigs
 , and
, and 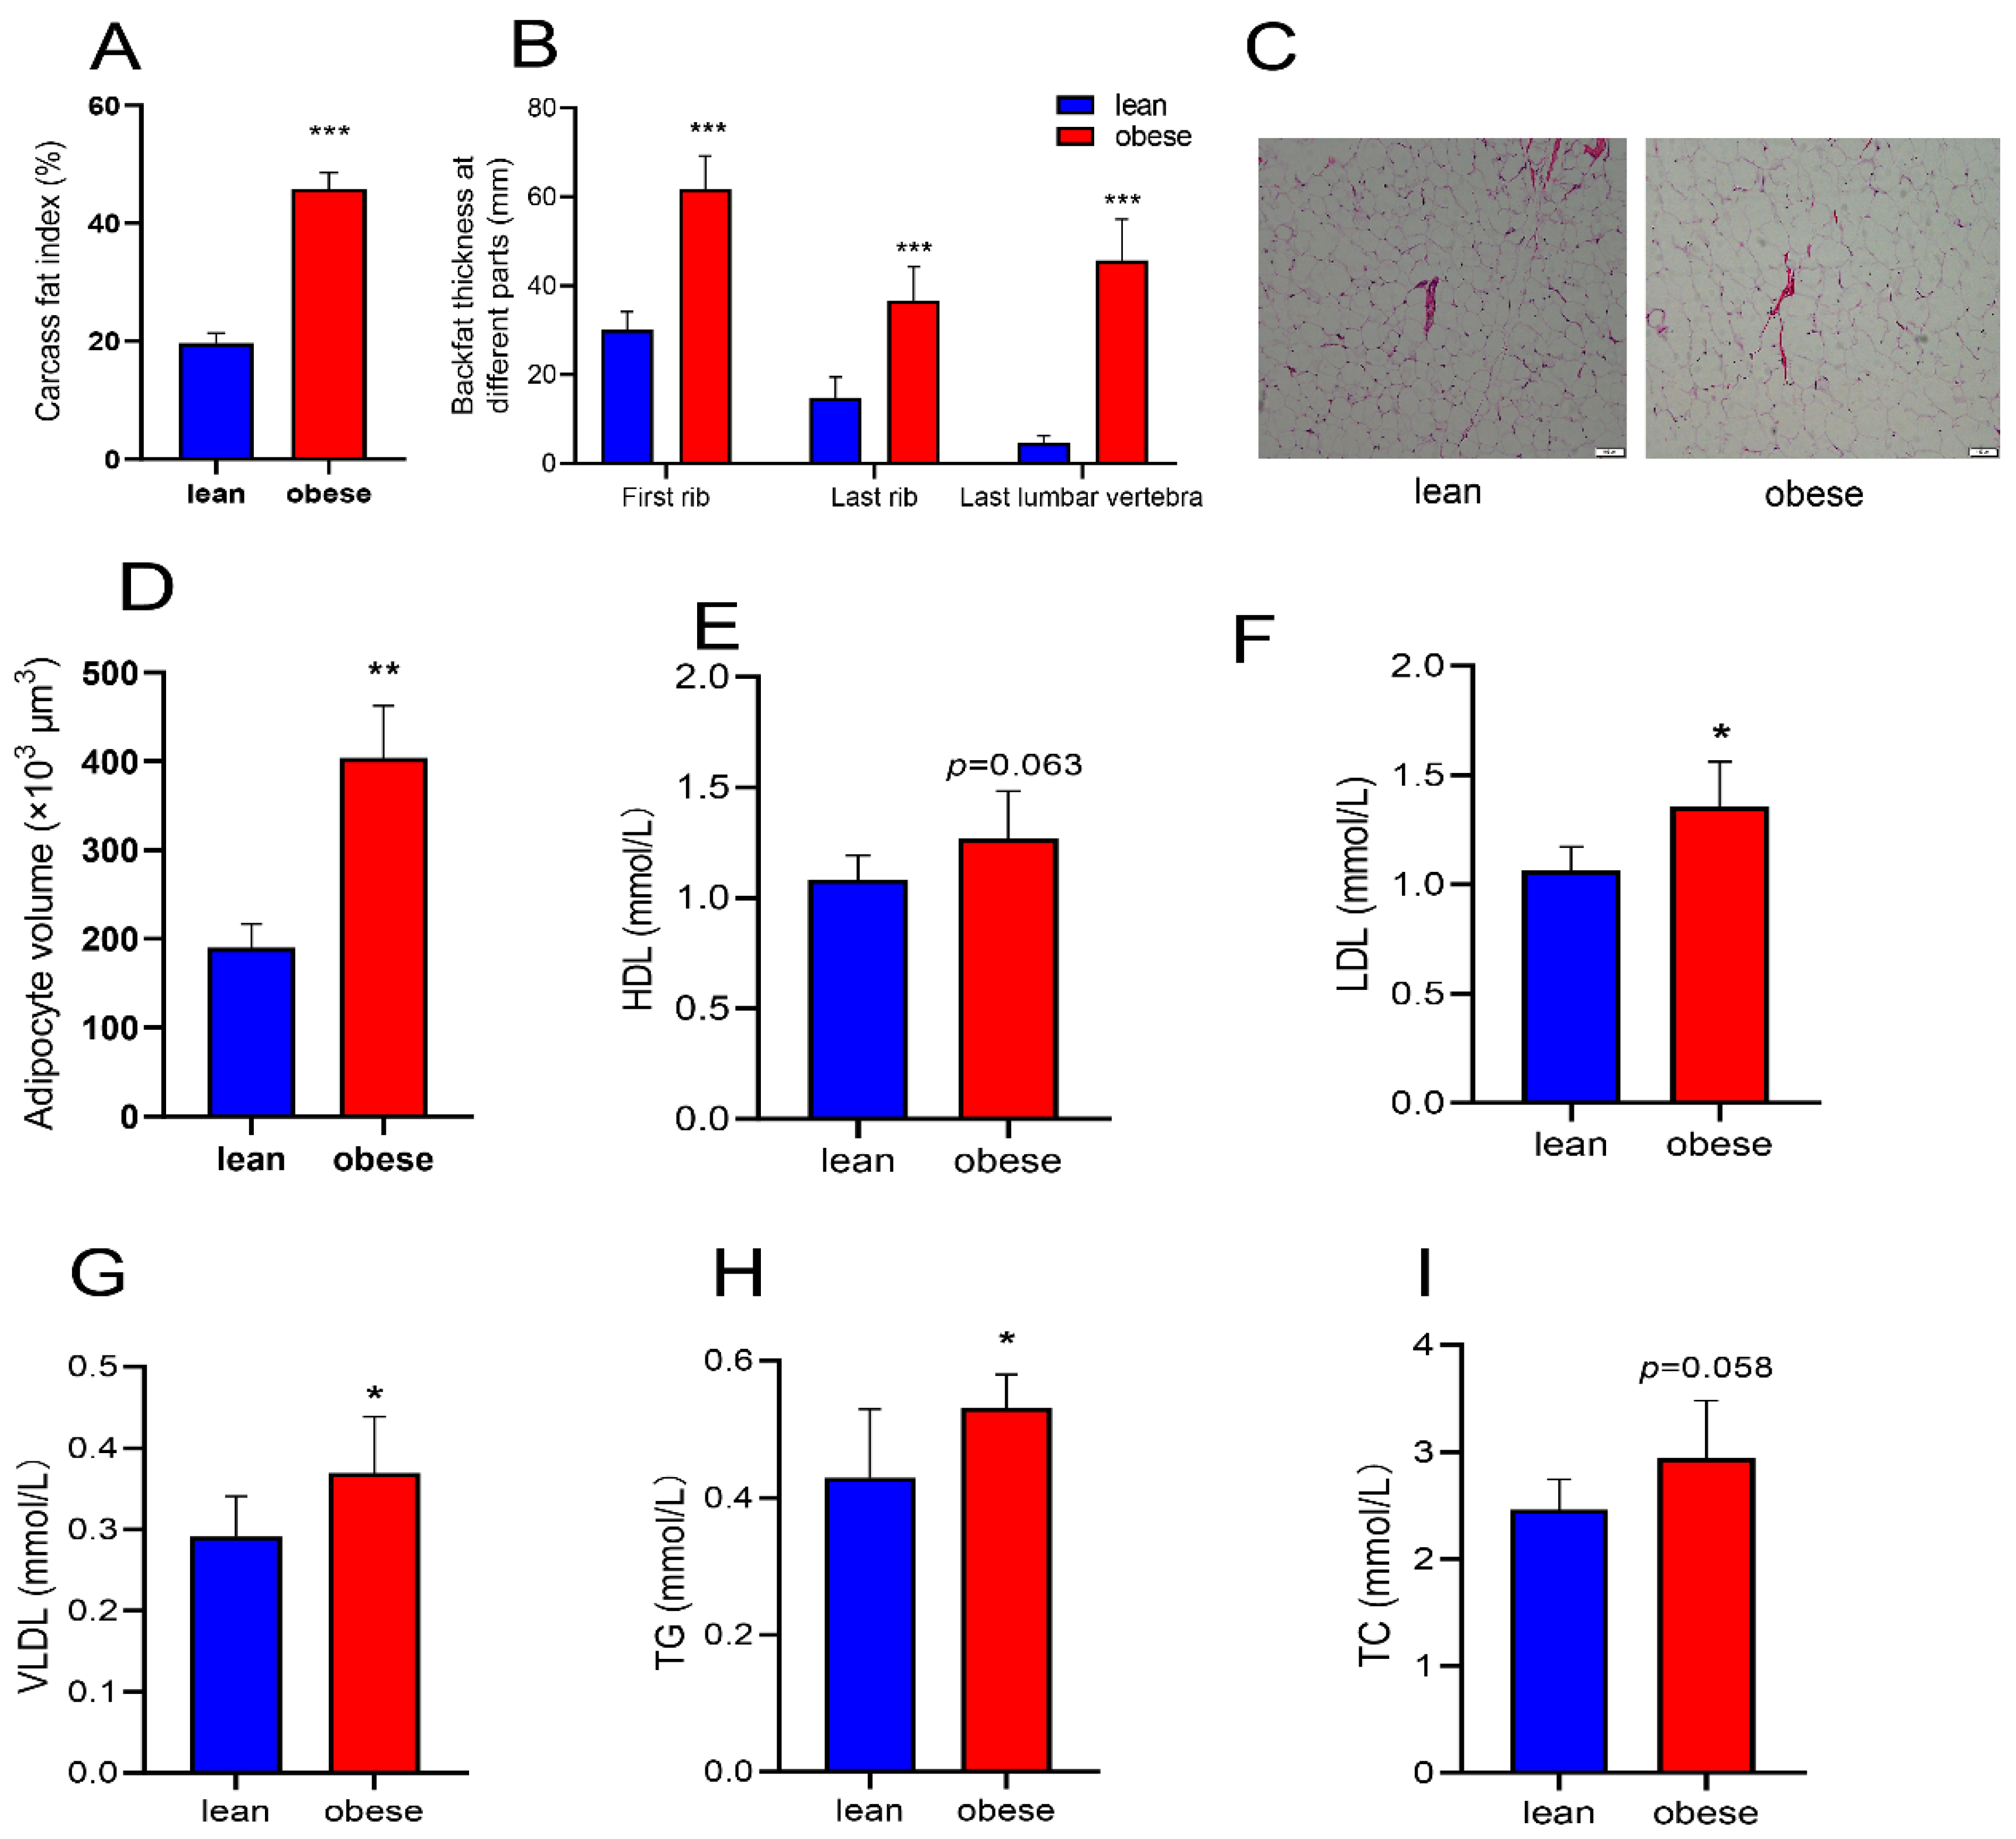
Abstract
:Simple Summary
Abstract
1. Introduction
2. Materials and Methods
2.1. Experimental Animals
2.2. Sample Collection
2.3. Determination of Serum Biochemical Indexes
2.4. RNA Extraction and RT-qPCR
2.5. tsRNA Sequencing
2.6. tsRNA Analysis
2.7. Target Gene Prediction and Functional Enrichment Analysis
2.8. Statistical Analysis
3. Results
3.1. Phenotypic Differences between Obese and Lean Pigs
3.2. Accumulation Characteristics of tsRNA in Subcutaneous Fat
3.3. Difference Analysis of tsRNA in Subcutaneous Fat
3.4. Target Gene Prediction and Functional Analysis of Differential tsRNAs
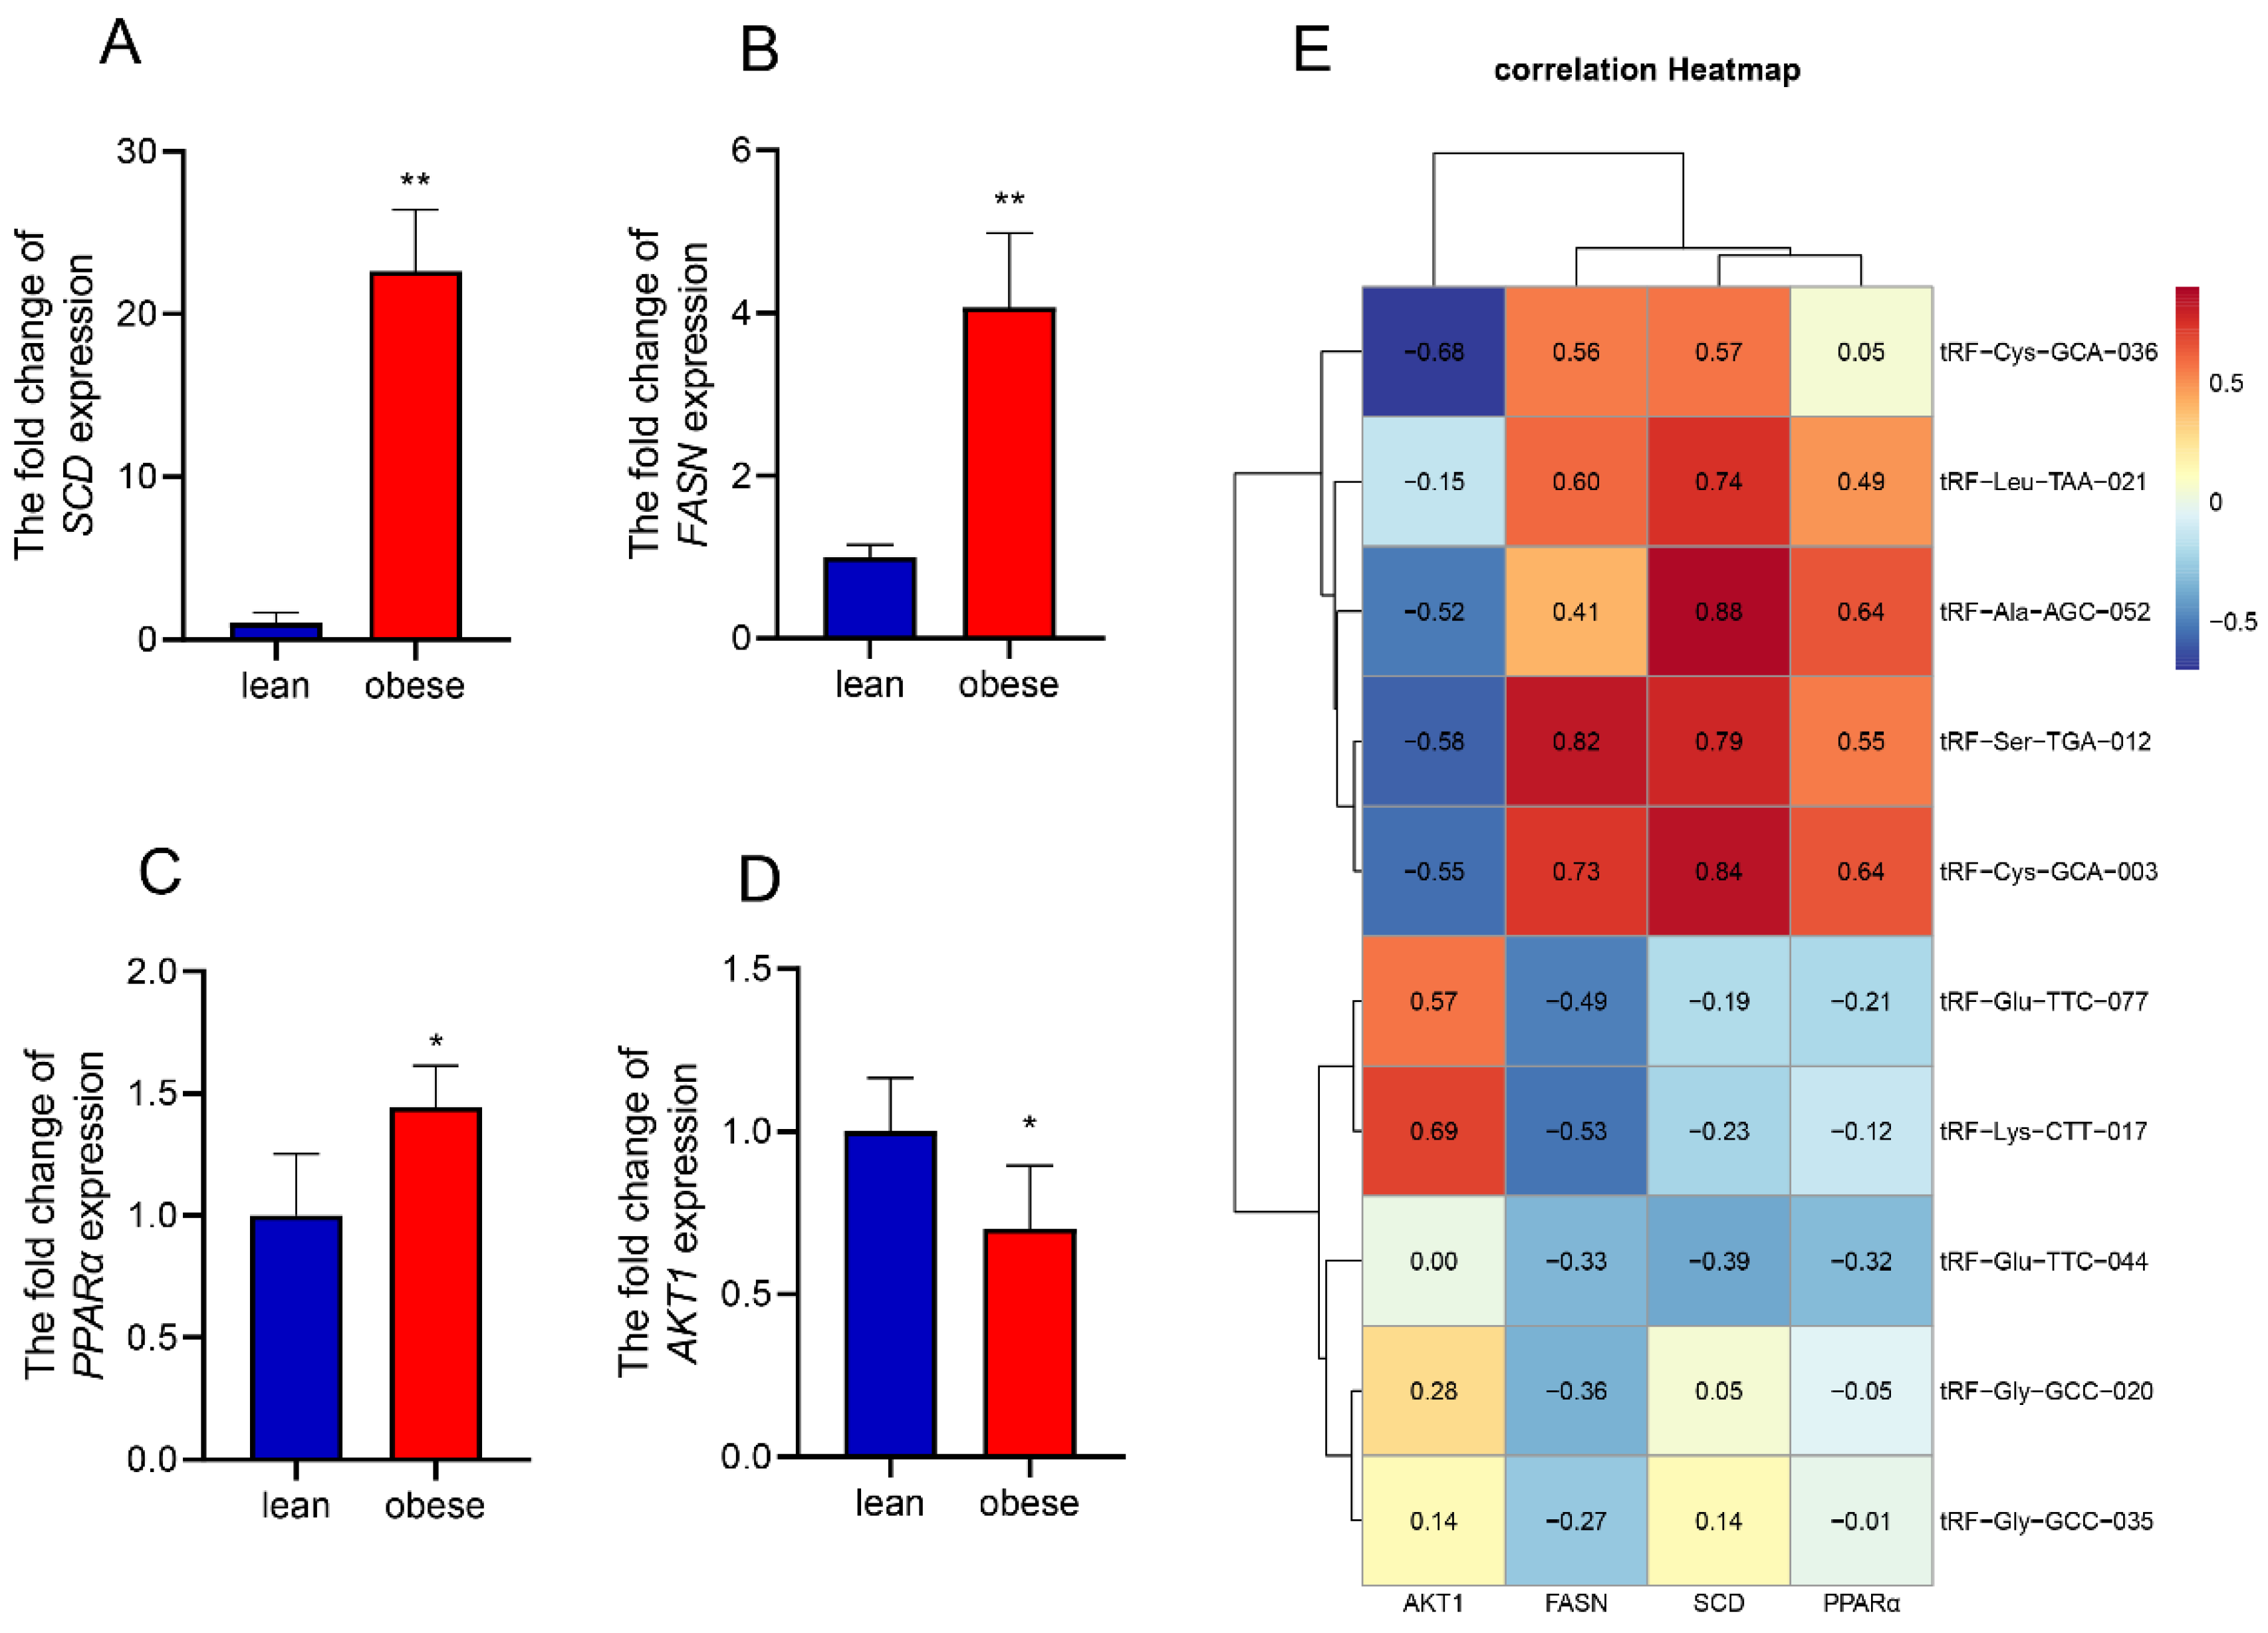
3.5. Regulation Network and Correlation Analysis of Fat Metabolism-Related Pathways
4. Discussion
5. Conclusions
Supplementary Materials
Author Contributions
Funding
Institutional Review Board Statement
Informed Consent Statement
Data Availability Statement
Conflicts of Interest
References
- Knox, R.V. Impact of swine reproductive technologies on pig and global food production. Adv. Exp. Med. Biol. 2014, 752, 131–160. [Google Scholar] [CrossRef] [PubMed]
- Lunney, J.K.; Van Goor, A. Importance of the pig as a human biomedical model. Sci. Transl. Med. 2021, 13, eabd5758. [Google Scholar] [CrossRef] [PubMed]
- Spurlock, M.E.; Gabler, N.K. The development of porcine models of obesity and the metabolic syndrome. J. Nutr. 2008, 138, 397–402. [Google Scholar] [CrossRef] [PubMed] [Green Version]
- Chooi, Y.C.; Ding, C.; Magkos, F. The epidemiology of obesity. Metab. Clin. Exp. 2019, 92, 6–10. [Google Scholar] [CrossRef] [PubMed] [Green Version]
- Kelly, T.; Yang, W.; Chen, C.S.; Reynolds, K.; He, J. Global burden of obesity in 2005 and projections to 2030. Int. J. Obes. 2008, 32, 1431–1437. [Google Scholar] [CrossRef] [PubMed] [Green Version]
- Kahn, S.E.; Hull, R.L.; Utzschneider, K.M. Mechanisms linking obesity to insulin resistance and type 2 diabetes. Nature 2006, 444, 840–846. [Google Scholar] [CrossRef] [PubMed]
- Al-Sulaiti, H.; Diboun, I.; Agha, M.V.; Mohamed, F.F.S.; Atkin, S.; Dömling, A.S.; Elrayess, M.A.; Mazloum, N.A. Metabolic signature of obesity-associated insulin resistance and type 2 diabetes. J. Transl. Med. 2019, 17, 348. [Google Scholar] [CrossRef] [PubMed] [Green Version]
- Ristic-Medic, D.; Bajerska, J.; Vucic, V. Crosstalk between dietary patterns, obesity and nonalcoholic fatty liver disease. World J. Gastroenterol. 2022, 28, 3314–3333. [Google Scholar] [CrossRef]
- Piché, M.E.; Tchernof, A.; Després, J.P. Obesity Phenotypes, Diabetes, and Cardiovascular Diseases. Circ. Res. 2020, 126, 1477–1500. [Google Scholar] [CrossRef]
- Ortega, F.B.; Lavie, C.J.; Blair, S.N. Obesity and Cardiovascular Disease. Circ. Res. 2016, 118, 1752–1770. [Google Scholar] [CrossRef]
- Liu, F.; Brewster, C.J.; Gilmour, S.L.; Henman, D.J.; Smits, R.J.; Luxford, B.G.; Dunshea, F.R.; Pluske, J.R.; Campbell, R.G. Relationship between energy intake and growth performance and body composition in pigs selected for low backfat thickness. J. Anim. Sci. 2021, 99, skab342. [Google Scholar] [CrossRef] [PubMed]
- Ding, R.; Zhuang, Z.; Qiu, Y.; Ruan, D.; Wu, J.; Ye, J. Identify known and novel candidate genes associated with backfat thickness in Duroc pigs by large-scale genome-wide association analysis. J. Anim. Sci. 2022, 100, 11–18. [Google Scholar] [CrossRef] [PubMed]
- Ibrahim, M.M. Subcutaneous and visceral adipose tissue: Structural and functional differences. Obes. Rev. Off. J. Int. Assoc. Study Obes. 2010, 11, 11–18. [Google Scholar] [CrossRef] [PubMed]
- Zwick, R.K.; Guerrero-Juarez, C.F.; Horsley, V.; Plikus, M.V. Anatomical, Physiological, and Functional Diversity of Adipose Tissue. Cell Metab. 2018, 27, 68–83. [Google Scholar] [CrossRef] [PubMed] [Green Version]
- Yu, K.; Mo, D.; Wu, M.; Chen, H.; Chen, L.; Li, M.; Chen, Y. Activating transcription factor 4 regulates adipocyte differentiation via altering the coordinate expression of CCATT/enhancer binding protein β and peroxisome proliferator-activated receptor γ. FEBS J. 2014, 281, 2399–2409. [Google Scholar] [CrossRef] [PubMed]
- Mota de Sá, P.; Richard, A.J.; Hang, H.; Stephens, J.M. Transcriptional Regulation of Adipogenesis. Compr. Physiol. 2017, 7, 635–674. [Google Scholar] [CrossRef]
- Lee, J.E.; Schmidt, H.; Lai, B. Transcriptional and Epigenomic Regulation of Adipogenesis. Mol. Cell. Biol. 2019, 39, e00601-18. [Google Scholar] [CrossRef] [Green Version]
- Chen, Y.T.; Yang, Q.Y.; Hu, Y.; Liu, X.D.; de Avila, J.M.; Zhu, M.J.; Nathanielsz, P.W.; Du, M. Imprinted lncRNA Dio3os preprograms intergenerational brown fat development and obesity resistance. Nat. Commun. 2021, 12, 6845. [Google Scholar] [CrossRef]
- Squillaro, T.; Peluso, G.; Galderisi, U. Long non-coding RNAs in regulation of adipogenesis and adipose tissue function. eLife 2020, 9, e59053. [Google Scholar] [CrossRef]
- Liu, K.; Liu, X.; Deng, Y.; Li, Z.; Tang, A. CircRNA-mediated regulation of brown adipose tissue adipogenesis. Front. Nutr. 2022, 9, 926024. [Google Scholar] [CrossRef]
- Chen, C.; Zhang, X.; Deng, Y.; Cui, Q.; Zhu, J.; Ren, H.; Liu, Y.; Hu, X.; Zuo, J.; Peng, Y. Regulatory roles of circRNAs in adipogenesis and lipid metabolism: Emerging insights into lipid-related diseases. FEBS J. 2021, 288, 3663–3682. [Google Scholar] [CrossRef] [PubMed]
- Shen, L.; He, J. MicroRNA-126b-5p Exacerbates Development of Adipose Tissue and Diet-Induced Obesity. Int. J. Mol. Sci. 2021, 22, 10261. [Google Scholar] [CrossRef] [PubMed]
- Arner, P.; Kulyté, A. MicroRNA regulatory networks in human adipose tissue and obesity. Nat. Rev. Endocrinol. 2015, 11, 276–288. [Google Scholar] [CrossRef] [PubMed]
- Wang, T.; Mei, J.; Li, X.; Xu, X.; Ma, B.; Li, W. A novel tsRNA-16902 regulating the adipogenic differentiation of human bone marrow mesenchymal stem cells. Stem Cell Res. Ther. 2020, 11, 365. [Google Scholar] [CrossRef]
- Pan, Q.; Han, T. Novel insights into the roles of tRNA-derived small RNAs. RNA Biol. 2021, 18, 2157–2167. [Google Scholar] [CrossRef]
- Chen, Q.; Zhang, X.; Shi, J.; Yan, M.; Zhou, T. Origins and evolving functionalities of tRNA-derived small RNAs. Trends Biochem. Sci. 2021, 46, 790–804. [Google Scholar] [CrossRef]
- Kim, H.K.; Fuchs, G.; Wang, S.; Wei, W.; Zhang, Y.; Park, H.; Roy-Chaudhuri, B.; Li, P.; Xu, J.; Chu, K.; et al. A transfer-RNA-derived small RNA regulates ribosome biogenesis. Nature 2017, 552, 57–62. [Google Scholar] [CrossRef]
- Goodarzi, H.; Liu, X.; Nguyen, H.C.; Zhang, S.; Fish, L.; Tavazoie, S.F. Endogenous tRNA-Derived Fragments Suppress Breast Cancer Progression via YBX1 Displacement. Cell 2015, 161, 790–802. [Google Scholar] [CrossRef] [Green Version]
- Kumar, P.; Kuscu, C.; Dutta, A. Biogenesis and Function of Transfer RNA-Related Fragments (tRFs). Trends Biochem. Sci. 2016, 41, 679–689. [Google Scholar] [CrossRef] [Green Version]
- Pandey, K.K.; Madhry, D.; Ravi Kumar, Y.S.; Malvankar, S.; Sapra, L.; Srivastava, R.K.; Bhattacharyya, S.; Verma, B. Regulatory roles of tRNA-derived RNA fragments in human pathophysiology. Mol. Ther. Nucleic Acids 2021, 26, 161–173. [Google Scholar] [CrossRef]
- Zuo, Y.; Chen, S.; Yan, L.; Hu, L.; Bowler, S.; Zitello, E.; Huang, G.; Deng, Y. Development of a tRNA-derived small RNA diagnostic and prognostic signature in liver cancer. Genes Dis. 2022, 9, 393–400. [Google Scholar] [CrossRef] [PubMed]
- Wang, B.; Xia, L.; Zhu, D.; Zeng, H.; Wei, B.; Lu, L.; Li, W.; Shi, Y.; Liu, J.; Zhang, Y.; et al. Paternal High-Fat Diet Altered Sperm 5′tsRNA-Gly-GCC Is Associated With Enhanced Gluconeogenesis in the Offspring. Front. Mol. Biosci. 2022, 9, 857875. [Google Scholar] [CrossRef] [PubMed]
- Shen, L.; Tan, Z.; Gan, M.; Li, Q.; Chen, L.; Niu, L.; Jiang, D.; Zhao, Y. tRNA-Derived Small Non-Coding RNAs as Novel Epigenetic Molecules Regulating Adipogenesis. Biomolecules 2019, 9, 274. [Google Scholar] [CrossRef] [PubMed] [Green Version]
- Wen, W.; Chen, X.; Huang, Z.; Chen, D.; Yu, B.; He, J.; Luo, Y.; Yan, H.; Chen, H.; Zheng, P.; et al. Dietary lycopene supplementation improves meat quality, antioxidant capacity and skeletal muscle fiber type transformation in finishing pigs. Anim. Nutr. (Zhongguo Xu Mu Shou Yi Xue Hui) 2022, 8, 256–264. [Google Scholar] [CrossRef] [PubMed]
- Li, M.; Wu, H.; Luo, Z.; Xia, Y.; Guan, J.; Wang, T.; Gu, Y.; Chen, L.; Zhang, K.; Ma, J.; et al. An atlas of DNA methylomes in porcine adipose and muscle tissues. Nat. Commun. 2012, 3, 850. [Google Scholar] [CrossRef] [Green Version]
- Livak, K.J.; Schmittgen, T.D. Analysis of relative gene expression data using real-time quantitative PCR and the 2(-Delta Delta C(T)) Method. Methods 2001, 25, 402–408. [Google Scholar] [CrossRef]
- Jin, F.; Yang, L.; Wang, W.; Yuan, N.; Zhan, S.; Yang, P.; Chen, X.; Ma, T.; Wang, Y. A novel class of tsRNA signatures as biomarkers for diagnosis and prognosis of pancreatic cancer. Mol. Cancer 2021, 20, 95. [Google Scholar] [CrossRef]
- Gan, M.; Liu, L.; Zhang, S.; Guo, Z.; Tan, Y.; Luo, J.; Yang, Q.; Pan, H.; Li, X.; Wang, J.; et al. Expression Characteristics of microRNA in Pig Umbilical Venous Blood and Umbilical Arterial Blood. Animals 2021, 11, 1563. [Google Scholar] [CrossRef]
- Robinson, M.D.; McCarthy, D.J.; Smyth, G.K. edgeR: A Bioconductor package for differential expression analysis of digital gene expression data. Bioinformatics 2010, 26, 139–140. [Google Scholar] [CrossRef] [Green Version]
- Di Fazio, A.; Schlackow, M.; Pong, S.K.; Alagia, A.; Gullerova, M. Dicer dependent tRNA derived small RNAs promote nascent RNA silencing. Nucleic Acids Res. 2022, 50, 1734–1752. [Google Scholar] [CrossRef]
- Zhang, L.; Lu, Q.; Chang, C. Epigenetics in Health and Disease. Adv. Exp. Med. Biol. 2020, 1253, 3–55. [Google Scholar] [CrossRef] [PubMed]
- Morselli, M.; Dieci, G. Epigenetic regulation of human non-coding RNA gene transcription. Biochem. Soc. Trans. 2022, 50, 723–736. [Google Scholar] [CrossRef] [PubMed]
- Yan, Y.; Chang, C.; Su, J.; Venø, M.T.; Kjems, J. Osteoblastogenesis Alters Small RNA Profiles in EVs Derived from Bone Marrow Stem Cells (BMSCs) and Adipose Stem Cells (ASCs). Biomedicines 2020, 8, 387. [Google Scholar] [CrossRef] [PubMed]
- Wang, T.; Cao, L.; He, S.; Long, K.; Wang, X.; Yu, H.; Ma, B.; Xu, X.; Li, W. Small RNA sequencing reveals a novel tsRNA-06018 playing an important role during adipogenic differentiation of hMSCs. J. Cell. Mol. Med. 2020, 24, 12736–12749. [Google Scholar] [CrossRef] [PubMed]
- Hill, J.O.; Wyatt, H.R.; Peters, J.C. Energy balance and obesity. Circulation 2012, 126, 126–132. [Google Scholar] [CrossRef] [PubMed]
- Kayser, B.; Verges, S. Hypoxia, energy balance and obesity: From pathophysiological mechanisms to new treatment strategies. Obes. Rev. Off. J. Int. Assoc. Study Obes. 2013, 14, 579–592. [Google Scholar] [CrossRef]
- Ali, A.T.; Hochfeld, W.E.; Myburgh, R.; Pepper, M.S. Adipocyte and adipogenesis. Eur. J. Cell Biol. 2013, 92, 229–236. [Google Scholar] [CrossRef]
- Sakers, A.; De Siqueira, M.K.; Seale, P.; Villanueva, C.J. Adipose-tissue plasticity in health and disease. Cell 2022, 185, 419–446. [Google Scholar] [CrossRef]
- Guilherme, A.; Virbasius, J.V.; Puri, V.; Czech, M.P. Adipocyte dysfunctions linking obesity to insulin resistance and type 2 diabetes. Nat. Rev. Mol. Cell Biol. 2008, 9, 367–377. [Google Scholar] [CrossRef] [Green Version]
- Kleinert, M.; Clemmensen, C.; Hofmann, S.M.; Moore, M.C.; Renner, S.; Woods, S.C.; Huypens, P.; Beckers, J.; de Angelis, M.H.; Schürmann, A.; et al. Animal models of obesity and diabetes mellitus. Nat. Rev. Endocrinol. 2018, 14, 140–162. [Google Scholar] [CrossRef]
- Zhang, Y.; Zhang, J.; Gong, H.; Cui, L.; Zhang, W.; Ma, J.; Chen, C.; Ai, H.; Xiao, S.; Huang, L.; et al. Genetic correlation of fatty acid composition with growth, carcass, fat deposition and meat quality traits based on GWAS data in six pig populations. Meat Sci. 2019, 150, 47–55. [Google Scholar] [CrossRef] [PubMed]
- Suzuki, K.; Ishida, M.; Kadowaki, H.; Shibata, T.; Uchida, H.; Nishida, A. Genetic correlations among fatty acid compositions in different sites of fat tissues, meat production, and meat quality traits in Duroc pigs. J. Anim. Sci. 2006, 84, 2026–2034. [Google Scholar] [CrossRef] [PubMed] [Green Version]
- Thitachot, K.; Sirinopwong, V.; Seemuang, V.; Ratchatasriprasert, A.; Kirkwood, R.N. Influence of Backfat Thickness and the Interval from Altrenogest Withdrawal to Estrus on Reproductive Performance of Gilts. Animals 2021, 11, 1348. [Google Scholar] [CrossRef] [PubMed]
- Thiengpimol, P.; Koonawootrittriron, S. Genetic and phenotypic correlations between backfat thickness and weight at 28 weeks of age, and reproductive performance in primiparous Landrace sows raised under tropical conditions. Trop. Anim. Health Prod. 2022, 54, 43. [Google Scholar] [CrossRef] [PubMed]
- Hames, K.C.; Koutsari, C.; Santosa, S.; Bush, N.C.; Jensen, M.D. Adipose tissue fatty acid storage factors: Effects of depot, sex and fat cell size. Int. J. Obes. 2015, 39, 884–887. [Google Scholar] [CrossRef] [PubMed] [Green Version]
- Packard, C.J.; Boren, J.; Taskinen, M.R. Causes and Consequences of Hypertriglyceridemia. Front. Endocrinol. 2020, 11, 252. [Google Scholar] [CrossRef]
- Aguilera-Méndez, A.; Álvarez-Delgado, C.; Hernández-Godinez, D.; Fernandez-Mejia, C. Hepatic diseases related to triglyceride metabolism. Mini Rev. Med. Chem. 2013, 13, 1691–1699. [Google Scholar] [CrossRef]
- Sozen, E.; Ozer, N.K. Impact of high cholesterol and endoplasmic reticulum stress on metabolic diseases: An updated mini-review. Redox Biol. 2017, 12, 456–461. [Google Scholar] [CrossRef]
- Zhang, Y.; Ren, L.; Sun, X.; Zhang, Z.; Liu, J.; Xin, Y.; Yu, J.; Jia, Y.; Sheng, J.; Hu, G.F. Angiogenin mediates paternal inflammation-induced metabolic disorders in offspring through sperm tsRNAs. Nat. Commun. 2021, 12, 6673. [Google Scholar] [CrossRef]
- Chen, Q.; Yan, M.; Cao, Z.; Li, X.; Zhang, Y.; Shi, J.; Feng, G.H.; Peng, H.; Zhang, X.; Zhang, Y.; et al. Sperm tsRNAs contribute to intergenerational inheritance of an acquired metabolic disorder. Science 2016, 351, 397–400. [Google Scholar] [CrossRef]
- Korac, B.; Kalezic, A.; Pekovic-Vaughan, V.; Korac, A.; Jankovic, A. Redox changes in obesity, metabolic syndrome, and diabetes. Redox Biol. 2021, 42, 101887. [Google Scholar] [CrossRef] [PubMed]
- Zhang, C.; Luo, X.; Chen, J.; Zhou, B.; Yang, M.; Liu, R.; Liu, D.; Gu, H.F. Osteoprotegerin Promotes Liver Steatosis by Targeting the ERK-PPAR-γ-CD36 Pathway. Diabetes 2019, 68, 1902–1914. [Google Scholar] [CrossRef] [PubMed]
- Mao, Z.; Feng, M.; Li, Z.; Zhou, M.; Xu, L.; Pan, K.; Wang, S.; Su, W.; Zhang, W. ETV5 Regulates Hepatic Fatty Acid Metabolism Through PPAR Signaling Pathway. Diabetes 2021, 70, 214–226. [Google Scholar] [CrossRef] [PubMed]
- Wang, Q.; Liu, S.; Zhai, A.; Zhang, B.; Tian, G. AMPK-Mediated Regulation of Lipid Metabolism by Phosphorylation. Biol. Pharm. Bull. 2018, 41, 985–993. [Google Scholar] [CrossRef] [Green Version]
- Glass, C.K.; Olefsky, J.M. Inflammation and lipid signaling in the etiology of insulin resistance. Cell Metab. 2012, 15, 635–645. [Google Scholar] [CrossRef] [Green Version]
- An, T.; Zhang, J.; Lv, B.; Liu, Y.; Huang, J.; Lian, J.; Wu, Y.; Gao, S.; Jiang, G. Salvianolic acid B plays an anti-obesity role in high fat diet-induced obese mice by regulating the expression of mRNA, circRNA, and lncRNA. PeerJ 2019, 7, e6506. [Google Scholar] [CrossRef] [Green Version]
- Sharma, M.; Dey, C.S. Role of Akt isoforms in neuronal insulin signaling and resistance. Cell. Mol. Life Sci. 2021, 78, 7873–7898. [Google Scholar] [CrossRef]
- Sievert, H.; Krause, C.; Geißler, C.; Grohs, M.; El-Gammal, A.T.; Wolter, S.; Mann, O.; Lehnert, H.; Kirchner, H. Epigenetic Downregulation of FASN in Visceral Adipose Tissue of Insulin Resistant Subjects. Exp. Clin. Endocrinol. Diabetes Off. J. Ger. Soc. Endocrinol. Ger. Diabetes Assoc. 2021, 129, 674–682. [Google Scholar] [CrossRef]


Publisher’s Note: MDPI stays neutral with regard to jurisdictional claims in published maps and institutional affiliations. |
© 2022 by the authors. Licensee MDPI, Basel, Switzerland. This article is an open access article distributed under the terms and conditions of the Creative Commons Attribution (CC BY) license (https://creativecommons.org/licenses/by/4.0/).
Share and Cite
Gu, H.; Gan, M.; Wang, L.; Yang, Y.; Wang, J.; Chen, L.; Zhang, S.; Zhao, Y.; Niu, L.; Jiang, D.; et al. Differential Expression Analysis of tRNA-Derived Small RNAs from Subcutaneous Adipose Tissue of Obese and Lean Pigs. Animals 2022, 12, 3561. https://doi.org/10.3390/ani12243561
Gu H, Gan M, Wang L, Yang Y, Wang J, Chen L, Zhang S, Zhao Y, Niu L, Jiang D, et al. Differential Expression Analysis of tRNA-Derived Small RNAs from Subcutaneous Adipose Tissue of Obese and Lean Pigs. Animals. 2022; 12(24):3561. https://doi.org/10.3390/ani12243561
Chicago/Turabian StyleGu, Hao, Mailin Gan, Linghui Wang, Yiting Yang, Jinyong Wang, Lei Chen, Shunhua Zhang, Ye Zhao, Lili Niu, Dongmei Jiang, and et al. 2022. "Differential Expression Analysis of tRNA-Derived Small RNAs from Subcutaneous Adipose Tissue of Obese and Lean Pigs" Animals 12, no. 24: 3561. https://doi.org/10.3390/ani12243561