
Effects of Fouling Management and Net Coating Strategies on Reared Gilthead Sea Bream Juveniles


Abstract
:Simple Summary
Abstract
1. Introduction
2. Materials and Methods
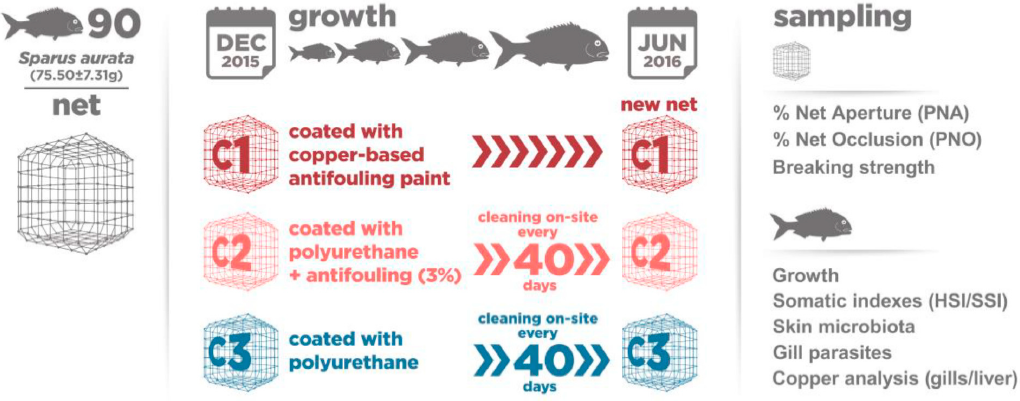
2.1. Study Area
Experimental Setup and System Description
2.2. Fish Husbandry and Feeding
2.2.1. Water Quality Monitoring and Copper Determination in Water
2.2.2. Net Sampling and Image Analysis
2.2.3. Growth Assessment and Somatic Indexes
2.2.4. Skin Mucus Collection and Preparation for Skin Microbiota Analyses
2.2.5. Gill Parasites Quantification
2.2.6. Gill Histology and Gill Score Protocol
2.2.7. Copper Analysis
2.2.8. Statistical Analysis
3. Results
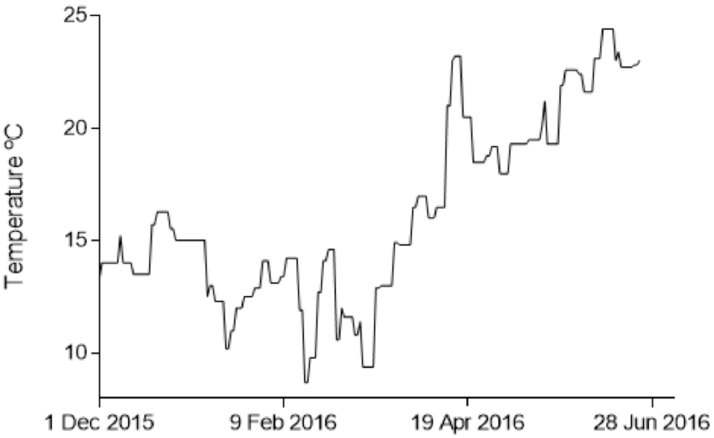
3.1. Water Quality
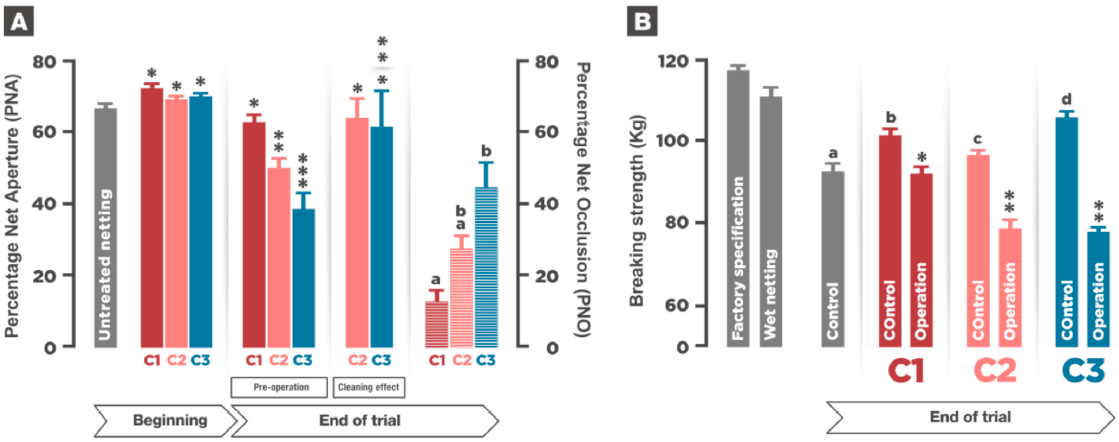
3.2. Netting and Fouling Formation
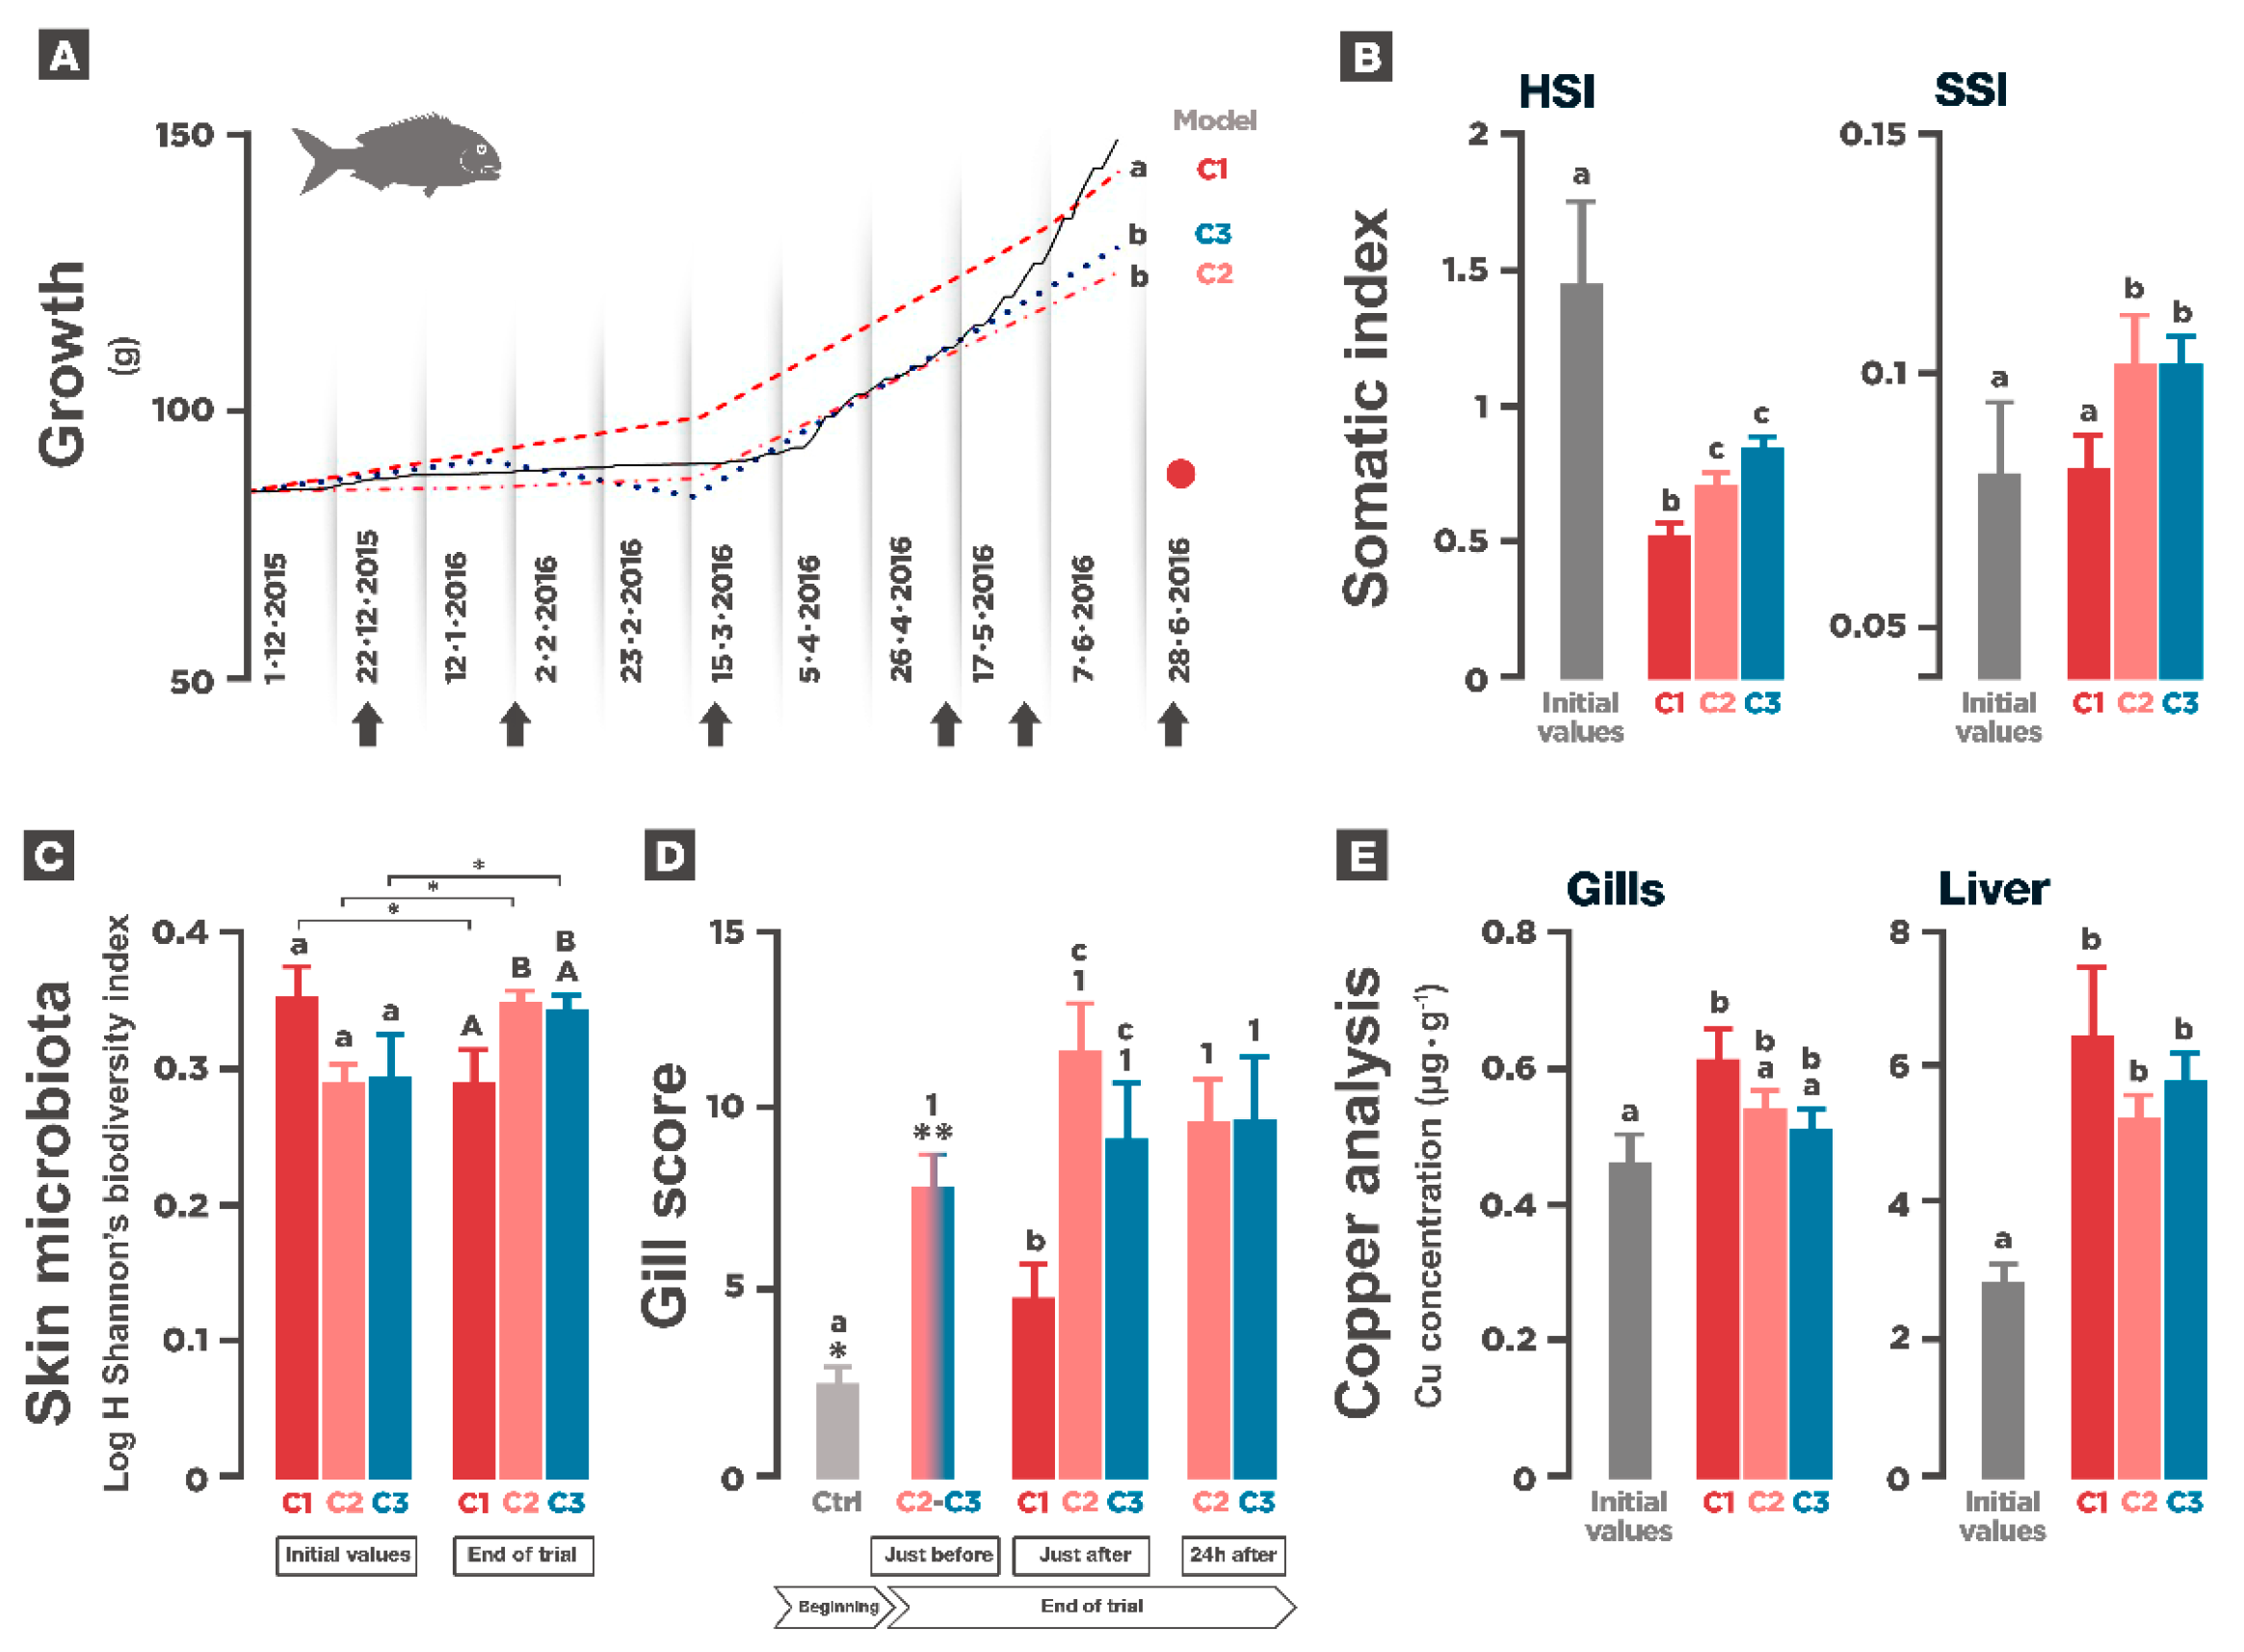
3.3. Growth and Somatic Indexes
3.4. Gill Parasites and Skin Microbiota
3.5. Gill Histology
3.6. Copper Analysis
4. Discussion
5. Conclusions
Author Contributions
Funding
Institutional Review Board Statement
Informed Consent Statement
Data Availability Statement
Acknowledgments
Ethical Approval
Conflicts of Interest
References
- FAO. The State of World Fisheries and Aquaculture; FAO: Rome, Italy, 2016. [Google Scholar]
- Hole, W. Marine Fouling and Its Prevention. In Bureau of Ships, Navy Department; United States Naval Institute: Annapolis, MA, USA, 1952. [Google Scholar]
- Bloecher, N.; Olsen, Y.; Guenther, J. Variability of biofouling communities on fish cage nets: A 1-year field study at a Norwegian salmon farm. Aquaculture 2013, 416–417, 302–309. [Google Scholar] [CrossRef]
- Edwards, C.D.; Pawluk, K.A.; Cross, S.F. The effectiveness of several commercial antifouling treatments at reducing biofouling on finfish aquaculture cages in British Columbia. Aquac. Res. 2015, 46, 2225–2235. [Google Scholar] [CrossRef]
- Braithwaite, R.A.; Carrascosa, M.C.C.; McEvoy, L.A. Biofouling of salmon cage netting and the efficacy of a typical copper-based antifoulant. Aquacuture 2007, 262, 219–226. [Google Scholar] [CrossRef]
- Douglas-Helders, G.; Tan, C.; Carson, J.; Nowak, B. Effects of copper-based antifouling treatment on the presence of Neoparamoeba pemaquidensis Page, 1987 on nets and gills of reared Atlantic salmon (Salmo salar). Aquaculture 2003, 221, 13–22. [Google Scholar] [CrossRef]
- Swain, G.; Shinjo, N. Comparing Biofouling Control Treatments for Use on Aquaculture Nets. Int. J. Mol. Sci. 2014, 15, 22142–22154. [Google Scholar] [CrossRef] [PubMed] [Green Version]
- IMO. Focus on IMO: Anti-fouling systems. Int. Marit. Organ. 2002, 44, 1–31. [Google Scholar] [CrossRef]
- Evans, L.V. Marine algae and fouling-a review, with particular reference to ship-fouling. Bot. Mar. 1981, 24, 167–171. [Google Scholar] [CrossRef]
- Grosell, M. Copper. Fish Physiol. 2011, 31, 53–133. [Google Scholar] [CrossRef]
- Grosell, M.; Wood, C.M. Copper uptake across rainbow trout gills: Mechanisms of apical entry. J. Exp. Biol. 2002, 205, 1179–1188. [Google Scholar] [PubMed]
- Brooks, K.M.; Mahnken, C.V.W. Interactions of Atlantic salmon in the Pacific Northwest environment: III. Accumulation of zinc and copper. Fish. Res. 2003, 62, 295–305. [Google Scholar] [CrossRef]
- Willemsen, P. Biofouling in European Aquaculture: Is there an easy solution? Eur. Aquac. Soc. Spec. Publ. 2005, 40, 1–6. [Google Scholar]
- Hodson, S.L.; Lewis, T.E.; Burkea, C.M. Biofouling of fish-cage netting: Efficacy and problems of in situ cleaning. Aquaculture 1997, 152, 77–90. [Google Scholar] [CrossRef]
- Schneider, C.A.; Rasband, W.S.; Eliceiri, K.W. NIH Image to ImageJ: 25 years of image analysis. Nat. Methods 2012, 9, 671–675. [Google Scholar] [CrossRef]
- Hopkins, K.D. Reporting Fish Growth: A Review of the Basics. J. World Aquac. Soc. 1992, 23, 173–179. [Google Scholar] [CrossRef]
- Xu, Z.; Parra, D.; Gómez, D.; Salinas, I.; Zhang, Y.-A.; Jørgensen, L.V.G.; Heinecke, R.D.; Buchmann, K.; LaPatra, S.; Sunyer, J.O. Teleost skin, an ancient mucosal surface that elicits gut-like immune responses. Proc. Natl. Acad. Sci. USA 2013, 110, 13097–13102. [Google Scholar] [CrossRef] [PubMed] [Green Version]
- Mitchell, S.O.; Baxter, E.J.; Holland, C.; Rodger, H.D. Development of a novel histopathological gill scoring protocol for assessment of gill health during a longitudinal study in marine-farmed Atlantic salmon (Salmo salar). Aquac. Int. 2012, 20, 813–825. [Google Scholar] [CrossRef]
- Moe, H.; Olsen, A.; Hopperstad, O.S.; Jensen, Ø.; Fredheim, A. Tensile properties for netting materials used in aquaculture net cages. Aquac. Eng. 2007, 37, 252–265. [Google Scholar] [CrossRef]
- Conte, F.S. Stress and The Welfare of Cultured Fish. In Applied Animal Behaviour Science; Elsevier: Amsterdam, The Netherlands, 2004; pp. 205–223. [Google Scholar]
- Rotllant, J.; Tort, L. Cortisol and glucose responses after acute stress by net handling in the sparid red porgy previously subjected to crowding stress. J. Fish Biol. 1997, 51, 21–28. [Google Scholar] [CrossRef]
- Tort, L.; Rotllant, J.; Liarte, C.; Acerete, L.; Hernández, A.; Ceulemans, S.; Coutteau, P.; Padros, F. Effects of temperature decrease on feeding rates, immune indicators and histopathological changes of gilthead sea bream Sparus aurata fed with an experimental diet. Aquaculture 2004, 229, 55–65. [Google Scholar] [CrossRef]
- Vera, R.; Vergara, A.M. Efectos del lavado in situ de redes en sedimentos asociados a la acuicultura en el sur de Chile. Rev. Biol. Mar. Oceanogr. 2016, 51, 505–514. [Google Scholar] [CrossRef] [Green Version]
- Dezfuli, B.S.; Giari, L.; Lui, A.; Lorenzoni, M.; Noga, E.J. Mast cell responses to Ergasilus (Copepoda), a gill ectoparasite of sea bream. Fish Shellfish. Immunol. 2011, 30, 1087–1094. [Google Scholar] [CrossRef]
- Dezfuli, B.S.; Squerzanti, S.; Fabbri, S.; Castaldelli, G.; Giari, L. Cellular response in semi-intensively cultured sea bream gills to Ergasilus sieboldi (Copepoda) with emphasis on the distribution, histochemistry and fine structure of mucous cells. Veter-Parasitol. 2010, 174, 359–365. [Google Scholar] [CrossRef]
- Andersen, R.J.; Luu, H.A.; Chen, D.Z.; Holmes, C.F.; Kent, M.L.; Le Blanc, M.; Taylor, F.; Williams, D.E. Chemical and biological evidence links microcystins to salmon ‘netpen liver disease’. Toxicon 1993, 31, 1315–1323. [Google Scholar] [CrossRef]
- González, L. The life cycle of Hysterothylacium aduncum (Nematoda: Anisakidae) in Chilean marine farms. Aquaculture 1998, 162, 173–186. [Google Scholar] [CrossRef]
- Henry, M.; Nikoloudaki, C.; Tsigenopoulos, C.; Rigos, G. Strong effect of long-term Sparicotyle chrysophrii infection on the cellular and innate immune responses of gilthead sea bream, Sparus aurata. Dev. Comp. Immunol. 2015, 51, 185–193. [Google Scholar] [CrossRef]
- Tan, C.K.; Nowak, B.F.; Hodson, S.L. Biofouling as a reservoir of Neoparamoeba pemaquidensis (Page, 1970), the causative agent of amoebic gill disease in Atlantic salmon. Aquaculture 2002, 210, 49–58. [Google Scholar] [CrossRef]
- Sitjà-Bobadilla, A.; Redondo, M.J.; Alvarez-Pellitero, P. Occurrence of Sparicotyle chrysophrii (Monogenea: Polyopisthocotylea) in gilthead sea bream (Sparus aurata L.) from different mariculture systems in Spain. Aquac. Res. 2009, 41, 939–944. [Google Scholar] [CrossRef] [Green Version]
- Ibarz, A.; Padrós, F.; Gallardo, M.Á.; Fernández-Borràs, J.; Blasco, J.; Tort, L. Low-temperature challenges to gilthead sea bream culture: Review of cold-induced alterations and ‘Winter Syndrome’. Rev. Fish Biol. Fish. 2010, 20, 539–556. [Google Scholar] [CrossRef]
- Cockell, K.A.; Bertinato, J.; L’Abbé, M.R. Regulatory frameworks for copper considering chronic exposures of the population. Am. J. Clin. Nutr. 2008, 88, 863–866. [Google Scholar]
- Hedley, C.; Huntington, T. Regulatory and Legal Constraints for European Aquaculture. In European Parliament, Internal Policy DG, Policy Department B: Structural and Cohesion Policies, Fisheries (Study No. PE 431.568); Policy Department of the European Parliament: Brussels, Belgium, 2009; 102p, ISBN 978-92-823-3081-4. [Google Scholar]
- Minganti, V.; Drava, G.; De Pellegrini, R.; Siccardi, C. Trace elements in farmed and wild gilthead seabream, Sparus aurata. Mar. Pollut. Bull. 2010, 60, 2022–2025. [Google Scholar] [CrossRef]
- Grosell, M.; Wood, C.M.; Walsh, P.J. Copper homeostasis and toxicity in the elasmobranch Raja erinacea and the teleost Myoxocephalus octodecemspinosus during exposure to elevated water-borne copper. Comp. Biochem. Physiol. Part C Toxicol. Pharmacol. 2003, 135, 179–190. [Google Scholar] [CrossRef]
- Nędzarek, A.; Czerniejewski, P. The edible tissues of the major European population of the invasive Chinese mitten crab (Eriocheir sinensis) in the Elbe River, Germany, as a valuable and safe complement in essential elements to the human diet. J. Food Compos. Anal. 2021, 96, 103713. [Google Scholar] [CrossRef]
- Bost, M.; Houdart, S.; Oberli, M.; Kalonji, E.; Huneau, J.-F.; Margaritis, I. Dietary copper and human health: Current evidence and unresolved issues. J. Trace Elements Med. Biol. 2016, 35, 107–115. [Google Scholar] [CrossRef] [PubMed]


| Temperature °C | O2 ppm | O2 SAT. % | NO2− mg·L−1 | NH4+ mg·L−1 | pH | Salinity ‰ | |
|---|---|---|---|---|---|---|---|
| Average | 16.61 ± 3.95 | 11.99 ± 4.31 | 124.06 ± 40.05 | 0.19 ± 0.18 | 0.05 ± 0.07 | 8.32 ± 0.19 | 28.99 ± 4.11 |
| Min. | 8.7 | 5.2 | 70.0 | 0.00 | 0.00 | 8.00 | 14.40 |
| Max. | 24.4 | 24.2 | 249.0 | 0.80 | 0.70 | 8.80 | 34.80 |
| P (%) | A | MI | |
|---|---|---|---|
| Condition 1 | 0.00 | 0.00 | 0.00 |
| Condition 2 | 25.00 | 0.83 | 3.30 |
| Condition 3 | 40.00 | 0.80 | 2.00 |
Publisher’s Note: MDPI stays neutral with regard to jurisdictional claims in published maps and institutional affiliations. |
© 2021 by the authors. Licensee MDPI, Basel, Switzerland. This article is an open access article distributed under the terms and conditions of the Creative Commons Attribution (CC BY) license (http://creativecommons.org/licenses/by/4.0/).
Share and Cite
Comas, J.; Parra, D.; Balasch, J.C.; Tort, L. Effects of Fouling Management and Net Coating Strategies on Reared Gilthead Sea Bream Juveniles. Animals 2021, 11, 734. https://doi.org/10.3390/ani11030734
Comas J, Parra D, Balasch JC, Tort L. Effects of Fouling Management and Net Coating Strategies on Reared Gilthead Sea Bream Juveniles. Animals. 2021; 11(3):734. https://doi.org/10.3390/ani11030734
Chicago/Turabian StyleComas, Jordi, David Parra, Joan Carles Balasch, and Lluís Tort. 2021. "Effects of Fouling Management and Net Coating Strategies on Reared Gilthead Sea Bream Juveniles" Animals 11, no. 3: 734. https://doi.org/10.3390/ani11030734