
Aflatoxicosis Dysregulates the Physiological Responses to Crowding Densities in the Marine Teleost Gilthead Seabream (Sparus aurata)


Abstract
:Simple Summary
Abstract
1. Introduction
2. Materials and Methods
2.1. Experimental Fish Feed
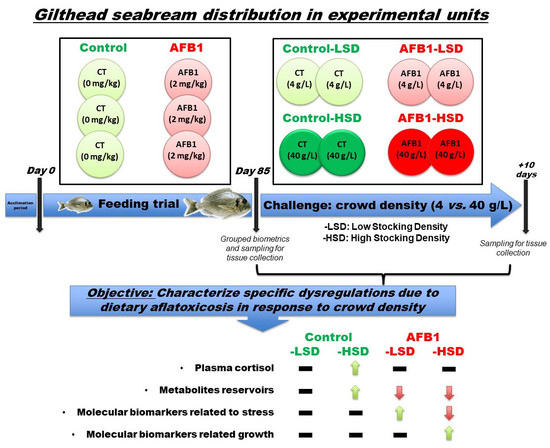
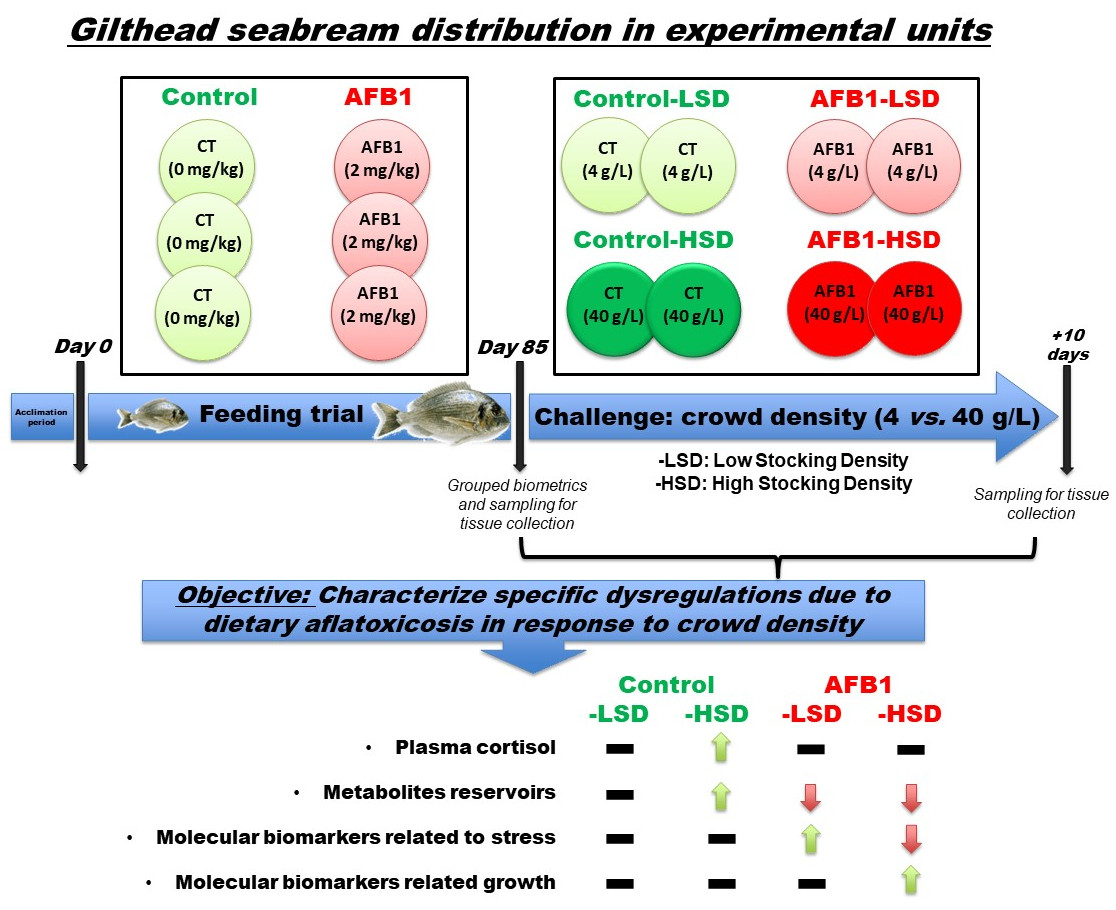
2.2. Animals and Experimental Designs
2.3. Sampling Protocol
2.4. Plasma and Tissue Parameters
2.5. RNA Isolation and Quantitative Real-Time PCR
2.6. Statistical Analysis
3. Results
3.1. Fish Mortality
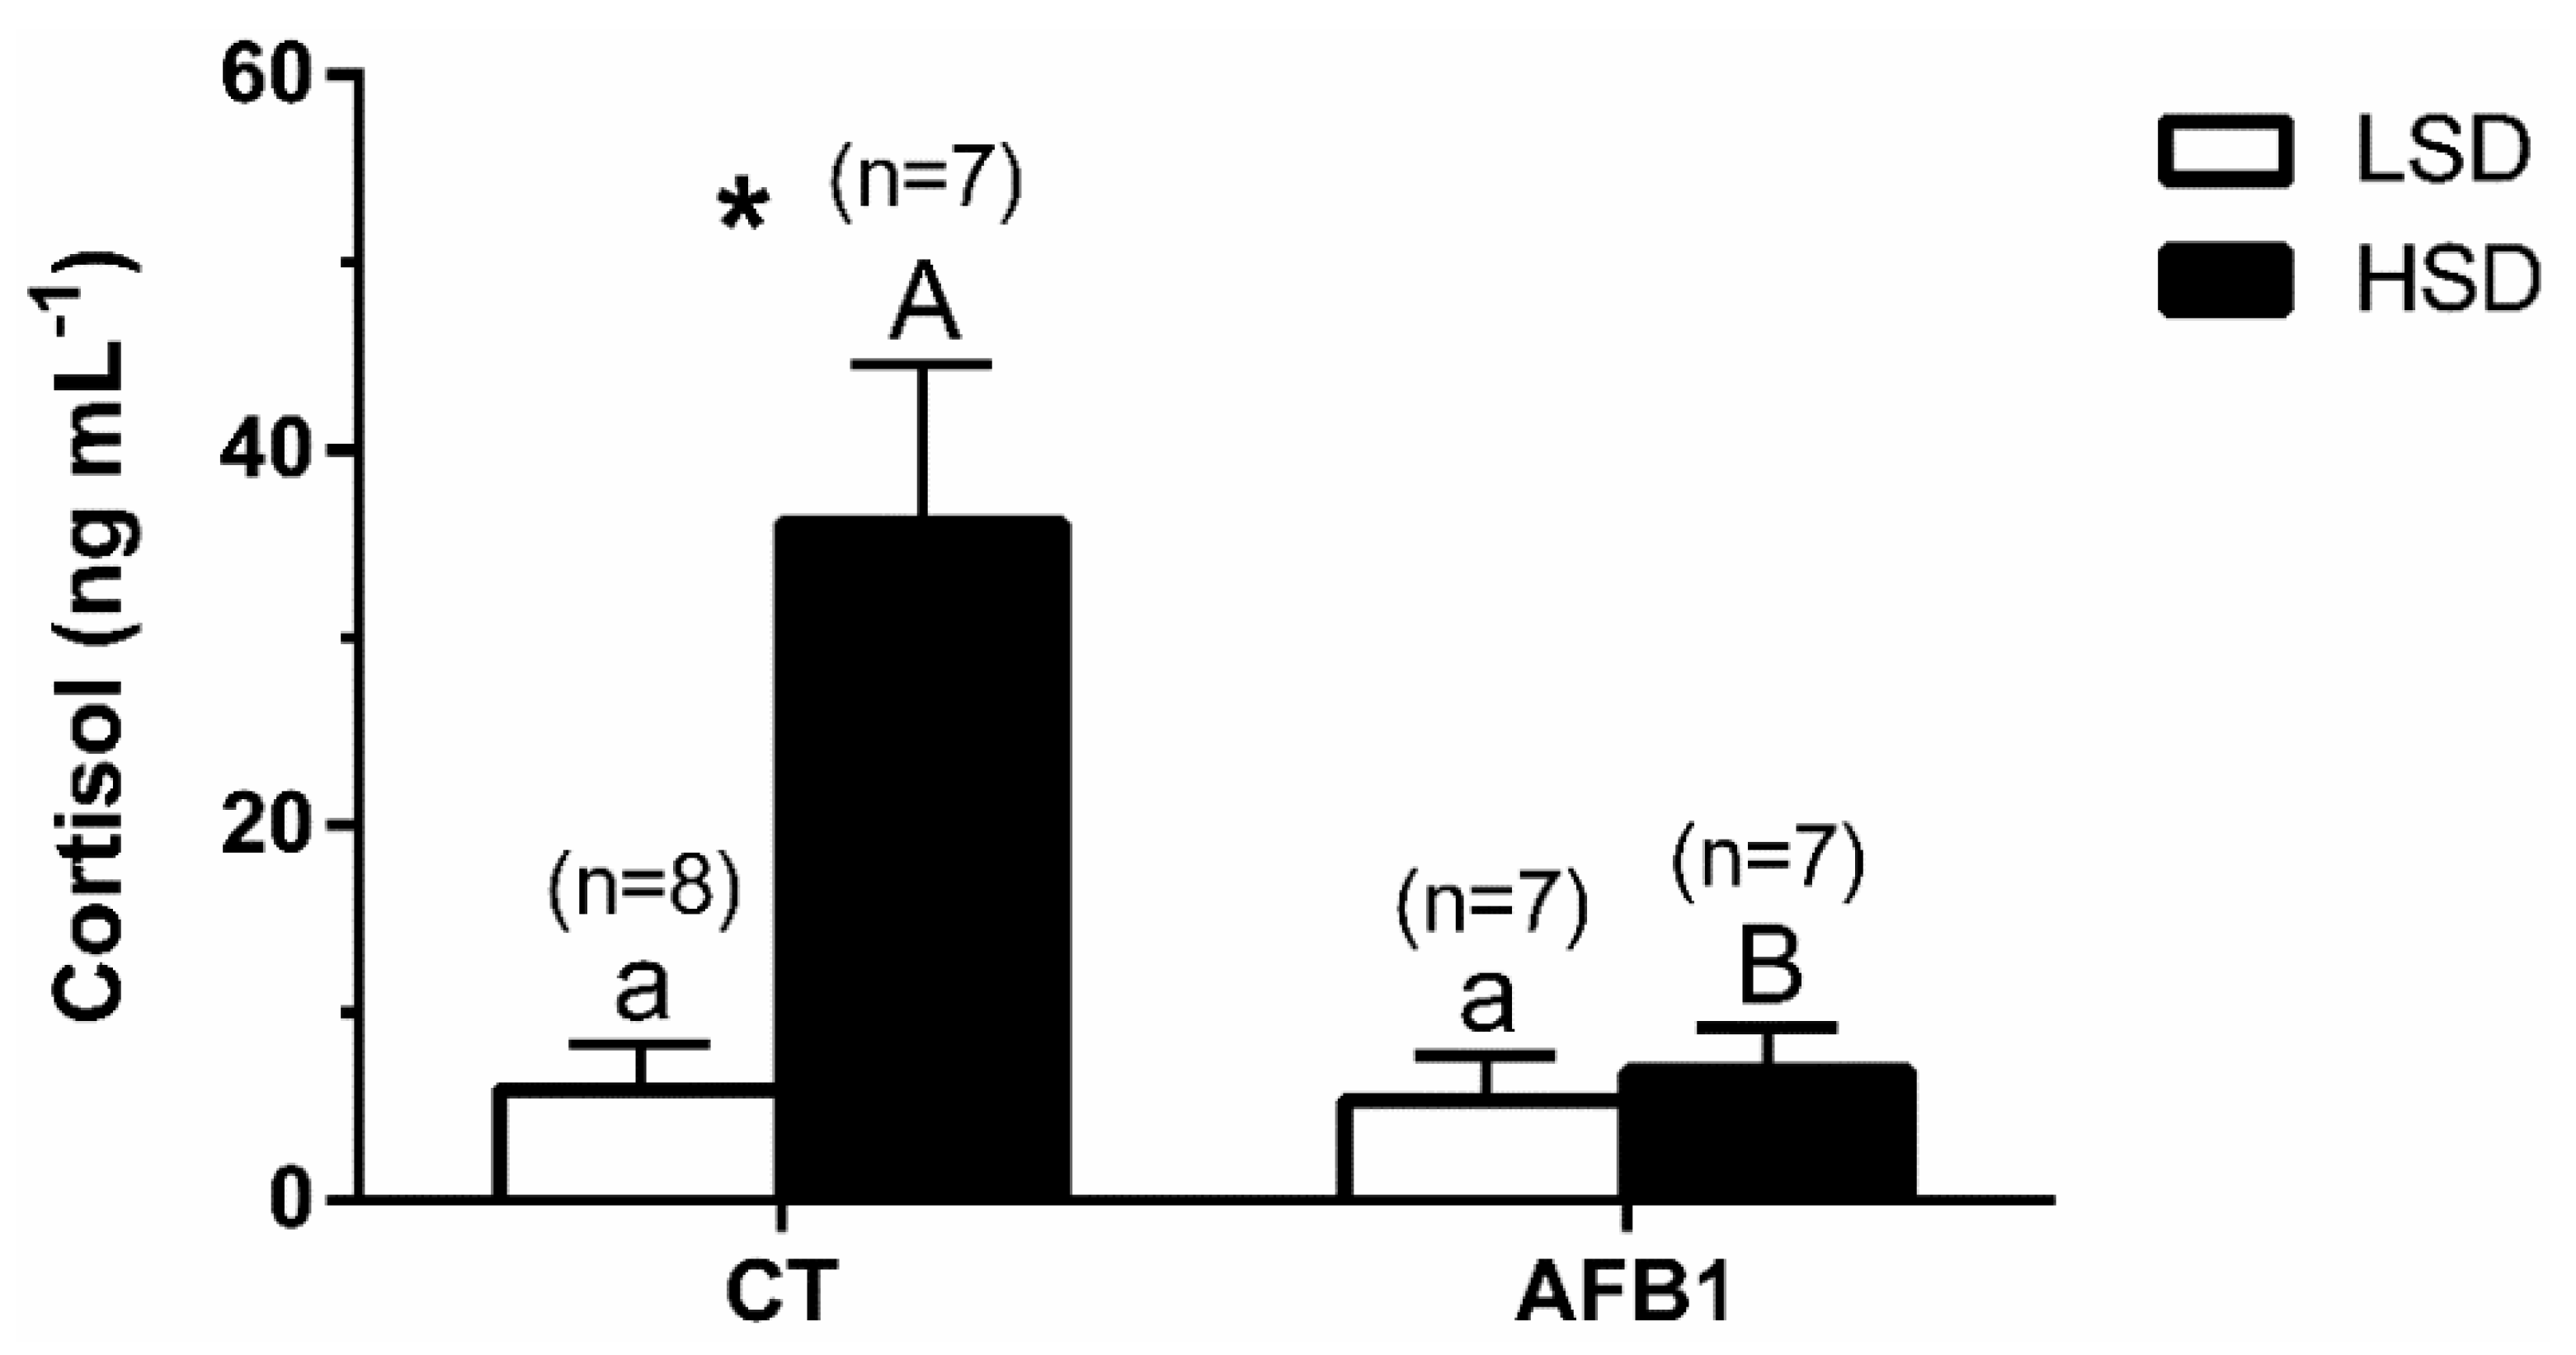
3.2. Plasma
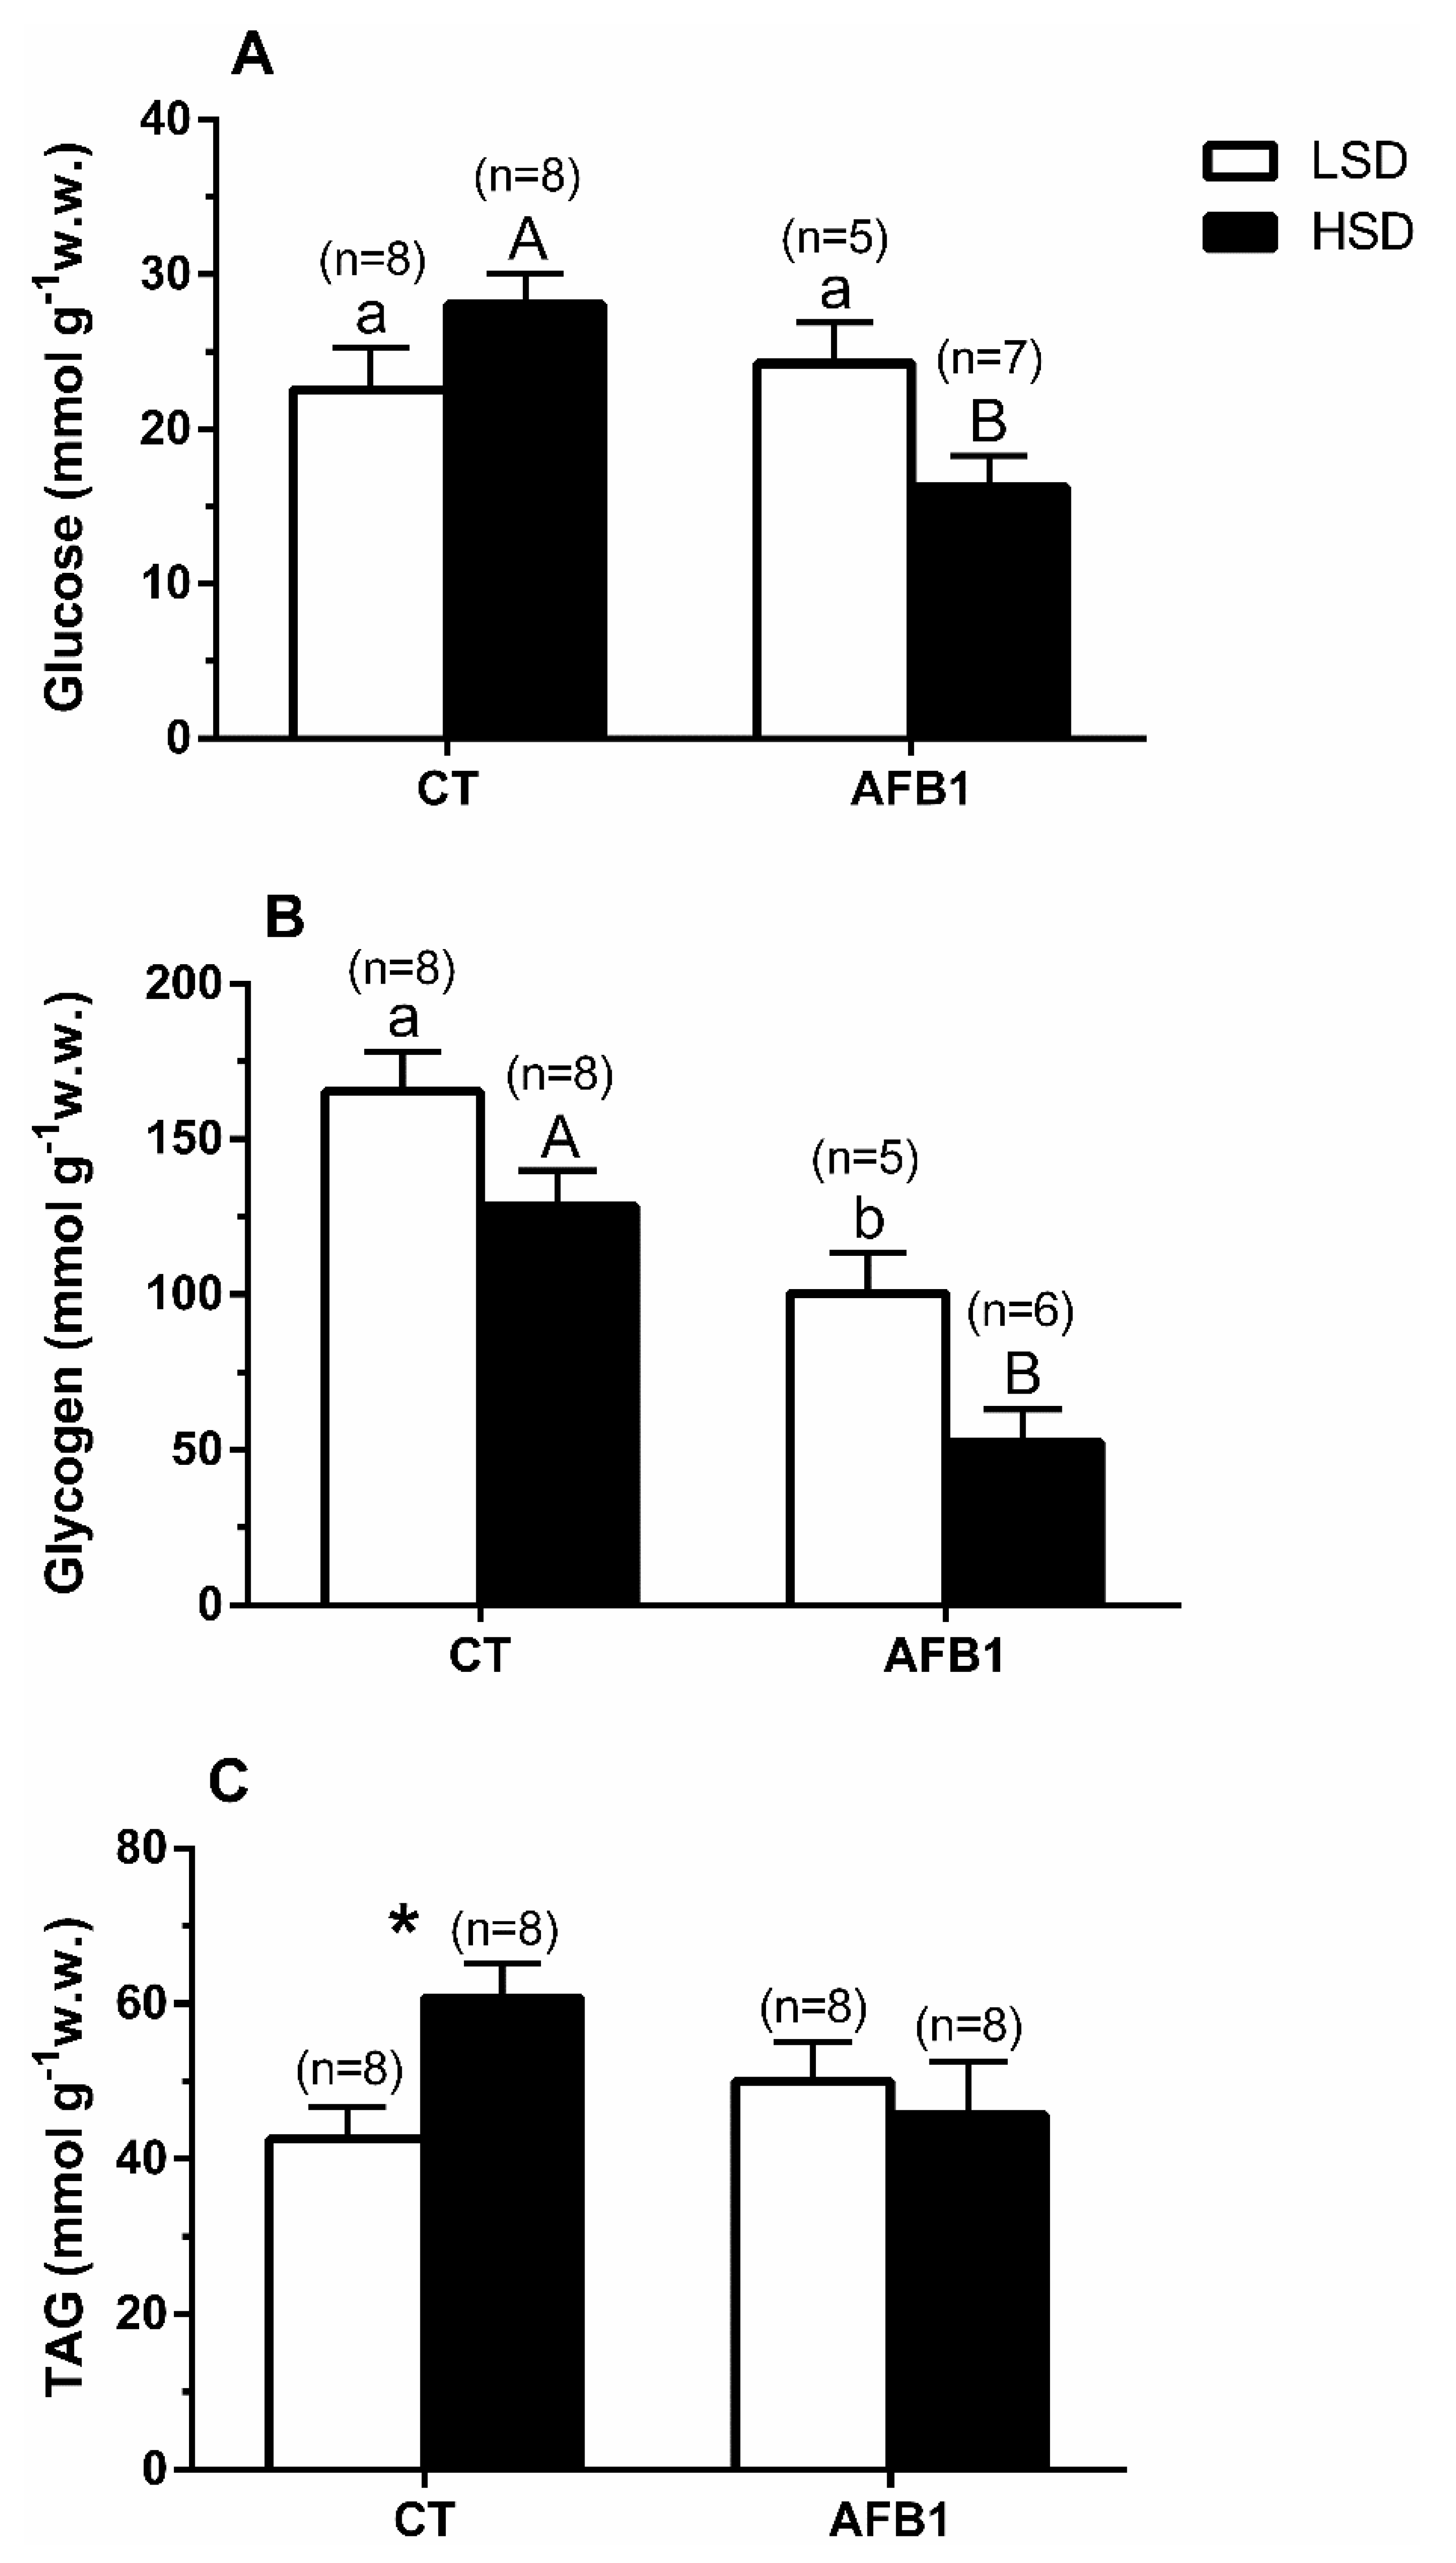
3.3. Liver
3.4. Muscle
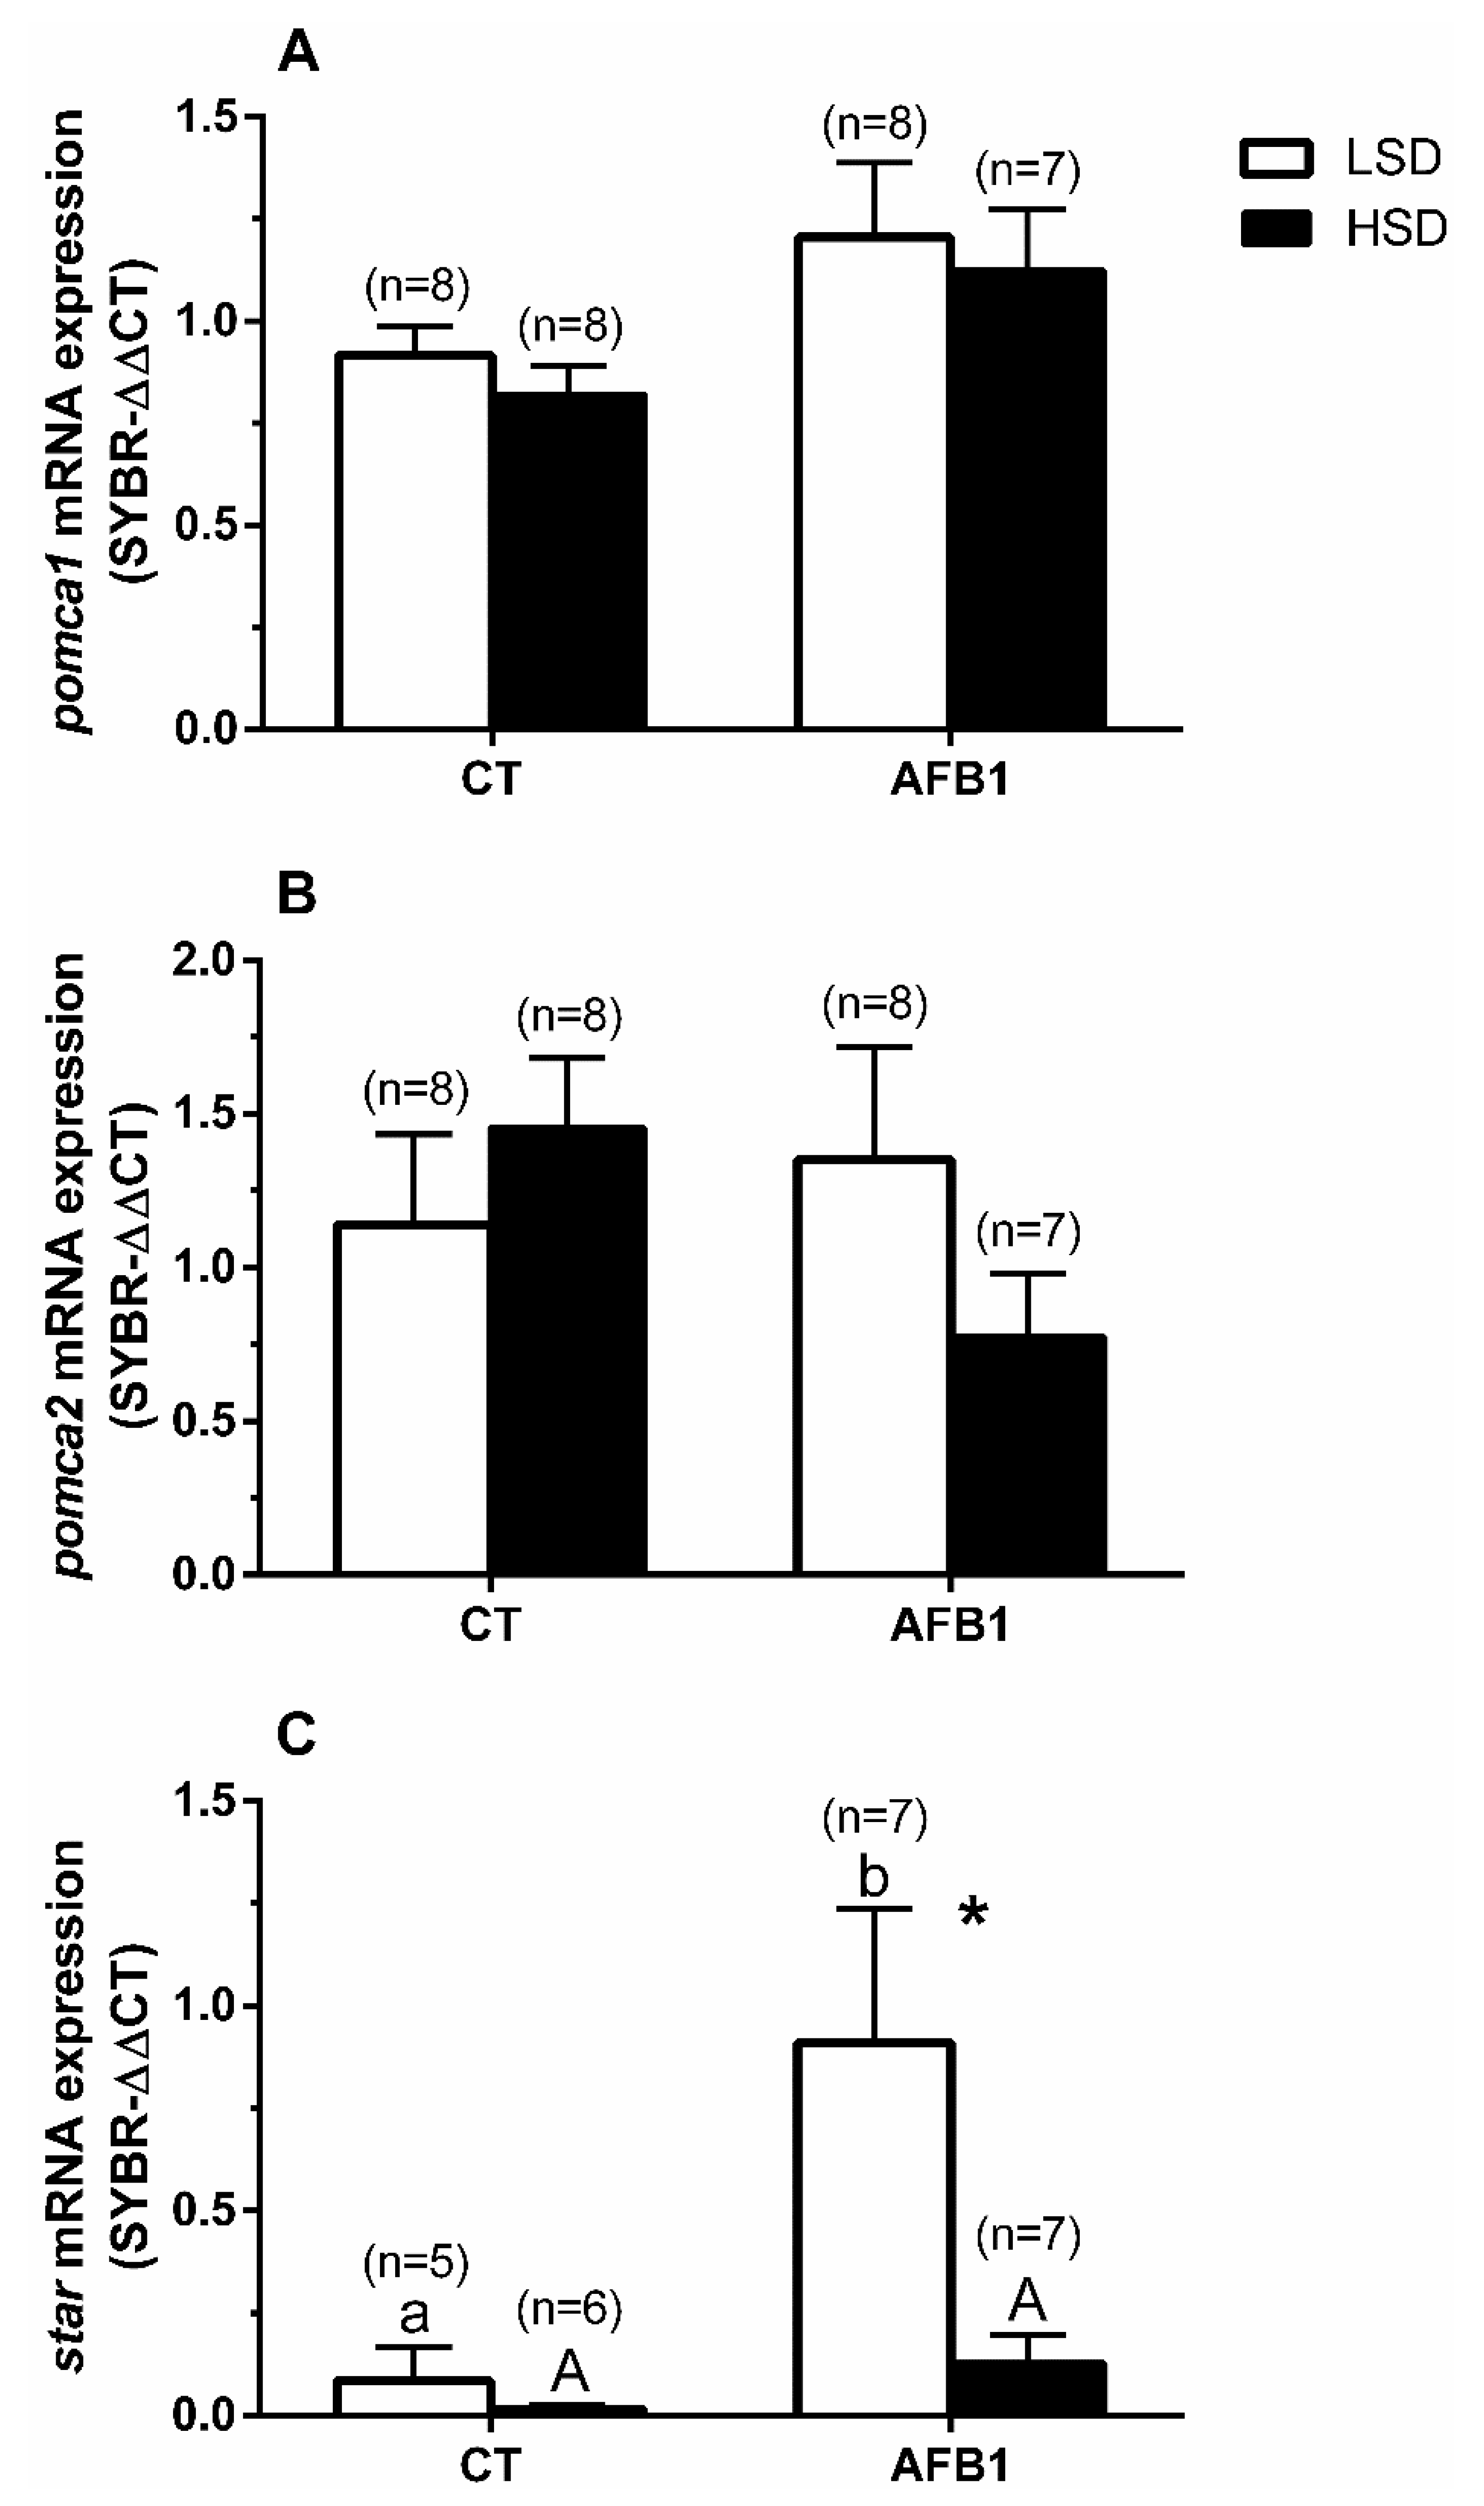
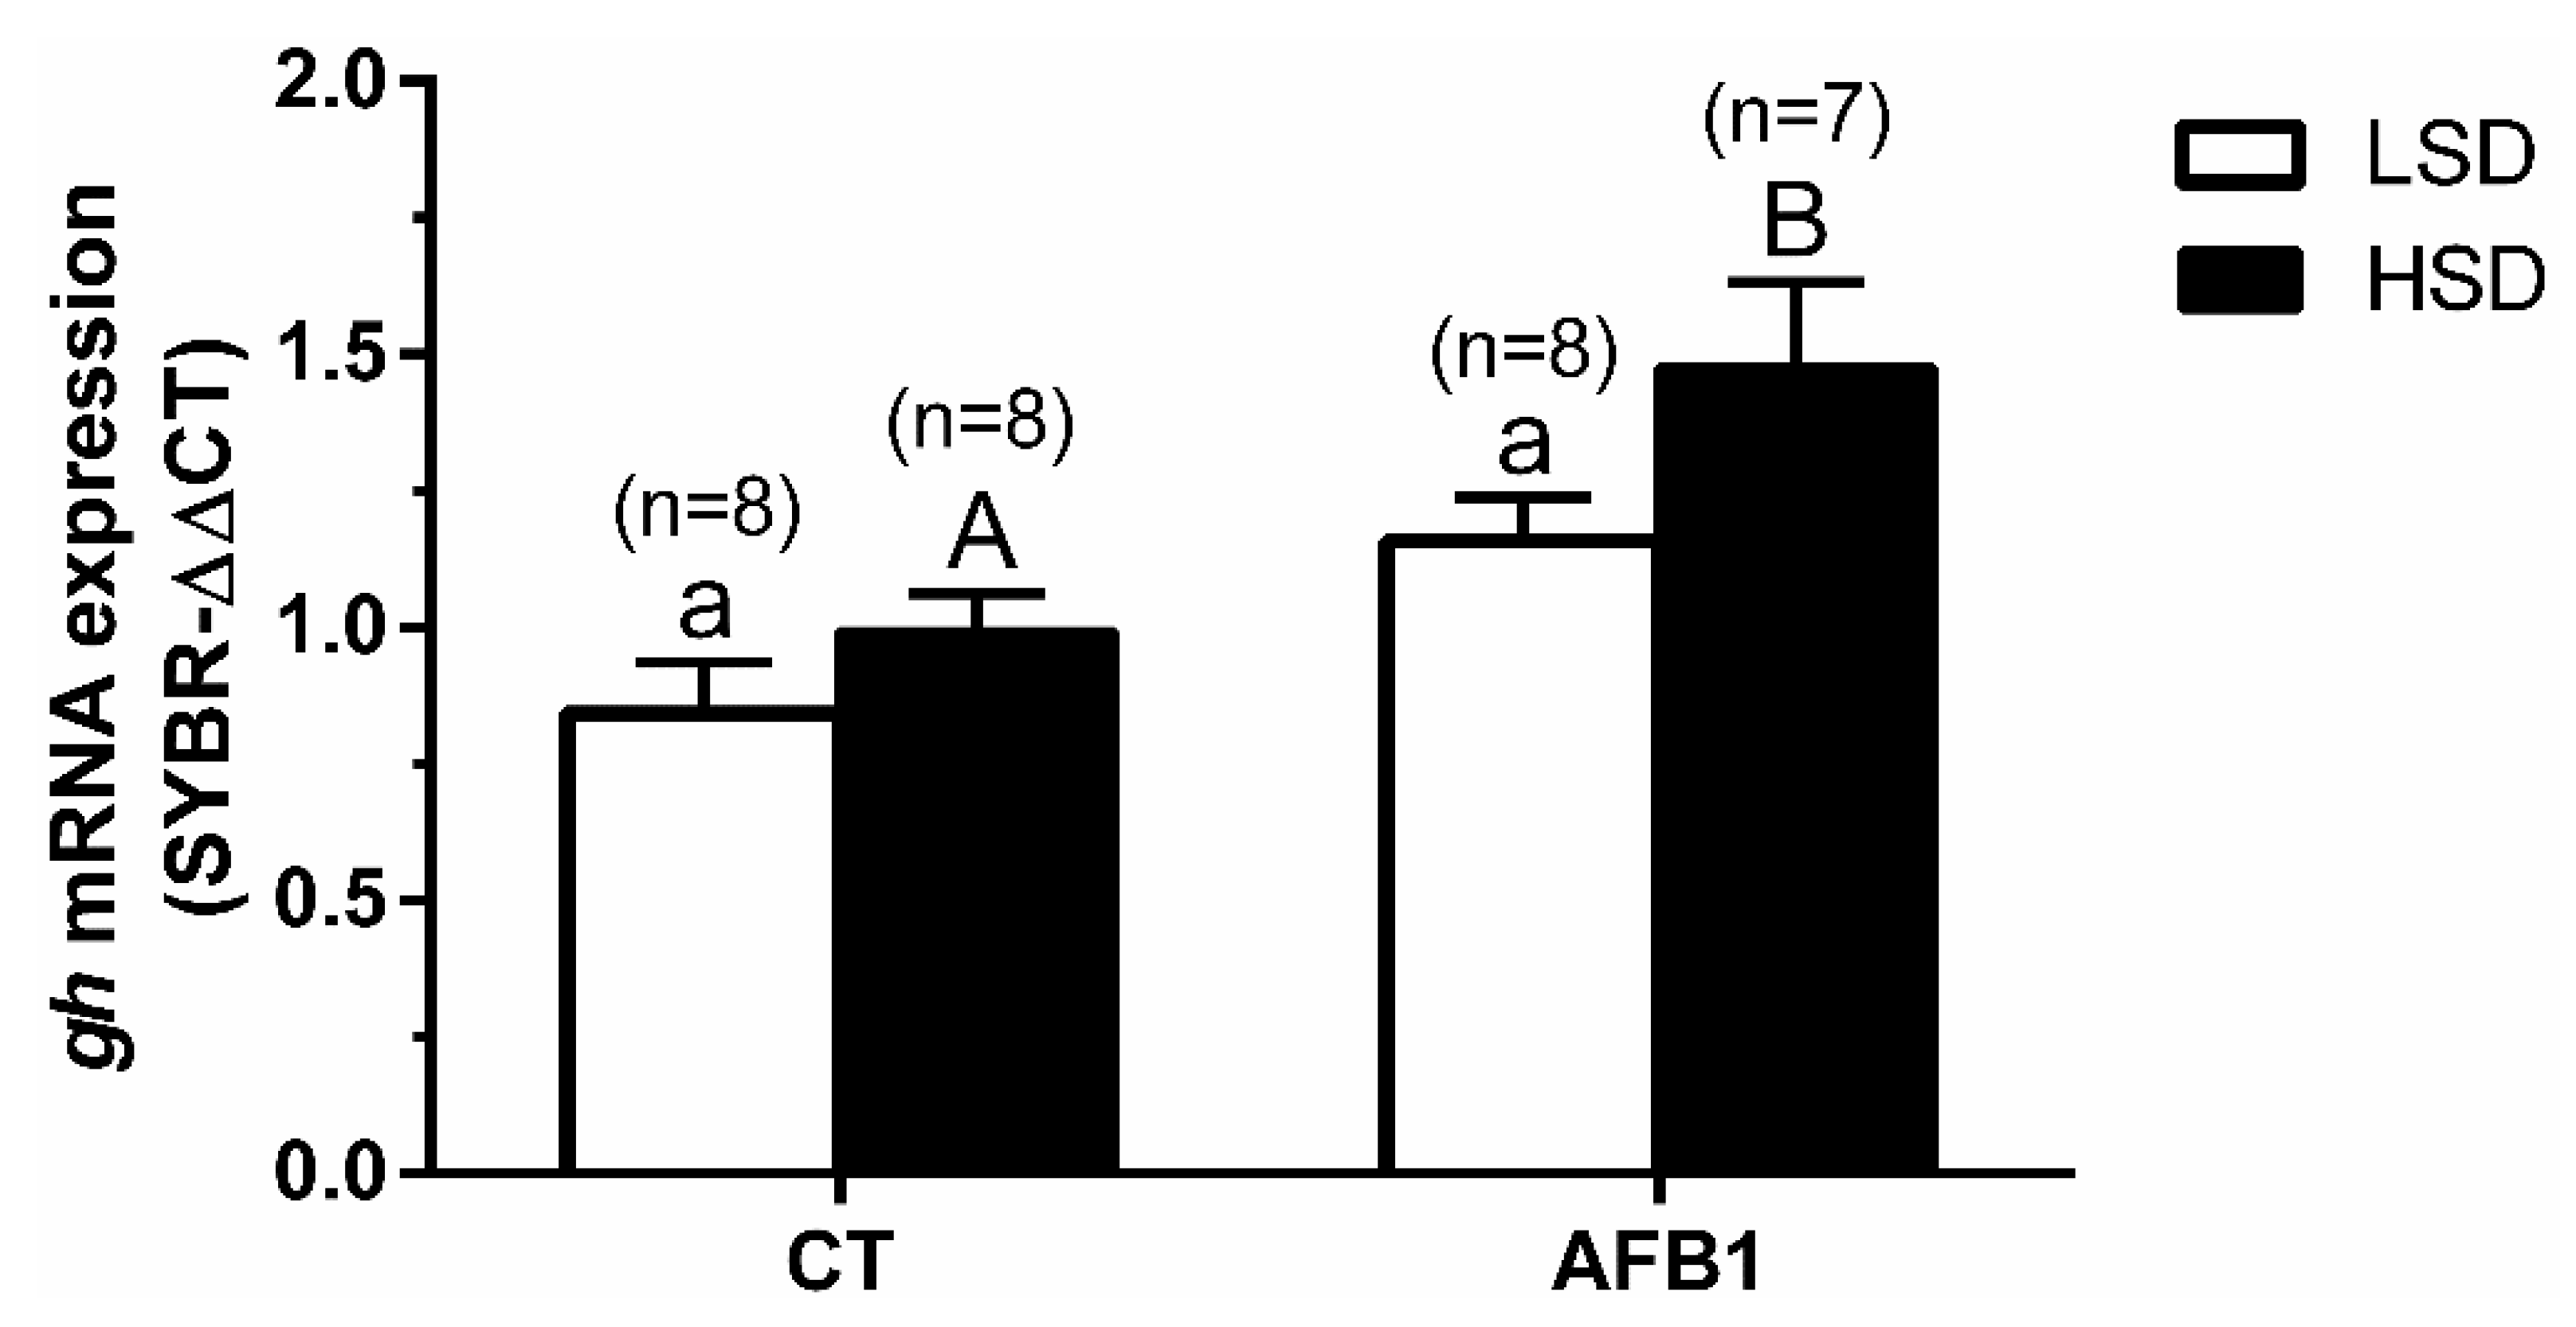
3.5. Quantitative Real-Time PCR Expression
4. Discussion
5. Conclusions
Author Contributions
Funding
Institutional Review Board Statement
Data Availability Statement
Acknowledgments
Conflicts of Interest
References
- Sneddon, L.U.; Wolfenden, D.C.; Thomson, J.S. Stress Management and Welfare; Elsevier BV: Amsterdam, The Netherlands, 2016; Volume 35, pp. 463–539. [Google Scholar]
- Bonga, S.E.W. The Stress Response in Fish. Physiol. Rev. 1997, 77, 591–625. [Google Scholar] [CrossRef]
- Barton, B.A. Stress in Fishes: A Diversity of Responses with Particular Reference to Changes in Circulating Corticosteroids. Integr. Comp. Biol. 2002, 42, 517–525. [Google Scholar] [CrossRef] [PubMed]
- McConnachie, S.H.; Cook, K.V.; Patterson, D.A.; Gilmour, K.M.; Hinch, S.G.; Farrell, A.P.; Cooke, S.J. Consequences of Acute Stress and Cortisol Manipulation on the Physiology, Behavior, and Reproductive Outcome of Female PA-Cific Salmon on Spawning Grounds. Horm. Behav. 2012, 62, 67–76. [Google Scholar] [CrossRef] [PubMed]
- Schreck, C.B.; Tort, L. The Concept of Stress in Fish. In Fish Physiology; Elsevier BV: Amsterdam, The Netherlands, 2016; Volume 35, pp. 1–34. [Google Scholar]
- Doyon, C.; Trudeau, V.; Moon, T.W. Stress Elevates Corticotropin-Releasing Factor (CRF) and CRF-Binding Protein mRNA Levels in Rainbow Trout (Oncorhynchus mykiss). J. Endocrinol. 2005, 186, 123–130. [Google Scholar] [CrossRef] [Green Version]
- Flik, G.; Klaren, P.H.; Burg, E.H.V.D.; Metz, J.R.; Huising, M.O. CRF and Stress in Fish. Gen. Comp. Endocrinol. 2006, 146, 36–44. [Google Scholar] [CrossRef] [Green Version]
- Mancera, J.M.; Vargas-Chacoff, L.; García-López, Á.; Kleszczynska, A.; Kalamarz, H.; Martínez-Rodríguez, G.; Kulczykowska, E. High Density and Food Deprivation Affect Arginine Vasotocin, Isotocin and Melatonin in Gilthead Sea Bream (Sparus auratus). Comp. Biochem. Physiol. Part A Mol. Integr. Physiol. 2008, 149, 92–97. [Google Scholar] [CrossRef]
- Cardoso, J.; Laiz-Carrión, R.; Louro, B.; Silva, N.; Canario, A.; Mancera, J.; Power, D. Divergence of Duplicate POMC Genes in Gilthead Sea Bream Sparus auratus. Gen. Comp. Endocrinol. 2011, 173, 396–404. [Google Scholar] [CrossRef]
- Gorissen, M.; Flik, G. The Endocrinology of the Stress Response in Fish: An Adaptation-Physiological View. In Fish Physiology; Elsevier Inc.: Amsterdam, The Netherlands, 2016; Volume 35, pp. 75–111. [Google Scholar]
- Lamers, A.E.; Ter Brugge, P.J.; Flik, G.; Bonga, S.E.W. Acid Stress Induces a D1-Like Dopamine Receptor in Pituitary MSH Cells of Oreochromis mossambicus. Am. J. Physiol. Content 1997, 273, R387–R392. [Google Scholar] [CrossRef] [PubMed] [Green Version]
- Kobayashi, Y.; Chiba, H.; Yamanome, T.; Schiöth, H.B.; Takahashi, A. Melanocortin Receptor Subtypes in Interrenal Cells and Corticotropic Activity of α-Melanocyte-Stimulating Hormones in Barfin Flounder, Verasper moseri. Gen. Comp. Endocrinol. 2011, 170, 558–568. [Google Scholar] [CrossRef]
- Bergan-Roller, H.E.; Sheridan, M.A. The Growth Hormone Signaling System: Insights into Coordinating the Anabolic and Catabolic Actions of Growth Hormone. Gen. Comp. Endocrinol. 2018, 258, 119–133. [Google Scholar] [CrossRef]
- Björnsson, B. The Biology of Salmon Growth Hormone: From Daylight to Dominance. Fish Physiol. Biochem. 1997, 17, 9–24. [Google Scholar] [CrossRef]
- Pérez-Sánchez, J.; Le Bail, P.-Y. Growth Hormone Axis as Marker of Nutritional Status and Growth Performance in Fish. Aquaculture 1999, 177, 117–128. [Google Scholar] [CrossRef]
- Pickering, A.; Pottinger, T.; Sumpter, J.; Carragher, J.; Le Bail, P. Effects of Acute and Chronic Stress on the Levels of Circulating Growth Hormone in the Rainbow Trout, Oncorhynchus mykiss. Gen. Comp. Endocrinol. 1991, 83, 86–93. [Google Scholar] [CrossRef] [Green Version]
- Laiz-Carrión, R.; Fuentes, J.; Redruello, B.; Guzmán, J.M.; Del Río, M.P.M.; Power, D.; Mancera, J.M. Expression of Pituitary Prolactin, Growth Hormone and Somatolactin Is Modified in Response to Different Stressors (Salinity, Crowding and Food-Deprivation) in Gilthead Sea Bream Sparus auratus. Gen. Comp. Endocrinol. 2009, 162, 293–300. [Google Scholar] [CrossRef]
- Bernier, N.J.; Flik, G.; Klaren, P.H. Chapter 6 Regulation And Contribution Of The Corticotropic, Melanotropic And Thyrotropic Axes To The Stress Response In Fishes. Fish Physiol. 2009, 28, 235–311. [Google Scholar] [CrossRef]
- Barton, A.B.; Ribas, L.; Acerete, L.; Tort, L. Effects of Chronic Confinement on Physiological Responses of Juvenile Gilthead Sea Bream, Sparus aurata L., to Acute Handling. Aquac. Res. 2005, 36, 172–179. [Google Scholar] [CrossRef]
- Korte, S.M.; Olivier, B.; Koolhaas, J.M. A New Animal Welfare Concept Based on Allostasis. Physiol. Behav. 2007, 92, 422–428. [Google Scholar] [CrossRef] [Green Version]
- Koolhaas, J.; Bartolomucci, A.; Buwalda, B.; De Boer, S.; Flügge, G.; Korte, S.; Meerlo, P.; Murison, R.; Olivier, B.; Palanza, P.; et al. Stress Revisited: A Critical Evaluation of the Stress Concept. Neurosci. Biobehav. Rev. 2011, 35, 1291–1301. [Google Scholar] [CrossRef]
- Faught, E.; Vijayan, M.M. Mechanisms of Cortisol Action in Fish Hepatocytes. Comp. Biochem. Physiol. Part B Biochem. Mol. Biol. 2016, 199, 136–145. [Google Scholar] [CrossRef]
- Stachowicz, M.; Lebiedzińska, A. The Effect of Diet Components on the Level of Cortisol. Eur. Food Res. Technol. 2016, 242, 2001–2009. [Google Scholar] [CrossRef] [Green Version]
- Skrzynska, A.K.; Maiorano, E.; Bastaroli, M.; Naderi, F.; Míguez, J.M.; Martínez-Rodríguez, G.; Mancera, J.M.; Martos-Sitcha, J.A. Impact of Air Exposure on Vasotocinergic and Isotocinergic Systems in Gilthead Sea Bream (Sparus aurata): New Insights on Fish Stress Response. Front. Physiol. 2018, 9, 96. [Google Scholar] [CrossRef] [Green Version]
- Varela, J.; Ruiz-Jarabo, I.; Vargas-Chacoff, L.; Arijo, S.; León-Rubio, J.; García-Millán, I.; Del Río, M.M.; Moriñigo, M.; Mancera, J. Dietary Administration of Probiotic Pdp11 Promotes Growth and Improves Stress Tolerance to High Stocking Density in Gilthead Seabream Sparus auratus. Aquaculture 2010, 309, 265–271. [Google Scholar] [CrossRef]
- Arends, R.J.; Mancera, J.M.; Munoz, J.L.; Bonga, S.E.W.; Flik, G. The Stress Response of the Gilthead Sea Bream (Sparus aurata L.) to Air Exposure and Confinement. J. Endocrinol. 1999, 163, 149–157. [Google Scholar] [CrossRef]
- Tacon, A.G.; Metian, M. Global Overview on the Use of Fish Meal and Fish Oil in Industrially Compounded Aquafeeds: Trends and Future Prospects. Aquaculture 2008, 285, 146–158. [Google Scholar] [CrossRef]
- Nasopoulou, C.; Zabetakis, I. Benefits of Fish Oil Replacement by Plant Originated Oils in Compounded Fish Feeds. A Review. LWT 2012, 47, 217–224. [Google Scholar] [CrossRef]
- Kousoulaki, K.; Saether, B.-S.; Albrektsen, S.; Noble, C.; Sæther, B. Review on European Sea Bass (Dicentrarchus labrax,Linnaeus, 1758) Nutrition and Feed Management: A Practical Guide for Optimizing Feed Formulation and Farming Protocols. Aquac. Nutr. 2015, 21, 129–151. [Google Scholar] [CrossRef]
- Pérez-Sánchez, J.; Simó-Mirabet, P.; Naya-Català, F.; Martos-Sitcha, J.A.; Perera, E.; Bermejo-Nogales, A.; Benedito-Palos, L.; Calduch-Giner, J.A. Somatotropic Axis Regulation Unravels the Differential Effects of Nutritional and Environmental Factors in Growth Performance of Marine Farmed Fishes. Front. Endocrinol. 2018, 9, 687. [Google Scholar] [CrossRef] [PubMed]
- Tacon, A.G.J.; Hasan, M.R.; Metian, M. Demand and Supply of Feed Ingredients for Farmed Fish and Crusta-Ceans: Trends and Prospects. In FAO Fisheries and Aquaculture Technical Papers; United Nations Food and Agriculture Organization: Rome, Italy, 2011; Volume 564, ISBN 9789251069332. [Google Scholar]
- Gonçalves, R.A.; Schatzmayr, D.; Albalat, A.; MacKenzie, S. Mycotoxins in Aquaculture: Feed and Food. Rev. Aquac. 2018, 12, 145–175. [Google Scholar] [CrossRef]
- Souza, C.D.F.; Baldissera, M.D.; Baldisserotto, B.; Petrolli, T.G.; Da Glória, E.M.; Zanette, R.A.; Da Silva, A.S. Dietary Vegetable Choline Improves Hepatic Health of Nile tilapia (Oreochromis niloticus) Fed Aflatoxin-Contaminated Diet. Comp. Biochem. Physiol. Part C: Toxicol. Pharmacol. 2020, 227, 108614. [Google Scholar] [CrossRef]
- Ma, R.; Zhang, L.; Liu, M.; Su, Y.-T.; Xie, W.-M.; Zhang, N.-Y.; Dai, J.-F.; Wang, Y.; Rajput, S.A.; Qi, D.-S.; et al. Individual and Combined Occurrence of Mycotoxins in Feed Ingredients and Complete Feeds in China. Toxins 2018, 10, 113. [Google Scholar] [CrossRef] [Green Version]
- Nogueira, W.V.; De Oliveira, F.K.; Sibaja, K.V.M.; Garcia, S.D.O.; Kupski, L.; De Souza, M.M.; Tesser, M.B.; Garda-Buffon, J. Occurrence and Bioacessibility of Mycotoxins in Fish Feed. Food Addit. Contam. Part B 2020, 13, 244–251. [Google Scholar] [CrossRef] [PubMed]
- Marijani, E.; Kigadye, E.; Okoth, S. Occurrence of Fungi and Mycotoxins in Fish Feeds and Their Impact on Fish Health. Int. J. Microbiol. 2019, 2019, 1–17. [Google Scholar] [CrossRef] [Green Version]
- Mwihia, E.W.; Lyche, J.L.; Mbuthia, P.G.; Ivanova, L.; Uhlig, S.; Gathumbi, J.K.; Maina, J.G.; Eshitera, E.E.; Eriksen, G.S. Co-Occurrence and Levels of Mycotoxins in Fish Feeds in Kenya. Toxins 2020, 12, 627. [Google Scholar] [CrossRef]
- Zhang, X.; Kuča, K.; Dohnal, V.; Dohnalová, L.; Wu, Q.; Wu, C. Military Potential of Biological Toxins. J. Appl. Biomed. 2014, 12, 63–77. [Google Scholar] [CrossRef]
- Nácher-Mestre, J.; Ballester-Lozano, G.F.; Garlito, B.; Portolés, T.; Calduch-Giner, J.; Serrano, R.; Hernández, F.; Berntssen, M.H.; Pérez-Sánchez, J. Comprehensive Overview of Feed-to-Fillet Transfer of New and Traditional Contaminants in Atlantic Salmon and Gilthead Sea Bream Fed Plant-Based Diets. Aquac. Nutr. 2018, 24, 1782–1795. [Google Scholar] [CrossRef]
- Battilani, P.; Toscano, P.; Van Der Fels-Klerx, H.J.; Moretti, A.; Leggieri, M.C.; Brera, C.; Rortais, A.; Goumperis, T.; Robinson, T. Aflatoxin B1 Contamination in Maize in Europe Increases Due to Climate Change. Sci. Rep. 2016, 6, 24328. [Google Scholar] [CrossRef] [Green Version]
- International Agency for Research on Cancer. Monograph on the Evaluation of Carcinogenic Risks to Humans. Chemical Agents and Related Occupations. a Review of Human Carcinogens. Aflatoxins; International Agency for Research on Cancer (IARC): Lyon, France, 2012; ISBN 978-9283213239. ISBN 978-9283201380. [Google Scholar]
- Flores-Flores, M.E.; Lizarraga, E.; de Cerain, A.L.; González-Peñas, E. Presence of Mycotoxins in Animal Milk: A Review. Food Control. 2015, 53, 163–176. [Google Scholar] [CrossRef]
- Zhang, N.-Y.; Qi, M.; Zhao, L.; Zhu, M.-K.; Guo, J.; Liu, J.; Gu, C.-Q.; Rajput, S.A.; Krumm, C.S.; Qi, D.-S.; et al. Curcumin Prevents Aflatoxin B1 Hepatoxicity by Inhibition of Cytochrome P450 Isozymes in Chick Liver. Toxins 2016, 8, 327. [Google Scholar] [CrossRef] [PubMed] [Green Version]
- Mwihia, E.W.; Mbuthia, P.G.; Eriksen, G.S.; Gathumbi, J.K.; Maina, J.G.; Mutoloki, S.; Waruiru, R.M.; Mulei, I.R.; Lyche, J.L. Occurrence and Levels of Aflatoxins in Fish Feeds and Their Potential Effects on Fish in Nyeri, Kenya. Toxins 2018, 10, 543. [Google Scholar] [CrossRef] [PubMed] [Green Version]
- Clerkin, J.; Naughton, R.; Quiney, C.; Cotter, T. Mechanisms of ROS Modulated Cell Survival during Carcinogenesis. Cancer Lett. 2008, 266, 30–36. [Google Scholar] [CrossRef]
- Souto, N.S.; Braga, A.C.M.; De Freitas, M.L.; Fighera, M.R.; Royes, L.F.F.; Oliveira, M.S.; Furian, A.F. Aflatoxin B1 Reduces Non-enzymatic Antioxidant Defenses and Increases Protein Kinase C Activation in the Cerebral Cortex of Young Rats. Nutr. Neurosci. 2017, 21, 268–275. [Google Scholar] [CrossRef]
- Stenske, K.A.; Smith, J.R.; Newman, S.J.; Newman, L.B.; Kirk, C.A. Aflatoxicosis in Dogs and Dealing with Suspected Contaminated Commercial Foods. J. Am. Veter. Med Assoc. 2006, 228, 1686–1691. [Google Scholar] [CrossRef] [Green Version]
- Probst, C.; Njapau, H.; Cotty, P.J. Outbreak of an Acute Aflatoxicosis in Kenya in 2004: Identification of the Causal Agent. Appl. Environ. Microbiol. 2007, 73, 2762–2764. [Google Scholar] [CrossRef] [PubMed] [Green Version]
- Alinezhad, S.; Faridi, M.; Falahatkar, B.; Nabizadeh, R.; Davoodi, D. Effects of Nanostructured Zeolite and Aflatoxin b1 in Growth Performance, Immune Parameters and Pathological Conditions of Rainbow Trout Oncorhynchus mykiss. Fish Shellfish. Immunol. 2017, 70, 648–655. [Google Scholar] [CrossRef] [PubMed]
- Barany, A.; Guilloto, M.; Cosano, J.; De Boevre, M.; Oliva, M.; De Saeger, S.; Fuentes, J.; Martínez-Rodriguez, G.; Mancera, J. Dietary Aflatoxin B1 (AFB1) Reduces Growth Performance, Impacting Growth Axis, Metabolism, and Tissue Integrity in Juvenile Gilthead Sea Bream (Sparus aurata). Aquaculture 2021, 533, 736189. [Google Scholar] [CrossRef]
- Wang, Y.; Wang, B.; Liu, M.; Jiang, K.; Wang, M.; Wang, L. Aflatoxin B1 (AFB1) Induced Dysregulation of Intestinal Microbiota and Damage of Antioxidant System in Pacific White Shrimp (Litopenaeus vannamei). Aquaculture 2018, 495, 940–947. [Google Scholar] [CrossRef]
- Santacroce, M.P.; Conversano, M.C.; Casalino, E.; Lai, O.; Zizzadoro, C.; Centoducati, G.; Crescenzo, G. Aflatoxins in Aquatic Species: Metabolism, Toxicity and Perspectives. Rev. Fish Biol. Fish. 2007, 18, 99–130. [Google Scholar] [CrossRef]
- Deng, S.-X.; Tian, L.-X.; Liu, F.-J.; Jin, S.-J.; Liang, G.-Y.; Yang, H.-J.; Du, Z.-Y.; Liu, Y.-J. Toxic Effects and Residue of Aflatoxin B1 in Tilapia (Oreochromis niloticus×o. aureus) during Long-Term Dietary Exposure. Aquaculture 2010, 307, 233–240. [Google Scholar] [CrossRef]
- Deng, J.; Zhao, L.; Zhang, N.-Y.; Karrow, N.A.; Krumm, C.S.; Qi, D.-S.; Sun, L.-H. Aflatoxin B1 Metabolism: Regulation by Phase I and II Metabolizing Enzymes and Chemoprotective Agents. Mutat. Res. Mutat. Res. 2018, 778, 79–89. [Google Scholar] [CrossRef]
- Mahato, D.K.; Lee, K.E.; Kamle, M.; Devi, S.; Dewangan, K.N.; Kumar, P.; Kang, S.G. Aflatoxins in Food and Feed: An Overview on Prevalence, Detection and Control Strategies. Front. Microbiol. 2019, 10, 2266. [Google Scholar] [CrossRef] [PubMed]
- Jobling, M.M.A.; Pavlidis, C.C. Mylonas sparidae: Biology and Aquaculture of Gilthead Sea Bream and Other Species. Aquac. Int. 2011, 19, 809–810. [Google Scholar] [CrossRef] [Green Version]
- Colloca, F.; Cerasi, S.; FAO Fisheries Division. Cultured Aquatic Species Information Programme. Sparus aurata. Available online: http://www.fao.org/fishery/culturedspecies/Sparus_aurata/en (accessed on 15 February 2021).
- Sangiao-Alvarellos, S.; Guzmán, J.M.; Laiz-Carrión, R.; Míguez, J.M.; Del Río, M.P.M.; Mancera, J.M.; Soengas, J.L. Interactive Effects of High Stocking Density and Food Deprivation on Carbohydrate Metabolism in Several Tissues of Gilthead Sea Breamsparus auratus. J. Exp. Zool. Part A Comp. Exp. Biol. 2005, 303, 761–775. [Google Scholar] [CrossRef]
- Montero, D.; Izquierdo, M.; Tort, L.; Robaina, L.; Vergara, J. High Stocking Density Produces Crowding Stress Altering Some Physiological and Biochemical Parameters in Gilthead Seabream, Sparus aurata, Juveniles. Fish Physiol. Biochem. 1999, 20, 53–60. [Google Scholar] [CrossRef]
- Martos-Sitcha, J.A.; Mancera, J.M.; Calduch-Giner, J.A.; Yúfera, M.; Martínez-Rodríguez, G.; Pérez-Sánchez, J. Unraveling the Tissue-Specific Gene Signatures of Gilthead Sea Bream (Sparus aurata L.) after Hyper-and Hypo-Osmotic Challenges. PLoS ONE 2016, 11, e0148113. [Google Scholar] [CrossRef] [Green Version]
- Keppler, D.; Decker, K. Glycogen. Determination with Amyloglucosidase. Methods Enzym. Anal. 1974, 3, 1127–1131. [Google Scholar]
- Mata-Sotres, J.A.; Martos-Sitcha, J.A.; Astola, A.; Yúfera, M.; Martínez-Rodríguez, G. Cloning and Molecular Ontogeny of Digestive Enzymes in Fed and Food-Deprived Developing Gilthead Seabream (Sparus aurata) larvae. Comp. Biochem. Physiol. Part B Biochem. Mol. Biol. 2016, 191, 53–65. [Google Scholar] [CrossRef] [PubMed]
- Livak, K.J.; Schmittgen, T.D. Analysis of Relative Gene Expression Data Using Real-Time Quantitative PCR and the 2−ΔΔCT Method. Methods 2001, 25, 402–408. [Google Scholar] [CrossRef] [PubMed]
- Pfaffl, M.W. A New Mathematical Model for Relative Quantification in Real-Time RT-PCR. Nucleic Acids Res. 2001, 29, e45. [Google Scholar] [CrossRef] [PubMed]
- Vandesompele, J.; De Preter, K.; Pattyn, F.; Poppe, B.; Van Roy, N.; De Paepe, A.; Speleman, F. Accurate Normalization of Real-Time Quantitative RT-PCR Data by Geometric Averaging of Multiple Internal Control Genes. Genome Biol. 2002, 3, 1–12. [Google Scholar] [CrossRef] [PubMed] [Green Version]
- Sangiao-Alvarellos, S.; Arjona, F.J.; Del Río, M.P.M.; Míguez, J.M.; Mancera, J.M.; Soengas, J.L. Time Course of Osmoregulatory and Metabolic Changes during Osmotic Acclimation in Sparus auratus. J. Exp. Biol. 2005, 208, 4291–4304. [Google Scholar] [CrossRef] [PubMed] [Green Version]
- Cádiz, L.; Román-Padilla, J.; Gozdowska, M.; Kulczykowska, E.; Martínez-Rodríguez, G.; Mancera, J.M.; Martos-Sitcha, J.A. Cortisol Modulates Vasotocinergic and Isotocinergic Pathways in the Gilthead Sea Bream. J. Exp. Biol. 2014, 218, 316–325. [Google Scholar] [CrossRef] [PubMed] [Green Version]
- Cowey, C.B.; Walton, M. Intermediary Metabolism. In Fish Nutrition; Halver, J.E., Ed.; Academic Press: New York, NY, USA, 1989; pp. 259–329. [Google Scholar]
- Hu, J.; Zhang, Z.; Shen, W.-J.; Azhar, S. Cellular Cholesterol Delivery, Intracellular Processing and Utilization for Biosynthesis of Steroid Hormones. Nutr. Metab. 2010, 7, 47. [Google Scholar] [CrossRef] [PubMed] [Green Version]
- Wood, B.Y.C.M. Acid-Base and Ion Balance, Metabolism, and Their Interactions, after Exhaustive Exercise in Fish. J. Exp. Biol. 1991, 160, 285–308. [Google Scholar]
- Zhang, J.; Zheng, N.; Liu, J.; Li, F.; Li, S.; Wang, J. Aflatoxin B1 and Aflatoxin M1 Induced Cytotoxicity and DNA Damage in Differentiated and Undifferentiated Caco-2 Cells. Food Chem. Toxicol. 2015, 83, 54–60. [Google Scholar] [CrossRef]
- Geslin, M.; Auperin, B. Relationship Between Changes in mRNAs of The Genes Encoding Steroidogenic Acute Regulatory Protein and P450 Cholesterol Side Chain Cleavage in Head Kidney and Plasma Levels of Cortisol in Response to Different Kinds of Acute Stress in the Rainbow Trout (Oncorhynchus mykiss). Gen. Comp. Endocrinol. 2004, 135, 70–80. [Google Scholar] [CrossRef]
- Gjerstad, J.K.; Lightman, S.L.; Spiga, F. Role of Glucocorticoid Negative Feedback in the Regulation of HPA Axis Pulsatility. Stress 2018, 21, 403–416. [Google Scholar] [CrossRef] [Green Version]
- Takemura, H.; Shim, J.-Y.; Sayama, K.; Tsubura, A.; Zhu, B.T.; Shimoi, K. Characterization of the Estrogenic Activities of Zearalenone and Zeranol in Vivo and in Vitro. J. Steroid Biochem. Mol. Biol. 2007, 103, 170–177. [Google Scholar] [CrossRef]
- Wu, L.; Liao, P.; He, L.; Ren, W.; Yin, J.; Duan, J.; Li, T. Growth Performance, Serum Biochemical Profile, Jejunal Morphology, and the Expression of Nutrients Transporter Genes in Deoxynivalenol (DON)-Challenged Growing Pigs. BMC Vet. Res. 2015, 11, 1–10. [Google Scholar] [CrossRef] [Green Version]
- Pottinger, T.G. Interactions of Endocrine-Disrupting Chemicals with Stress Responses in Wildlife. Pure Appl. Chem. 2003, 75, 2321–2333. [Google Scholar] [CrossRef]
- Saaristo, M.; Brodin, T.; Balshine, S.; Bertram, M.G.; Brooks, B.W.; Ehlman, S.M.; McCallum, E.S.; Sih, A.; Sundin, J.; Wong, B.B.M.; et al. Direct and Indirect Effects of Chemical Contaminants on the Behaviour, Ecology and Evolution of Wildlife. Proc. R. Soc. B Boil. Sci. 2018, 285, 20181297. [Google Scholar] [CrossRef] [PubMed]
- Matthiessen, P.; Wheeler, J.R.; Weltje, L. A Review of the Evidence for Endocrine Disrupting Effects of Current-Use Chemicals on Wildlife Populations. Crit. Rev. Toxicol. 2018, 48, 195–216. [Google Scholar] [CrossRef] [PubMed] [Green Version]
- Hontela, A.; Rasmussen, J.B.; Chevalier, G. Impaired Cortisol Stress Response in Fish from Environments Polluted by PAHs, PCBs, and Mercury. Arch. Environ. Contam. Toxicol. 1992, 22, 278–283. [Google Scholar] [CrossRef] [PubMed]


| Primers | Nucleotide Sequence (5′→3′) | GenBank acc. no. | Amplicon Size (bp) |
|---|---|---|---|
| pomca1 Fw | AGCCAGAAGAGAGAGCAGTGAT | HM584909 | 122 |
| pomca1 Rv | ATCGGGTCAGAAAACACTCA | ||
| pomca2 Fw | AGCTCGCCAGTGAGCTGT | HM584910 | 81 |
| pomca2 Rv | CCTCCTGCATCACTTCCTG | ||
| gh Fw | CGTCTCTTCTCAGCCGAT | U01301 | 131 |
| gh Rv | GCTGGTCCTCCGTCTGC | ||
| star Fw | GAGCACAGATGTTGGCTTCA | EF640987 | 175 |
| star Rv | GAAACAATCGAGGCACACAA | ||
| eef1a Fw | AGAGGCTGTCCCTGGTGA | AF184170 | 137 |
| eef1a Rv | TGATGACCTGAGCGTTGAAG | ||
| actb Fw | TCTTCCAGCCATCCTTCCTCG | X89920 | 108 |
| actb Rv | TGTTGGCATACAGGTCCTTACGG |
| Parameters | CT-LSD | CT-HSD | AFB1-LSD | AFB1-HSD |
|---|---|---|---|---|
| Osmolality (mOsm kg−1) | 363 ± 4 (n = 8) | 345 ± 7 (n = 7) | 361 ± 8 (n = 7) | 362 ± 22 (n = 7) |
| Glucose (mM) | 3.64 ± 0.19 a (n = 8) | 4.42 ± 0.24 A* (n = 8) | 3.64 ± 0.15 a (n = 8) | 3.68 ± 0.28 A (n = 8) |
| Lactate (mM) | 1.28 ± 0.12 (n = 8) | 1.66 ± 0.13 (n = 8) | 1.92 ± 0.27 (n = 8) | 1.80 ± 0.39 (n = 8) |
| Triglycerides (mM) | 1.02 ± 0.07 a (n = 8) | 1.01 ± 0.06 A (n = 8) | 0.46 ± 0.07 b (n = 8) | 0.42 ± 0.09 B (n = 8) |
| Parameters | CT-LSD | CT-HSD | AFB1-LSD | AFB1-HSD |
|---|---|---|---|---|
| Glucose (mmol g−1 w.w.) | 13.75 ± 1.67 (n = 8) | 13.02 ± 2.86 (n = 8) | 14.83 ± 3.36 (n = 8) | 11.68 ± 2.24 (n = 8) |
| Glycogen (mmol g−1 w.w.) | 1.22 ± 0.39 (n = 5) | 1.49 ± 0.62 (n = 5) | 1.06 ± 0.17 (n = 8) | 1.93 ± 0.57 (n = 8) |
| Lactate (mmol g−1 w.w.) | 38.70 ± 2.30 (n = 8) | 44.30 ± 2.13 (n = 8) | 32.61 ± 2.30 (n = 8) | 33.85 ± 4.37 (n = 8) |
| Triglycerides (mmol g−1 w.w.) | 16.91 ± 2.13 (n = 8) | 20.83 ± 3.11 (n = 8) | 19.02 ± 1.84 (n = 8) | 16.16 ± 3.24 (n = 8) |
Publisher’s Note: MDPI stays neutral with regard to jurisdictional claims in published maps and institutional affiliations. |
© 2021 by the authors. Licensee MDPI, Basel, Switzerland. This article is an open access article distributed under the terms and conditions of the Creative Commons Attribution (CC BY) license (http://creativecommons.org/licenses/by/4.0/).
Share and Cite
Barany, A.; Fuentes, J.; Martínez-Rodríguez, G.; Mancera, J.M. Aflatoxicosis Dysregulates the Physiological Responses to Crowding Densities in the Marine Teleost Gilthead Seabream (Sparus aurata). Animals 2021, 11, 753. https://doi.org/10.3390/ani11030753
Barany A, Fuentes J, Martínez-Rodríguez G, Mancera JM. Aflatoxicosis Dysregulates the Physiological Responses to Crowding Densities in the Marine Teleost Gilthead Seabream (Sparus aurata). Animals. 2021; 11(3):753. https://doi.org/10.3390/ani11030753
Chicago/Turabian StyleBarany, Andre, Juan Fuentes, Gonzalo Martínez-Rodríguez, and Juan Miguel Mancera. 2021. "Aflatoxicosis Dysregulates the Physiological Responses to Crowding Densities in the Marine Teleost Gilthead Seabream (Sparus aurata)" Animals 11, no. 3: 753. https://doi.org/10.3390/ani11030753