Article

Rhizobacterial Colonization and Management of Bacterial Speck Pathogen in Tomato by Pseudomonas spp.

by
Mohsen M. Elsharkawy
1,*,
Amr A. Khedr
1,
Farid Mehiar
1,
Elsayed M. El-Kady
1,
Khairiah Mubarak Alwutayd
2 and
Said I. Behiry
3
1
Department of Agricultural Botany, Faculty of Agriculture, Kafrelsheikh University, Kafr Elsheikh 33516, Egypt
2
Department of Biology, College of Science, Princess Nourah bint Abdulrahman University, P.O. Box 84428, Riyadh 11671, Saudi Arabia
3
Agricultural Botany Department, Faculty of Agriculture (Saba Basha), Alexandria University, Alexandria 21531, Egypt
*
Author to whom correspondence should be addressed.
Microorganisms 2023, 11(5), 1103; https://doi.org/10.3390/microorganisms11051103
Submission received: 22 February 2023 / Revised: 5 April 2023 / Accepted: 21 April 2023 / Published: 23 April 2023
(This article belongs to the Special Issue Plant Microbiome and Host Tolerance to Biotic and Abiotic Stresses)

Abstract

:
Plants and soil microorganisms interact at every stage of growth. Pseudomonas spp. are highly regarded for their ability to increase crop production and protection from diseases. The aim of this study is to understand the mechanisms of the rhizobacterial colonization of tomato roots via chemotaxis assay and the activation of tomato resistance against the pathogenic bacterium, Pseudomonas syringae pv. tomato DC3000 (Pst). The capillary assay was used to evaluate the chemotaxis response of PGPRs (plant growth-promoting rhizobacteria). The activities of defense enzymes and the expressions of PR (pathogenesis-related) genes were measured using real-time qPCR. Chemotactic responses to malic and citric acids (the most important root exudates found in different plant species) at low concentrations varied substantially among the rhizobacterial isolates (63 species). Beneficial isolates including Pseudomonas resinovorans A5, P. vranovensis A30, P. resinovorans A28, P. umsongensis O26, P. stutzeri N42, and P. putida T15 reacted well to different concentrations of root exudates. P. putida T15 demonstrated the most potent anti-Pst activity. At three and six days after inoculation, the greatest levels of polyphenol oxidase and peroxidase activity were reported in the A5 and T15 groups. In tomato, transcript levels of four PR (pathogenesis-related) genes were elevated by rhizobacterial treatments. PGPR isolates alone or in combination with BABA (β-amino butyric acid) up-regulated the transcriptions of PR1, PR2, LOX, and PAL genes. Treatments with N42 and T15 resulted in the greatest improvements in tomato growth and yield traits. In conclusion, the results explain the mechanisms of rhizobacterial colonization for the improved management of Pst. Rhizobacterial isolates play a role in tomato’s resistance to Pst via salicylic acid and jasmonic acid pathways.

1. Introduction

Rhizobacteria that enhance plant development and health are called PGPR (plant growth-promoting rhizobacteria) [1,2]. Biocontrol agents, especially PGPR, may act against different pathogens. The activation of plant growth by PGPR occurs through changing plant hormone concentrations, nutrient facilitation by biological N2 fixation, inorganic phosphate solubilization, organic phosphate mineralization, and siderophores formation [3,4,5,6]. Antibiosis against phytopathogens, systemic resistance stimulation in plants, and the regulation of the growth of phytopathogens by forming iron-limiting conditions via the production of siderophores are examples of indirect mechanisms that reduce the effect of phytopathogens on plant growth [7]. PGPR have been utilized in commercial applications for disease biocontrol and phytoremediation, such as Pseudomonas putida [8]. Biofertilizers, phytostimulators, and biopesticides are the three forms of PGPR, based on their modes of action [9]. To accomplish these beneficial effects, PGPR colonization of the roots is clearly needed [7]. PGPR may be more effective in agricultural production by further understanding the dynamic relationships between plants and microbes. In addition to growth-promoting properties, establishment and persistence in the rhizosphere are essential for an effective bacterium. The activation of various pathways is needed for antagonistic bacteria to exhibit such properties. However, little is known about the potential mechanisms underlying these positive effects through the modification of the rhizosphere microbial community and soil functionality, despite the encouraging plant growth promotion results commonly reported and mostly attributed to phytohormones or other organic compounds produced by PGPR isolates.
Rhizosphere competence is the potential of rhizobacteria to colonize the surface of roots and compete for nutrients released by roots in rhizosphere soil. The three major forms of rhizosphere competence characteristics are chemotaxis, adhesion, and growth. PGPR isolates may have rhizosphere competence based on the transcription of genes associated with chemotaxis and adhesion to surfaces. Characteristics of rhizosphere competence, such as chemotaxis against root exudates (RE), adhesion functions, and RE metabolization, were widely investigated in order to reveal the roles of active rhizosphere colonization [10]. RE perform significant roles in the plant-microbe relationship [11]. RE are a source of carbon for soil microbes. Additionally, they serve as a signal to encourage the growth of microbes [12]. Organic acids such as malic and citric acid are major components of RE [13]. The role of organic acids in controlling plant-microbe interactions was reported in numerous studies [14,15]. For example, Pseudomonas fluorescens WCS365 exhibits chemotactic responses to different organic acids [16]. Bacillus subtilis FB17 is attracted to the malic acid released by plants’ roots [17]. Different plant species have an impact on the composition of RE. This relationship is thought to have an effect on microbial communities in the rhizosphere soil [18]. Exudates from plant roots develop their own microbial communities in the soil [19]. For example, among low and high-density stands in Montana, the fungal community of knapweed decreased significantly in nature and diversity [20]. Hence, plants use RE to select specific microbial species from a variety of microorganisms in the soil. These compounds were compatible with the bacteria found in the rhizosphere [19]. Colonization and chemotaxis are the two most important components of plant-microbe relationships. Bacterial colonization begins with the chemotaxis of root exudates [21]. For instance, by competing for nutrients and space, B. amyloliquefaciens SQR9 protects cucumber from infection with soil-borne pathogens [22]. B. subtilis N11, on the other side, can colonize the rhizosphere of banana plants and inhibit pathogen infection [23].
The tomato speck disease pathogen P. syringae pv. tomato (Pst) DC3000 has gained notoriety as a model organism for investigating the complex relationships between plants and pathogens [24]. Pst is responsible for bacterial speck disease, which is one of the most serious foliar diseases of tomato due to the substantial losses it may cause when the temperature is low and moisture is high [25]. It is still difficult to manage this disease. Although there are tomato genotypes that exhibit some resistance to Pst, the disease has been proven to be able to also overcome this resistance [26,27]. PGPR have been shown to activate systemic resistance to bacteria, fungi, and viruses in different plants. Some PGPR strains that induce ISR (induced systemic resistance) are associated with SAR (systemic acquired resistance) progress [28]. The two signals (SA and JA) coordinately stimulated 50 defense-related genes in Arabidopsis plants subjected to different defense-inducing methods [29]. Through a signaling pathway interaction, SA controls the defensive mechanisms in combination with ethylene [30]. Plants may have evolved separate signaling pathways to improve their defensive responses against specific pathogens, depending on their virulence methods [31]. Resistance to (Cucumber mosaic virus) CMV in tobacco plants treated with Bacillus spp. was concomitant with a higher transcription of the PR genes (NPR1 and Coi1) [32]. The aims of this research are to examine the chemotactic behavior of different rhizobacterial isolates belonging to Pseudomonas spp. through capillary assay to evaluate the effect of the most effective PGPR strains in terms of chemotactic activity on tomato growth and resistance against Pst, and to explore the various mechanisms involved in the resistance induction against Pst using real-time quantitative PCR analysis.

2. Materials and Methods

2.1. Chemotaxis Activity of PGPRs

2.1.1. Collecting Root Exudates

RE were collected [33]. Tomato seeds (Lycopersicon esculentum cv. Pantelosa), obtained from the Ministry of Agriculture, Egypt, were sterilized using NaOCl (sodium hypochlorite solution at 2% v/v, for 2 min) followed by washing three times in SDW (sterile distilled water). In a Petri dish, seeds (100 seeds) were put on Hoagland solution-wetted filter papers in the darkness at 25 °C for germination. Exudates from the roots were gathered in a magnate stirrer with a perforated tray filled with 80 mL of Hoagland solution. Eighty germinated seedlings with their roots in the solution were put on the tray. Exudates were obtained by filtration through Whatman No. 3 filter papers after 1 week of growth at 18 °C to eliminate solid plant contents, and then frozen quickly with liquid nitrogen. On solidified King’s B medium, a sample of exudates was taken directly from the magnate vessels and checked for contamination. The solid material was re-dissolved in 2 mL sterile water after the exudates were lyophilized. These exudates were purified through a 0.45 µm Millipore membrane to eliminate undissolved particles and deposited at −20 °C until needed. Samples were identified and confirmed using liquid chromatography-mass spectrometry (Agilent, Santa Clara, CA, USA) [34].

2.1.2. Chemotactic Response of Bacterial Isolates to Organic Acids in a “Drop” Assay

The “drop” assay was utilized to conduct chemotaxis experiments with slight modifications [35]. After 24 h of incubation on Kings B medium, cells were diluted to 10−2 in 150 mL of chemotaxis buffer containing 1% succinic acid. Forty ml of samples were resuspended in 12 mL chemotaxis buffer (100 mM potassium phosphate [pH7.0]/20 mM EDTA) when cells reached the early logarithmic phase (OD600 of 0.12). To achieve a viscosity of 4000 cP in a 2% aqueous solution, the cell suspension was treated with an aqueous solution (up to 15 mL) of 1% hydroxypropyl methyl cellulose (Sigma-Aldrich). The resultant cell suspension was moved to a Petri dish (60 mm in diameter), where it produced a 3 mm thick layer. A drop (10 µL) of concentrated (50-fold) root exudates (citric acid (100 mM) and malic acid (100 mM) was placed into the dish’s center at a concentration equal to or less than 0.1 M. After incubation at room temperature for 0.5 to 2 h, the plates were examined for the presence of a clear zone around the bacteria as criteria for a chemotactic reaction. Any turbidity rings that formed in the following 30 min were noted to determine the extent of the chemotactic reaction.

2.1.3. Chemotaxis Assay (Capillary Assay)

A modified capillary test based on Adler’s method was used for the quantitative assessment of isolates’ chemotaxis response to citric acid [36]. Sixty-three PGPR isolates were tested in this experiment. The identification of all strains was established by comparing 16S rDNA sequences to those of the strains. The pathogen P. syringae pv. tomato DC3000 and rhizobacterial isolates were obtained from Gifu university, Japan. The KB medium was used to grow the strains until they reached the log phase (OD600 = 0.12). The cells were centrifuged and cleaned twice using chemotaxis buffer before being resuspended in the same buffer. Six mL of the above-mentioned cell suspension were placed on a Petri dish (60 mm in diameter). Three concentrations (1, 10, and 50 μM) of organic acids (malic acid and citric acid) were put into standard 2 μL capillary tubes and then immersed in the cell suspension. Static incubation at room temperature for 30 min after removing the capillary’s contents into a sterile Eppendorf tube was performed. The suspension was diluted and then plated on KB plates. In KB plates cultured for 24 h at 30 °C, the CFU was measured. Each treatment was carried out three times in total.

2.2. Induction Treatments with PGPRs

Tomato seeds were sterilized and put on wetted filter papers in Petri dishes under sterilized conditions for germination at 25 °C in the dark. The vermiculite was packed into sterilized polypropylene bags and autoclaved for 6 min at 121 °C (three times at 12 h intervals). Sterilized pots (25 cm in diam) with autoclaved potting medium were planted with tomato seeds and irrigated three times/week. Two weeks of growing in a growth chamber at 30 °C with a 16 h light/8 h dark photoperiod were used to transplant the germinated seeds. PGPR isolates, attracted to low concentrations of citric acid, were grown in KB medium and shaken at 160 rpm and 30 °C for 24 h. The cells were collected by centrifugation at 12,000 rpm for 10 min, then washed with SDW and resuspended in 10 MgCl2. The harvested bacterial suspensions were adjusted to 1 × 10⁸ CFU. Soil was inoculated with different bacterial suspensions. An additional treatment (booster) was conducted 1 day before pathogen inoculation by soil drenching with β-amino butyric acid (BABA). A stock solution of BABA (Syngenta Research, Triangle Park, NC, USA) at 0.33 M was used. P. syringae pv. tomato DC3000 inoculation was done as described by Elsharkawy et al. [37]. Five days after Pst inoculation, the severity of the disease was measured by measuring the area of infected leaves on a scale from 0 (no symptoms) to 100 (severe necrotic symptoms). The number of Pst was determined on tomato leaves [37].

2.3. Assessment of Defense-Related Enzymes

Enzyme extracts were produced using the approved procedures by Elsharkawy et al. [38]. Tomato leaf samples were collected and pulverized in a mortar and pestle containing liquid nitrogen at three and six days post Pst inoculation (DPI). After grinding for 30 s, the powder was homogenized in a mortar and pestle with 3 mL of sodium phosphate buffer pH 6.8 (0.01 M). A refrigerated centrifuge was used to clarify the filtrates for 15 min at 6000 rpm after filtering the triturated tissues through cheesecloth. The clear supernatant was used to measure defense enzymes using a spectrophotometer (DR 5000 UV-VIS-Hyxo).
The activity of peroxidase (POX) in the obtained samples was determined using spectrophotometric analysis. Although there are many different types of POX enzymes, we chose guaiacol as a marker for general POX activity. Phosphate buffer (2.5 mL, pH7.0) and 0.2 mL enzyme extract were added to all test tubes (2 sets). Guaiacol solution (1%, 0.2 mL) was added and stirred in the experimental set. For 15–20 min, both sets were kept at room temperature. Subsequently, the contents of all the test tubes were then carefully mixed with 0.1 mL of 0.3% H2O2. Distilled water (0.2 mL), 0.1 mL of 0.3 % H2O2, and 2.5 mL of phosphate buffer (pH 7.0) were used to prepare the blank. A spectrophotometer was used to measure the absorbance at 470 nm. Each measurement was repeated three times.
The enzyme extract was utilized to measure polyphenol oxidase activity (PPO). Using phosphate buffer (pH 7.3), the final volume of the extract was increased to 25 mL, and the filtrate was centrifuged for 1 h at 15,000 rpm. The fraction precipitated between 45 and 95%, and saturation was obtained and re-dissolved in phosphate buffer after an ammonium sulphate fractionation. The mixture was then dialyzed in cellulose dialysis tubing at 4 °C. The activities of catecholase and cresolase were assessed spectrophotometrically [39]. To test the catecholase activity, a 30 mM 4-methyl catechol (4MC) substrate in a sodium acetate buffer (10 mM, pH 4.5) was used. Regarding crude enzyme extract (1 mL), the reaction was initiated by adding 1 mL of the substrate and 3 mL of phosphate buffer (pH 7.3) to the mixture. A spectrophotometer was used to measure the change in absorbance at 400 nm.

2.4. Molecular Investigation

The Total RNA Purification Kit (Thermo Scientific, Fermentas (Waltham, MA, USA), #K0731) was used to extract RNA from tomato leaves according to the manufacturer’s procedure. The Reverse Transcription Kit (Thermo Scientific, Fermentas, #EP0451) was used for cDNA synthesis. Template RNA (5 µL) was put to a sterile, nuclease-free tube on ice, followed by 0.5 μL Oligo dT, and the volume was increased to 12.5 μL using DEPC-treated water. On the nuclease-free tube holding the component of the first step, 4 μL of 5× reaction buffer, 0.5 μL of RiboLock RNase Inhibitor, 2 μL of dNTP Mix, and 1 μL of RevertAidTM H Minus Reverse Transcriptase were added. The mixture was gently mixed before being incubated at 42 °C for 60 min. To ensure that the quantities of RNA and cDNA are pure enough for real-time PCR, the concentrations were quantified. The Q5000 (UV-Vis spectrophotometer Q5000/USA) was used to perform all required measurements and computations automatically. The expression of target genes mRNAs was measured using real-time PCR with SYBR Green. The cDNA was amplified using 2× Maxima SYBR Green/ROX qPCR Master Mix (Thermo Scientific, USA, #K0221) and gene specific primers according to the manufacturer’s procedure. Table 1 lists the primers used in the amplification, including pathogenesis-related genes of PR1, PR2, lipoxygenase (LOX), and Phenylalanine ammonia lyase (PAL). Firstly, the polymerase chain reaction (PCR) mixture was denatured at 94 °C for 5 min, followed by 40 cycles of denaturation for 30 s at 94 °C, annealing for 30 s at 55 °C, and extension for 30 s at 72 °C. The housekeeping gene (Ubectin 13) serves as a normalizer for calculating relative gene expression or fold change in the target gene. The 2−∆∆Ct method was employed to equalize the quantities cycle threshold (Ct) of the target gene with the quantities Ct of the housekeeping gene [40]. In both the target and reference genes, the control group served as a calibrator, while the other groups served as test groups.

2.5. Plant Growth under Field Experiments

On a loamy soil, 15 treatments were applied in plots of 15 plants for a total of 225 tomato plants on a raised bed at a spacing of 0.55 m. Treatments were P. umsongensis O26, P. vranovensis A30, P. resinovorans A5, P. resinovorans A28, P. resinovorans A33, P. resinovorans A47, P. brassicacearum N6, P. brassicacearum N32, P. putida T15, P. stutzeri N42, P. putida C21, P. aeruginosa B30, P. alcaligenes B5, P. alcaligenes B16, and control. Tomatoes were planted in rows of 120 × 40 cm, with a row length of 25 m. The experiments used a split-plot design with a randomized complete block and were repeated three times. The plants were irrigated using the drip method. The application of 14 PGPR isolates (1 × 10⁸ CFU/cm3) was performed as soil drench at 2 days before pathogen inoculation [2]. Plants in the control group were treated with sterile water. Cumulative yield (kg/plant), plant height (cm), fresh weight (g), dry weight (g), number of branches, chlorophyll contents, number of fruits per plant, average fruit weight (g), leaf area (cm2), number of flowers per plant, vitamin C (mg/100 g), titratable acidity, and total soluble solids (TSS, %) were all used to evaluate the growth enhancement by bacterial treatments.

2.6. Statistical Analysis

Means were used to represent all data. Fisher’s least significant difference (LSD) test was employed to evaluate statistical significance [38]. The experiments were performed three times. All analyses were performed with a significance level of p ≤ 0.05 using XLSTAT PRO (statistical analysis software, Addinsoft 2016.02.270444 version, Paris, France).

3. Results

3.1. Chemotaxis Activity of PGPRs

The chemotactic response of 63 bacterial isolates to malic and citric acids was investigated to identify the reason for the biocontrol agents’ preferred colonization pattern (Table 2). Isolates including P. resinovorans A5, P. resinovorans A47, P. umsongensis O26, P. putida C21, and P. putida T15 reacted well to both concentrations of root exudates (Table 2). B5 and B16, on the other hand, may be attracted to malic acid, but not to citric acid (Table 2).
PGPRs, particularly P. umsongensis O26, P. vranovensis A30, P. resinovorans A5, P. resinovorans A28, P. stutzeri N42, and P. putida T15, responded clearly to chemotaxis buffer concentrated root exudates (malic acid and citric acid), in contrast to the non-treated control (Table 3). B11 and C37 induced an inconspicuous chemotactic response to citric acid. Neither B5 nor B16 elicited a reaction (Figure 1). When examined in 10-µL drops at concentrations of 100 mM, the major amino acids found in tomato root exudate, L-glutamic acid, L-aspartic acid, L-leucine, L-isoleucine, and L-lysine, all elicited a response of PGPR isolates. The threshold concentration of organic acids that may cause chemotaxis was determined by testing various concentrations of organic acids in 10-µL drops. Citric acid and malic acid responses were started at doses as low as 10 to 50 mM (Table 3). The best isolates in the responses to low doses of citric and malic acids were shown compared with the isolates Pseudomonas alcaligenes B5 and Pseudomonas alcaligenes B16 (Table 3).
The chemotactic response of PGPRs to different doses of malic and citric acids was determined using a modified quantitative capillary chemotaxis test. Citric acid, found in tomato root exudates, was shown to attract P. umsongensis O26, P. vranovensis A30, P. resinovorans A5, P. resinovorans A28, P. stutzeri N42, and P. putida T15 at concentrations ranging from 1 to 50 mM (Figure 2). Malic and citric acids (1, 10, and 50 mM) showed clear positive and concentration-dependent chemotactic behavior in PGPR strains, with the most effective concentration ranging from 10 to 50 mM (Figure 2). Only B5 and B16 chemotactic responses were induced by malic acid at concentrations of 1, 10, and 50 mM, without any response toward all concentrations of citric acids (Figure 2).

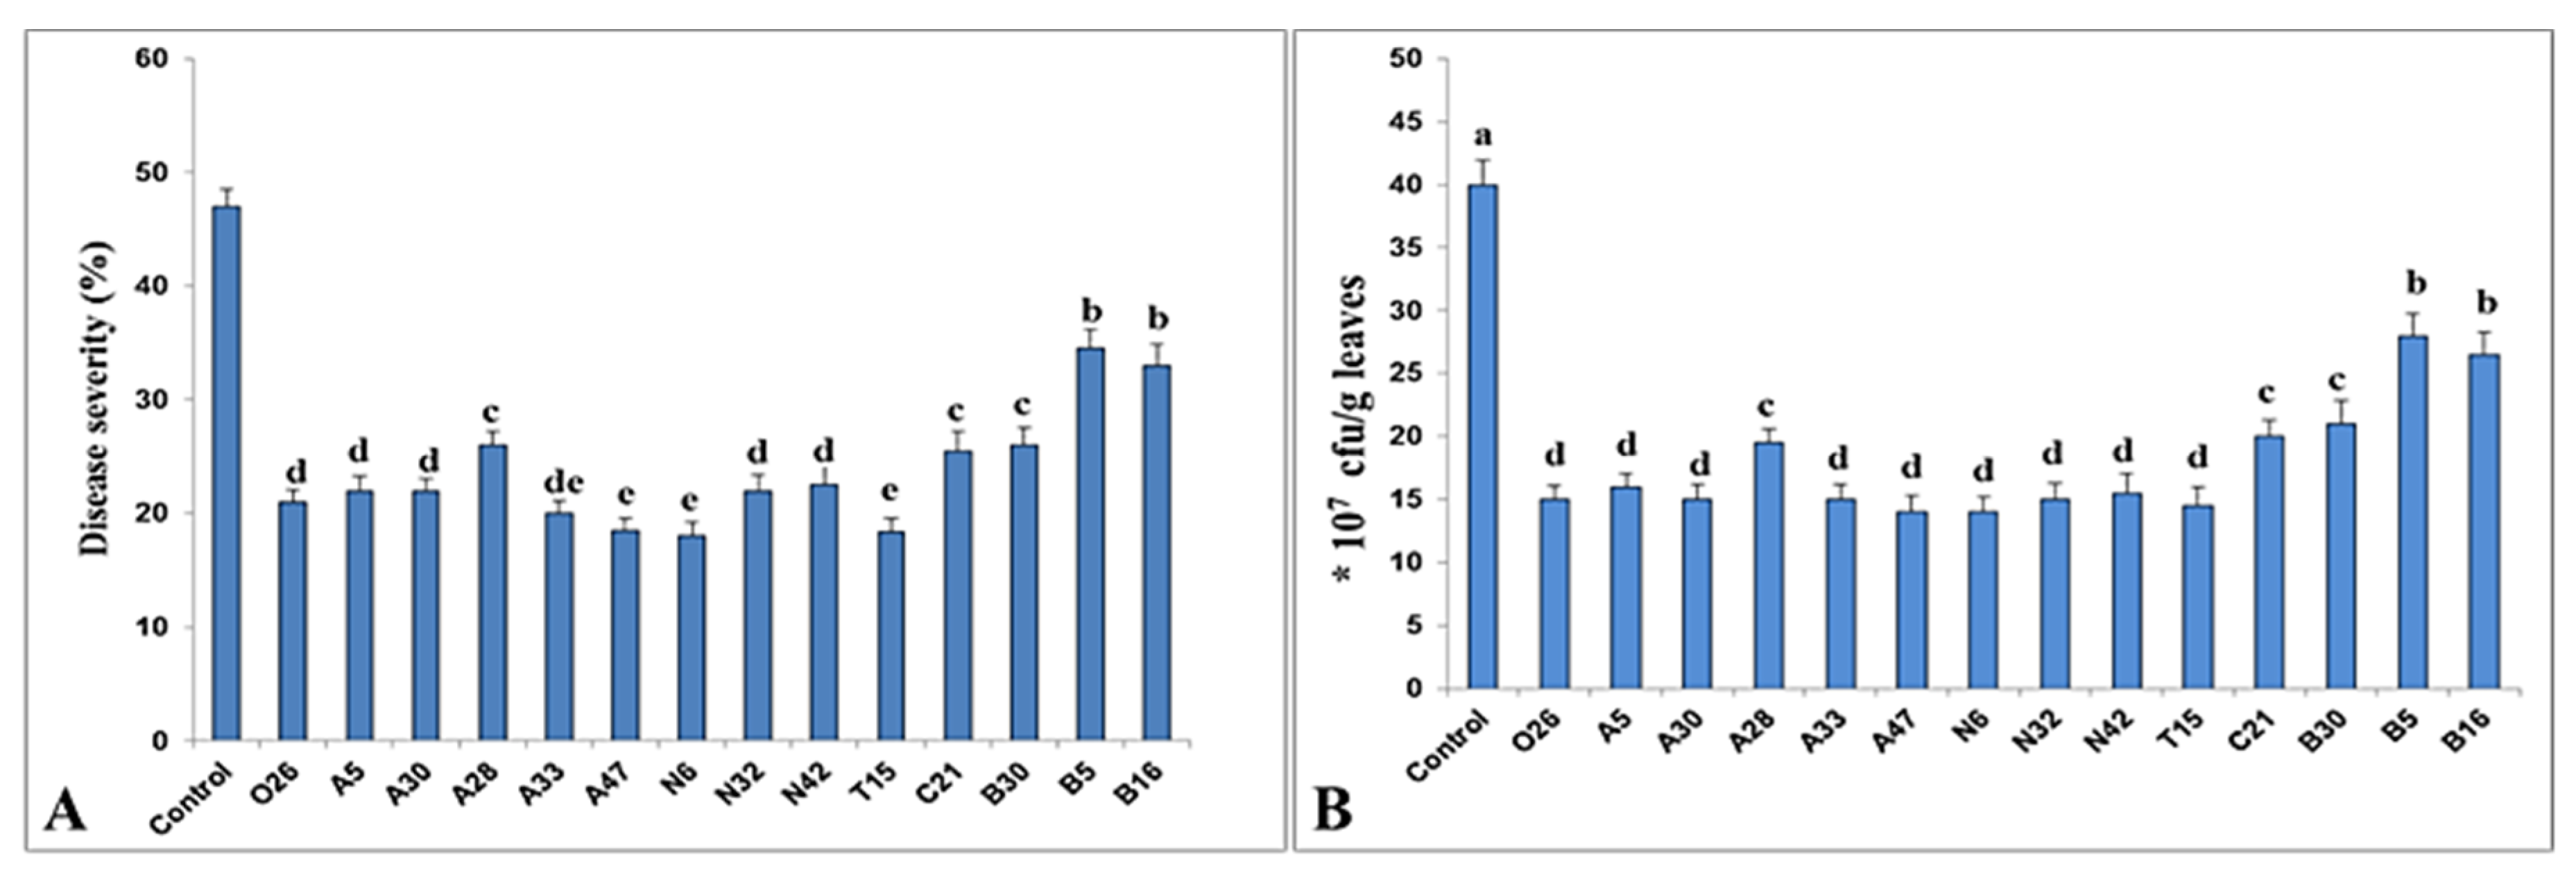
3.2. Induction of Systemic Resistance against Pst by PGPR

Root treatment with PGPR resulted in induced systemic resistance (ISR) in tomato against Pst. The defensive mechanisms mediated by PGPR were described using a tomato-based model system. A screening procedure using root treatment was done to explore the most effective PGPR strains in terms of chemotactic activity and, consequently, the most effective isolates against Pst. ISR against the pathogen was measured five days after a challenge by calculating disease severity as a percentage, and Pst proliferation was checked in the leaves. T15 had the most remarkable outcomes in terms of lowering disease severity (18.3%) and pathogen proliferation (14.5) (Figure 3).
Among 14 PGPR isolates, the most efficient nine isolates were selected and used as dual treatments with BABA against Pst. Results showed that the treatments exhibited substantial suppression of disease symptoms without any symptoms of infection (Figure 4). According to these findings, root dual treatments with BABA and P. umsongensis O26, P. resinovorans A5, P. resinovorans A33, P. resinovorans A47, P. brassicacearum N6, P. brassicacearum N32, and P. putida T15 were more resistant to Pst-caused foliar disease, and showed a considerable decrease in disease severity (7.8, 8.2, 8.4, 8.2, 8.3, 8.5, and 8.1%, respectively) and the proliferation of Pst in the leaves (5.1, 4.8, 5, 4.6, 4.6, 5, and 4.4, respectively) compared with control plants (52 and 45%, respectively).

3.3. Effects of PGPR Treatments on Enzyme Activities in Plants Infected with Pst

Peroxidase and polyphenol oxidase activities at 3 and 6 days post-inoculation (DPI) in different PGPR treatments were presented in Table 4. PGPR isolates induced considerable increases in POX and PPO activity in tomato plants compared with the control treatment (Table 4). Additionally, it is clear from the data that POX and PPO activities were higher at 3 DPI than 6 DPI. PGPR isolates; P. resinovorans A5, P. resinovorans A33, P. resinovorans A47, P. stutzeri N42, P. putida T15, and P. putida C21 recorded the highest values of POX and PPO activities at 3 and 6 DPI (Table 4).
PPO and POX activities were determined after 3 and 6 DPI in plants treated with both PGPR isolates and BABA or BABA alone (Table 5). The obtained data showed that the most effective treatment was the dual treatment with T15 and BABA, which recorded 66.0 and 49.4 for POX at 3 and 6 DPI, and 45.4 and 41.1 for PPO at 3 and 6 DPI, respectively, and consequently caused higher reduction values of bacterial leaf speck disease than the untreated inoculated control (Table 5).

3.4. Effects of PGPR Treatments on Plant Growth and Yield

The results revealed that bacterial treatments substantially impacted fruit production, vitamin C, and the number of fruits per plant (Table 6 and Table 7). A significant increase in the yield was achieved using A5 (5.8 kg/plant), A30 (5.7 kg/plant), A47 (5.9 kg/plant), N6 (5.9 kg/plant), T15 (6.2 kg/plant) and C21 (5.9 kg/plant) as compared with the control (3.3 kg/plant) (Table 6). PGPR-treated plants outperformed their untreated controls in terms of yield measures. Treatment with T15 exhibited the highest increase in the number of flowers and fruits and weight of fruits/plant compared with other isolates and control treatment. Additionally, the isolates P. resinovorans A5, P. resinovorans A47, P. brassicacearum N6, and P. putida C21 showed a higher number of fruits, and fruits weight/plant T15 had the most significant outcomes in terms of fresh and dry weights, plant height, number of branches, leaf area, and chlorophyll content, although there were substantial variations between treatments.
TSS, acidity, and vitamin C concentration were the fruit quality parameters examined. T15 treatment provided the highest vitamin C (137.3 mg/100 g) compared with the control treatment (120.2 mg/100 g). P. putida T15, P. stutzeri N42, P. vranovensis A30, P. resinovorans A5, and P. putida C21 had the same TSS levels (5.21, 5.19, 5.19, 5.22, and 5.18, respectively), with no statistically significant differences. All treatments were significantly higher than the control. Similar to vitamin C contents, A5, A30, A47, N6, N42, T15, and C21 treatments increased the acidity of tomato fruits (0.58, 0.57, 0.58, 0.58, 0.59, 0.58, and 0.57) compared to the control (0.47), respectively (Table 7).

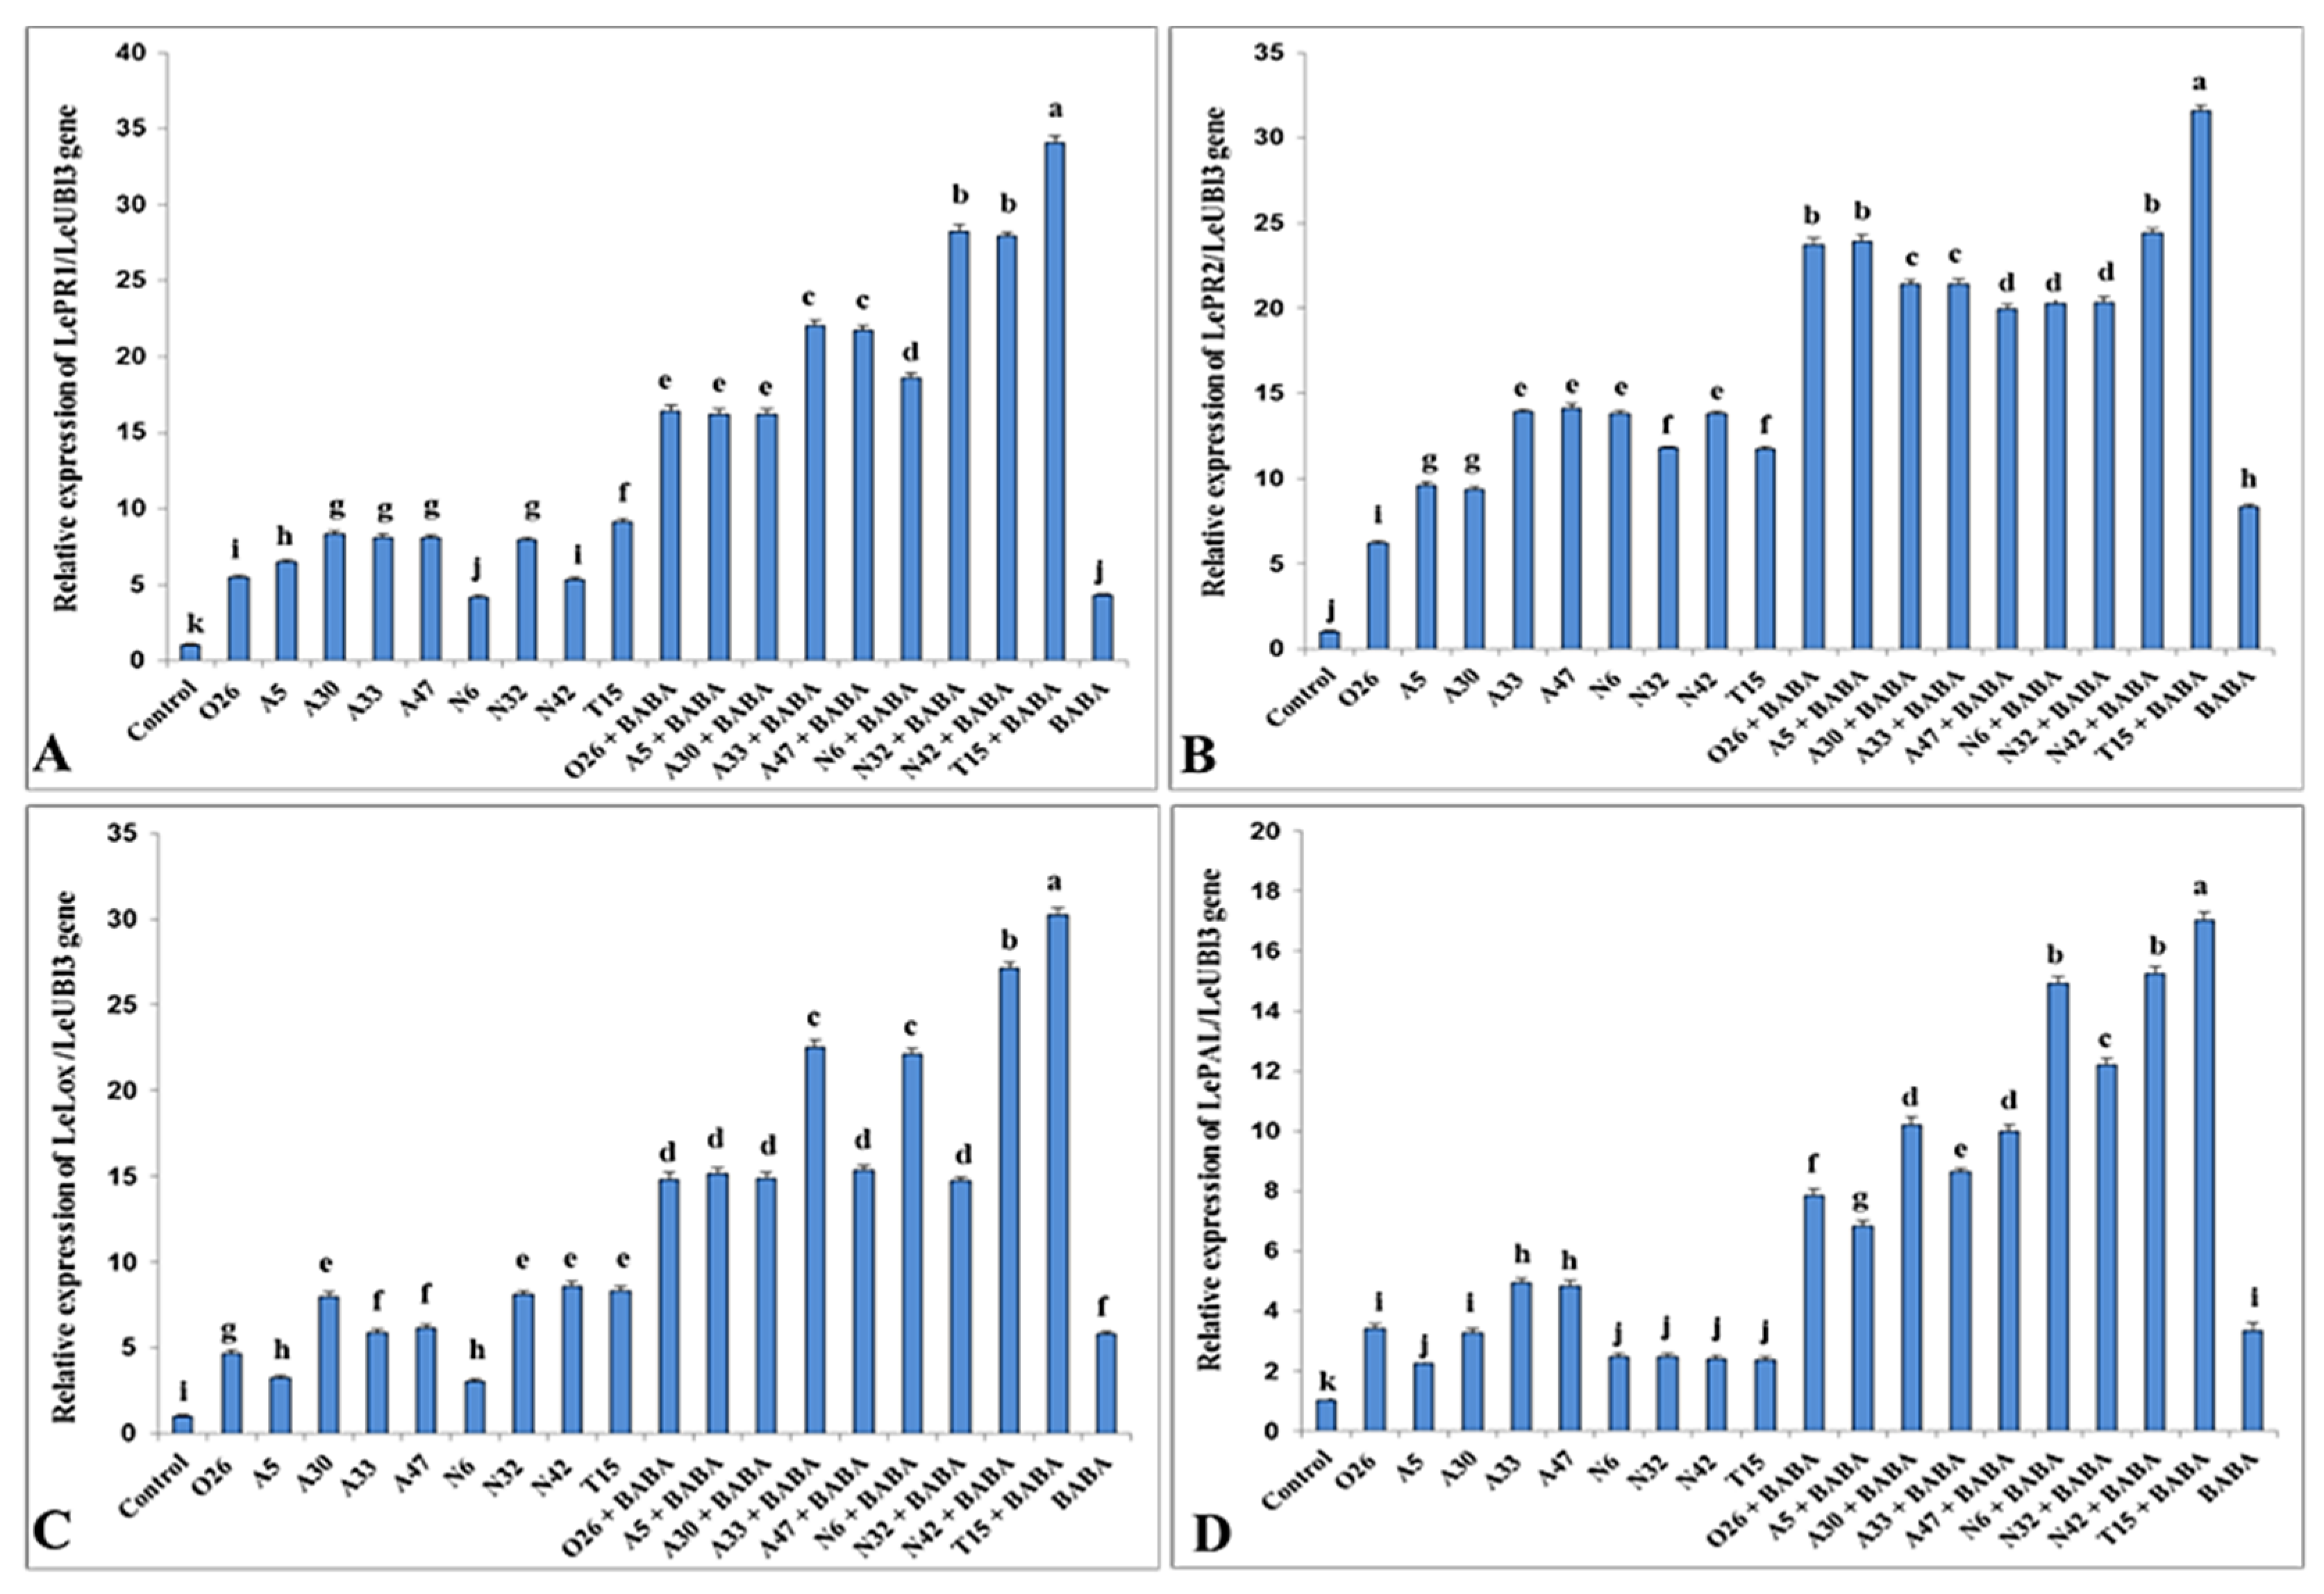
3.5. Molecular Analysis of Defense Genes by Real-Time PCR

After treatment with PGPR isolates alone or in combination with BABA, real-time PCR was performed to assess the relative expression of four pathogenesis-related proteins encoded by the genes PR1 and PR2, LOX, and PAL. An evaluation of these genes’ transcription levels in the treated tomato and the control was carried out. Nanodrop was used to evaluate the quality and concentration of total RNA, which revealed pure RNA with much higher quantities of RNA (ranging from 950 to 2050 ng/µL). The housekeeping gene encoding the elongation factor Ubectin 13 was utilized as an internal reference for normalization throughout the real-time PCR experiment, and data were represented as mean ± SEM.
Compared to control tomato plants, PGPR-treated tomato plants had a substantial increase in PR1 gene expression before Pst inoculation (Figure 5). Plants treated with T15 + BABA showed the highest expression (34.06 folds). The amount of PR2 gene expression in PGPR-treated tomato plants was substantially higher than in control plants (Figure 5). In addition, dual treatment with T15 and BABA resulted in the highest up-regulation of PR2 gene expression (31.56 folds), followed by dual treatments with N42 + BABA, A5 + BABA and O26 + BABA.
The mean value of PR2 gene expression in PGPR-treated tomato plants was substantially higher than in the control plants (Figure 5). Gene expression was not significantly different between O26 + BABA, A5 + BABA and A30 + BABA treatments. When comparing all treatments, dual treatment with T15 and BABA showed the highest expression of the PR1 gene than other treatments. PAL gene expression was significantly increased in plants treated with PGPR compared to the control (Figure 5). T15 + BABA, N42 + BABA, and N6 + BABA were significantly more elevated than the other treatments in all groups. Furthermore, plants treated with T15 + BABA had a greater up-regulation of PAL gene expression than plants treated with N42 + BABA or N6 + BABA (Figure 5).

4. Discussion

We examined the chemo-attractants in 63 root-colonizing rhizobacterial strains and evaluated their colonizing and chemotactic behavior. The movement of an organism in reaction to a chemical stimulation is known as chemotaxis. This is crucial because bacteria move toward the areas with the highest concentrations of food molecules (such as glucose). Carbon-based chemicals make up the majority of root exudates [41]. Soil microbes need organic acids which may serve as food and signal molecules [14]. The effects of malic and citric acids on the chemotactic response of PGPR were elucidated. The compositions of plant root exudates are closely linked to the chemotaxis response and colonization behavior of bacterial strains. This study offers valuable information with implications for co-evolution between plants and microorganisms in the same niche, as well as improved PGPR-strain selection for agricultural production applications. P. putida T15 has the genetic components (chemotaxis, adhesion structures, and antimicrobial activities) to colonize the rhizosphere effectively. Various concentrations of malic and citric acids were examined to establish the chemotaxis threshold concentration. Low quantities of malic and citric acids, such as 10 mM, elicited the response of PGPRs. Exudates stimulated chemotaxis, proliferation, and biofilm formation, which impacted B. amyloliquefaciens BNM339 colonization of soybean seeds [42]. The higher favorable reactivity of P. putida T15 to tomato root exudates may essentially explain its colonization behavior. Many different organic acids, such as citric and malic acids, are released simultaneously by the bacteria in the rhizosphere at the same time and have been associated with their function in phosphate solubilization.
Fourteen distinctly different PGPR isolates were utilized against Pst, and the protective effect and mechanism of the PGPR in tomato plants were elucidated. Our findings show that only PGPR treatment is sufficient to protect plants. In tomato, a mixture of PGPR and BABA substantially increased resistance to Pst. The number of symptomatic leaves, the proliferation of Pst in the leaves, and the severity of the disease were all decreased as a result of PGPR treatment. In tomato plants, the function of defensive signaling molecules has been investigated using real-time PCR. The fact that PGPR alone or in combination with BABA substantially upregulated the pathogenesis-related genes (PR1, PR2, LOX, and PAL) explains their importance in systemic resistance to Pst. ISR refers to the reduction in the severity or incidence of disease caused by PGPR-elicited host defenses that are spatially separated from pathogens [43]. The stimulation of PGPR in plants leads to indirect systemic resistance to pathogens [44,45]. In Arabidopsis and tobacco, the systemic resistance generated by the bacteria Serratia marcescens 90–166 or Pseudomonas fluorescens WCS417 is independent of SA accumulation [46]. P. aeruginosa 7NSK2, on the other hand, used the SA-dependent pathway to elicit ISR against Botrytis cinerea in tomato and Tobacco mosaic virus in tobacco [47]. Using Arabidopsis mutant lines, a model pathway for signal transduction in PGPR-mediated ISR was established [2]. ISR induced by PGPR is dependent on jasmonic acid (JA), ethylene, and SA, according to the proposed pathway [2]. The treatments P. putida T15 and P. putida T15 + BABA substantially reduced the severity of Pst (p ≤ 0.05). When compared to the control, PGPR isolates substantially enhanced all the tested plant growth parameters. Individual P. putida T15 treatment exhibited the most substantial increases in tomato growth and yield compared to other treatments. PGPR isolates outperformed the control in all plant growth and morphological parameters. PGPR has been shown to improve plant growth via a number of methods, including mineral phosphate solubilization, biological nitrogen fixation, plant hormone production, and stress reduction [5]. PGPR may also have an indirect impact on plant development by keeping pathogens from deleterious effects.
In conclusion, the processes by which the plant recognizes helpful microorganisms were addressed. Root exudates (malic and citric acids) attract beneficial rhizobacteria leading to the stimulation of defense response in tomato against Pst. These results are important for improving management strategies against plant pathogens.

Author Contributions

Conceptualization, M.M.E.; methodology, M.M.E. and A.A.K.; software, M.M.E.; validation, M.M.E., K.M.A. and S.I.B.; formal analysis, M.M.E.; investigation, M.M.E.; resources, M.M.E., K.M.A. and S.I.B.; data curation, M.M.E., F.M. and E.M.E.-K.; writing—original draft preparation, M.M.E.; writing—review and editing, M.M.E.; visualization, M.M.E.; supervision, M.M.E., F.M. and E.M.E.-K.; project administration, M.M.E.; funding acquisition, K.M.A. and S.I.B. All authors have read and agreed to the published version of the manuscript.

Funding

Princess Nourah bint Abdulrahman University Researchers Supporting Project number (PNURSP2023R402), Princess Nourah bint Abdulrahman University, Riyadh, Saudi Arabia.

Institutional Review Board Statement

Not applicable.

Informed Consent Statement

Not applicable.

Data Availability Statement

Not applicable.

Acknowledgments

The authors gratefully acknowledge Princess Nourah bint Abdulrahman University Researchers Supporting Project number (PNURSP2023R402), Princess Nourah bint Abdulrahman University, Riyadh, Saudi Arabia.

Conflicts of Interest

The authors declare no conflict of interest.

References

  1. Basu, A.; Prasad, P.; Das, S.N.; Kalam, S.; Sayyed, R.Z.; Reddy, M.S.; El Enshasy, H. Plant Growth Promoting Rhizobacteria (PGPR) as Green Bioinoculants: Recent Developments, Constraints, and Prospects. Sustainability 2021, 13, 1140. [Google Scholar] [CrossRef]
  2. Elsharkawy, M.M.; Elsawy, M.M.; Ismail, I.A. Mechanism of resistance to Cucumber mosaic virus elicited by inoculation with Bacillus subtilis subsp. subtilis. Pest Manag. Sci. 2021, 78, 86–94. [Google Scholar] [CrossRef] [PubMed]
  3. El-Sawah, A.M.; El-Keblawy, A.; Ali, D.F.I.; Ibrahim, H.M.; El-Sheikh, M.A.; Sharma, A.; Hamoud, Y.A.; Shaghaleh, H.; Brestic, M.; Skalicky, M.; et al. Arbuscular Mycorrhizal Fungi and Plant Growth-Promoting Rhizobacteria Enhance Soil Key Enzymes, Plant Growth, Seed Yield, and Qualitative Attributes of Guar. Agriculture 2021, 11, 194. [Google Scholar] [CrossRef]
  4. Vocciante, M.; Grifoni, M.; Fusini, D.; Petruzzelli, G.; Franchi, E. The Role of Plant Growth-Promoting Rhizobacteria (PGPR) in Mitigating Plant’s Environmental Stresses. Appl. Sci. 2022, 12, 1231. [Google Scholar] [CrossRef]
  5. Tian, J.; Ge, F.; Zhang, D.; Deng, S.; Liu, X. Roles of Phosphate Solubilizing Microorganisms from Managing Soil Phosphorus Deficiency to Mediating Biogeochemical P Cycle. Biology 2021, 10, 158. [Google Scholar] [CrossRef]
  6. Oubohssaine, M.; Sbabou, L.; Aurag, J. Native Heavy Metal-Tolerant Plant Growth Promoting Rhizobacteria Improves Sulla spinosissima (L.) Growth in Post-Mining Contaminated Soils. Microorganisms 2022, 10, 838. [Google Scholar] [CrossRef]
  7. Gashash, E.A.; Osman, N.A.; Alsahli, A.A.; Hewait, H.M.; Ashmawi, A.E.; Alshallash, K.S.; El-Taher, A.M.; Azab, E.S.; El-Raouf, H.S.A.; Ibrahim, M.F.M. Effects of Plant-Growth-Promoting Rhizobacteria (PGPR) and Cyanobacteria on Botanical Characteristics of Tomato (Solanum lycopersicon L.) Plants. Plants 2022, 11, 2732. [Google Scholar] [CrossRef]
  8. Zhu, N.; Zhang, B.; Yu, Q. Genetic Engineering-Facilitated Coassembly of Synthetic Bacterial Cells and Magnetic Nanoparticles for Efficient Heavy Metal Removal. ACS Appl. Mater. Interfaces 2020, 12, 22948–22957. [Google Scholar] [CrossRef]
  9. Kumar, R.; Swapnil, P.; Meena, M.; Selpair, S.; Yadav, B.G. Plant Growth-Promoting Rhizobacteria (PGPR): Approaches to Alleviate Abiotic Stresses for Enhancement of Growth and Development of Medicinal Plants. Sustainability 2022, 14, 15514. [Google Scholar] [CrossRef]
  10. Yang, L.; Zhou, Y.; Guo, L.; Yang, L.; Wang, J.; Liang, C.; Huang, J. The Effect of Banana Rhizosphere Chemotaxis and Chemoattractants on Bacillus velezensis LG14-3 Root Colonization and Suppression of Banana Fusarium Wilt Disease. Sustainability 2023, 15, 351. [Google Scholar] [CrossRef]
  11. Upadhyay, S.K.; Srivastava, A.K.; Rajput, V.D.; Chauhan, P.K.; Bhojiya, A.A.; Jain, D.; Chaubey, G.; Dwivedi, P.; Sharma, B.; Minkina, T. Root Exudates: Mechanistic Insight of Plant Growth Promoting Rhizobacteria for Sustainable Crop Production. Front. Microbiol. 2022, 13, 916488. [Google Scholar] [CrossRef]
  12. Feng, H.; Fu, R.; Hou, X.; Lv, Y.; Zhang, N.; Liu, Y.; Xu, Z.; Miao, Y.; Krell, T.; Shen, Q.; et al. Chemotaxis of Beneficial Rhizobacteria to Root Exudates: The First Step towards Root–Microbe Rhizosphere Interactions. Int. J. Mol. Sci. 2021, 22, 6655. [Google Scholar] [CrossRef] [PubMed]
  13. Tsotetsi, T.; Nephali, L.; Malebe, M.; Tugizimana, F. Bacillus for Plant Growth Promotion and Stress Resilience: What Have We Learned? Plants 2022, 11, 2482. [Google Scholar] [CrossRef] [PubMed]
  14. Jamil, F.; Mukhtar, H.; Fouillaud, M.; Dufossé, L. Rhizosphere Signaling: Insights into Plant–Rhizomicrobiome Interactions for Sustainable Agronomy. Microorganisms 2022, 10, 899. [Google Scholar] [CrossRef]
  15. Antoszewski, M.; Mierek-Adamska, A.; Dąbrowska, G.B. The Importance of Microorganisms for Sustainable Agriculture—A Review. Metabolites 2022, 12, 1100. [Google Scholar] [CrossRef]
  16. De Weert, S.; Vermeiren, H.; Mulders, I.H.M.; Kuiper, I.; Hendrickx, N.; Bloemberg, G.V.; Vanderleyden, J.; De Mol, R.; Lug-tenberg, B.J.J. Flagella-driven chemotaxis towards exudate components is an important trait for tomato root colonization by Pseudomonas fluorescens. Mol. Plant Microbe. Interact. 2002, 15, 1173–1180. [Google Scholar] [CrossRef]
  17. Rudrappa, T.; Czymmek, K.J.; Paré, P.W.; Bais, H.P. Root-Secreted Malic Acid Recruits Beneficial Soil Bacteria. Plant Physiol. 2008, 148, 1547–1556. [Google Scholar] [CrossRef]
  18. Micallef, S.A.; Channer, S.; Shiaris, M.P.; Colón-Carmona, A. Plant age and genotype impact the progression of bacterial community succession in the Arabidopsis rhizosphere. Plant Signal. Behav. 2009, 4, 777–780. [Google Scholar] [CrossRef] [PubMed]
  19. Jin, J.; Huang, R.; Wang, J.; Wang, C.; Liu, R.; Zhang, H.; Deng, M.; Li, S.; Li, X.; Tang, R.; et al. Increase in Cd Tolerance through Seed-Borne Endophytic Fungus Epichloë gansuensis Affected Root Exudates and Rhizosphere Bacterial Community of Achnatherum inebrians. Int. J. Mol. Sci. 2022, 23, 13094. [Google Scholar] [CrossRef]
  20. Broz, A.K.; Manter, D.K.; Vivanco, J.M. Soil fungal abundance and diversity: Another victim of the invasive plant Centaurea maculosa. ISME J. 2007, 1, 763–765. [Google Scholar] [CrossRef]
  21. Santoyo, G.; Urtis-Flores, C.A.; Loeza-Lara, P.D.; Orozco-Mosqueda, M.D.C.; Glick, B.R. Rhizosphere Colonization Determinants by Plant Growth-Promoting Rhizobacteria (PGPR). Biology 2021, 10, 475. [Google Scholar] [CrossRef]
  22. Xu, Z.; Shao, J.; Li, B.; Yan, X.; Shen, Q.; Zhang, R. Contribution of Bacillomycin D in Bacillus amyloliquefaciens SQR9 to Antifungal Activity and Biofilm Formation. Appl. Environ. Microbiol. 2013, 79, 808–815. [Google Scholar] [CrossRef]
  23. Zhang, N.; Wu, K.; He, X.; Li, S.-Q.; Zhang, Z.-H.; Shen, B.; Yang, X.-M.; Zhang, R.-F.; Huang, Q.-W.; Shen, Q.-R. A new bioorganic fertilizer can effectively control banana wilt by strong colonization with Bacillus subtilis N11. Plant Soil 2011, 344, 87–97. [Google Scholar] [CrossRef]
  24. Butsenko, L.; Pasichnyk, L.; Kolomiiets, Y.; Kalinichenko, A. The Effect of Pesticides on the Tomato Bacterial Speck Disease Pathogen Pseudomonas Syringae pv. Tomato. Appl. Sci. 2020, 10, 3263. [Google Scholar] [CrossRef]
  25. Bazzarelli, F.; Mazzei, R.; Papaioannou, E.; Giannakopoulos, V.; Roberts, M.R.; Giorno, L. Biorefinery of Tomato Leaves by Integrated Extraction and Membrane Processes to Obtain Fractions That Enhance Induced Resistance against Pseudomonas syringae Infection. Membranes 2022, 12, 585. [Google Scholar] [CrossRef] [PubMed]
  26. Nabi, R.B.S.; Rolly, N.K.; Tayade, R.; Khan, M.; Shahid, M.; Yun, B.-W. Enhanced Resistance of atbzip62 against Pseudomonas syringae pv. tomato Suggests Negative Regulation of Plant Basal Defense and Systemic Acquired Resistance by AtbZIP62 Transcription Factor. Int. J. Mol. Sci. 2021, 22, 11541. [Google Scholar] [CrossRef] [PubMed]
  27. Thapa, S.P.; Coacker, G. Genome sequences of two Pseudomonas syringae pv. tomato race 1 strains, isolated from tomato fields in California. Genome Announc. 2016, 4, e01671-15. [Google Scholar] [CrossRef]
  28. Nicoletti, R.; Petriccione, M.; Curci, M.; Scortichini, M. Hazelnut-Associated Bacteria and Their Implications in Crop Management. Horticulturae 2022, 8, 1195. [Google Scholar] [CrossRef]
  29. Schenk, P.M.; Kazan, K.; Wilson, I.; Anderson, J.P.; Richmond, T.; Somerville, S.C.; Manners, J.M. Coordinated plant defense responses in Arabidopsis revealed by microarray analysis. Proc. Natl. Acad. Sci. USA 2000, 97, 11655–11660. [Google Scholar] [CrossRef]
  30. Martinez, C.; Blanc, F.; Le Claire, E.; Besnard, O.; Nicole, M.; Baccou, J.-C. Salicylic Acid and Ethylene Pathways Are Differentially Activated in Melon Cotyledons by Active or Heat-Denatured Cellulase from Trichoderma longibrachiatum. Plant Physiol. 2001, 127, 334–344. [Google Scholar] [CrossRef]
  31. Nguyen, Q.-M.; Iswanto, A.B.B.; Son, G.H.; Kim, S.H. Recent Advances in Effector-Triggered Immunity in Plants: New Pieces in the Puzzle Create a Different Paradigm. Int. J. Mol. Sci. 2021, 22, 4709. [Google Scholar] [CrossRef]
  32. Wang, S.; Wu, H.; Qiao, J.; Ma, L.; Liu, J.; Xia, Y.; Gao, X. Molecular mechanism of plant growth promotion and induced systemic resistance to Tobacco mosaic virus by Bacillus spp. J. Microbiol. Biotechnol. 2009, 19, 1250–1258. [Google Scholar] [CrossRef] [PubMed]
  33. Zhang, N.; Wang, D.; Liu, Y.; Li, S.; Shen, Q.; Zhang, R. Effects of different plant root exudates and their organic acid components on chemotaxis, biofilm formation and colonization by beneficial rhizosphere-associated bacterial strains. Plant Soil 2014, 374, 689–700. [Google Scholar] [CrossRef]
  34. Sharma, M.; Saleh, D.; Charron, J.-B.; Jabaji, S. A Crosstalk Between Brachypodium Root Exudates, Organic Acids, and Bacillus velezensis B26, a Growth Promoting Bacterium. Front. Microbiol. 2020, 11, 575578. [Google Scholar] [CrossRef]
  35. Grimm, A.C.; Harwood, C.S. Chemotaxis of Pseudomonas spp. to the polyaromatic hydrocarbon naphthalene. Appl. Environ. Microbiol. 1997, 63, 4111–4115. [Google Scholar] [CrossRef] [PubMed]
  36. Adler, J. A Method for Measuring Chemotaxis and Use of the Method to Determine Optimum Conditions for Chemotaxis by Escherichia coli. J. Gen. Microbiol. 1973, 74, 77–91. [Google Scholar] [CrossRef]
  37. Elsharkawy, M.M.; Khedr, A.A.; Mehiar, F.; El-Kady, E.M.; Baazeem, A.; Shimizu, M. Suppression of Pseudomonas syringae pv. tomato infection by rhizosphere fungi. Pest Manag. Sci. 2021, 77, 4350–4356. [Google Scholar] [CrossRef]
  38. Elsharkawy, M.M.; Shivanna, M.B.; Meera, M.S.; Hyakumachi, M. Mechanism of induced systemic resistance against anthracnose disease in cucumber by plant growth-promoting fungi. Acta Agric. Scand. Sect. B—Soil Plant Sci. 2015, 65, 287–299. [Google Scholar] [CrossRef]
  39. Sanchez-Ferrer, A.; Bru, R.; Cabanes, J.; Garcia-Carmona, F. Characterization of catacholase and cresolase activities of Monastrell grape polyphenol oxidase. Phytochemistry 1988, 27, 319–321. [Google Scholar] [CrossRef]
  40. Livak, K.J.; Schmittgen, T.D. Analysis of relative gene expression data using real-time quantitative PCR and the 2−ΔΔCT Method. Methods 2001, 25, 402–408. [Google Scholar] [CrossRef]
  41. Bais, H.P.; Weir, T.L.; Perry, L.G.; Gilroy, S.; Vivanco, J.M. The role of root exudates in rhizosphere interactions with plants and other organisms. Annu. Rev. Plant Biol. 2006, 57, 233–266. [Google Scholar] [CrossRef] [PubMed]
  42. Yaryura, P.M.; León, M.; Correa, O.S.; Kerber, N.L.; Pucheu, N.L.; García, A.F. Assessment of the Role of Chemotaxis and Biofilm Formation as Requirements for Colonization of Roots and Seeds of Soybean Plants by Bacillus amyloliquefaciens BNM339. Curr. Microbiol. 2008, 56, 625–632. [Google Scholar] [CrossRef]
  43. Kloepper, J.W.; Ryu, C.-M.; Zhang, S. Induced Systemic Resistance and Promotion of Plant Growth by Bacillus spp. Phytopathology 2004, 94, 1259–1266. [Google Scholar] [CrossRef] [PubMed]
  44. Ramamoorthy, V.; Viswanathan, R.; Raguchander, T.; Prakasam, V.; Samiyappan, R. Induction of systemic resistance by plant growth promoting rhizobacteria in crop plants against pests and diseases. Crop. Prot. 2001, 20, 1–11. [Google Scholar] [CrossRef]
  45. Vale, F.X.R.D.; Parlevliet, J.E.; Zambolim, L. Concepts in plant disease resistance. Fitopatol. Bras. 2001, 26, 577–589. [Google Scholar] [CrossRef]
  46. Pieterse, C.M.; Van Wees, S.C.; Hoffland, E. Systemic resistance in Arabidopsis induced by biocontrol bacteria is independent of salicylic acid accumulation and pathogenesis-related gene expression. Plant Cell 1996, 8, 1225–1237. [Google Scholar] [PubMed]
  47. De Meyer, G.; Audenaert, K.; Höfte, M. Pseudomonas aeruginosa 7NSK2-induced Systemic Resistance in Tobacco Depends on in planta Salicylic Acid Accumulation but is not Associated with PR1a Expression. Eur. J. Plant Pathol. 1999, 105, 513–517. [Google Scholar] [CrossRef]
Figure 1. Chemotactic response of the isolates B5 and B16 in response to 10-µL drops of malic and citric acids at concentrations of 100 mM using drop assay.
Microorganisms 11 01103 g001
Figure 2. Chemotactic response of PGPRs towards different concentrations of malic and citric acids evaluated by capillary assay. Columns with different letters are statistically different according to the Fisher’s LSD test (p ≤ 0.05).
Microorganisms 11 01103 g002
Figure 3. Induced suppression of disease symptoms (A) and number of Pst bacteria (B) in tomato plants in response to root treatment with PGPRs. Columns with different letters are statistically different according to the Fisher’s LSD test (p ≤ 0.05).
Microorganisms 11 01103 g003
Figure 4. Induced suppression of disease symptoms (A) and number of Pst bacteria (B) in tomato plants in response to dual treatments with PGPR and BABA. Columns with different letters are statistically different according to the Fisher’s LSD test (p ≤ 0.05).
Microorganisms 11 01103 g004
Figure 5. Real-time quantitative PCR analysis of the expression of PR1 (A), PR2 (B), LOX (C), and PAL (D) genes in tomato in control group, PGPR treated group, dual treatment with PGPR, and BABA and BABA alone treatment. Columns with different letters are statistically different according to the Fisher’s LSD test (p ≤ 0.05).
Microorganisms 11 01103 g005
Table 1. Forward and reverse primers sequence for pathogenesis-related genes.
GeneForward PrimerReverse PrimerSizeAccession Number
LePR1GCCAAGCTATAACTACGCTACCAACGCAAGAAATGAACCACCATCC139DQ159948
LePR2GGACACCCTTCCGCTACTCTTTGTTCCTGCCCCTCCTTTC81M80604
LeLOXATCTCCCAAGTGAAACACCACATCATAAACCCTGTCCCATTCTTC109U13681
LePALCTGGGGAAGCTTTTCAGAATCTGCTGCAAGTTACAAATCCAGAG150AW035278
LeUBI3TCCATCTCGTGCTCCGTCTGAACCTTTCCAGTGTCATCAACC144X58253
Table 2. Chemotactic response of PGPRs in drop assay in response to malic and citric acid.
StrainGenus SpeciesHost PlantChemotactic Activity
Malic AcidCitric Acid
N2Pseudomonas brassicacearumChinese chive++++
N6Pseudomonas brassicacearumChinese chive+++++
N12Pseudomonas brassicacearumChinese chive++++
N16Pseudomonas brassicacearumChinese chive++++++
N22Pseudomonas brassicacearumChinese chive+++
N27Pseudomonas brassicacearumChinese chive+++++
N32Pseudomonas brassicacearumChinese chive++++++
N37Pseudomonas delhiensisChinese chive++++
N39Pseudomonas fluorescensChinese chive++++
N42Pseudomonas stutzeriChinese chive+++++
N44Pseudomonas plecoglossicidaChinese chive++++
O10Pseudomonas vranovensisOnion++++
O26Pseudomonas umsongensisOnion++++++
O29Pseudomonas vranovensisOnion++++
O35Burkholderia cepaciaOnion++++++
O39Pseudomonas vranovensisOnion++++
O41Pseudomonas fulvalOnion++++
A5Pseudomonas resinovoransGarlic++++++
A6Pseudomonas vranovensisGarlic++++
A25Pseudomonas vranovensisGarlic++++++
A27Pseudomonas resinovoransGarlic+++++
A28Pseudomonas resinovoransGarlic++++++
A30Pseudomonas vranovensisGarlic+++++
A31Pseudomonas resinovoransGarlic++++
A33Pseudomonas resinovoransGarlic++++++
A47Pseudomonas resinovoransGarlic++++++
C1Pseudomonas putidaCucumber++++
C7Pseudomonas putidaCucumber+++
C14Pseudomonas putidaCucumber+++++
C21Pseudomonas putidaCucumber++++++
C27Pseudomonas putidaCucumber++++++
C33Pseudomonas putidaCucumber++++
C37Pseudomonas sp.Cucumber++++++
C40Pseudomonas putidaCucumber++++
C46Pseudomonas putidaCucumber+++++
T1Pseudomonas brassicacearumTomato+++
T5Pseudomonas putidaTomato++
T11Pseudomonas putidaTomato+++
T15Pseudomonas putidaTomato++++++
T21Pseudomonas fluorescensTomato+++
T26Pseudomonas brassicacearumTomato+++++
T28Pseudomonas alcaligenesTomato++++
T31Pseudomonas putidaTomato++++
T36Pseudomonas putidaTomato+++++
T41Pseudomonas putidaTomato++++
B1Pseudomonas resinovoransBulk soil++++++
B5Pseudomonas alcaligenesBulk soil+++
B6Pseudomonas pseudoalcaligenesBulk soil++
B11Pseudomonas citronellolisBulk soil++++++
B12Pseudomonas resinovoransBulk soil+++++
B13Pseudomonas resinovoransBulk soil+++++
B15Pseudomonas resinovoransBulk soil++++
B16Pseudomonas alcaligenesBulk soil+++
B19Pseudomonas resinovoransBulk soil+++
B22Pseudomonas resinovoransBulk soil++
B28Pseudomonas resinovoransBulk soil+++++
B29pseudomonas resinovoransBulk soil+++++
B30Pseudomonas aeruginosaBulk soil++++++
B32Pseudomonas resinovoransBulk soil++++
B36Pseudomonas resinovoransBulk soil+++++
B39Pseudomonas resinovoransBulk soil++++
B42Pseudomonas alcaligenesBulk soil+++
B43Pseudomonas panipatensisBulk soil++++
Table 3. Chemotactic response of PGPRs in response to low concentrations of malic and citric acid.
StrainGenus SpeciesHost PlantChemotactic Activity
Malic Acid mMCitric Acid mM
1105011050
N6Pseudomonas brassicacearumChinese chive+++++++++++++++
N16Pseudomonas brassicacearumChinese chive++++++++++
N32Pseudomonas brassicacearumChinese chive+++++++++++++++
N42Pseudomonas stutzeriChinese chive+++++++++++++++++
O26Pseudomonas umsongensisOnion++++++++++++++++
O35Bacillus cepaciaOnion++++++++++++++++
A5Pseudomonas resinovoransGarlic+++++++++++++++++
A28Pseudomonas resinovoransGarlic++++++++++++++++
A30Pseudomonas vranovensisGarlic++++++++++++++++
A33Pseudomonas resinovoransGarlic++++++++++++
A47Pseudomonas resinovoransGarlic++++++++++++++++
C21Pseudomonas putidaCucumber+++++++++++++++
C27Pseudomonas putidaCucumber++++++++++++++++
C37Pseudomonas sp.Cucumber++++++++++++
T15Pseudomonas putidaTomato++++++++++++++++
B11Pseudomonas citronellolisBulk soil++++++++++++
B30Pseudomonas aeruginosaBulk soil+++++++++++++++++
B5Pseudomonas alcaligenesBulk soil++++++++
B16Pseudomonas alcaligenesBulk soil++++++++
Table 4. Activity of peroxidase and polyphenol oxidase enzymes (mg/mL−1) on tomato leaves that were treated by PGPRs.
TreatmentsPeroxidasePolyphenol Oxidase
3DPI6DPI3DPI6DPI
O2650.9b38.9a25.3b22.4b
A554.8a39.5a29.7a25.2a
A3051.2b35.6b24.9b21.9b
A2846.3c31.5c20.8c17.4c
A3356.1a41.1a30.2a25.4a
A4755.3a40.5a29.9a24.8a
N651.5b35.9b25.3b21.8b
N3251.3b36.1b25.4b22.2b
N4255.1a39.8a30.5a25.6a
T1555.9a40.7a30.1a25.3a
C2145.9c30.4c19.9c15.7d
B3046.1c31.2c20.6c15.4d
B540.4d26.3d19.8c14.9d
B1641.9d25.9d20.3c15.3d
Control19.1e18.6e8.9d8.9e
Different letters indicate significant difference to the Fisher’s LSD test (p ≤ 0.05).
Table 5. Activity of peroxidase and polyphenol oxidase enzymes (mg/mL−1) on tomato leaves that were treated by PGPRs and BABA.
TreatmentsPeroxidasePolyphenol Oxidase
3DPI6DPI3DPI6DPI
O26 + BABA60.6b*44.6b35.3c32.7c
A5 + BABA66.7a45.3b39.9b32.5c
A30 + BABA59.1b39.8c34.8c29.4d
A33 + BABA65.7a45.6b35.1c30.2d
A47 + BABA65.9a45.1b41.2a36.3b
N6 + BABA60.4b41.1c34.3c30.8d
N32 + BABA67.3a49.2a41.5a37.9b
N42 + BABA66.1a40.9c34.3c30.5d
T15 + BABA66.0a49.4a45.4a41.1a
BABA54.2c33.2d31.5e27.9e
Control21.3d17.2e9.5f9.1f
* Different letters indicate significant difference to the Fisher’s LSD test (p ≤ 0.05).
Table 6. Effects of PGPRs on tomato growth and yield under field conditions.
TreatmentsMorphological and Physiological Characters
Plant Height (cm)Leaf Area (cm)No. of BranchesFresh Weight (g)Dry Weight (g)Chlorophyll ContentsNo. of FlowersNo. of FruitsWeight of Fruits/Plant
O2675.0e*225.4d20.0c417.3d65.5c44.7b105.2b34.6a4.6b
A592.1b277.8b24.2b449.0b76.3a48.3a116.9a42.8a5.8a
A3091.3b273.5c23.9b447.9b76.2a47.6a113.938.5b5.7a
A2879.4c226.4d20.4c427.5c68.6b45.1b105.8b35.1c4.7b
A3380.2c226.7d21.1c428.2c69.2b45.3b104.1b35.7c4.9b
A4792.3b278.1b24.1b449.2b77.1a48.3a117. 3a42.9a5.9a
N691.9b276.9b23.4b448.7b76.9a48.1a117.8a42.6a5.9a
N3262.7f192.4e16.5d337.9e52.8b39.1c99.3c23.2b4.0c
N4296.5a281.7a26.2a452.1a78.3a48.7a117.4a43.0a6.0a
T1597.6a281.9a25.9a451.9a78.1a49.1a118.1a43.5a6.2a
C2192.3b277.3a25.2a451.7a76.9a47.5a117.9a42.6a5.9a
B3078.4d226.7d20.6c428.3c68.5b45.2b104.8b34.8c4.6b
B563.7f193.1e17.2d339.0e53.3d38.6c97.9c29.7d4.1c
B1662.9f194.2e17.0d338.4e52.9d39.1c98.2c29.9d4.2c
Control49.5g119.2f13.5e244.0f38.1e35.5d78.4d20.6e3.3d
* Different letters indicate significant difference to the Fisher’s LSD test (p ≤ 0.05).
Table 7. Effects of PGPRs on quality of tomato fruits.
TreatmentsData Analysis
AcidityTotal Soluble Solids (TSS)%Vitamin C mg/100 g
O260.53b*4.76b13.14b
A50.58a5.22a13.54ab
A300.57a5.19a13.49ab
A280.54b4.69b13.19b
A330.52b4.75b13.09b
A470.58a4.78b13.63a
N60.58a4.73b13.72a
N320.49c4.81b12.63c
N420.59a5.19a13.69a
T150.58a5.21a13.73a
C210.57a5.18a13.62a
B300.53b4.79b13.17b
B50.48c4.75b12.59c
B160.46c4.73b12.68c
Control0.47c4.69b12.02d
* Different letters indicate significant difference to the Fisher’s LSD test (p ≤ 0.05).
Disclaimer/Publisher’s Note: The statements, opinions and data contained in all publications are solely those of the individual author(s) and contributor(s) and not of MDPI and/or the editor(s). MDPI and/or the editor(s) disclaim responsibility for any injury to people or property resulting from any ideas, methods, instructions or products referred to in the content.

