Article

Microbiota Phenotype Promotes Anastomotic Leakage in a Model of Rats with Ischemic Colon Resection

1
Colorrectal Unit, Clínica Las Condes, Santiago 13114, Chile
2
Programa de Microbiología y Micología, Instituto de Ciencias Biomédicas, Facultad de Medicina, Universidad de Chile, Santiago 8380453, Chile
3
Marine Microbiology Group, Department of Animal and Microbial Diversity, IMEDEA (CSIC-UIB), 07190 Esporles, Illes Balears, Spain
4
Centro de Cáncer, Clínica Universidad de los Andes, Santiago 7591047, Chile
5
Instituto Milenio de Inmunología e Inmunoterapia, Facultad de Medicina, Universidad de Chile, Santiago 8380453, Chile
*
Author to whom correspondence should be addressed.
These authors contributed equally to this work.
Microorganisms 2023, 11(3), 680; https://doi.org/10.3390/microorganisms11030680
Submission received: 30 December 2022 / Revised: 16 February 2023 / Accepted: 20 February 2023 / Published: 7 March 2023
(This article belongs to the Special Issue Gut Microbiota: Health, Clinical & Beyonds)

Abstract

:
Anastomotic leakage (AL) is a major cause of morbidity and mortality after colorectal surgery, but the mechanism behind this complication is still not fully understood. Despite the advances in surgical techniques and perioperative care, the complication rates have remained steady. Recently, it has been suggested that colon microbiota may be involved in the development of complications after colorectal surgery. The aim of this study was to evaluate the association of gut microbiota in the development of colorectal AL and their possible virulence strategies to better understand the phenomenon. Using 16S rRNA sequencing of samples collected on the day of surgery and the sixth day following surgery, we analyzed the changes in tissue-associated microbiota at anastomotic sites created in a model of rats with ischemic colon resection. We discovered a trend for lower microbial diversity in the AL group compared to non-leak anastomosis (NLA). There were no differences in relative abundance in the different types of microbial respiration between these groups and the high abundance of the facultative anaerobic Gemella palaticanis is a marker species that stands out as a distinctive feature.

1. Introduction

Anastomotic leak (AL) is a devastating complication of colorectal surgery that has many consequences and exposes the patient to a high risk of morbidity and mortality. Despite technological advances, AL continues to occur at an unacceptable rate in terms of procedural efficacy.
Colorectal resection is a common surgical procedure performed on thousands of patients. The global incidence of colorectal AL varies widely in the available literature, ranging between 1 and 24% [1]. The incidence of AL after a rectum resection can be as high as 50% if asymptomatic AL diagnosed by images is included [2,3].
This complication has many negative implications, contributing to an increased hospital stay and a mortality rate as high as 10–16% [4,5]. To prevent the devastating consequences of AL, most surgeons perform a derivative ostomy during the resection surgery. In a study of 1066 patients who underwent rectal surgery, a derivative ostomy was performed in 70% of cases [6]. This study also showed that derivation does not prevent AL but does reduce the severity of the event. The problem with this practice, which is usually temporary, is that on a significant number of occasions, it ends up being a definitive solution [7,8].
Regarding the long-term oncological outcomes, a systematic review and meta-analysis assess the impact of AL [9]. The authors concluded that AL has a negative effect after a previous oncological resection of the rectum on local recurrence and specific survival, but not on distant recurrence.
A recent study that analyzed the factors associated with AL concluded that there is no evidence to support poor irrigation of the anastomosis, increased anastomotic tension, different surgical techniques, and preoperative radiotherapy resulting in an alteration in the anastomosis healing [10]. Therefore, to date, the pathophysiology of this postoperative complication is not yet fully understood.
Some studies have evaluated the interaction of microorganisms in the healing of intestinal anastomosis. The original research exploring microbiota’s effects in AL was conducted in 1955 [11]. An animal (dog) model was used, and ischemic colon anastomosis was performed; the half that received enteral antibiotics showed complete anastomosis healing compared to the control group, which later developed AL, peritonitis, and death.
Although previous studies provide evidence for the hypothesis that the microbiota may have a causal role in the AL, how these pathogens colonize the gastrointestinal lumen is unknown [12]. To understand how the normal intestinal microbiota change in response to surgical intervention, a research group used sequencing of 16S rRNA to characterize changes in a rat model with partial colectomy and anastomosis [12]. This study observed an increase in the relative abundance of 500-fold and 200-fold of Enterococcus and Escherichia/Shigella, respectively, using a comparison in the anastomotic tissue on the seventh postoperative day compared to day zero. This difference was observed by analyzing the intestinal tissue after creating the anastomosis, suggesting that certain bacteria develop an adhesive phenotype, thereby facilitating certain pathogenic microorganisms to adhere to the new anastomosis.
More recently, Shogan et al. attempt to clarify the molecular mechanism by which bacteria may be involved in AL in a rat model [13]. They demonstrated that the commensal bacterium Enterococcus faecalis enhanced collagen-degrading activity and also increased the ability to activate host matrix metalloprotease-9 (MMP9) in intestinal tissues through gelatinase E (gelE) and serine protease (sprE). Moreover, the authors demonstrated that in stool cultures of human patients who underwent colon resections, there is the presence of E. faecalis and other bacteria with collagen-degrading phenotype. In this same sense, Jacobson et al. demonstrated an additional mechanism of collagenolytic virulence by which E. faecalis is able to bind to and locally activate the fibrinolytic protease plasminogen (PLG). Activation depends on the binding of alpha-enolase on the surface of E. faecalis (and probably other as yet unidentified receptors) to PLG, leading to supraphysiological collagen degradation [14].
Despite these advances, the incidence of surgical complications persists, and AL is associated with a substantial risk of death and is still not fully understood. Achieving the above would require a better characterization of the microbiome and the interaction with the host to understand which bacteria are associated, how it or they act postoperatively, and how we can prevent the AL associated with microbiota changes. In this sense, to identify the bacteria that colonize ischemic tissues in AL and the possible associated virulence mechanisms, we examined the microbiota using 16S rRNA analysis in rats 6 days after surgery. As a novelty, the complete 16S rRNA gene was sequenced using PacBio, which, unlike partial 16S rRNA sequencing technologies such as Illumina, provides maximum taxonomic resolution when identifying bacteria at the species taxonomic level [15]. Thus, this study seeks to shed light on the bacteria involved in AL and their possible virulence strategies to better understand the phenomenon.

2. Materials and Methods
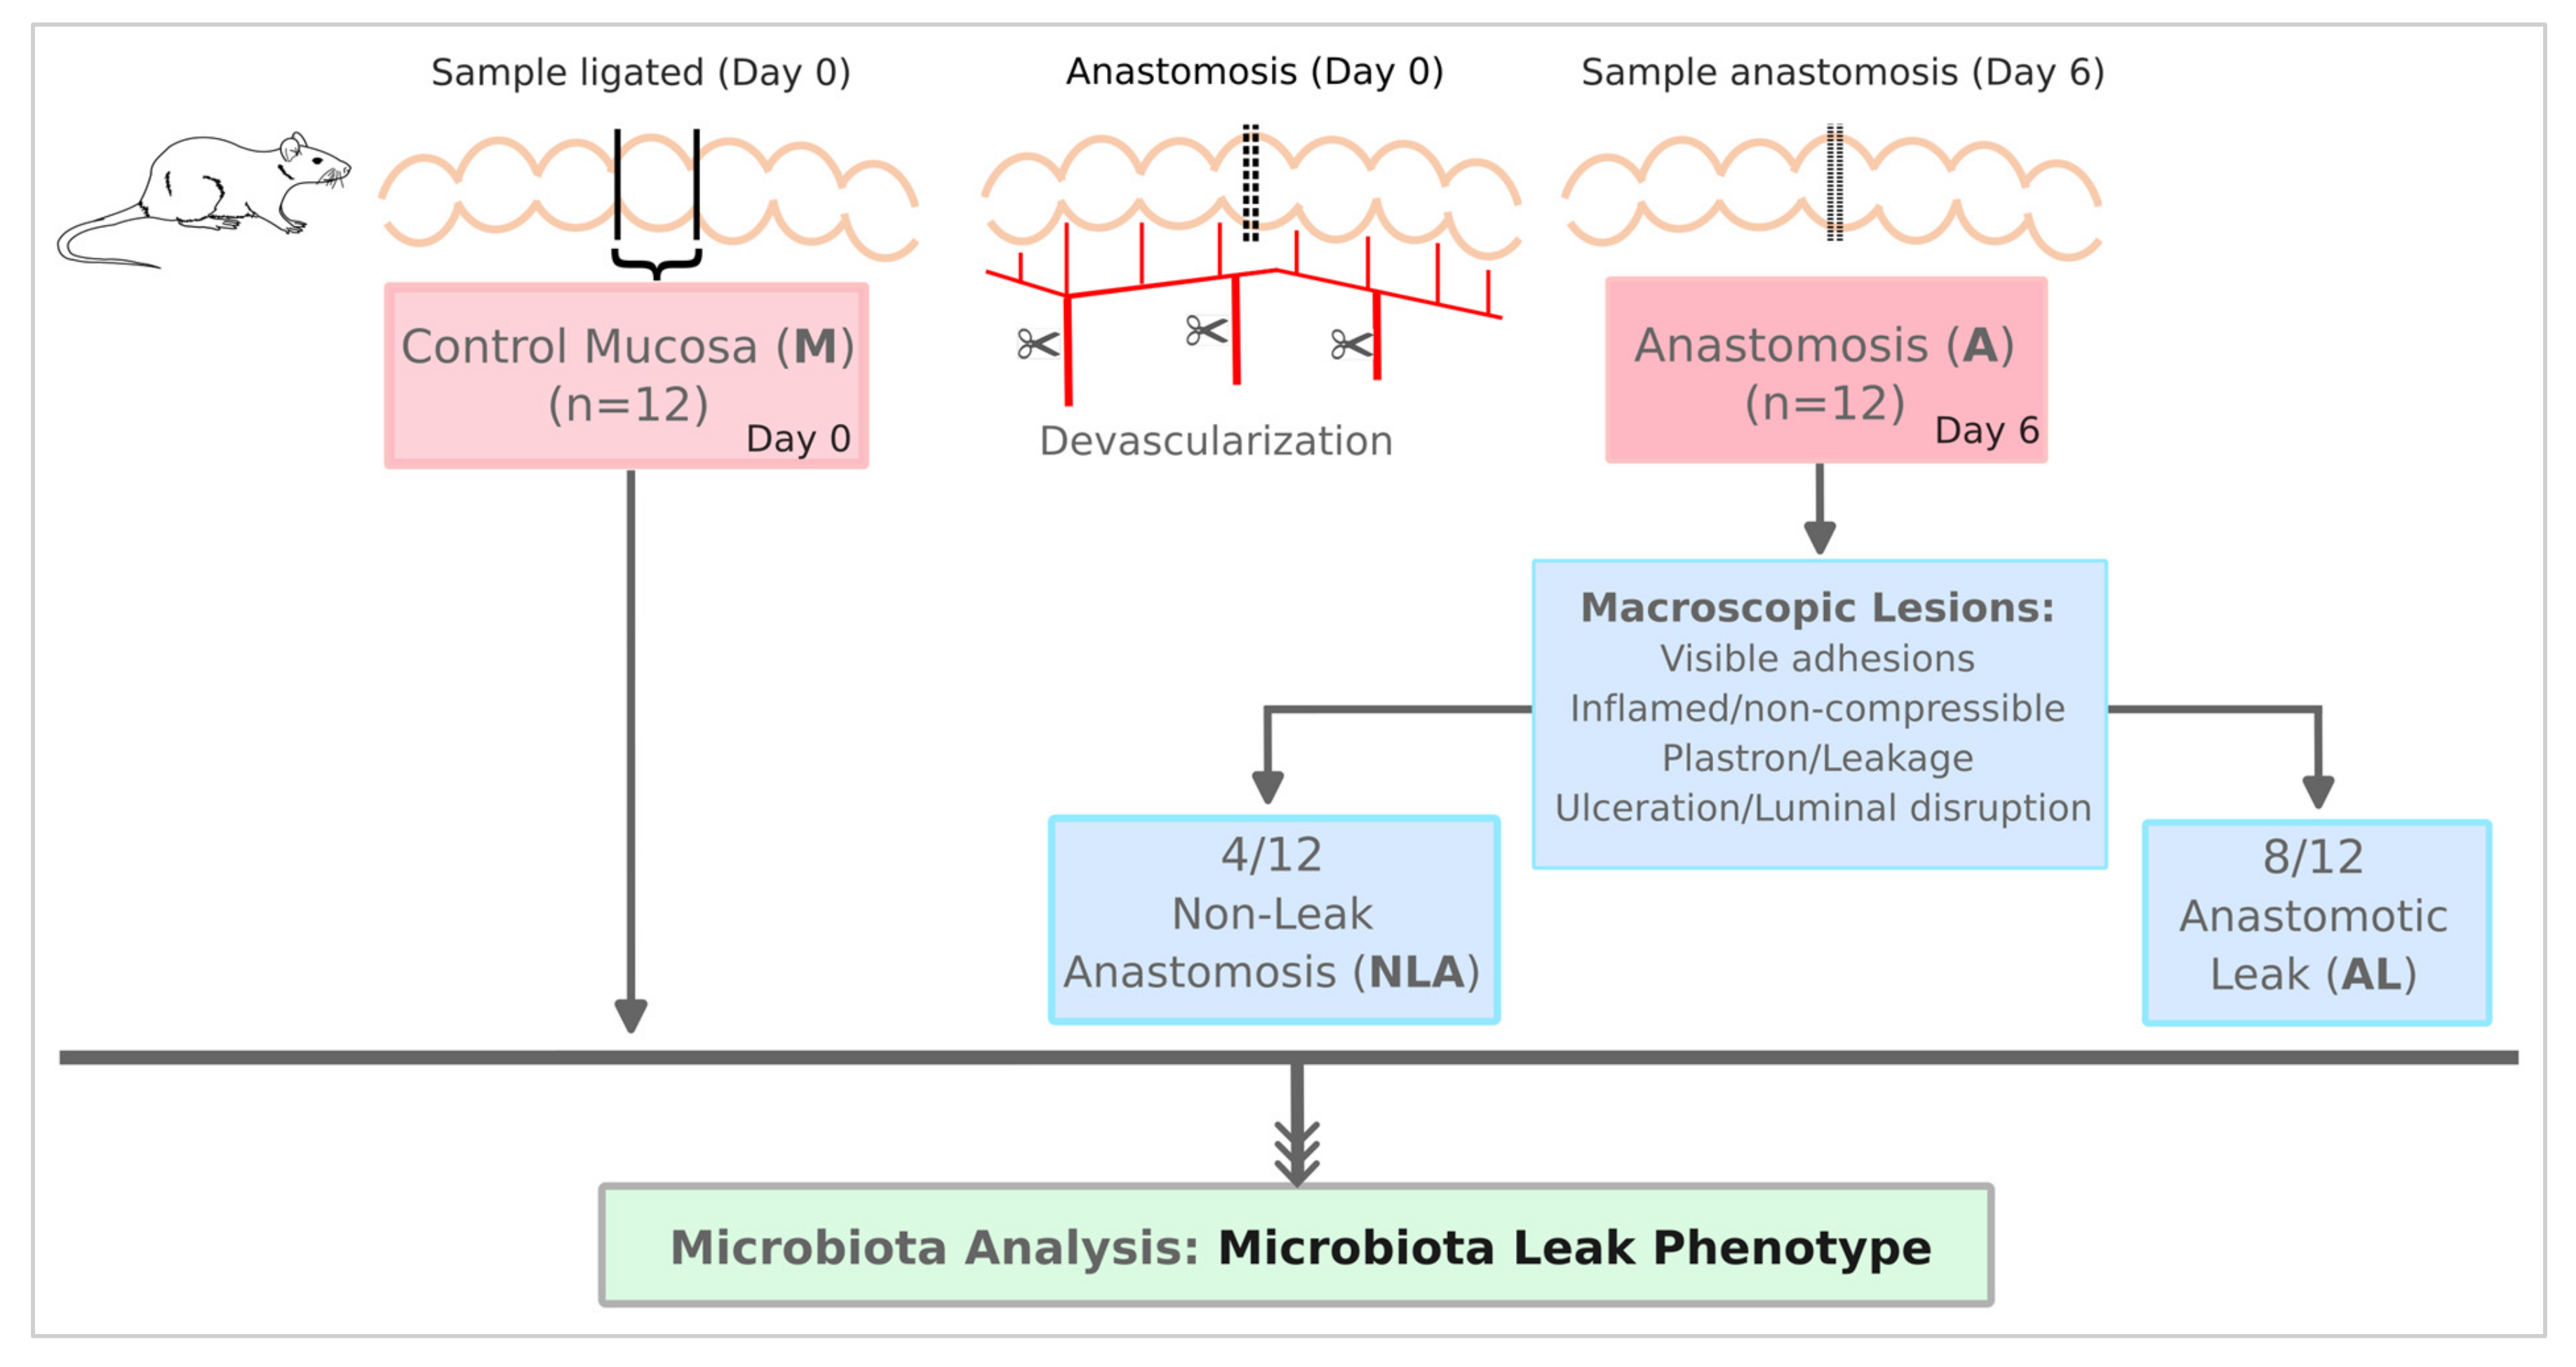
2.1. Animal Model

Adult Sprague Dawley male rats weighing 250–300 g were used for all experiments and were allowed food and water ad libitum. The rats were kept in a ventilated place with one rat per cage, with controlled temperature and humidity. Animals were removed from the cage only for surgery. A group of 6 rats was used to evaluate the safety and reproducibility of the technique and the same surgeon performed all the procedures. Then, the previously described anastomosis with devascularization [13] was performed on a group of 12 rats. In addition, the same 12 rats were used as controls without intervention: prior to performing the anastomosis and the opening of the gut, a segment of colon was obtained with the two ends ligated, taking care to keep this segment as airtight as possible. All animals were euthanized on the sixth postoperative day to assess the integrity of the anastomosis.
For surgery, the rats were sedated with 40–80 mg/kg ketamine and 5–10 mg/kg intraperitoneal xylazine and operated on using an aseptic technique. A laparotomy was performed, followed by a 0.5 cm distal colon resection with a rectosigmoid termino-terminal anastomosis using 12 stitches of non-absorbable 6–0 interrupted monofilament. The distal resection area was located 1 cm from the peritoneal reflection. The adjacent mesentery was divided 1 cm above and 1 cm below the anastomosis to perform anastomosis devascularization. The airtightness was then verified using a physiological serum test.
To evaluate non-leak anastomosis (NLA) during the autopsy, it was considered that the anastomosis had to be completely intact, virtually free of adhesions, free of stenosis or inflammation (mild and compressible), and free of proximal intestine dilatation. On the other hand, those with anastomotic leak (AL) had to meet certain criteria: (1) visible adhesions to the anastomotic line, including adjacent organs; (2) compression with a cotton swab showed the anastomosis felt hard, inflamed, and incompressible; (3) dissection of the anastomotic site in the presence of a plastron with adjacent organs revealed an evident disruption or leakage of purulent content; and (4) opening of the anastomosis showed ulceration or luminal disruption. The protocol was approved by the Ethics Committee of Clínica Las Condes, Santiago, Chile.

2.2. Sample Processing

Total DNA was extracted from biopsy samples using the EZNA DNA/RNA Isolation kit (Omega-Bio-Tek, Norcross GA, USA) following the manufacturer’s recommendations. One extracted aliquot per sample was shipped to MR DNA (Molecular Research LP, Shallowater, TX, USA) for 16S rRNA gene library construction and sequencing.

2.3. Primers, 16S rRNA Amplification, and Sequencing Procedure

Primers GM3 (5′-AGAGTTTGATCMTGGC-3′) and 23S1 (5′-GGGTTTCCCCATTCGGAAATC-3′) with a unique barcode linked to the forward primer were used in the amplification of the target sequence. These primers comprise the complete 16S rRNA gene plus the contiguous internal transcribed spacer (ITS) located between 16S and 23S rRNA genes, a region with a high degree of variability, allowing for additional analysis on relatedness and discrimination of intra-species diversity [16]. A 35-cycle PCR (5 for PCR products) was performed using the HotStarTaq Plus Master Mix Kit (Qiagen, MD, USA). PCR settings were 94 °C for 3 min, then 35 cycles of 94 °C for 30 s, 53 °C for 40 s, and 72 °C for 90 s, with a final elongation step of 72 °C for 5 min. The amplification performance was inspected in 2% agarose gel to examine the relative intensities of the PCR products. Next, various samples were joined together in equal parts based on their molecular weight and DNA concentrations. The PCR pool was purified using Ampure PB beads (Pacific Biosciences, Menlo Park, CA, USA). The SMRTbell library preparation was accomplished using the SMRTbell® Express Template Prep Kit 2.0 following the user guide. Finally, the sequencing process was completed at MR DNA (www.mrdnalab.com accessed on 30 January 2022, Shallowater, TX, USA) on the PacBio Sequel platform following the manufacturer’s guidelines.

2.4. Processing and OTU (Operational Taxonomic Units) Grouping

After finalizing the initial DNA sequencing, the library underwent a second analysis, Circular Consensus Sequencing (CCS), using PacBio’s CCS algorithm (SMRT Link 9.0.0.92188). The CCS algorithm aligns the subreads individually from each amplicon to generate consensus sequences, allowing the correction of stochastic errors caused in the first analysis. Sequence data were processed using the MR DNA analysis pipeline (MR DNA, Shallowater, TX, USA). In short, barcodes were separated from the CCS sequencing data, then oriented 5′ to 3′, and sequences < 150 bp were removed. Chimera removal and de novo OTU clustering were carried out using the USEARCH v.7 software package. Operational taxonomic units were defined by grouping sequences at a similarity threshold of 99%.

2.5. Phylogenetic Affiliation and OPU (Operational Phylogenetic Unit) Clustering

OTU representative sequences were included in the nonredundant Silva 138 database using the ARB program package [17,18]. Sequences were aligned using SINA (SILVA Incremental Aligner) [19] and then added to a preexisting tree to choose the closest relatives and generate a phylogenetic tree reconstructed by neighbor-joining. The tree was modified using the parsimony tool to optimize the branching order. Finally, the parsimony tree was manually curated to obtain OPUs.
An OPU is the smallest monophyletic clade clustering OTU representatives and their closest reference sequence. Where feasible, OPUs included a type strain as a reference sequence. When this was not possible, other available databases were consulted. For identity values >98.7% containing a type strain sequence, reads were considered as belonging to the same species. When identity values were <98.7 and >94.5% with the closest relative type strain, reads were different unclassified species of the same genus [20]. This focus uses phylogenetic inference rather than clustering by sequence identity to show diversity measures as group sequences in lineages that approach the species thresholds with a more robust view of microbial diversity [21].

2.6. Alpha Diversity, Beta Diversity, Comparative, and Statistical Analyses

Alpha diversity indices and rarefaction curves were calculated using the PAST software v4.05 [22] on bacterial reads of each sample. For data analysis, OPUs harboring <2 sequences and those occurring in a single sample were removed for beta diversity analysis and comparative analysis. Data scaling was performed by the total sum scaling (TSS) method, transforming raw reads into relative abundances by dividing the number of reads of an OPU in each sample by the total number of reads. The MicrobiomeAnalyst web-based tool [23] was used to conduct the OPU profile analyses at different taxonomic levels and the β-diversity analyses (PCoA, HeatTree, LEfSe, and correlations network). The options and parameters selected can be found in the description of each figure. The annotation of microbial respiration was generated manually, using information from SILVA references [18] and papers related to the description of each species). Venn diagrams were carried out with the “InteractiVenn” web application [24]. Statistical differences between groups were performed utilizing the stats v4.1.2 R package [25]. Normality and homoscedasticity were checked. Then, parametric or non-parametric tests were performed. For post hoc pairwise comparisons, a Bonferroni- or Tukey-adjusted test was performed.

3. Results

3.1. Samples, Sequences, and OPUs Distribution

A total of 12 rats underwent surgery and 24 samples were analyzed, with 12 being control mucosa samples (M) and 12 being experimental anastomosis samples (A). Of these, 4 were classified as NLA and 8 as AL (Figure 1). A process control sample was also included (without a piece of tissue). A total of 349,633 reads were obtained that grouped into OTUs at 99% sequence identity, yielding 2484 different OTUs, with an average of 201 (±154) OTUs for control samples and 145 (±68) OTUs for anastomosis samples. Among the samples of the anastomosis group, a total of 175 (±115) OTUs were obtained for the NLA samples and 130 (±27) OTUs for the AL samples. Finally, a total of 317 different OPUs were generated by phylogenetic inference using OTU representatives, with an average of 39 (±28) OPUs for control samples and 53 (±29) OPUs for experimental samples. Among the samples of the anastomosis group, a total of 70 (47±) OPUs were obtained for the NLA samples and 45 (±12) OPUs for the AL samples (Table S1).
After removing OPUs with identical values (zeroes) in all samples, as well as OPUs appearing in only one sample (considered artifacts), the data set was reduced from 317 to 169 total OPUs (Table S1). Of these, 106 OPUs (62.7%) were shared between control and anastomosis samples, 18 OPUs (10.7%) were present exclusively in control samples, and 45 OPUs (26.6%) were present only in anastomosis samples (Figure S1A). When analyzing samples within the anastomosis group, 105 OPUs (69.5%) were shared between NLA and AL samples, 30 OPUs (19.9%) were present exclusively in NLA samples, and 16 OPUs (10.6%) were present only in AL samples (Figure S1B). This accounts for a lower diversity of OPUs in the AL group than in the NLA group.

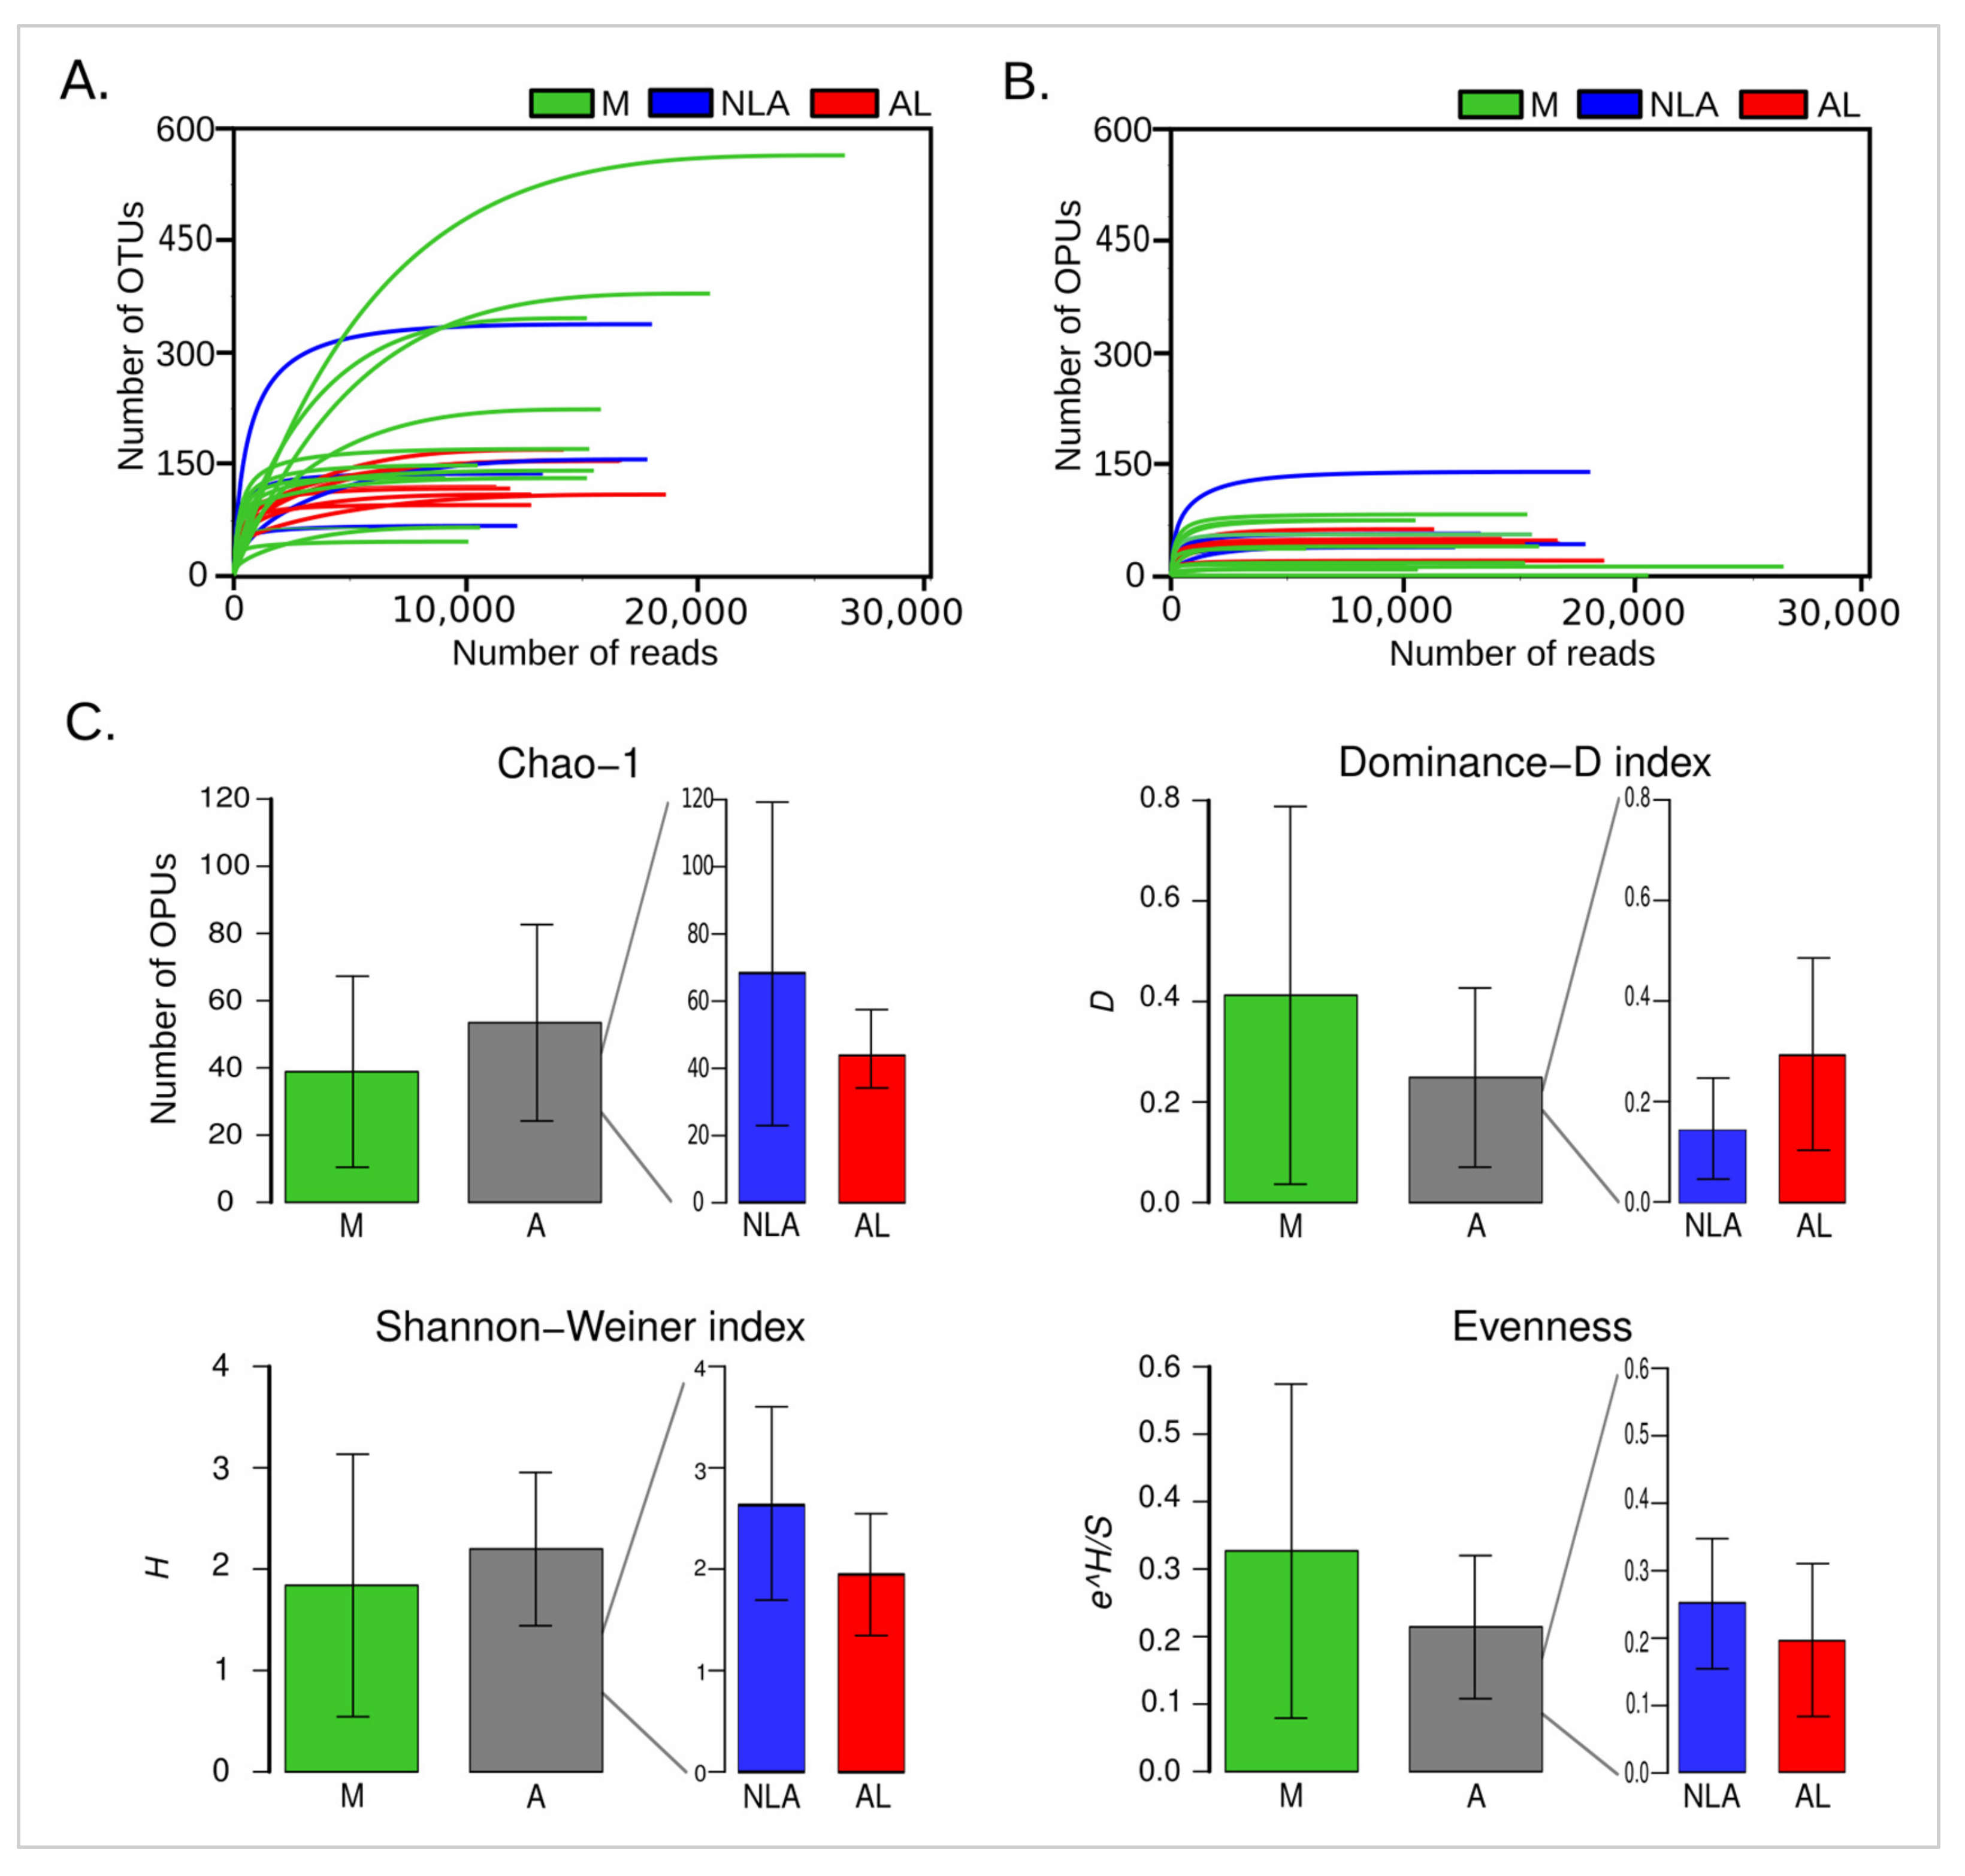
3.2. Alpha Diversity Involvement in Anastomotic Leak

Diversity represents the number of species and their distribution, described in terms of alpha diversity as the different species found within a sample. This diversity is believed to contribute to greater stability of an individual’s microbiome [26], which may protect against external-induced change. Accordingly, we analyzed the alpha diversity and its variation in the animals that underwent surgery.
In Figure 2A,B, rarefaction curves are shown for the number of OTUs, OPUs, and reads analyzed. The OTU approach (Figure 2A) showed rarefaction curves that saturated later than the OPU rarefaction curves (Figure 2B), indicating that the traditional OTU approach may overestimate diversity [20]. Both the OTU (Figure 2A) and OPU (Figure 2B) graphs show that the samples reach the sequencing plateau, though the OPU approach does so earlier. It is noted that the sequencing depth was optimal, particularly when analyzing the rarefaction curves of the OPU approach, indicating that the greatest diversity of samples was recovered. It should be noted that the values of Chao-1, which represents the number of estimated OPUs (Table S2), and the number of observed OPUs (Table S1) for all samples analyzed coincide, indicating again the optimal sequencing depth obtained for all libraries.
When the control (M) and experimental anastomosis (A) groups were analyzed, it was found that they both had similar alpha diversity indices, without showing significant differences. The same happens when analyzing the NLA and AL groups (Figure 2C, Table S2). Even when comparing the three groups, M, NLA, and AL, no differences were observed. Despite this, a trend towards a lower presence of estimated OPUs in Chao-1 can be observed for the AL group when compared to the NLA group. In addition to this, there is also a trend towards greater dominance and less heterogeneity in AL given the Shannon–Weiner Index. Finally, lower values for the AL group can be seen in evenness, indicating a less uniform distribution of species (OPUs). All these results show us a tendency for less diversity in the AL samples.
These results are in line with what was previously described, where low diversity has been observed in the microbiota of the anastomotic tissue that develops AL [27,28,29]. This may be so because reduced diversity may be associated with an increase in undesirable microbiota and a decrease in beneficial microbiota, resulting in compromised intestinal resistance [30]. It is well known that the microbiota serves the host in different ways, such as the competitive exclusion of pathogens or digesting complex carbohydrates to produce the SCFAs (short-chain fatty acids) needed as energy sources for the enterocyte [31,32], among others. Thus, in the same way, in inflammatory bowel disease, reduced bacterial diversity is described [33], which affects the ability of the intestinal microbiome to maintain a normal profile thanks to the services provided by the bacterial community.

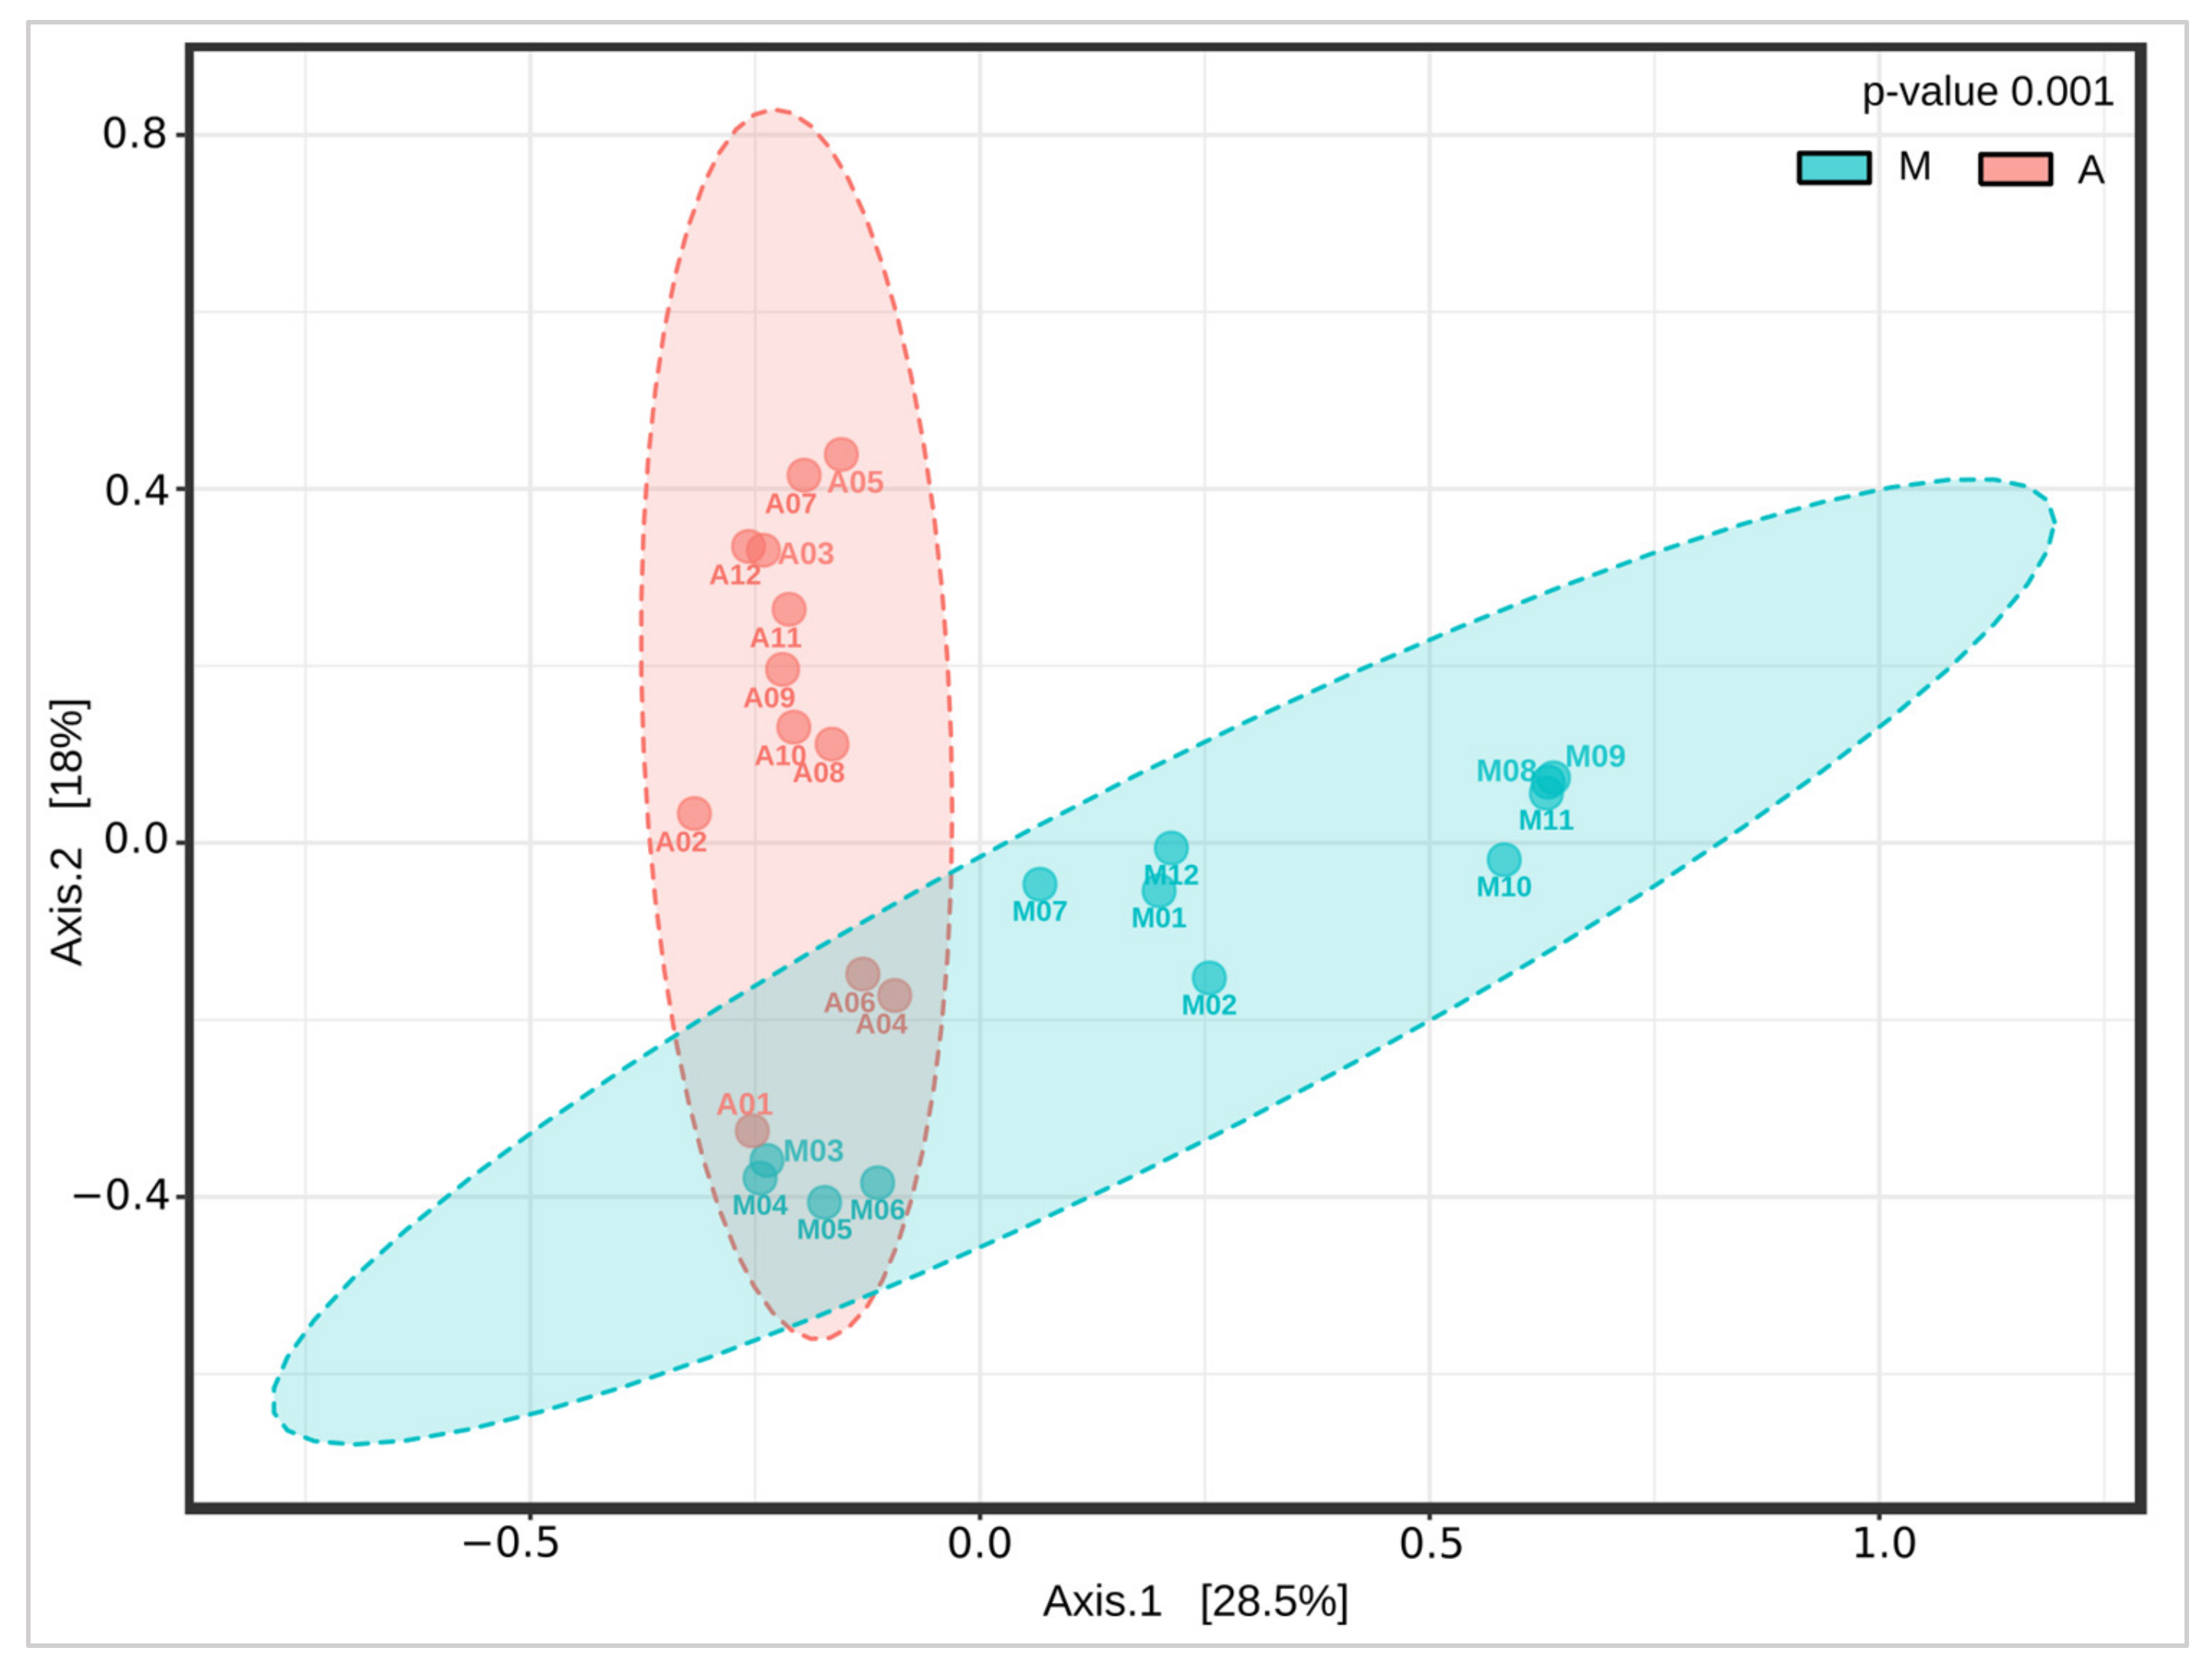
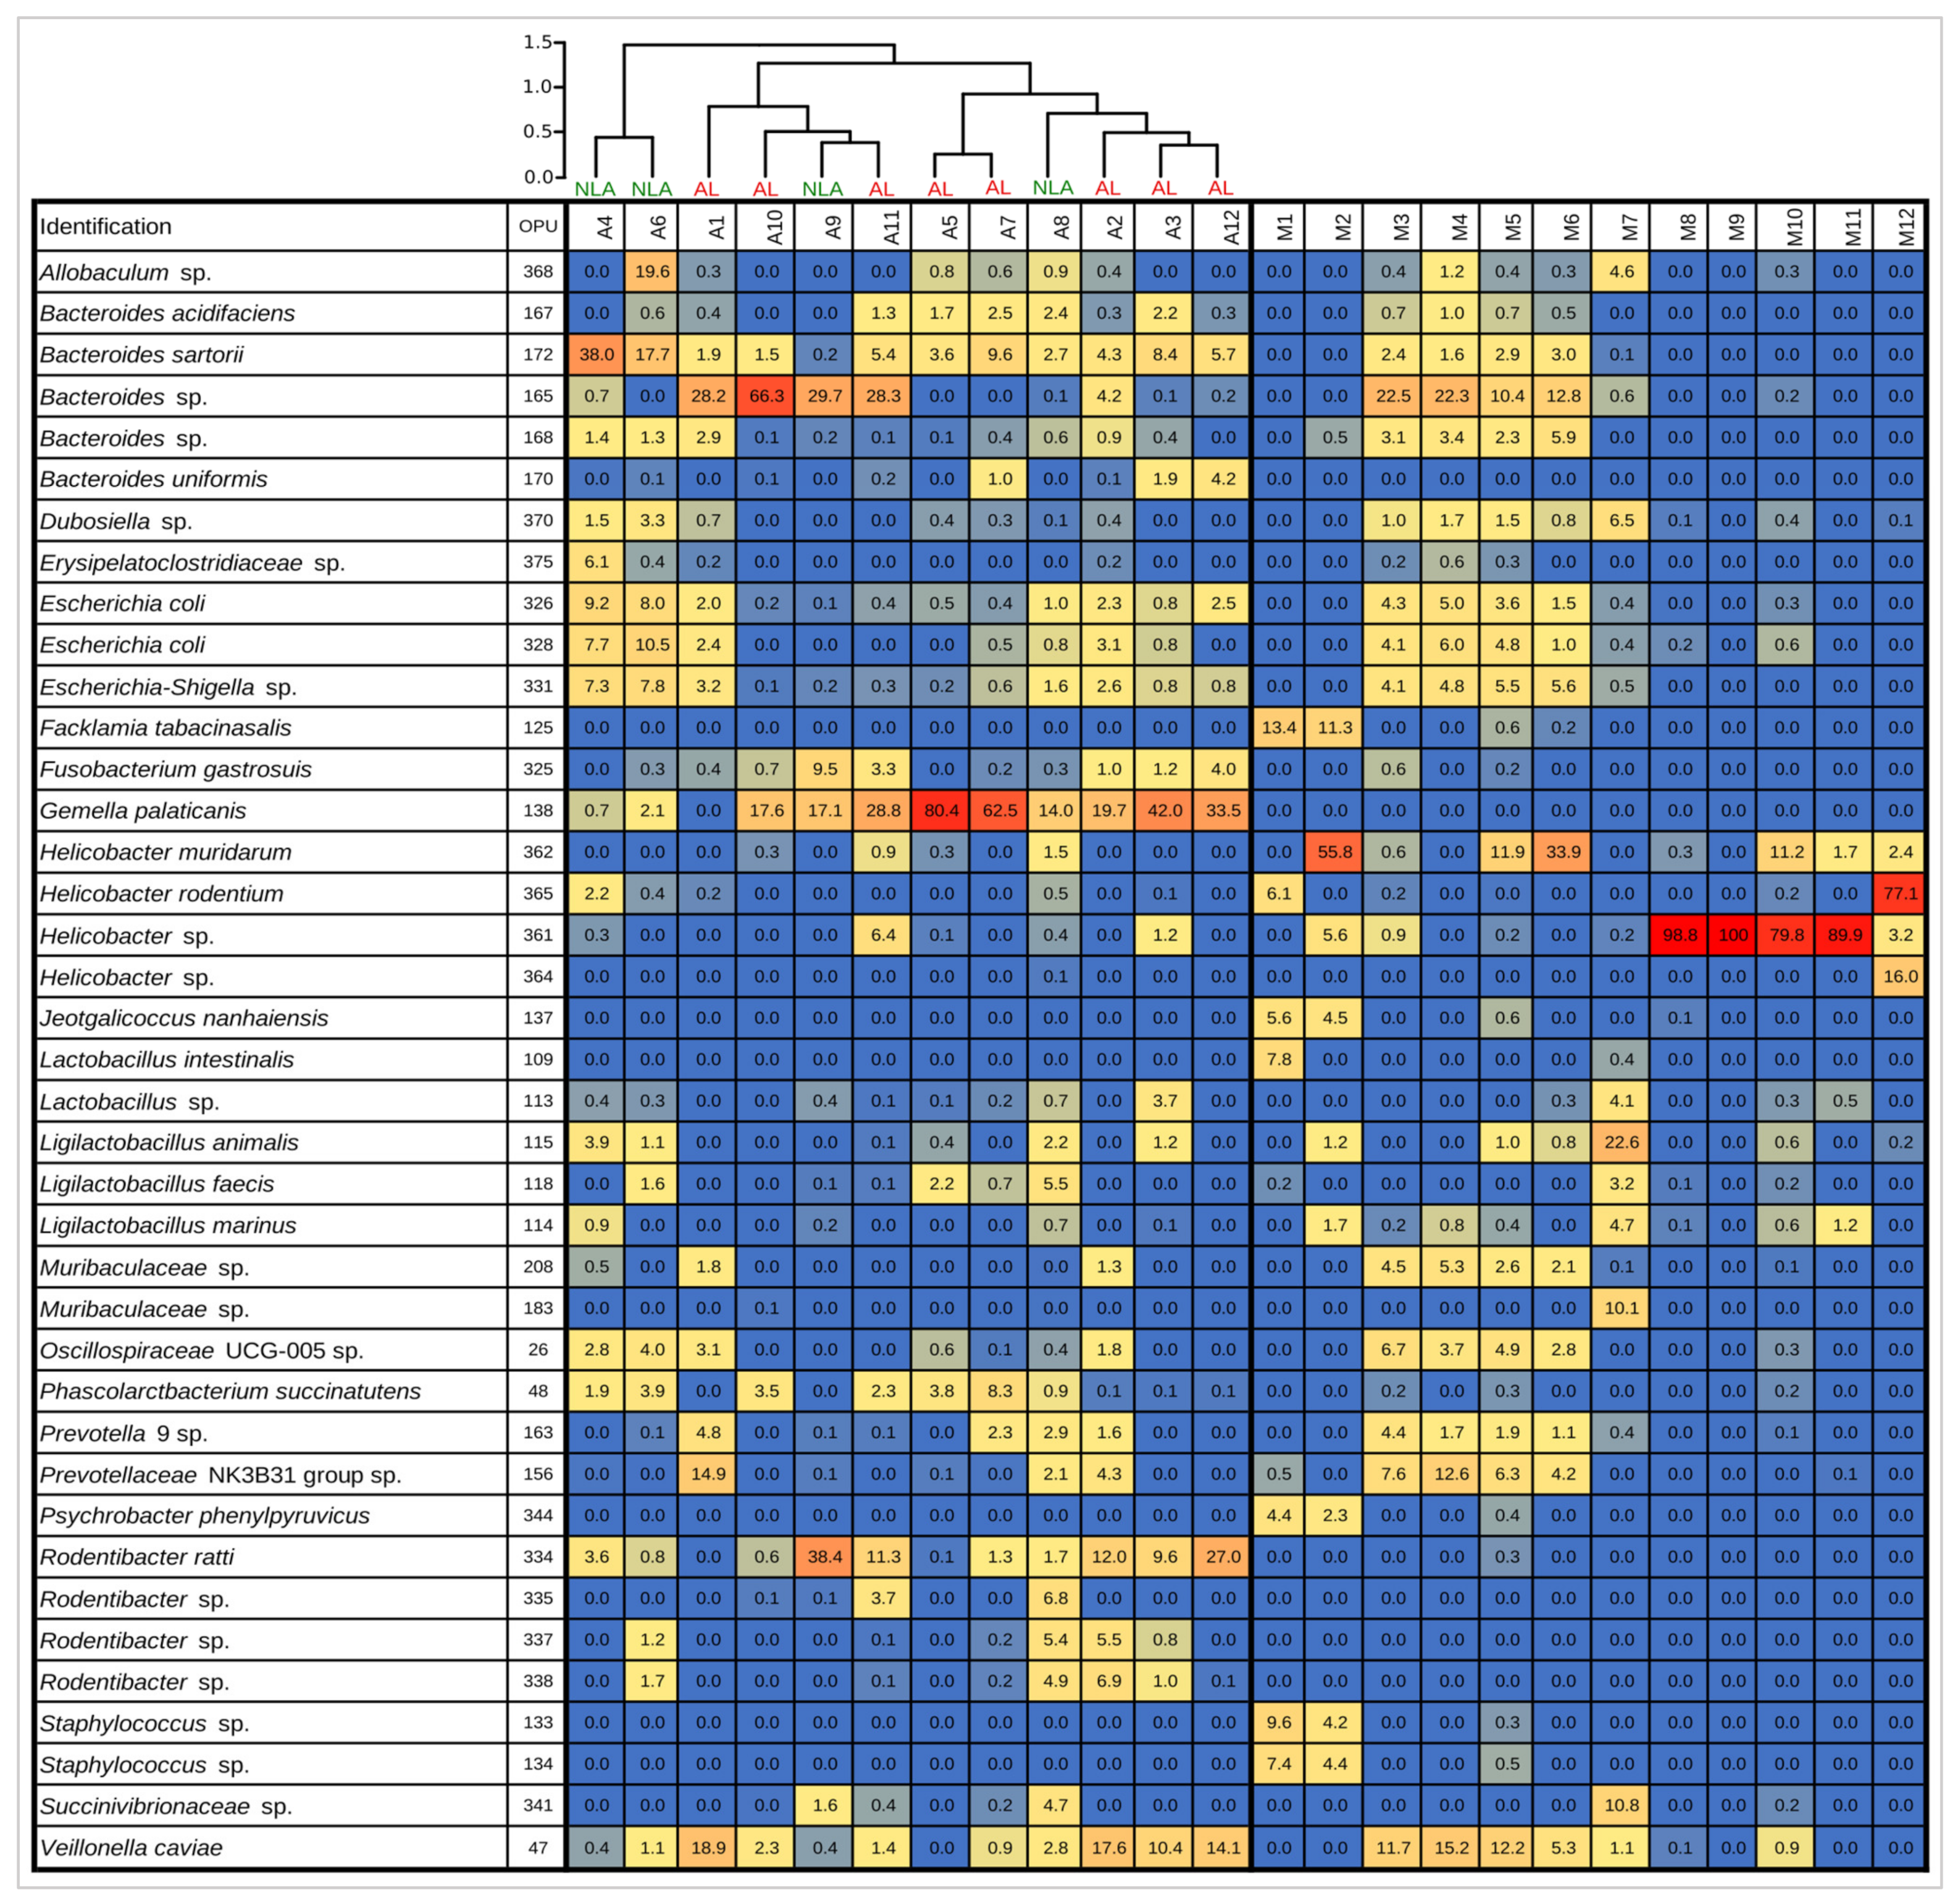
3.3. Changes in the Intestinal Microbiota Associated with Surgical Anastomosis

To explore the change of structure in the mucosal microbiota of rats undergoing anastomosis compared to samples obtained from unoperated control rats, a beta diversity analysis was performed. For this, PCoA analyses were used to compare the microbiota of M (control) and A (anastomosis) (Figure 3). There were significant differences in the composition of these groups, with the two main PCoA axes explaining 46.5% of the variation (PERMANOVA, p = 0.001). A significant clustering pattern (28.5%) was found on axis 1, where the statistical test revealed two distinct microbiome profiles. A significant clustering pattern (18%) was also observed on axis 2, where two different microbiome profiles between A and M were observed.
Then, a HeatTree was performed to compare the differences between samples A and M in order to observe distinctive features at each taxonomic level. Thus, the differences revealed by the beta diversity analysis could be explained by differences observed in Figure 4, which illustrates differences between the two groups. Here, 4 phyla, 5 classes, 8 orders, 16 families, 21 genera, and 33 species (Table S3) were statistically different. At the phylum level, Firmicutes, Proteobacteria, and Fusobacteriota stand out as being more represented in A than in M. Within Firmicutes, the Bacilli class stands out, including the species Gemella palaticanis. In the phylum Proteobacteria, the class Gammaproteobacteria, the order Enterobacterales, and the family Pasteurellaceae within which the genus Rodentibacter stands out. In the Bacteroidaceae family, the genus Bacteroides stands out. In the phylum Fusobacteriota the species Fusobacterium gastrosuis stands out. By contrast, the phylum Campylobacterota stands out as being more represented in M than in A. In this phylum, the genus Helicobacter stands out.

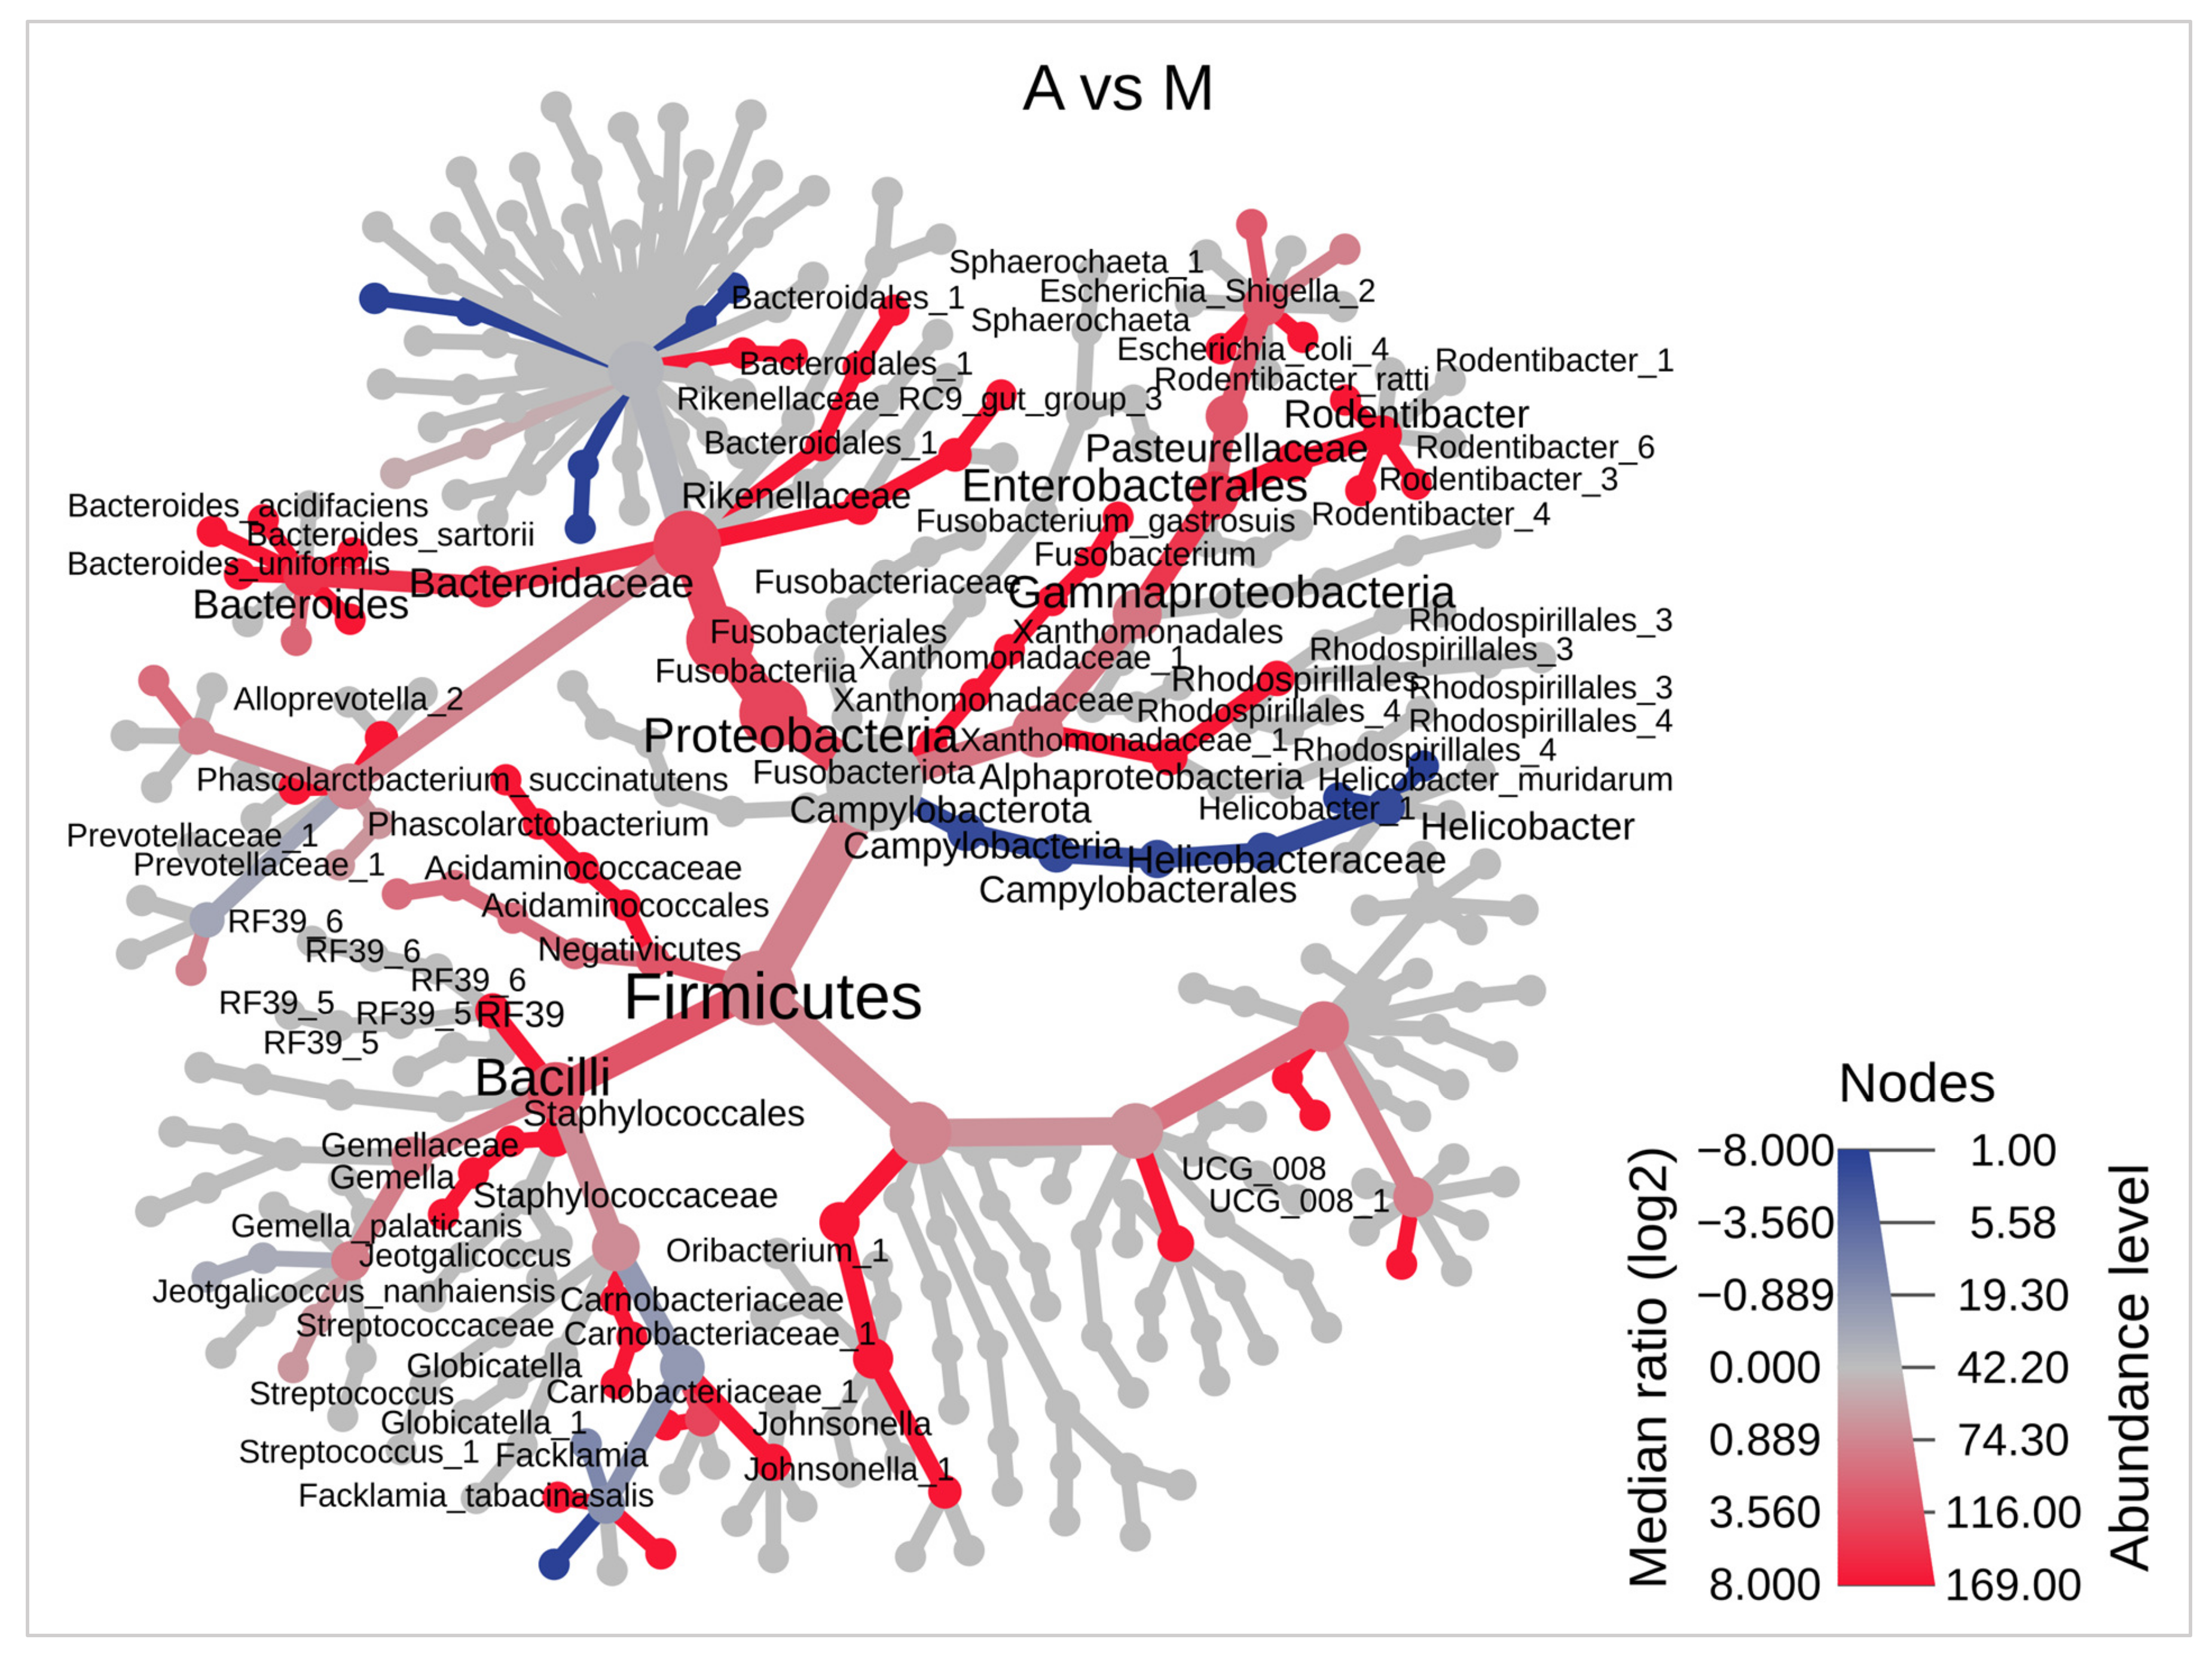
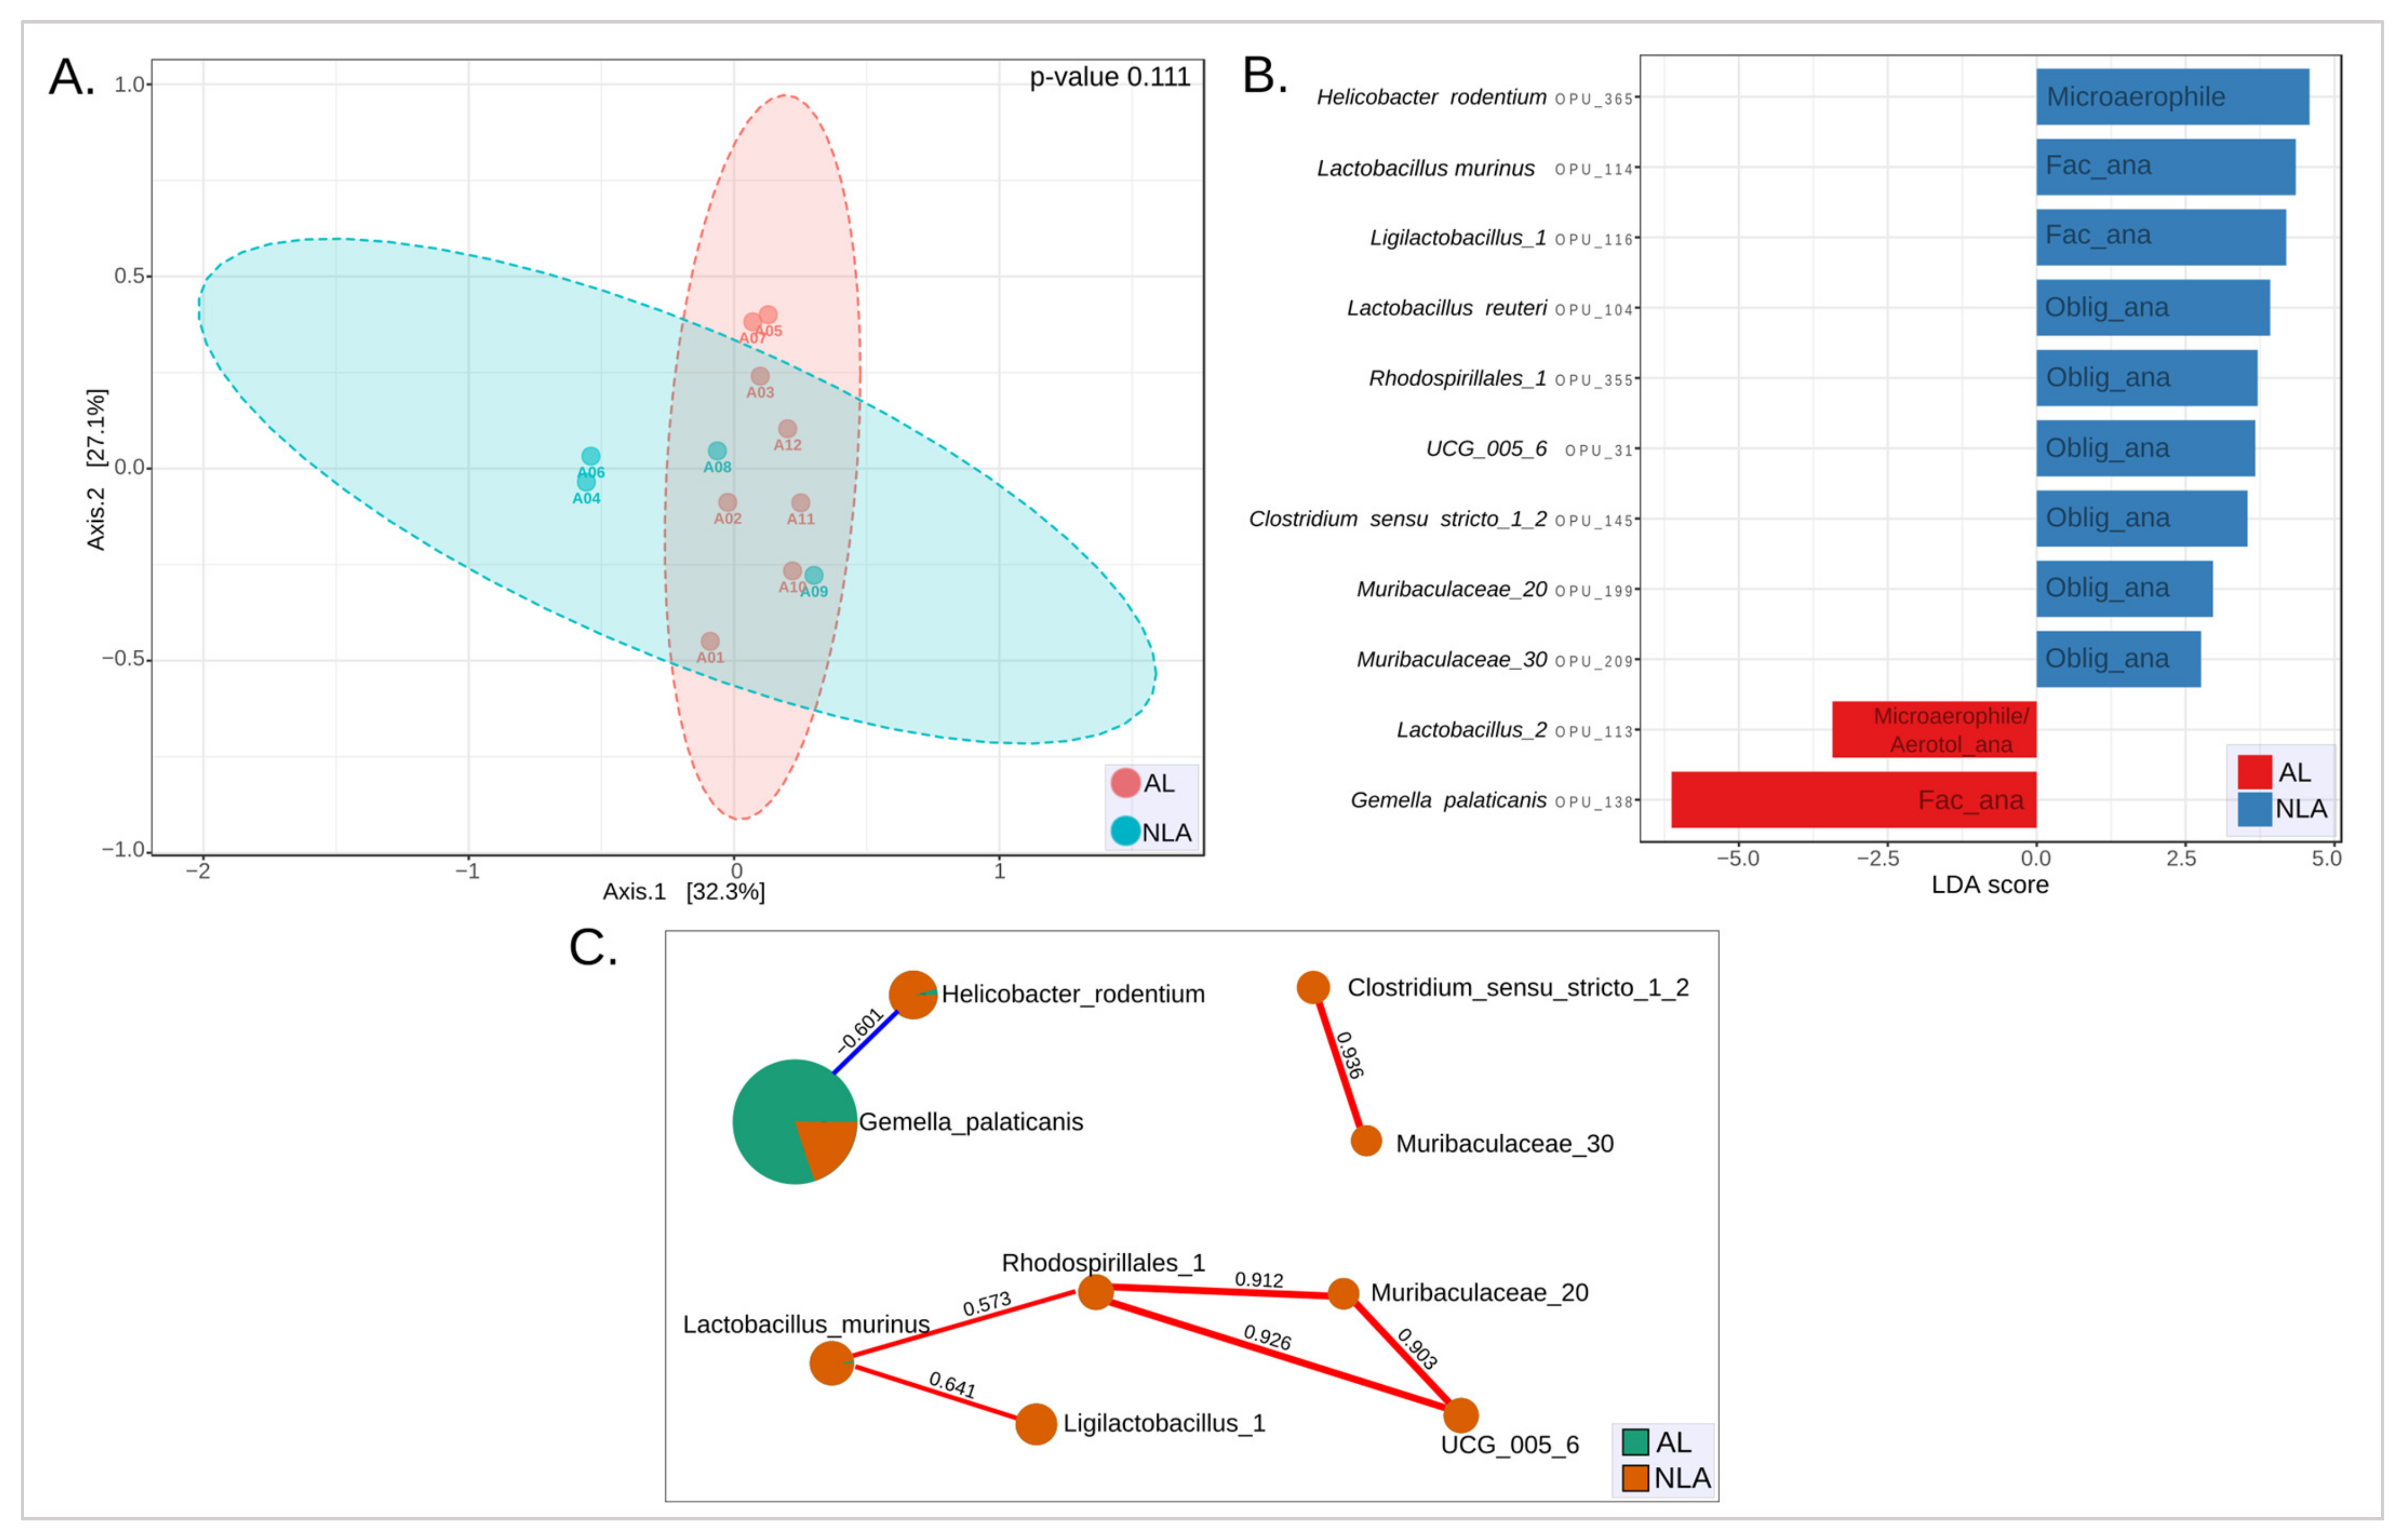
3.4. Bacterial Biomarkers of Anastomotic Intervention

Then, a univariate “LEfSe” analysis was performed to identify microbial species that differed significantly between groups A and M. LEfSe first employs the Kruskal–Wallis test to identify taxa with significantly different relative abundances between groups [23]. Using a raw p-value cutoff of 0.05, 33 species were identified as distinct, which coincided with the 33 species identified as different in the comparative heat tree A vs. M (Figure 4, Table S3) using the Wilcoxon test. The LDA (linear discriminant analysis) method was then used to generate a ranked species list based on their LDA scores. The above enabled us to identify the taxa that best represent each group (Figure 5A). As a result, the anastomosis group presented 28 marker species. This group was significantly (p-adjusted) dominated by five species: Gemella palaticanis, Rodentibacter ratti, Bacteroides sartorii, Fusobacterium gastrosuis, and Bacteroides uniformis. By contrast, five species were found to be marker species of the mucosal control group, none of which were statistically significant (p-adjusted) (Figure 5A, Table S4).
A correlation network was built (Figure 5B, Table S5) over the 33 LDA LEfSe species to uncover potential bacterial interactions that could aid in understanding how the microbiota responds and adapts to anastomosis intervention. Notably, Gemella palaticanis and Rodentibacter ratti showed by far the highest positive correlation (0.8373). Then, the highest negative correlation was between Gemella palaticanis and Helicobacter muridarum (−0.5158). The second highest negative correlation was observed between Bacteriodes uniformis and Helicobacter muridarum (−0.5107). It is noteworthy that the highest positive correlations were observed between Gemella palaticanis and Rodentibacter ratti, both of which are facultative anaerobes and had the highest LDA scores within the anastomosis group. It is also noteworthy that the highest negative correlation values pointed to the microaerophilic Helicobacter muridarum, which is among the marker species of the control mucosa group. As a result of these observations, the next focus was on investigating what type of microbial respiration of the intestinal microbiota characterized each group.

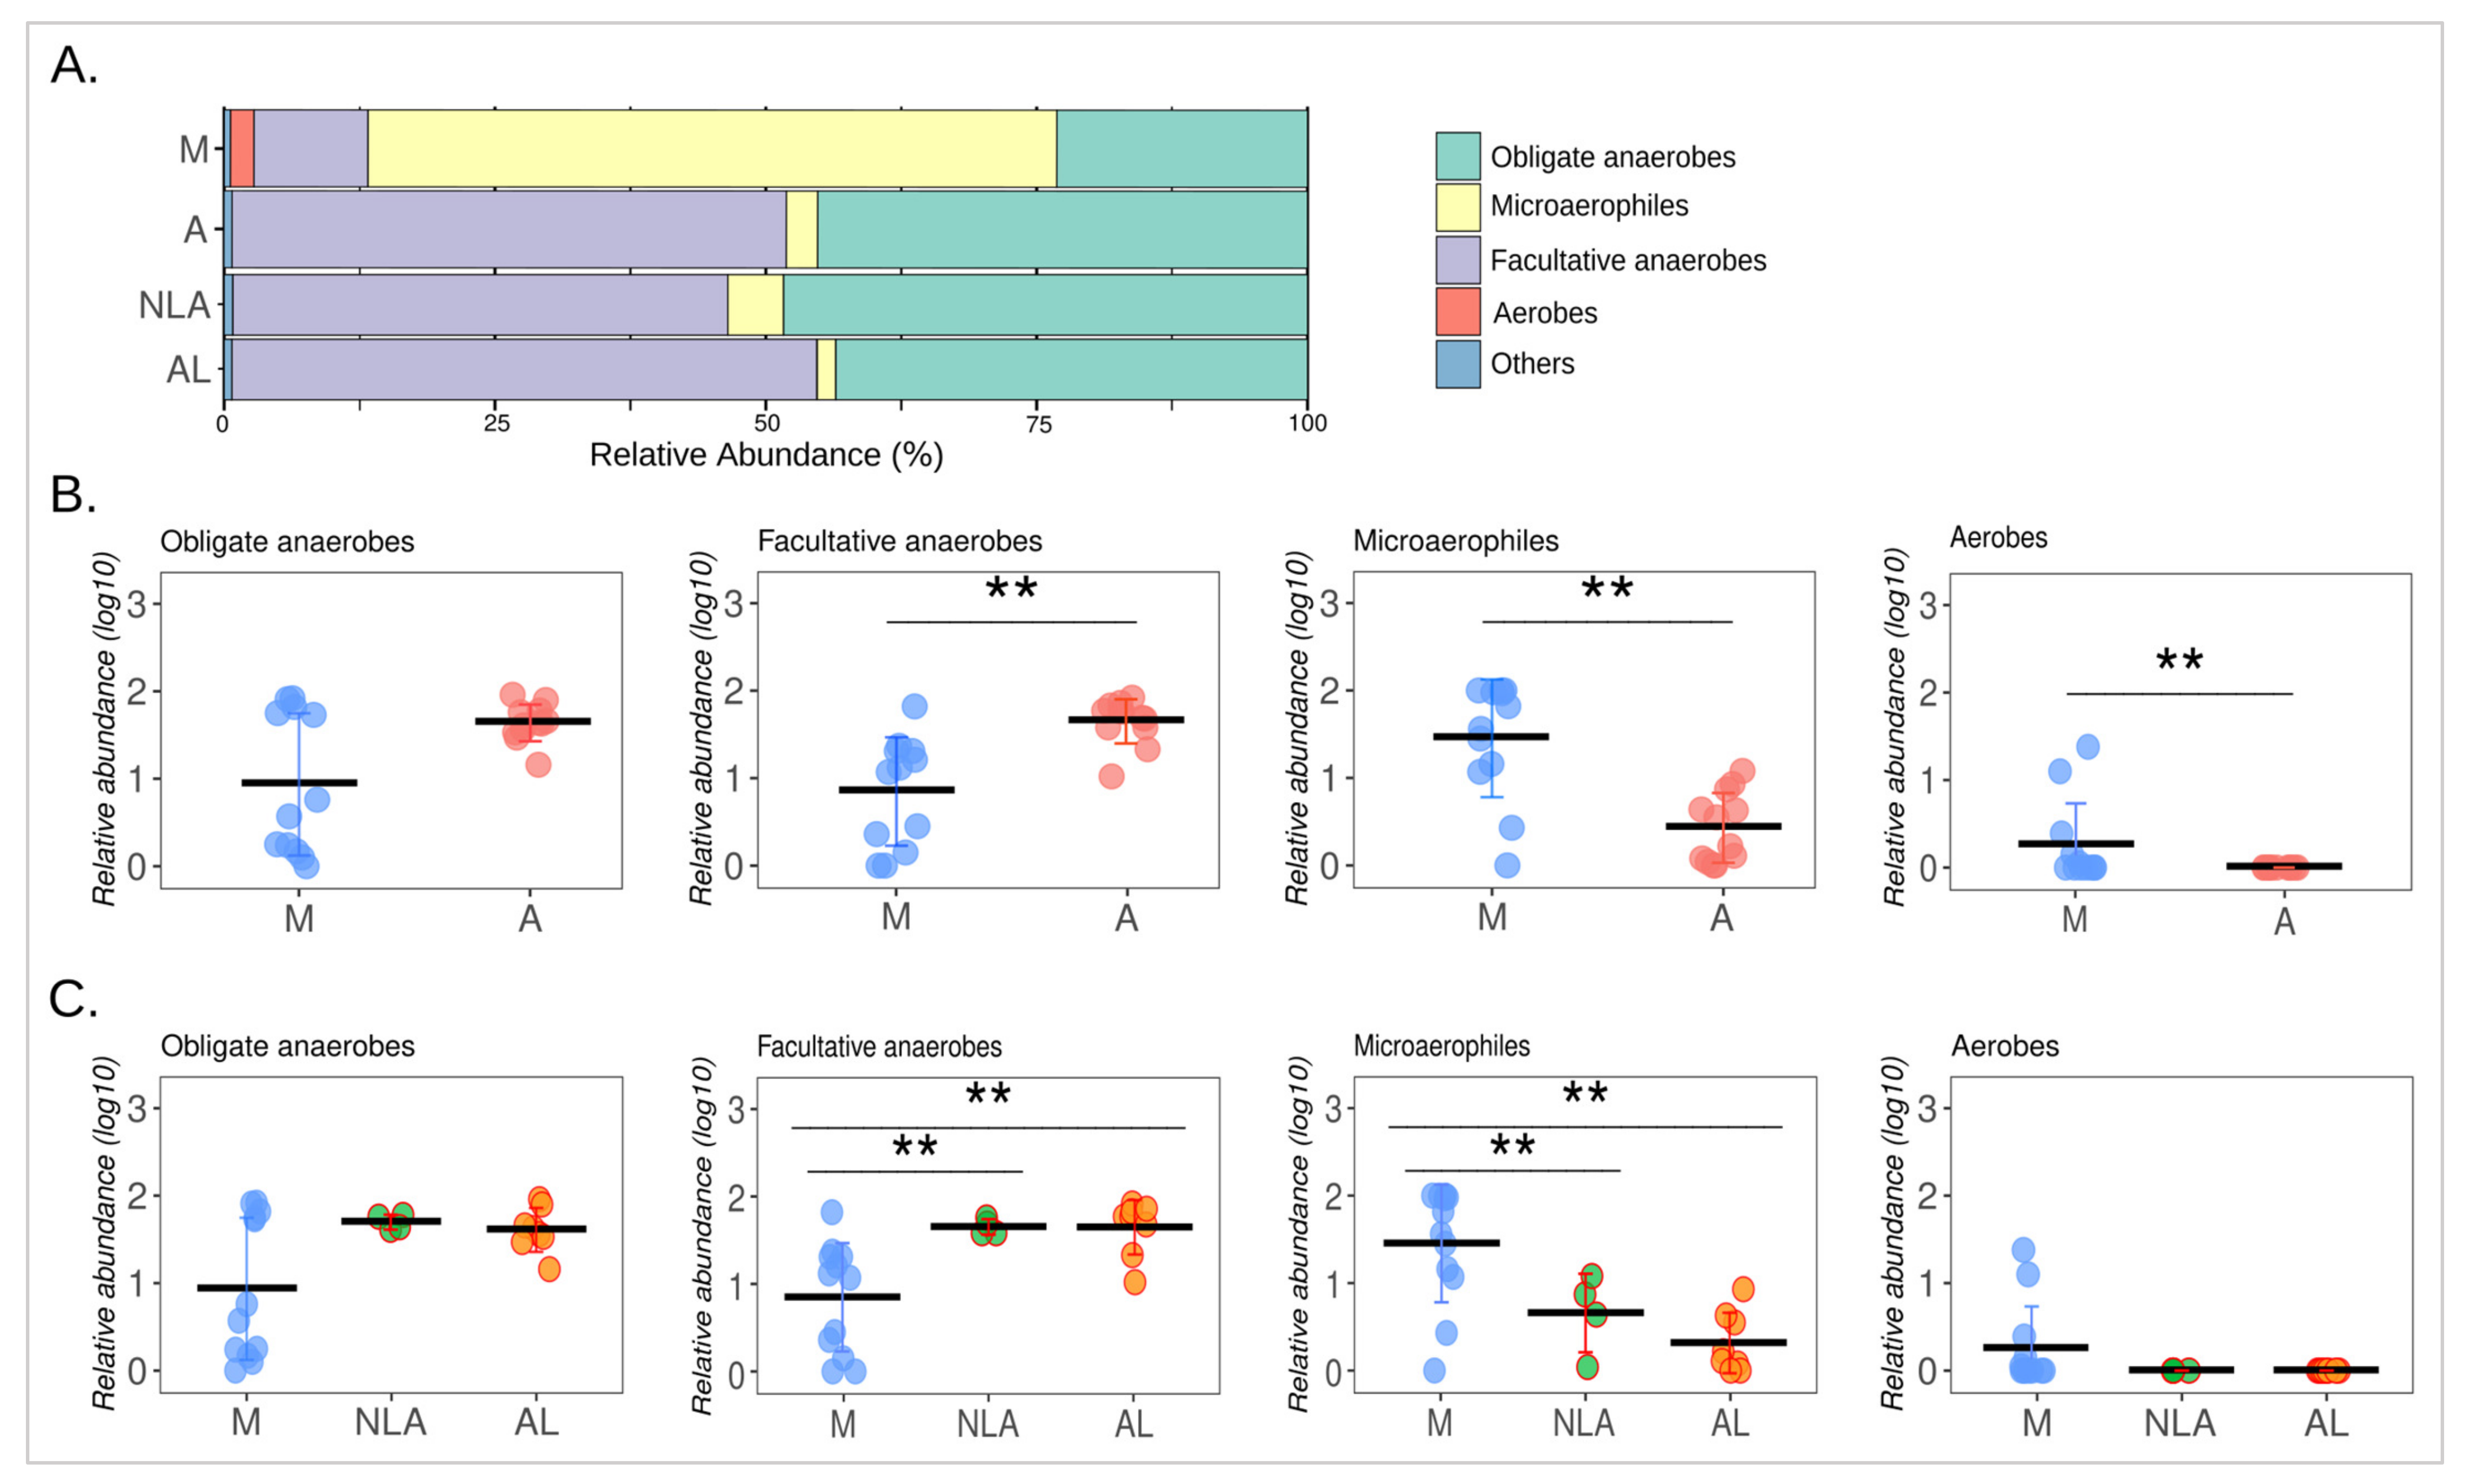
3.5. Changes in Microbial Respiration of the Intestinal Microbiota

The healthy intestinal mucosal environment is characterized by a low oxygen level that allows the survival and establishment of anaerobic bacterial communities. By contrast, during anastomotic surgery, the intestinal mucosa is exposed to high concentrations of oxygen that can affect and stop the growth of obligate anaerobic bacteria [34]. On this basis, the microbial respiration of mucosa-associated intestinal microbiota was investigated in the anastomosis and control groups. It was found that the anastomosis group (A) had a higher abundance of facultative anaerobes and a lower abundance of microaerophiles (p < 0.005). A higher abundance of aerobes was also observed in the mucosal control group (M). No differences were observed in the abundance of the obligate anaerobes (Figure 6A,B, Table S6).
As a result of these findings, oxygen appears to play an important role in the intestinal shift of the anastomosis phenotype. This is consistent with what has been previously suggested, where oxygen exposure is among the factors that could be implicated in changes in the composition of the intestinal microbiota due to colorectal surgery [35]. Prior evidence [12,36] showed that exposure of the intestinal mucosa to oxygen is associated with a loss of obligate anaerobes and a gain in potentially pathogenic facultative anaerobes such as Enterococcus and Escherichia/Shigella. In the present study, no changes were observed in the relative abundances of obligate anaerobic bacteria, but a significant increase in facultative anaerobes was indeed observed, mainly at the expense of a decrease in the relative abundance of microaerophiles when comparing the anastomosis group with the control group. As can be seen in Figure 5A, these changes are mainly due to the increase in the abundance of the facultative anaerobes Gemella palaticanis and Rodentibacter ratti, and the decrease in the microaerophiles Helicobacter sp. (OPU 361) and Helicobacter muridarum. This can be observed more globally in Figure 7, where the total absence of Gemella palaticanis and the minimal presence of Rodentibacter ratti in the mucosal control group stand out compared to the anastomosis group.

3.6. Microbiota Leak Phenotype

This study describes a trend for lower microbial diversity in the AL group compared to NLA (Figure 2C). There were also no differences in relative abundance in the different types of microbial respiration between the NLA and AL groups (Figure 6C). Next, the differences in the structure of microbial communities between NLA and LA were explored, as well as species potentially involved in the pathogenesis of an anastomotic leak.
To explore the differences in the structure of microbial communities between NLA and LA samples, a beta diversity analysis was performed. For this, PCoA analyses were used to compare the microbiota of NLA and AL (Figure 8A). No differences were observed between these two groups. This shows that globally, the two microbial communities did not differ. Next, it was studied whether there were specific species (OPUs) that could account for differences between the two groups. For this, a LEfSe analysis with LDA was performed using a raw p cutoff value of 0.05. The results made it possible to identify 11 distinct species, with 9 marker species for the NLA phenotype and 2 marker species for the AL phenotype (Figure 8B, Table S7). Thus, Gemella palaticanis and Lactobacillus sp. (OPU 113) were the species that best represented the AL phenotype. On the other hand, the species that best represented the NLA phenotype were Helicobacter rodentium, Lactobacillus murinus, Ligilactobacillus sp. (OPU 116), Lactobacillus reuteri, Rhodospirillales sp. (OPU 355), UCG_005 sp. (OPU 31), Clostridium sensu stricto sp. (OPU 145), Muribaculaceae sp. (OPU 199), Muribaculaceae sp. (OPU 209).
Then, a correlation network (Figure 8C, Table S8) was built between all NLA and AL species to plot only those present in the LEfSe-LDA of Figure 8B. This was performed to discover possible bacterial interactions that could help in understanding how the anastomotic leak phenotype (AL) behaves in relation to the non-leak phenotype (NLA). Here, a strong positive correlation (>0.9) was observed between the obligate anaerobes Rhodospirillales sp. (OPU 355), Muribaculaceae sp. (OPU 199), and UCG_005 sp. (OPU 31), which correspond to marker species in the NLA group. A strong positive correlation (0.936) was also observed between Clostridium sensu stricto sp. (OPU 145) and Muribaculaceae sp. (OPU 209), both obligate anaerobes that also correspond to marker species in the NLA group (Figure 8B,C). This marked presence of obligate anaerobes may be illustrative of their importance in maintaining a NLA phenotype.
Next, a negative correlation (−0.601) was observed between the facultative anaerobe Gemella palaticanis and the microaerophile Helicobacter rodentium. Both were the most important marker species of the AL phenotype (LDA score −6.13) and the NLA phenotype (LDA score 4.58), respectively (Figure 8B,C). This behavior is similar to what was seen between the anastomosis group (A) and the control mucosal group (M), where the most important marker species for each group corresponded to facultative anaerobes and microaerophiles, respectively (Figure 5A). Thus, the possible effect due to oxygen exposure during the anastomosis procedure seems to play an important role not only in the change in the intestinal microbiota of the anastomosis/mucosal control groups, but also in the NLA/LA phenotypes. In both cases, the high abundance of the facultative anaerobe Gemella palaticanis as a marker species stands out as a distinctive feature. This was manifested as a null presence of this bacterium in the control group compared to the anastomosis group, and as a more marked presence in the AL phenotype, with a relative abundance of 35.6% (±25.8) compared to the NLA phenotype, the relative abundance of which was 8.5% (±8.3) (Figure 7).
Lactobacillus murinus and Ligilactobacillus sp. (OPU 116), both facultative anaerobes and marker species of the NLA phenotype, showed a positive correlation (0.641) (Figure 8B,C). Thus, the presence of an anaerobic facultative marker species is not exclusive to the AL phenotype. Finally, Lactobacillus reuteri and Lactobacillus sp. (OPU 113) did not show any correlation with the rest of the marker species. Lactobacillus reuteri is another anaerobic obligate species, thus 6 of 9 species corresponded to this type of microbial respiration in the NLA phenotype. Lactobacillus sp. (OPU 113), for its part, is a microaerophile or aerotolerant anaerobe, a marker species of the AL phenotype together with Gemella palaticanis, and which demonstrates that microaerophiles are not exclusive marker species of the NLA group (Figure 8B,C).

4. Discussion

The best animal model [37] should be able to reproduce the disease or event under study with the greatest anatomical and physiological resemblance to a human. However, it must also be widely available, inexpensive, and technically feasible to perform in a safe and repeatable manner, and the animal should be easy to keep in a suitable space.
Animal models used are usually very different from the typical clinical setting in humans. Models are generally young and healthy animals, whereas humans are typically old and fragile. The above would explain why AL is less common in animal models, so some pathophysiological mechanisms (e.g., insufficient sutures, ischemia) must be simulated for filtration to occur [38,39].
AL models have been performed in rats and mice. These animals are excellent for these purposes because they are low-cost, easy to maintain and handle, and widely available. Unlike strict herbivores, these animals can digest food derived from animals, and their digestive system is less fragile, being a model of greater similarity to humans [40]. Most studies have been conducted in rats with discouraging initial results, where despite models with insufficient or ischemic sutures, the filtration could not be reproduced. The authors conclude that due to the greater consistency of the stools, creating a colorectal anastomosis that presents a leak is harder [41]. In other models with the use of corticosteroids, AL was evidenced, but the omentum contained it without showing an obvious filtration [42]. Recently, rats with ischemic colorectal anastomosis were used, which was achieved by the devascularization of a proximal and distal centimeter of the anastomosis. A filtration rate of 50% confirmed by the autopsy of the specimens on the sixth day was achieved postoperatively, showing only one death during anesthesia [43], which makes it an excellent model to study this event, being reproducible, economical, with a high incidence of the event to be studied and safe [37].
Like the Shogan study [13], our rat model has certain limitations in terms of recapitulating the anastomotic leak in humans. Leaks are not directly visualized during surgery as most patients do not undergo reoperation. In addition, most anastomotic leaks are discovered by computed tomography (CT) scans and appear as inflammation or fluid collections adjacent to the anastomotic site. The precise definition of AL is thus debated, and contrast enema and CT scanning are known to carry significant false negative rates. Our approach examines all anastomoses in rats for evidence of dense adhesion, dehiscence, inflammation, and purulence that contrast with a healthy non-inflamed anastomosis without adhesions. We believe this assessment aligns with what might be seen clinically in patients.
The gut microbiota has been proposed as a critical factor in colorectal surgery complications. It has been hypothesized as the “missing factor” that could explain little-understood complications of an anastomotic leak [44]. Bacterial diversity (alpha diversity) is believed to contribute to the stability of the microbiome. It was previously reported that there are postoperative changes in the microbiome after gastrointestinal surgery, where better outcomes are associated with greater microbiome diversity [26]. It has also been reported that low microbial diversity may decrease resistance to colonization by pathogenic bacteria that might play a role in AL development [27,28]. Although our results showed no differences between the anastomosis group and the mucosal control group, we found a trend toward lower microbial diversity in the AL group compared to the NLA group.
The current study shows that the intestinal anastomosis procedure induces changes in microbial composition after surgery in rats. Other factors, such as sex, age, diet, or the animal model’s comorbidities, could influence how the microbiota affects AL but was not considered in this study. However, the effect of oxygen on bacterial microbiota is a general mechanism that is sufficiently independent of host factors (i.e., gender) to account for our findings, which can also be seen in Chamorro’s findings [21] regarding the effect of oxygen on the microbiota of female and male IBD patients. Thus, we observed significant differences in the composition (beta diversity) between the anastomotic intervention group and the mucosal control group. A possible explanation for this change in the structure of the communities may be the exposure to a high concentration of oxygen when the intestine is opened during anastomotic surgery [35]. Our results support this idea, showing a marked increase in the abundance of anaerobic, facultative bacteria in the anastomotic group at the expense of a decrease in microaerophiles. This change was mainly due to the high presence of the facultative anaerobic bacterium Gemella palaticanis in the anastomosis group.
Previous studies have described a marked increase in the abundance of anaerobic, facultative bacteria at the anastomosis site. Thus, Shogan et al. showed a 500- and 200-fold increase in the relative abundance of Enterococcus and Escherichia/Shigella, respectively [12,13]. In addition, these enterococci showed the ability to degrade collagen and activate the production of matrix metalloproteinase 9 in the host, thanks to the virulence factors gelE and sprE of E. faecalis. Consequently, it is likely to weaken the anastomosis by degrading collagen in the healing tissue [13,45].
Furthermore, Lam et al. [46] mentioned that rodent models fed a high-fat and low-fiber diet induced alterations in the gut microbiota composition that might influence the postoperative process in anastomotic leakage; however, it showed an attenuation based on a short course of a healthy high-fiber diet before surgery [46,47]. The role of microbiota (“invisible enemy“) in the AL phenotype must be uncovered, as has been mentioned by Lam et al. [46] to prevent strains with adhesive phenotype and tropism towards injured tissues. In our study, neither control nor surgical rats had Enterococcus in their colorectal mucosa microbiota. Shogan’s work and our study both characterized the mucosa-associated microbiota; however, we used different strains of rats (Sprague Dawley), which could explain the differences in results, as Li et al. suggest [48]. Li mentioned that differences in gut microbiota might account for the animals’ differential metabolic response to dietary intervention and, as a result, predispose them to different pathological outcomes.
On the other hand, the PacBio platform was used in our work to characterize the microbiome, and the complete sequence of the 16S RNA plus the ITS region was obtained. This undoubtedly contributes to greater specificity in the phylogenetic association of the OPUs discovered [49]. Still, we may have lost sensitivity to detect Enterococcus, which is also associated with its low presence in the early microbiota.
This study observed no differences in composition (beta diversity) between the NLA and AL phenotypes. There were also no differences in the types of microbial respiration between the two groups. However, the presence of obligate anaerobes was observed, as marker species (LEfSe-LDA) in the NLA phenotype and not in AL. We also identified that these anaerobic obligate species had a strong positive correlation with each other. The importance of anaerobic obligate bacteria in maintaining the stability of the gut microbiota has previously been reported [21,34]. These obligate anaerobes are very important to maintain the environmental stability of the intestinal tract and offer services to the host, such as SCFA production [32]. For example, SCFA butyrate has been shown to have anti-inflammatory effects and is also a primary source of energy for colonic epithelium [50]. Thus, our results show that the presence of obligate anaerobic marker species related to the NLA group (Lactobacillus reuteri, Rhodospirillales sp. (OPU 355), UCG_005 sp. (OPU 31), Clostridium sensu stricto sp. (OPU 145), Muribaculaceae sp. (OPU 199), Muribaculaceae sp. (OPU 209), Figure 8B) may be playing an essential role in maintaining the non-leakage anastomosis phenotype.
Additionally, the presence of facultative anaerobic bacteria as a marker (LEfSe-LDA) was observed in both the AL and NLA groups. Among these, the AL phenotype’s most prominent marker species was G. palaticanis [51]. This bacterium showed a relative abundance of up to 80.4% in the AL phenotype samples (Figure 7). Therefore, our results show that G. palaticanis may play an important role in maintaining the AL phenotype when its population increased during the surgery. Thus, although the compositional structure and the type of respiration of the NLA and AL phenotypes do not differ, there are bacterial marker species that would be involved in the manifestation of the anastomotic leakage phenotype and affect wound healing.
Gemella species is a Gram-positive coccus, catalase-negative, facultatively anaerobic bacterium in human mucous membranes, human dental plaque, oral cavity (oropharynx), the genitourinary system, upper respiratory tract, and gastrointestinal tract [52,53]. There are six bacterial species, Gemella hemolysins, G. morbillorum, G. bergeri, G. sanguinis, G. asaccharolytica, and two species recovered only from animals, G. cuniculi and G. palaticanis [54]. In addition, Gemella has been associated as a causative agent in different human infections, such as bacteremia, age-related macular degeneration (AMD), the microbiome in cancerous tissue where Gemella was observed in stages I, II, and IV, root caries, and rarely in infective endocarditis [55,56,57,58]. In addition to the preceding, Liu et al. [59] describe a three-level relationship between intestinal microbiota and anastomotic leakage (AL). The first are those associated with peri- or intraoperative factors, the second with how pathogenic bacteria adhere to the intestinal mucosa and interact with the extracellular cell matrix (ECM) to prevent host clearance, and the third with how pathogens affect anastomotic healing.
The analysis of the G. palaticanis reference genome (ASM1523476v1) and protein table, which were deposited and annotated in GenBank, enabled us to identify some virulence factors that could explain the rise of this opportunistic pathogen in rats with AL. Fibronectin-binding protein A (FnBPA), a cell surface-bound protein that binds fibronectin and fibrinogen, and the SdrC-like adhesin that promotes cell attachment and aggregation by an unknown mechanism, are found in G. palaticanis [60,61]. Furthermore, the genome of G. palaticanis (Accession number NZ JADGKN010000100.1) harbors a putative holin-like toxin that may oligomerize in the cytoplasmic membrane and trigger the formation of holes that cause cell death, different families of serine proteases (S1C, ClpP, ClpX), a type II and III toxin-antitoxin system (RelE/ParE, RelB/DinJ, RelE/StbE, PemK/MazF, ToxN/AbiQ), metallo-endopeptidase, metallo-hydrolases and M28, Xaa-Pro and U32 family of peptidases, among other putative virulence genes.
Authors should discuss the results and how they can be interpreted from the perspective of previous studies and of the working hypotheses. The findings and their implications should be discussed in the broadest context possible. Future research directions may also be highlighted.

5. Conclusions

To summarize, G. palaticanis and E. faecalis can both colonize various niches in their hosts, including the oral cavity [55,62,63,64,65], the heart [66,67,68,69], and the gut [70,71,72,73]. Moreover, we describe G. palaticanis as a new bacterium that may be involved in generating the AL phenotype in our murine model. Our findings suggest that when the intestine is opened, oxygen promotes the growth of this bacterium (among other facultative anaerobes), which then finds a favorable niche for adhesion where the extracellular matrix at the site of anastomotic injury is exposed. This occurs in both the NLA and AL groups, but the presence of G. palaticanis is more significant in the AL phenotype. In this sense, preoperative stool sampling to detect patients at high risk of developing AL appears to be ineffective currently, as recent data are too heterogeneous to identify a harmful bacterial composition of the bowel. Instead, it seems that AL is caused by a combination of factors and is not due to surgery alone. On the contrary, positive associations with other facultative anaerobes could indicate cooperative or symbiotic interactions in which the AL phenotype is a consequence of a dysregulation in the proportions of these populations due to oxygen influx and the possibilities they have to colonize surgery-associated tissue.

Supplementary Materials

The following supporting information can be downloaded at: https://www.mdpi.com/article/10.3390/microorganisms11030680/s1, Figure S1: Venn diagram of OPUs obtained; Table S1: Sequences, OTUs, and OPUs; Table S2: Alpha diversity indices; Table S3: Heat tree data of taxonomic differences between A and M; Table S4: Data summary of LEfSe analysis between A and M; Table S5: Correlation coefficients results between A and M; Table S6: Microbial respiration of microbiota; Table S7: Data summary of LEfSe analysis between NLA and AL; Table S8: Correlation coefficient results between NLA and AL.

Author Contributions

D.Z. and D.I. contributed equally to this work. Conceptualization, D.Z., F.L.-K. and R.M.V.; data curation, D.Z., D.I., T.V. and R.M.V.; formal analysis, D.Z., D.I., T.V., and R.M.V.; funding acquisition, D.Z. and R.M.V.; investigation, F.L.-K. and R.M.V.; methodology, D.Z., F.M., D.I., T.V. and R.M.V.; project administration, D.Z. and R.M.V.; supervision, D.Z. and R.M.V.; visualization, D.I.; writing original draft, D.Z., D.I. and R.M.V.; writing—review and editing, R.M.V. All authors have read and agreed to the published version of the manuscript.

Funding

This research was funded by Proyecto de Investigación Dirección Académica Clínica Las Condes (PIDA 2017-005) (D.Z.); Fondo Nacional de Desarrollo Científico y Tecnológico (FONDECYT 1211647, Chile) (R.V.). Beca de Doctorado Nacional 21171030 (D.I.).

Institutional Review Board Statement

The study was approved by The Institutional Committee for the Care and Use of Laboratory Animals of Clínica Las Condes, (Protocol N°: IDZ-COL-01 is authorized).

Informed Consent Statement

Not applicable.

Data Availability Statement

The data presented in this study are available on request from the corresponding author.

Acknowledgments

We thank Pía Ocampo M.V., from the Central Animal Facility at the School of Medicine, Universidad de Chile, for the excellent animal care support. We thank Helen Lowry for her careful review of the manuscript and helpful discussions.

Conflicts of Interest

The authors declare no conflict of interest.

References

  1. Paun, B.C.; Cassie, S.; MacLean, A.R.; Dixon, E.; Buie, W.D. Postoperative Complications Following Surgery for Rectal Cancer. Ann. Surg. 2010, 251, 807–818. [Google Scholar] [CrossRef] [PubMed]
  2. Goligher, J.C.; Graham, N.G.; De Dombal, F.T. Anastomotic Dehiscence after Anterior Resection of Rectum and Sigmoid. Br. J. Surg. 2005, 57, 109–118. [Google Scholar] [CrossRef] [PubMed]
  3. Ogilvie, J.W.; Dietz, D.W.; Stocchi, L. Anastomotic Leak after Restorative Proctosigmoidectomy for Cancer: What Are the Chances of a Permanent Ostomy? Int. J. Color. Dis. 2012, 27, 1259–1266. [Google Scholar] [CrossRef] [PubMed]
  4. Buchs, N.C.; Gervaz, P.; Secic, M.; Bucher, P.; Mugnier-Konrad, B.; Morel, P. Incidence, Consequences, and Risk Factors for Anastomotic Dehiscence after Colorectal Surgery: A Prospective Monocentric Study. Int. J. Color. Dis. 2008, 23, 265–270. [Google Scholar] [CrossRef] [PubMed] [Green Version]
  5. McArdle, C.S.; McMillan, D.C.; Hole, D.J. Impact of Anastomotic Leakage on Long-Term Survival of Patients Undergoing Curative Resection for Colorectal Cancer. Br. J. Surg. 2005, 92, 1150–1154. [Google Scholar] [CrossRef]
  6. Wong, N.Y.; Eu, K.W. A Defunctioning Ileostomy Does Not Prevent Clinical Anastomotic Leak After a Low Anterior Resection: A Prospective, Comparative Study. Dis. Colon Rectum 2005, 48, 2076–2079. [Google Scholar] [CrossRef]
  7. Hallböök, O.; Sjödahl, R. Anastomotic Leakage and Functional Outcome after Anterior Resection of the Rectum. Br. J. Surg. 2005, 83, 60–62. [Google Scholar] [CrossRef]
  8. Nesbakken, A.; Nygaard, K.; Lunde, O.C. Outcome and Late Functional Results after Anastomotic Leakage Following Mesorectal Excision for Rectal Cancer. Br. J. Surg. 2002, 88, 400–404. [Google Scholar] [CrossRef]
  9. Mirnezami, A.; Mirnezami, R.; Chandrakumaran, K.; Sasapu, K.; Sagar, P.; Finan, P. Increased Local Recurrence and Reduced Survival from Colorectal Cancer Following Anastomotic Leak: Systematic Review and Meta-Analysis. Ann. Surg. 2011, 253, 890–899. [Google Scholar] [CrossRef]
  10. Shogan, B.D.; Carlisle, E.M.; Alverdy, J.C.; Umanskiy, K. Do We Really Know Why Colorectal Anastomoses Leak? J. Gastrointest. Surg. 2013, 17, 1698–1707. [Google Scholar] [CrossRef]
  11. Cohn, I.; Rives, J.D. Antibiotic Protection of Colon Anastomoses*. Ann. Surg. 1955, 141, 707–717. [Google Scholar] [CrossRef]
  12. Shogan, B.D.; Smith, D.P.; Christley, S.; Gilbert, J.A.; Zaborina, O.; Alverdy, J.C. Intestinal Anastomotic Injury Alters Spatially Defined Microbiome Composition and Function. Microbiome 2014, 2, 35. [Google Scholar] [CrossRef] [Green Version]
  13. Shogan, B.D.; Belogortseva, N.; Luong, P.M.; Zaborin, A.; Lax, S.; Bethel, C.; Ward, M.; Muldoon, J.P.; Singer, M.; An, G.; et al. Collagen Degradation and MMP9 Activation by Enterococcus faecalis Contribute to Intestinal Anastomotic Leak. Sci. Transl. Med. 2015, 7, 286ra68. [Google Scholar] [CrossRef] [Green Version]
  14. Jacobson, R.A.; Wienholts, K.; Williamson, A.J.; Gaines, S.; Hyoju, S.; van Goor, H.; Zaborin, A.; Shogan, B.D.; Zaborina, O.; Alverdy, J.C. Enterococcus faecalis Exploits the Human Fibrinolytic System to Drive Excess Collagenolysis: Implications in Gut Healing and Identification of Druggable Targets. Am. J. Physiol.-Gastrointest. Liver Physiol. 2020, 318, G1–G9. [Google Scholar] [CrossRef] [Green Version]
  15. Yarza, P.; Yilmaz, P.; Pruesse, E.; Glöckner, F.O.; Ludwig, W.; Schleifer, K.-H.; Whitman, W.B.; Euzéby, J.; Amann, R.; Rosselló-Móra, R. Uniting the Classification of Cultured and Uncultured Bacteria and Archaea Using 16S RRNA Gene Sequences. Nat. Rev. Microbiol. 2014, 12, 635–645. [Google Scholar] [CrossRef]
  16. Kashyap, S.K.; Maherchandani, S.; Kumar, N. Chapter 18—Ribotyping: A Tool for Molecular Taxonomy. In Animal Biotechnology; Verma, A.S., Singh, A., Eds.; Academic Press: San Diego, CA, USA, 2014; pp. 327–344. ISBN 978-0-12-416002-6. [Google Scholar]
  17. Ludwig, W.; Strunk, O.; Westram, R.; Richter, L.; Meier, H.; Yadhukumar; Buchner, A.; Lai, T.; Steppi, S.; Jobb, G.; et al. ARB: A Software Environment for Sequence Data. Nucleic Acids Res. 2004, 32, 1363–1371. [Google Scholar] [CrossRef] [Green Version]
  18. Quast, C.; Pruesse, E.; Yilmaz, P.; Gerken, J.; Schweer, T.; Yarza, P.; Peplies, J.; Glöckner, F.O. The SILVA Ribosomal RNA Gene Database Project: Improved Data Processing and Web-Based Tools. Nucleic Acids Res. 2013, 41, D590–D596. [Google Scholar] [CrossRef]
  19. Pruesse, E.; Peplies, J.; Glöckner, F.O. SINA: Accurate High-Throughput Multiple Sequence Alignment of Ribosomal RNA Genes. Bioinformatics 2012, 28, 1823–1829. [Google Scholar] [CrossRef] [Green Version]
  20. Vidal, R.; Ginard, D.; Khorrami, S.; Mora-Ruiz, M.; Munoz, R.; Hermoso, M.; Díaz, S.; Cifuentes, A.; Orfila, A.; Rosselló-Móra, R. Crohn Associated Microbial Communities Associated to Colonic Mucosal Biopsies in Patients of the Western Mediterranean. Syst. Appl. Microbiol. 2015, 38, 442–452. [Google Scholar] [CrossRef]
  21. Chamorro, N.; Montero, D.A.; Gallardo, P.; Farfán, M.; Contreras, M.; De la Fuente, M.; Dubois, K.; Hermoso, M.A.; Quera, R.; Pizarro-Guajardo, M.; et al. Landscapes and Bacterial Signatures of Mucosa-Associated Intestinal Microbiota in Chilean and Spanish Patients with Inflammatory Bowel Disease. Microb. Cell 2021, 8, 223–238. [Google Scholar] [CrossRef]
  22. Hammer, O.; Harper, D.A.T.; Ryan, P.D. PAST: Paleontological Statistics Software Package for Education and Data Analysis. Palaeontol. Electron. 2001, 4, 4–9. [Google Scholar]
  23. Chong, J.; Liu, P.; Zhou, G.; Xia, J. Using MicrobiomeAnalyst for Comprehensive Statistical, Functional, and Meta-Analysis of Microbiome Data. Nat. Protoc. 2020, 15, 799–821. [Google Scholar] [CrossRef] [PubMed]
  24. Heberle, H.; Meirelles, G.V.; da Silva, F.R.; Telles, G.P.; Minghim, R. InteractiVenn: A Web-Based Tool for the Analysis of Sets through Venn Diagrams. BMC Bioinform. 2015, 16, 169. [Google Scholar] [CrossRef] [PubMed] [Green Version]
  25. R Core Team. R: A Language and Environment for Statistical Computing; R Foundation for Statistical Computing: Vienna, Austria, 2014. [Google Scholar]
  26. Ferrie, S.; Webster, A.; Wu, B.; Tan, C.; Carey, S. Gastrointestinal Surgery and the Gut Microbiome: A Systematic Literature Review. Eur. J. Clin. Nutr. 2021, 75, 12–25. [Google Scholar] [CrossRef]
  27. Van Praagh, J.B.; de Goffau, M.C.; Bakker, I.S.; Harmsen, H.J.M.; Olinga, P.; Havenga, K. Intestinal Microbiota and Anastomotic Leakage of Stapled Colorectal Anastomoses: A Pilot Study. Surg. Endosc. 2016, 30, 2259–2265. [Google Scholar] [CrossRef]
  28. Van Praagh, J.B.; de Goffau, M.C.; Bakker, I.S.; van Goor, H.; Harmsen, H.J.M.; Olinga, P.; Havenga, K. Mucus Microbiome of Anastomotic Tissue During Surgery Has Predictive Value for Colorectal Anastomotic Leakage. Ann. Surg. 2019, 269, 911–916. [Google Scholar] [CrossRef]
  29. Vomhof-DeKrey, E.E.; Stover, A.; Basson, M.D. Microbiome Diversity Declines While Distinct Expansions of Th17, INKT, and Dendritic Cell Subpopulations Emerge after Anastomosis Surgery. Gut Pathog. 2021, 13, 51. [Google Scholar] [CrossRef]
  30. Zhao, Y.; Li, B.; Sun, Y.; Liu, Q.; Cao, Q.; Li, T.; Li, J. Risk Factors and Preventive Measures for Anastomotic Leak in Colorectal Cancer. Technol. Cancer Res. Treat. 2022, 21, 1–14. [Google Scholar] [CrossRef]
  31. Buffie, C.G.; Pamer, E.G. Microbiota-Mediated Colonization Resistance against Intestinal Pathogens. Nat. Rev. Immunol. 2013, 13, 790–801. [Google Scholar] [CrossRef] [Green Version]
  32. Wang, G.; Yu, Y.; Wang, Y.; Wang, J.; Guan, R.; Sun, Y.; Shi, F.; Gao, J.; Fu, X. Role of SCFAs in Gut Microbiome and Glycolysis for Colorectal Cancer Therapy. J. Cell. Physiol. 2019, 234, 17023–17049. [Google Scholar] [CrossRef]
  33. The Human Microbiome Project Consortium. Structure, Function and Diversity of the Healthy Human Microbiome. Nature 2012, 486, 207–214. [Google Scholar] [CrossRef] [Green Version]
  34. Lu, Z.; Imlay, J.A. When Anaerobes Encounter Oxygen: Mechanisms of Oxygen Toxicity, Tolerance and Defence. Nat. Rev. Microbiol. 2021, 19, 774–785. [Google Scholar] [CrossRef]
  35. Agnes, A.; Puccioni, C.; D’Ugo, D.; Gasbarrini, A.; Biondi, A.; Persiani, R. The Gut Microbiota and Colorectal Surgery Outcomes: Facts or Hype? A Narrative Review. BMC Surg. 2021, 21, 83. [Google Scholar] [CrossRef]
  36. Ohigashi, S.; Sudo, K.; Kobayashi, D.; Takahashi, T.; Nomoto, K.; Onodera, H. Significant Changes in the Intestinal Environment After Surgery in Patients with Colorectal Cancer. J. Gastrointest. Surg. 2013, 17, 1657–1664. [Google Scholar] [CrossRef]
  37. Chow, P.K.H.; Ng, R.T.H.; Ogden, B.E. (Eds.) Animal Models in Biomedical Research: A Primer for the Investigator; World Scientific: Hackensack, NJ, USA, 2008; ISBN 978-981-270-663-8. [Google Scholar]
  38. Komen, N.; van der Wal, H.-C.; Ditzel, M.; Kleinrensink, G.-J.; Jeekel, H.; Lange, J.F. Colorectal Anastomotic Leakage: A New Experimental Model. J. Surg. Res. 2009, 155, 7–12. [Google Scholar] [CrossRef]
  39. Van der Ham, A.C.; Kort, W.J.; Weijma, I.M.; van den Ingh, H.F.G.M.; Jeekel, H. Healing of Ischemic Colonic Anastomosis: Fibrin Sealant Does Not Improve Wound Healing. Dis. Colon Rectum 1992, 35, 884–891. [Google Scholar] [CrossRef]
  40. Hem, A.; Eide, D.M.; Engh, E.; Smith, A. (Eds.) Laboratory Animal Science; Norwegian Veterinary School: Oslo, Norway, 2001; ISBN 82-7725-117-3. [Google Scholar]
  41. Van der Ham, A.C.; Kort, W.J.; Weijma, I.M.; Jeekel, H. Transient Protection of Incomplete Colonic Anastomoses with Fibrin Sealant: An Experimental Study in the Rat. J. Surg. Res. 1993, 55, 256–260. [Google Scholar] [CrossRef]
  42. Henne-Bruns, D.; Kreischer, H.P.; Schmiegelow, P.; Kremer, B. Reinforcement of Colon Anastomoses with Polyglycolic Acid Mesh: An Experimental Study. Eur. Surg. Res. 1990, 22, 224–230. [Google Scholar] [CrossRef]
  43. Shakhsheer, B.A.; Lec, B.; Zaborin, A.; Guyton, K.; Defnet, A.M.; Bagrodia, N.; Kandel, J.J.; Zaborina, O.; Hernandez, S.L.; Alverdy, J. Lack of Evidence for Tissue Hypoxia as a Contributing Factor in Anastomotic Leak Following Colon Anastomosis and Segmental Devascularization in Rats. Int. J. Color. Dis. 2017, 32, 539–547. [Google Scholar] [CrossRef]
  44. Gibiino, G.; Binda, C.; Cristofaro, L.; Sbrancia, M.; Coluccio, C.; Petraroli, C.; Jung, C.F.M.; Cucchetti, A.; Cavaliere, D.; Ercolani, G.; et al. Dysbiosis and Gastrointestinal Surgery: Current Insights and Future Research. Biomedicines 2022, 10, 2532. [Google Scholar] [CrossRef]
  45. Edomskis, P.; Goudberg, M.R.; Sparreboom, C.L.; Menon, A.G.; Wolthuis, A.M.; D’Hoore, A.; Lange, J.F. Matrix Metalloproteinase-9 in Relation to Patients with Complications after Colorectal Surgery: A Systematic Review. Int. J. Color. Dis. 2021, 36, 1–10. [Google Scholar] [CrossRef]
  46. Lam, A.; Keskey, R.; Alverdy, J. The Invisible Enemy: Gut Microbiota and Their Role in Anastomotic Leak. Semin. Colon Rectal Surg. 2022, 33, 100880. [Google Scholar] [CrossRef]
  47. Hyoju, S.K.; Adriaansens, C.; Wienholts, K.; Sharma, A.; Keskey, R.; Arnold, W.; van Dalen, D.; Gottel, N.; Hyman, N.; Zaborin, A.; et al. Low-Fat/High-Fibre Diet Prehabilitation Improves Anastomotic Healing via the Microbiome: An Experimental Model. Br. J. Surg. 2020, 107, 743–755. [Google Scholar] [CrossRef]
  48. Li, H.; Ni, Y.; Su, M.; Qiu, Y.; Zhou, M.; Qiu, M.; Zhao, A.; Zhao, L.; Jia, W. Pharmacometabonomic Phenotyping Reveals Different Responses to Xenobiotic Intervention in Rats. J. Proteome Res. 2007, 6, 1364–1370. [Google Scholar] [CrossRef] [PubMed]
  49. Ivulic, D.; Rossello-Mora, R.; Viver, T.; Montero, D.A.; Vidal, S.; Aspee, F.; Hidalgo, H.; Vidal, R. Litter Management Strategies and Their Impact on the Environmental and Respiratory Microbiome Might Influence Health in Poultry. Microorganisms 2022, 10, 878. [Google Scholar] [CrossRef] [PubMed]
  50. Kriss, M.; Hazleton, K.Z.; Nusbacher, N.M.; Martin, C.G.; Lozupone, C.A. Low Diversity Gut Microbiota Dysbiosis: Drivers, Functional Implications and Recovery. Curr. Opin. Microbiol. 2018, 44, 34–40. [Google Scholar] [CrossRef]
  51. Collins, M.D.; Rodriguez Jovita, M.; Foster, G.; Sjödén, B.; Falsen, E. Characterization of a Gemella-like Organism from the Oral Cavity of a Dog: Description of Gemella palaticanis Sp. Nov. Int. J. Syst. Evol. Microbiol. 1999, 49, 1523–1526. [Google Scholar] [CrossRef] [Green Version]
  52. Selçuk, N.; Esma, C.; Ahmet Rıza, Ş.; Selma, A. Evaluation of Cases with Gemella Infection: Cross-Sectional Study. J. Infect. Dis. Epidemiol. 2018, 4, 63. [Google Scholar] [CrossRef] [Green Version]
  53. Youssef, D.; Youssef, I.; Marroush, T.S.; Sharma, M. Gemella Endocarditis: A Case Report and a Review of the Literature. Avicenna J. Med. 2019, 09, 164–168. [Google Scholar] [CrossRef]
  54. Collins, M.D. The Genus Gemella. In The Prokaryotes; Dworkin, M., Falkow, S., Rosenberg, E., Schleifer, K.-H., Stackebrandt, E., Eds.; Springer: New York, NY, USA, 2006; pp. 511–518. ISBN 978-0-387-25494-4. [Google Scholar]
  55. Damé-Teixeira, N.; Parolo, C.C.F.; Maltz, M.; Rup, A.G.; Devine, D.A.; Do, T. Gene Expression of Bacterial Collagenolytic Proteases in Root Caries. J. Oral Microbiol. 2018, 10, 1424475. [Google Scholar] [CrossRef] [Green Version]
  56. Ho, E.X.P.; Cheung, C.M.G.; Sim, S.; Chu, C.W.; Wilm, A.; Lin, C.B.; Mathur, R.; Wong, D.; Chan, C.M.; Bhagarva, M.; et al. Human Pharyngeal Microbiota in Age-Related Macular Degeneration. PLoS ONE 2018, 13, e0201768. [Google Scholar] [CrossRef] [Green Version]
  57. Ternes, D.; Tsenkova, M.; Pozdeev, V.I.; Meyers, M.; Koncina, E.; Atatri, S.; Schmitz, M.; Karta, J.; Schmoetten, M.; Heinken, A.; et al. The Gut Microbial Metabolite Formate Exacerbates Colorectal Cancer Progression. Nat. Metab. 2022, 4, 458–475. [Google Scholar] [CrossRef]
  58. Woo, P.C.Y.; Lau, S.K.P.; Fung, A.M.Y.; Chiu, S.K.; Yung, R.W.H.; Yuen, K.Y. Gemella bacteraemia Characterised by 16S Ribosomal RNA Gene Sequencing. J. Clin. Pathol. 2003, 56, 690–693. [Google Scholar] [CrossRef] [Green Version]
  59. Liu, Y.; Li, B.; Wei, Y. New Understanding of Gut Microbiota and Colorectal Anastomosis Leak: A Collaborative Review of the Current Concepts. Front. Cell. Infect. Microbiol. 2022, 12, 1022603. [Google Scholar] [CrossRef]
  60. Speziale, P.; Pietrocola, G. The Multivalent Role of Fibronectin-Binding Proteins A and B (FnBPA and FnBPB) of Staphylococcus aureus in Host Infections. Front. Microbiol. 2020, 11, 2054. [Google Scholar] [CrossRef]
  61. Wang, J.; Zhang, M.; Wang, M.; Zang, J.; Zhang, X.; Hang, T. Structural Insights into the Intermolecular Interaction of the Adhesin SdrC in the Pathogenicity of Staphylococcus aureus. Acta Crystallogr. F Struct. Biol. Commun. 2021, 77, 47–53. [Google Scholar] [CrossRef]
  62. Joseph, S.; Aduse-Opoku, J.; Hashim, A.; Hanski, E.; Streich, R.; Knowles, S.C.L.; Pedersen, A.B.; Wade, W.G.; Curtis, M.A. A 16S RRNA Gene and Draft Genome Database for the Murine Oral Bacterial Community. mSystems 2021, 6, e01222-20. [Google Scholar] [CrossRef]
  63. Komiyama, E.Y.; Lepesqueur, L.S.S.; Yassuda, C.G.; Samaranayake, L.P.; Parahitiyawa, N.B.; Balducci, I.; Koga-Ito, C.Y. Enterococcus Species in the Oral Cavity: Prevalence, Virulence Factors and Antimicrobial Susceptibility. PLoS ONE 2016, 11, e0163001. [Google Scholar] [CrossRef] [Green Version]
  64. Najafi, K.; Ganbarov, K.; Gholizadeh, P.; Tanomand, A.; Rezaee, M.A.; Mahmood, S.S.; Asgharzadeh, M.; Kafil, H.S. Oral Cavity Infection by Enterococcus faecalis: Virulence Factors and Pathogenesis. Rev. Med. Microbiol. 2020, 31, 51–60. [Google Scholar] [CrossRef]
  65. Takayasu, L.; Suda, W.; Takanashi, K.; Iioka, E.; Kurokawa, R.; Shindo, C.; Hattori, Y.; Yamashita, N.; Nishijima, S.; Oshima, K.; et al. Circadian Oscillations of Microbial and Functional Composition in the Human Salivary Microbiome. DNA Res. 2017, 24, 261–270. [Google Scholar] [CrossRef] [Green Version]
  66. Elsayed, S.; Zhang, K. Gemella bergeriae Endocarditis Diagnosed by Sequencing of RRNA Genes in Heart Valve Tissue. J. Clin. Microbiol. 2004, 42, 4897–4900. [Google Scholar] [CrossRef] [PubMed] [Green Version]
  67. García López, E.; Martín-Galiano, A.J. The Versatility of Opportunistic Infections Caused by Gemella Isolates Is Supported by the Carriage of Virulence Factors From Multiple Origins. Front. Microbiol. 2020, 11, 524. [Google Scholar] [CrossRef] [PubMed]
  68. Singh, K.V.; Nallapareddy, S.R.; Sillanpää, J.; Murray, B.E. Importance of the Collagen Adhesin Ace in Pathogenesis and Protection against Enterococcus faecalis Experimental Endocarditis. PLoS Pathog. 2010, 6, e1000716. [Google Scholar] [CrossRef]
  69. Thurlow, L.R.; Thomas, V.C.; Narayanan, S.; Olson, S.; Fleming, S.D.; Hancock, L.E. Gelatinase Contributes to the Pathogenesis of Endocarditis Caused by Enterococcus faecalis. Infect. Immun. 2010, 78, 4936–4943. [Google Scholar] [CrossRef] [Green Version]
  70. De Almeida, C.V.; Taddei, A.; Amedei, A. The Controversial Role of Enterococcus faecalis in Colorectal Cancer. Ther. Adv. Gastroenterol. 2018, 11, 175628481878360. [Google Scholar] [CrossRef] [Green Version]
  71. Dubin, K.; Pamer, E.G. Enterococci and Their Interactions with the Intestinal Microbiome. Microbiol. Spectr. 2017, 5, BAD-0014-2016. [Google Scholar] [CrossRef] [Green Version]
  72. Loftus, M.; Hassouneh, S.A.-D.; Yooseph, S. Bacterial Community Structure Alterations within the Colorectal Cancer Gut Microbiome. BMC Microbiol. 2021, 21, 98. [Google Scholar] [CrossRef]
  73. Villmones, H.C.; Haug, E.S.; Ulvestad, E.; Grude, N.; Stenstad, T.; Halland, A.; Kommedal, Ø. Species Level Description of the Human Ileal Bacterial Microbiota. Sci. Rep. 2018, 8, 4736. [Google Scholar] [CrossRef] [Green Version]
Figure 1. Grouping scheme of rats subjected to anastomosis and controls.
Microorganisms 11 00680 g001
Figure 2. Rarefaction and alpha diversity. Rarefaction curves for detected OTUs (A) and OPUs (B), where each line represents an independent sample. (C) Alpha diversity indices, where the average diversity index ± standard deviation for each group is plotted. The Wilcoxon rank sum test was used to compare differences (* p < 0.05) between groups. M: control mucosa group, A: experimental anastomosis group, NLA: non-leak anastomosis, AL: anastomotic leak.
Microorganisms 11 00680 g002
Figure 3. PCoA plot for beta diversity analysis. Samples A4, A6, A8, and A9 correspond to NLA. The remaining A samples correspond to AL. The analysis was performed using Bray–Curtis measures of beta diversity. Statistics: PERMANOVA. A: anastomosis, M: control. F-value 4.8374; R-squared 0.18025; p-value 0.001.
Microorganisms 11 00680 g003
Figure 4. Taxonomic differences are visualized using a heat tree. The heat tree depicts the taxonomic differences between the experimental anastomosis (A) and control (M) groups, up to the species level. On the heat tree, only significant taxon names are labeled. Colors indicate whether corresponding taxa are lower (blue) or higher (red) in experimental rats compared to controls. The median abundance and the statistical non-parametric Wilcoxon rank sum test (p < 0.05) were used.
Microorganisms 11 00680 g004
Figure 5. Anastomosis group and control group species abundance and correlation network analysis. (A) LEfSe-LDA score >2 identified species that differ significantly in abundance between groups (raw p-value cutoff < 0.05, Kruskal–Wallis test). Species with a Kruskal–Wallis FDR-adjusted p-value < 0.05 were highlighted. (B) Correlation networks (SparCC) of 33 species depicted in LEfSe-LDA. Correlation threshold > 0.3 and p-value threshold < 0.05 were used. The nodes (pie charts) represent species, size reflects relative abundance, with the anastomosis group in green and the control group in orange. Correlation values of species with an FDR-adjusted p-value < 0.05 in LDA-LEfSe were labeled, along with their connections. Positive and negative correlations in red and blue lines, respectively. The thickness of the line represents the strength of the correlation. (C) Boxplot of the abundances of species with an FDR-adjusted p-value < 0.05 in LDA-LEfSe. Fac_ana: facultative anaerobe, Oblig_ana: obligate anaerobe, ND: unknown respiration type, M: control mucosa, A: anastomosis.
Microorganisms 11 00680 g005
Figure 6. Microbial respiration of microbiota. (A) Relative abundances (%) of species classified by respiration type. (B) For M and A comparations, Wilcoxon rank sum test was used. (C) For M, NLA and AL, Kruskal–Wallis and Bonferroni’s post hoc were performed. (B,C) graphs depict relative abundances (Log10) where each data point represents a sample, and the horizontal lines represent the means. Error bars depict standard deviations. Statistical significance: ** p < 0.005. M: control mucosa, A: anastomosis, NLA: non-leak anastomosis, AL: anastomotic leak. The same analysis was then performed but dividing the anastomosis group (A) into non-leak anastomosis (NLA) and anastomotic leak (AL) to compare all the groups. Here, it was observed that NLA and AL, like the anastomotic group (A), showed a higher abundance of facultative anaerobes (p < 0.005), a lower abundance of microaerophiles (p < 0.005), with no differences in obligate anaerobes compared to the control group. No differences were observed between groups in the category of aerobes. Furthermore, no difference was observed between NLA and AL in any of the categories of microbial respiration (A,C, Table S6).
Microorganisms 11 00680 g006
Figure 7. Heat map and dendrogram analyses. Heat map of relative abundances (%) of top OPUs per sample up to 5%. The inset color of blue indicates zero; yellow to increasing red values indicate above 1%. On top of experimental anastomosis samples (A), dendrogram analysis, Bray–Curtis distance method, and Ward’s clustering algorithm. M: control mucosa, A: anastomosis, NLA: non-leak anastomosis, AL: anastomotic leak.
Microorganisms 11 00680 g007
Figure 8. Beta diversity, LEfSe-LDA, and correlation network analyses of NLA and AL groups. (A) PCoA of NLA and AL samples using Bray–Curtis beta diversity measures. Statistics: PERMANOVA. (B) LEfSe-LDA score >2 for the identification of species that differ significantly in abundance between groups (raw p-value cutoff < 0.05, Kruskal–Wallis test). (C) Correlation networks (SparCC) of 11 species depicted in LEfSe-LDA. Correlation threshold > 0.3 and p-value threshold < 0.05 were used. The nodes (pie charts) represent species, size reflects relative abundance, with the AL group in green and the NLA group in orange. Positive and negative correlations in red and blue lines, respectively. The thickness of the line represents the strength of the correlation. Fac_ana: facultative anaerobe, Oblig_ana: obligate anaerobe, Aerotol_ana: aerotolerant anaerobe, NLA: non-leak anastomosis, AL: anastomotic leak.
Microorganisms 11 00680 g008
Disclaimer/Publisher’s Note: The statements, opinions and data contained in all publications are solely those of the individual author(s) and contributor(s) and not of MDPI and/or the editor(s). MDPI and/or the editor(s) disclaim responsibility for any injury to people or property resulting from any ideas, methods, instructions or products referred to in the content.

