
Characterization of the Cultivable Endophytic Bacterial Community of Seeds and Sprouts of Cannabis sativa L. and Perspectives for the Application as Biostimulants

Abstract
:1. Introduction
2. Materials and Methods
2.1. Plant Material and Seed Extraction
2.2. Isolation of Bacterial Strains from Seeds
2.3. Isolation of Bacterial Strains from Sprouts
2.4. Molecular Characterization of the Isolated Strains and Phylogenetic Analysis
2.5. Phenotypic Characterization of Bacterial Strains
2.5.1. Bacterial Stress Resistance Assay
2.5.2. IAA Production
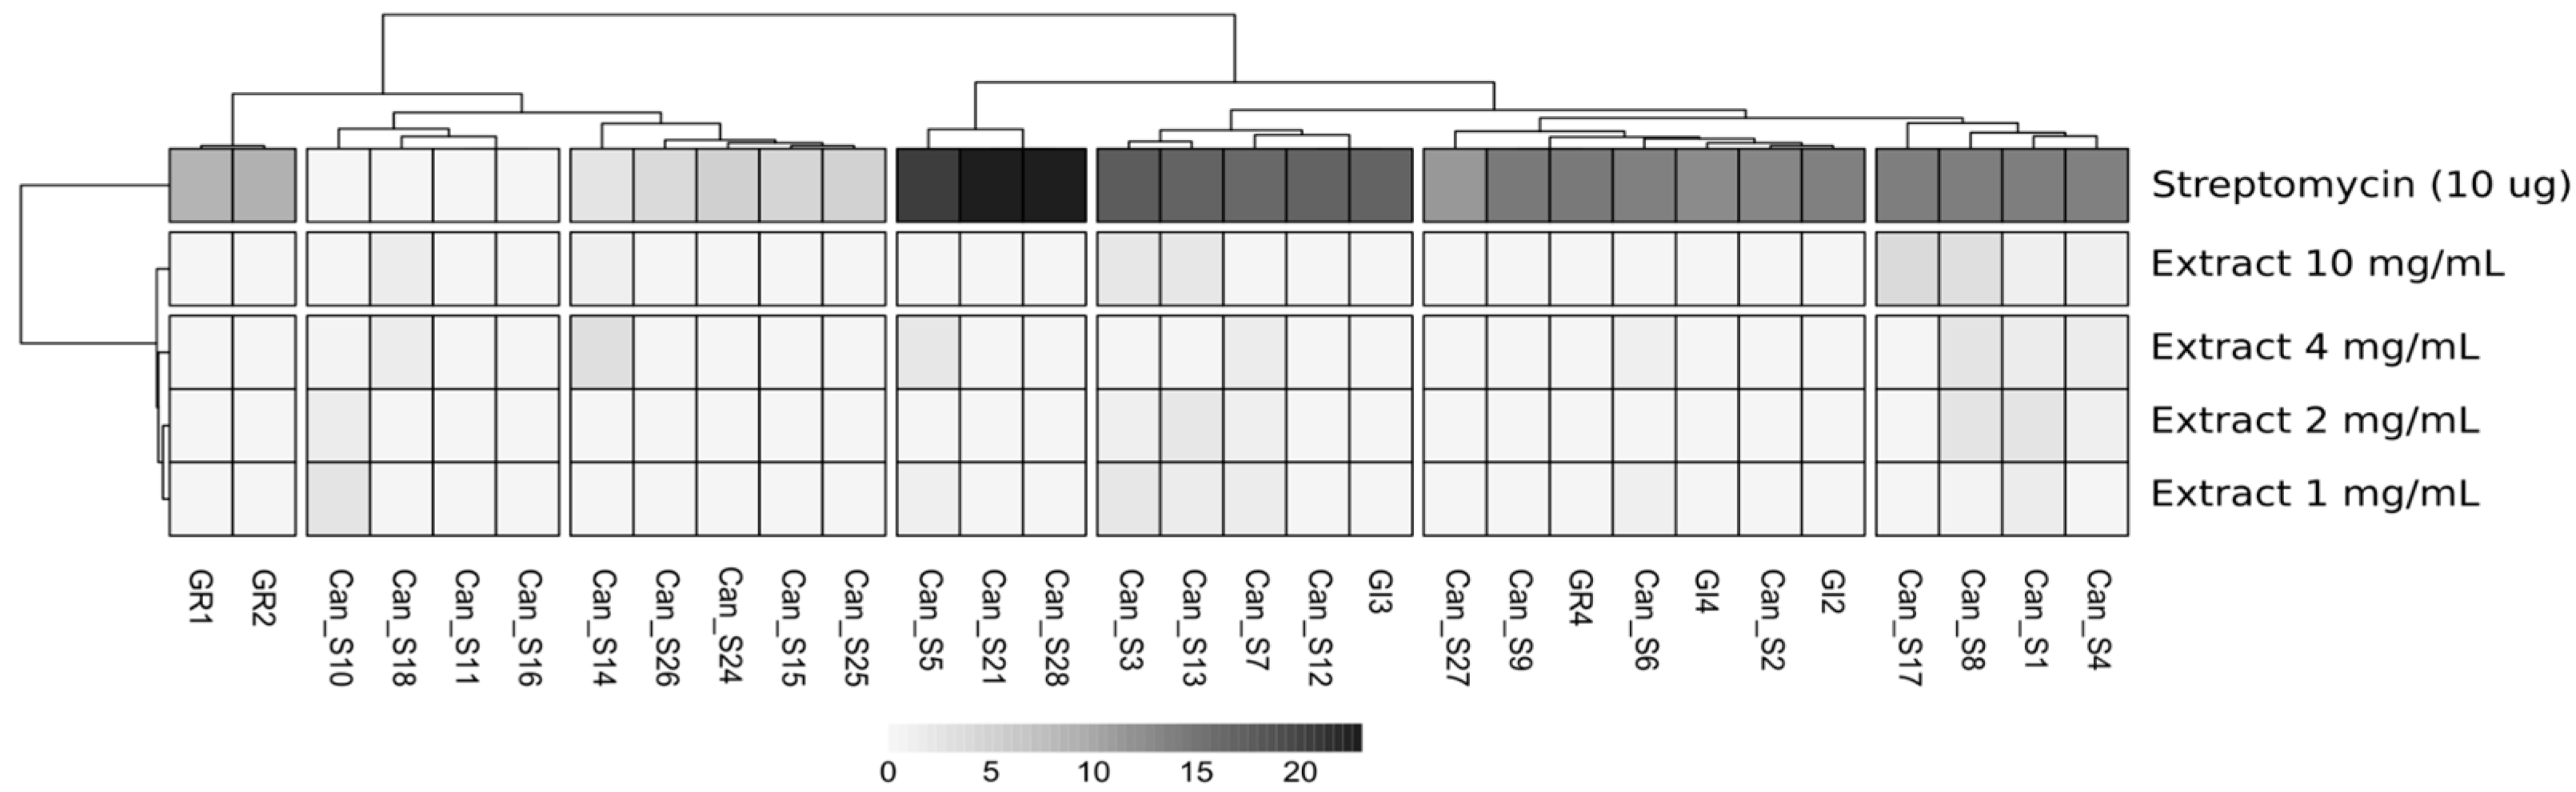
2.5.3. Disk-Diffusion Assay of Cannabis Sativa Seed Extracts and Multivariate Statistical Analysis of Phenotypic Traits
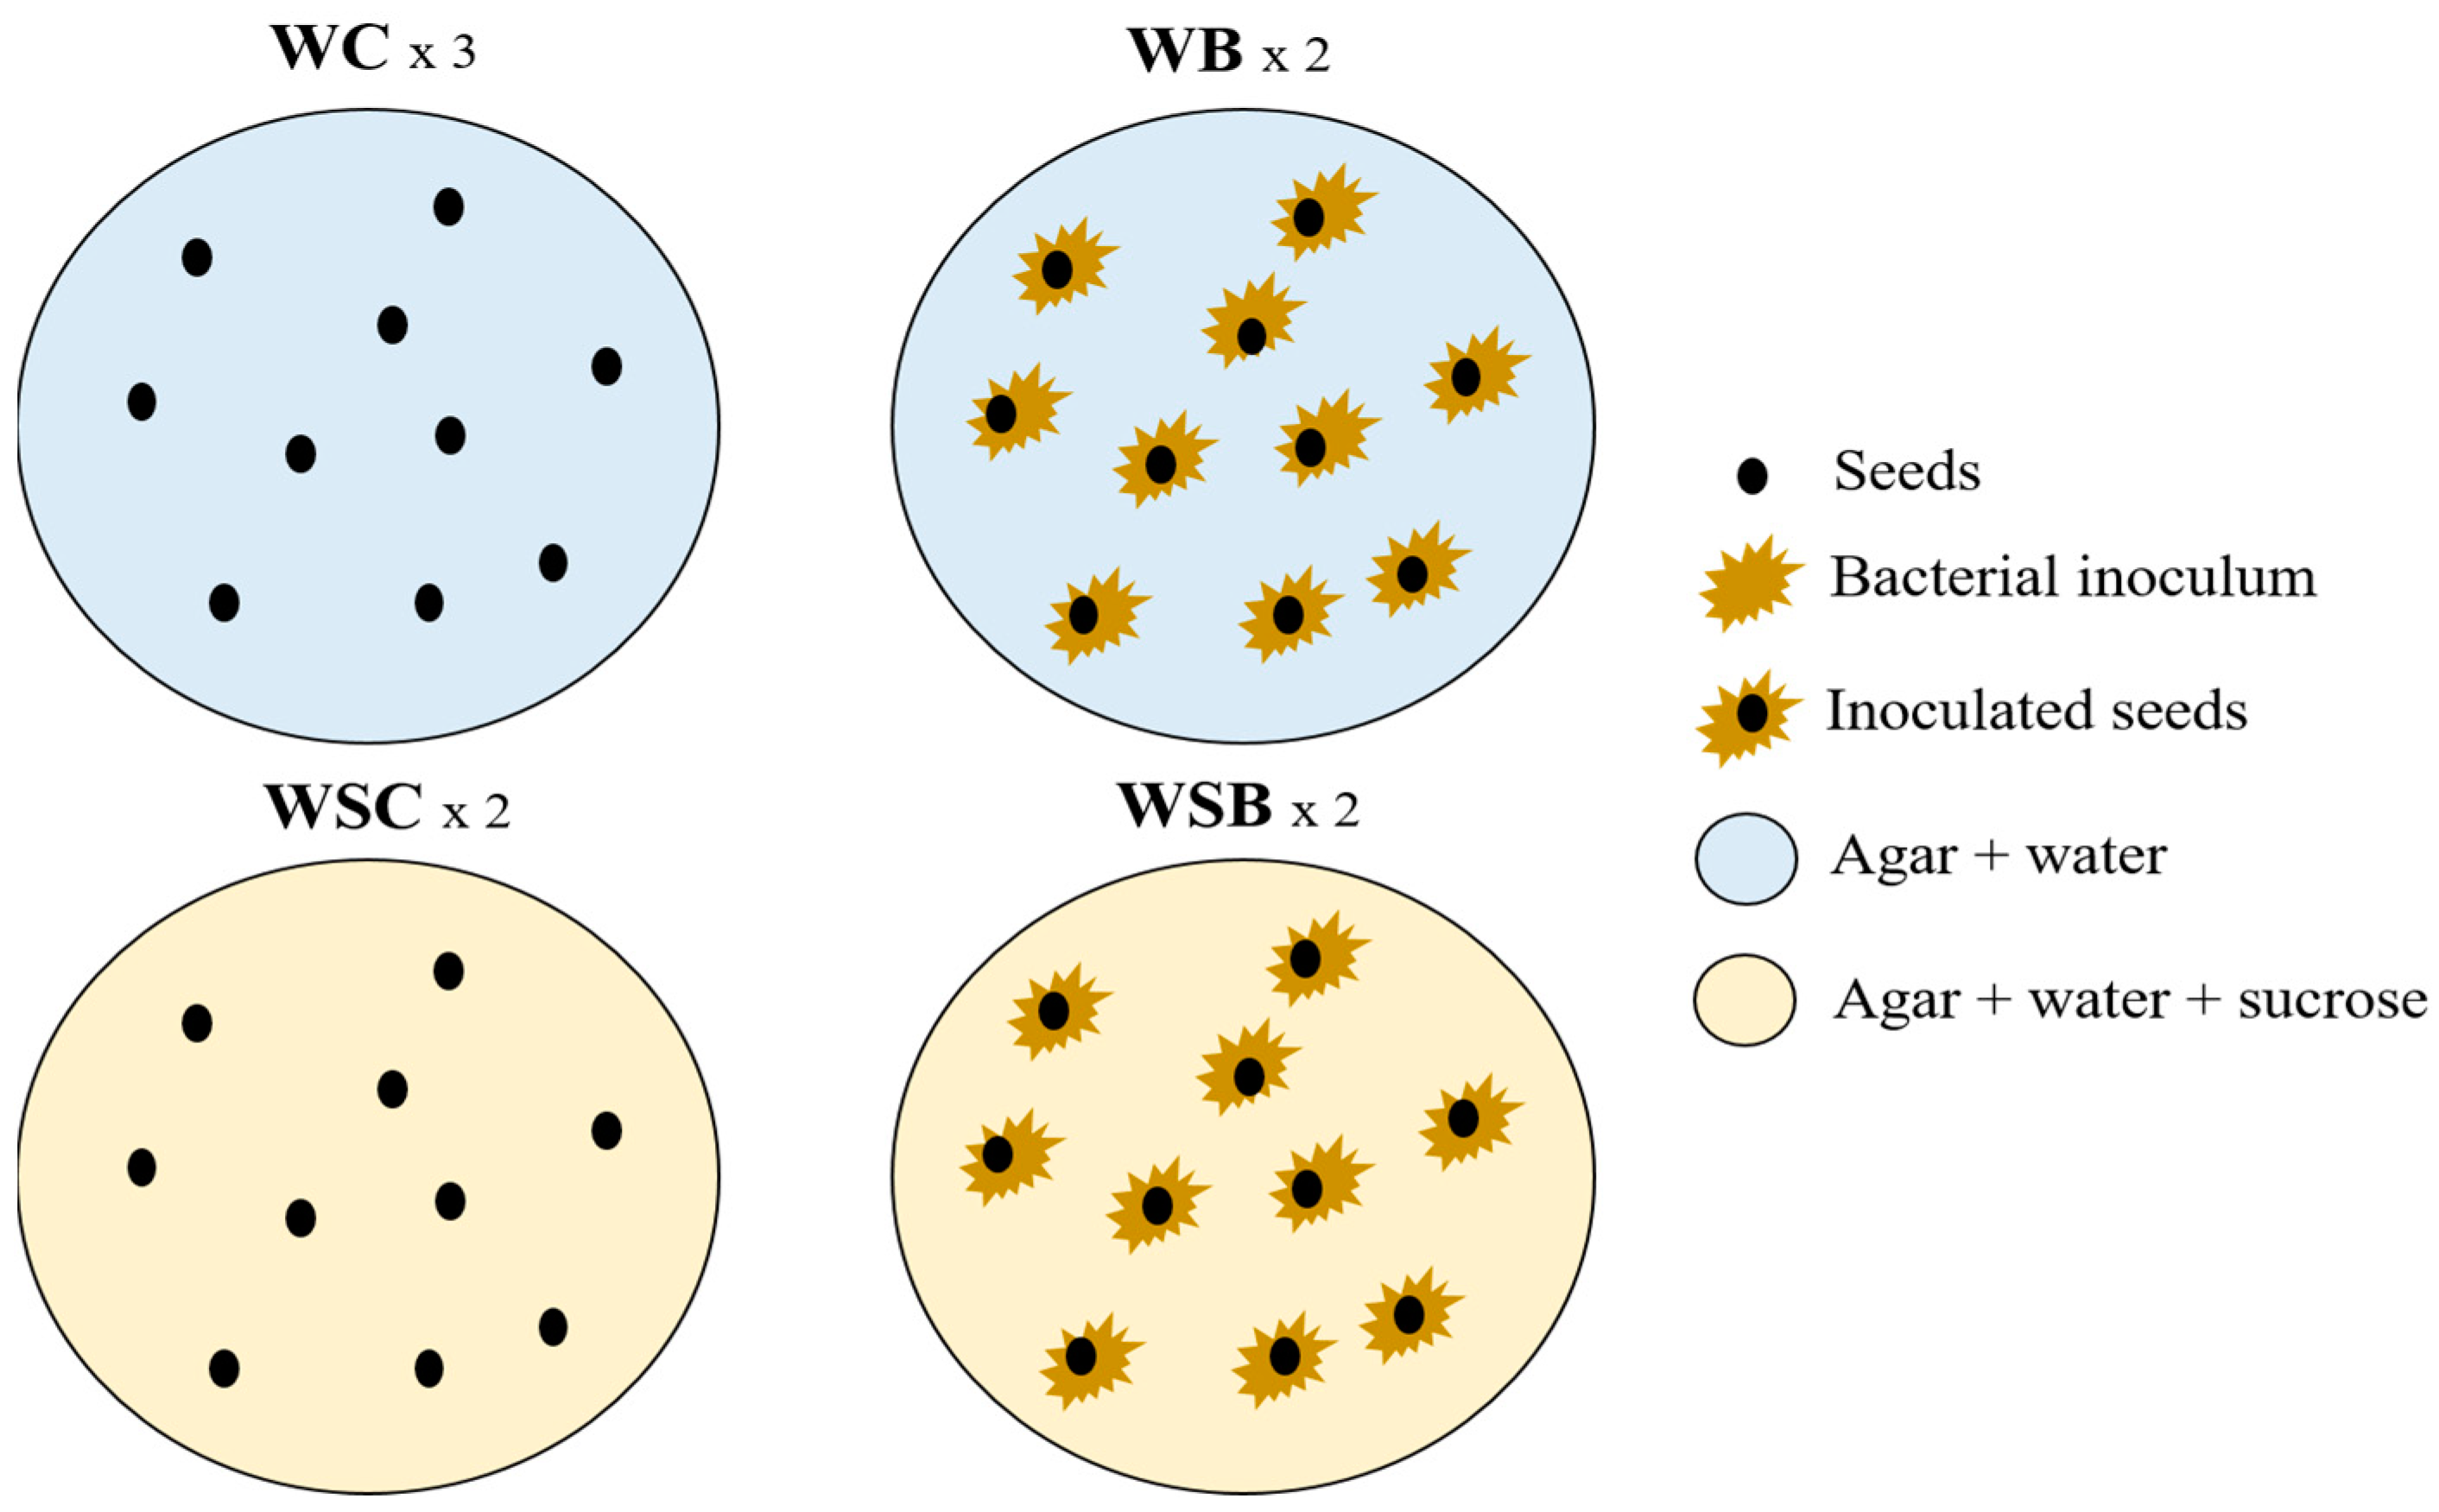
2.6. Seed Germination Tests and Evaluation of Morphometric Parameters
2.7. Nutraceutical Characteristics of Two-Week Sprouts of C. sativa
3. Results
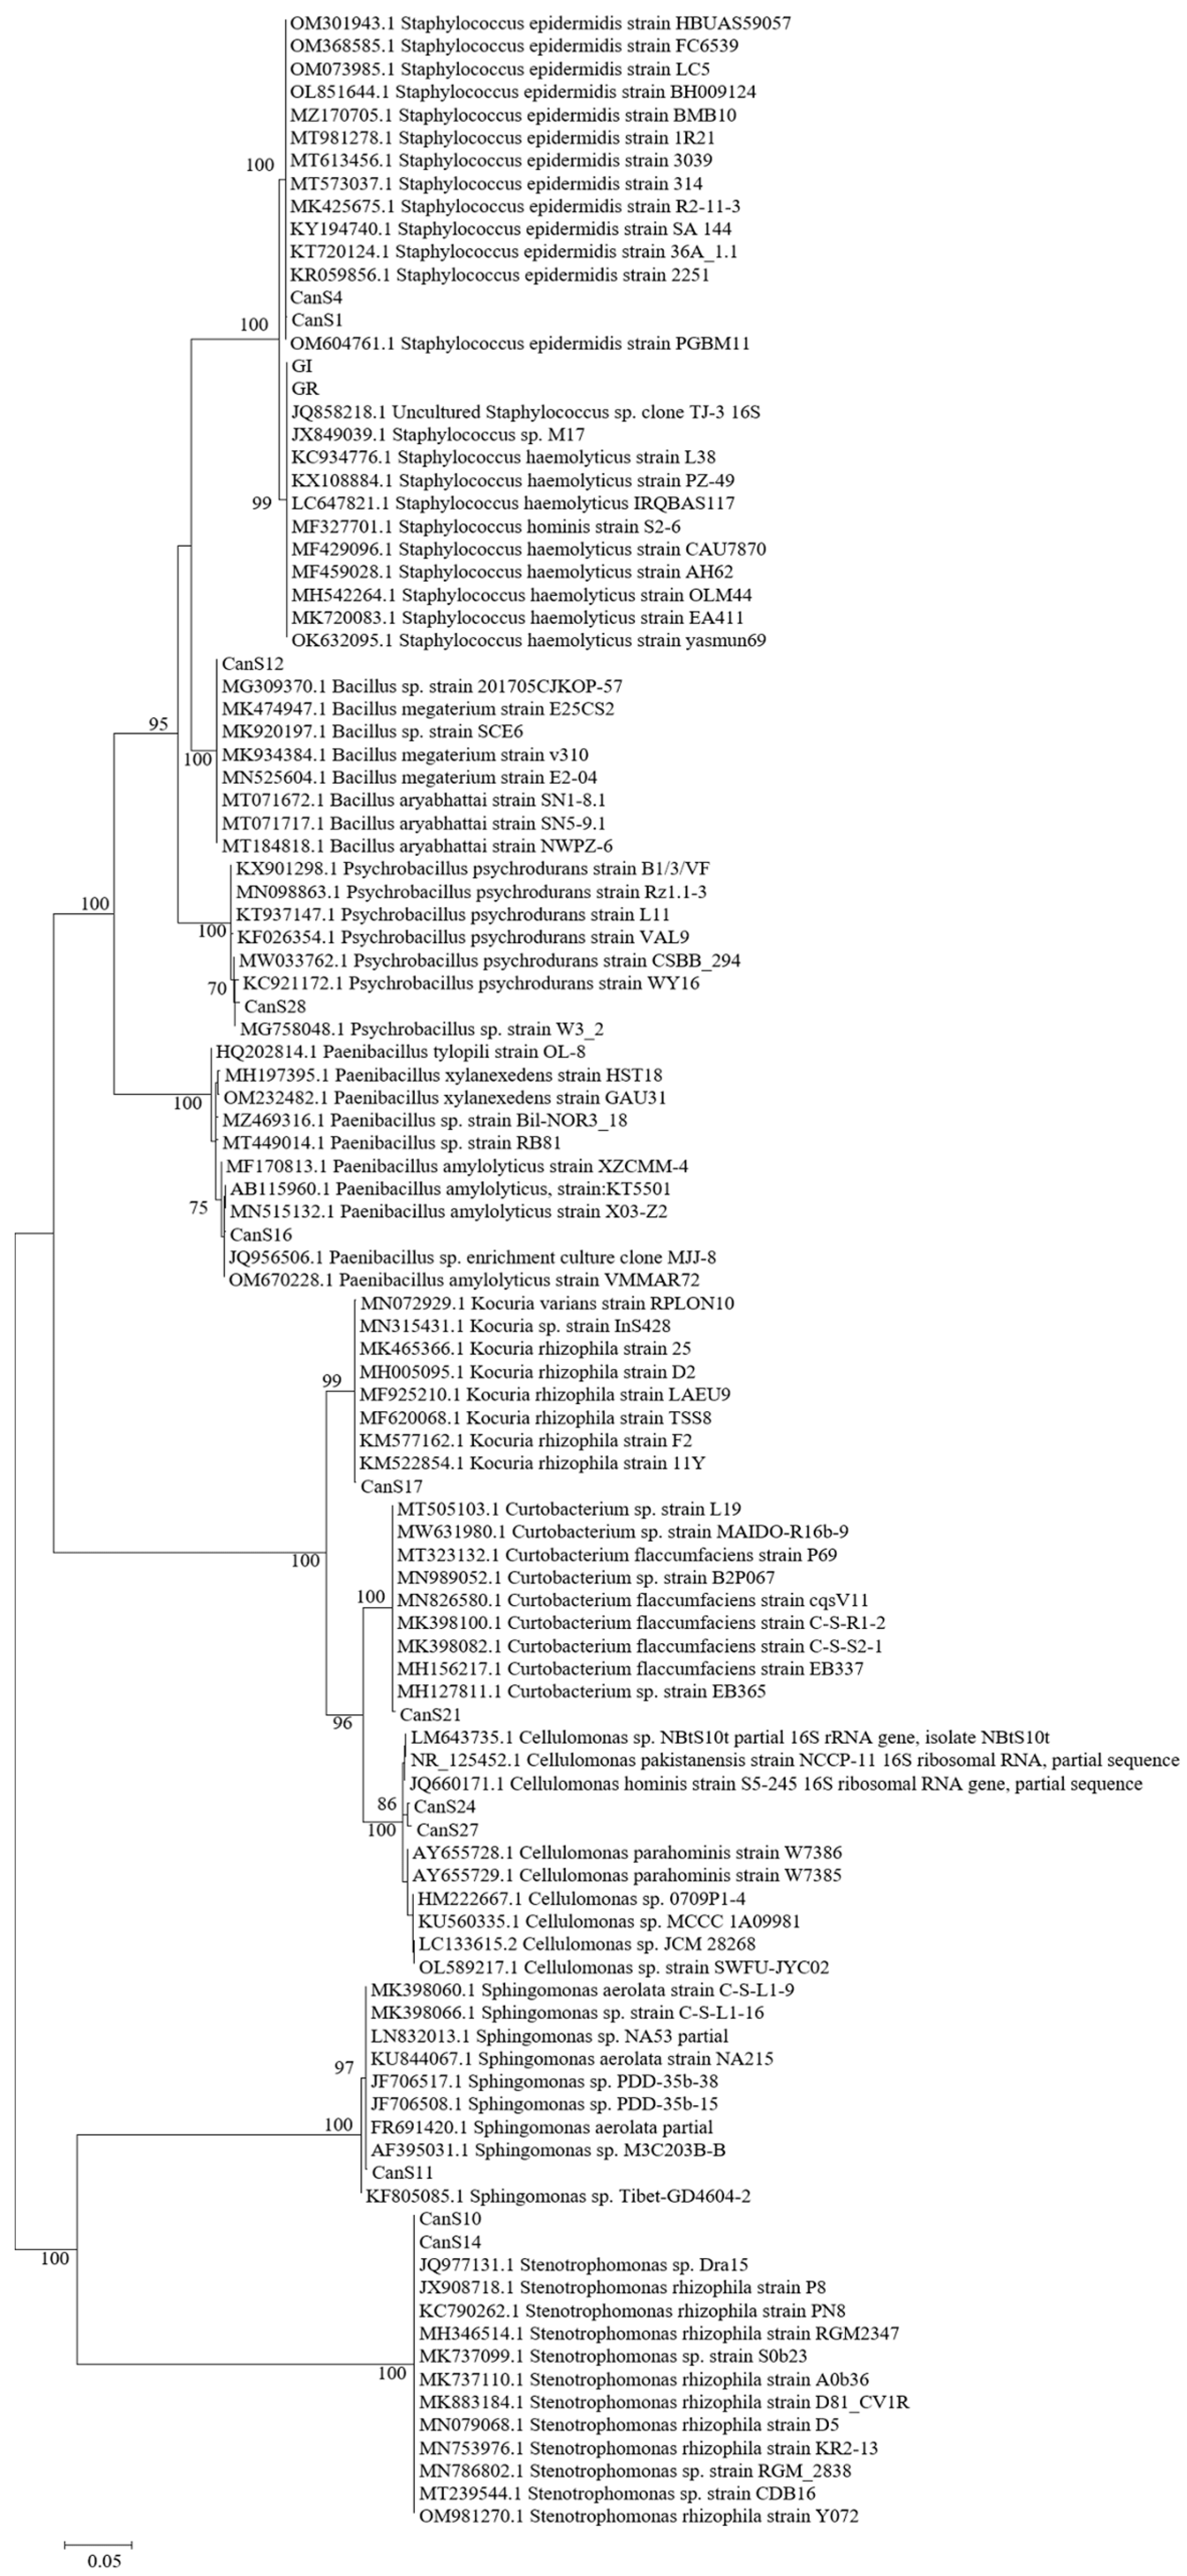
3.1. Molecular Characterization of the Isolated Strains and Phylogenetic Analysis
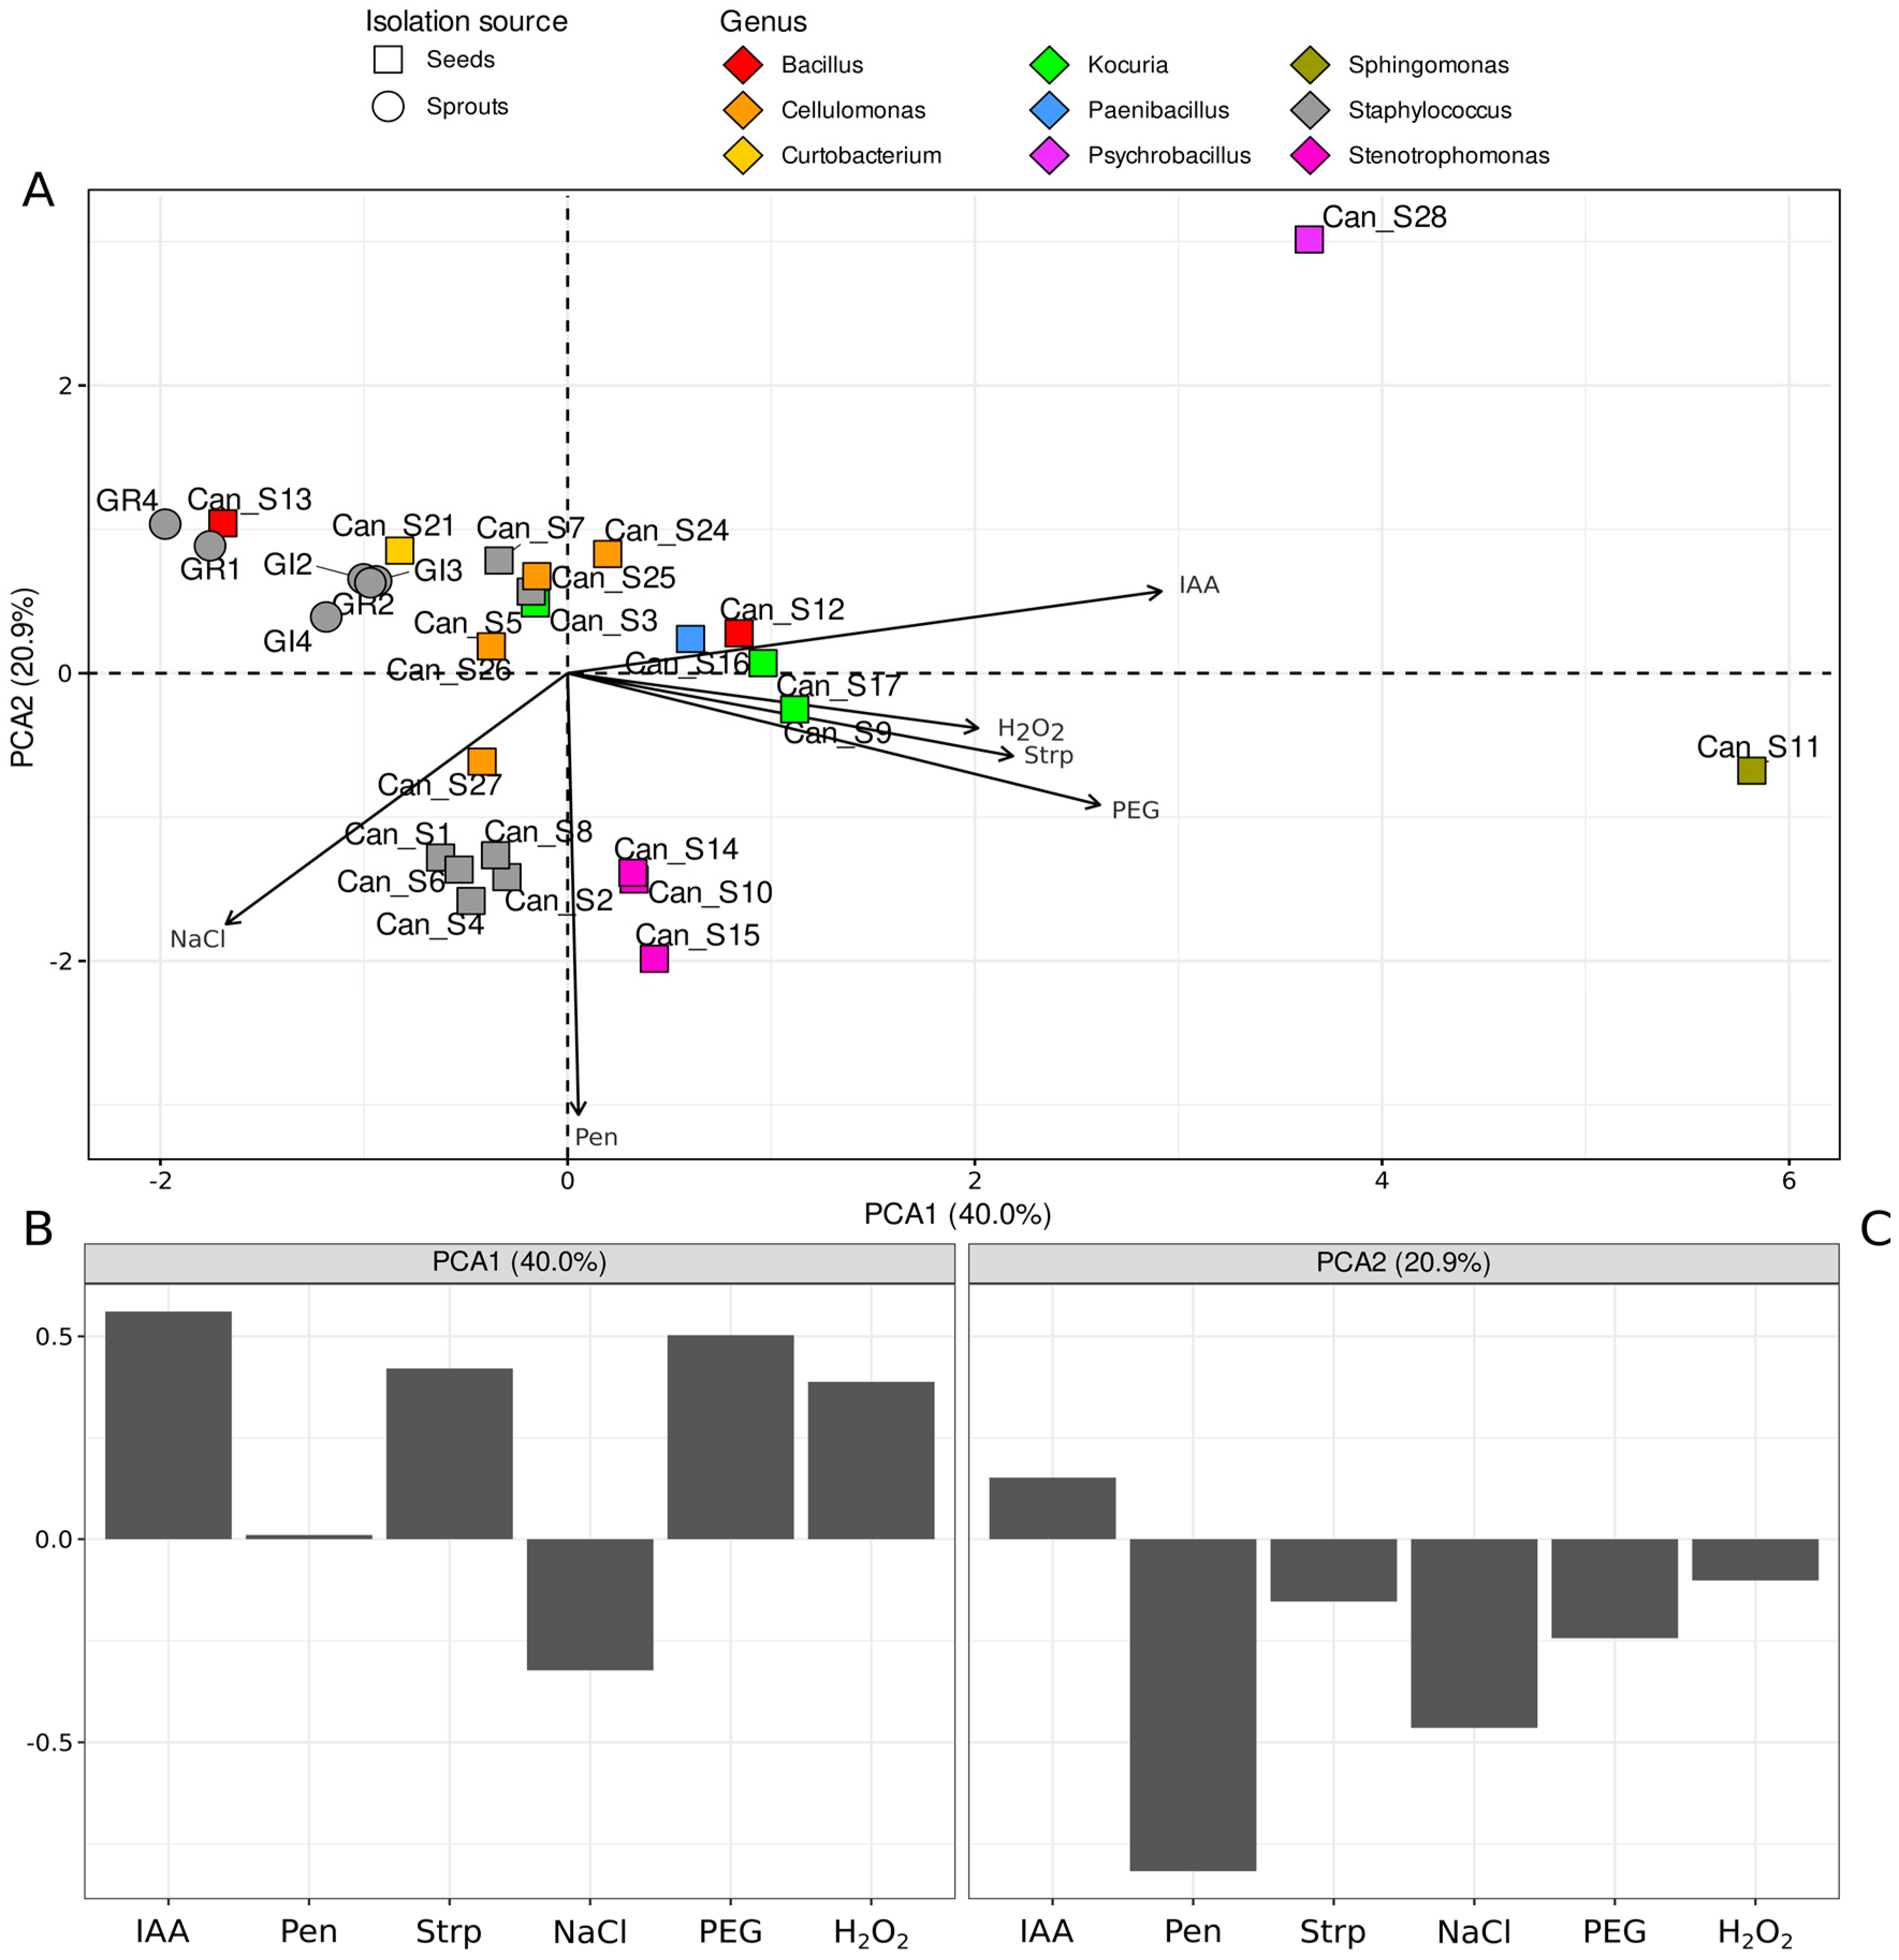
3.2. Phenotypic Characterization of Isolated Bacterial Strains: IAA Production, Environmental Stresses, and Seed Extract Susceptibility
3.3. Seed Germination Assay in Presence of Different Treatment Conditions
4. Discussion
5. Conclusions
Supplementary Materials
Author Contributions
Funding
Institutional Review Board Statement
Informed Consent Statement
Data Availability Statement
Acknowledgments
Conflicts of Interest
References
- Berg, G.; Grube, M.; Schloter, M.; Smalla, K. The plant microbiome and its importance for plant and human health. Front. Microbiol. 2014, 5, 491. [Google Scholar] [CrossRef]
- Afzal, I.; Shinwari, Z.K.; Sikandar, S.; Shahzad, S. Plant beneficial endophytic bacteria: Mechanisms, diversity, host range and genetic determinants. Microbiol. Res. 2019, 221, 36–49. [Google Scholar] [CrossRef]
- Harrison, J.G.; Griffin, E.A. The diversity and distribution of endophytes across biomes, plant phylogeny and host tissues: How far have we come and where do we go from here? Environ. Microbiol. 2020, 22, 2107–2123. [Google Scholar] [CrossRef]
- Khare, E.; Mishra, J.; Arora, N.K. Multifaceted Interactions Between Endophytes and Plant: Developments and Prospects. Front. Microbiol. 2018, 9, 2732. [Google Scholar] [CrossRef]
- Taulé, C.; Vaz-Jauri, P.; Battistoni, F. Insights into the early stages of plant–endophytic bacteria interaction. World J. Microbiol. Biotechnol. 2021, 37, 13. [Google Scholar] [CrossRef]
- Frank, A.C.; Guzmán, J.P.S.; Shay, J.E. Transmission of Bacterial Endophytes. Microorganisms 2017, 5, 70. [Google Scholar] [CrossRef]
- Truyens, S.; Weyens, N.; Cuypers, A.; Vangronsveld, J. Bacterial seed endophytes: Genera, vertical transmission and interaction with plants. Environ. Microbiol. Rep. 2014, 7, 40–50. [Google Scholar] [CrossRef]
- Shahzad, R.; Waqas, M.; Khan, A.L.; Asaf, S.; Khan, M.A.; Kang, S.-M.; Yun, B.-W.; Lee, I.-J. Seed-borne endophytic Bacillus amyloliquefaciens RWL-1 produces gibberellins and regulates endogenous phytohormones of Oryza sativa. Plant Physiol. Biochem. 2016, 106, 236–243. [Google Scholar] [CrossRef]
- Finkel, O.M.; Castrillo, G.; Paredes, S.H.; González, I.S.; Dangl, J.L. Understanding and exploiting plant beneficial microbes. Curr. Opin. Plant Biol. 2017, 38, 155–163. [Google Scholar] [CrossRef]
- Gagne-Bourgue, F.; Aliferis, K.A.; Seguin, P.; Rani, M.; Samson, R.; Jabaji, S. Isolation and characterization of indigenous endophytic bacteria associated with leaves of switchgrass (Panicum virgatum L.) cultivars. J. Appl. Microbiol. 2013, 114, 836–853. [Google Scholar] [CrossRef]
- Xu, M.; Sheng, J.; Chen, L.; Men, Y.; Gan, L.; Guo, S.; Shen, L. Bacterial community compositions of tomato (Lycopersicum esculentum Mill.) seeds and plant growth promoting activity of ACC deaminase producing Bacillus subtilis (HYT-12-1) on tomato seedlings. World J. Microbiol. Biotechnol. 2014, 30, 835–845. [Google Scholar] [CrossRef]
- Andre, C.M.; Hausman, J.-F.; Guerriero, G. Cannabis sativa: The Plant of the Thousand and One Molecules. Front. Plant Sci. 2016, 7, 19. [Google Scholar] [CrossRef]
- Frassinetti, S.; Moccia, E.; Caltavuturo, L.; Gabriele, M.; Longo, V.; Bellani, L.; Giorgi, G.; Giorgetti, L. Nutraceutical potential of hemp (Cannabis sativa L.) seeds and sprouts. Food Chem. 2018, 262, 56–66. [Google Scholar] [CrossRef]
- Gautam, A.K.; Kant, M.; Thakur, Y. Isolation of endophytic fungi from Cannabis sativa and study their antifungal potential. Arch. Phytopathol. Plant Prot. 2013, 46, 627–635. [Google Scholar] [CrossRef]
- Kusari, P.; Kusari, S.; Spiteller, M.; Kayser, O. Endophytic fungi harbored in Cannabis sativa L.: Diversity and potential as biocontrol agents against host plant-specific phytopathogens. Fungal Divers. 2013, 60, 137–151. [Google Scholar] [CrossRef]
- Scott, M.; Rani, M.; Samsatly, J.; Charron, J.-B.; Jabaji, S. Endophytes of industrial hemp (Cannabis sativa L.) cultivars: Identification of culturable bacteria and fungi in leaves, petioles, and seeds. Can. J. Microbiol. 2018, 64, 664–680. [Google Scholar] [CrossRef]
- Taghinasab, M.; Jabaji, S. Cannabis Microbiome and the Role of Endophytes in Modulating the Production of Secondary Metabolites: An Overview. Microorganisms 2020, 8, 355. [Google Scholar] [CrossRef]
- Gabriele, M.; Pucci, L. Chapter 23—Fermentation and germination as a way to improve cereals antioxidant and antiinflammatory properties. In Current Advances for Development of Functional Foods Modulating Inflammation and Oxidative Stress; Hernández-Ledesma, B., Martínez-Villaluenga, C., Eds.; Academic Press: Cambridge, MA, USA, 2022; pp. 477–497. [Google Scholar]
- Frassinetti, S.; Gabriele, M.; Moccia, E.; Longo, V.; Di Gioia, D. Antimicrobial and antibiofilm activity of Cannabis sativa L. seeds extract against Staphylococcus aureus and growth effects on probiotic Lactobacillus spp. LWT 2020, 124, 109149. [Google Scholar] [CrossRef]
- Chiellini, C.; Cardelli, V.; de Feudis, M.; Corti, G.; Cocco, S.; Agnelli, A.; Massaccesi, L.; Alessi, G.D.; Mengoni, A.; Mocali, S. Exploring the links between bacterial communities and magnetic susceptibility in bulk soil and rhizosphere of beech (Fagus sylvatica L.). Appl. Soil Ecol. 2019, 138, 69–79. [Google Scholar] [CrossRef]
- Chiellini, C.; Pasqualetti, C.; Lanzoni, O.; Fagorzi, C.; Bazzocchi, C.; Fani, R.; Petroni, G.; Modeo, L. Harmful Effect of Rheinheimera sp. EpRS3 (Gammaproteobacteria) Against the Protist Euplotes aediculatus (Ciliophora, Spirotrichea): Insights Into the Ecological Role of Antimicrobial Compounds From Environmental Bacterial Strains. Front. Microbiol. 2019, 10, 510. [Google Scholar] [CrossRef] [PubMed]
- Altschul, S.F.; Madden, T.L.; Schäffer, A.A.; Zhang, J.; Zhang, Z.; Miller, W.; Lipman, D.J. Gapped BLAST and PSI-BLAST: A new generation of protein database search programs. Nucleic Acids Res. 1997, 25, 3389–3402. [Google Scholar] [CrossRef] [PubMed]
- Chiellini, C.; Mariotti, L.; Reyes, T.H.; de Arruda, E.J.; Fonseca, G.G.; Guglielminetti, L. Remediation Capacity of Different Microalgae in Effluents Derived from the Cigarette Butt Cleaning Process. Plants 2022, 11, 1770. [Google Scholar] [CrossRef] [PubMed]
- Li, E.; de Jonge, R.; Liu, C.; Jiang, H.; Friman, V.-P.; Pieterse, C.M.J.; Bakker, P.A.H.M.; Jousset, A. Rapid evolution of bacterial mutualism in the plant rhizosphere. Nat. Commun. 2021, 12, 3829. [Google Scholar] [CrossRef]
- Chiellini, C.; Miceli, E.; Bacci, G.; Fagorzi, C.; Coppini, E.; Fibbi, D.; Bianconi, G.; Mengoni, A.; Canganella, F.; Fani, R. Spatial structuring of bacterial communities in epilithic biofilms in the Acquarossa river (Italy). FEMS Microbiol. Ecol. 2018, 94, fiy181. [Google Scholar] [CrossRef]
- Gordon, S.A.; Weber, R.P. Colorimetric Estimation of Indoleacetic Acid. Plant Physiol. 1951, 26, 192–195. [Google Scholar] [CrossRef]
- McFaland, J. Nephelometer: An instrument for media used for estimating the number of bacteria in suspensions used for calculating the opsonic index and for vaccines. JAMA 1907, 49, 1176–1178. [Google Scholar] [CrossRef]
- Bauer, A.W.; Kirby, W.M.; Sherris, J.C.; Turck, M. Antibiotic susceptibility testing by a standardized single disk method. Am. J. Clin. Pathol. 1966, 45, 493–496. [Google Scholar] [CrossRef]
- Kolde, R. pheatmap: Pretty Heatmaps; R Package Version 1.0.12; 2019. [Google Scholar]
- Team R Core. R: A Language and Environment for Statistical Computing, version 4.2; R Foundation for Statistical Computing: Vienna, Austria, 2022; Available online: https://www.r-project.org.
- Oksanen, J.; Simpson, G.; Blanchet, F.G.; Kindt, R.; Legendre, P.; Minchin, P.; O’hara, R.; Solymos, P.; Stevens, H.; Szöcs, E.; et al. Vegan Community Ecology Package; R Package Version 2.6-2 April 2022; 2022. [Google Scholar]
- Kassambara, A. rstatix: Pipe-Friendly Framework for Basic Statistical Tests; R Package Version 0.6.0; 2020. [Google Scholar]
- Kassambara, A. ggpubr: ‘ggplot2’ Based Publication Ready Plots, R Package version 0.4.0; 2020. [Google Scholar]
- Chiellini, C.; Serra, V.; Gammuto, L.; Ciurli, A.; Longo, V.; Gabriele, M. Evaluation of Nutraceutical Properties of Eleven Microalgal Strains Isolated from Different Freshwater Aquatic Environments: Perspectives for Their Application as Nutraceuticals. Foods 2022, 11, 654. [Google Scholar] [CrossRef]
- Colosimo, R.; Gabriele, M.; Cifelli, M.; Longo, V.; Domenici, V.; Pucci, L. The effect of sourdough fermentation on Triticum dicoccum from Garfagnana: 1H NMR characterization and analysis of the antioxidant activity. Food Chem. 2020, 305, 125510. [Google Scholar] [CrossRef]
- Mano, H.; Tanaka, F.; Watanabe, A.; Kaga, H.; Okunishi, S.; Morisaki, H. Culturable Surface and Endophytic Bacterial Flora of the Maturing Seeds of Rice Plants (Oryza sativa) Cultivated in a Paddy Field. Microbes Environ. 2006, 21, 86–100. [Google Scholar] [CrossRef] [Green Version]
- Elbeltagy, A.; Nishioka, K.; Suzuki, H.; Sato, T.; Sato, Y.-I.; Morisaki, H.; Mitsui, H.; Minamisawa, K. Isolation and characterization of endophytic bacteria from wild and traditionally cultivated rice varieties. Soil Sci. Plant Nutr. 2000, 46, 617–629. [Google Scholar] [CrossRef]
- Khan, A.L.; Waqas, M.; Kang, S.-M.; Al-Harrasi, A.; Hussain, J.; Al-Rawahi, A.; Al-Khiziri, S.; Ullah, I.; Ali, L.; Jung, H.-Y.; et al. Bacterial endophyte Sphingomonas sp. LK11 produces gibberellins and IAA and promotes tomato plant growth. J. Microbiol. 2014, 52, 689–695. [Google Scholar] [CrossRef] [PubMed]
- Asaf, S.; Numan, M.; Khan, A.L.; Al-Harrasi, A. Sphingomonas: From diversity and genomics to functional role in environmental remediation and plant growth. Crit. Rev. Biotechnol. 2020, 40, 138–152. [Google Scholar] [CrossRef] [PubMed]
- Xu, J.; Kloepper, J.W.; Huang, P.; McInroy, J.A.; Hu, C.H. Isolation and characterization of N2-fixing bacteria from giant reed and switchgrass for plant growth promotion and nutrient uptake. J. Basic Microbiol. 2018, 58, 459–471. [Google Scholar] [CrossRef] [PubMed]
- Badawy, M.; Eldin, A.; Abd-Elmonem, S.; Abdelsadek, S. Halotolerant microresidents of mangrove swamps are among the pillars of barley development in salt-affected environments. Int. J. Adv. Eng. Manag. Sci. 2016, 2, 1385. [Google Scholar]
- Hrynkiewicz, K.; Patz, S.; Ruppel, S. Salicornia europaea L. as an underutilized saline-tolerant plant inhabited by endophytic diazotrophs. J. Adv. Res. 2019, 19, 49–56. [Google Scholar] [CrossRef] [PubMed]
- Almuhayawi, M.S.; Abdel-Mawgoud, M.; Al Jaouni, S.K.; Almuhayawi, S.M.; Alruhaili, M.H.; Selim, S.; AbdElgawad, H. Bacterial Endophytes as a Promising Approach to Enhance the Growth and Accumulation of Bioactive Metabolites of Three Species of Chenopodium Sprouts. Plants 2021, 10, 2745. [Google Scholar] [CrossRef]
- Briatia, X.; Azad, M.O.K.; Khanongnuch, C.; Woo, S.H.; Park, C.H. Effect of Endophytic Bacterium Inoculation on Total Polyphenol and Flavonoid Contents of Tartary Buckwheat Sprouts. Korean J. Crop Sci. 2018, 63, 57–63. [Google Scholar] [CrossRef]
- Chen, L.; Xu, M.; Zheng, Y.; Men, Y.; Sheng, J.; Shen, L. Growth promotion and induction of antioxidant system of tomato seedlings (Solanum lycopersicum L.) by endophyte TPs-04 under low night temperature. Sci. Hortic. 2014, 176, 143–150. [Google Scholar] [CrossRef]
- Wei, Y.; Wang, X.; Shao, X.; Xu, F.; Wang, H. Sucrose treatment of mung bean seeds results in increased vitamin C, total phenolics, and antioxidant activity in mung bean sprouts. Food Sci. Nutr. 2019, 7, 4037–4044. [Google Scholar] [CrossRef]
- Busse, H.-J.; Denner, E.B.M.; Buczolits, S.; Salkinoja-Salonen, M.; Bennasar, A.; Kampfer, P. Sphingomonas aurantiaca sp. nov., Sphingomonas aerolata sp. nov. and Sphingomonas faeni sp. nov., air- and dustborne and Antarctic, orange-pigmented, psychrotolerant bacteria, and emended description of the genus Sphingomonas. Int. J. Syst. Evol. Microbiol. 2003, 53, 1253–1260. [Google Scholar] [CrossRef] [PubMed]
- Chiellini, C.; Maida, I.; Emiliani, G.; Mengoni, A.; Mocali, S.; Fabiani, A.; Biffi, S.; Maggini, V.; Gori, L.; Vannacci, A.; et al. Endophytic and rhizospheric bacterial communities isolated from the medicinal plants Echinacea purpurea and Echinacea angustifolia. Int. Microbiol. 2014, 17, 165–174. [Google Scholar] [CrossRef] [PubMed]
- Panchal, H.; Ingle, S. Isolation and Characterization of Endophytes from the Root of Medicinal Plant Chlorophytum borivilianum (Safed musli). J. Adv. Dev. Res. 2011, 2, 205–209. [Google Scholar]
- McInroy, J.A.; Kloepper, J.W. Survey of indigenous bacterial endophytes from cotton and sweet corn. Plant Soil 1995, 173, 337–342. [Google Scholar] [CrossRef]
- Surette, M.A.; Sturz, A.V.; Lada, R.R.; Nowak, J. Bacterial endophytes in processing carrots (Daucus carota L. var. sativus): Their localization, population density, biodiversity and their effects on plant growth. Plant Soil 2003, 253, 381–390. [Google Scholar] [CrossRef]
- Hung, P.; Annapurna, K. Isolation and characterization of endophytic bacteria in soybean (Glycine sp.). Omonrice 2004, 12, 92–101. [Google Scholar]
- Liu, Y.; Zuo, S.; Xu, L.; Zou, Y.; Song, W. Study on diversity of endophytic bacterial communities in seeds of hybrid maize and their parental lines. Arch. Microbiol. 2012, 194, 1001–1012. [Google Scholar] [CrossRef]
- Liu, Y.; Zuo, S.; Zou, Y.; Wang, J.; Song, W. Investigation on diversity and population succession dynamics of endophytic bacteria from seeds of maize (Zea mays L., Nongda108) at different growth stages. Ann. Microbiol. 2013, 63, 71–79. [Google Scholar] [CrossRef]
- Vendan, R.T.; Yu, Y.J.; Lee, S.H.; Rhee, Y.H. Diversity of endophytic bacteria in ginseng and their potential for plant growth promotion. J. Microbiol. 2010, 48, 559–565. [Google Scholar] [CrossRef]
- Alibrandi, P.; Cardinale, M.; Rahman, M.; Strati, F.; Ciná, P.; de Viana, M.L.; Giamminola, E.M.; Gallo, G.; Schnell, S.; de Filippo, C.; et al. The seed endosphere of Anadenanthera colubrina is inhabited by a complex microbiota, including Methylobacterium spp. and Staphylococcus spp. with potential plant-growth promoting activities. Plant Soil 2018, 422, 81–99. [Google Scholar] [CrossRef]
- Chaudhry, V.; Patil, P.B. Genomic investigation reveals evolution and lifestyle adaptation of endophytic Staphylococcus epidermidis. Sci. Rep. 2016, 6, 19263. [Google Scholar] [CrossRef] [PubMed]
- Chaudhry, V.; Patil, P.B. Evolutionary insights into adaptation of Staphylococcus haemolyticus to human and non-human niches. Genomics 2020, 112, 2052–2062. [Google Scholar] [CrossRef] [PubMed]
- Gan, H.Y.; Gan, H.M.; Savka, M.A.; Triassi, A.J.; Wheatley, M.S.; Smart, L.B.; Fabio, E.S.; Hudson, A.O. Whole-Genome Sequences of 13 Endophytic Bacteria Isolated from Shrub Willow (Salix) Grown in Geneva, New York. Genome Announc. 2014, 2, e00288-14. [Google Scholar] [CrossRef] [Green Version]
- Hong, J.; Kim, J.; Kim, B.-Y.; Park, J.-W.; Ryu, J.-G.; Roh, E. Complete Genome Sequence of Biofilm-Forming Strain Staphylococcus haemolyticus S167. Genome Announc. 2016, 4, e00567-16. [Google Scholar] [CrossRef]
- Naik, S.; Shaanker, R.U.; Ravikanth, G.; Dayanandan, S. How and why do endophytes produce plant secondary metabolites? Symbiosis 2019, 78, 193–201. [Google Scholar] [CrossRef]
- Wu, W.; Chen, W.; Liu, S.; Wu, J.; Zhu, Y.; Qin, L.; Zhu, B. Beneficial Relationships between Endophytic Bacteria and Medicinal Plants. Front. Plant Sci. 2021, 12, 646146. [Google Scholar] [CrossRef] [PubMed]


| Haplotype | Strains | Sequenced Strain | Acc nr. | Length (bp) | Similarity 1° Blast and Affiliation | Similarity 1° Described Blast and Affiliation | Phylum |
|---|---|---|---|---|---|---|---|
| A | Can_S1; Can_S2 | Can_S1 | ON965345 | 1119 | 99.91% Staphylococcus epidermidis MK425675.1 | Firmicutes | |
| B | Can_S3; Can_S9; Can_S17 | Can_S17 | ON965346 | 1080 | 99.72% Kocuria rhizophila strain 25, MK465366.1 | Actinobacteria | |
| C | Can_S4; Can_S5; Can_S6; Can_S7; Can_S8 | Can_S4 | ON965347 | 1029 | 100% Staphylococcus epidermidis MT613456.1 | Firmicutes | |
| D | Can_S10; Can_S14; Can_S15 | Can_S10 | ON965348 | 1033 | 100% Stenotrophomonas sp. MT239544.1 | 100% Stenotrophomonas rhizophila strain KR2-13, MN753976.1 | Proteobacteria (Gamma) |
| D | Can_S10; Can_S14; Can_S15 | Can_S14 | ON965349 | 1058 | 100% Stenotrophomonas rhizophila strain PN8 1, KC790262.1 | Proteobacteria (Gamma) | |
| E | Can_S12; Can_S13 | Can_S12 | ON965350 | 1059 | 100% Bacillus aryabhattai strain NWPZ-6, MT184818.1 | Firmicutes | |
| F | Can_S11; Can_S18 | Can_S11 | ON965351 | 1159 | 99.65% Sphingomonas sp. MK398066.1 | 99.65% Sphingomonas aerolata R-36940, FR691420.1 | Proteobacteria (Alpha) |
| G | Can_S16 | Can_S16 | ON965352 | 1088 | 99.91% Paenibacillus amylolyticus strain VMSES13, OM963148.1 | Firmicutes | |
| H | Can_S21 | Can_S21 | ON965353 | 1063 | 99.53% Curtobacterium sp. strain MAIDO-R16b-9 MW631980.1 | 99.53% Curtobacterium flaccumfaciens strain Cff1037, CP041259.1 | Actinobacteria |
| I | Can_S24; Can_S25; Can_S26 | Can_S24 | ON965354 | 1028 | 99.32% Cellulomonas sp. strain Y8, CP041203.1 | 99.22% Cellulomonas hominis strain S5-250 JQ660173.1 | Actinobacteria |
| L | Can_S27 | Can_S27 | ON965355 | 1015 | 99.41% Cellulomonas sp. strain UYSB125, MT229317.1 | 99.31% Cellulomonas hominis strain S5-250, JQ660173.1 | Actinobacteria |
| M | Can_S28 | Can_S28 | ON965356 | 1049 | 99.53% Psychrobacillus sp. strain W3_2, MG758048.1 | 99.43% Psychrobacillus psychrodurans strain CSBB_294, MW033762.1 | Firmicutes |
| N | GI_1; GI_2; GI_3; GI_4; GI_5; GI_6 | GI_2 | ON965357 | 1046 | 100% Bacterium strain MTL7-8 16S, MH151274.1 | 100% Staphylococcus haemolyticus strain EA411, MK720083.1 | Firmicutes |
| N | GR_1; GR_2; GR_3; GR_4; GR_5; GR_6; | GR_3 | ON965358 | 1151 | 100% Bacterium strain MTL7-8 16S, MH151274.1 | 100% Staphylococcus haemolyticus strain OLM44, MH542264.1 | Firmicutes |
| Strains | Haplotype | Taxonomy | Pen 5 µg mL−1 | Strp 1 µg mL−1 | NaCl 2% | PEG 6000 15% | H2O2 0.0025% |
|---|---|---|---|---|---|---|---|
| Can_S1 | A | Staphylococcus sp. | |||||
| Can_S2 | A | Staphylococcus sp. | |||||
| Can_S3 | B | Kocuria sp. | |||||
| Can_S9 | B | Kocuria sp. | |||||
| Can_S17 | B | Kocuria sp. | |||||
| Can_S4 | C | Staphylococcus sp. | |||||
| Can_S5 | C | Staphylococcus sp. | |||||
| Can_S6 | C | Staphylococcus sp. | |||||
| Can_S7 | C | Staphylococcus sp. | |||||
| Can_S8 | C | Staphylococcus sp. | |||||
| Can_S14 | D | Stenotrophomonas sp. | |||||
| Can_S10 | D | Stenotrophomonas sp. | |||||
| Can_S15 | D | Stenotrophomonas sp. | |||||
| Can_S12 | E | Bacillus sp. | |||||
| Can_S13 | E | Bacillus sp. | |||||
| Can_S11 | F | Sphingomonas sp. | |||||
| Can_S18 | F | Sphingomonas sp. | |||||
| Can_S16 | G | Paenibacillus sp. | |||||
| Can_S21 | H | Curtobacterium sp. | |||||
| Can_S24 | I | Cellulomonas sp. | |||||
| Can_S25 | I | Cellulomonas sp. | |||||
| Can_S26 | I | Cellulomonas sp. | |||||
| Can_S27 | L | Cellulomonas sp. | |||||
| Can_S28 | M | Psychrobacillus sp. | |||||
| GI2 | N | Staphylococcus sp. | |||||
| GI3 | N | Staphylococcus sp. | |||||
| GI4 | N | Staphylococcus sp. | |||||
| GR1 | N | Staphylococcus sp. | |||||
| GR2 | N | Staphylococcus sp. | |||||
| GR4 | N | Staphylococcus sp. |
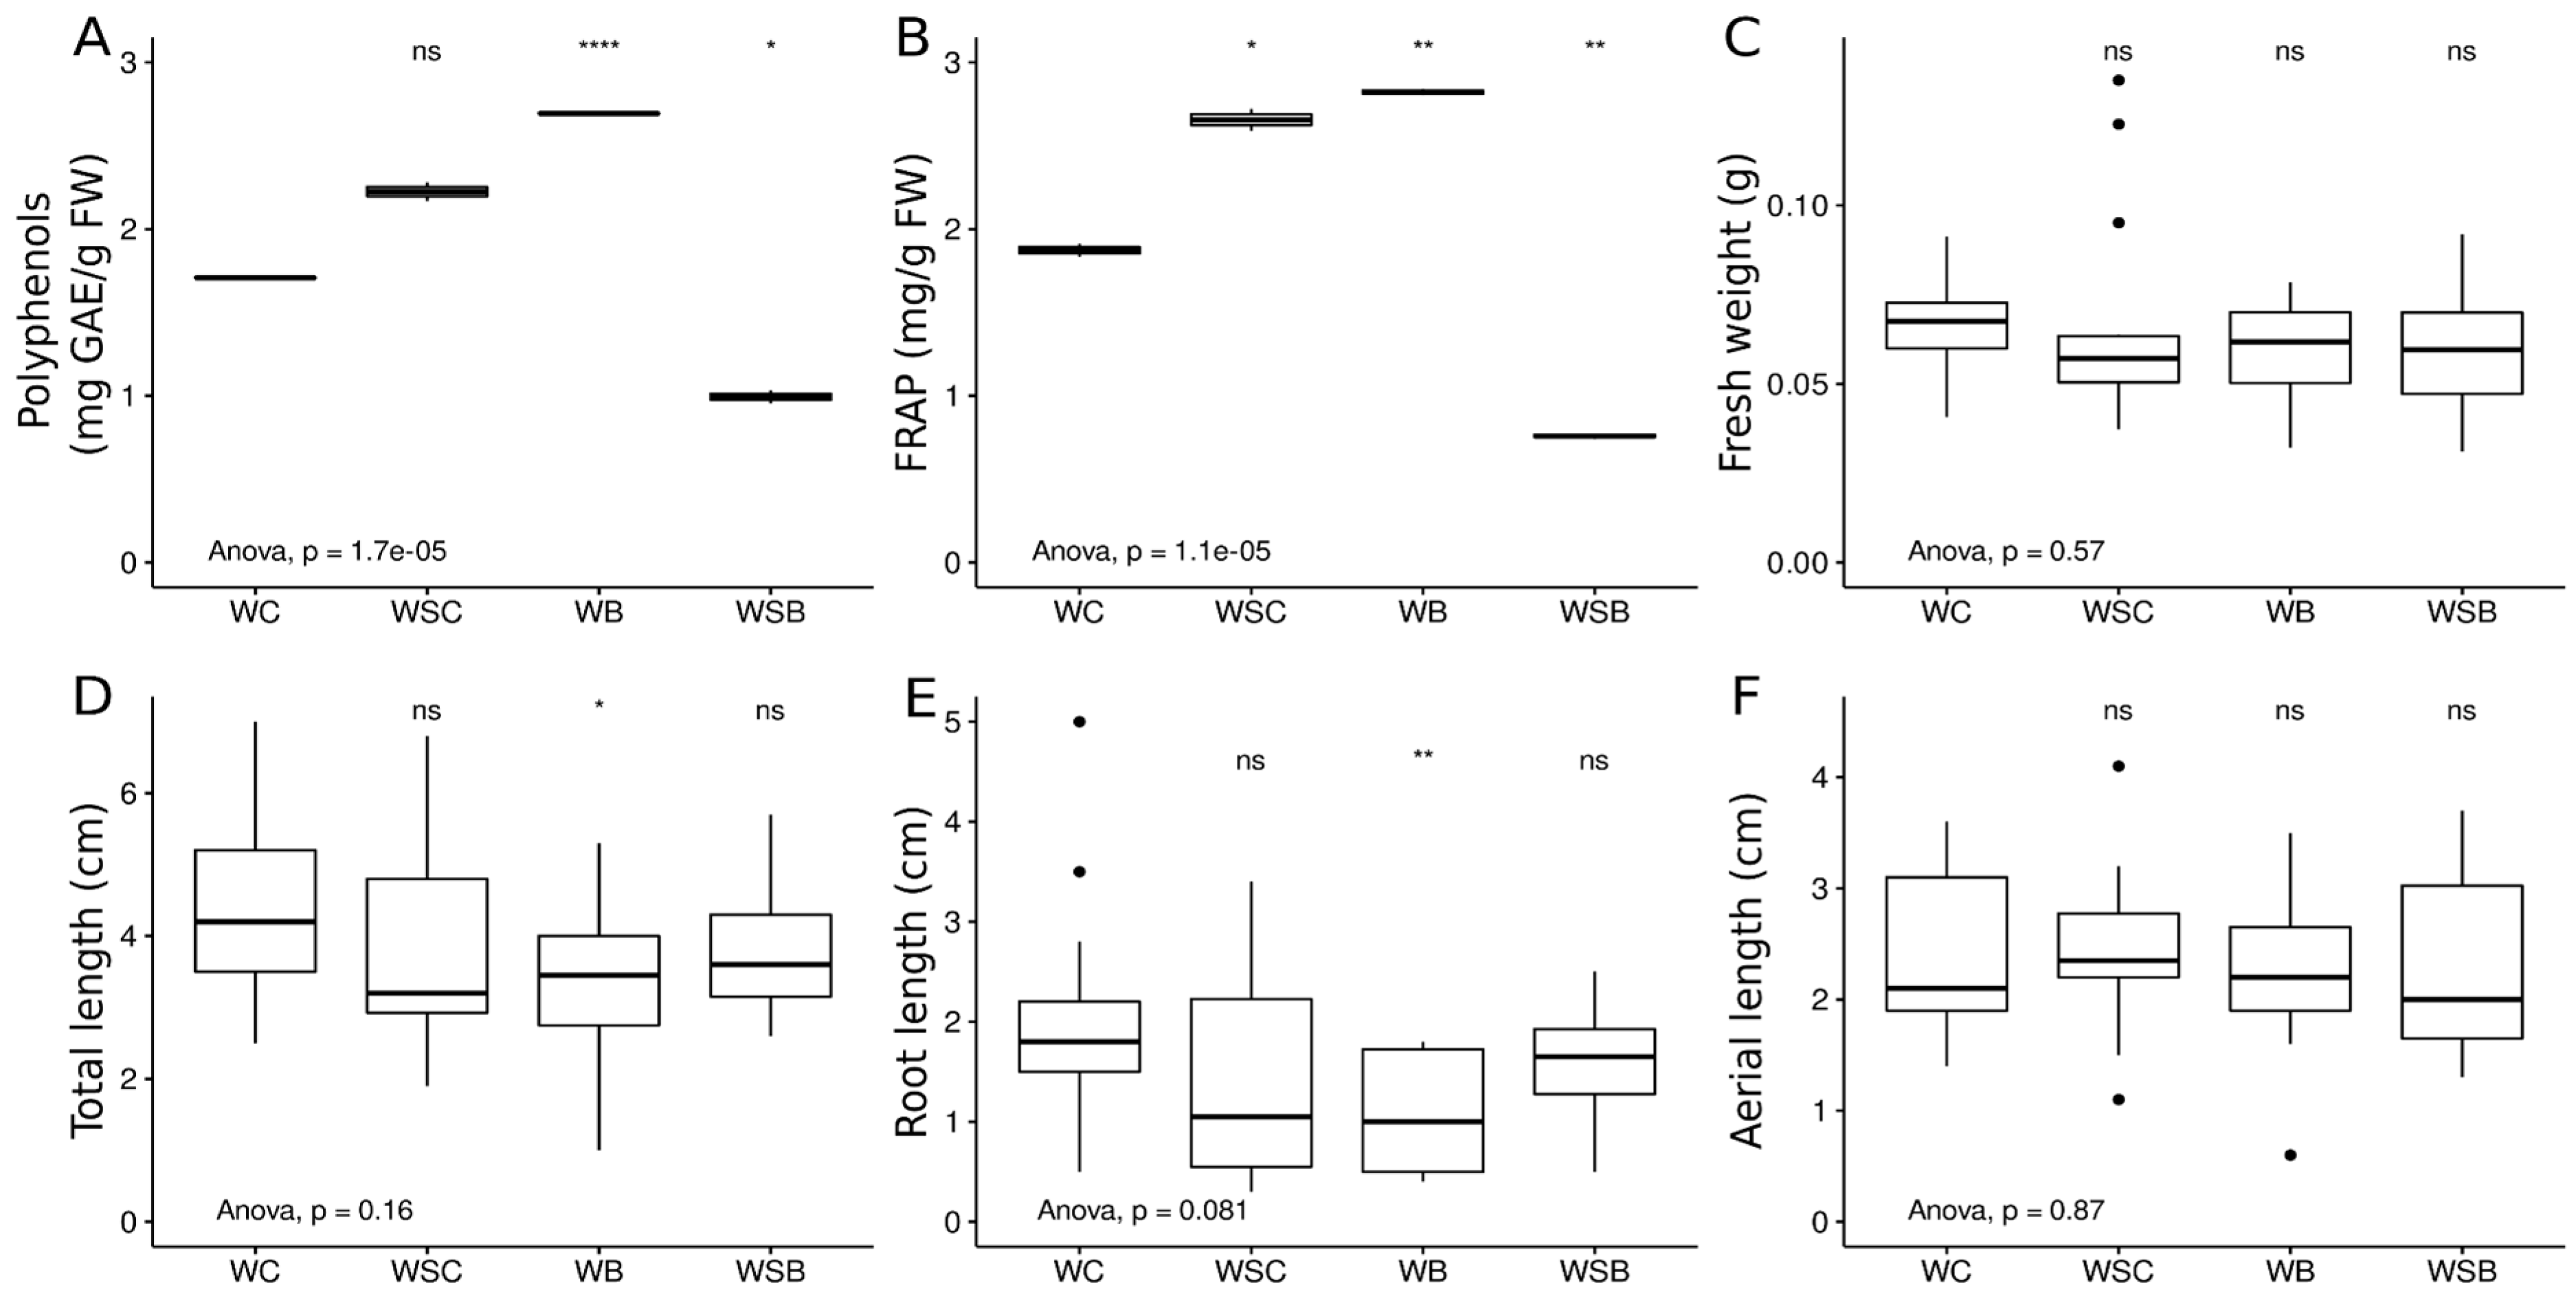
| % Seeds Germinated | Fresh Biomass | Total Length | Root Length | Aerial Part Length | Polyphenols | FRAP | |
|---|---|---|---|---|---|---|---|
| WC | 70% | 0.067 ± 0.013 | 4.362 ± 1.178 | 1.943 ± 1.006 | 2.419 ± 0.698 | 1.707 ± 0.006 | 1.873 ± 0.055 |
| WB | 60% | 0.059 ± 0.016 | 3.333 ± 1.184 | 1.116 ± 0.581 | 2.216 ± 0.732 | 2.693 ± 0.004 | 2.821 ± 0.026 |
| WSC | 70% | 0.066 ± 0.03 | 3.893 ± 1.52 | 1.486 ± 1.073 | 2.407 ± 0.757 | 2.225 ± 0.08 | 2.655 ± 0.093 |
| WSB | 60% | 0.059 ± 0.017 | 3.866 ± 0.982 | 1.575 ± 0.561 | 2.291 ± 0.842 | 0.994 ± 0.055 | 0.758 ± 0.023 |
Publisher’s Note: MDPI stays neutral with regard to jurisdictional claims in published maps and institutional affiliations. |
© 2022 by the authors. Licensee MDPI, Basel, Switzerland. This article is an open access article distributed under the terms and conditions of the Creative Commons Attribution (CC BY) license (https://creativecommons.org/licenses/by/4.0/).
Share and Cite
Gabriele, M.; Vitali, F.; Chelucci, E.; Chiellini, C. Characterization of the Cultivable Endophytic Bacterial Community of Seeds and Sprouts of Cannabis sativa L. and Perspectives for the Application as Biostimulants. Microorganisms 2022, 10, 1742. https://doi.org/10.3390/microorganisms10091742
Gabriele M, Vitali F, Chelucci E, Chiellini C. Characterization of the Cultivable Endophytic Bacterial Community of Seeds and Sprouts of Cannabis sativa L. and Perspectives for the Application as Biostimulants. Microorganisms. 2022; 10(9):1742. https://doi.org/10.3390/microorganisms10091742
Chicago/Turabian StyleGabriele, Morena, Francesco Vitali, Elisa Chelucci, and Carolina Chiellini. 2022. "Characterization of the Cultivable Endophytic Bacterial Community of Seeds and Sprouts of Cannabis sativa L. and Perspectives for the Application as Biostimulants" Microorganisms 10, no. 9: 1742. https://doi.org/10.3390/microorganisms10091742