Article

Evaluation and Simulation Analysis of Mixing Performance for Gas Fuel Direct Injection Engine under Multiple Working Conditions

School of Automotive and Traffic Engineering, Jiangsu University of Technology, Changzhou 213001, China
*
Author to whom correspondence should be addressed.
Actuators 2023, 12(6), 239; https://doi.org/10.3390/act12060239
Submission received: 23 May 2023 / Revised: 6 June 2023 / Accepted: 7 June 2023 / Published: 8 June 2023
(This article belongs to the Special Issue Linear Motors and Direct-Drive Technology)

Abstract

:
Gas fuel direct injection (DI) technology can improve the control precision of the in-cylinder mixing and combustion process and effectively avoid volumetric efficiency reduction in a compressed natural gas (CNG) engine, which has been a tendency. However, compared with the port fuel injection (PFI) method, the former’s mixing path and duration are shortened greatly, which often leads to poor mixing uniformity. What is worse, the in-cylinder mixing performance would be seriously affected by engine working conditions, such as engine speed and load. Based on this situation, the fluid mechanics software FLUENT is used in this article, and the computational fluid dynamics (CFD) model of the injection and mixing process in a gas-fueled direct injection engine is established. A quantitative evaluation mechanism of the in-cylinder mixing performance of the CNG engine is proposed to explore the influencing rule of different engine speeds and loads on the mixing process and performance. The results indicate that phase space analysis can accurately reflect the characteristics of the mixture mixing process. The gas fuel mixture rapidly occupies the cylinder volume in the injection stage. During the transition stage, the gas fuel mixture is in a highly transient state. The diffusion stage is characterized by the continuous homogenization of the mixture. The in-cylinder mixing performance is linearly dependent on the engine’s working condition in the phase space.

1. Introduction

The energy crisis and environmental pollution are the two major challenges facing current social development. The transportation industry is one of the main contributors to the energy consumption and emission growth, and its share continues to grow [1]. Vigorously promoting orthodox car energy conservation and emission reductions, as well as the industrialization of new energy vehicles, will become major challenges which urgently need to be addressed in the current transportation industry and pressing tasks for promoting the sustainable development of the transportation industry [2]. Compared to traditional diesel fuel, the use of natural gas (NG) engines can significantly reduce pollution from sulfur dioxide, nitrogen oxide and CO2 in emissions. CNG engines have been widely used in key areas of the national economy, including automobiles (including sedans, buses, trucks, etc.), ships and distributed power stations [3,4].
Currently, the fuel supply system of CNG engines can be classified as in-cylinder direct injection (DI) and port fuel injection (PFI) [5]. The PFI mode reduces the CNG engine’s volumetric efficiency, with engines having lower power output than gasoline and diesel engines with the same displacement [6]. Moreover, it is difficult to achieve accurate control of the mixing and combustion process for PFI, which limits the development of CNG engines. With the maturity of DI technology, the combination of gas fuel and DI technology will become a development trend in future [7,8,9]. The gas fuel DI technology can eliminate the volumetric efficiency loss due to the PFI mode, avoid fuel loss during the scavenging process and facilitate the suppression of knocking. The DI technology enables the enhanced control of the mixing and combustion process by optimizing the matching of injection timing, air–fuel ratio and ignition advance angle [7].
The mixing performance for CNG engines can be divided into homogeneous mixtures and stratified mixtures [8,9]. At high loads and steady speeds, the gas fuel needs to be sufficiently mixed with air to increase the engine power and meet the vehicle’s driving performance. The homogeneous mixing method can ensure that the fuel is fully mixed, which makes the fuel easier to burn, thus improving thermal efficiency and dynamic performance [10]. However, under a partial load, incomplete combustion and the wastage of energy may occur with the homogeneous mixing method, where some exhaust is not fully burned, which can lead to environmental pollution. In this case, a stratified mixing method is necessary [11]. A stratified mixing method can make the engine run smoothly by reducing the noise and vibration [12].
The energy power and economy performance of engines are affected by the in-cylinder mixing performance of the gas fuel DI technology. Compared with the PFI mode, the mixing path and duration are shortened greatly for the DI mode [13]. In contrast to liquid fuels, gas fuel injection and mixing processes do not require complex physical changes such as phase transitions. However, due to the lower gas density, it is more difficult for the gas fuel to fully mix with the air. What is worse, the mixing performance is greatly affected by variable factors, such as engine speed and load [14]. The formation of the mixture of in-cylinder DI engines was studied by Karri Keskinen et al. through computational fluid dynamics (CFD) [15]. They designed three mixing performance metrics based on injection pressure and nozzle type to describe the mixing performance of the gas fuel throughout the compression stroke. An objective classification method of mixture distribution in the combustion chamber of a DI engine was proposed by S.K et al. [16]. On this basis, four types of mixture distribution, random, linear, Gaussian and parabolic, were simulated in the combustion chamber of a DI engine by using the CFD method. The effects of different engines’ intake pressure, intake temperature and engine speed on mixture uniformity were studied by Mohammad et al. [17], and it was found that intake pressure and speed had greater effects on the mixture gas fuel. The numerical simulation of the formation mechanism of the mixture in-cylinder was carried out by Baratta et al. [18]. The research results showed that the mixing rate of gas fuel and air was dominated by the fuel jet and the tumble and vortex flow, and the mixing duration had an influence on the mixing performance of gas fuel.
In view of this, a CFD model of the DI mixing process for CNG engines is established. A quantitative evaluation mechanism for the mixing performance of CNG engines is proposed. The influence of different engine speeds and loads on the mixing process and mixing performance is investigated in this paper. This study has significant theoretical implications for improving the power and emission performance of CNG DI engines and increasing engine efficiency.

2. Model and Research Method
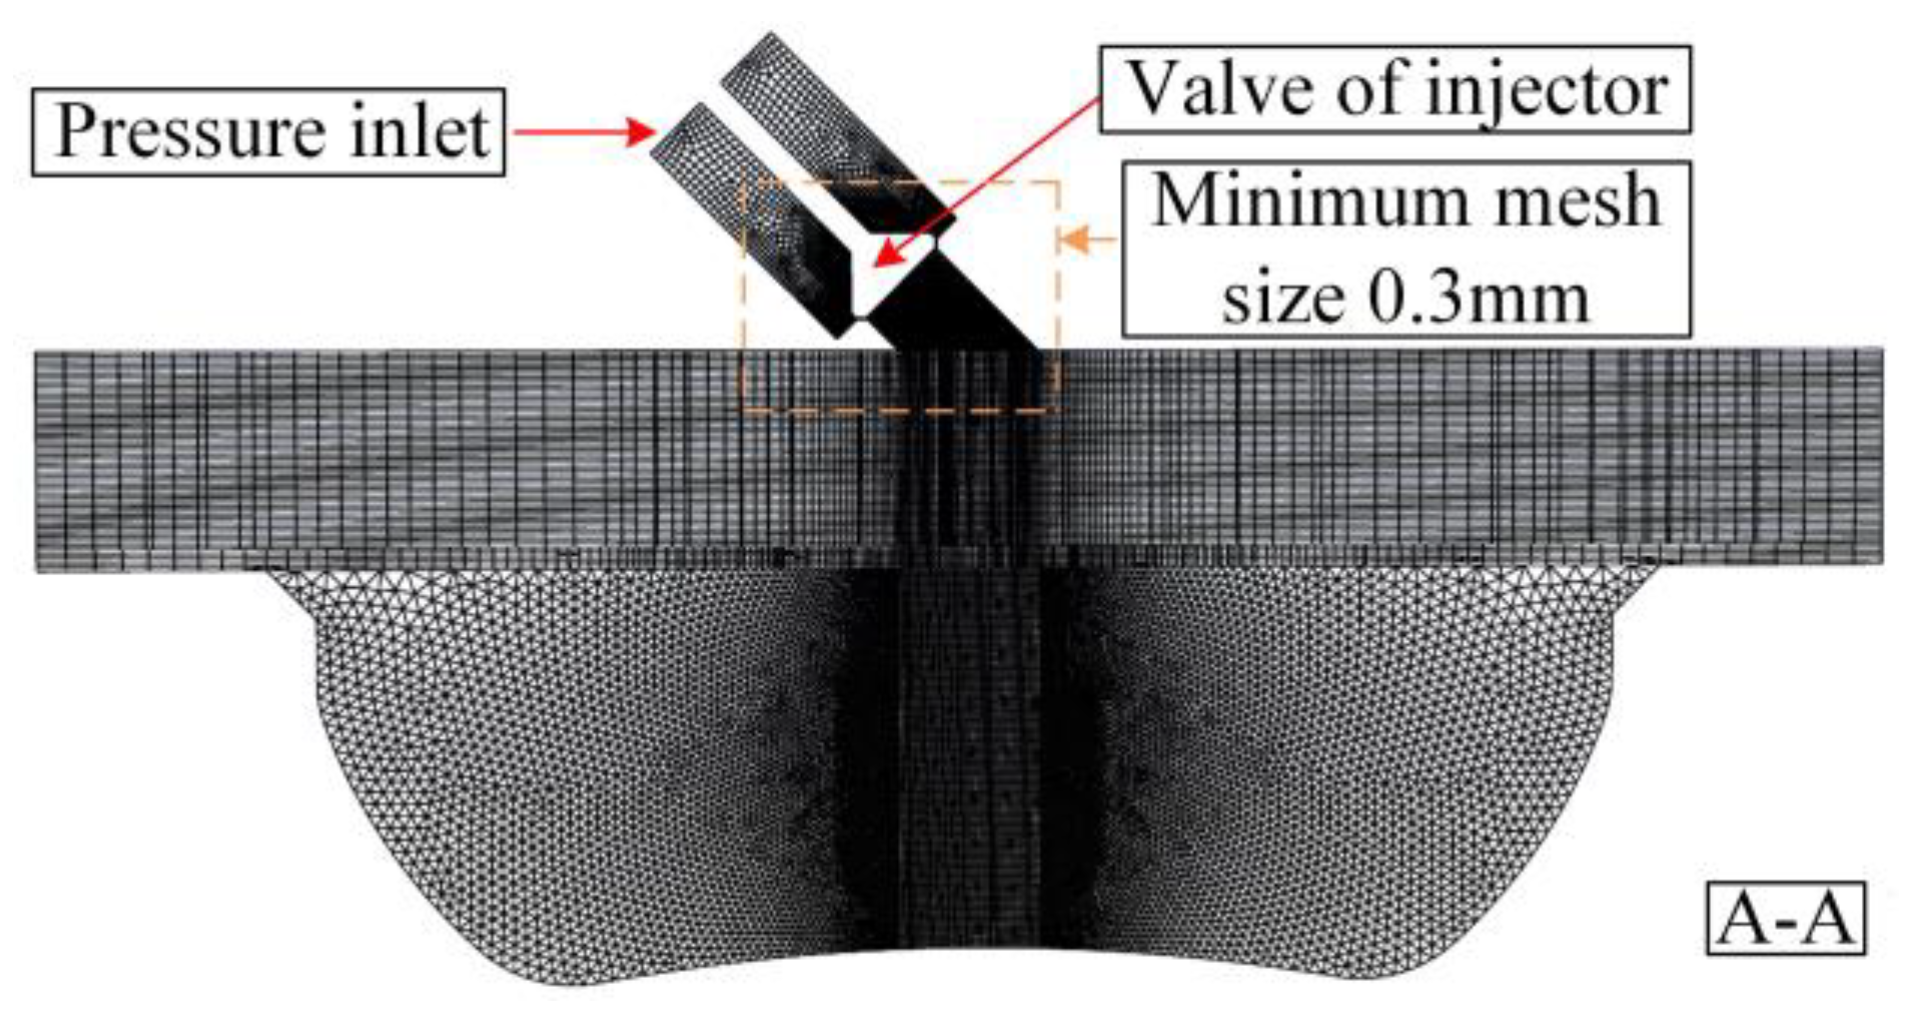
2.1. Model

This study is based on a certain type of CNG DI engine. The main engine parameters are shown in Table 1. Based on the power requirements of the prototype engine, the authors have previously designed a high-pressure CNG injection device based on a moving-coil electromagnetic linear actuator and mushroom-type poppet valve [19], with the main parameters shown in Table 2. Building upon the high-pressure CNG injection device studied in the author’s previous research, this article further investigates the in-cylinder mixing performance of gas-fueled engines using this type of injection device. To facilitate the calibration of gas fuel duration of injection (DOI), the inlet pressure of the injection device was set to 1.0 MPa, which was based on the one-dimensional isentropic flow calculation formula and the in-cylinder pressure without gas injection (sourced from CFD model calculation results) [19]. Under this injection pressure, the choking phenomenon of the nozzle throat near the field could be ensured. A lower injection pressure can reduce production costs and improve the gas fuel utilization efficiency of the upstream gas storage tanks in the gas supply system.
The CFD model of the in-cylinder mixing process for the CNG DI engine is shown in Figure 1, which includes the intake port, exhaust port, cylinder area and injection device cavity. An injection device study has been analyzed in the authors’ previous research [20], and here, the injection device was arranged at the center of the cylinder at a 45° angle to the cylinder axis. There was large pressure and velocity near the nozzle throat and injection device. The CFD model was locally refined to a minimum grid size of 0.3 mm near the nozzle. In addition, the computational cost of CFD needed to be kept within acceptable limits. The grid size gradually increased away from the nozzle throat, reaching a maximum size of about 3 mm. The grid partition is shown in Figure 2. For convenience, the CNG composition was assumed to be 100% methane. The simulation calculation started from the intake valve opening (IVO) time and ended at the ignition time. That is, it started from 30° before the top dead center (BTDC), corresponding to a 330° crank angle (CA), and ended at CA700. The entire computational domain was assumed to be initially stationary. The RNG k–ε turbulence model and the non-equilibrium wall function were used in this study. The turbulent Schmid number took the fixed default value of 0.7. In this paper, we focused on the theoretical exploration of the mechanisms that influence the performance of in-cylinder mixing in engine working conditions.

2.2. Transient CFD Model Verification

The minimum mesh size near the nozzle of the CFD model was 0.3 mm, and the maximum mesh size of other positions was about 3 mm. The core area of the jet of the nozzle was an important position for the jet development of the CFD model, and the mesh needed to be verified. In the author’s previous research [21], the mesh in the core region of the nozzle jet was validated. Experiments were carried out on the cumulative transient flow rate of the gas fuel injection device. Compared with the experimental results, the maximum error in the transient flow rate of the simulations was about 6.1%, validating the flow rate properties of the CFD model. In addition, the supersonic jet morphology was verified, and the simulation results were in good agreement with the experimental jet imaging results, as shown in Figure 3.

2.3. Research Method

To investigate the effects of different engine speeds and loads on the in-cylinder mixing performance, the research plan for this paper was determined, and the specific parameters are shown in Table 3. The main purpose of Cases 1–4 was to investigate the effect of different engine speeds (1200, 1500, 1800 and 2000 rpm) on the mixing performance under the same engine load (i.e., the engine had the same load of 100%). Cases 4–7 were used to explore the effect of different loads on the mixing performance under the same speed (rated speed of 2000 rpm). At different loads, the inlet pressure of the engine was adjusted accordingly to ensure a stoichiometric ratio of combustion in the cylinder. Different gas fuel demand was achieved by adjusting the start of injection (SOI), while the end of injection (EOI) remained the same. Cases 8–11 built on Cases 4–7 and further explored the impact of load on the mixing performance at non-rated speeds.

3. Evaluation Methods for Mixing Performance

In an ideal state, different working conditions of the engine correspond to different mixture distribution methods. To improve the rationality and accuracy of the research on mixture distribution, this paper proposed an objective classification method for the mixture distribution of gas engines. The mixture distribution of CNG engines was divided into homogeneous mixtures and non-homogeneous mixtures, and the non-homogeneous mixtures were further divided into reasonable stratification, unreasonable stratification and other mixture types.
M e a n = m f , i i
S D = ( m f , i M e a n ) 2 i
To quantitatively analyze the influence mechanism of engine working conditions on the in-cylinder mixing performance, a phase space analysis method based on the MEAN and standard deviation (SD) of the gas fuel mass fraction (FMF) was designed, as shown in Figure 4. The objective classification method of the mixture was applied in the phase space. The MEAN and SD of the FMF were defined as evaluation indicators for measuring the in-cylinder mixing performance. The horizontal axis was taken as the MEAN of the in-cylinder FMF of the mixture, and the vertical axis was taken as the SD of the FMF of the mixture. MEAN and SD are defined in Equations (1) and (2). In the formula, mf,i represents the FMF in the i region.
A larger MEAN indicates that the distribution of gas fuel is not confined within a particular combustion chamber area. Conversely, a smaller MEAN indicates that some combustion chamber areas may not even have gas fuel. A higher SD indicates that the gas fuel distribution in the area containing gas fuel varies greatly (poor mixing), while a lower SD indicates that the gas fuel distribution in the area varies less (excellent mixing). The lower the SD and the larger the MEAN, the better the homogeneous mixing performance, while the higher the SD and the larger the MEAN, the better the stratified mixing performance.

4. Results and Discussion

The focus of this study was to explore the in-cylinder mixing process of gas fuel and the mixing performance at the end of the compression stroke. Considering that the average FMF is different under different speeds and loads, the FMF was normalized for the convenience of comparative research.

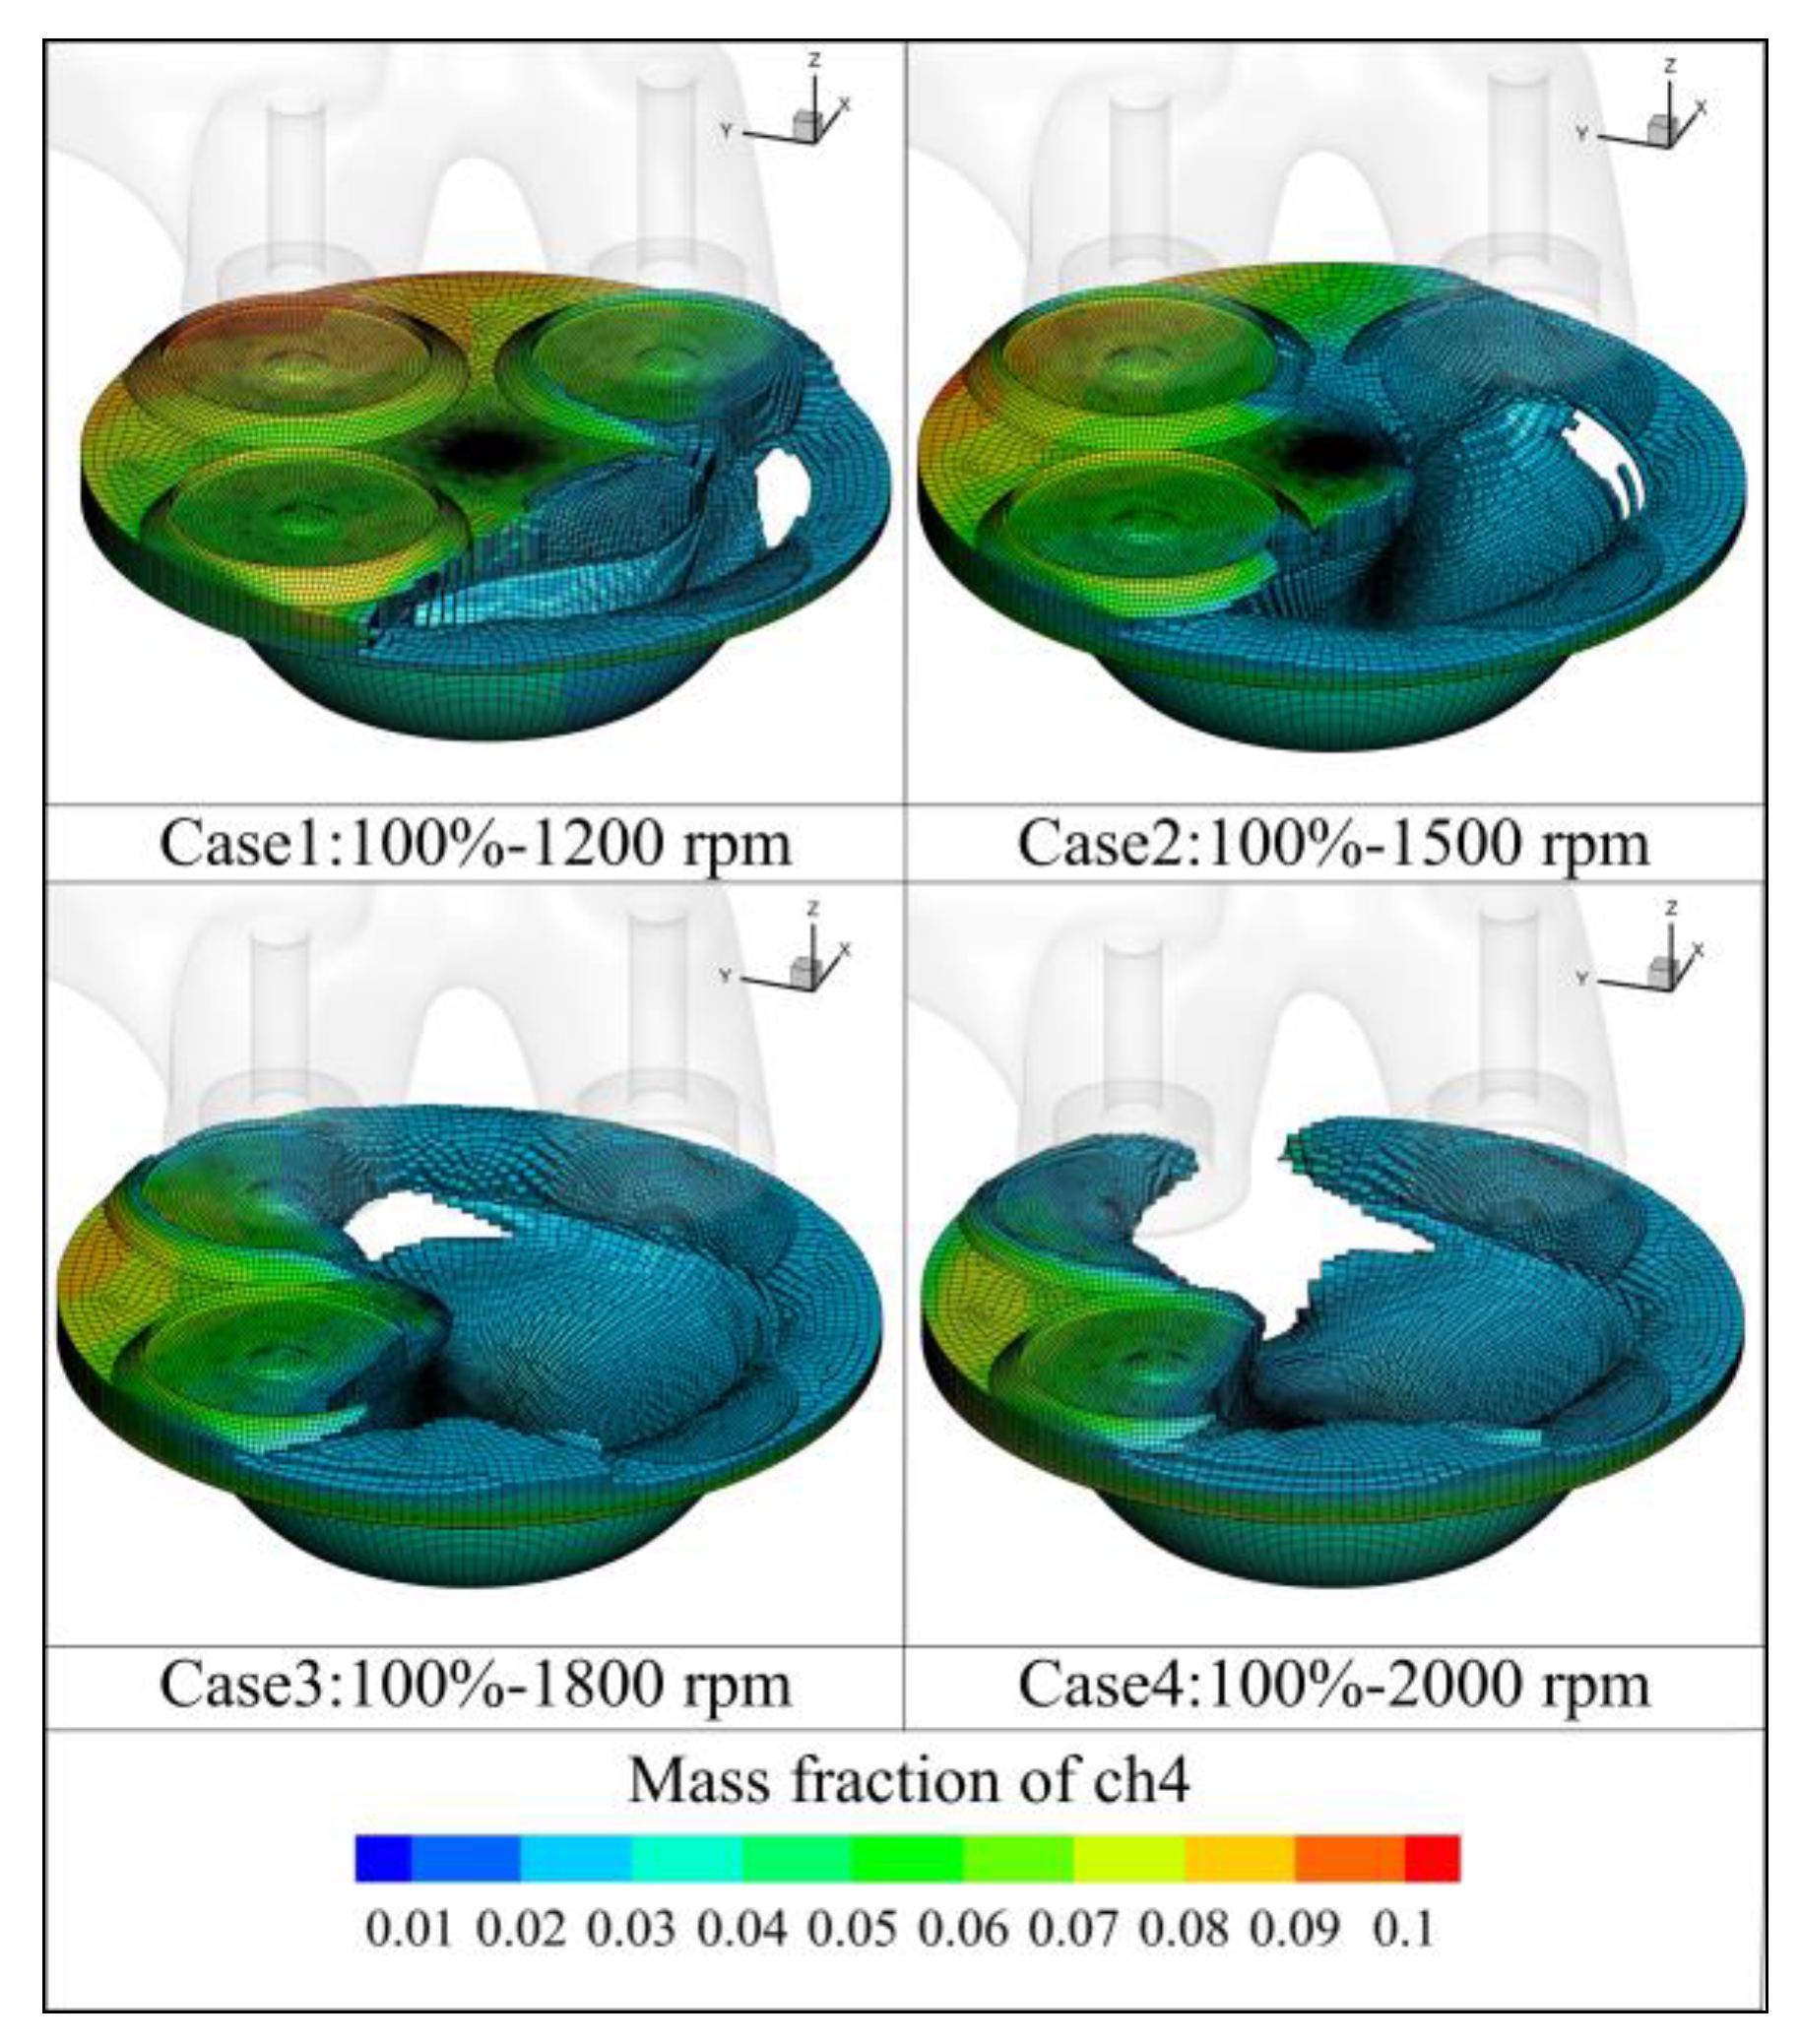
4.1. The Effect of Engine Speed

Firstly, regarding the effect of speed on the mixing process, we compared Cases 1–4 as shown in Figure 5, where the mixing process of gas fuel was divided into three stages based on the distribution of MEAN and SD in the phase space: injection, transition, and diffusion. The injection stage was from B (CA590) to C (CA630), where the valve of the gas fuel injection device was open and gas was continuously injected into the cylinder. The transition stage was from C to D (CA640), where the gas fuel injection valve was closed (CA635) in the middle moment of the transition phase. The diffusion stage was from D to F (CA700), which was the late stage of the mixing process between the gas fuel and air.
During the injection stage (B-C), the MEAN in the phase space rapidly increased with the duration of mixing, as shown in Figure 5. During the period of CA610–CA620 (defined as the G period), comparing Cases 1–4, the increase in MEAN was most significant in Case 1, and the increase in MEAN decreased in order in Cases 2–4. According to the DOI in Table 3 (SOI CA584~EOI CA635), the G period corresponded to the maximum lift period of the gas fuel injection device. The injection of gas fuel was the fastest and most stable, and the gas fuel quickly occupied the cylinder volume and mixed with the air in cylinder. Therefore, the MEAN increased rapidly with the duration of mixing. To analyze the reasons for the difference in the increase in MEAN among Cases 1–4 during the G period, an analysis was conducted based on the gas volume ratio. For Case 1, the gas volume ratio was approximately 16.7% at CA610 and increased to about 30.2% at CA620, which was a rise of approximately 13.5%. For Case 2, the increase was about 10.2% compared to CA610 at CA620. The increase for Case 3 was around 7.6% and around 6.7% for Case 4. During the G period, the gas volume ratio increase was highest for Case 1, followed by Case 2, Case 3 and Case 4. Thus, in the phase space, the increase in MEAN decreased in order in Cases 1–4. The in-cylinder FMF cloud map on the A-A section at CA620 was taken, as shown in Figure 6. It can be seen that, in Cases 1–4, the tumble flow was formed due to the wall blocking effect after the gas fuel jet impinged on the cylinder wall, and the gas fuel was directed towards the top of the piston. In Case 1, the gas fuel jet already crossed the in-cylinder centerline. While in Cases 2–4, the distance between the tail end of the gas fuel jet and the centerline increased in order, the space for gas fuel diffusion was significantly smaller than that in Case 1. Therefore, under the same load, a change in speed will lead to a difference in gas diffusion.
During the transition stage (C-D), the MEAN in the phase space remained basically unchanged with the duration of mixing, as shown in Figure 5. The SD rapidly decreased with the duration of mixing, halving from its initial value, as shown in Figure 4. According to the DOI in Table 3 (Cases 1–4: EOI 635), the transition stage corresponded to the period when the valve of the gas fuel injection device was closed, and the duration of mixing was relatively short. Moreover, the FMF remained basically unchanged during the transition stage. Therefore, the MEAN of FMF remained basically unchanged in the phase space. To analyze the reason for the SD being halved from its initial value during the transition stage in Cases 1–4, the FMF cloud map on the A-A section at the D (CA640) moment was taken, as shown in Figure 7. It is obvious that the gas fuel jet ended at this moment. It can be found that the gas fuel impinging jets still existed because of an inertia effect. The gas fuel jet was directed to the other side of the cylinder. The gas fuel already crossed the centerline of the cylinder. The velocity vector map on the A-A section at the D (CA640) moment was taken, as shown in Figure 8. The gas fuel jet developed towards the left side of the cylinder and was affected by the tumble flow. The velocity in the left cylinder also developed. In the cylinder, the degree of mixing between gas fuel and air intensified, indicating that these mixtures were in a highly transient state. The above phenomenon led to halving of the SD in the phase space of Cases 1–4.
During the diffusion stage (D-F), the SD in the phase space continuously decreased with the duration of mixing, as shown in Figure 5. After the E (Cases 1 and 2: CA660, Cases 3 and 4: CA680) moment, the MEAN showed different trends, with Cases 1 and 2 increasing while Cases 3 and 4 continued to decrease. The diffusion stage corresponded to the later stage of the gas fuel mixing process. The gas fuel continuously occupied the cylinder volume and continuously mixed with the air. Therefore, the SD continuously decreased with the duration of mixing. To analyze the reasons for the different trends in MEAN after the E (defined as the characteristic inflection point) moment, the FMF cloud map on the A-A section at time E was taken, as shown in Figure 9. It can be found that the gas fuel was generally concentrated on the other side of the gas fuel jet impingement, and there was a gas-rich phenomenon on the left side of the cylinder. In the H region, the gas fuel impinged on the left cylinder wall, forming a phenomenon of pushing back towards the in-cylinder centerline. The mixing process in the cylinder experienced a brief buffering period, which may be the reason for the appearance of the characteristic inflection point. The characteristic inflection points of Cases 1 and 2 appeared earlier than those of Cases 3 and 4, which caused the MEAN of Cases 1 and 2 to increase after the E moment, while the MEAN of Cases 3 and 4 decreased.

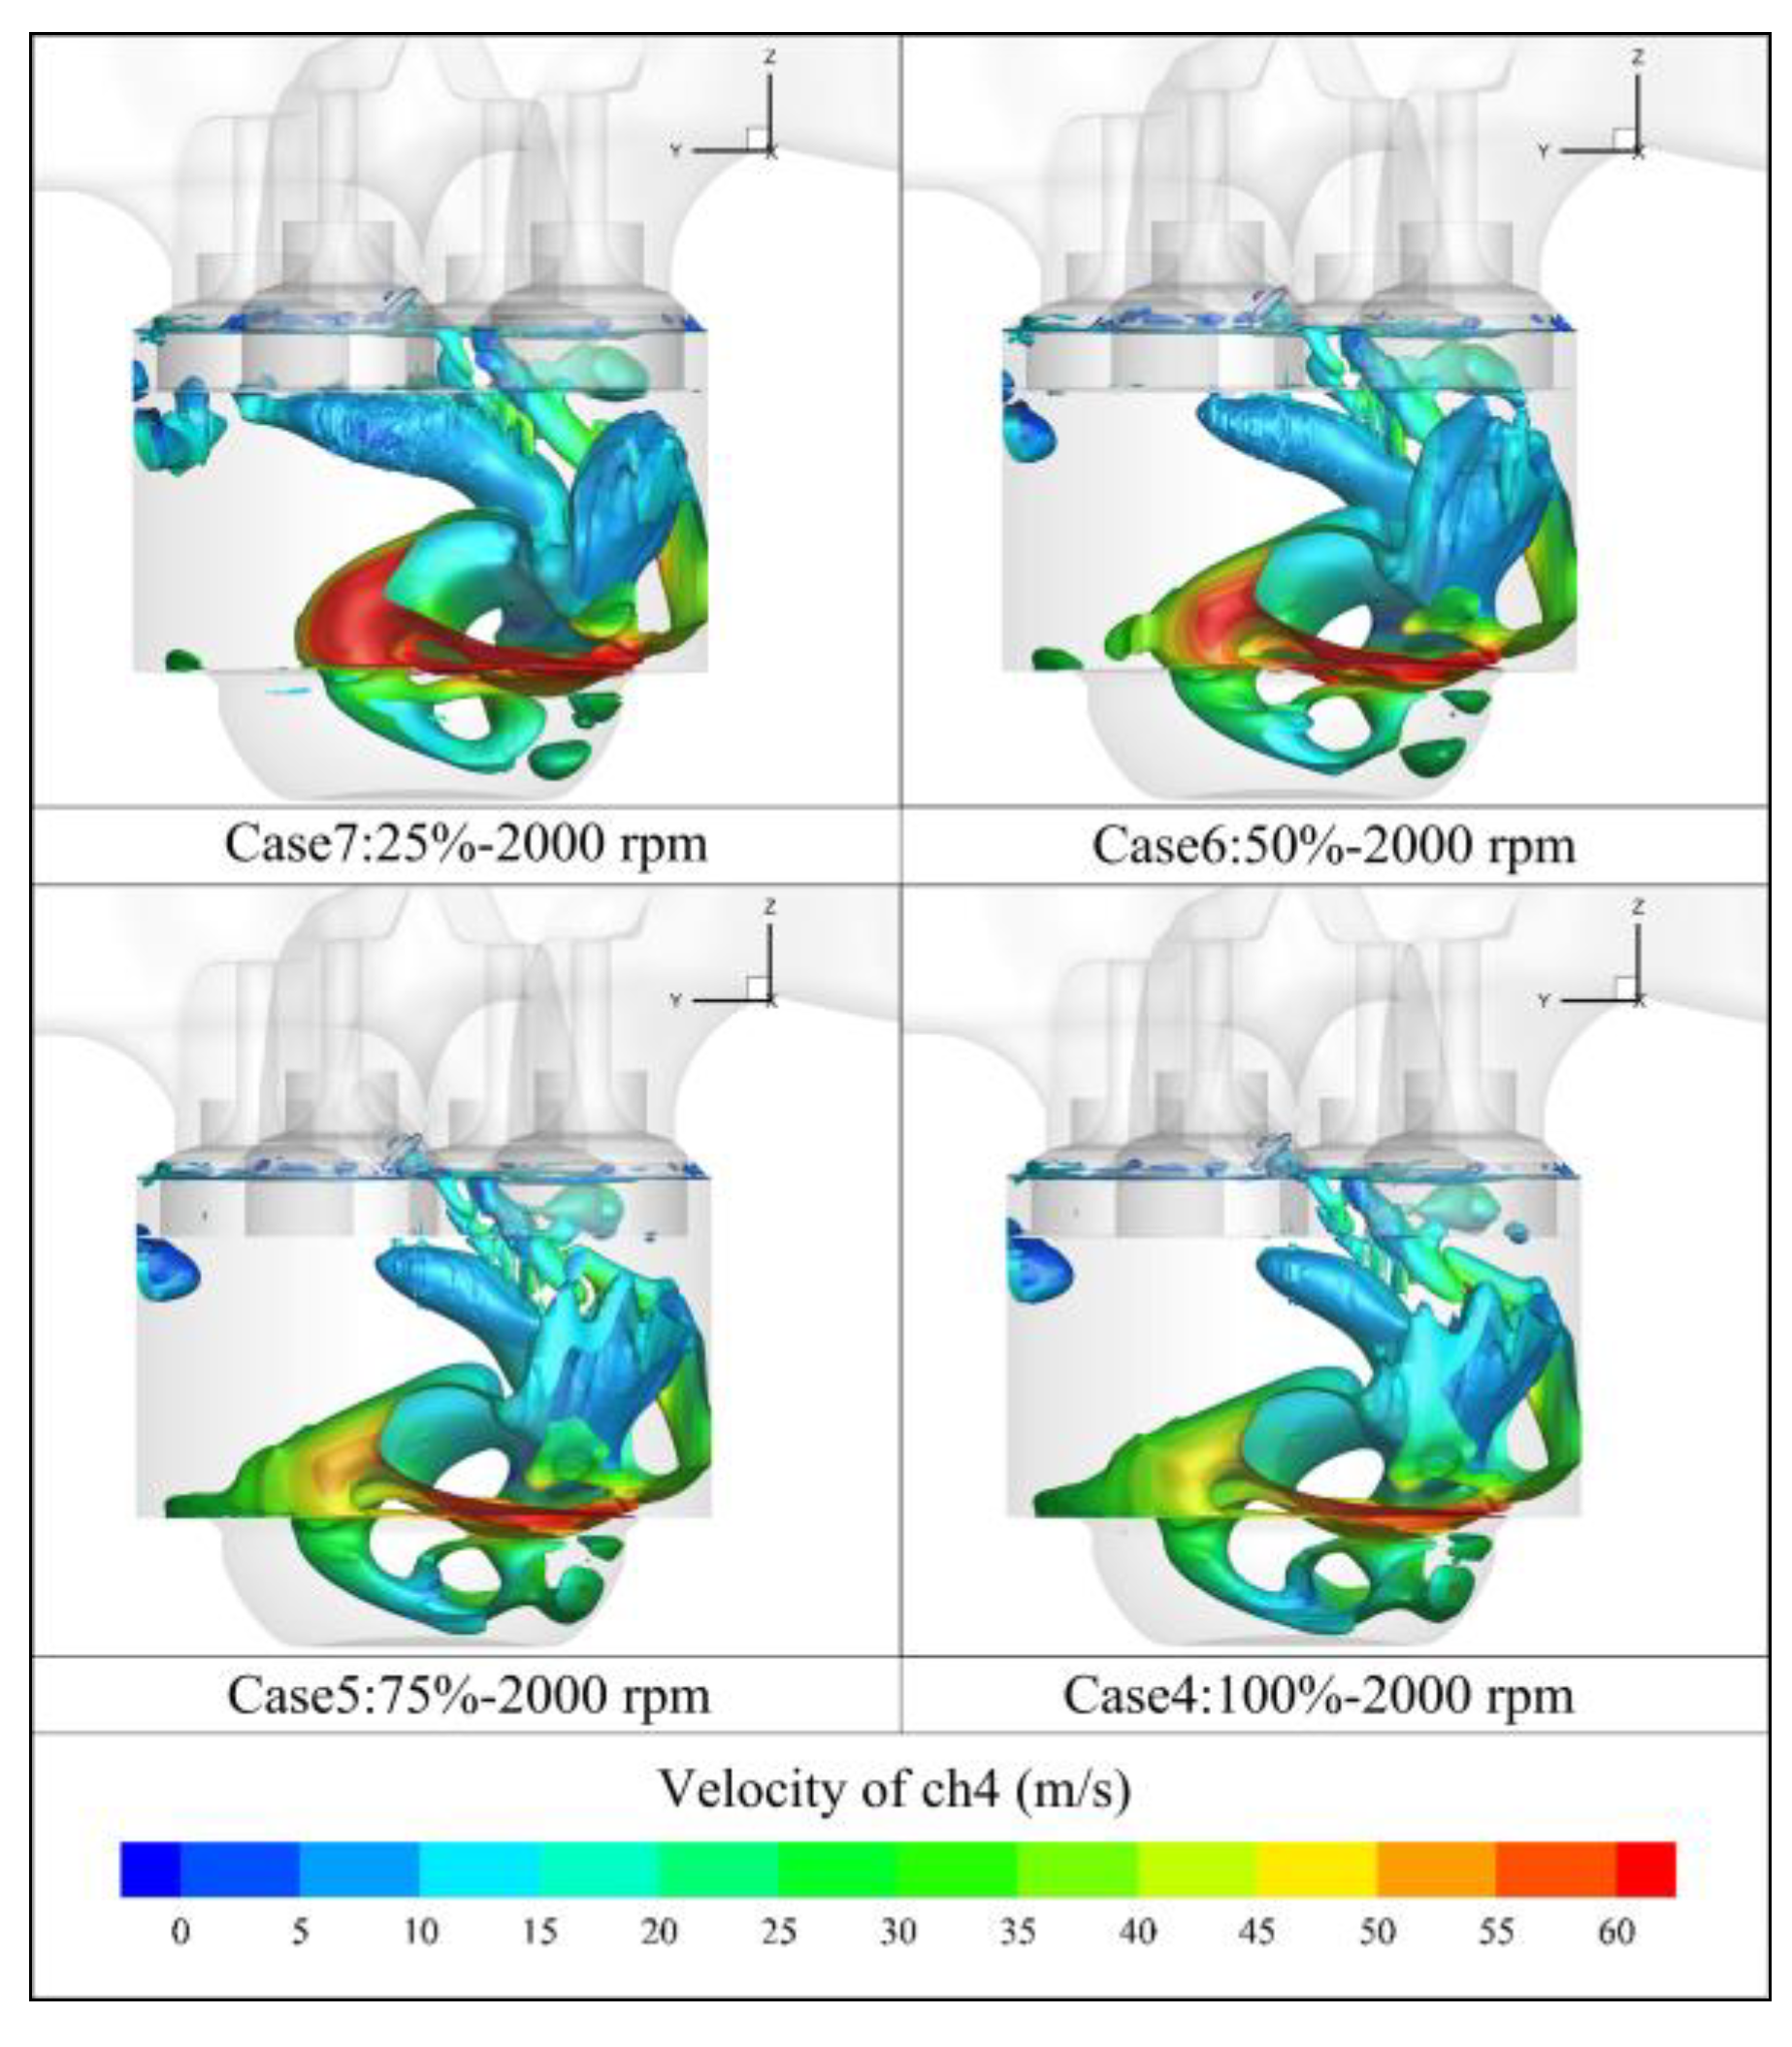
4.2. The Effect of Engine Load

Secondly, regarding the influence of load on the mixing process, a comparison was made between Cases 4 and 7, as shown in Figure 10. The mixing trend of gas fuel with the duration of mixing in the phase space was very similar, showing a reverse “C” shape. The mixing process of gas fuel was also divided into three stages: injection, transition and diffusion.
At the same time, the SD of Cases 4–7 gradually increased in the phase space, as shown in Figure 10. After the D (CA640) moment, the changes in the phase space began to decrease significantly, and the changes in MEAN and SD slowed down. After the D moment, the valve of the gas fuel injection device closed, and the mixing of gas fuel and air was no longer affected by the valve injection. Therefore, the changes in MEAN and SD in the phase space slowed down, and the mixture of fuel and air in the cylinder entered a stable development stage. To analyze the influence of load on the mixing process, the in-cylinder velocity–vortex cloud map at CA640 was taken, as shown in Figure 11. The vortex with a Q-criterion value of 2 × 10⁵ was taken. Larger vortices make the structure and properties of the vortices more intuitively observable. It can be seen that the inertial jet was pushed towards the bowl piston top due to the lack of upstream injection pressure during the upward movement of the piston. Meanwhile, there were vortices in the bowl piston top, and the boundaries of the vortices crossed the center of the cylinder. The velocity difference near the boundary of the vortex was large in Cases 4–7. Case 4 had the highest load, and the highest point of the jet velocity was farthest from the vortex boundary, located at the center of the vortex. As the load decreased in Cases 5–7, the highest point of jet velocity gradually approached the vortex boundary. According to the energy dissipation rule of vortices, the jet velocity was proportional to the vorticity. The higher the velocity of the vortex boundary jet, the more difficult the energy dissipation of the vortex is, resulting in greater variation in the distribution of the gas fuel. Therefore, this phenomenon caused the SD in the same moment of Cases 4–7 to gradually increase in the phase space.

4.3. The Effect of Engine Multiple Working Conditions

Finally, the influence of different working conditions on the mixing performance in the cylinder at the end of the compression stroke (CA700) was analyzed, and the corresponding laws were discussed. There were two different results in the phase space, as shown in Figure 12. In Cases 1–4, under the condition of 100% load, the lower the speed, the larger the MEAN of the FMF, and the smaller the SD. In Cases 4–7, at the rated speed of 2000 rpm, the smaller the load, the larger the MEAN of the FMF, and the larger the SD. For Cases 8–11, at a non-rated speed of 1500 rpm, the influence of load on the mixing performance was the same as that at the rated speed. It can be preliminarily concluded that, when the engine load was the same, the lower the speed, the better the in-cylinder homogeneous mixing performance, when the engine speed was the same, the lower the load, the better the in-cylinder stratification trend.
The influence of engine speed on the in-cylinder mixing performance at the end of the compression stroke was analyzed. The FMF distribution at the CA700 moment is shown in Figure 13, where a thin mixture (FMF < 2%) was hidden for the purpose of a clear contrast. Obviously, in Cases 1–4, the gas fuel was concentrated near the opposite cylinder wall of the direction of injection. In Case 1, the gas fuel was distributed almost throughout the cylinder, followed by Case 2, in which the gas fuel was concentrated near the bowl piston top and the cylinder wall in Cases 3 and 4. Case 1 had the best distribution of gas fuel, while the distribution of gas fuel gradually became worse in Cases 2–4. These results are similar to the research of Zhang et al. [22]. The gas fuel mainly concentrated at the piston top or cylinder wall, which was unfavorable for the complete combustion of the gas mixture. It can be concluded that, when the load is the same, the lower the engine speed, the better the in-cylinder homogeneous mixing performance. The FMF distribution at the CA700 moment confirms the accuracy of the influence law of engine speed on the mixing performance in the phase space.
The influence of engine load on the in-cylinder mixing performance at the end of the compression stroke was analyzed. The probability distribution frequency (PDF) of the FMF at the CA700 moment is shown in Figure 14. It was calculated that the best mixture concentration region (BMCR) of the gas fuel in Cases 4–7 was consistent, and it was between 2.5% and 3%. Correspondingly, 2–2.5% was taken as the thinner interval, 3–3.5% was taken as the thicker interval, 0–2% was taken as the thinnest interval, and the FMF exceeding 3.5% was taken as the thickest interval. In order to achieve better stratified mixing performance, the proportion of the BMCR should be lower than that of other cases. Based on this, the proportion of the thicker interval should be reduced as much as possible, and the proportion of the thinner interval should be increased as much as possible. From Figure 13, the BMCR decreased as the load decreased, from 12.72 to 12.29. The thicker interval decreased from 9.64 to 8.61, while the thinner interval increased from 13.13 to 14.83. The PDF of FMF in Cases 4–7 was consistent with the characteristics of the separated mixture. The optimal concentration range of the separated mixture was low compared to the homogeneous mixture [9]. It can be concluded that at the same speed, the lower the load, the better the in-cylinder stratified mixing performance. The PDF of the FMF at the CA700 moment confirms the accuracy of the influence law of engine load on the mixing performance in the phase space.

5. Conclusions

In this research, a CFD model for the DI mixing process of CNG engines was established. A quantitative evaluation mechanism for the in-cylinder mixing performance of CNG engines was proposed. The influence law of different engine speeds and loads on the in-cylinder mixing process and its mixing performance was researched. The main conclusions are as follows:
(1)
Under the influence of engine speed, the characteristics of the gas fuel mixing process can be divided into three stages in the phase space. The gas fuel mixture rapidly occupies the cylinder volume in injection stage. During the transition stage, the gas fuel mixture is in a highly transient state. The diffusion stage is characterized by the continuous homogenization of the mixture.
(2)
In the phase space, the diffusion stage of the mixing stage shows a characteristic inflection point after the E moment. The gas fuel impinges on the left cylinder wall, forming a phenomenon of pushing back towards the in-cylinder centerline. This may be the reason for the emergence of characteristic inflection points.
(3)
The in-cylinder mixing process is influenced by the load factors too, and the mixing trend of the gas fuel in the phase space is the same. As the load decreases, the velocity of the gas fuel jet near the boundary of the vortex increases, making it more difficult for the energy of the vortex to dissipate. This leads to a greater variation in the gas fuel distribution in the cylinder.
(4)
The in-cylinder mixing performance at the end of compression stroke under different working conditions can be reflected in the phase space. As the engine load decreases, the MEAN increases, while the SD also increases, and the gas fuel mixture approaches the stratified mixture. As the engine speed decreases, the MEAN increases, while the SD decreases, and the gas fuel mixture approaches the homogeneous mixture.

Author Contributions

Methodology and software, H.W. and T.W.; verification, L.Z. and Y.Z.; resources, L.Z. and J.C.; writing original draft preparation, H.W., L.L. and Y.S. All authors have read and agreed to the published version of the manuscript.

Funding

This work was supported by the National Natural Science Foundation of China (Grant No. 52105260 and No. 11802108); Changzhou Sci & Tech Program (Grant No. CE20225049); Natural Science Research Project of Higher Education Institutions in Jiangsu Province [Grant No. 21KJB460008, 22KJA580002]; Qinglan Engineering Project of Jiangsu Universities. The APC was funded by the National Natural Science Foundation of China, Changzhou Sci & Tech Program and Natural Science Research Project of Higher Education Institutions in Jiangsu Province (Grant No. 21KJB460008).

Data Availability Statement

Not applicable.

Conflicts of Interest

The authors declare no conflict of interest.

Nomenclature

CNGcompressed natural gas
DIdirect injection
PFIport fuel injection
CFDcomputational fluid dynamics
DOIduration of injection
SOIstart of injection
EOIend of injection
IVOintake valve opening time
IVCintake valve closing time
BTDCbefore top dead center
ATDCafter top dead center
CAcrank angle
FMFgas fuel mass fraction
PDFprobability distribution frequency
BMCRbest mixture concentration region

References

  1. IEA. Gas. Available online: https://www.iea.org/fuels-and-technologies/gas (accessed on 14 March 2023).
  2. Gideon, F.; Tarun, S.; Fionn, R. Exploring a case transition to low carbon fuel: Scenarios for natural gas vehicles in Irish road freight. SSRN Electron. J. 2021. Available online: https://papers.ssrn.com/sol3/papers.cfm?abstract_id=3855537 (accessed on 22 May 2023).
  3. Abdullah, N.N.; Anwar, G. An Empirical Analysis of Natural Gas as an Alternative Fuel for Internal Transportation. Int. J. Engl. Lit. Soc. Sci. 2021, 6, 479–485. [Google Scholar] [CrossRef]
  4. Tadeusz, D.; Przemysław, M.; Karolina, Z. Costs and benefits of using buses fuelled by natural gas in public transport. J. Clean. Prod. 2019, 225, 1134–1146. [Google Scholar]
  5. Mahendar, S.K.; Erlandsson, A.; Adlercreutz, L. Challenges for Spark Ignition Engines in Heavy Duty Application: A Review; SAE Technical Paper 2018-01-0907; SAE International: Warrendale, PA, USA, 2018. [Google Scholar]
  6. Abdullah, S.; Mahmood, W.; Aljamali, S.; Shamsudeen, S.A.A.A. Compressed Natural Gas Direct Injection: Comparison Between Homogeneous and Stratified Combustion. In Advances in Natural Gas Emerging Technologies; InTech Open: London, UK, 2017; pp. 153–169. [Google Scholar]
  7. Kakaee, A.-H.; Nasiri-Toosi, A.; Partovi, B.; Paykani, A. Effects of piston bowl geometry on combustion and emissions characteristics of a natural gas/diesel RCCI engine. Appl. Therm. Eng. 2016, 102, 1462–1472. [Google Scholar] [CrossRef]
  8. Chiodi, M.; Berner, H.-J.; Bargende, M. Investigation on Different Injection Strategies in a Direct-Injected Turbocharged CNG-Engine; SAE Technical Papers 2006-01-3000; SAE International: Warrendale, PA, USA, 2006. [Google Scholar]
  9. Spiegel, L.; Spicher, U. Mixture Formation and Combustion in a Spark Ignition Engine with Direct Fuel Injection. In International Congress and Exposition; SAE International: Warrendale, PA, USA, 1992; pp. 24–28. [Google Scholar]
  10. Yadollahi, B.; Boroomand, M. A Numerical Investigation of Combustion and Mixture Formation in a Compressed Natural Gas DISI Engine with Centrally Mounted Single-Hole Injector. J. Fluids Eng. 2013, 135, 091101. [Google Scholar] [CrossRef]
  11. Sankesh, D.; Lappas, P. Natural-Gas Direct-Injection for Spark-Ignition Engines—A Review on Late-Injection Studies; SAE Technical Paper 2017-26-0067; SAE International: Warrendale, PA, USA, 2017. [Google Scholar]
  12. Sankesh, D.; Edsell, J.; Mazlan, S.; Lappas, P. Comparative Study Between Early and Late Injection in a Natural-Gas Fueled Spark-Ignited Direct-Injection Engine. Energy Procedia 2017, 110, 275–280. [Google Scholar] [CrossRef]
  13. Wang, T.; Zhang, X.; Zhang, J.; Hou, X. Numerical analysis of the influence of the fuel injection timing and ignition position in a direct-injection natural gas engine. Energy Convers. Manag. 2017, 149, 748–759. [Google Scholar] [CrossRef]
  14. Yousefi, A.; Guo, H.; Birouk, M. Effect of diesel injection timing on the combustion of natural gas/diesel dual-fuel engine at low-high load and low-high speed conditions. Fuel 2018, 235, 838–846. [Google Scholar] [CrossRef]
  15. Keskinen, K.; Kaario, O.; Nuutinen, M.; Vuorinen, V.; Künsch, Z.; Liavåg, L.O.; Larmi, M. Mixture formation in a direct injection gas engine: Numerical study on nozzle type, injection pressure and injection timing effects. Energy 2016, 94, 542–556. [Google Scholar] [CrossRef]
  16. Addepalli, S.K.; Mallikarjuna, J.M. Quantitative Parametrization of Mixture Distribution in GDI Engines: A CFD Analysis. Arch. Comput. Methods Eng. 2018, 26, 639–662. [Google Scholar] [CrossRef]
  17. Mohammad, A.; Bashar, Q. Evaluating the in-cylinder gas mixture homogeneity in natural gas HCCI free piston engine under different engine parameters using 3D-CFD analysis. Energy Sources 2018, 40, 1097–1113. [Google Scholar]
  18. Baratta, M.; Misul, D.; Xu, J.; Fuerhapter, A.; Heindl, R.; Peletto, C.; Preuhs, J.; Salemi, P. Development of a High Performance Natural Gas Engine with Direct Gas Injection and Variable Valve Actuation. SAE Int. J. Engines 2017, 10, 2535–2551. [Google Scholar] [CrossRef] [Green Version]
  19. Wang, T.; Chang, S. Effect of Injection Location and Multi-Hole Nozzle on Mixing Performance in a CNG-Fueled Engine with Port Gas Injection, Using CFD Analyses. MATEC Web Conf. EDP Sci. 2017, 95, 06003. [Google Scholar] [CrossRef] [Green Version]
  20. Wang, T.; Zhang, L.; Li, L.; Wu, J.; Wang, H. Numerical Comparative Study on the In-Cylinder Mixing Performance of Port Fuel Injection and Direct Injection Gas-Fueled Engine. Energies 2022, 15, 5223. [Google Scholar] [CrossRef]
  21. Wang, T.; Wang, H.; Zhang, L.; Zheng, Y.; Li, L.; Chen, J.; Gong, W. A Numerical Study on the Transient Injection Characteristics of Gas Fuel Injection Devices for Direct-Injection Engines. Actuators 2023, 12, 102. [Google Scholar] [CrossRef]
  22. Zhang, X.; Wang, T.; Zhang, J. Numerical analysis of flow, mixture formation and combustion in a direct injection natural gas engine. Fuel 2019, 259, 116268. [Google Scholar] [CrossRef]
Figure 1. The CFD calculation domain for CNG DI engine.
Actuators 12 00239 g001
Figure 2. CFD calculation domain and mesh on the A-A section.
Actuators 12 00239 g002
Figure 3. Experimental results (first row) and simulation results (second row) of jet morphology.
Actuators 12 00239 g003
Figure 4. The phase space analysis method for the mixing performance.
Actuators 12 00239 g004
Figure 5. The mixing process of the mixture (left) and enlarged diagram (right) at different speeds under 100% load.
Actuators 12 00239 g005
Figure 6. The in-cylinder methane mass fraction distribution at CA620.
Actuators 12 00239 g006
Figure 7. The in-cylinder methane mass fraction distribution at CA640.
Actuators 12 00239 g007
Figure 8. The in-cylinder velocity vector at CA640.
Actuators 12 00239 g008
Figure 9. The in-cylinder methane mass fraction distribution at E moment.
Actuators 12 00239 g009
Figure 10. The mixing process of the mixture at different loads under 2000 rpm.
Actuators 12 00239 g010
Figure 11. The in-cylinder velocity–vortex distribution at CA640.
Actuators 12 00239 g011
Figure 12. Mixing performance in the cylinder at CA700.
Actuators 12 00239 g012
Figure 13. The in-cylinder FMF distributions of Cases 1–4 at CA700.
Actuators 12 00239 g013
Figure 14. The PDF of gas fuel mass fraction under Cases 1–4 at CA700.
Actuators 12 00239 g014
Table 1. Specifications of CNG engine.
ParameterValue
Bore (mm) × Stroke (mm)131 × 155
Displacement volume(L)12.53
Compression ratio11.5
Rated power (kW)/speed (rpm)255/2000
IVO/IVC(CA)30° BTDC/46° ATDC
EVO/EVC(CA)78° BTDC/30° ATDC
Table 2. Specification of gas injection device.
ParameterValue
Outlet diameter (mm)7
Valve lift (mm)1.5
Injection pressure (MPa)1.0
Table 3. Parameters of each case.
CaseLoadRotate Speed,
rpm
Inlet Pressure,
bar
SOI, ° CAEOI, ° CADOI, ° CA
1100%12002.058463551
2100%15002.058463551
3100%18002.058463551
4100%20002.058463551
575%20001.758863547
650%20001.359463541
725%20000.860163534
825%15000.660763528
950%15000.860363532
1075%15001.159763538
11100%15001.459363542
Disclaimer/Publisher’s Note: The statements, opinions and data contained in all publications are solely those of the individual author(s) and contributor(s) and not of MDPI and/or the editor(s). MDPI and/or the editor(s) disclaim responsibility for any injury to people or property resulting from any ideas, methods, instructions or products referred to in the content.

