Review

Flexoelectric Effect of Ferroelectric Materials and Its Applications

1
Institute of Advanced Materials, Hubei Normal University, Huangshi 435002, China
2
Department of Materials Science and Engineering, Inha University, 100 Inha-ro, Michuhol-gu, Incheon 22212, Republic of Korea
3
Guangdong Fenghua Advanced Technology Holding Co., Ltd., 18th Fenghua Road, Zhaoqing 526020, China
4
CAS Key Laboratory of Materials for Energy Conversion and Department of Materials Science and Engineering, University of Science and Technology of China, Hefei 230026, China
5
State Key Laboratory of Advanced Materials and Electronic Components, University of Science and Technology of China, Hefei 230026, China
*
Authors to whom correspondence should be addressed.
Actuators 2023, 12(3), 114; https://doi.org/10.3390/act12030114
Submission received: 16 January 2023 / Revised: 22 February 2023 / Accepted: 23 February 2023 / Published: 7 March 2023

Abstract

:
The flexoelectric effect, which exists in all dielectrics, is an electromechanical effect that arises due to the coupling of strain gradients (or electric field gradients) with electric polarization (or mechanical stress). Numerous experimental studies have demonstrated that ferroelectric materials possess a larger flexoelectric coefficient than other dielectric materials; thus, the flexoelectric response becomes significant. In this review, we will first summarize the measurement methods and magnitudes of the flexoelectric coefficients of ferroelectric materials. Theoretical studies of the flexoelectric coefficients of ferroelectric materials will be addressed in this review. The scaling effect, where the flexoelectric effect dramatically increases when reducing the material dimension, will also be discussed. Because of their large electromechanical response and scaling effect, ferroelectric materials offer vast potential for the application of the flexoelectric effect in various physical phenomena, including sensors, actuators, and transducers. Finally, this review will briefly discuss some perspectives on the flexoelectric effect and address some pressing questions that need to be considered to further develop this phenomenon.

1. Introduction

Without an electric field, the strain and strain gradient contribute to the polarization in dielectric materials, which is expressed using the following equation [1]:
P i = e i j k S j k + μ i j k l S k l x j
where Pi is the electric polarization, Sjk is the strain, S k l / x j is the strain gradient, eijk is the third-rank piezoelectric tensor, and μijkl is the flexoelectric coefficient (the fourth-rank tensor). For the Einstein summation convention, i, j, k, and l traverse 1, 2, and 3, respectively. The first term describes the direct piezoelectric effect, where polarization is linearly related to a homogeneous strain in materials. The second term describes the direct flexoelectric effect, where polarization is linearly dependent on a strain gradient in dielectric materials. Thus, the flexoelectric effect is not restricted by material structures, thereby broadening electromechanical material options. There also exists a converse flexoelectric effect, as shown below [1]:
T i j = μ i j k l E k x l
where Tij is the induced stress and E k / x l is the electric field gradient.
The flexoelectric coefficient is a parameter that assesses the magnitude of the flexoelectric response. For low-symmetry materials, there are several non-zero components of the flexoelectric coefficient [2,3]. In centrosymmetric dielectric materials, the non-zero flexoelectric coefficient includes the longitudinal flexoelectric coefficient (μ1111), transverse flexoelectric coefficient (μ1122), and shear flexoelectric coefficient (μ1212) [4]. The tensor matrices can be expressed as follows [4]:
μ = ( μ 1111 μ 1122 μ 1122 0 0 0 μ 1122 μ 1111 μ 1122 0 0 0 μ 1122 μ 1122 μ 1111 0 0 0 0 0 0 μ 1212 0 0 0 0 0 0 μ 1212 0 0 0 0 0 0 μ 1212 )
where μ1111, μ1122, and μ1212 can be written as μ11, μ12, and μ44 using Voigt tensor notations.
Flexoelectric coefficient scales for the dielectric susceptibility of materials were proposed [1,5] and are expressed as
μ i j k l = γ χ i j k l e a
where χijkl is the dielectric susceptibility, γ is the scaling factor, e is the electron charge, and a is the unit cell dimension. Using Equation (4), the flexoelectric coefficients of simple dielectrics were calculated to be as small as 10−11~10−10 C/m, which hindered the research interest in flexoelectricity [1,4,5,6]. In the early 2000s, Cross and coworkers measured a significant flexoelectric coefficient at the μC/m level in ferroelectric materials, which was much larger than the previously estimated values, attracting the attention of many researchers [1,4,6,7,8,9,10,11,12]. However, the theoretical explanations for this phenomenon remain elusive [4,6,11]. Several experimental results have demonstrated that extrinsic mechanisms dominate the measured flexoelectric coefficient of ferroelectric materials, which will be discussed in detail below.
The other important parameter, the strain gradient, depends on the elastic modulus, applied force, and material size. For example, the strain gradient in nanoscale materials is several orders of magnitude larger than that in bulk materials [4,6,13,14]. Thus, the flexoelectric response shows a strong scaling effect, which will also be discussed below [4,6,13,14]. Based on the large flexoelectric coefficients in ferroelectric materials and high strain gradients in small-scale dielectrics, several applications have been designed. Because the flexoelectric effect is also an electromechanical coupling effect, it can be applied in sensors, actuators, transducers, and energy harvesters [14,15,16,17,18,19,20]. Furthermore, some novel applications have been developed due to the universality of the flexoelectric effect, such as mechanical writing memory; manipulating oxygen vacancies and carriers; controlling ferromagnetic switching and band structures; and enhancing the thermoelectricity, photovoltage, and photocurrent [11,12,15,16].
In this review, we review the measurement methods and magnitudes of the flexoelectric coefficients, the theoretical investigations of the measured flexoelectric coefficients, the flexoelectric effect in nanoscale materials, and the applications of the flexoelectric effect, which are presented in Section 2, Section 3, Section 4, Section 5 and Section 6. Finally, the future directions of flexoelectricity are addressed in Section 7.

2. Measurement Methods of Flexoelectric Coefficients

The flexoelectric coefficient is the product of the linear coupling between polarization (or stress) and strain gradient (or electric field gradient). Therefore, to measure flexoelectric coefficients, methods of manipulating the strain gradient or electric field gradient of materials should be adopted. The methods for obtaining strain gradients include cantilever bending, four-point bending, three-point bending, point-ring bending, pyramid compression, and shock wave. In this section, we detail the methods for measuring flexoelectric coefficients. Table 1 includes nomenclatures used in Section 2.

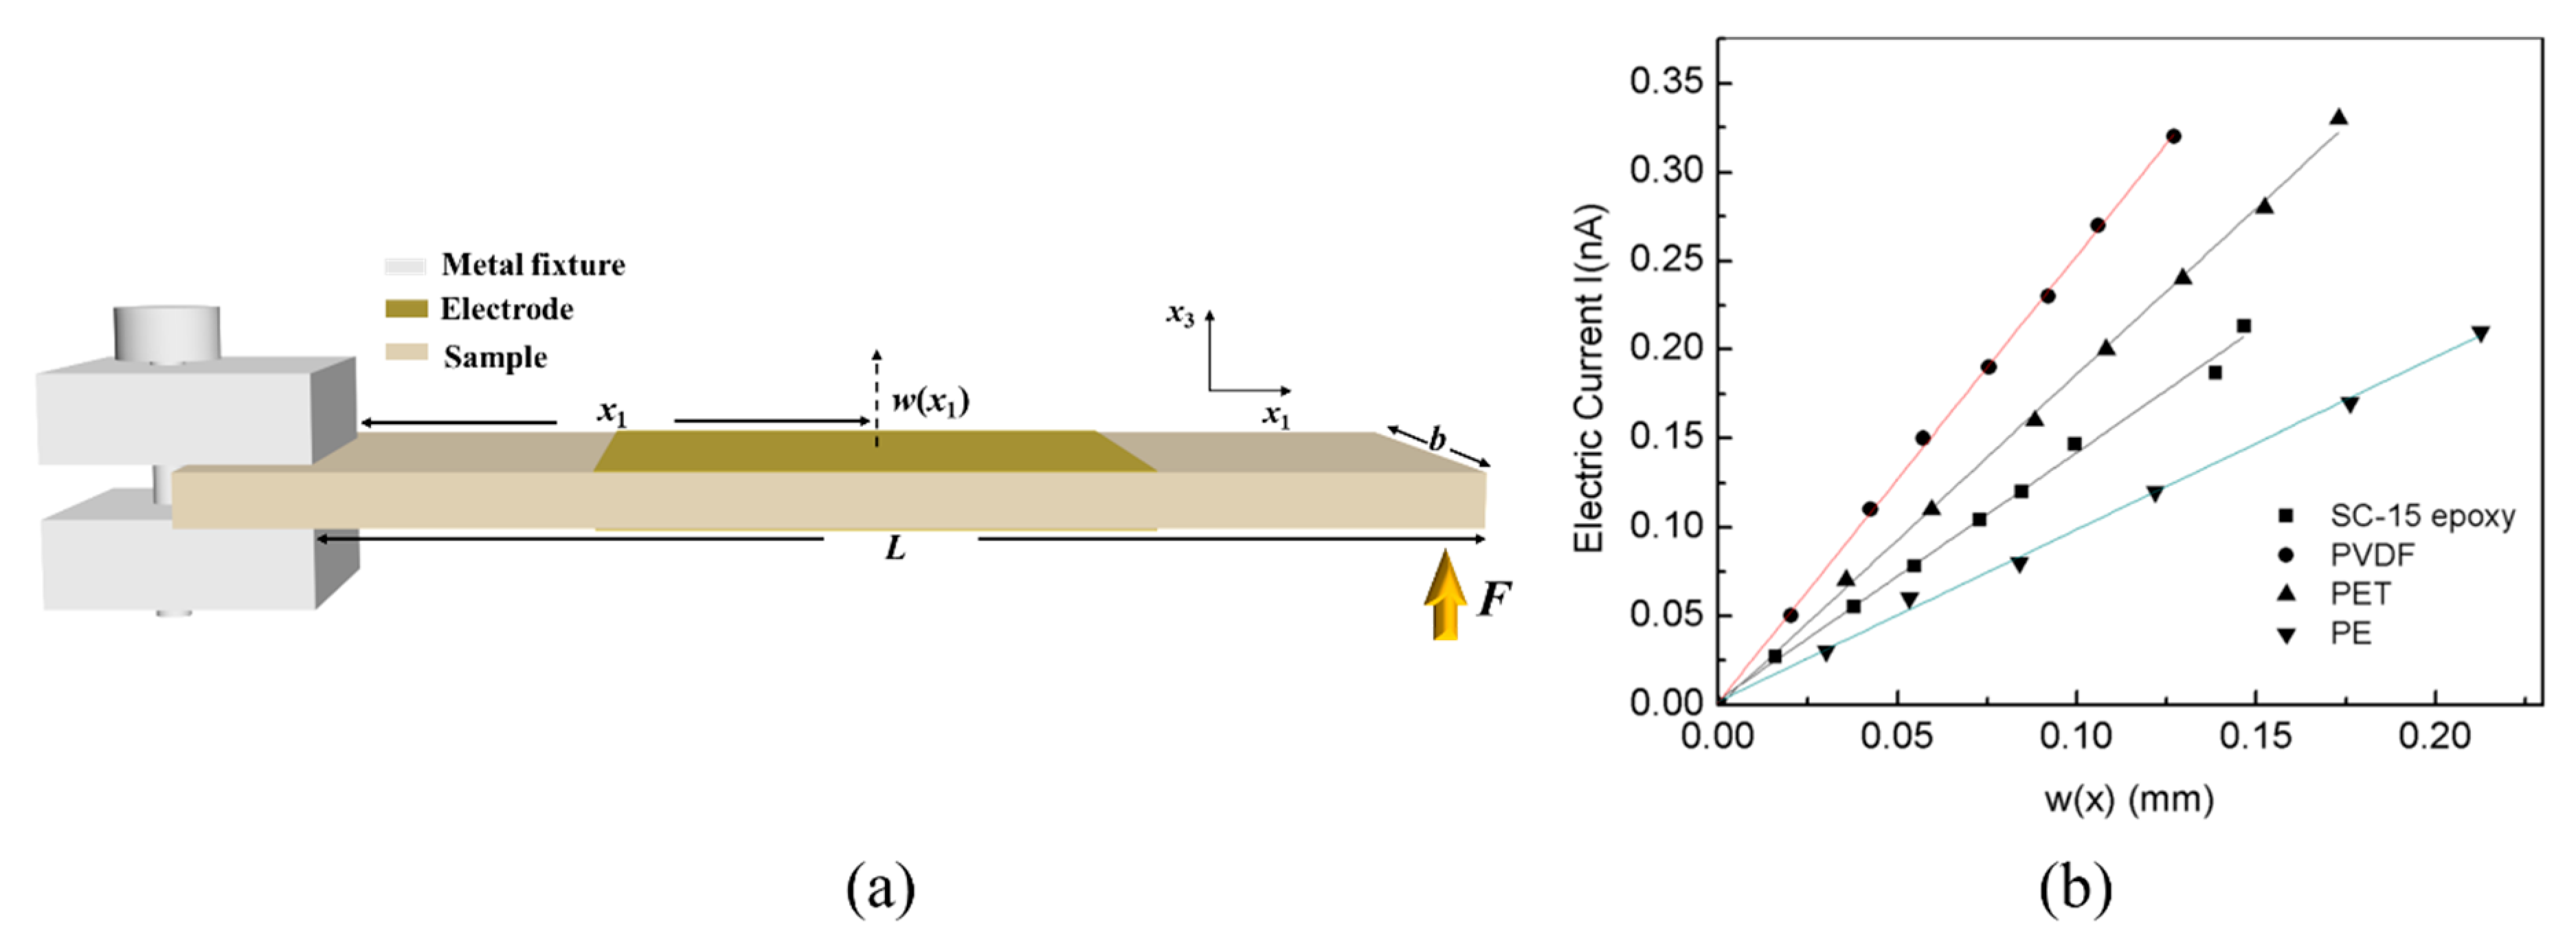
2.1. Cantilever Bending (CB)

One common method for obtaining strain gradients is the cantilever bending method (CB), which mainly measures μ12 [7,8,9]. The samples should be fabricated as rectangular shapes. As shown in Figure 1a, one end is kept clamped and the other free end is driven by force (F), which causes a bending deformation (i.e., strain gradient). The displacement w(x1) along the thickness direction (x3) can be measured by a differential variable reluctance transducer for point x1 (the distance from the clamping point) on the beam and is a function of x1 [7]. At point x1, the strain gradient S 11 / x 3 can be calculated as follows [7]:
S 11 x 3 = 2 w ( x 1 ) x 1 2
w(x1) can be calculated using the mode shape function [7]:
w r ( x 1 ) = A r { [ sin ( β r L ) sinh ( β r L ) ] [ sin ( β r x 1 ) sinh ( β r x 1 ) ] + [ cos ( β r L ) cosh ( β r L ) ] [ cos ( β r x 1 ) cosh ( β r x 1 ) ] }
and
A r = C 1 sin ( β r L ) sinh ( β r L )
where r is the fundamental mode and its value is usually 1; therefore, β1L = 1.875 [7]. L is the distance from the free end to the clamped end of the beam, and C1 is determined by the measured vertical displacement of point x1. The flexoelectric response generating a current (i) can be measured by a lock-in amplifier and is transformed into polarization (P):
P = i 2 π f A
where f is the measurement frequency and A is the electrode area. After measuring the flexoelectric polarization and strain gradient of several points, μ12 can be calculated using the slope of the linear curve between the polarization and the strain gradient [9].
The above small electrodes are suitable for materials with significant flexoelectric coefficients. For materials with weak flexoelectric coefficients, the electrodes should be spread over both surfaces of the cantilever beam. In this case, μ12 can be derived using the linear ratio coefficient between i and w(x1) [21]:
i = 2 π f μ 12 b L x 1 2 ( 1 ( x 1 / 3 L ) ) w ( x 1 )
where b is the width of the beam. As shown in Figure 1b, the flexoelectric coefficients can be obtained by fitting the linear relationship between i and w(x1) [21].

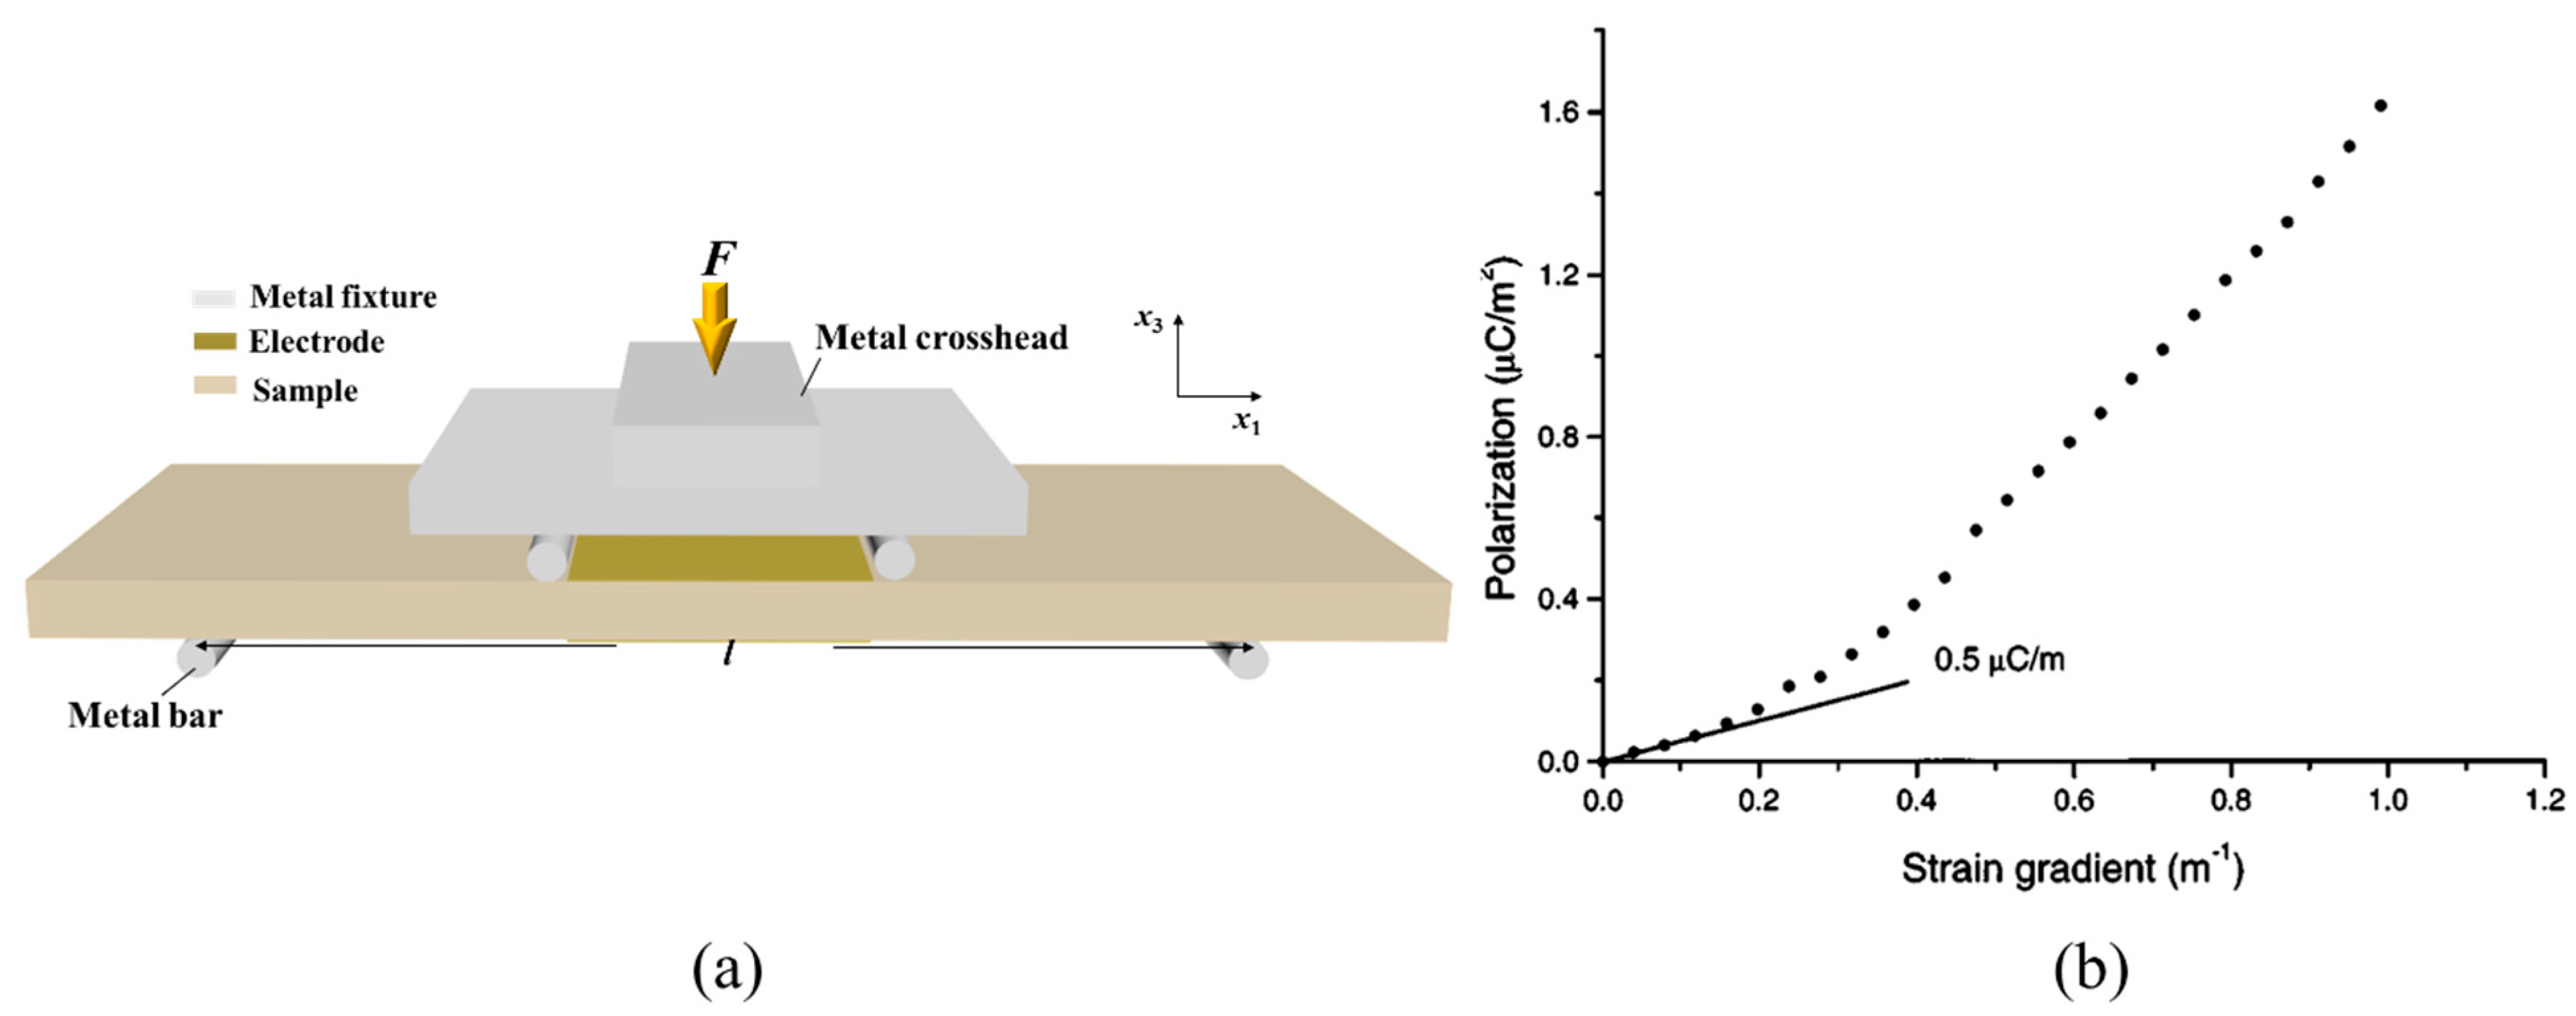
2.2. Four-Point Bending (4PB)

The four-point bending (4PB) method is also used to measure μ12 for a rectangular plate sample. As schematically shown in Figure 2a, both ends of the bottom side of a plate are supported by metal bars. Two forces from the metal bars on the top side compress the top side in the middle part of the sample through the metal crosshead, producing a large strain gradient S 11 / x 3 along the thickness direction. The strain gradient can be calculated as follows [10]:
S 11 x 3 = 12 s t l 2
where s is the speed of the top metal crosshead after applying F, t is the time, and l is the distance of the outer span. The generated polarization is
P = Q A
where Q is the induced electric charge, which can be measured by an electrometer connecting the top and bottom electrodes, and A is the electrode area. Using Equations (10) and (11), μ12 is derived as
μ 12 = Q l 2 12 A s t
As shown in Figure 2b, the flexoelectric coefficient measured using the 4PB method can be obtained according to the linear relationship between the polarization from the flexoelectric response and the strain gradient [10].

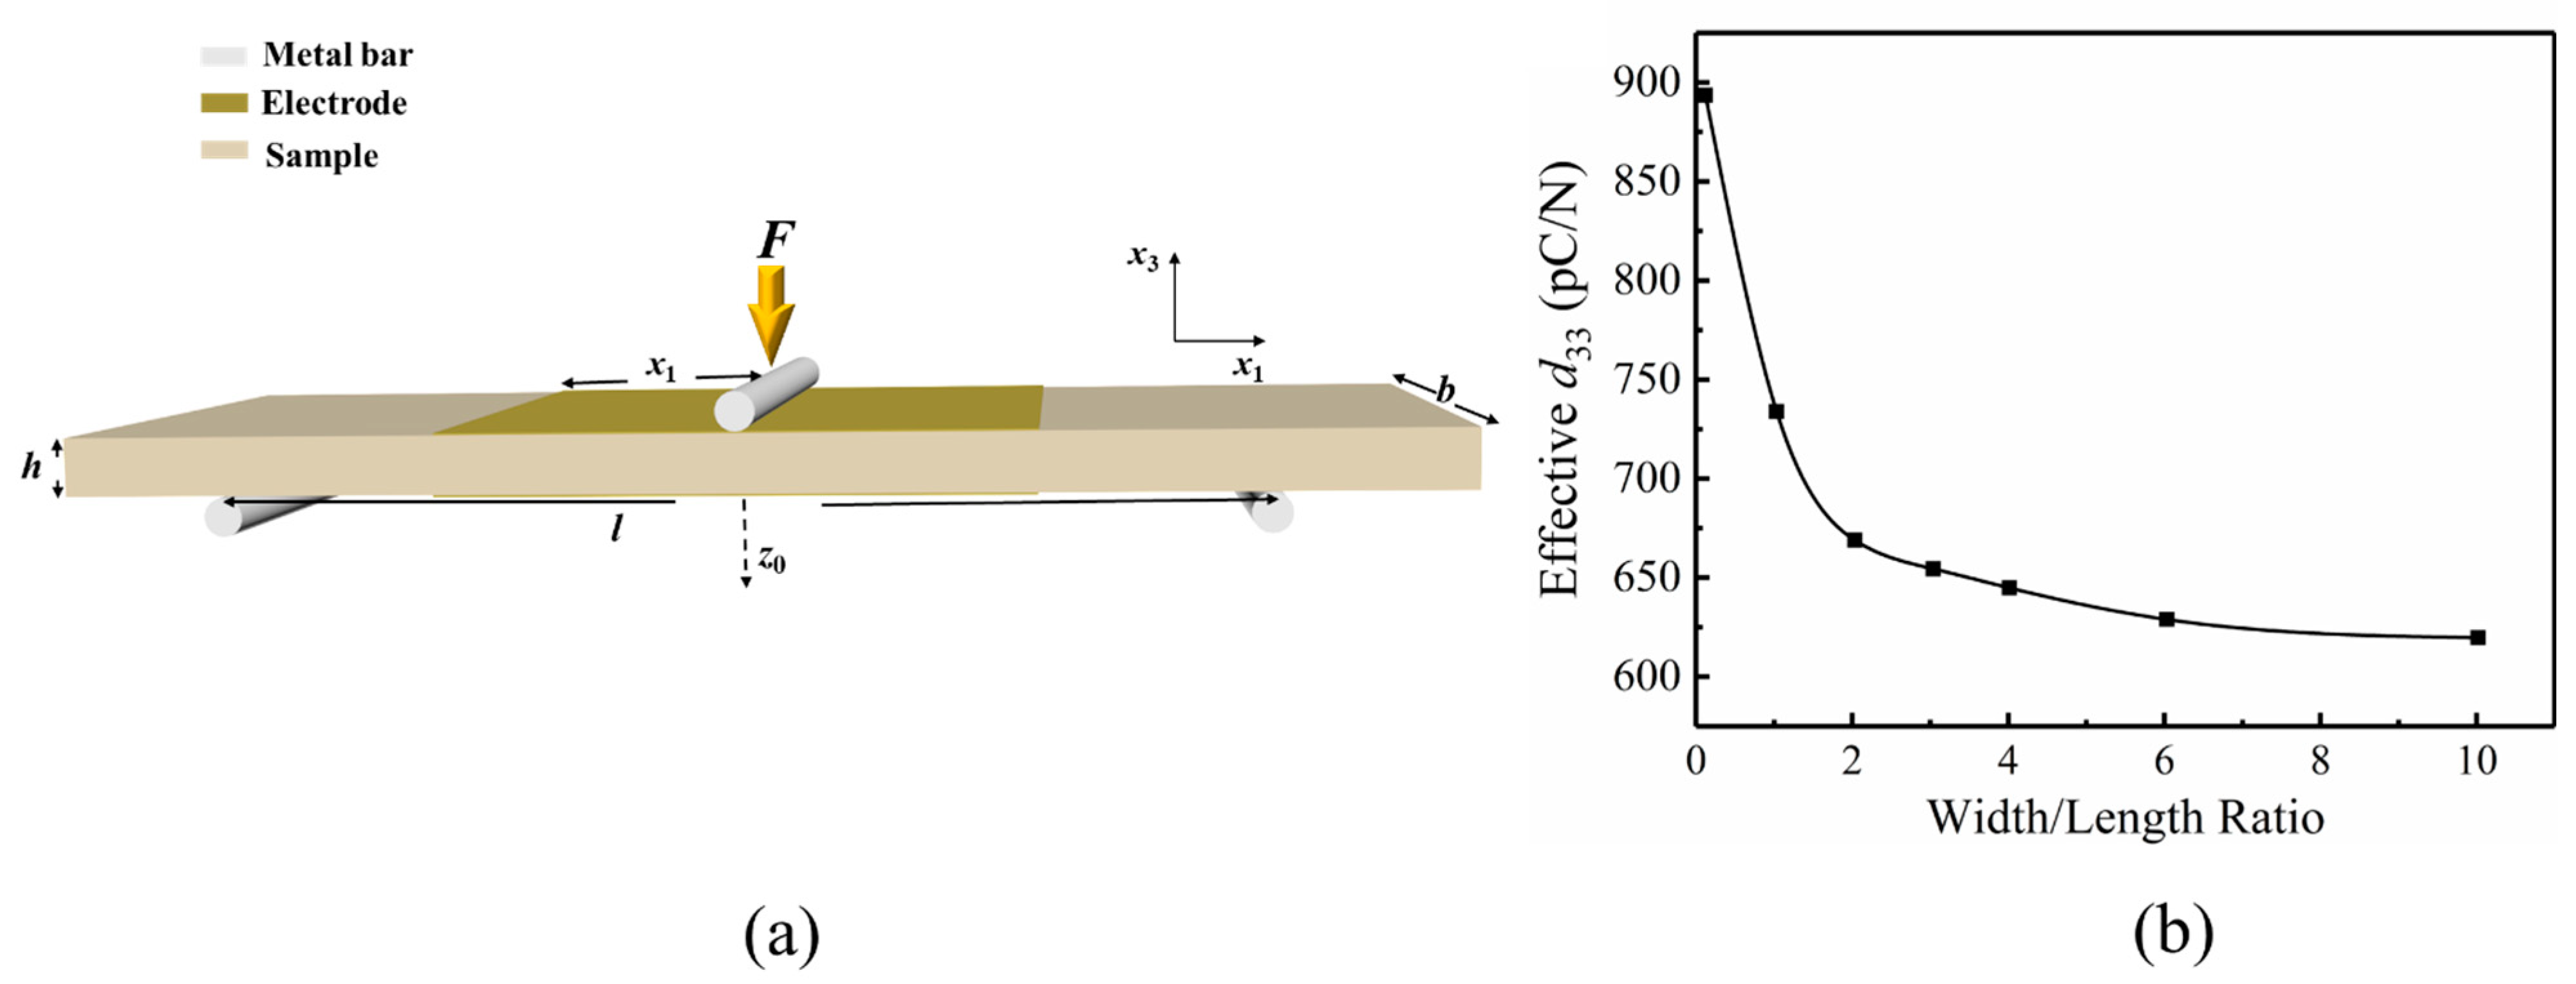
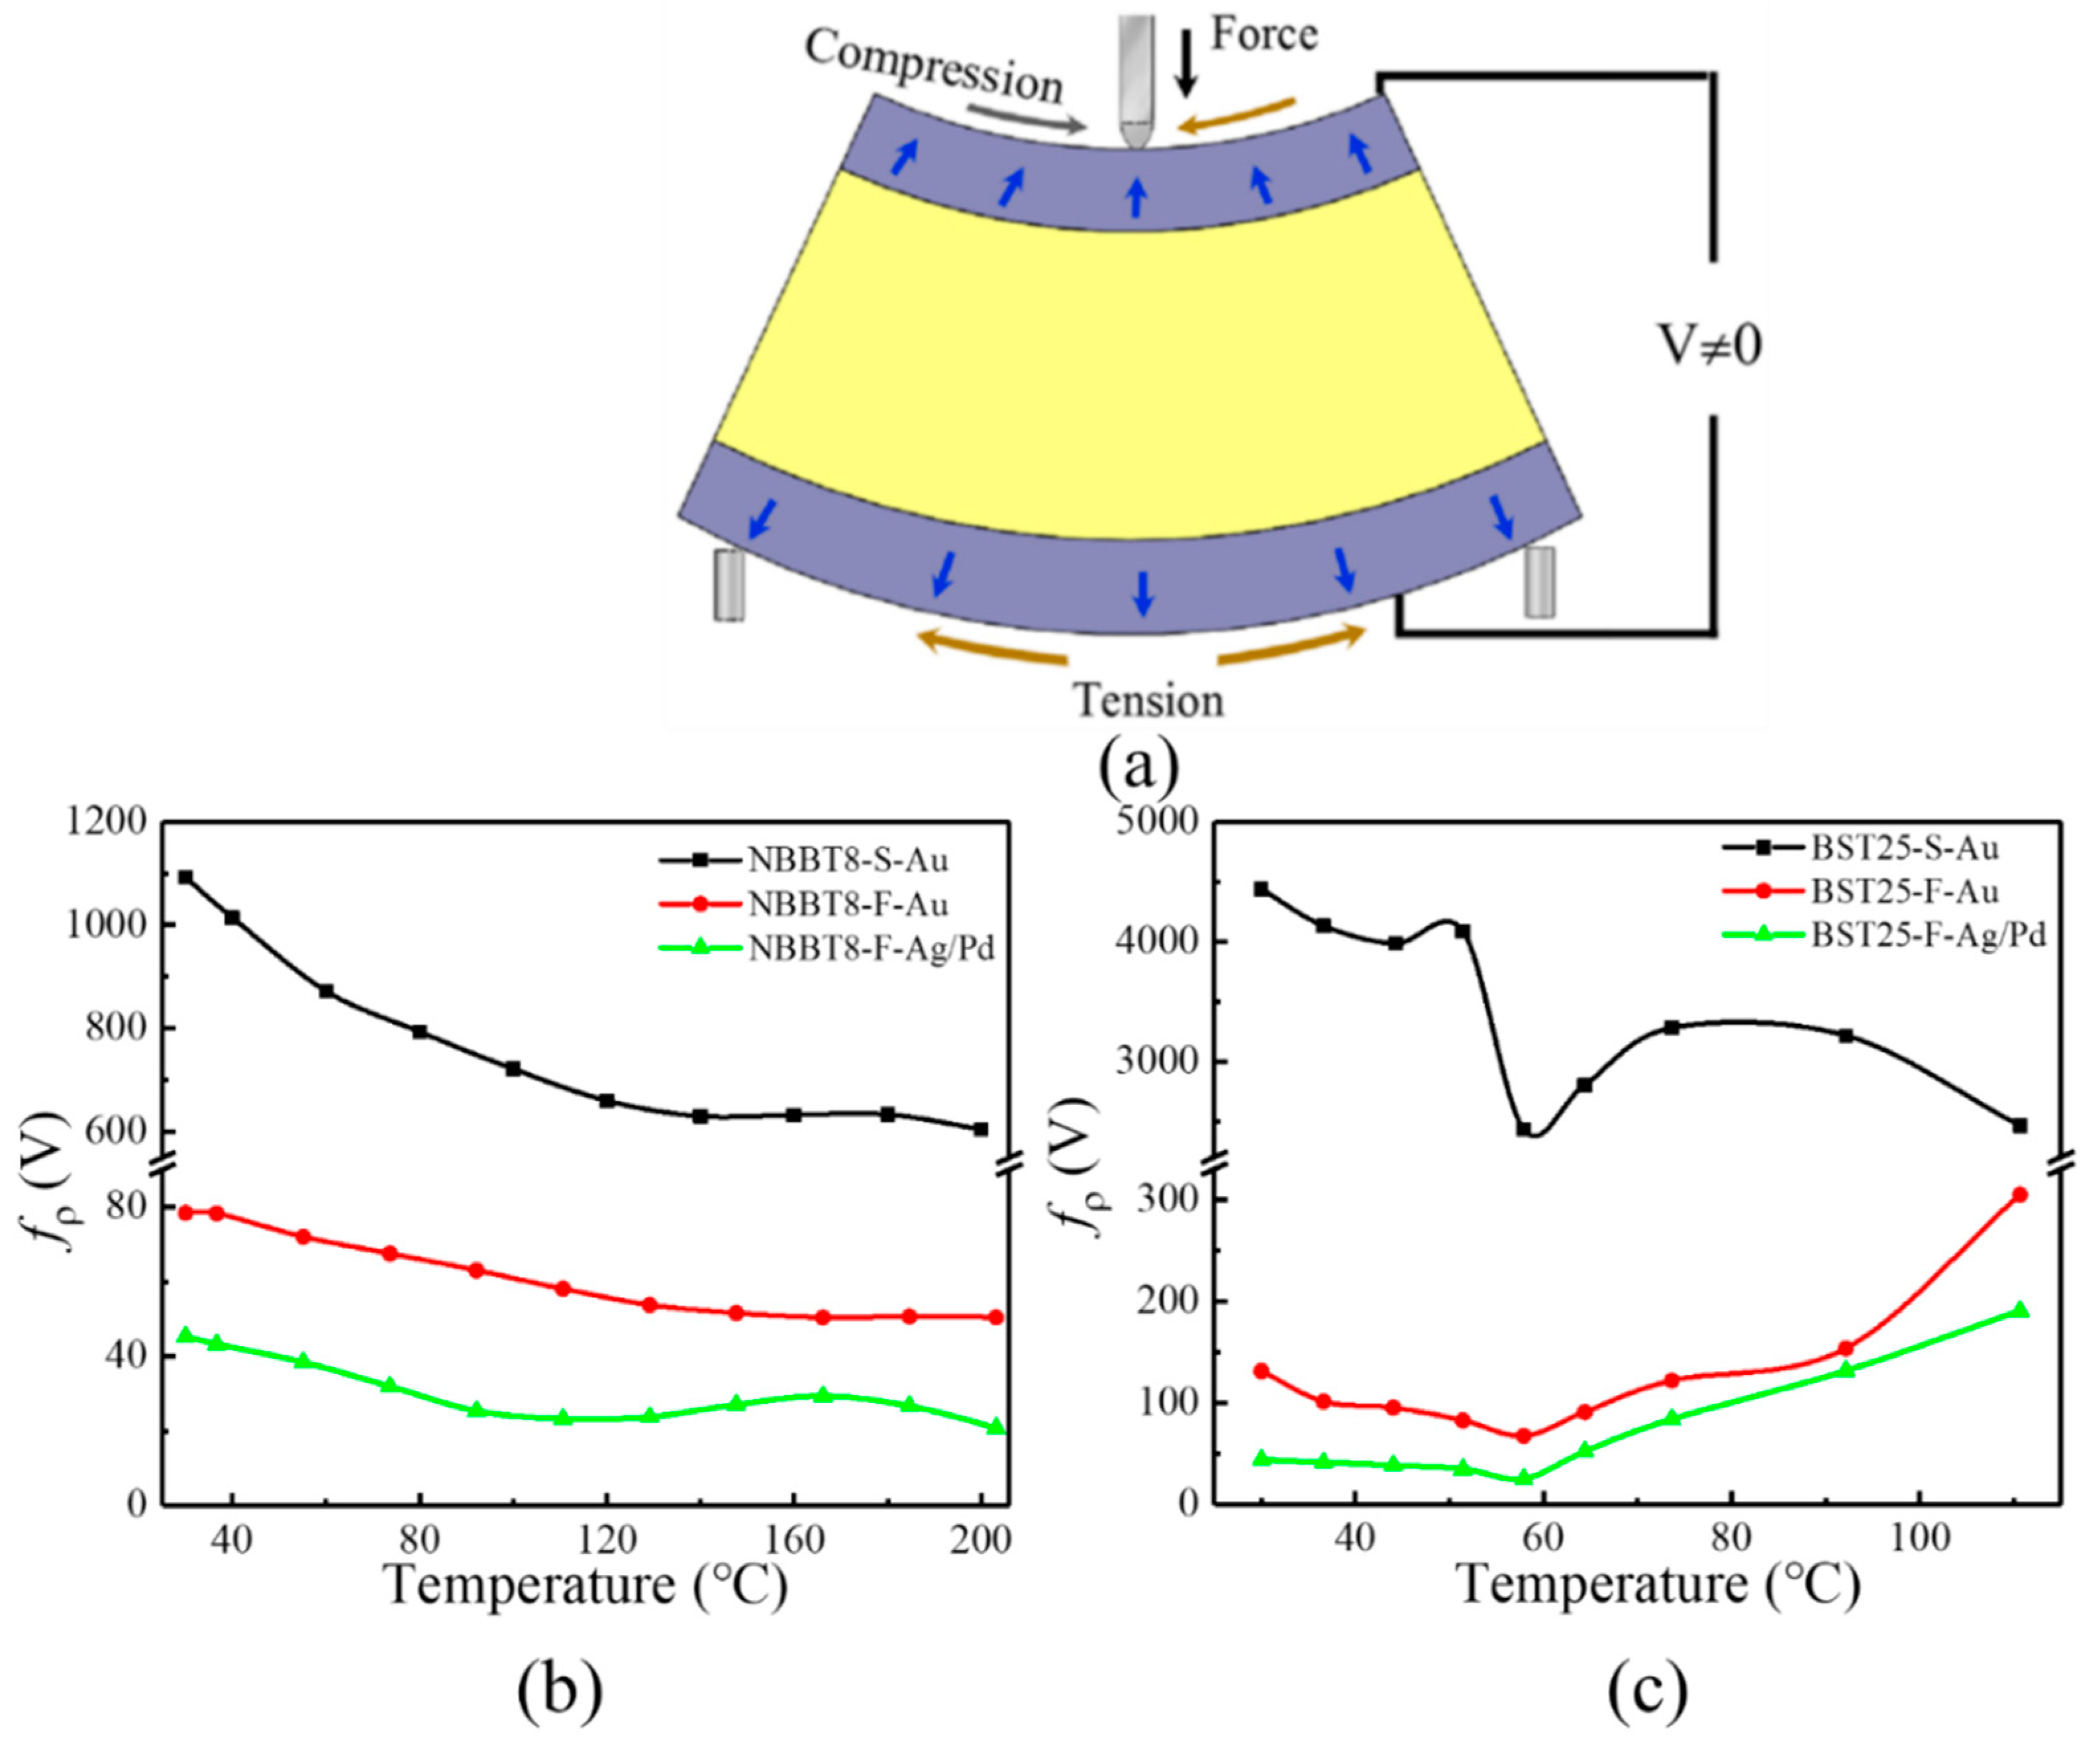
2.3. Three-Point Bending (3PB)

For the three-point bending method (3PB), both ends of the bottom side are also supported by metal bars but the middle part of the top side is compressed by one force, as shown in Figure 3a. The 3PB test fixture can be installed on a dynamic mechanical analyzer (DMA) or a d33 meter [22,23].
Using a DMA, the generated current (i) from the flexoelectric response can be measured by a lock-in amplifier and is converted to polarization using Equation (8). The strain gradient in the thickness direction is denoted by [22]:
S 11 x 3 = 12 z 0 l 3 ( l x 1 )
where z0 is the displacement of the center point measured by the DMA, x1 is the half length of the electrodes, and l is the distance of the outer span. From Equations (8) and (13), μ12 is derived as
μ 12 = i l 3 48 π f b x 1 z 0 ( l x 1 )
The 3PB test can also be performed on a commercial d33 meter using a modified test fixture. For unpolarized materials, a d33 constant from the flexoelectric response can be measured. The relationship between μ12 and d33 can be given by [23]:
d 33 = 3 μ 12 ( 1 σ ) l 2 2 h 3 c 11
where σ is the Poisson ratio of ceramics, h is the thickness, and c11 is the elastic modulus. Although the flexoelectric coefficient remains unchanged with the dimensions of ceramics in the micrometer size range, the magnitude of d33 was demonstrated to decrease with the increasing width-to-length ratio of a rectangular material (Figure 3b) because of the scaling effect of flexoelectricity [23].

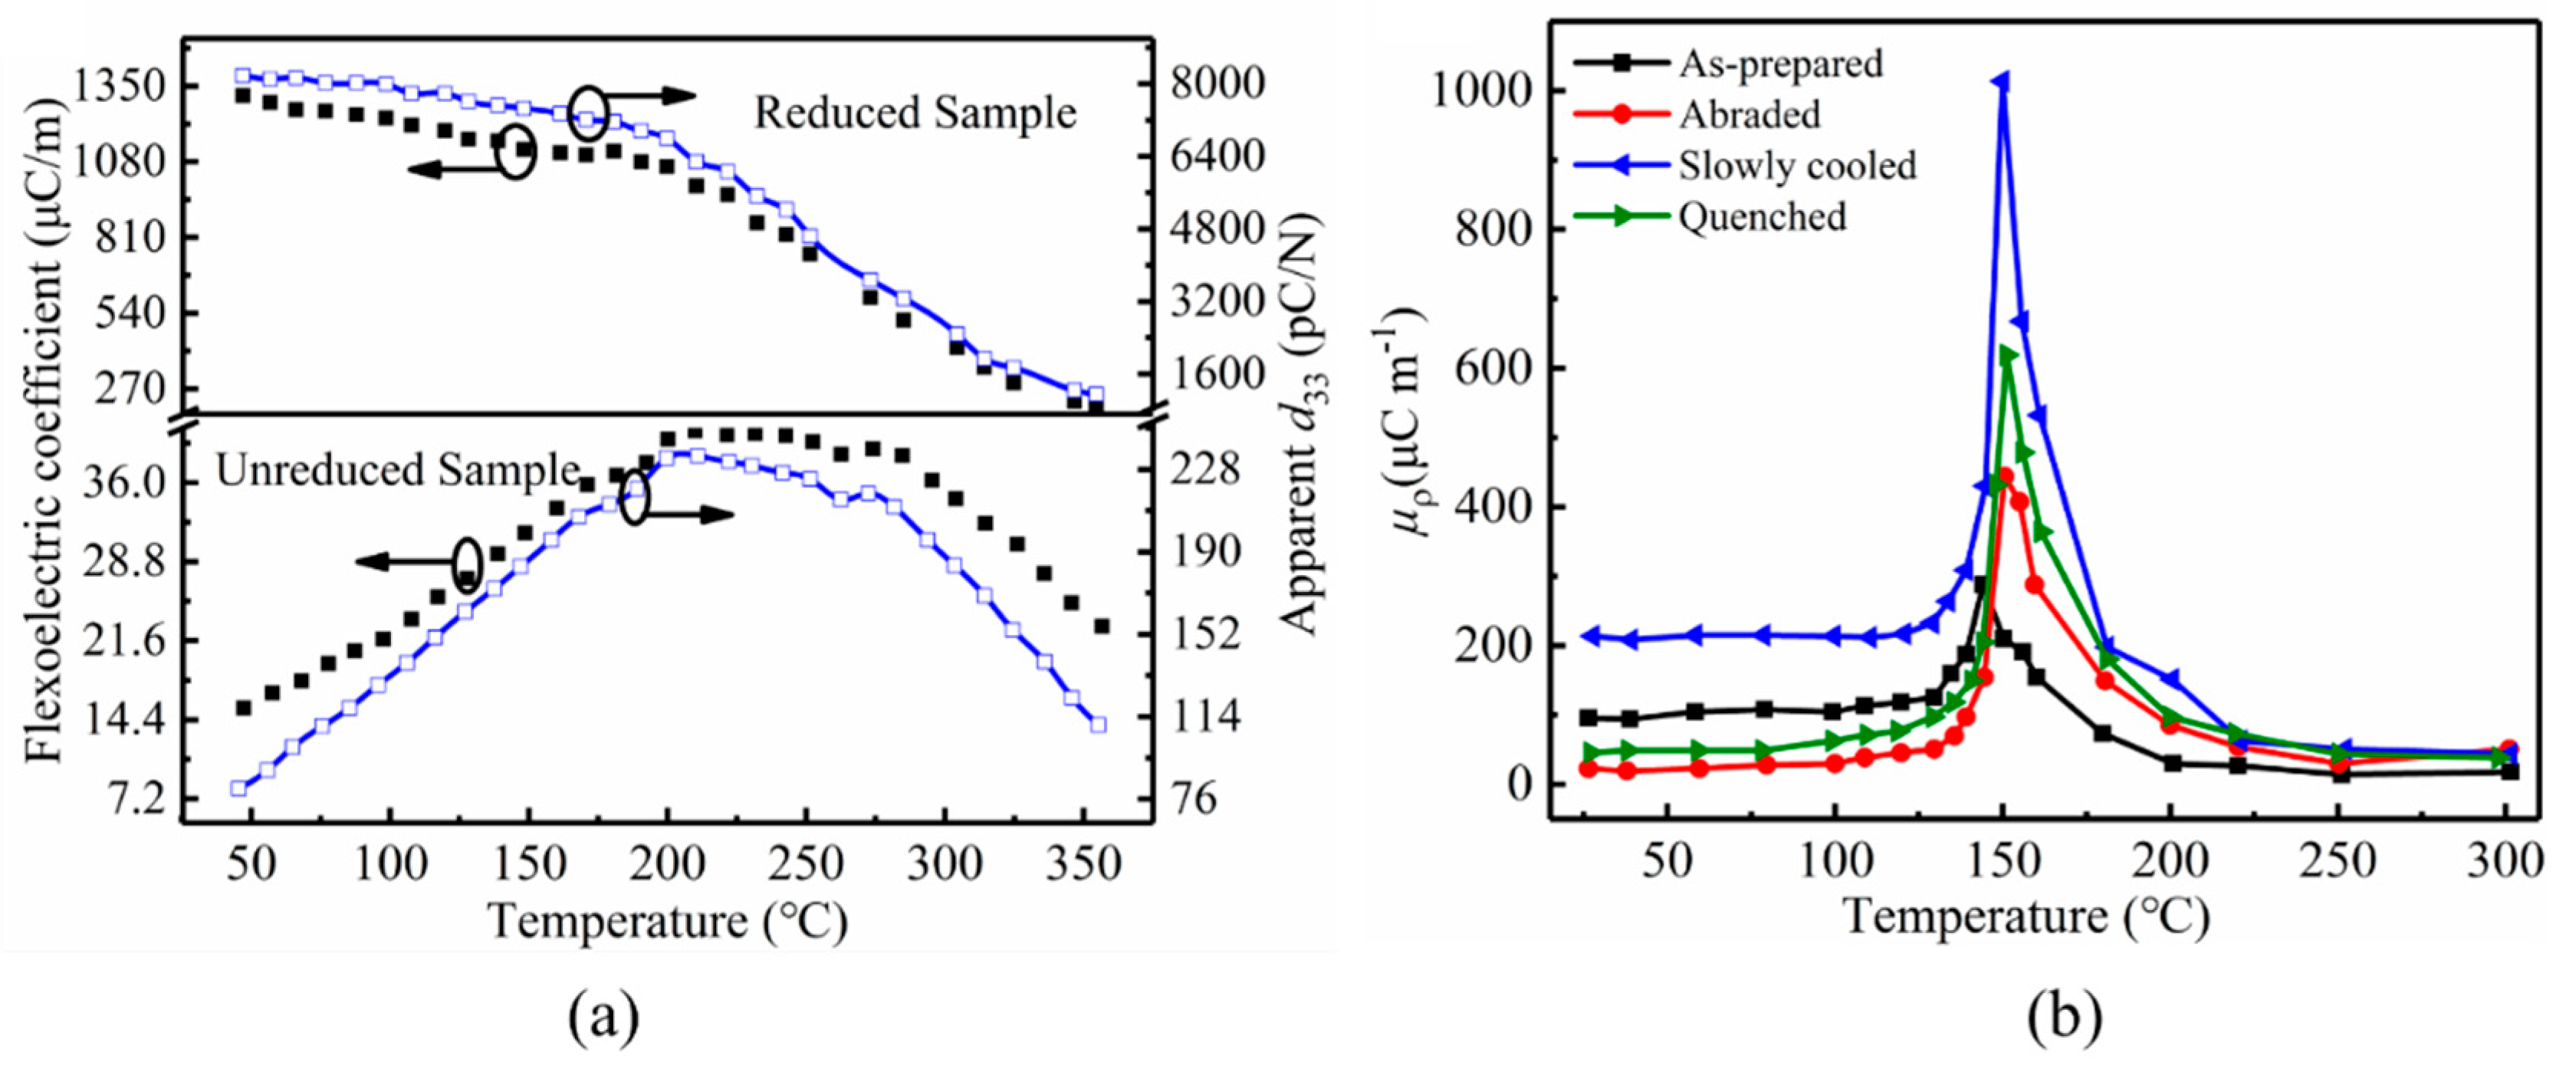
2.4. Point-Ring Method (PR)

The point-ring method is used to measure the flexoelectric coefficients of disc ceramics. As shown in Figure 4, one side of a disc sample is supported by a metal ring with a comparable inner diameter and the middle of the other side is compressed by force (F), which causes bending deformation. The generated strain gradient in the thickness direction can be given by [24]:
S ( r ) x 3 = 3 F ( 1 σ 2 ) π c 11 h 3 ( σ 1 + σ + ln r R D )
where S(r) is the strain along the radial direction, r is the distance of a point from the center of the disc, and R D is the radius of the disc. The text fixture can also be mounted on a d33 meter. The measured d33 from the flexoelectric response is converted to the electric charge Q as follows:
d 33 = Q F
and the relationship between Q and the flexoelectric coefficient is
Q = 2 π 0 + R D μ ρ S ( r ) x 3 r d r
where μρ is the effective flexoelectric coefficient that contains the contributions of μ12 and μ11. Substituting Equations (16) and (17) into (18), μρ can be expressed as:
μ ρ = 2 d 33 c 11 h 3 3 ( 1 σ ) 2 R D 2

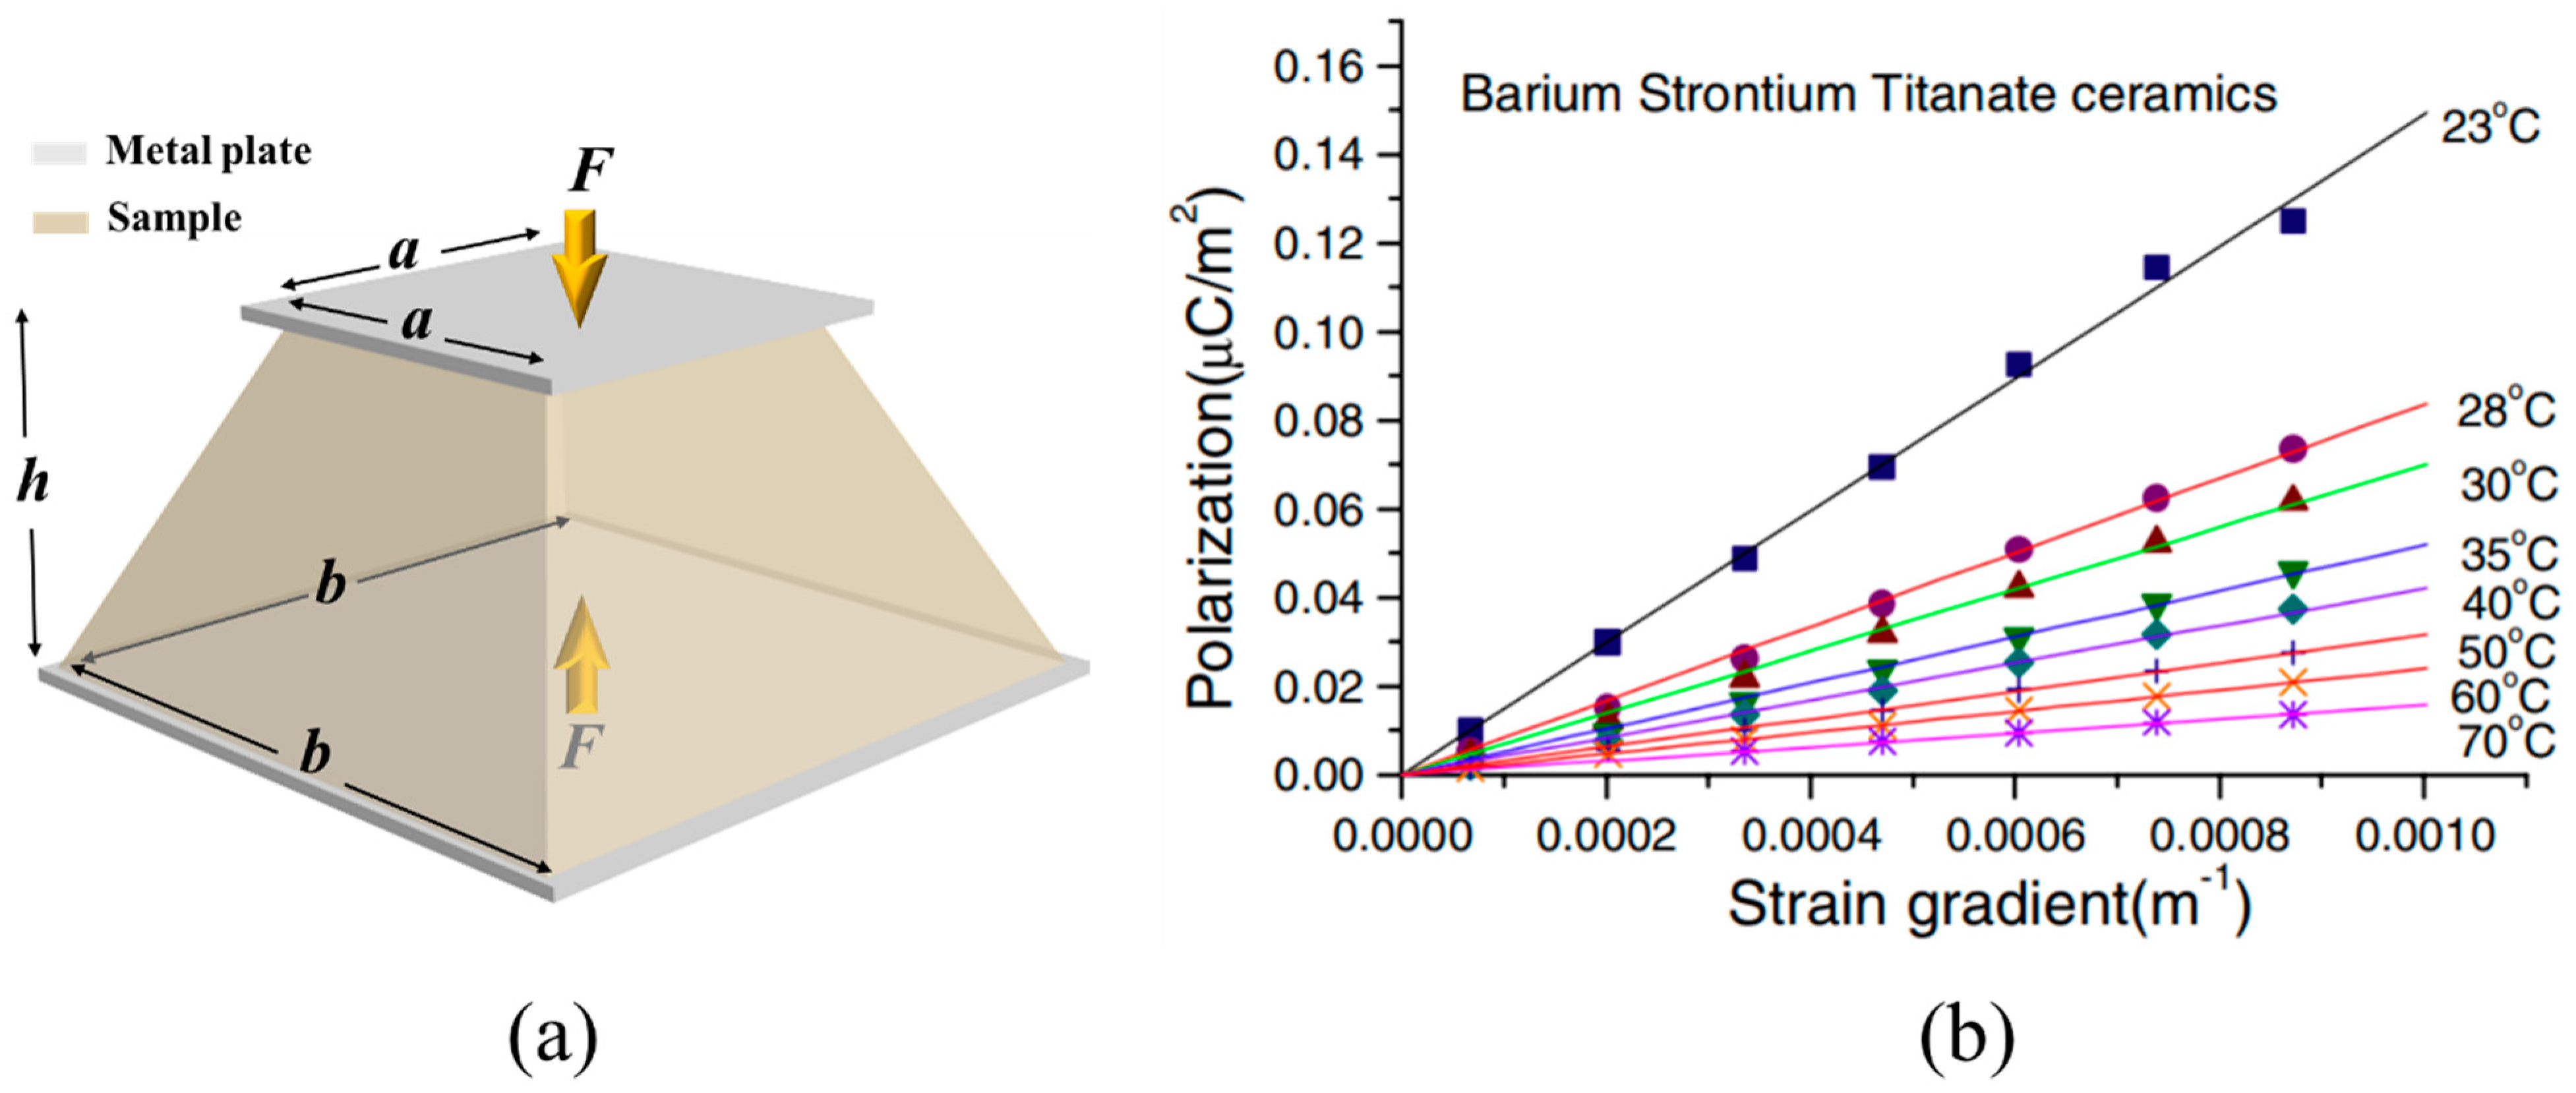
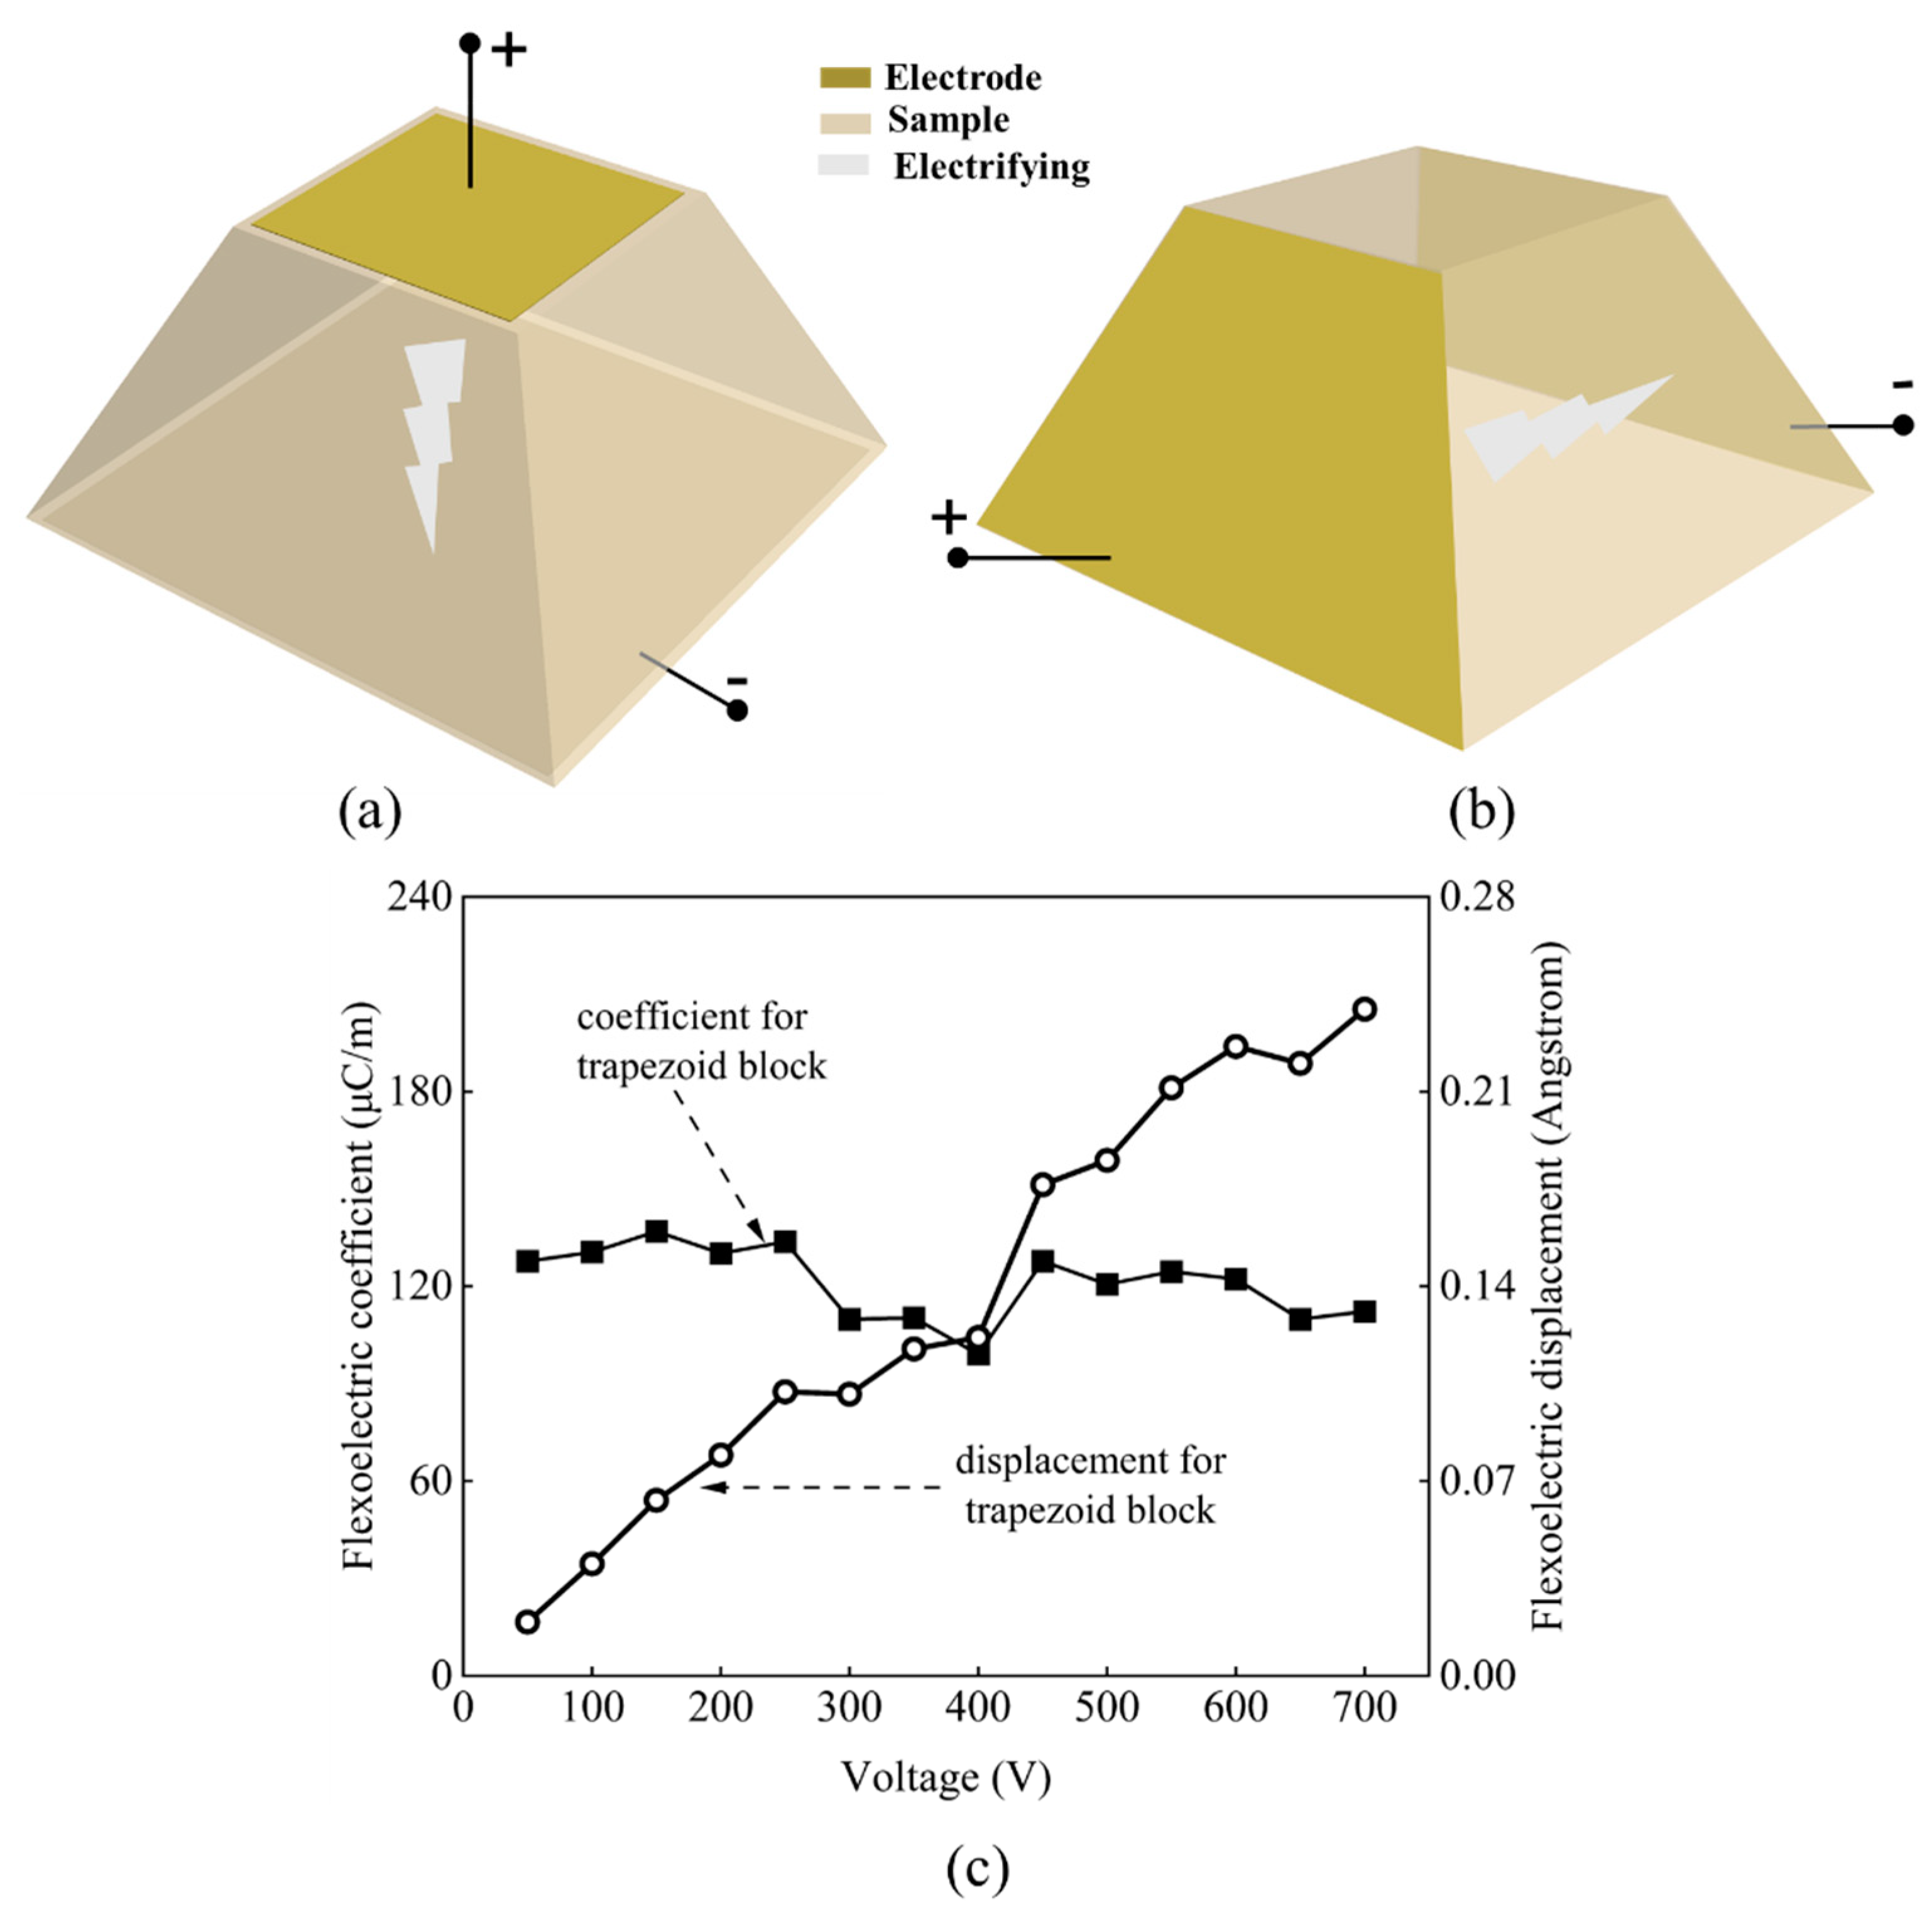
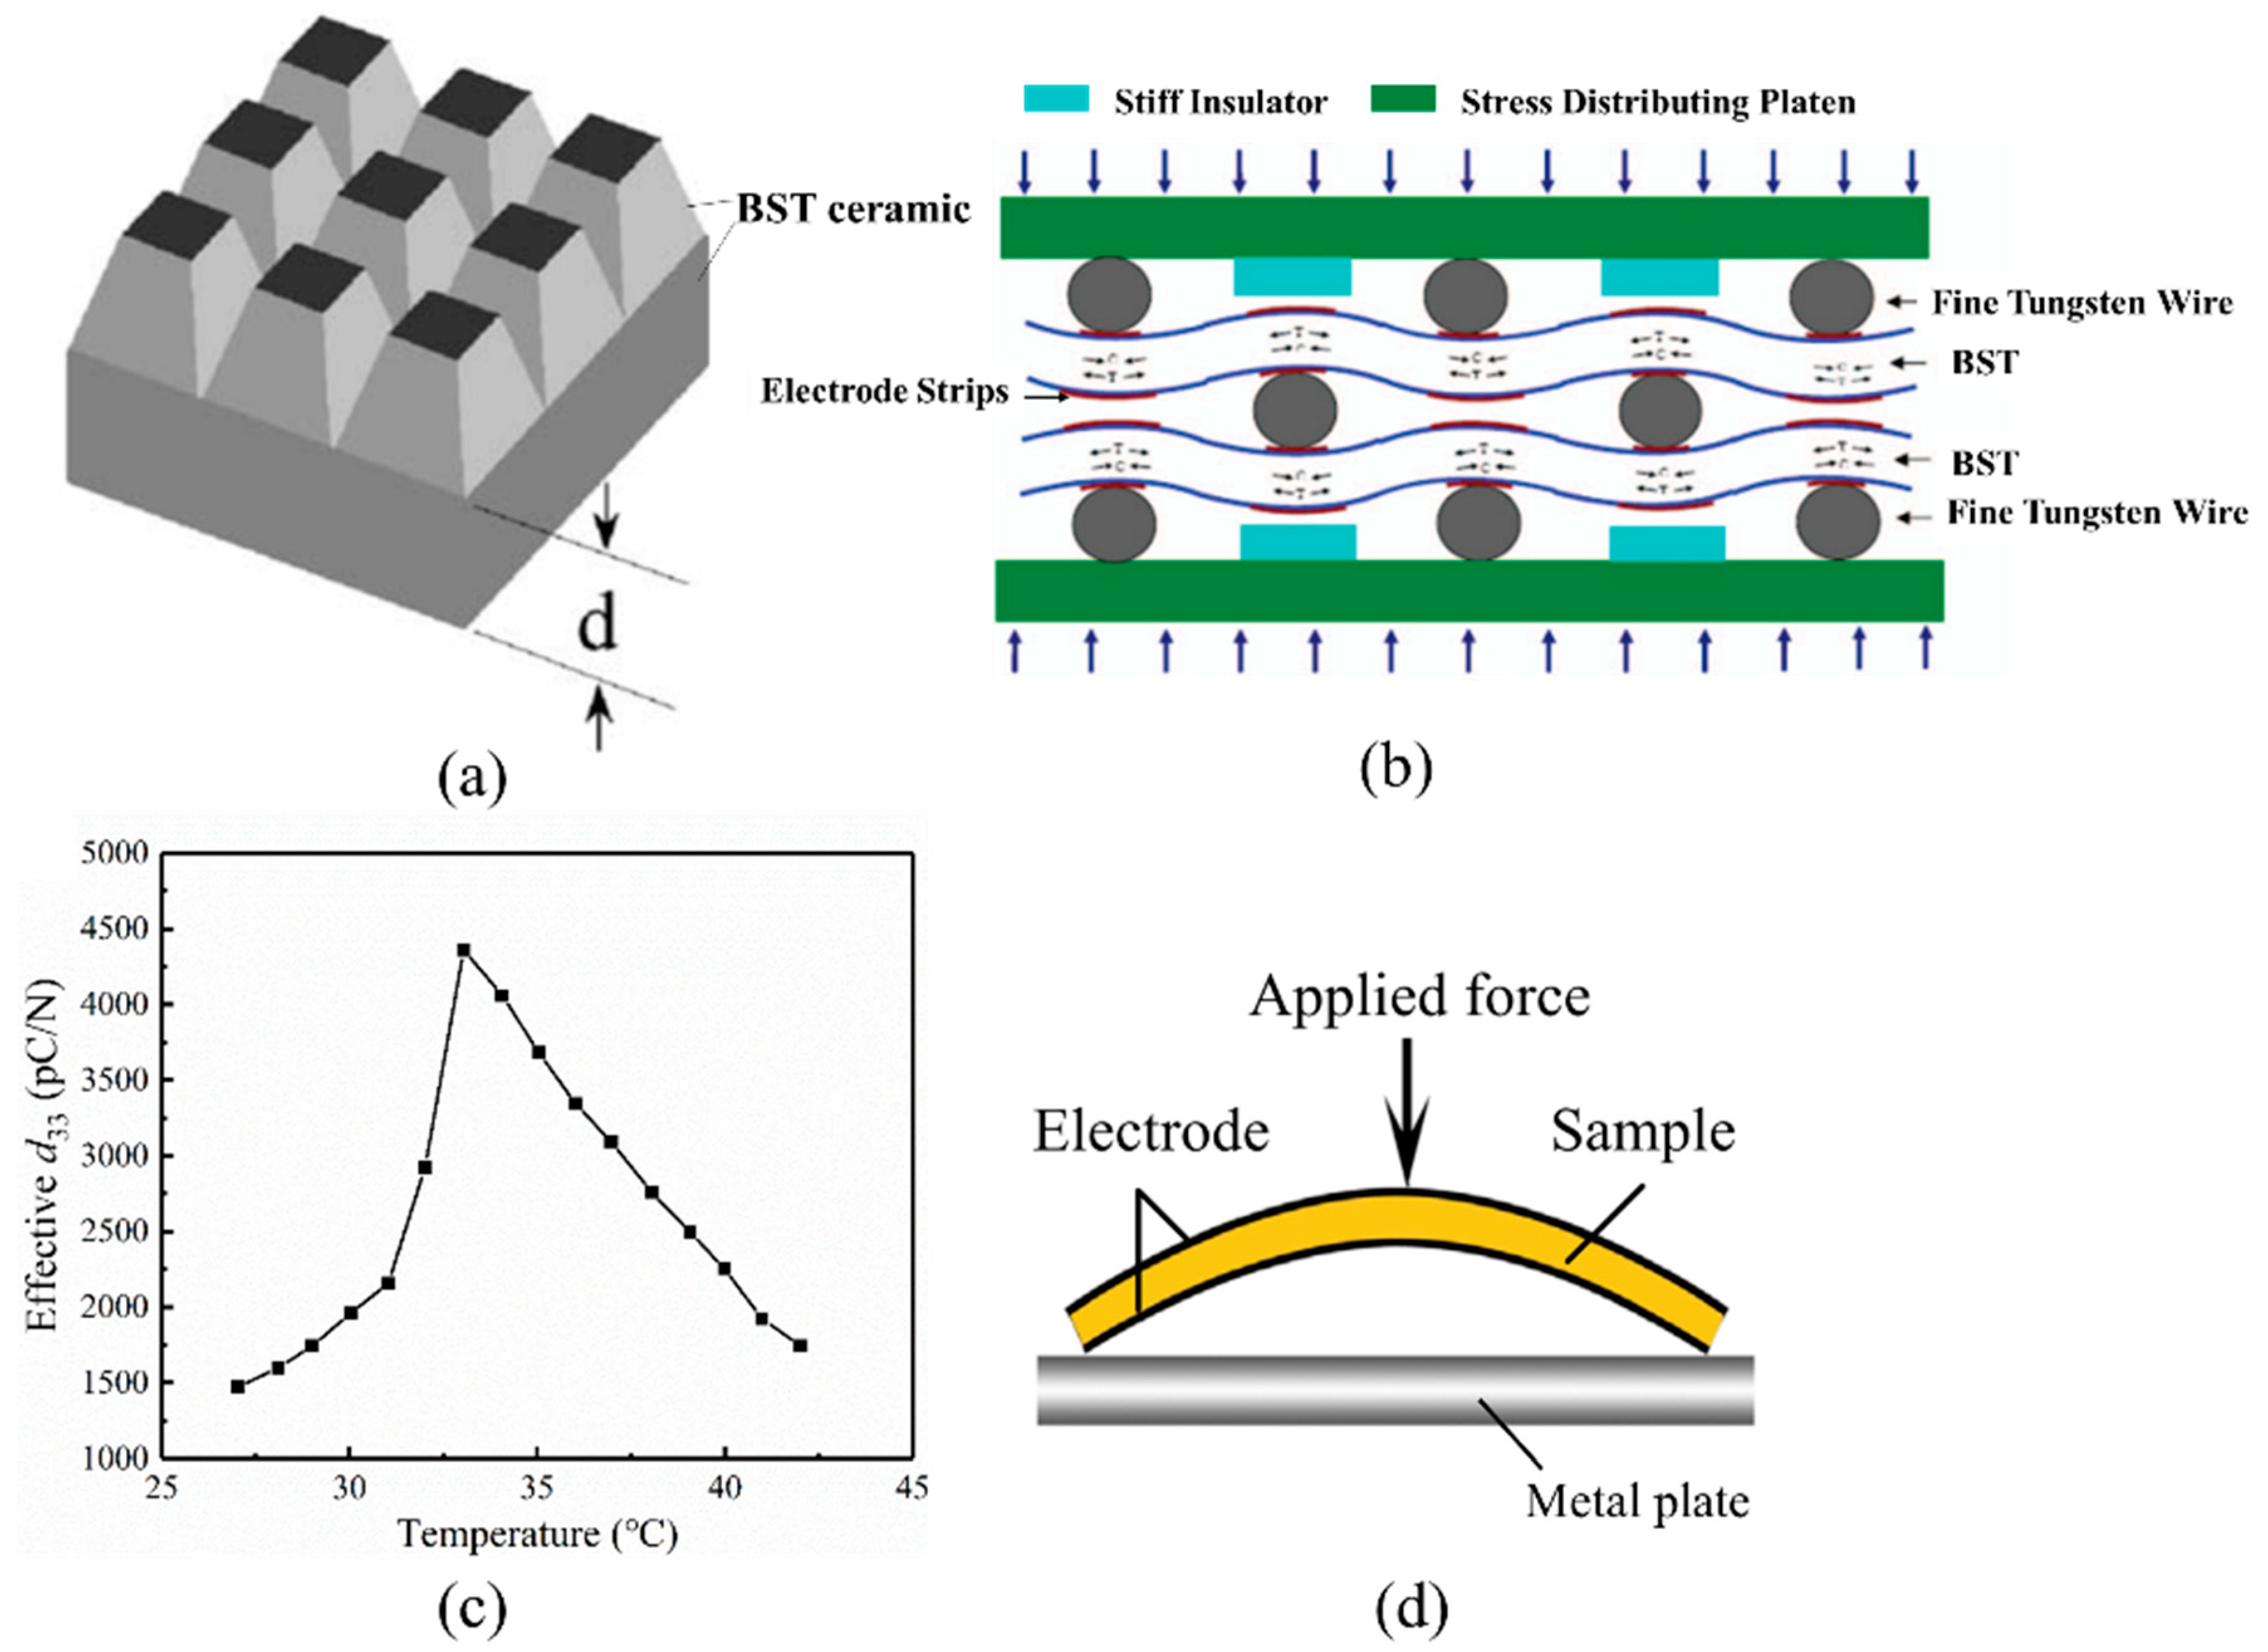
2.5. Pyramid Compression (PC)

The above methods for generating strain gradients are mainly realized by bending the samples. For samples with asymmetric shapes, such as truncated pyramid-like shapes, symmetric forces can induce strain gradients. Figure 5a shows that the forces from the top and bottom sides compress a sample with a truncated pyramid-like shape, which causes a strain gradient along the thickness direction. If the strain gradient S 33 / x 3 is uniform, it can give [1]:
S 33 x 3 = ( ( F / c 11 a 2 ) ( F / c 11 b 2 ) ) h = F ( b 2 a 2 ) c 11 a 2 b 2 h
where a and b are the edge lengths of the top and bottom square surfaces with electrodes, respectively. The proportionality coefficient between the generated polarization from the flexoelectric response and the strain gradient is μ11 (Figure 5b). However, the strain gradient cannot be simplified using Equation (20) and is nonuniformly distributed in pyramid-like samples [25]. Correspondingly, this method cannot obtain the exact value of μ11 [26]. Nevertheless, the simply calculated μ11 can be used to evaluate and compare the flexoelectric response of different materials. In addition, the method is not appropriate for materials with a piezoelectric response or polarized ferroelectric materials. Otherwise, the piezoelectric response would become an important factor in the measured flexoelectric response [26,27]. Thus, the contribution of the piezoelectric response should first be precluded when measuring the flexoelectric coefficient using the PC method [26]. For polymers, the strain can be caused by stretching the samples [28,29].

2.6. Shock-Wave Method

Shen and Liang used a shock wave propagating into a fixed sample to generate a strain gradient [30]. As shown in Figure 6, the first-order hydrogen gas gun shoots a flying slab, which causes a shock wave. The strain gradient is expressed as [30]
2 u ( x , t ) x 2 = v c λ h s ( e c t x h s λ h s + e c t + x h s λ h s )
and
c = c 11 ( 1 σ ) ρ ( 1 + σ ) ( 1 2 σ )
where u(x,t) is the displacement of the particle at point x and time t, c is the wave velocity, v is the speed of the impacted sample by a flying plate, λ is the ratio of the flying plate to the sample mass, h is the thickness of the samples, ρ is the mass density of the materials, σ is the Poisson ratio of the samples, and c11 is the elastic modulus. The method measures μ11 by studying the relationship between the induced voltage Umax and strain gradient, which is given by
U max = R μ 11 v π D s 2 ( 2 λ h ) 2 ( e c t x h λ h + e c t + x h λ h )
where R is the resistance of the loading resistor and Ds is the diameter of the samples. Using this method, the measured μ11 of BaTiO3 ceramics is ~17.33 μC/m, which is consistent with the published transverse flexoelectric coefficient.

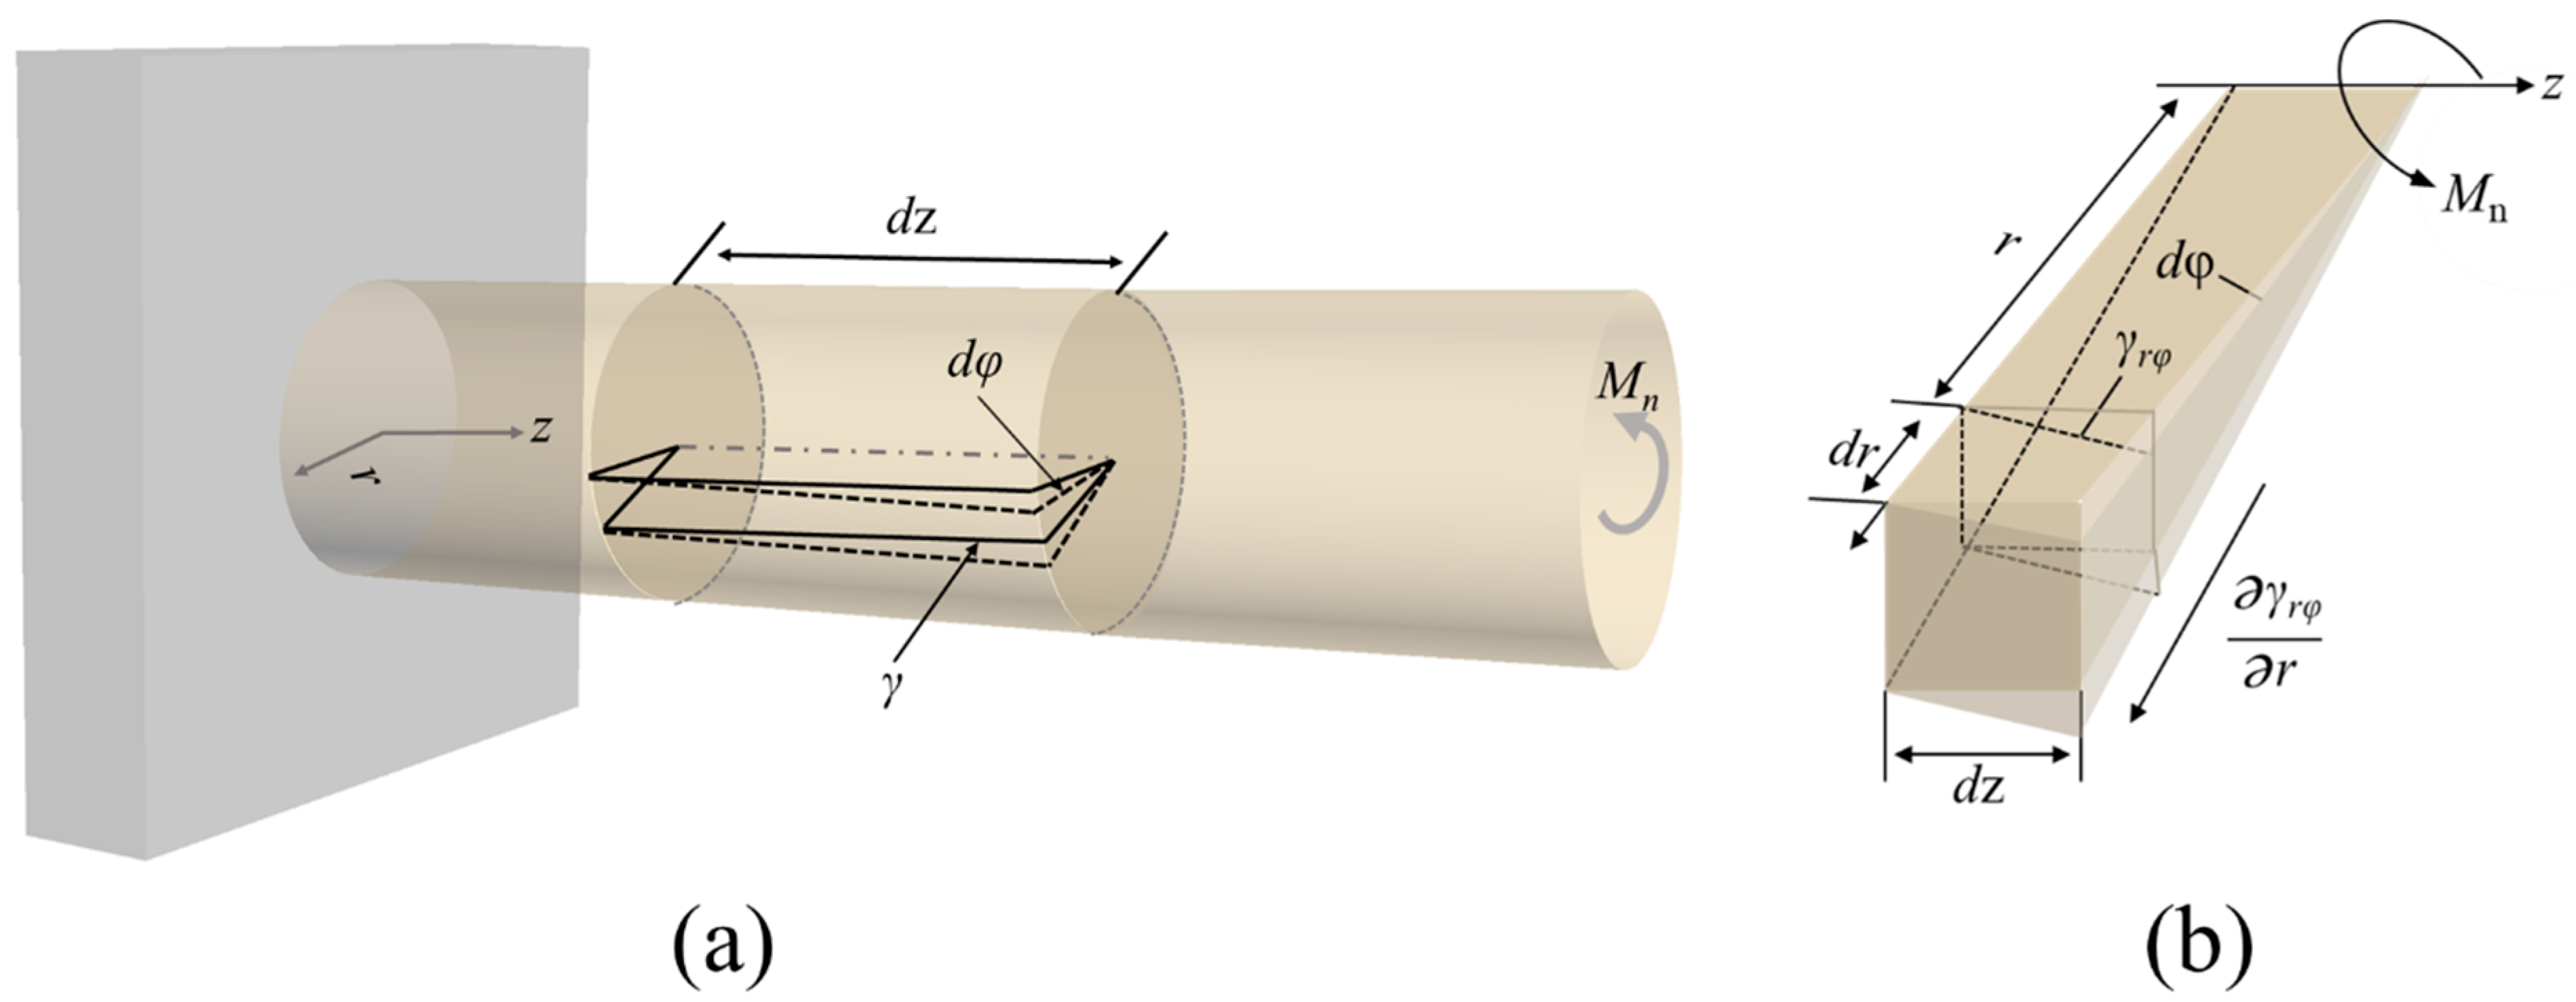
2.7. Cylinder Twisting (CT)

The cylinder twisting method is mainly designed for polymers and is used to measure the shear flexoelectric coefficients [31,32]. Both ends are clamped for a cylinder-shaped sample and the middle part is torqued, resulting in an inhomogeneous shear strain along the radial direction, as shown in Figure 7. Therefore, the strain gradient along the radial direction occurs when torque is exerted on the sample. Meanwhile, the parallel lines deflect at a micro-angle γ and the related diameter line rotates at a micro-angle . The shear strain γ in the effective region of the samples can be expressed as [31,32]
γ r φ = M n r J G
where Mn is the applied torque, r is the radius, J is the polar moment of inertia of the effective region of the sample, and G is the shear modulus. The gradient of the shear strain along the radial direction can be given as [31,32]
γ r r = γ | r = R D γ | r = r D R D - r D = M n J G
Electric polarization is defined as
P r = μ 44 γ r r
By substituting Equation (25) into Equation (26), the value of μ44 can be estimated. Before measuring the electric polarization, a tube-shaped sample is prepared and the intersurface and external surface of the tube are coated with full electrodes [31]. When applying torque to the sample, the electric polarization can be measured using a charge amplifier. The strain gradient is usually obtained through the torque angle φ [31,32]. The torque angle as a function of the applied torque Mn is [32]
φ = d φ = 0 l M n J G d z = M n l J G
where l is the total length of the specimen along the z direction. After measuring the torque angle and applied torque, the strain gradient can be estimated using Equations (25) and (27).

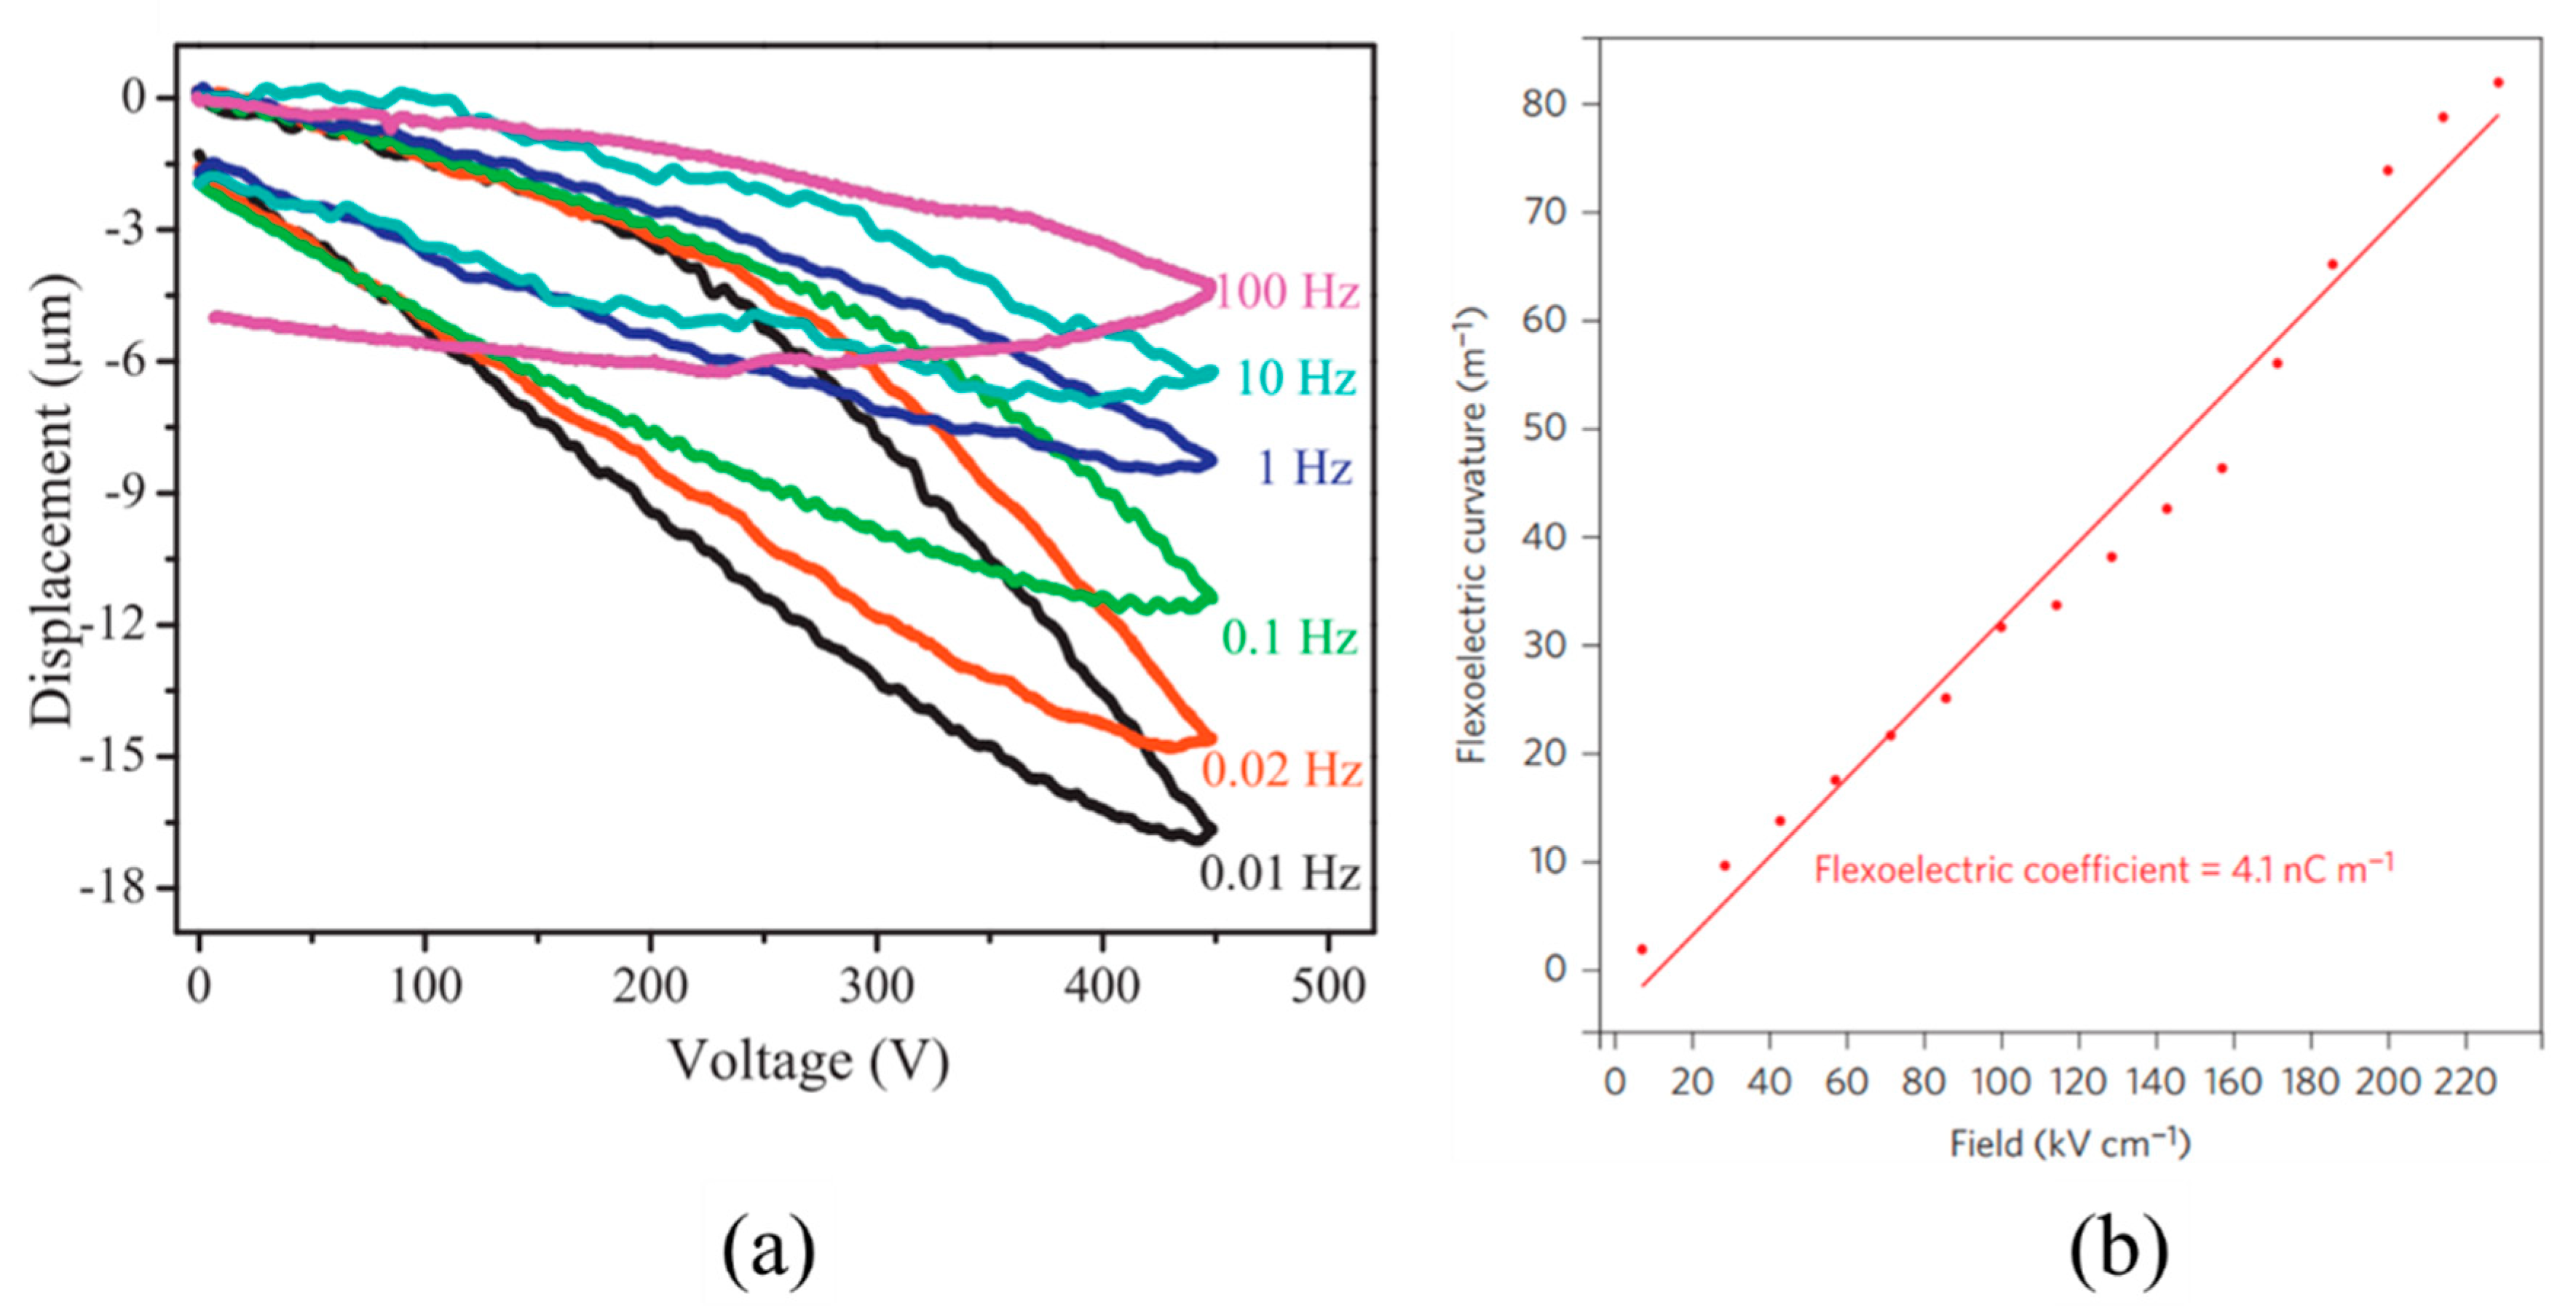
2.8. Converse Flexoelectric Effect (CFE)

For the converse flexoelectric response, the flexoelectric coefficients μijkl can be calculated according to Equation (2). To apply an inhomogeneous electric field, measured materials with asymmetric shapes are usually required, such as those with truncated pyramid-like shapes [33,34]. An electric field gradient is generated when a voltage is applied on the top and bottom surfaces or both lateral sides of the truncated pyramid-like samples (Figure 8a,b) [33,34]. Figure 8c shows the relationship between the displacement of the trapezoid BST block from the converse flexoelectric effect and the applied voltages, which can be used to estimate the flexoelectric coefficient [33]. The flexoelectric coefficients obtained from the direct effect and converse effect should be the same for the same materials. The strain induced by the flexoelectric response can be monitored by a high-resolution laser vibrometer and converted to stress via the elastic modulus.

3. The Magnitude of the Flexoelectric Coefficient

The flexoelectric coefficients of different ferroelectric materials were measured using the methods described above and are summarized in Table 2 and Table 3. It should be noted that a reliable comparison of the results presented in Table 2 and Table 3 is impossible due to the lack of uncertainties in many of the results. The origin of the measured flexoelectric coefficient is complex and the flexoelectric coefficient in ferroelectric materials contains some inseparable non-zero components and extrinsic contributions (discussed in the next section). Thus, the measured flexoelectric coefficients are effective values [27]. For example, the measured μ11 comprises the contributions of μ11 and μ12. In addition, the flexoelectric coefficients vary with the measurement methods for the same material, as shown in Table 2 and Table 3, indicating that the comparison of flexoelectric coefficients should be based on the same measurement method.
To enhance the flexoelectric coefficient, various attempts, including composite, doping, compositional gradient, or thermal treatment, can be adopted [39,45,48,54,61,70]. The flexoelectric coefficient of Ba0.6Sr0.4TiO3/Ni0.8Zn0.2Fe2O4 composites was increased to ~128 μC/m compared to ~100 μC/m of Ba0.6Sr0.4TiO3 ceramics [39]. In polymer materials, by adding 25% Ba0.67Si0.33TiO3 to PVDF film, the flexoelectric coefficient was enhanced several times [68]. After doping Sm into BaTi0.85Sn0.15O3 ceramics, the flexoelectric coefficient at room temperature can be greatly increased [55]. It was found that compositional gradients can greatly enhance the flexoelectric coefficient of ferroelectric ceramics [61]. The effective flexoelectric coefficient of reduced 0.92Na0.5Bi0.5TiO3-0.08BaTiO3 (NBBT8) ceramics can be increased by more than two orders of magnitude after an asymmetric reduction reaction using graphite, which causes a chemical inhomogeneity in the ceramics [60]. The high flexoelectric coefficients of the reduced ceramics can be maintained at a high temperature, as shown in Figure 9a [60]. When abraded ferroelectric ceramics are heat-treated at a temperature above the Curie temperature (TC) or maximum dielectric temperature (Tm) and then slowly cooled, polarized surface layers are generated (discussed in detail in the next section), which contribute to the effective flexoelectric coefficient [45,59]. From the temperature dependence of the effective flexoelectric coefficient of BaTiO3 ferroelectric ceramics (Figure 9b), it can be seen that μρ of the slowly cooled sample sustains a high level, even at a temperature slightly higher than the Curie temperature [45]. Overall, the inorganic ferroelectric materials have a stronger flexoelectric response than ferroelectric polymers, as shown in Table 2 and Table 3.

4. Theoretical Studies of Measured Flexoelectric Coefficients of Ferroelectric Materials

In dielectric materials, the measured flexoelectric effect theoretically consists of contributions from bulk dynamic flexoelectricity, bulk static flexoelectricity, surface flexoelectricity, and surface piezoelectricity [1]. The bulk and surface flexoelectricity are theoretically proportional to the dielectric permittivity. In materials, each surface layer with a thickness of several atoms is always asymmetric, generating surface piezoelectricity [71,72,73,74,75]. Thus, the surface piezoelectricity is dependent on the surface properties [1]. Under bending, the surface piezoelectricity contributing to the flexoelectric response is manifested because one surface is in tension and the other is in compression. The magnitude of the flexoelectric effect is often evaluated using the flexocoupling coefficient fsjkl and is given by [6]:
f s j k l = μ i j k l χ i s ε 0
where ε0 is the vacuum permittivity. Theoretically, fsjkl is determined by the lattice parameter and should typically be below 10 V for common dielectric materials and ~15 V for materials with perovskite structures [6]. However, the experimental fsjkl is often several orders of magnitude larger than the theoretically estimated values in ferroelectric materials, which implies that extrinsic mechanisms dominate the flexoelectric response in ferroelectric materials [36,42,45,59,60,62]. In this section, some theoretical investigations of the large flexoelectric coefficients of ferroelectric materials are summarized.

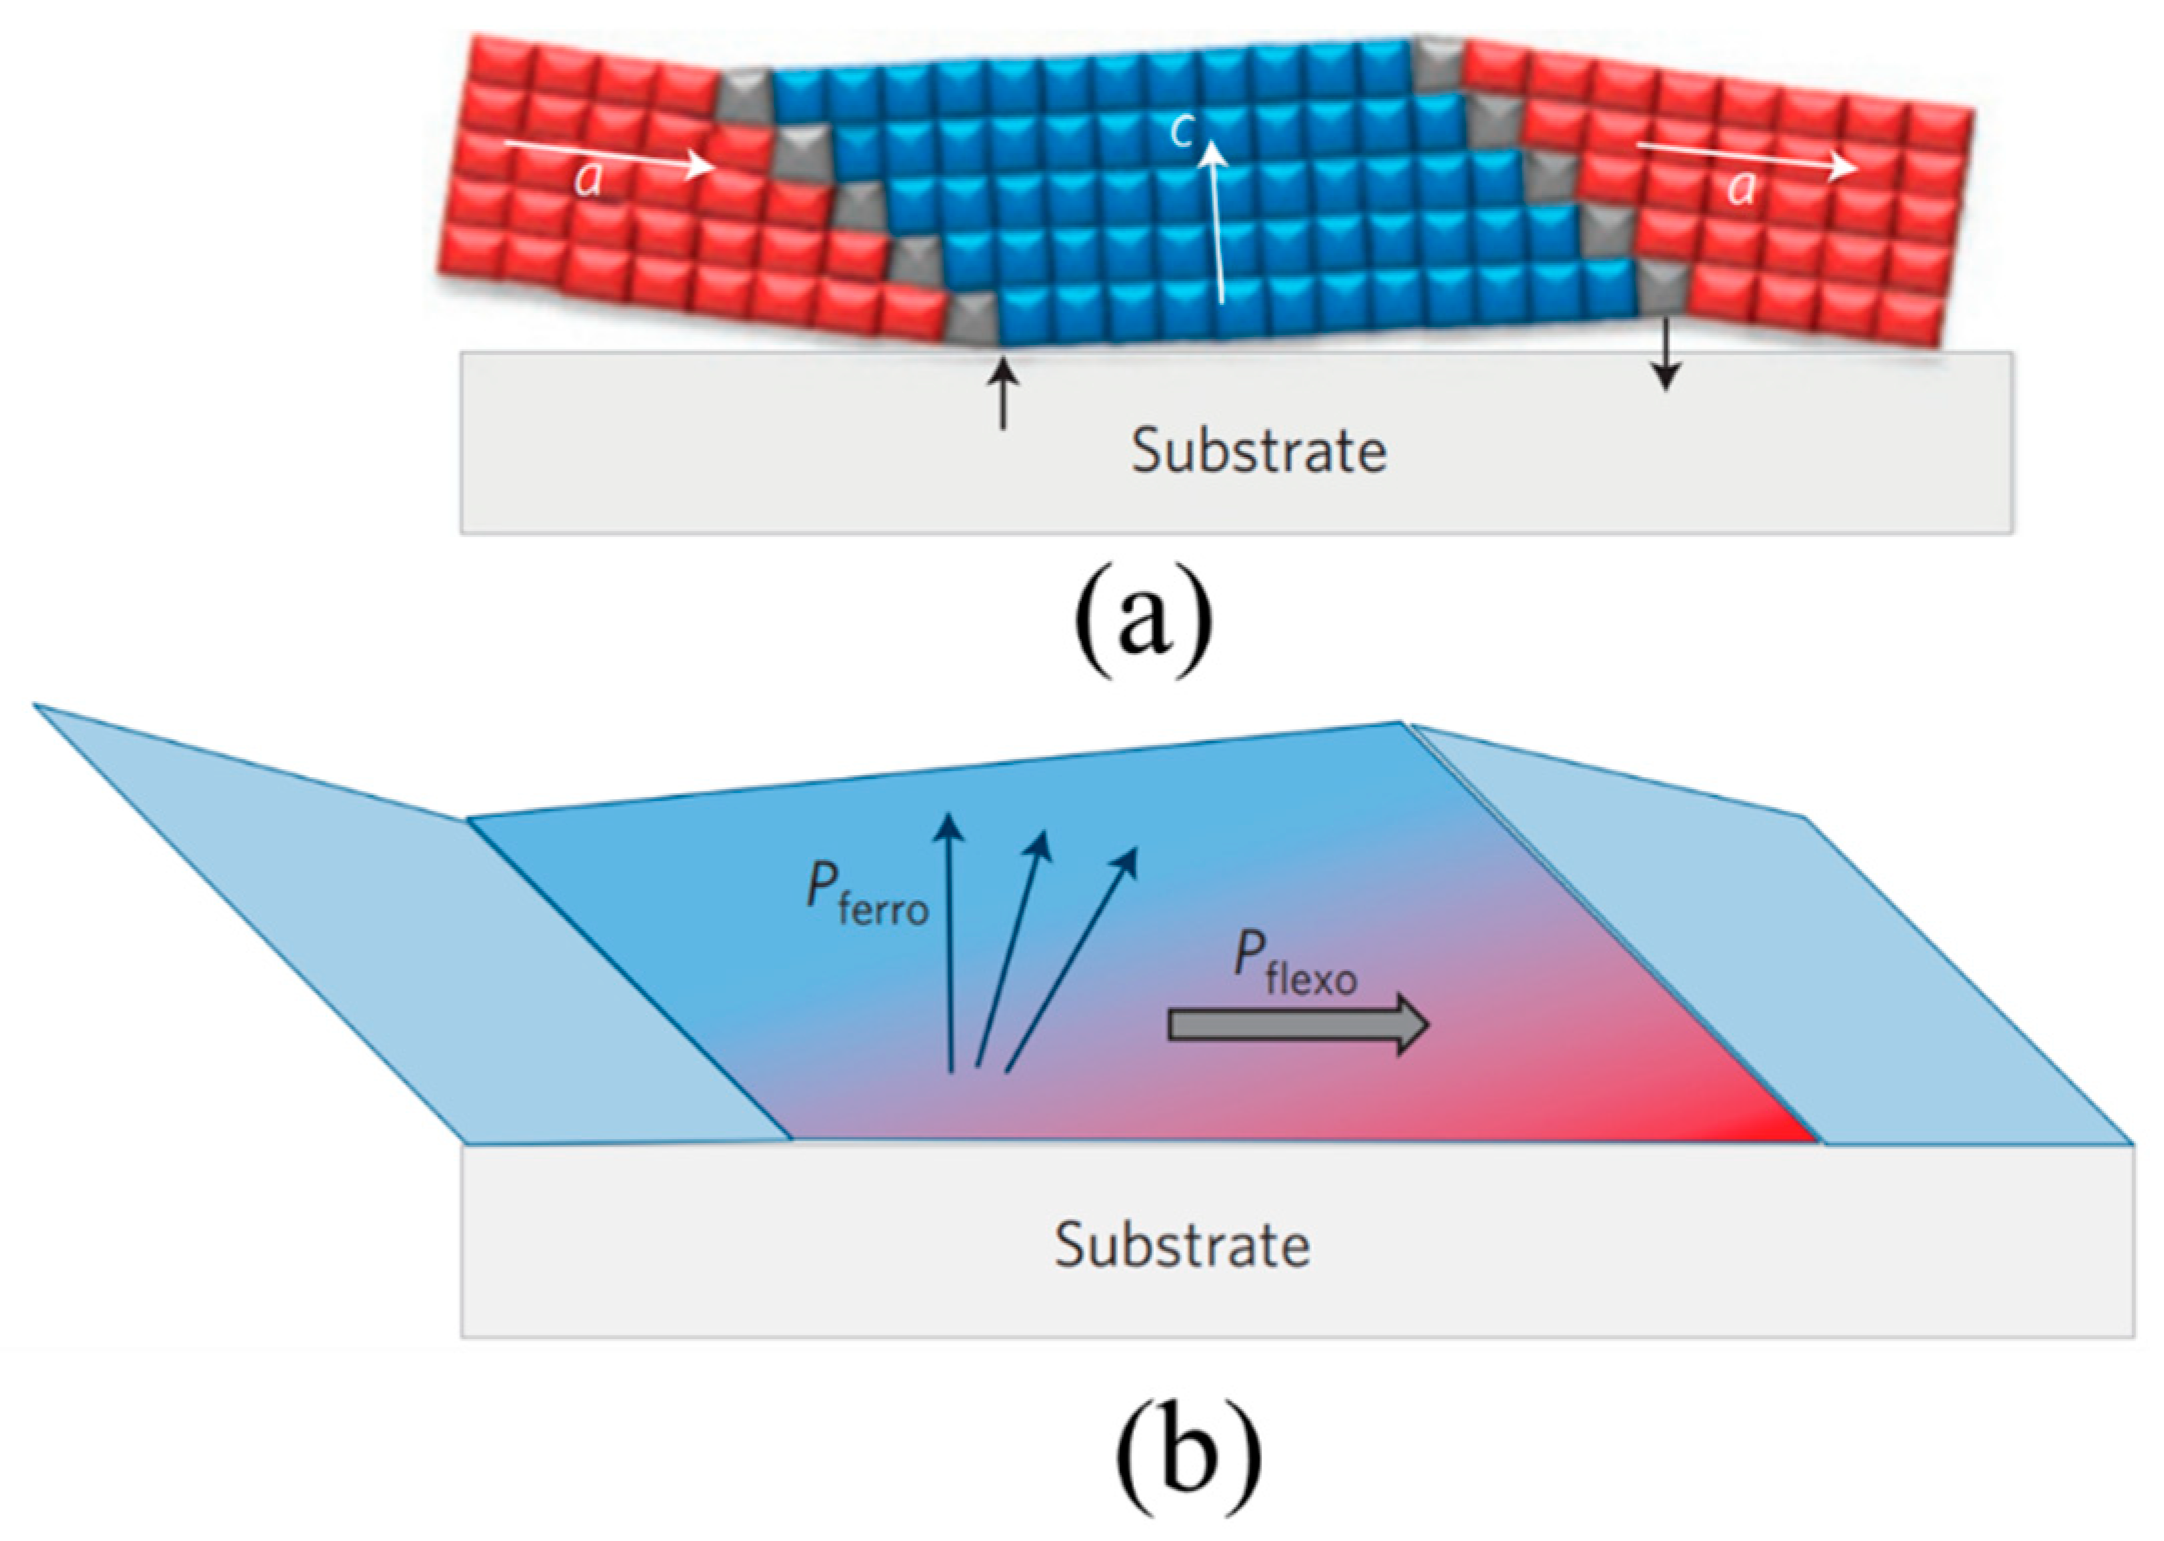
4.1. Theoretical Investigation of Spontaneously Polarized Surfaces

In ferroelectric ceramics, it has been demonstrated that spontaneously polarized surfaces with thicknesses of approximately several μm can be generated in ferroelectric materials, which is different from theoretical piezoelectric surfaces with thicknesses of several atoms [4,6,45,59]. The conditions for generating spontaneously polarized surfaces are that the ferroelectric ceramics should be slowly cooled from a temperature above TC or Tm. During the heat-treatment process, a phase transition between the ferroelectric and paraelectric phases occurs, causing residual stress. Ceramics cooled at a high temperature are often accompanied by the release of stress. The extent of the stress release depends on the temperature. Since the grains on the surfaces are biaxially confined by the surrounding grains, the stress near the surfaces is mainly released along the thickness direction. Cooled from a temperature just above TC or Tm, the stress in each surface with a thickness of ~10 μm releases inhomogeneously, causing a strain gradient and polarizing the surfaces. Under bending, one surface is tensile and another surface is compressive, generating a piezoelectric response that contributes to the measured flexoelectric-like response of ferroelectric ceramics (Figure 10a).
To verify the extent of the surface effect contributing to the measured flexoelectric response, a fired-on metal electrode was used on the surfaces of ferroelectric ceramics. At a high firing temperature, the polarized surfaces can be destroyed [42]. At a high temperature that is lower than the firing temperature, the diffusion of substances in the electrode paste into the surface regions, stress relief, and the generation of impurity phases caused by volatile element evaporation occur, leading to a huge decay of the flexoelectric-like response (Figure 10b,c) [42]. After suppressing the polarized surfaces, the flexocoupling coefficient can approach the intrinsic coefficient for Ba0.75Sr0.25TiO3 (BST25) ceramics and 0.92Na0.5Bi0.5TiO3-0.08BaTiO3 (NBBT8) ceramics, which confirms that the piezoelectric response from the polarized surfaces is the dominant mechanism that causes the large deviation of the measured flexoelectric-like response from the intrinsic response in ferroelectric ceramics. However, for (Ba, Sr)TiO3 ceramics with a Sr content of less than 25 mol%, the polarized surfaces are challenging to remove using the fired-on electrode method. In addition, the flexocoupling coefficients of BST25 ceramics become much larger than the intrinsic coefficients at a temperature well above TC, which may be ascribed to the polarized surfaces not being entirely removed by the fired-on electrode method or other extrinsic contributions to the flexoelectric-like response at a high temperature. Therefore, a new way to eliminate the polarized surfaces should be explored to quantify the contribution degree of the polarized surfaces to the measured flexoelectric response of ferroelectric ceramics.
The polarized surfaces also allow ferroelectric ceramics with sub-millimeter thicknesses to exhibit a non-negligible scaling effect, which reduces the weak-field dielectric properties, increases the coercive fields, and decreases the piezoelectric response [76].

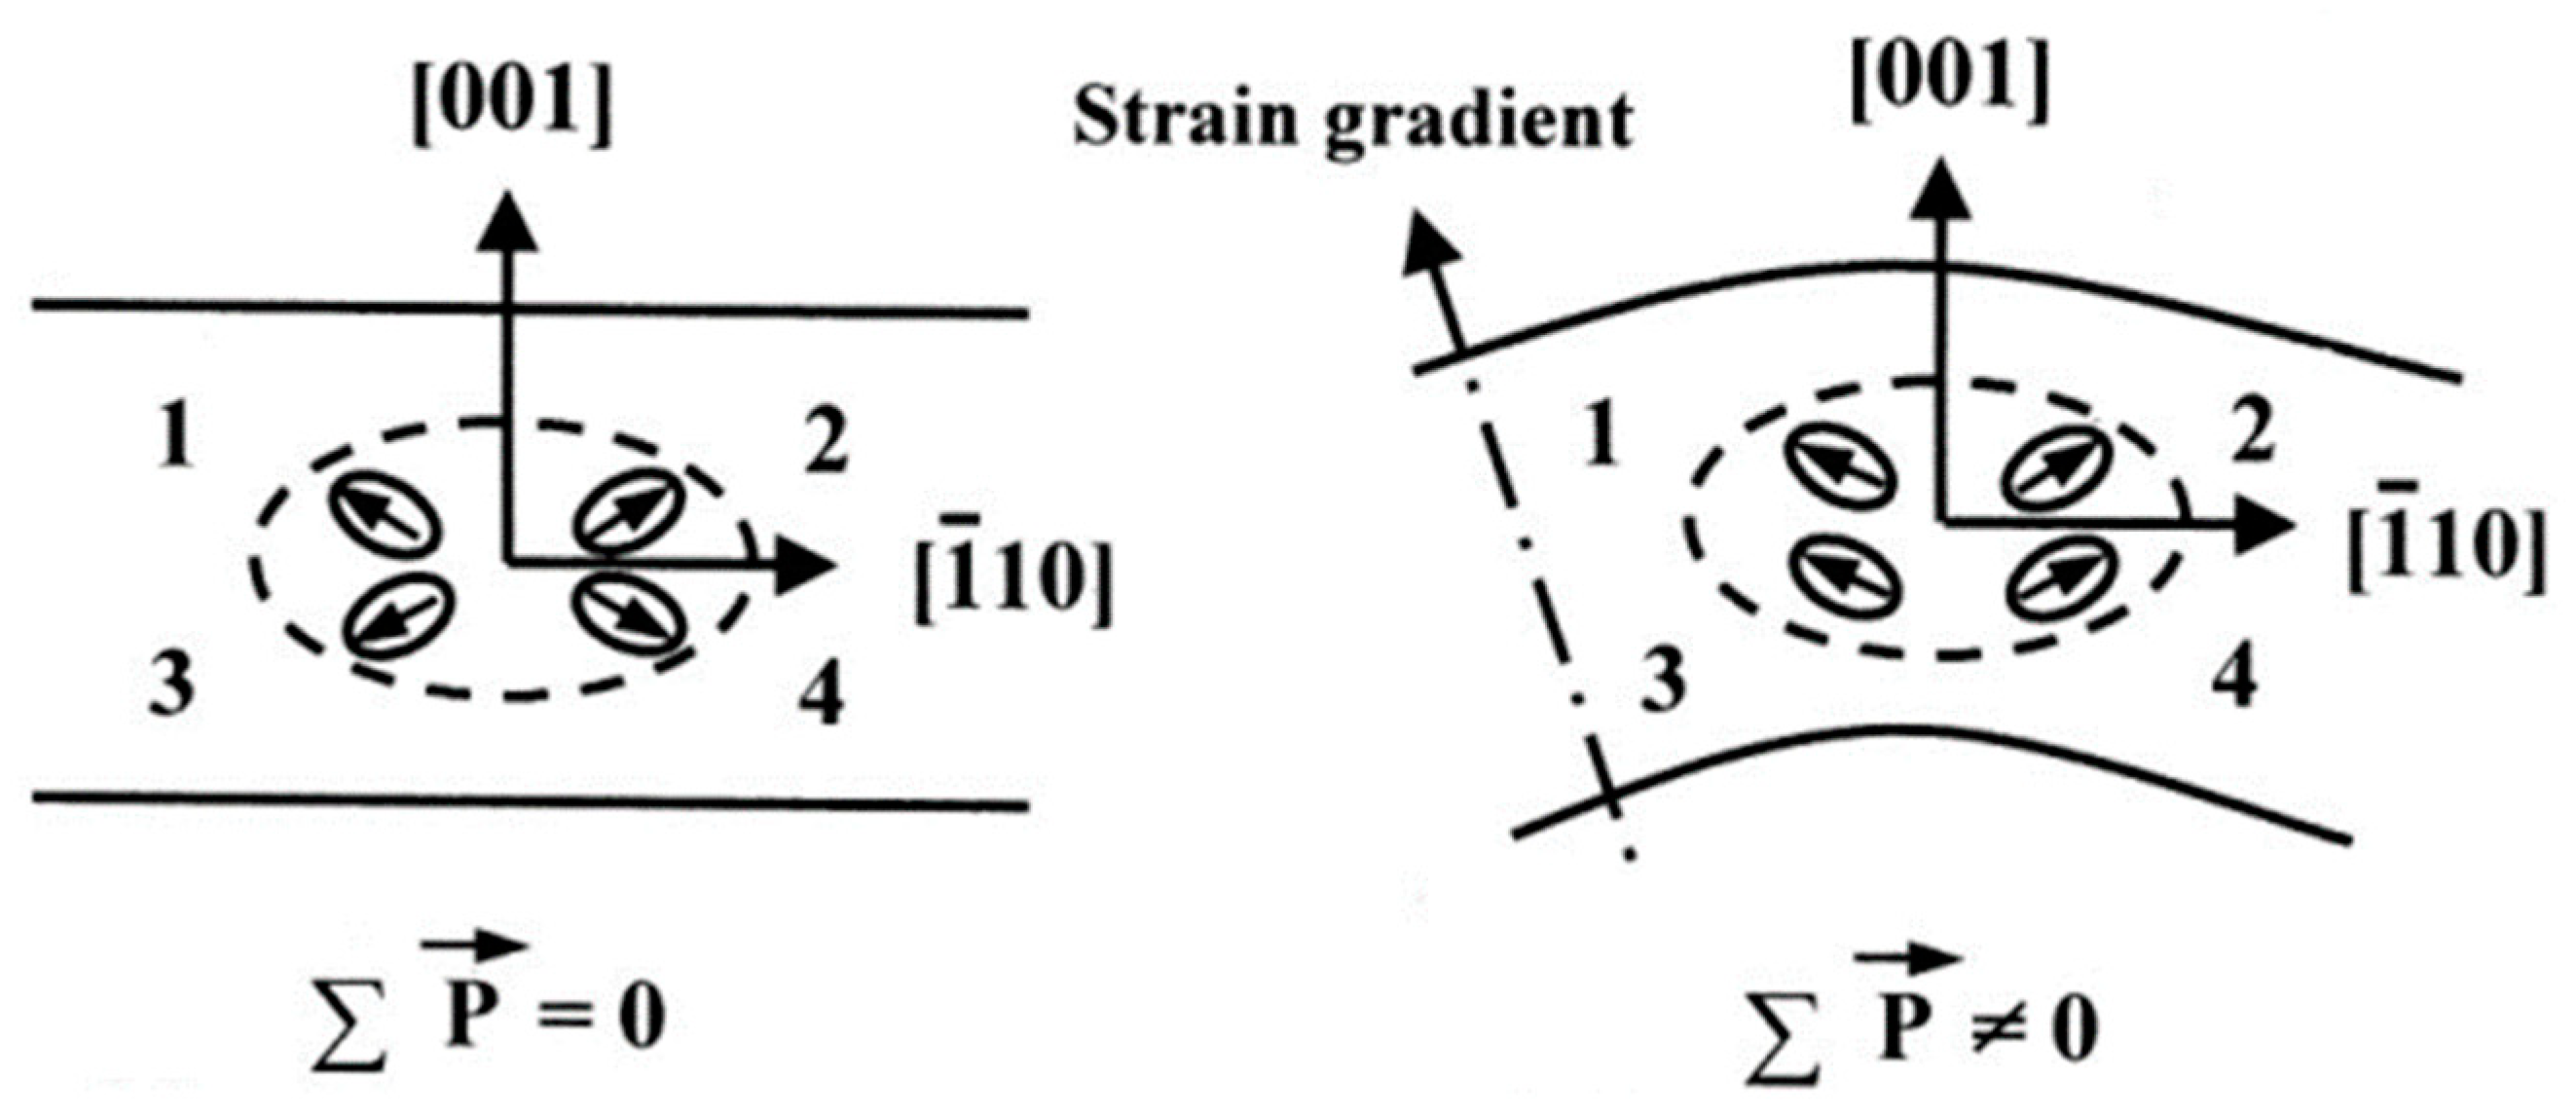
4.2. Theoretical Investigation of Nanopolar Region Orientation Regulated by Strain Gradient

For relaxor ferroelectrics, it was thought that preexisting nanodomains or nanopolar regions have a significant effect on the measured flexoelectric response [8,51]. When external stress is applied to relaxor ferroelectrics, it easily induces a preferred orientation of the nanodomains or the nanopolar regions. In PMN relaxor ferroelectric ceramics, the nanodomains or nanopolar regions should possess eight equivalent <111> polarization orientations, which lack a preferred orientation. After bending deformation, the generated strain gradient breaks the balance of the polarization orientations, resulting in a preferable polarization orientation, which contributes to the large flexoelectric response of relaxor ferroelectric ceramics (Figure 11). It should be noted that this theory is aimed only at relaxor ferroelectrics, and the nanodomain contribution to the flexoelectric response has yet to be quantified.

4.3. Theoretical Investigation of Inhomogeneity Inducing Symmetry Breaking

It was found that macroscopic symmetry breaking is inevitably generated in materials due to the inhomogeneity produced during preparation processes, resulting in built-in polarization [27]. During the densification of ceramics, the charged defects and polar nano-entities redistribute according to the initial position and direction of the samples and sintering temperature, determining the orientation of the built-in polarization (Figure 12). After applying the bending deformation, the measured flexoelectric response is enhanced by the piezoelectric response from the built-in polarization, which is thought to be the mechanism responsible for the large flexoelectric coefficients in ferroelectric materials. However, if the fabrication process is the main factor affecting the large flexoelectric response, the flexoelectric coefficients of identical ceramics prepared by different researchers should be different due to inconsistent processing conditions. However, the reported flexoelectric coefficients of identical ceramics measured using the same methods are quite similar [22,36,40,41,42,59,60]. Therefore, macroscopic symmetry breaking may not be the primary cause of the measured large flexoelectric coefficients in ferroelectric materials.

4.4. Theoretical Investigation of Barrier Layer

In addition to ferroelectrics, a significant flexoelectric coefficient can also be measured in semiconductors [77]. However, the above theories to explain the significant measured flexoelectric response were proposed for insulating ferroelectric ceramics. A barrier-layer theory was used to explain the large flexoelectric response in semiconductors [40,77,78]. In semiconductors, the depletion layers formed at the interfaces between the semiconductor and electrodes act as insulating barrier layers, providing an insulating environment for surface piezoelectricity [77]. Under bending, the surface piezoelectric response generates the flexoelectric-like response measured in semiconductors. Meanwhile, the middle semi-conducting region (bulk) separating the depletion layers acts as an intercalated electrode and provides free charges to respond to surface piezoelectricity, enhancing surface piezoelectricity (Figure 13) [77]. The enhanced surface piezoelectricity correspondingly contributes to the large flexoelectric-like response.

4.5. Other Theoretical Investigations

Besides the above theories, several other theories have also been proposed for the flexoelectric response of ferroelectric materials. Above the nominal TC, it was found that the flexoelectric coefficients of ferroelectric materials still deviate from the intrinsic values for BST ceramics and ferroelectricity still exists. Therefore, ferroelectricity was thought to be one of the origins of the flexoelectric response [79]. Interface effects, such as the interfaces between films and substrates, domain walls, or grain boundaries, generate an inhomogeneous strain and flexoelectric effect [22,80,81]. The piezoelectricity of grain boundaries is also a non-negligible factor [44]. In materials, compositional heterogeneity, which can induce structural heterogeneity, is a method used to enhance the flexoelectric response [55,61,82]. In addition, defects also influence the flexoelectric response [64,83]. For polymers, polymer chain motion, relaxation processes, and crystallinity affect the flexoelectric response [67,69].

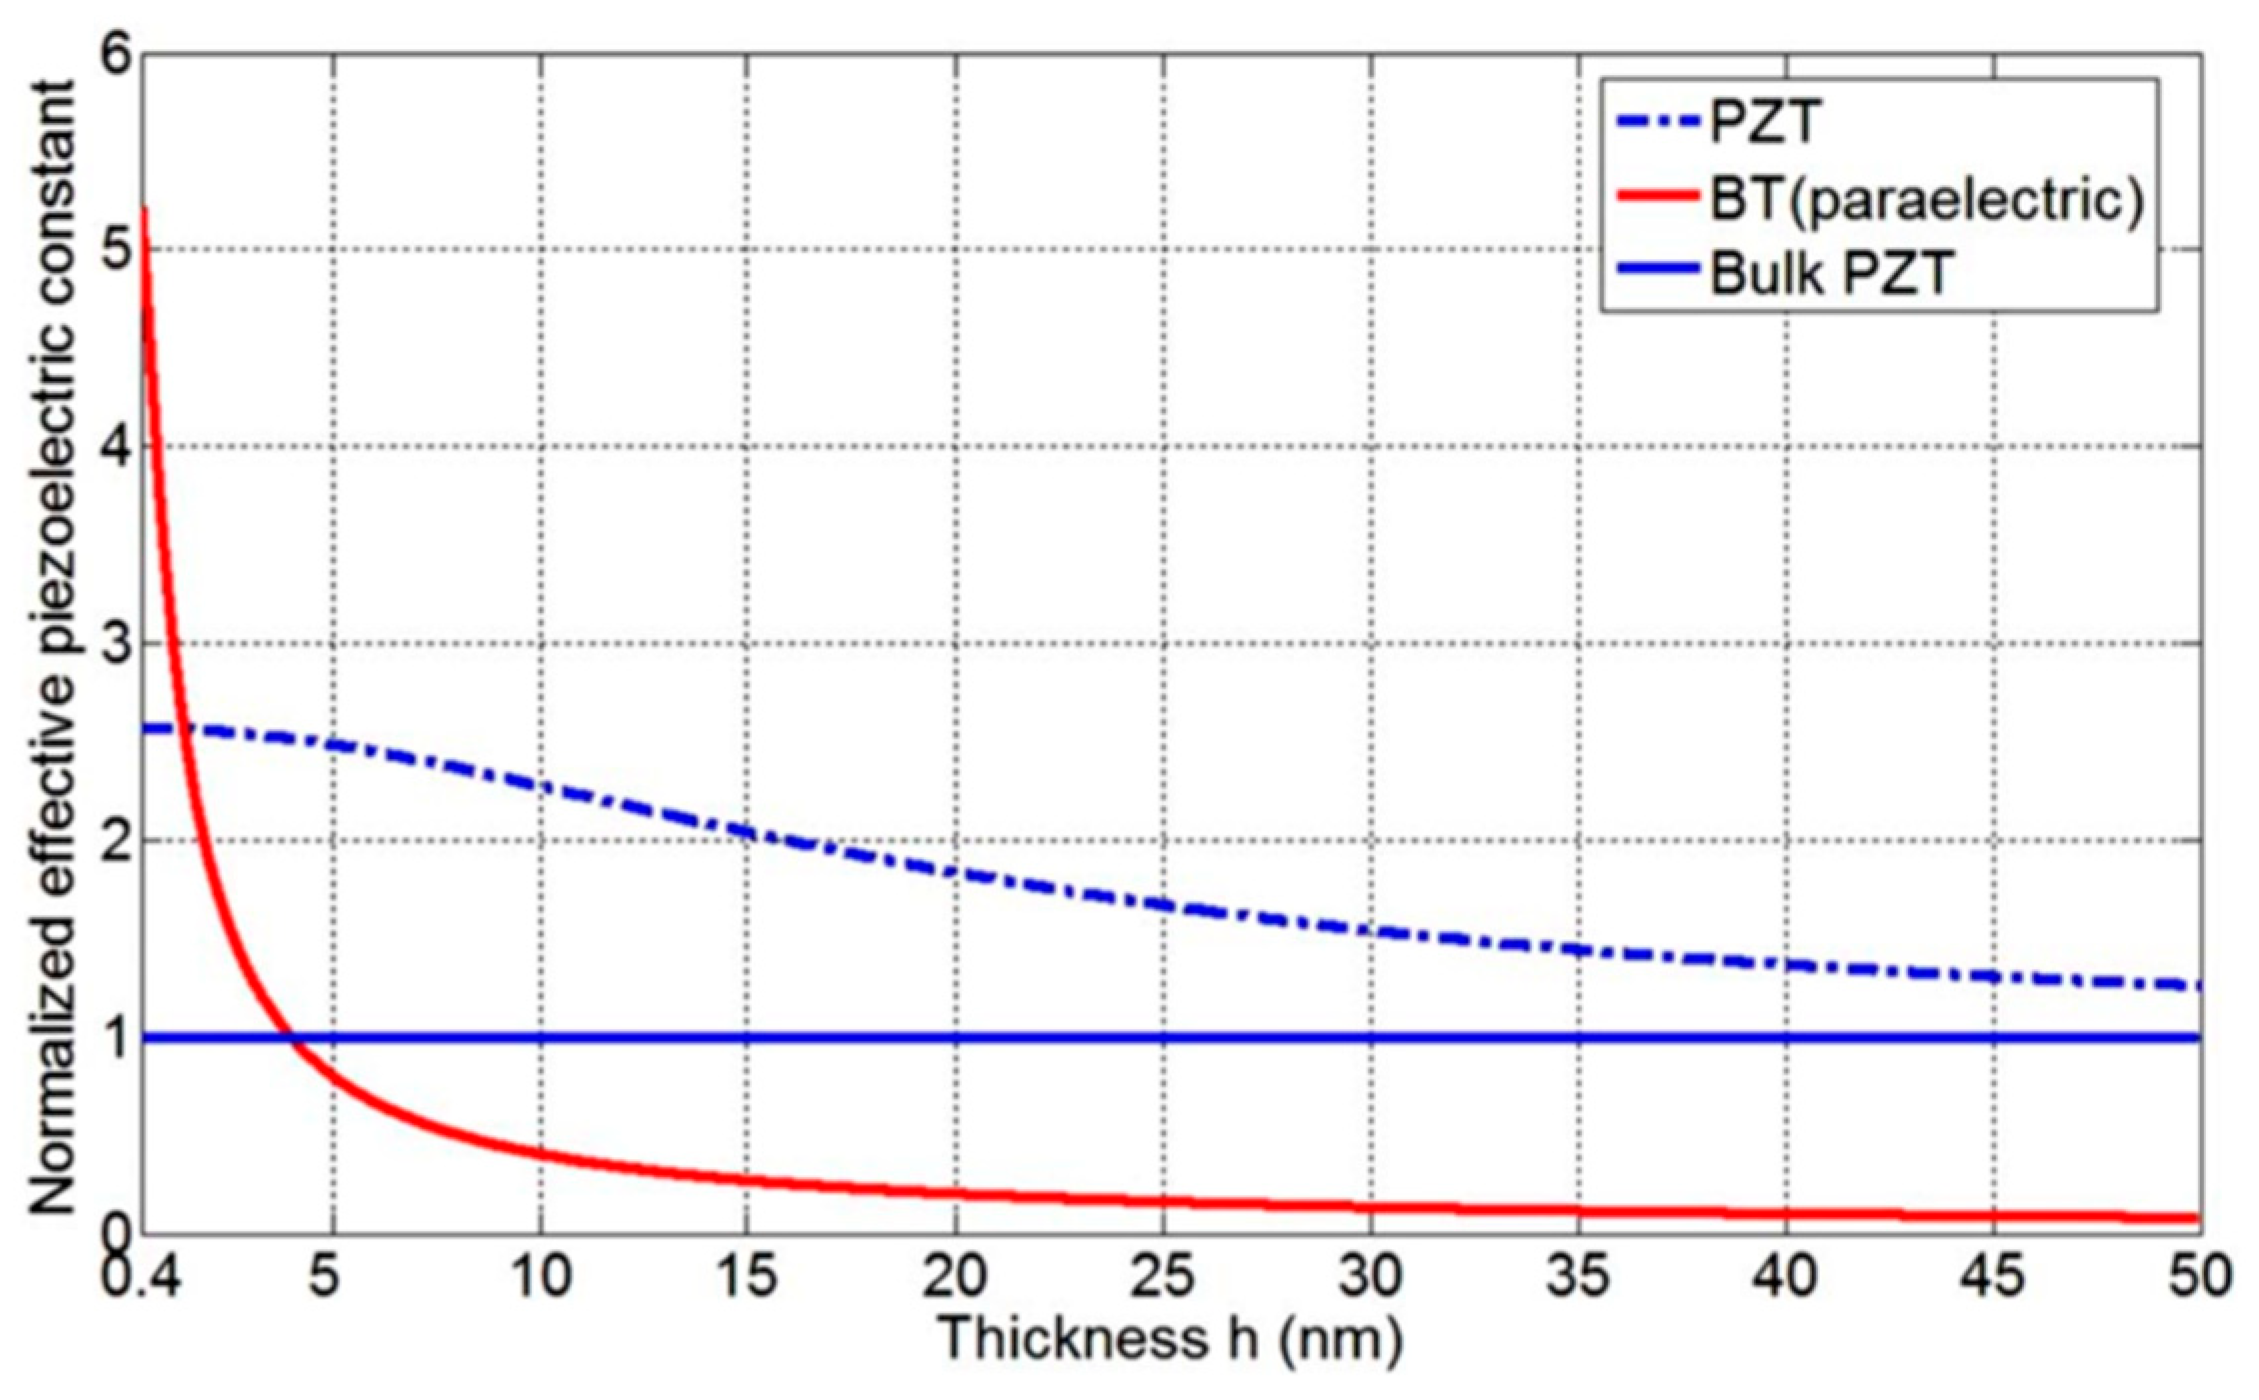
5. Flexoelectric Scaling Effect in Nanoscale Materials

Equation (1) shows that the strain gradient also determines the flexoelectric response. The strain gradient depends on the applied forces, elastic modulus, and material dimensions. A large force is required for bulk materials to obtain a high strain gradient but the generated strain will surpass the upper strain limit above which the bulk materials will fracture [84]. For film materials, a large strain gradient is easy to produce using a low force due to their small dimensions, namely the flexoelectric scaling effect [38]. Especially for nanoscale materials, a small force can cause a huge strain gradient of 106~108 m−1, which is several orders of magnitude higher than that in bulk materials [7,9,13,82,85]. The strain gradient can be engineered by a lattice mismatch near the interface between the film and substrate, compositional gradient, sharp probes of atomic force microscopes, or bending nanoscale films and substrates (Figure 14) [6,82,85,86,87,88,89,90,91,92,93,94]. As shown in Figure 14a, the lattice mismatch between HoMnO3 and the Pt(111)/Al2O3(0001) substrate can generate a large strain gradient of ~106 m−1 [93]. The strain gradient can be modulated by oxygen partial pressures, which control the distribution of oxygen vacancies in the oxide film (Figure 14b) [82]. Figure 14c shows that a giant strain gradient (up to >107 m−1) can be produced through the sharp probe of an atomic force microscope compressing an ultrathin SrTiO3 film [85]. Using the bending method shown in Figure 14d, the maximum strain gradient is ~0.5 m−1 due to the brittle nature of the single crystal substrate under a higher force [94]. The huge strain gradient induces a large flexoelectric field Es, which is described by [13,82]:
E s = e 4 π ε 0 a S x
In nanoscale materials, Es can reach a magnitude of ~MV/m and trigger various physical phenomena, such as heightening piezoelectricity and polarization switching due to the flexoelectric effect [22,23,37,82,95,96,97,98,99]. In Figure 15, the piezoelectric response from the flexoelectric effect (measured using a cantilever) of the PZT and the BT films is enhanced as the thicknesses decrease [95]. The enhancement in the BT cantilever is much more pronounced than in the PZT cantilever in the ultrathin region (<10 nm) because of the high flexoelectric coefficient of BT (100× that of PZT). The piezoelectric response from the flexoelectric effect is different from the conventional piezoelectric response due to the differential production and origin, which is usually called the piezoelectric-like response. As shown in Figure 16, horizontal flexoelectricity forces the spontaneous polarization to rotate away from the normal to the horizonal plane in a ferroelectric film [97]. Apart from these common physical phenomena, many other surprising phenomena are attributable to the flexoelectric effect. It has been reported that Es can manipulate the deformation and distribution of defects, the carrier density and mobility of two-dimensional electron gas (2DEG), the barrier of semiconductors, magnetoelectric responses, nanoindentation, thermal–electrical responses, driving triboelectricity, resistance and quantum tunneling of nanoscale dielectrics, photovoltage, and photocurrent, which are described in detail in the next section [85,89,90,92,94,100,101,102,103,104,105,106,107,108,109,110].

6. Potential Applications of the Flexoelectric Effect

The flexoelectric effect has motivated several potential applications, such as flexoelectric piezoelectric composites, manipulation of ferroelectric polarization, energy conversion, sensors, and actuators, and several other progressive applications.

6.1. Flexoelectric Piezoelectric Composites

Conventional piezoelectricity only exists in non-centrosymmetric materials, which limits material selectivity. The flexoelectric effect artificially breaks material structural symmetry with geometrical asymmetry, which can generate a piezoelectric-like response. Cross et al. obtained a piezoelectric-like response of ~6 pC/N at room temperature by using Ba0.67Sr0.33TiO3 (BST) ceramics (in the paraelectric phase) to design a 3 × 3 array of millimeter-scale square truncated pyramids, as shown in Figure 17a [111]. The piezoelectric-like response from the flexoelectric response mainly depends on the strain gradient due to the low flexoelectric coefficient in paraelectric materials. Furthermore, a flexure mode flexoelectric piezoelectric composite was designed, where fine tungsten wires were used to separate the BST ceramic sheets and compression stresses were applied to the top and bottom metal plates, causing bending of the ceramics and a high strain gradient, as illustrated in Figure 17b. As a result, a piezoelectric-like response of ~4300 pC/N was produced near TC and maintained high values at higher temperatures (Figure 17c) [37]. To simplify the design, our research group designed a dome-like structure (Figure 17d) using the diffusion or asymmetrical reducing method [24,61]. The asymmetrical reducing method also causes a composition gradient [61]. Based on the asymmetrical reducing method, a piece of NBBT8 ceramic wafer can generate a high piezoelectric-like response of over 8000 pC/N measured using the point-ring method (Figure 8a) [60]. In addition, the bending Si crystal can also generate a piezoelectric-like response of ~80 pC/N for which the flexoelectric response is from the piezoelectric response of the surface oxide layers, and the high conductivity of the bulk and the bending deformation of the Si plates amplify the piezoelectric response [112]. It should be noted that the piezoelectric-like response from the flexoelectric response increases with decreasing the material thickness due to the flexoelectric scaling effect [23].

6.2. Sensors and Actuators

Because of the sensitivity of the flexoelectric effect to stress or electric fields, the flexoelectric effect can also be used in the application of sensors and actuators [15,16,113,114]. Unlike the piezoelectric effect, the flexoelectric effect can still exist when the temperature exceeds Td (the depolarization temperature). Thus, flexoelectric sensors and actuators can operate at higher temperatures [37]. Trapezoidal (Ba,Sr) TiO3 ceramics were designed to be used in an acceleration sensor with a sensitivity of ~0.84 pC/g or a microphone with a sensitivity of ~0.85 pC/Pa and a signal to noise ratio of 74 dB utilizing the flexoelectric effect [115,116]. The asymmetrically reduced NBBT ceramics can induce a large displacement of ~17 μm by the converse flexoelectric effect (Figure 18a), which can be used in actuator applications [117]. When the size of materials decreases, the sensitivity of the sensors and actuators also increases due to the scaling effect of flexoelectricity. For example, the performance of SrTiO3 film cantilever actuators can be comparable to that of Pb(Zr,Ti)O3-based piezoelectric bimorphs (Figure 18b) [19].

6.3. Mechanical Writing

For materials with nanoscale sizes, the large strain gradient can induce a flexoelectric field Es, which can exceed their coercive fields. As a result, Es can manipulate domain switching, namely the stress controls the domains [82,97,98]. Figure 19 shows that the polarization and switching behavior of PZT films vary with the polarization orientation of the flexoelectric effect [98]. Based on these phenomena, a device with the function of mechanical writing was designed (Figure 20a,b) [74]. The strain gradient can be controlled by the size of the individual nanodots on polyvinylidene fluoride-trifluoroethylene (P(VDF-TrFE)) to modulate Es for the application of force-induced high-density data storage [99]. As shown in Figure 20c, from the letter “F” to the letter “E”, the area of the individual nanodots becomes smaller, which is beneficial to the strain gradient, and the letters become clearer and have high signals [99].

6.4. Energy Harvester

Because the flexoelectric effect is the interconversion of mechanical and electrical energy, applications for converting mechanical energy to electrical energy have been developed [35,60,118]. Under bending, the reduced NBBT8 ceramics exhibit a large piezoelectric-like response, which can be used in mechanical energy-harvesting applications [60]. However, the energy-harvesting properties from the flexoelectric response are weaker than those of the conventional piezoelectric energy harvesters [60]. It is worth mentioning that the energy harvesting from the flexoelectric response can be maintained at a temperature higher than Td (the temperature of the piezoelectric response disappearing in piezoelectric ceramics), as shown in Figure 21. To enhance the energy-harvesting properties, flexoelectric nanogenerators were designed due to the flexoelectric scaling effect [113,119].
The flexoelectric field Es can also act as a driving electric field modulating carrier migration. At high temperatures, ferroelectric materials become more conductive and Es can generate a thermal current [106]. This indicates that the flexoelectric effect can facilitate thermal energy harvesting (Figure 22) [106]. Furthermore, because the flexoelectric effect can provide a driving electric field, it implies that an uneven thermal environment, which is the driving force of conventional thermoelectricity, is not necessary for flexoelectric thermal energy harvesting. However, the conductivity of ferroelectric materials is lower than that of conventional thermoelectric materials, which limits the output thermal current. To enhance the conductivity, reduced ferroelectric ceramics and doping were adopted [107,120]. In addition, asymmetrically reduced ferroelectric ceramics can also improve Es [107]. Consequently, a large power density of ~0.18 mW/cm3 can be collected in the reduced NBBT8 ceramics at a temperature of 350 °C [107]. Thus, flexoelectric thermal energy harvesting depends mainly on the flexoelectric response and materials’ conductivity. In addition, chemical inhomogeneities present in the asymmetrically reduced ferroelectric ceramics result in a built-in electric field [107].
The flexoelectric effect can also be involved in photoelectric conversion. Similar to the bulk photovoltaic effect of ferroelectric materials in which the absence of structural symmetry causes the asymmetric distribution of photoexcited non-equilibrium carriers in momentum space, the flexoelectric effect breaks the center symmetry of the structure to generate photoexcited non-equilibrium carriers in centrosymmetric materials, such as single crystals of SrTiO3, TiO2, and Si [104]. The bulk photovoltaic effect caused by the flexoelectric effect is called the flexo-photovoltaic effect (Figure 23). For low-dimensional materials, larger strain gradients render a stronger flexo-photovoltaic effect [105,121,122]. Recently, another photoelectric conversion phenomenon in which light can modulate the flexoelectric-like response of semiconductors was reported, which was defined as the photo-flexoelectric effect (Figure 24) [78]. Given the barrier-layer theory of the flexoelectric-like response of semiconductors, light tunes the Schottky barrier height to control the free carriers compensating for the surface piezoelectricity [78]. The photo-flexoelectric effect can be further enhanced when oxygen vacancies induce defect levels as light absorption centers, which convert photon energy to electron–hole pairs [123].

6.5. Other Applications

The flexoelectric effect can reconfigure the distribution of oxygen vacancies, as shown in Figure 25 [101]. The strain gradient of STO film was produced using the spherical tip of a Kelvin probe force microscope to compress the grey boxes, as shown in Figure 25a [101]. In the grey boxes in Figure 25a, the change in the normalized vacancy concentration (NVC) along lines M1, M2, M3, and M4 (Figure 25b) indicates that the flexoelectric effect affects the concentration of oxygen vacancies [101]. In semiconductors, the flexoelectric effect can be used to manipulate the barrier height, maximum rectified current density, reverse saturation current density, maximum rectified ratio, and open voltage of Schottky barrier diodes (Figure 26) [90]. Utilizing mechanical touching or rubbing to generate a strain gradient, the flexoelectric effect has a non-negligible effect on the peak-to-peak voltage of triboelectric devices (Figure 27) [124]. The flexoelectric effect plays the role of a built-in electric field and can be utilized to generate a rectifying diode effect [93,107]. As shown in Figure 28a, the relationship between the current density and electrical field exhibits a rectifying diode effect for asymmetrically reduced NBBT8 ceramics [107]. Furthermore, in ultrathin dielectrics, Noh et al. reported that the flexoelectric effect controls quantum tunneling or resistance through strain gradients by modifying the band structure of ultrathin dielectrics (Figure 28c) [85,89]. Dai et al. bent LaAlO3 to control the electrical transport properties of the interfacial 2DEG at the LaAlO3/SrTiO3 heterostructure (Figure 28b) [94]. In inhomogeneous ferromagnetic materials, the inhomogeneous magnetostrictive response generates bending deformation and a flexoelectric effect, inducing a magnetoelectric response (Figure 29) [62]. Through a strain gradient, a topologically flexomagnetic response can be enhanced in synthetic antiferromagnetic systems hosting skyrmions, and the systems exhibit a flexo-Hall effect [125].

7. Summary and Future Trends

This review summarizes the reported experimental results of flexoelectricity in ferroelectric materials. Different measurement methods have been designed for flexoelectric coefficients, but a technique to separate the non-zero components of the flexoelectric coefficients of ferroelectric materials is still missing. As seen from the reported flexoelectric coefficients, they are several orders of magnitude larger than the theoretical values for ferroelectric materials. Although the spontaneously polarized surface theory can largely explain this issue, other theories may also contribute to the measured flexoelectric coefficients. Therefore, further research is necessary to fully understand the origin of the large flexoelectric response observed in ferroelectric ceramics.
For the applications of flexoelectric response, the criteria for achieving better performance are a large flexoelectric coefficient and strain gradient. Thus, enhancing the flexoelectric coefficient and strain gradient is necessary. A common approach to increasing strain gradients is to reduce the size of materials, for example, by fabricating nanoscale films. However, obtaining a large strain gradient in bulk materials is still difficult. Reducing the size of materials to nanoscale is in line with the development of small electronic devices. Because of the universality of flexoelectric response, strain gradients have been demonstrated to affect many physical properties through the generation of a flexoelectric field, which is an interdisciplinary research direction.

Author Contributions

D.T. conceptualized the framework for this paper, collected the data, and wrote the sections on the innovation of components. D.-Y.J. oversaw and edited this paper. Z.F. contributed to the aforementioned sections. B.C. conceptualized the framework for this paper and contributed to the aforementioned sections. All authors have read and agreed to the published version of the manuscript.

Funding

This research was funded by the Research Project of the Hubei Provincial Department of Education (Grant No. Q20222503). D. Tian acknowledges the support of Hubei Normal University. D.Y. Jeong acknowledges the support of Inha University.

Data Availability Statement

Not applicable.

Conflicts of Interest

The authors declare no conflict of interest.

References

  1. Cross, L.E. Flexoelectric effects: Charge separation in insulating solids subjected to elastic strain gradients. J. Mater. Sci. 2006, 41, 53–63. [Google Scholar] [CrossRef]
  2. Quang, H.L.; He, Q.C. The number and types of all possible rotational symmetries for flexoelectric tensors. Proc. R. Soc. A Math. Phys. Eng. Sci. 2011, 467, 2369–2386. [Google Scholar] [CrossRef]
  3. Shu, L.; Wei, X.; Pang, T.; Yao, X.; Wang, C. Symmetry of flexoelectric coefficients in crystalline medium. J. Appl. Phys. 2011, 110, 104106. [Google Scholar] [CrossRef]
  4. Yudin, P.V.; Tagantsev, A.K. Fundamentals of flexoelectricity in solids. Nanotechnology 2013, 24, 432001. [Google Scholar] [CrossRef] [PubMed]
  5. Tagantsev, A.K. Electric polarization in crystals and its response to thermal and elastic perturbations. Phase Trans. 1991, 35, 119–203. [Google Scholar] [CrossRef]
  6. Zubko, P.; Catalan, G.; Tagantsev, A.K. Flexoelectric Effect in Solids. Annu. Rev. Mater. Res. 2013, 43, 387–421. [Google Scholar] [CrossRef] [Green Version]
  7. Ma, W.; Cross, L.E. Observation of the flexoelectric effect in relaxor Pb(Mg1/3Nb2/3)O3 ceramics. Appl. Phys. Lett. 2001, 78, 2920–2921. [Google Scholar] [CrossRef]
  8. Ma, W.; Cross, L.E. Large flexoelectric polarization in ceramic lead magnesium niobate. Appl. Phys. Lett. 2001, 79, 4420–4422. [Google Scholar] [CrossRef]
  9. Ma, W.; Cross, L.E. Flexoelectric polarization of barium strontium titanate in the paraelectric state. Appl. Phys. Lett. 2002, 81, 3440–3442. [Google Scholar] [CrossRef]
  10. Ma, W.; Cross, L.E. Strain-gradient-induced electric polarization in lead zirconate titanate ceramics. Appl. Phys. Lett. 2003, 82, 3293–3295. [Google Scholar] [CrossRef] [Green Version]
  11. Zhou, W.; Chen, P.; Chu, B. Flexoelectricity in ferroelectric materials. IET Nanodielectr. 2019, 2, 83–91. [Google Scholar] [CrossRef]
  12. Wang, B.; Gu, Y.; Zhang, S.; Chen, L.-Q. Flexoelectricity in solids: Progress, challenges, and perspectives. Prog. Mater. Sci. 2019, 106, 100570. [Google Scholar] [CrossRef]
  13. Nguyen, T.D.; Mao, S.; Yeh, Y.W.; Purohit, P.K.; McAlpine, M.C. Nanoscale flexoelectricity. Adv. Mater. 2013, 25, 946–974. [Google Scholar] [CrossRef]
  14. Deng, Q.; Kammoun, M.; Erturk, A.; Sharma, P. Nanoscale flexoelectric energy harvesting. Int. J. Solids Struct. 2014, 51, 3218–3225. [Google Scholar] [CrossRef] [Green Version]
  15. Shu, L.; Liang, R.; Rao, Z.; Fei, L.; Ke, S.; Wang, Y. Flexoelectric materials and their related applications: A focused review. J. Adv. Ceram. 2019, 8, 153–173. [Google Scholar] [CrossRef] [Green Version]
  16. Tripathy, A.; Saravanakumar, B.; Mohanty, S.; Nayak, S.K.; Ramadoss, A. Comprehensive Review on Flexoelectric Energy Harvesting Technology: Mechanisms, Device Configurations, and Potential Applications. ACS Appl. Electron. Mater. 2021, 3, 2898–2924. [Google Scholar] [CrossRef]
  17. Kwon, S.R.; Huang, W.B.; Zhang, S.J.; Yuan, F.G.; Jiang, X.N. Flexoelectric sensing using a multilayered barium strontium titanate structure. Smart Mater. Struct. 2013, 22, 115017. [Google Scholar] [CrossRef] [Green Version]
  18. Yan, X.; Huang, W.; Ryung Kwon, S.; Yang, S.; Jiang, X.; Yuan, F.-G. A sensor for the direct measurement of curvature based on flexoelectricity. Smart Mater. Struct. 2013, 22, 085016. [Google Scholar] [CrossRef]
  19. Bhaskar, U.K.; Banerjee, N.; Abdollahi, A.; Wang, Z.; Schlom, D.G.; Rijnders, G.; Catalan, G. A flexoelectric microelectromechanical system on silicon. Nat. Nanotechnol. 2016, 11, 263–266. [Google Scholar] [CrossRef]
  20. Wang, K.F.; Wang, B.L. Non-linear flexoelectricity in energy harvesting. Int. J. Eng. Sci. 2017, 116, 88–103. [Google Scholar] [CrossRef]
  21. Chu, B.; Salem, D.R. Flexoelectricity in several thermoplastic and thermosetting polymers. Appl. Phys. Lett. 2012, 101, 103905. [Google Scholar] [CrossRef]
  22. Zubko, P.; Catalan, G.; Buckley, A.; Welche, P.R.; Scott, J.F. Strain-gradient-induced polarization in SrTiO3 single crystals. Phys. Rev. Lett. 2007, 99, 167601. [Google Scholar] [CrossRef] [PubMed] [Green Version]
  23. Chu, B.; Zhu, W.; Li, N.A.N.; Cross, L.E. Flexoelectric Composite—A New Prospect for Lead-Free Piezoelectrics. Funct. Mater. Lett. 2011, 03, 79–81. [Google Scholar] [CrossRef]
  24. Zhang, X.; Liu, J.; Chu, M.; Chu, B. Flexoelectric piezoelectric metamaterials based on the bending of ferroelectric ceramic wafers. Appl. Phys. Lett. 2016, 109, 072903. [Google Scholar] [CrossRef]
  25. Abdollahi, A.; Millán, D.; Peco, C.; Arroyo, M.; Arias, I. Revisiting pyramid compression to quantify flexoelectricity: A three-dimensional simulation study. Phys. Rev. B 2015, 91, 104103. [Google Scholar] [CrossRef] [Green Version]
  26. Lu, J.; Lv, J.; Liang, X.; Xu, M.; Shen, S. Improved approach to measure the direct flexoelectric coefficient of bulk polyvinylidene fluoride. J. Appl. Phys. 2016, 119, 094104. [Google Scholar] [CrossRef]
  27. Biancoli, A.; Fancher, C.M.; Jones, J.L.; Damjanovic, D. Breaking of macroscopic centric symmetry in paraelectric phases of ferroelectric materials and implications for flexoelectricity. Nat. Mater. 2015, 14, 224–229. [Google Scholar] [CrossRef]
  28. Baskaran, S.; Ramachandran, N.; He, X.; Thiruvannamalai, S.; Lee, H.J.; Heo, H.; Chen, Q.; Fu, J.Y. Giant flexoelectricity in polyvinylidene fluoride films. Phys. Lett. A 2011, 375, 2082–2084. [Google Scholar] [CrossRef]
  29. Baskaran, S.; He, X.; Chen, Q.; Fu, J.Y. Experimental studies on the direct flexoelectric effect in α-phase polyvinylidene fluoride films. Appl. Phys. Lett. 2011, 98, 242901. [Google Scholar] [CrossRef]
  30. Hu, T.; Deng, Q.; Liang, X.; Shen, S. Measuring the flexoelectric coefficient of bulk barium titanate from a shock wave experiment. J. Appl. Phys. 2017, 122, 055106. [Google Scholar] [CrossRef]
  31. Zhang, S.; Xu, M.; Liang, X.; Shen, S. Shear flexoelectric coefficient μ1211 in polyvinylidene fluoride. J. Appl. Phys. 2015, 117, 204102. [Google Scholar] [CrossRef]
  32. Zhang, S.; Liang, X.; Xu, M.; Feng, B.; Shen, S. Shear flexoelectric response along 3121 direction in polyvinylidene fluoride. Appl. Phys. Lett. 2015, 107, 142902. [Google Scholar] [CrossRef]
  33. Fu, J.Y.; Zhu, W.; Li, N.; Cross, L.E. Experimental studies of the converse flexoelectric effect induced by inhomogeneous electric field in a barium strontium titanate composition. J. Appl. Phys. 2006, 100, 024112. [Google Scholar] [CrossRef]
  34. Shu, L.; Huang, W.; Ryung Kwon, S.; Wang, Z.; Li, F.; Wei, X.; Zhang, S.; Lanagan, M.; Yao, X.; Jiang, X. Converse flexoelectric coefficient f1212 in bulk Ba0.67Sr0.33TiO3. Appl. Phys. Lett. 2014, 104, 232902. [Google Scholar] [CrossRef] [Green Version]
  35. Xia, Y.; Ji, Y.; Liu, Y.; Wu, L.; Yang, Y. Controllable Piezo-flexoelectric Effect in Ferroelectric Ba0.7Sr0.3TiO3 Materials for Harvesting Vibration Energy. ACS Appl. Mater. Interfaces 2022, 14, 36763–36770. [Google Scholar] [CrossRef]
  36. Hou, Y.; Tian, D.; Chu, B. Flexoelectric response of (1-x)BaTiO3-xSrTiO3 ceramics. Ceram. Int. 2020, 46, 12928–12932. [Google Scholar] [CrossRef]
  37. Chu, B.; Zhu, W.; Li, N.; Cross, L.E. Flexure mode flexoelectric piezoelectric composites. J. Appl. Phys. 2009, 106, 104109. [Google Scholar] [CrossRef]
  38. Huang, W.; Kim, K.; Zhang, S.; Yuan, F.-G.; Jiang, X. Scaling effect of flexoelectric (Ba,Sr)TiO3 microcantilevers. Phys. Status Solidi RRL 2011, 5, 350–352. [Google Scholar] [CrossRef]
  39. Li, Y.; Shu, L.; Huang, W.; Jiang, X.; Wang, H. Giant flexoelectricity in Ba0.6Sr0.4TiO3/Ni0.8Zn0.2Fe2O4 composite. Appl. Phys. Lett. 2014, 105, 162906. [Google Scholar] [CrossRef]
  40. Dai, Z.; Guo, S.; Gong, Y.; Wang, Z. Semiconductor flexoelectricity in graphite-doped SrTiO3 ceramics. Ceram. Int. 2021, 47, 6535–6539. [Google Scholar] [CrossRef]
  41. Mizzi, C.A.; Guo, B.; Marks, L.D. Experimental determination of flexoelectric coefficients in SrTiO3, KTaO3, TiO2, and YAlO3 single crystals. Phys. Rev. Mater. 2022, 6, 055005. [Google Scholar] [CrossRef]
  42. Tian, D.; Hou, Y.; Zhou, W.; Chu, B. Flexoelectric response of ferroelectric ceramics with reduced surface layer effect. J. Appl. Phys. 2021, 129, 194103. [Google Scholar] [CrossRef]
  43. Ma, W.; Cross, L.E. Flexoelectricity of barium titanate. Appl. Phys. Lett. 2006, 88, 232902. [Google Scholar] [CrossRef]
  44. Narvaez, J.; Saremi, S.; Hong, J.; Stengel, M.; Catalan, G. Large Flexoelectric Anisotropy in Paraelectric Barium Titanate. Phys. Rev. Lett. 2015, 115, 037601. [Google Scholar] [CrossRef] [Green Version]
  45. Zhang, X.; Pan, Q.; Tian, D.; Zhou, W.; Chen, P.; Zhang, H.; Chu, B. Large Flexoelectriclike Response from the Spontaneously Polarized Surfaces in Ferroelectric Ceramics. Phys. Rev. Lett. 2018, 121, 057602. [Google Scholar] [CrossRef] [PubMed]
  46. Huang, S.; Kim, T.; Hou, D.; Cann, D.; Jones, J.L.; Jiang, X. Flexoelectric characterization of BaTiO3-0.08Bi(Zn1/2Ti1/2)O3. Appl. Phys. Lett. 2017, 110, 222904. [Google Scholar] [CrossRef]
  47. Shu, L.; Wei, X.; Jin, L.; Li, Y.; Wang, H.; Yao, X. Enhanced direct flexoelectricity in paraelectric phase of Ba(Ti0.87Sn0.13)O3 ceramics. Appl. Phys. Lett. 2013, 102, 152904. [Google Scholar] [CrossRef] [Green Version]
  48. Shu, L.; Wan, M.; Wang, Z.; Wang, L.; Lei, S.; Wang, T.; Huang, W.; Zhou, N.; Wang, Y. Large flexoelectricity in Al2O3-doped Ba(Ti0.85Sn0.15)O3 ceramics. Appl. Phys. Lett. 2017, 110, 192903. [Google Scholar] [CrossRef]
  49. Hana, P. Study of Flexoelectric Phenomenon from Direct and from Inverse Flexoelectric Behavior of PMNT Ceramic. Ferroelectrics 2007, 351, 196–203. [Google Scholar] [CrossRef]
  50. Hana, P.; Marvan, M.; Burianova, L.; Zhang, S.J.; Furman, E.; Shrout, T.R. Study of the Inverse Flexoelectric Phenomena in Ceramic Lead Magnesium Niobate-Lead Titanate. Ferroelectrics 2011, 336, 137–144. [Google Scholar] [CrossRef]
  51. Narvaez, J.; Catalan, G. Origin of the enhanced flexoelectricity of relaxor ferroelectrics. Appl. Phys. Lett. 2014, 104, 162903. [Google Scholar] [CrossRef] [Green Version]
  52. Shu, L.; Wan, M.; Jiang, X.; Li, F.; Zhou, N.; Huang, W.; Wang, T. Frequency dispersion of flexoelectricity in PMN-PT single crystal. AIP Adv. 2017, 7, 015010. [Google Scholar] [CrossRef] [Green Version]
  53. Shu, L.; Li, T.; Wang, Z.; Li, F.; Fei, L.; Rao, Z.; Ye, M.; Ke, S.; Huang, W.; Wang, Y.; et al. Flexoelectric behavior in PIN-PMN-PT single crystals over a wide temperature range. Appl. Phys. Lett. 2017, 111, 162901. [Google Scholar] [CrossRef]
  54. Li, C.; Wang, Z.; Li, F.; Rao, Z.; Huang, W.; Shen, Z.; Ke, S.; Shu, L. Large flexoelectric response in PMN-PT ceramics through composition design. Appl. Phys. Lett. 2019, 115, 142901. [Google Scholar] [CrossRef]
  55. Yu, Z.; Wang, Z.; Shu, S.; Tian, T.; Huang, W.; Li, C.; Ke, S.; Shu, L. Local structural heterogeneity induced large flexoelectricity in Sm-doped PMN–PT ceramics. J. Appl. Phys. 2021, 129, 174103. [Google Scholar] [CrossRef]
  56. Ma, W.; Cross, L.E. Flexoelectric effect in ceramic lead zirconate titanate. Appl. Phys. Lett. 2005, 86, 072905. [Google Scholar] [CrossRef]
  57. Henmi, N.; Tohyama, M. Measurement of Flexoelectric Effect in Lead Zirconate Titanate Ceramics. J. Adv. Mech. Design Syst. Manuf. 2011, 5, 1–6. [Google Scholar] [CrossRef] [Green Version]
  58. Vales-Castro, P.; Roleder, K.; Zhao, L.; Li, J.-F.; Kajewski, D.; Catalan, G. Flexoelectricity in antiferroelectrics. Appl. Phys. Lett. 2018, 113, 132903. [Google Scholar] [CrossRef] [Green Version]
  59. Zhou, W.; Hou, Y.; Chen, P.; Zhang, H.; Chu, B. The surface mechanism for the flexoelectric response in sodium bismuth titanate-based ferroelectric ceramics. J. Am. Ceram. Soc. 2019, 102, 5454–5464. [Google Scholar] [CrossRef]
  60. Zhang, H.; Chu, B. Energy harvesting by exploiting the enhanced flexoelectric-like response of reduced (Na0.5Bi0.5)0.92Ba0.08TiO3 ceramics. J. Eur. Ceram. Soc. 2018, 38, 2520–2525. [Google Scholar] [CrossRef]
  61. Zhou, W.; Chen, P.; Pan, Q.; Zhang, X.; Chu, B. Lead-Free Metamaterials with Enormous Apparent Piezoelectric Response. Adv. Mater. 2015, 27, 6349–6355. [Google Scholar] [CrossRef] [PubMed]
  62. Pan, Q.; Fang, C.; Luo, H.; Chu, B. Magnetoelectric response from the enhanced ferromagnetism and flexoelectric response in reduced BiFeO3–based ceramics. J. Eur. Ceram. Soc. 2019, 39, 1057–1064. [Google Scholar] [CrossRef]
  63. Li, Y.; Shu, L.; Zhou, Y.; Guo, J.; Xiang, F.; He, L.; Wang, H. Enhanced flexoelectric effect in a non-ferroelectric composite. Appl. Phys. Lett. 2013, 103, 142909. [Google Scholar] [CrossRef]
  64. Zhu, J.; Chen, T.; Shu, L.; Wang, Z.; Huang, W.; Fei, L.; Li, F.; Rao, Z.; Ke, S.; Li, B.; et al. Flexoelectric fatigue in (K,Na,Li)(Nb,Sb)O3 ceramics. Appl. Phys. Lett. 2018, 113, 182901. [Google Scholar] [CrossRef]
  65. Poddar, S.; Ducharme, S. Measurement of the flexoelectric response in ferroelectric and relaxor polymer thin films. Appl. Phys. Lett. 2013, 103, 202901. [Google Scholar] [CrossRef] [Green Version]
  66. Zhang, S.; Xu, M.; Ma, G.; Liang, X.; Shen, S. Experimental method research on transverse flexoelectric response of poly(vinylidene fluoride). Jpn. J. Appl. Phys. 2016, 55, 071601. [Google Scholar] [CrossRef]
  67. Zhou, Y.; Liu, J.; Hu, X.; Chu, B.; Chen, S.; Salem, D. Flexoelectric effect in PVDF-based polymers. IEEE Trans. Dielectr. Electr. Insul. 2017, 24, 727–731. [Google Scholar] [CrossRef]
  68. Hu, X.; Zhou, Y.; Liu, J.; Chu, B. Improved flexoelectricity in PVDF/barium strontium titanate (BST) nanocomposites. J. Appl. Phys. 2018, 123, 154101. [Google Scholar] [CrossRef]
  69. Liu, J.; Zhou, Y.; Hu, X.; Chu, B. Flexoelectric effect in PVDF-based copolymers and terpolymers. Appl. Phys. Lett. 2018, 112, 232901. [Google Scholar] [CrossRef]
  70. Wen, X.; Yang, G.; Ma, Q.; Tian, Y.; Liu, X.; Xue, D.; Deng, Q.; Shen, S. Flexoelectricity in compositionally graded Ba1-xSrxTiO3 ceramics. J. Appl. Phys. 2021, 130, 074102. [Google Scholar] [CrossRef]
  71. Tagantsev, A.K. Piezoelectricity and flexoelectricity in crystalline dielectrics. Phys. Rev. B 1987, 36, 6177. [Google Scholar] [CrossRef] [PubMed]
  72. Tagantsev, A.K.; Yurkov, A.S. Flexoelectric effect in finite samples. J. Appl. Phys. 2012, 112, 044103. [Google Scholar] [CrossRef] [Green Version]
  73. Stengel, M. Microscopic response to inhomogeneous deformations in curvilinear coordinates. Nat. Commun. 2013, 4, 2693. [Google Scholar] [CrossRef] [PubMed] [Green Version]
  74. Stengel, M. Surface control of flexoelectricity. Phys. Rev. B 2014, 90, 201112. [Google Scholar] [CrossRef] [Green Version]
  75. Hong, J.; Vanderbilt, D. First-principles theory of frozen-ion flexoelectricity. Phys. Rev. B 2011, 84, 180101. [Google Scholar] [CrossRef] [Green Version]
  76. Tian, D.; Chen, P.; Yang, X.; Chu, B. Thickness dependence of dielectric and piezoelectric properties from the surface layer effect of BaTiO3-based ceramics. Ceram. Int. 2021, 47, 17262–17267. [Google Scholar] [CrossRef]
  77. Narvaez, J.; Vasquez-Sancho, F.; Catalan, G. Enhanced flexoelectric-like response in oxide semiconductors. Nature 2016, 538, 219–221. [Google Scholar] [CrossRef]
  78. Shu, L.; Ke, S.; Fei, L.; Huang, W.; Wang, Z.; Gong, J.; Jiang, X.; Wang, L.; Li, F.; Lei, S.; et al. Photoflexoelectric effect in halide perovskites. Nat. Mater. 2020, 19, 605–609. [Google Scholar] [CrossRef]
  79. Garten, L.M.; Trolier-McKinstry, S. Enhanced flexoelectricity through residual ferroelectricity in barium strontium titanate. J. Appl. Phys. 2015, 117, 094102. [Google Scholar] [CrossRef] [Green Version]
  80. Liu, X.; Tan, P.; Ma, X.; Wang, D.; Jin, X.; Liu, Y.; Xu, B.; Qiao, L.; Qiu, C.; Wang, B.; et al. Ferroelectric crystals with giant electro-optic property enabling ultracompact Q-switches. Science 2022, 376, 371–377. [Google Scholar] [CrossRef]
  81. Wu, M.; Zhang, X.; Li, X.; Qu, K.; Sun, Y.; Han, B.; Zhu, R.; Gao, X.; Zhang, J.; Liu, K.; et al. Engineering of atomic-scale flexoelectricity at grain boundaries. Nat. Commun. 2022, 13, 216. [Google Scholar] [CrossRef] [PubMed]
  82. Lee, D.; Yoon, A.; Jang, S.Y.; Yoon, J.G.; Chung, J.S.; Kim, M.; Scott, J.F.; Noh, T.W. Giant flexoelectric effect in ferroelectric epitaxial thin films. Phys. Rev. Lett. 2011, 107, 057602. [Google Scholar] [CrossRef]
  83. Wang, Z.; Li, C.; Zhang, Z.; Hu, Y.; Huang, W.; Ke, S.; Zheng, R.-K.; Li, F.; Shu, L. Interplay of defect dipole and flexoelectricity in linear dielectrics. Scr. Mater. 2022, 210, 114427. [Google Scholar] [CrossRef]
  84. Li, Q.; Liu, Y.; Liu, J.; Song, K.; Guo, H.; Li, F.; Xu, Z. Enhanced Piezoelectric Properties and Improved Property Uniformity in Nd-Doped PMN-PT Relaxor Ferroelectric Single Crystals. Adv. Funct. Mater. 2022, 32, 202201719. [Google Scholar] [CrossRef]
  85. Das, S.; Wang, B.; Paudel, T.R.; Park, S.M.; Tsymbal, E.Y.; Chen, L.Q.; Lee, D.; Noh, T.W. Enhanced flexoelectricity at reduced dimensions revealed by mechanically tunable quantum tunnelling. Nat. Commun. 2019, 10, 537. [Google Scholar] [CrossRef] [Green Version]
  86. Yamada, T.; Astafiev, K.F.; Sherman, V.O.; Tagantsev, A.K.; Muralt, P.; Setter, N. Strain relaxation of epitaxial SrTiO3 thin films on LaAlO3 by two-step growth technique. Appl. Phys. Lett. 2005, 86, 142904. [Google Scholar] [CrossRef]
  87. Catalan, G.; Noheda, B.; McAneney, J.; Sinnamon, L.J.; Gregg, J.M. Strain gradients in epitaxial ferroelectrics. Phys. Rev. B 2005, 72, 020102. [Google Scholar] [CrossRef] [Green Version]
  88. Karthik, J.; Mangalam, R.V.K.; Agar, J.C.; Martin, L.W. Large built-in electric fields due to flexoelectricity in compositionally graded ferroelectric thin films. Phys. Rev. B 2013, 87, 024111. [Google Scholar] [CrossRef] [Green Version]
  89. Park, S.M.; Wang, B.; Paudel, T.; Park, S.Y.; Das, S.; Kim, J.R.; Ko, E.K.; Lee, H.G.; Park, N.; Tao, L.; et al. Colossal flexoresistance in dielectrics. Nat. Commun. 2020, 11, 2586. [Google Scholar] [CrossRef]
  90. Sun, L.; Zhu, L.; Zhang, C.; Chen, W.; Wang, Z. Mechanical Manipulation of Silicon-based Schottky Diodes via Flexoelectricity. Nano Energy 2021, 83, 105855. [Google Scholar] [CrossRef]
  91. Guo, R.; You, L.; Lin, W.; Abdelsamie, A.; Shu, X.; Zhou, G.; Chen, S.; Liu, L.; Yan, X.; Wang, J.; et al. Continuously controllable photoconductance in freestanding BiFeO3 by the macroscopic flexoelectric effect. Nat. Commun. 2020, 11, 2571. [Google Scholar] [CrossRef] [PubMed]
  92. Park, S.M.; Wang, B.; Chen, L.-Q.; Noh, T.W.; Yang, S.M.; Lee, D. Flexoelectric control of physical properties by atomic force microscopy. Appl. Phys. Rev. 2021, 8, 041327. [Google Scholar] [CrossRef]
  93. Lee, D.; Yang, S.M.; Yoon, J.G.; Noh, T.W. Flexoelectric rectification of charge transport in strain-graded dielectrics. Nano Lett. 2012, 12, 6436–6440. [Google Scholar] [CrossRef] [PubMed]
  94. Zhang, F.; Lv, P.; Zhang, Y.; Huang, S.; Wong, C.M.; Yau, H.M.; Chen, X.; Wen, Z.; Jiang, X.; Zeng, C.; et al. Modulating the Electrical Transport in the Two-Dimensional Electron Gas at LaAlO3/SrTiO3 Heterostructures by Interfacial Flexoelectricity. Phys. Rev. Lett. 2019, 122, 257601. [Google Scholar] [CrossRef] [PubMed]
  95. Majdoub, M.S.; Sharma, P.; Cagin, T. Enhanced size-dependent piezoelectricity and elasticity in nanostructures due to the flexoelectric effect. Phys. Rev. B 2009, 79, 119904. [Google Scholar] [CrossRef]
  96. Liu, C.; Wu, H.; Wang, J. Giant piezoelectric response in piezoelectric/dielectric superlattices due to flexoelectric effect. Appl. Phys. Lett. 2016, 109, 192901. [Google Scholar] [CrossRef]
  97. Catalan, G.; Lubk, A.; Vlooswijk, A.H.; Snoeck, E.; Magen, C.; Janssens, A.; Rispens, G.; Rijnders, G.; Blank, D.H.; Noheda, B. Flexoelectric rotation of polarization in ferroelectric thin films. Nat. Mater. 2011, 10, 963–967. [Google Scholar] [CrossRef] [Green Version]
  98. Gruverman, A.; Rodriguez, B.J.; Kingon, A.I.; Nemanich, R.J.; Tagantsev, A.K.; Cross, J.S.; Tsukada, M. Mechanical stress effect on imprint behavior of integrated ferroelectric capacitors. Appl. Phys. Lett. 2003, 83, 728–730. [Google Scholar] [CrossRef] [Green Version]
  99. Liu, J.-H.; Chen, X.; Li, Y.; Guo, X.; Ge, H.-X.; Shen, Q.-D. Ferroelectric polymer nanostructure with enhanced flexoelectric response for force-induced memory. Appl. Phys. Lett. 2018, 113, 042903. [Google Scholar] [CrossRef]
  100. Lee, D.; Jeon, B.C.; Yoon, A.; Shin, Y.C.; Lee, M.H.; Song, T.K.; Bu, S.D.; Kim, M.; Chung, J.-S.; Yoon, J.G.; et al. Flexoelectric Control of Defect Formation in Ferroelectric Epitaxial Thin Films. Adv. Mater. 2014, 26, 5005–5011. [Google Scholar] [CrossRef]
  101. Das, S.; Wang, B.; Cao, Y.; Rae Cho, M.; Jae Shin, Y.; Mo Yang, S.; Wang, L.; Kim, M.; Kalinin, S.V.; Chen, L.Q.; et al. Controlled manipulation of oxygen vacancies using nanoscale flexoelectricity. Nat. Commun. 2017, 8, 615. [Google Scholar] [CrossRef] [PubMed] [Green Version]
  102. Jia, T.; Kimura, H.; Cheng, Z.; Zhao, H.; Kim, Y.-H.; Osada, M.; Matsumoto, T.; Shibata, N.; Ikuhara, Y. Mechanical force involved multiple fields switching of both local ferroelectric and magnetic domain in a Bi5Ti3FeO15 thin film. NPG Asia Mater. 2017, 9, e349. [Google Scholar] [CrossRef] [Green Version]
  103. Gharbi, M.; Sun, Z.H.; Sharma, P.; White, K.; El-Borgi, S. Flexoelectric properties of ferroelectrics and the nanoindentation size-effect. Int. J. Solids Struct. 2011, 48, 249–256. [Google Scholar] [CrossRef] [Green Version]
  104. Hu, T.; Deng, Q.; Shen, S. Probing flexoelectricity via a split Hopkinson pressure bar experiment. Appl. Phys. Lett. 2018, 112, 242902. [Google Scholar] [CrossRef]
  105. Wu, M.; Jiang, Z.; Lou, X.; Zhang, F.; Song, D.; Ning, S.; Guo, M.; Pennycook, S.J.; Dai, J.Y.; Wen, Z. Flexoelectric Thin-Film Photodetectors. Nano Lett. 2021, 21, 2946–2952. [Google Scholar] [CrossRef] [PubMed]
  106. Chen, P.; Zhang, H.; Chu, B. Strain gradient induced thermal-electrical response in paraelectric Na0.5Bi0.5TiO3-based ceramics. Phys. Rev. Mater. 2018, 2, 034401. [Google Scholar] [CrossRef]
  107. Chen, P.; Zhou, W.; Zhang, H.; Pan, Q.; Zhang, X.; Chu, B. Large Thermal–Electrical Response and Rectifying Conduction Behavior in Asymmetrically Reduced Ferroelectric Ceramics. ACS Appl. Electron. Mater. 2019, 1, 478–484. [Google Scholar] [CrossRef]
  108. Qi, M.; Yang, Z.; Chen, S.; Lin, S.; Jin, Q.; Hong, H.; Rong, D.; Guo, H.; Wang, C.; Wang, Z.; et al. Asymmetric ground states in La0.67Sr0.33MnO3/BaTiO3 heterostructures induced by flexoelectric bending. Appl. Phys. Lett. 2022, 120, 233103. [Google Scholar] [CrossRef]
  109. Mizzi, C.A.; Lin, A.Y.W.; Marks, L.D. Does Flexoelectricity Drive Triboelectricity? Phys. Rev. Lett. 2019, 123, 116103. [Google Scholar] [CrossRef] [Green Version]
  110. Persson, B.N.J. On the role of flexoelectricity in triboelectricity for randomly rough surfaces. EPL 2020, 129, 10006. [Google Scholar] [CrossRef] [Green Version]
  111. Zhu, W.; Fu, J.Y.; Li, N.; Cross, L. Piezoelectric composite based on the enhanced flexoelectric effects. Appl. Phys. Lett. 2006, 89, 192904. [Google Scholar] [CrossRef]
  112. Tian, D.; Hou, Y.; Pan, Q.; Chu, B. Large Piezoelectriclike Response from Inhomogeneously Deformed Silicon Crystals. Phys. Rev. Appl. 2020, 14, 034008. [Google Scholar] [CrossRef]
  113. Jiang, X.; Huang, W.; Zhang, S. Flexoelectric nano-generator: Materials, structures and devices. Nano Energy 2013, 2, 1079–1092. [Google Scholar] [CrossRef]
  114. Huang, W.; Yan, X.; Kwon, S.R.; Zhang, S.; Yuan, F.-G.; Jiang, X. Flexoelectric strain gradient detection using Ba0.64Sr0.36TiO3 for sensing. Appl. Phys. Lett. 2012, 101, 252903. [Google Scholar] [CrossRef]
  115. Huang, W.; Kwon, S.-R.; Zhang, S.; Yuan, F.-G.; Jiang, X. A trapezoidal flexoelectric accelerometer. J. Intell. Mater. Syst. Struct. 2013, 25, 271–277. [Google Scholar] [CrossRef]
  116. Kwon, S.R.; Huang, W.B.; Zhang, S.J.; Yuan, F.G.; Jiang, X.N. Study on a flexoelectric microphone using barium strontium titanate. J. Micromech. Microeng. 2016, 26, 045001. [Google Scholar] [CrossRef] [Green Version]
  117. Zhou, W.; Chu, B. Sodium bismuth titanate-based lead-free RAINBOW piezoelectric devices. J. Eur. Ceram. Soc. 2017, 37, 2373–2377. [Google Scholar] [CrossRef]
  118. Zhang, S.; Zhai, C.; Liu, K.; Song, S.; Ji, H.; Shao, S.; Xu, M. Quantitative evaluation of energy harvesting capabilities on flexoelectric and piezoelectric materials. J. Appl. Phys. 2022, 131, 064101. [Google Scholar] [CrossRef]
  119. Qi, Y.; Jafferis, N.T.; Lyons, K., Jr.; Lee, C.M.; Ahmad, H.; McAlpine, M.C. Piezoelectric ribbons printed onto rubber for flexible energy conversion. Nano Lett. 2010, 10, 524–528. [Google Scholar] [CrossRef] [Green Version]
  120. Xu, R.; Chen, P.; Chen, C.; Hou, Y.; Chu, B. Thermal-electrical like response in doped sodium bismuth titanate-based ferroelectric ceramics. Ceram. Int. 2022, 48, 27568–27574. [Google Scholar] [CrossRef]
  121. Jiang, J.; Chen, Z.; Hu, Y.; Xiang, Y.; Zhang, L.; Wang, Y.; Wang, G.C.; Shi, J. Flexo-photovoltaic effect in MoS2. Nat. Nanotechnol. 2021, 16, 894–901. [Google Scholar] [CrossRef]
  122. Jiang, Z.; Xu, Z.; Xi, Z.; Yang, Y.; Wu, M.; Li, Y.; Li, X.; Wang, Q.; Li, C.; Wu, D.; et al. Flexoelectric-induced photovoltaic effects and tunable photocurrents in flexible LaFeO3 epitaxial heterostructures. J. Mater. 2022, 8, 281–287. [Google Scholar] [CrossRef]
  123. Jin, Y.; Zhang, F.; Zhou, K.; Suen, C.H.; Zhou, X.Y.; Dai, J.-Y. Oxygen vacancy and photoelectron enhanced flexoelectricity in perovskite SrTiO3 crystal. Appl. Phys. Lett. 2021, 118, 164101. [Google Scholar] [CrossRef]
  124. Qiao, H.; Zhao, P.; Kwon, O.; Sohn, A.; Zhuo, F.; Lee, D.-M.; Sun, C.; Seol, D.; Lee, D.; Kim, S.-W.; et al. Mixed triboelectric and flexoelectric charge transfer at the nanoscal. Adv. Sci. 2021, 8, 2101793. [Google Scholar] [CrossRef] [PubMed]
  125. Liu, L.; Chen, W.; Zheng, Y. Flexoresponses of Synthetic Antiferromagnetic Systems Hosting Skyrmions. Phys. Rev. Lett. 2022, 128, 257201. [Google Scholar] [CrossRef] [PubMed]
Figure 1. (a) Schematic of the cantilever bending method used to apply a strain gradient. The dotted arrow represents the displacement w(x1) of point x1 when applying F to the free end of the beam. (b) The relationship between the electric current induced by the flexoelectric effect and the displacement of a specific point on the polymer beam. Reprinted with permission from [21]. Copyright 2012 AIP Publishing.
Actuators 12 00114 g001
Figure 2. (a) Schematic of the four-point bending method used to apply a strain gradient. The four metal bars represent the four points. (b) Dependence of polarization on strain gradient for an unpoled PZT–5H sample induced during a 4PB test carried out at a crosshead speed of 0.2 mm/min. Reprinted with permission from [10]. Copyright 2003 AIP Publishing.
Actuators 12 00114 g002
Figure 3. (a) Schematic of the three-point bending method used to apply a strain gradient. The three metal bars represent the three points. The dotted arrow represents the displacement of the center point when applying F. (b) The effect of the width-to-length ratio on the effective d33 from the flexoelectric response for rectangular (Ba,Sr)TiO3 ceramics. Reprinted with permission from [23]. Copyright 2010 World Scientific.
Actuators 12 00114 g003
Figure 4. Schematic of point-ring method used to apply strain gradient.
Actuators 12 00114 g004
Figure 5. (a) Schematic of pyramid compression method used to apply strain gradient. (b) Dependence of polarization on strain gradient for an unpoled BST sample measured using the PC test at different temperatures. Reprinted with permission from [1]. Copyright 2006 Springer Science Business Media, Inc.
Actuators 12 00114 g005
Figure 6. (a) Schematic of the sample configuration and the one-dimensional shock-wave experiment. (b) The theoretical model of the shock-wave experiment.
Actuators 12 00114 g006
Figure 7. (a) Schematic of shear and deformation under the torque value. (b) Infinitesimal analysis of the shear strain gradient.
Actuators 12 00114 g007
Figure 8. Schematic of converse flexoelectric coefficient measurement by applying a voltage on (a) top and bottom surfaces, or (b) both lateral sides of the truncated pyramid-like samples. (c) Flexoelectric coefficient and displacement of the trapezoid BST block measured by the converse flexoelectric effect at 25 °C under ac drive voltages with a frequency of 400 Hz. Reprinted with permission from [33]. Copyright 2006 AIP Publishing.
Actuators 12 00114 g008
Figure 9. (a) The temperature dependence of the flexoelectric coefficient and apparent d33 for reduced and unreduced NBBT8 ceramics under bending. Reprinted with permission from [60]. Copyright 2018 Elsevier. (b) The temperature dependence of the flexoelectric coefficient for BaTiO3 ceramics under bending. Reprinted with permission from [45]. Copyright 2018 American Physical Society.
Actuators 12 00114 g009
Figure 10. (a) Schematic of the contribution of the spontaneously polarized surface to the measured flexoelectric coefficient under bending. Reprinted with permission from [45]. Copyright 2018 American Physical Society. (b,c) The flexocoupling coefficients of NBBT8 and BST25 ceramics after sputtering (S) or fired (F)-on electrodes. Reprinted with permission from [42]. Copyright 2021 AIP Publishing. fρ is the effective flexoelectric coefficient.
Actuators 12 00114 g010
Figure 11. The orientation of nanodomains in relaxor ferroelectrics before and after applying a strain gradient. Reprinted with permission from [8]. Copyright 2001 AIP Publishing.
Actuators 12 00114 g011
Figure 12. Breaking the macroscopic centric symmetry during sintering at high temperatures. The preferred direction of the polarization depends on the orientation of the sample in the furnace. The sample’s arrow represents the polarization’s preferred direction. Reprinted with permission from [27]. Copyright 2015 Springer Nature.
Actuators 12 00114 g012
Figure 13. Schematic of a semiconductive BaTiO3−δ crystal forming barrier layers on the surfaces, and the barrier layer theory enhancing surface piezoelectricity when bending the semiconductive BaTiO3−δ crystal. Reprinted with permission from [77]. Copyright 2016 Springer Nature.
Actuators 12 00114 g013
Figure 14. (a) The film generating a strain gradient through the interfacial lattice mismatch between the film and substrate Reprinted with permission from [93]. Copyright 2012 American Chemical Society. (b) Oxygen partial pressures controlling the oxygen vacancy gradient that modulates the strain gradient of the film. Reprinted with permission from [82]. Copyright 2011 American Physical Society. (c) The sharp probe of an atomic force microscope applying a compressive force to a film, causing strain gradient. Reprinted with permission from [85]. Copyright 2019 Springer Nature. (d) Bending films and substrates to obtain strain gradient. Reprinted with permission from [94]. Copyright 2019 American Physical Society.
Actuators 12 00114 g014
Figure 15. Effective piezoelectric constant of PZT (dashed blue line) and BT (solid red line) cantilevers. The piezoelectric constants of the two cantilevers are normalized with respect to the bulk PZT value (solid blue line). Reprinted with permission from [95]. Copyright 2008, American Physical Society).
Actuators 12 00114 g015
Figure 16. (a) Schematic representation of the domain structure in a film with a–c domains. The black arrows represent the stresses that must be applied to the twinned film to flatten it onto the substrate. (b) The flexoelectric polarization (grey) induces a rotation of the ferroelectric polarization of the c domain (blue). Reprinted with permission from [97]. Copyright 2011 Springer Nature.
Actuators 12 00114 g016
Figure 17. Schematic of (a) a 3 × 3 pyramid BST array structure (d = 0.52 mm) (reprinted with permission from [111]; copyright 2006 AIP Publishing) and (b) a flexure mode composite. (c) Effective d33 of three-layer six-unit BST composites. (b,c) Reprinted with permission from [37]. Copyright 2009 AIP Publishing). (d) A sample with a dome-like structure. Reprinted with permission from [24]. Copyright 2016 AIP Publishing.
Actuators 12 00114 g017
Figure 18. (a) Unipolar displacement of reduced NBBT8 ceramics under different voltages at different frequencies. Reprinted with permission from [117]. Copyright 2017 Elsevier. (b) The linear variance of the first-harmonic flexoelectric curvature with the applied ac field at a frequency of 100 kHz of MEMS actuators fabricated by SrTiO3. Reprinted with permission from [19]. Copyright 2015 Springer Nature.
Actuators 12 00114 g018
Figure 19. PFM images illustrating the impact of stress (generating the flexoelectric effect) on the polarization and switching behavior of (111)-oriented PZT capacitors. (ac) Before applying stress: PFM amplitude (a) and phase (b) images of as-grown capacitors and a local hysteresis loop (c) measured near the edge of one of the capacitors. (df) After applying tensile stress: PFM amplitude (d) and phase (e) images of the same capacitors and a hysteresis loop (f) measured at the same site. (gi) After applying compressive stress: PFM amplitude (g) and phase (h) images and a hysteresis loop (i) measured near the edge of one of the capacitors. Reprinted with permission from [98]. Copyright 2003 AIP Publishing.
Actuators 12 00114 g019
Figure 20. (a,b) Fabrication of nanoscale domain patterns using the tip of an atomic force microscope (AFM). Reprinted with permission from [74]. Copyright 2012 American Association for the Advancement of Science. (a) Domain lines were mechanically written on a BaTiO3 film by scanning the film using the tip under a loading force of 1500 nN. (b) The same domain structure was modified by the electrical erasure of the mechanically written domains. The erasure was performed by scanning the central segment using the tip under a dc –3 V bias. (c) Scheme of the signal of force-induced devices on different surfaces with nanodots. Reprinted with permission from [99]. Copyright 2018 AIP Publishing.
Actuators 12 00114 g020
Figure 21. The temperature dependence of the output power density and the matched resistance measured in the unreduced NBBT8 ceramics. Reprinted with permission from [60]. Copyright 2018 Elsevier. Td is ∼140 °C for the NBBT8 ceramics.
Actuators 12 00114 g021
Figure 22. (a) Schematic of the thermal current measurements under the application of a three-point bending load to the samples. (b) The temperature dependence of the thermal current density of BNT-based ceramic plates using the test device in (a). The red curves are the measured results after flipping the samples. The current direction is mainly dependent on the direction of the strain gradient, which is less related to the direction of the heat transfer. Reprinted with permission from [106]. Copyright 2018 American Physical Society.
Actuators 12 00114 g022
Figure 23. (a) Schematic of the AFM tip applying a load to generate a strain gradient in an illuminating area of dielectrics. (b) Evolution of the photocurrent from the flexoelectric response with forces for SrTiO3 single crystals. Reprinted with permission from [104]. Copyright 2018 American Association for the Advancement of Science.
Actuators 12 00114 g023
Figure 24. Cantilever bending the halide capacitors (where X is Cl, Br, or I) with transparent electrodes in the dark (a) or under light (b). The evolution of the collected current and strain gradient with time in the dark (c) or under light (d). Reprinted with permission from [78]. Copyright 2020 Springer Nature.
Actuators 12 00114 g024
Figure 25. Controlled manipulation of oxygen vacancies. (a) The normalized vacancy concentration (NVC) maps after mechanical scans were performed using a sharp tip with a contact force of 9.5 µN within the grey boxes. Horizontal arrows indicate the corresponding fast scan direction. (b) NVC profiles along lines M1, M2, M3, and M4. M1 and M4 are placed 0.5 µm away from the borders between the V O · · -enriched region (inside the red box) and the pristine region (outside the red box). Horizontal black lines in (b) indicate the background, which is used to estimate the net change in the NVC. The NVC profiles were averaged over a 0.5 µm wide averaging window. Reprinted with permission from [101]. Copyright 2020 Springer Nature.
Actuators 12 00114 g025
Figure 26. Energy band diagram of metal-Si (p-type) contact under (a) no strain gradient, (b) positive strain gradient, and (c) negative strain gradient. The effect of the induced flexoelectric polarization on the (d) maximum rectified current density, (e) reverse saturation current density, (f) rectification ratio, and (g) open voltage for silicon-based Schottky barrier diode devices. The red dots are the experimental results and the blue dotted lines are their fitted curves. Reprinted with permission from [90]. Copyright 2021 Elsevier.
Actuators 12 00114 g026
Figure 27. (a) Schematic diagrams of triboelectric devices: (i) pyramid-featured Pt (generating strain gradient on dielectric films) and (ii) flat Pt. (b,c) Peak-to-peak voltage as a function of the applied force (1 kgf = 9.8 N) in triboelectric devices of flat Pt and pyramid-featured Pt contact (b) SiO2 and (c) Si3N4 thin films. For pyramid-featured Pt and SiO2, the triboelectric effect is suppressed by the flexoelectric effect owing to opposite charge transfer directions, which leads to a smaller peak-to-peak voltage in the pyramid-featured device than in the flat device. For pyramid-featured Pt and Si3N4, the triboelectric effect is improved by the flexoelectric effect owing to uniform charge transfer directions, which leads to a larger peak-to-peak voltage in the pyramid-featured device than in the flat device. Reprinted with permission from [124]. Copyright 2021 Wiley.
Actuators 12 00114 g027
Figure 28. (a) The rectifying diode effect in asymmetrically reduced NBT-based ferroelectric ceramics because of the built-in electric field from the flexoelectric effect. Reprinted with permission from [107]. Copyright 2019 American Chemical Society. (b) The interface carrier densities and mobilities of 2DEG under different strain gradients for the LaAlO3/SrTiO3 heterostructure. Reprinted with permission from [94]. Copyright 2019 American Physical Society. (c) Schematic diagram of the potential energy profiles with increasing flexoelectric polarization P (white arrow). The solid red and black dashed lines indicate the effective tunnel barrier and the Fermi level, respectively. The blue and green dashed lines indicate the conduction band minimum and valence band maximum for P = 0, respectively. Reprinted with permission from [89]. Copyright 2020 Springer Nature.
Actuators 12 00114 g028
Figure 29. (a) A schematic illustration of the magnetic field-induced bending of the inhomogeneously reduced BFO-BTO ceramic wafers due to the inhomogeneous magnetostrictive response across the thickness. The bending causes a flexoelectric response. (b) The effect of the DC magnetic field on the magnetoelectric coupling coefficient for the BFO-BTO ceramics. The electric voltage is from the flexoelectric response. Reprinted with permission from [62]. Copyright 2019 Elsevier.
Actuators 12 00114 g029
Table 1. Nomenclatures used in Section 2.
ParametersMeaningParametersMeaning
FForcew(x1)Displacement of point x1 for a cantilever beam
S k l / x j Strain gradientPPolarization
iCurrentfMeasurement frequency
AElectrode areaLDistance from the free end to the clamping end of a cantilever beam
μijklFlexoelectric coefficientbWidth of a plate sample or edge length of the bottom square surface of a sample with a truncated pyramid-like shape
sSpeed of the top metal crossheadtTime
lDistance of the outer span of a plate sampleQCharge
z0Displacement of the center point of a three-point bending sampleσPoisson ratio
hThickness of the samplec11Elastic modulus
d33Piezoelectric coefficientrDistance of a point from the center of a disc sample
RDRadius of a disc sampleaEdge length of the top square surface of a sample with a truncated pyramid-like shape
u(x,t)Displacement of the particle at point x and time t using the shock-wave methodcShock-wave velocity
vSpeed of impacted sample by a flying plate λ Ratio of the flying plate to the sample mass
ρMass density UmaxInduced voltage from flexoelectric response
RResistance of a loading resistorDsDiameter of a disc sample
γA deflecting micro-angle along the parallel lines of a cylinder-shaped sample dφA rotating micro-angle along the diameter line of a cylinder-shaped sample
γShear strainMnApplied torque
JPolar moment of inertiaGShear modulus
Table 2. Summary of the measured flexoelectric coefficients of inorganic ferroelectric materials at room temperature.
MaterialFlexoelectric Coefficient (Frequency)Value, μC/mMethod
Ba0.7Sr0.3TiO3 [35]μ12 (17 Hz)~7CB
Ba0.67Sr0.33TiO3 [1]μ11 (0.5 Hz)~150PC
Ba0.67Sr0.33TiO3 [33]μ11 (400 Hz)121 ± 20CFE
Ba0.67Sr0.33TiO3 [9]μ12 (1 Hz)~100CB
Ba0.67Sr0.33TiO3 [34]μ12 (10 Hz)124 ± 14CFE
Ba0.67Sr0.33TiO3 [36]μρ (110 Hz)284 ± 20PR
Ba0.67Sr0.33TiO3 [37]μ126 ~103PB
Ba0.65Sr0.35TiO3 [38]μ12 (2 Hz)~8CB
Ba0.6Sr0.4TiO3 [24]μρ (110 Hz)10 ± 2PR
Ba0.6Sr0.4TiO3/Ni0.8Zn0.2Fe2O4 [39] μ12 (30 Hz)~128CB
Ba0.5Sr0.5TiO3 [36]μρ (110 Hz)2 ± 0.5PR
SrTiO3 [36]μρ (110 Hz)0.3 ± 0.02PR
SrTiO3 [40]μ12 (9 Hz)~0.008CB
SrTiO3 single crystals [22,41]μ0.001~0.013PB
20% C doped SrTiO3 [40]μ12 (9 Hz)~0.16CB
Ba0.75Sr0.25TiO3 [42]μρ (110 Hz)120 ± 20PR
BaTiO3 [43]μ12~10CB
BaTiO3 [30]μ11~17Shock wave
BaTiO3 single crystals [44] μ 13 e f f (13 Hz)1~103PB
As prepared BaTiO3 [45]μρ (110 Hz)120 ± 20PR
Abraded BaTiO3 [45]μρ (110 Hz)30 ± 5PR
Quenched BaTiO3 [45]μρ (110 Hz)45 ± 5PR
Heat-treated BaTiO3 [45]μρ (110 Hz)200 ± 20PR
BaTiO3-0.08Bi(Zn0.5Ti0.5)O3 [46]μ12 (20 Hz)~25CB
BaTi0.87Sn0.13O3 [47]μ12 (30 Hz)~53CB
BaTi0.85Sn0.15O3 [48]μ12 (10 Hz)~18CB
0.5 wt%Al2O3-doped BaTi0.85Sn0.15O3 [48]μ12 (10 Hz)~40CB
0.2 wt%Al2O3-doped BaTi0.85Sn0.15O3 [48]μ12 (10 Hz)~2CB
(Pb0.3 Sr0.7)TiO3 [1]μ11 (0.5 Hz)~21PC
PMN [7]μ12 (1 Hz)~4CB
0.9PMN-0.1PT [49]μ116~12PC
0.9PMN-0.1PT [49]μ1120~50PC
0.9PMN-0.1PT [50]μ33 (0.2 Hz)~1000CFE
PMN-PT single crystals [51] μ 13 e f f (13 Hz)~103PB
PMN-PT single crystals [52]μeff (3 Hz)~71CB
PMN-PT single crystals [52]μeff (6 Hz)~81CB
PMN-PT single crystals [52]μeff (9 Hz)~99CB
PMN-PT single crystals [52]μeff (12 Hz)~101CB
PIN-PMN-PT single crystals [53]μeff (9 Hz)~50CB
2.5% Bi-doped 0.7PMN-0.3PT [54]μ12 (7 Hz)~260CB
2.5% Bi-doped 0.68PMN-0.32PT [54]μ12 (7 Hz)~300CB
2.5% Bi-doped 0.66PMN-0.34PT [54]μ12 (7 Hz)~220CB
2.5% Bi-doped 0.64PMN-0.36PT [54]μ12 (7 Hz)~80CB
2.5% Sm-doped 0.70PMN-0.30PT [55]μ12~430CB
2.5% Sm-doped 0.68PMN-0.32PT [55]μ12~550CB
2.5% Sm-doped 0.66PMN-0.34PT [55]μ12~490CB
2.5% Eu-doped 0.66PMN-0.32PT [55]μ12~380CB
Pb(Zr,Ti)O3 [10]μ120.5~24PB
Pb(Zr,Ti)O3 [56]μ12 (1 Hz)~1.4CB
Abraded PZT-81[45]μρ (110 Hz)5 ± 0.5PR
Heat-treated PZT-81[45]μρ (110 Hz)25 ± 2.5PR
Poled soft PZT [57]μ12 (0.5 Hz)~494PB
PbZrO3 [58] μ 13 e f f (13 Hz)~0.0023PB
AgNbO3 [58]μ (13 Hz)~0.0053PB
NBT [59]μρ (110 Hz)0.43 ± 0.02PR
NBBT2 [59]μρ (110 Hz)0.83 ± 0.14PR
NBBT6 [24,59]μρ (110 Hz)6.1 ± 1.22PR
NBBT8 [59]μρ (110 Hz)4.19 ± 0.49PR
Heat-treated NBBT8 [42]μρ (110 Hz)20 ± 5PR
Reduced NBBT8 [60]μρ (110 Hz)1350 ± 100PR
NBBT10 [59]μρ (110 Hz)4.24 ± 0.95PR
NBBT15 [59]μρ (110 Hz)3.29 ± 0.2PR
NBBT20 [59]μρ (110Hz)3.25 ± 0.38PR
NBBT20 [61]μ122.4 ± 0.5CB
Reduced NBBT20 [61]μ12100 ± 10CB
0.75BiFeO3-0.25BaTiO3 [62]μρ (110 Hz)1 ± 0.5PR
Reduced 0.75BiFeO3-0.25BaTiO3 [62]μρ (110 Hz)140 ± 20PR
(Bi1.5Zn0.5)(Zn0.5Nb1.5)O7/Ag [63]μ12 (10 Hz)~0.17CB
(K0.4Na0.58Li0.02)(Nb0.96Sb0.04)O3 [64]μ12~1CB
KTaO3 single crystals [41]μeff~0.0043PB
YAlO3 single crystals [41]μeff~−0.0043PB
DyScO3 single crystals [41]μeff~−0.0083PB
LaAlO3 single crystals [41]μeff~−0.0033PB
Compound Pb(Mg1/3Nb2/3)O3 is abbreviated as PMN; PbTiO3 is abbreviated as PT, and Pb(Zr,Ti)O3 is abbreviated as PZT. Compound 1−x(Na1/2Bi1/2) TiO3-xBaTiO3 is abbreviated as NBBT(100x).
Table 3. Summary of the measured flexoelectric coefficients of ferroelectric polymers at room temperature.
MaterialFlexoelectric Coefficient (Frequency)Value, μC/mMethod
PVDF [21]μ12 (21 Hz)0.013 ± 0.001CB
Oriented PET [21]μ12 (21 Hz)0.0099 ± 0.0004CB
P(VDF-TrFE) [65]μ12≤0.191 ± 0.017CB
P(VDF-TrFE-CFE) [65]μ120.03 ± 0.0015CB
PVDF [31]μ12~0.00073CT
α -phase bulk PVDF [26]μ11~0.016PC
PVDF [66]μ12~0.015CB
PVDF [66]μ12~0.013PB
PVDF [66]μ12~0.0144PB
PVDF [67]μ12 (6 Hz)0.00582 ± 0.00043CB
P(VDF-CTFE) [67]μ12 (6 Hz)0.00216 ± 0.00027CB
P(VDF-HFP) [67]μ12 (6 Hz)0.00257 ± 0.00026CB
PVDF/10 vol% BST [68]μ12 (6 Hz)0.00436 ± 0.000933PB
PVDF/15 vol% BST [68]μ12 (6 Hz)0.00681 ± 0.00073PB
PVDF/20 vol% BST [68]μ12 (6 Hz)0.00877 ± 0.001193PB
PVDF/25 vol% BST [68]μ12 (6 Hz)0.0135 ± 0.001763PB
P(VDF-TrFE) (70/30) [69]μ12 (6 Hz)0.00304 ± 0.000553PB
P(VDF-TrFE) (55/45) [69]μ12 (6 Hz)0.00418 ± 0.000673PB
P(VDF-TrFE-CTFE) [69]μ12 (6 Hz)0.00352 ± 0.00053PB
Disclaimer/Publisher’s Note: The statements, opinions and data contained in all publications are solely those of the individual author(s) and contributor(s) and not of MDPI and/or the editor(s). MDPI and/or the editor(s) disclaim responsibility for any injury to people or property resulting from any ideas, methods, instructions or products referred to in the content.

