Article

Optimised Voltage Distribution on Piezoelectric Actuators for Modal Excitations Damping in Tapered Beams

Department of Industrial, Electronic and Mechanical Engineering, Roma Tre University, Via Vito Volterra 62, 00146 Rome, Italy
*
Author to whom correspondence should be addressed.
Actuators 2023, 12(2), 71; https://doi.org/10.3390/act12020071
Submission received: 11 January 2023 / Revised: 7 February 2023 / Accepted: 8 February 2023 / Published: 9 February 2023

Abstract

:
Vibration mitigation is a prominent matter in several engineering fields. Several adverse phenomena are related to vibrations, such as fatigue, noise, etc. The availability of smart materials increases the solutions for both vibration damping and energy harvesting applications. Piezoelectric materials seem to be the most promising for these applications. However, their positioning significantly affects their efficiency. Several studies were performed on the positioning of piezoelectric actuators to dampen a target resonance in cantilever beams with constant cross-sections. Here, an analytical model for the optimal voltage distribution on an array of piezoceramic (PZT) actuator pairs is proposed in the case of tapered beams. The effect of tapering on the optimal voltage distribution was investigated for several eigenmode excitations and tapering ratios. The model outcomes were corroborated via FEM simulations and a fair agreement was found for each considered case.

1. Introduction

Vibration in flexible and lightweight components represents one of the key issues for mechanical and aeronautical designers since vibrations at resonance, if proper damping is not provided, may accelerate the growth and propagation of cracks; thus, weakening the structure. Vibration dampening systems are often adopted to improve the fatigue strength of such structural components.
The recent growth of smart materials has facilitated the development of new passive and active damping systems that can be implemented in many engineering applications. Such materials provide an appealing capability to modulate their mechanical behaviour through an external stimulus, which can be represented by an electric or magnetic field, a strain, a temperature variation, etc.
Jacob et al. [1] proposed a hybrid damper, based on a combination of a magneto-rheological (MR) Fluid (MRF) and Shape Memory Alloy (SMA), which can dissipate a significant amount of shock energy. Wei et al. [2] presented a systematic methodology for the optimal design of MR dampers. Park et al. [3] designed a passive launch–vibration isolation system, based on shape memory alloy (SMA) technology to mitigate the dynamic launch loads transmitted to small satellites.
The implementation of piezoelectric materials has been widely investigated in different applications, including the following: energy harvesting [4,5,6], turbomachinery blade vibration [7,8,9,10,11], piezoelectric ultrasonic motors [12,13,14] and structural health monitoring [15]. Goltz [16] used piezoelectric actuators to control the vibration in an axial compressor. Choi [17,18] implemented an active device to dampen fan blade vibration. Provenza [19] reported a wireless appliance to control piezoelectric elements in rotating plates. In some applications, two eigenmodes of the structure may be simultaneously excited. Such scenarios may occur in turbomachinery blades, where the unsteady aerodynamic loads, due to the interaction among the rotor and the stator and the presence of mistuning, may lead to bi-modal excitation [19,20].
Damping techniques, based on active piezoelectric systems, generally offer better performance, compared to passive ones, and the opportunity to tunr the action of the actuators at each resonance condition. Among piezoelectrics, the most commonly used in vibration damping applications are piezoceramics such as lead zirconate titanate (PZT).
Nevertheless, the actuator placement greatly affects the efficiency of such active systems in the case of single and bi-modal excitations. Earlier studies on the best piezoelectric actuators positioning to efficiently damp single mode excitation were performed by [21,22]. An analytical strategy for the placement optimisation of a single pair of PZT plates in a cantilever beam for bi-modal placement optimisation was proposed in [23]. Recently, such an approach has been enhanced by optimising the voltage distribution on each pair of an array of PZT actuators couples mounted on cantilever beams [24]. This method offers the highest efficiency, as all the actuator pairs are always activated, concurring to achieve the highest feasible damping, while only the voltage phase is optimised, depending on the excited mode. However, not all structures exhibit constant cross-section, such as tapered beams, which can be embodied by blades from gas turbines, wind turbines and helicopters [25,26,27]. For these structures, showing variable cross-sections, there is a gap in the literature regarding the research of the optimal voltage distribution on PZT actuator pairs. In particular, the effect of the tapering on the optimal voltage distribution, in the case of eigenmode excitations, has never been investigated.
Although turbomachinery blades can be modelled, in the first approximation, as cantilever beams, the typical blades show peculiar geometric characteristics, such as tapering and twisting, which lead to errors in the evaluation of eigenfrequencies and modal shapes, especially if the typical Euler–Bernoulli model of beams with constant cross-section is considered.
This work aimed to investigate how tapering affected the optimal potential distribution on an array of PZT actuators entirely covering a cantilever tapered beam. From the dynamics of linearly tapered beams, a theoretical model was developed to find the optimal voltage distribution (O.V.D) on pairs of PZT actuators. The theoretical model was verified by means of FEM (Finite Element Method) analysis, which revealed a fair consistency with the analytical data. Analytical findings showed that the tapering ratio modified the position at which the driving voltage had to be phase shifted by 180 degrees with respect to a traditional non-tapered cantilever beam. Finally, several cases of modal excitations were reported on in order to provide a comprehensive set of instances that were used to check the validity of the proposed method.
In what follows, the theoretical model for the detection of the optimal potential distribution is presented in Section 2. The FEM model and corresponding outcomes are described and discussed in Section 3.

2. Optimal Voltage Distribution on Piezoelectric Actuators Coupled with Cantilever Tapered Beams

In this paper, a model for active vibration damping of tapered beams (extending a model already presented in [24] for constant cross-section beams) using piezoelectric plates is presented. A typical cantilever tapered beam is depicted in Figure 1:
A linearly tapered beam can be described with the following equation:
A R = A L 1 + c I R = I L 1 + c 3 A ( x ) = A L 1 + c x L I ( x ) = I L 1 + c x L 3
where A L , I L , A R and I R are the area and the inertia moment of the beam’s left-end and right-end cross-sections [28], and c is the tapering ratio (with 0 c < ).
The equilibrium equation can be obtained by applying the principle of the virtual works:
δ L e = δ L i + δ L f + δ L p
where δ L e , δ L i , δ L f and δ L p represent, respectively, the virtual works of the elastic, inertial, external and piezoelectric forces. Denoting with w the vertical displacement of the beam section and the virtual quantities with a superimposed tilde, the first three terms can be written in the form:
δ L e = 0 L M e ( x , t ) w ( x , t ) d x δ L i = 0 L ρ A ( x ) w . . ( x , t ) w ( x , t ) d x δ L f = 0 L g ( x , t ) w ( x , t ) d x
where M e ( x , t ) = E b I ( x ) w ( x , t ) is the internal elastic moment while g ( x , t ) is the external load, varying in both space and time, which can be written as:
g ( x , t ) = G ( x ) sin ( ω j t )
with ω j being the angular frequency of the excited mode and G ( x ) represents how the load is spatially distributed. For instance, in a turbomachinery blade vibration framework, g ( x , t ) is represented by an aerodynamic load, which is proportional to the rotor speed and matches one of the blade eigenmodes. Such loads can be calculated via computational fluid dynamics simulations, as reported in [29]. The calculation of δ L p is done by considering that the procedure requires the whole beam to be covered with piezoelectric plates and the identification of the optimal potential distribution to maximise their damping effectiveness was the aim of this work. Since it is not possible to obtain a variable potential distribution on a single pair of actuators, the piezoelectric plates, both the lower and upper plates, are segmented:
The expression of δ L p can be obtained by considering that the stresses that each piezoelectric plate applies to the beam are concentrated at the plate’s ends. Thereby, considering the generic couple of plates (symmetrical with respect to the x-axis in both position and voltage distribution) it is possible to model their mechanical action on the beam by two bending moments concentrated at their ends, Figure 2. The expression of this moment was evaluated by Crawley and de Luis for beams with constant cross-section [21]. Here, Crawley’s expression was extended to tapered beams, verifying its validity, for the considered cases, by means of an FEM code (Figure 3):
Therefore, denoting with:
ψ ( x ) = E b T b ( x ) E a T a Λ ( t ) = d 31 T a V ( t )
the piezoelectric moment can be written as:
M p ( x , t ) = ψ ( x ) 6 + ψ ( x ) E a b T a T b ( x ) Λ ( t )
so that:
δ L p = i = 1 N p M p ( x i , t ) w ( x i , t )
Since the external and piezoelectric loads must act in phase opposition to achieve vibration damping, given the same δ L f , the maximum dampening effect can be obtained by maximising δ L p . In fact, δ L p is a measure of the effectiveness of PZT actuators work: the larger work they exert, the higher their damping effectiveness is. The maximum δ L p can be achieved by keeping all plates activated at all times. The search was focused on the optimal potential distribution. For this purpose, a step distribution was considered (having to keep the voltage amplitude V constant in order to compare different configurations with each other), so that γ i indicates a function that can have the value of, depending on the pair of plates considered, +1 or −1 (see Figure 2) δ L p will be:
δ L p = i = 1 N p γ i M p ( x i , t ) w ( x i , t )
This study considered external loads exciting the first eigenmodes of the structure, thereby denoting with ϕ j ( x ) the eigenmode of a cantilever tapered beam that must be damped, δ L p can be rewritten as:
δ L p = i = 1 N p γ i M p ( x i , t ) ϕ j ( x )
The analytical formula for calculating the eigenmodes and eigenfrequencies of a tapered cantilever beam was proposed by Banerjee and Ananthapuvirajah [28]. In this paper, a new model is proposed for identifying the optimal voltage distribution through the introduction of the following function f j ( x ) :
f j ( x ) = 0 x M p ( x ) ϕ j d x
It is possible to show that the effectiveness of the PPs is the highest if the driving voltage sign is changed at each extremum of this function. Figure 4, Figure 5 and Figure 6 show the f j ( x ¯ ) for the first three eigenmodes. When the first mode was excited, the O.V.D. had no voltage sign switch, because the minimum of f 1 ( x ¯ ) coincided with x ¯ = 0 and the maximum was located at the beam’s free-end, i.e., x ¯ = 1 , (Figure 4a). The same conclusion could be made by analysing Figure 4b which shows the area subtended by the integrand function of f 1 ( x ¯ ) , i.e., M p ( x ¯ ) ϕ 1 ( x ¯ ) . As the integrand had no negative values, the area always stayed above the x-axis, sp no sign switch was entailed for the O.V.D. Conversely, when the second mode was excited, the O.V.D. involved a sign switch at x ¯ = 0.315 , as the minimum of f 2 ( x ¯ ) was achieved (Figure 5a). Equivalently, an analysis of Figure 5b shows that for 0 x ¯ 0.315 the area subtended by the function M p ( x ¯ ) ϕ 2 ( x ¯ ) was negative; this meant that the γ of the PPs within that region must have had the opposite sign of the one supplied to the remaining PPs. The O.V.D. in the case of the third eigenmode excitation entailed two voltage sign changes. The function f 3 ( x ¯ ) had a local maximum at x ¯ = 0.2 and a minimum at x ¯ = 0.61 , and, thus, the voltage sign had to change at these values to obtain the O.V.D. (Figure 6a). The same observation could be made by analysing the graph in Figure 6b. It can be seen that the voltage distribution of the PPs within the region 0.2 x ¯ 0.61 had to be the opposite of the remaining zones. In this way, the areas all stood on the same side with respect to the x-axis and the effectiveness of the PPs was maximised.
The effect of the tapering ratio c on the optimal voltage distributions for the first three eigenmodes could be gathered by analysing the corresponding f i 1 ( x ¯ ) functions shown in Figure 7, Figure 8 and Figure 9. It can be observed that, as the tapering ratio increased, the positions of the extrema shift toward the beam’s free-end. In other terms, if c increased the voltage sign change occurred closer to the beam’s tip.

3. Numerical Model and Results

The analytical model outcomes were verified by means of numerical simulations using commercial multiphysics FEM software. The geometric dimensions considered in the analytical and numerical models are reported in Table 1:
The tapered beams were coupled with thirteen PZT actuator pairs, and, hence, 2 13 voltage distributions (Table 2) were explored to find the optimal one. The PPs were supplied with the same voltage amplitude in all the considered cases. The beam and PZT actuator materials are reported in Table 3 and the thickness of each PZT actuator was set to T a = 0.4 mm. The tapered beam coupled with PZT actuators was modelled in a 2D environment. The overall domain was meshed with 53,024 free-triangular elements and the region close to the edges of each PZT actuator was refined to improve the accuracy of the solution. In fact, the piezoelectric moment exerted by each PP was actually concentrated at the edges of each actuator (Section 2). A numerical modal analysis was performed to find the first three eigenmodes for each tapering ratio and the numerical results compared with the analytical ones (Table 4). A fair agreement was found in every considered case.
For each c and eigenmode excitation, all the possible voltage distributions were simulated and the O.V.D. was obtained by finding the configuration that maximised δ L p . In the case of cantilever beams, this configuration also corresponded to the maximum displacement of the beam’s tip.
Figure 10, Figure 11 and Figure 12 show the comparison between the analytical and numerical O.V.D. for each the considered mode excitation as the tapering ratio was varied. Figure 10 shows that, for the first eigenmode, the analytical and numerical O.V.D. were always coincident, regardless of the tapering ratio. When the second mode was excited (Figure 5), the numerical optimal voltage distributions were reasonably close to the analytical ones (solid black line) for every c. The same fair agreement appeared when the third eigenmode excitation was considered (Figure 12) because the numerical voltage sign switches were close to the analytical ones (solid black lines).
The error, due to the number of PPs used to validate the analytical model, was barely meaningful. For example, the O.V.D. numerically obtained, in the case of the third mode excitation and c = 3 , differed from the analytical one because the analytical positions of the voltage sign switches did not coincide with integer multiples of L b / 13 (Figure 13). However, the total loss of piezoelectric work ( e 1 + e 2 ) (Figure 13) always remained below 3%, with respect to the maximum analytical δ L p .
Figure 14, Figure 15 and Figure 16 show the damping efficacy of the O.V.D. activation when a resonance was caused by an external load. Figure 14 illustrates the beam’s tip vertical displacement versus time in the case of the first eigenmode excitation. When the O.V.D. for the first mode was activated, the tip displacement rapidly decreased to about 8% of the tip displacement due to the external load. Similar results could be achieved by activating the O.V.D in the cases of the second Figure 15 and the third mode Figure 16 excitations.
The proposed model for the optimal voltage distribution on PPs may be relevant for vibration damping and energy harvesting applications based on tapered cantilever beams. For example, gas turbine blades often show variable cross-sections, and so the proposed model may be applied to find the optimal voltage distributions to mitigate vibrations in the case of resonance.

4. Conclusions

An analytical model for the identification of the optimal voltage distribution on arrays of PZT actuator pairs, mounted on cantilever linearly tapered beams, was herein presented. The model may be beneficial for active piezoelectric systems for vibration damping or energy harvesting applications. For example, the electric power generation of a piezoelectric-based energy harvester is affected by the mode shapes of the hosting structure, and the proper positioning or electrode segmentation facilitates higher efficiency, as reported in [30]. Knowledge of the optimal voltage distribution, for each excited eigenmode, is beneficial for the system’s efficiency maximisation. Numerical FEM simulations were performed for several tapering ratios to validate the model predictions. It was found that the voltage sign switches shifted towards the free-end with increasing tapering ratios. Parametric plots of the function, needed to identify the optimal voltage distribution on PZT actuator pairs, were provided for several tapering ratios ( 0.5 c 5 ) and in the case of the first three eigenmodes excitation of cantilever tapered beams. The numerical results seemed to corroborate the proposed model outcomes for each considered case.

Author Contributions

Conceptualization, A.R. and F.B.; methodology, A.R and F.B.; software, F.B.; validation, A.R. and F.B.; formal analysis, F.B.; investigation, A.R. and F.B.; data curation, A.R.; writing—original draft preparation, A.R. and F.B.; writing—review and editing, A.R. and F.B.; visualization, A.R.; supervision, F.B. All authors have read and agreed to the published version of the manuscript.

Funding

This research received no external funding.

Institutional Review Board Statement

Not applicable.

Informed Consent Statement

Not applicable.

Data Availability Statement

Not applicable.

Conflicts of Interest

The authors declare no conflict of interest.

Nomenclature

d 31 piezoelectric coefficient
E a Young’s modulus of the piezoelectric actuator
E b Young’s modulus of the beam
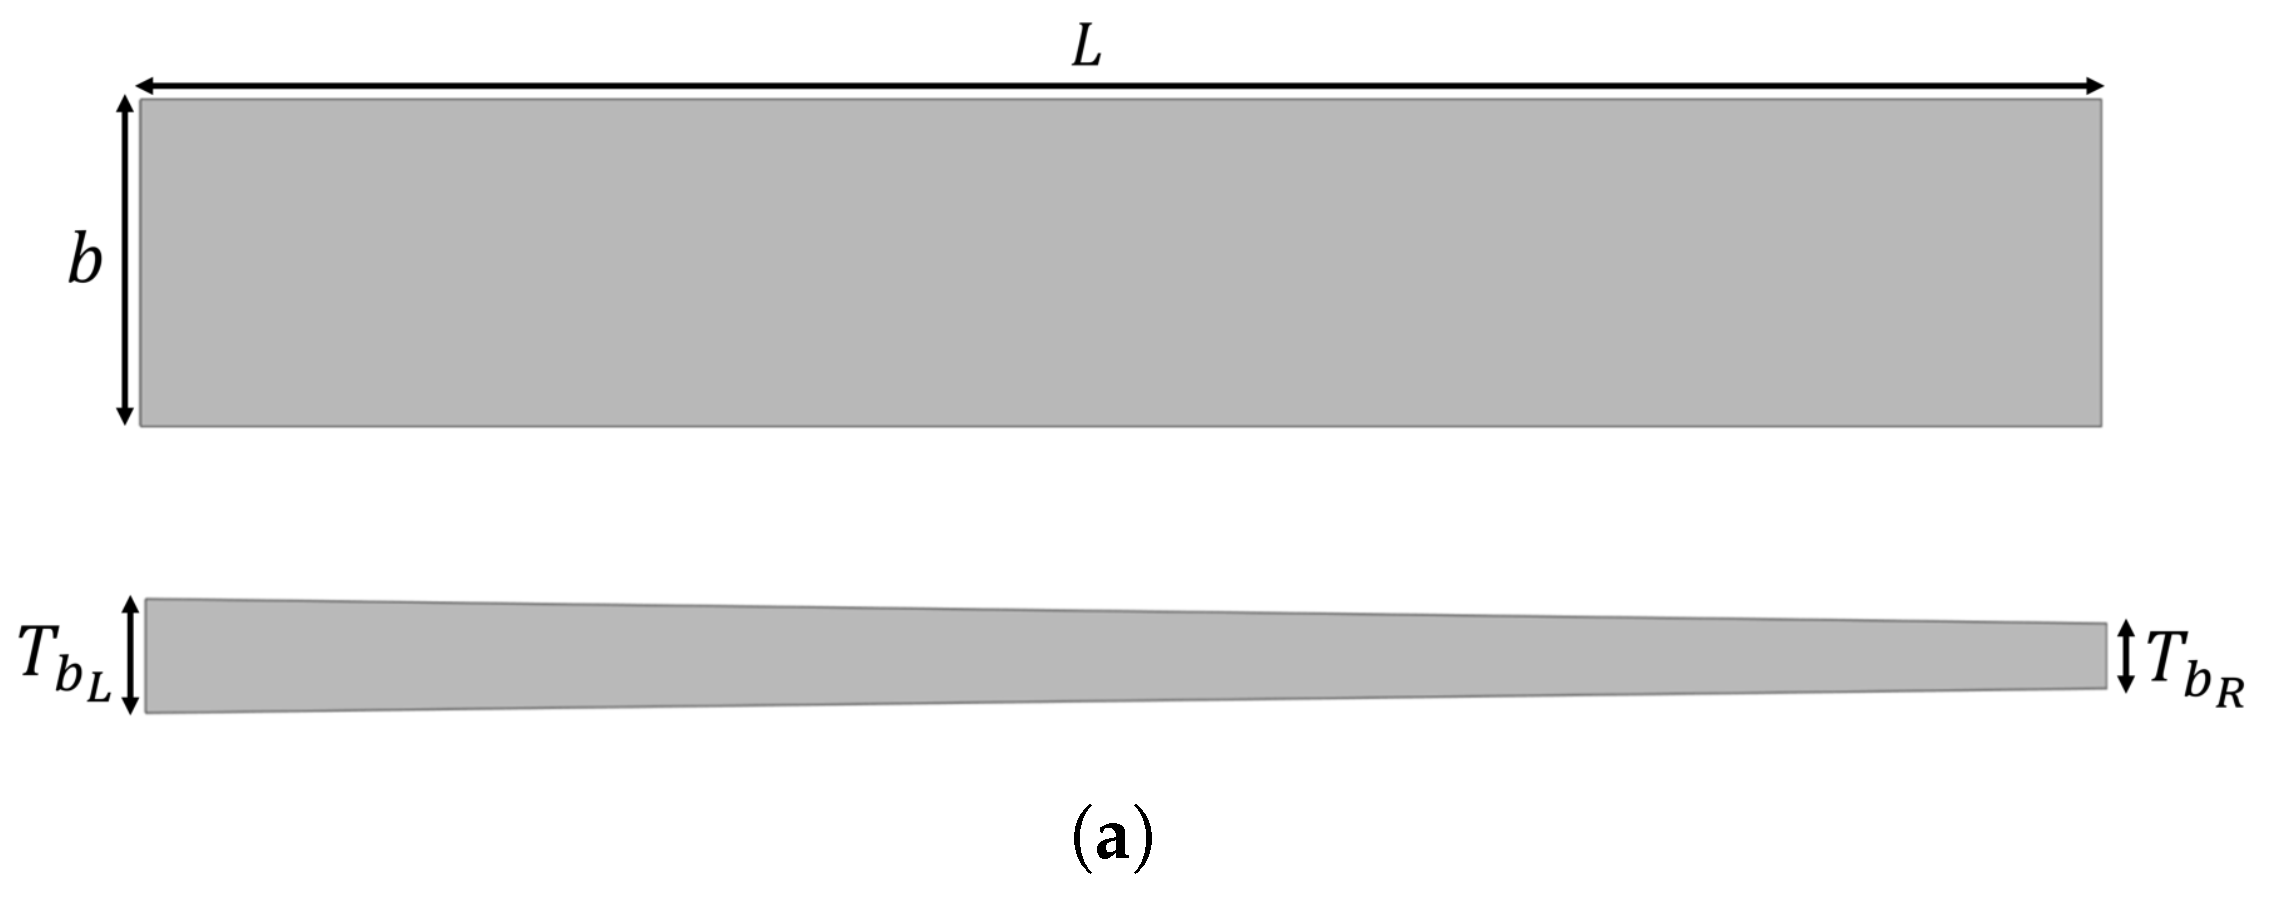
Lbeam length
M p 
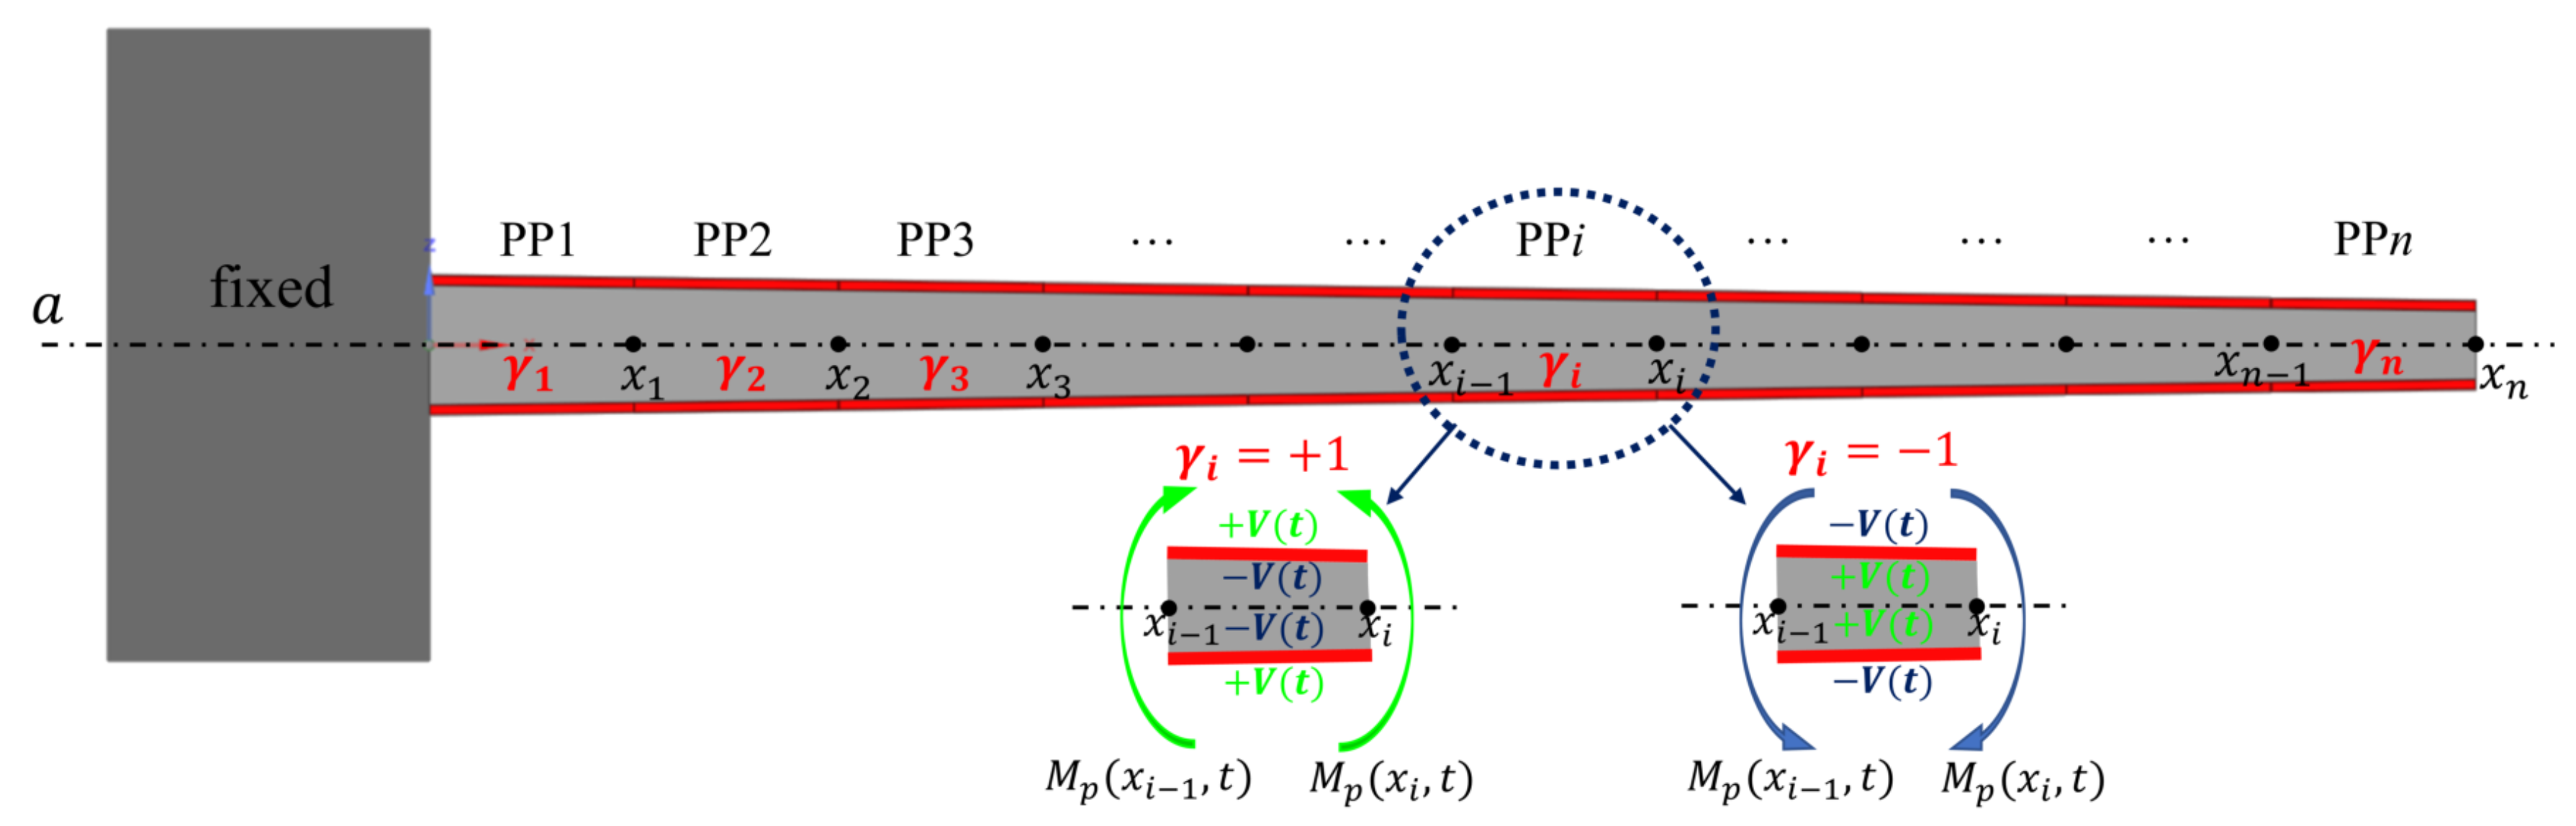
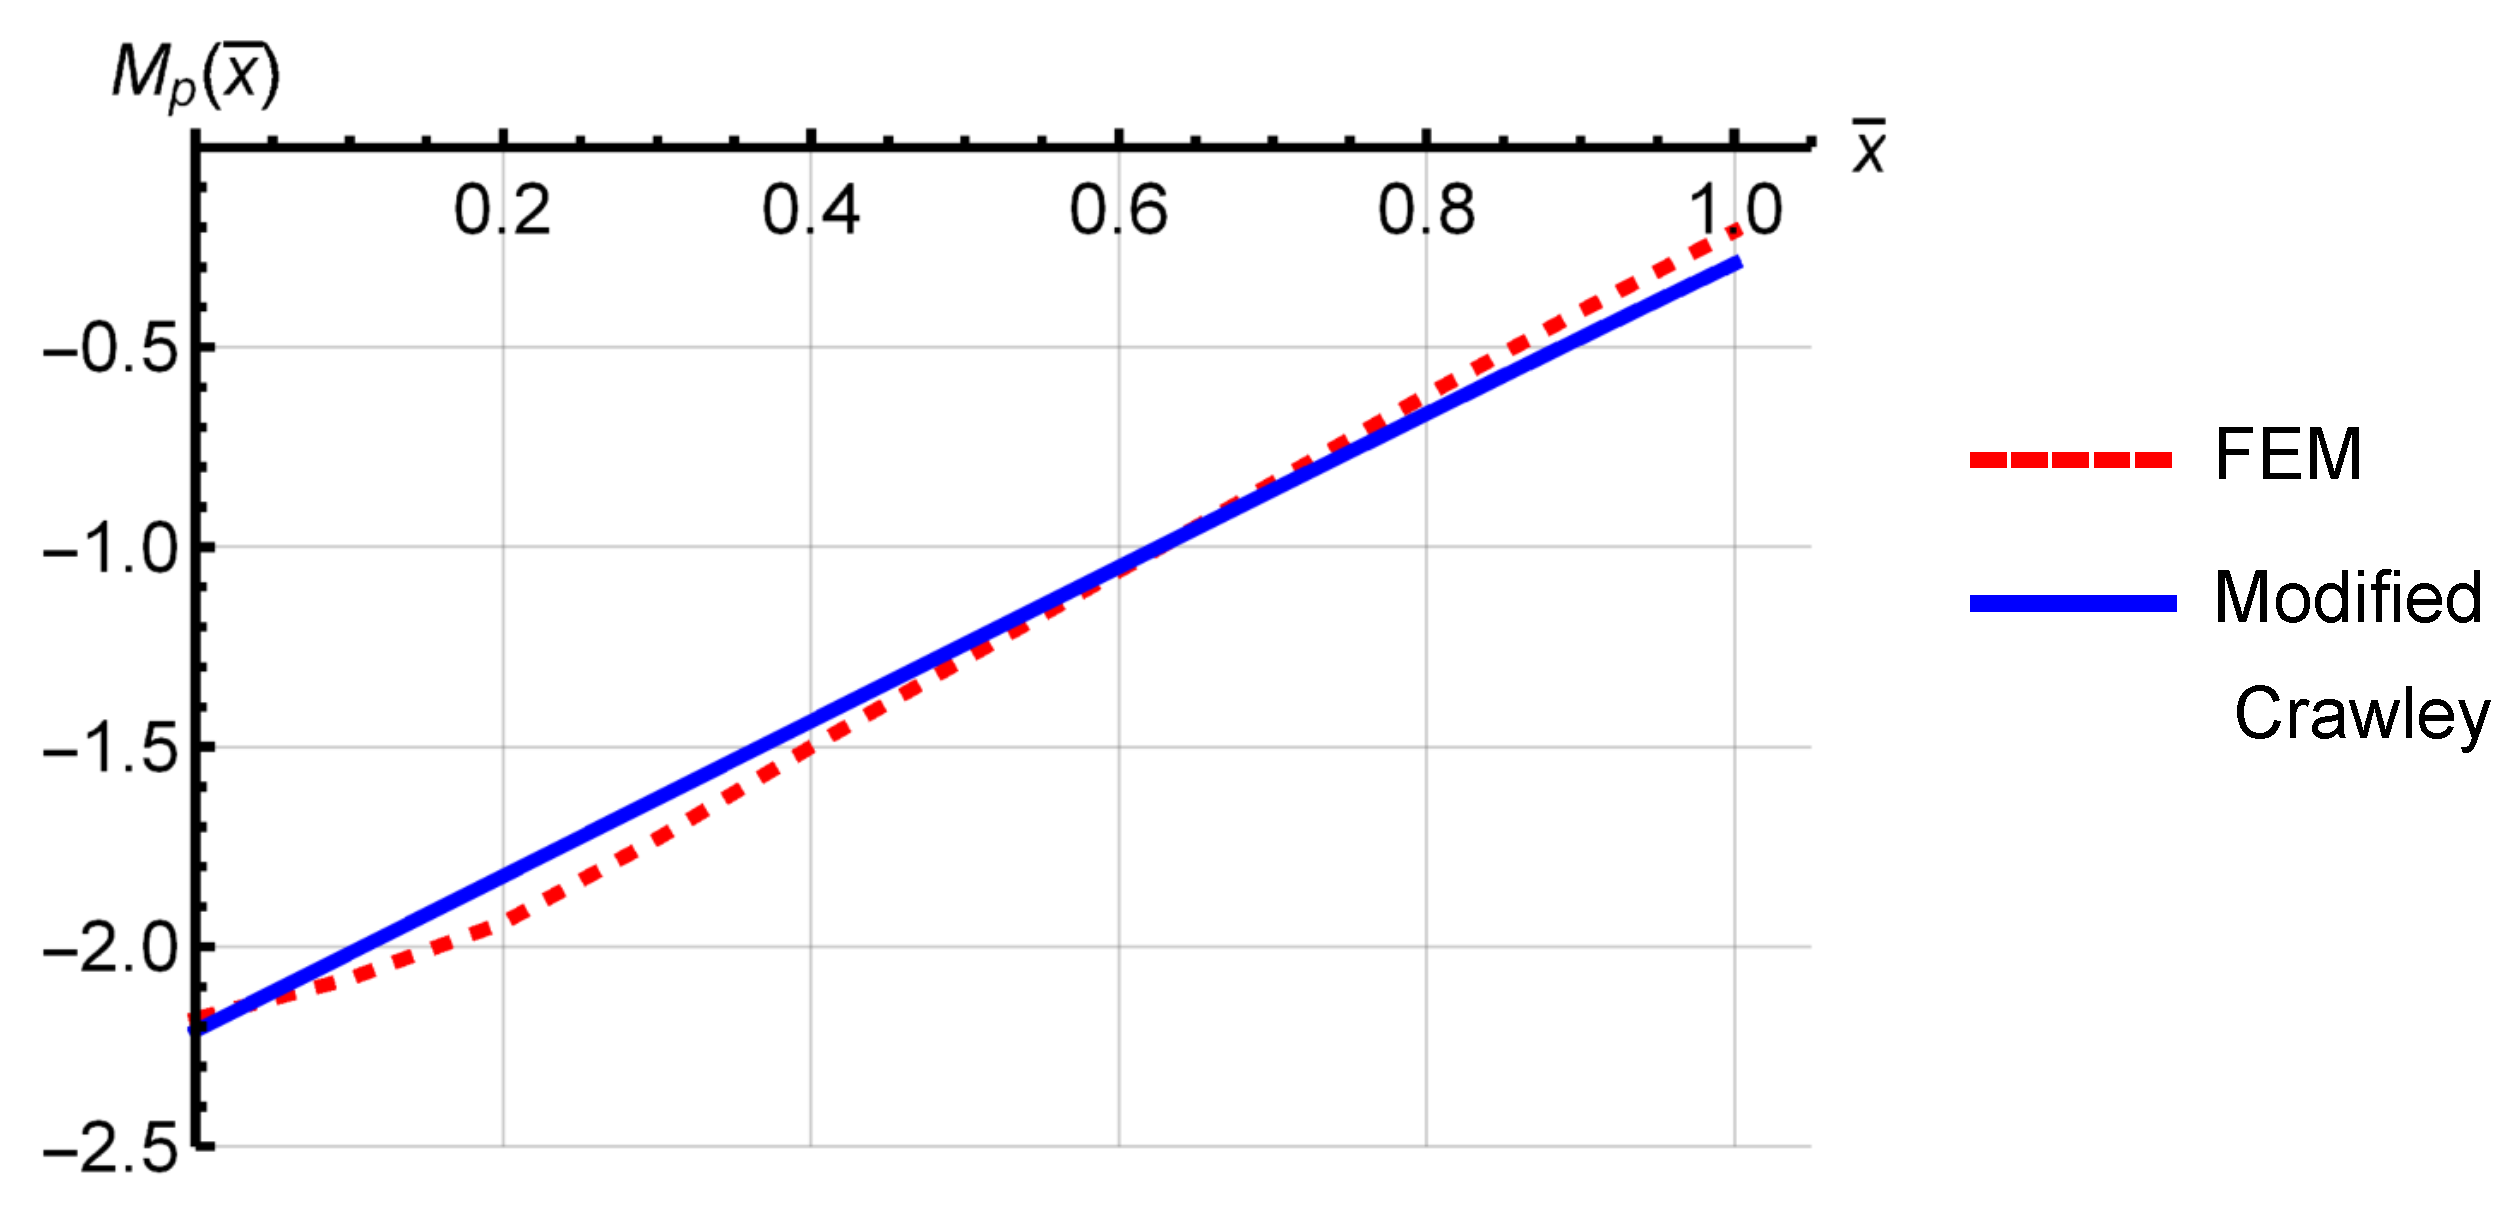
piezoelectric bending moment
T a piezoelectric actuator thickness
T b ( x ) beam thickness
bbeam width
ctapering ratio
wvertical displacement
w virtual vertical displacement
ϕ i ( x ) 
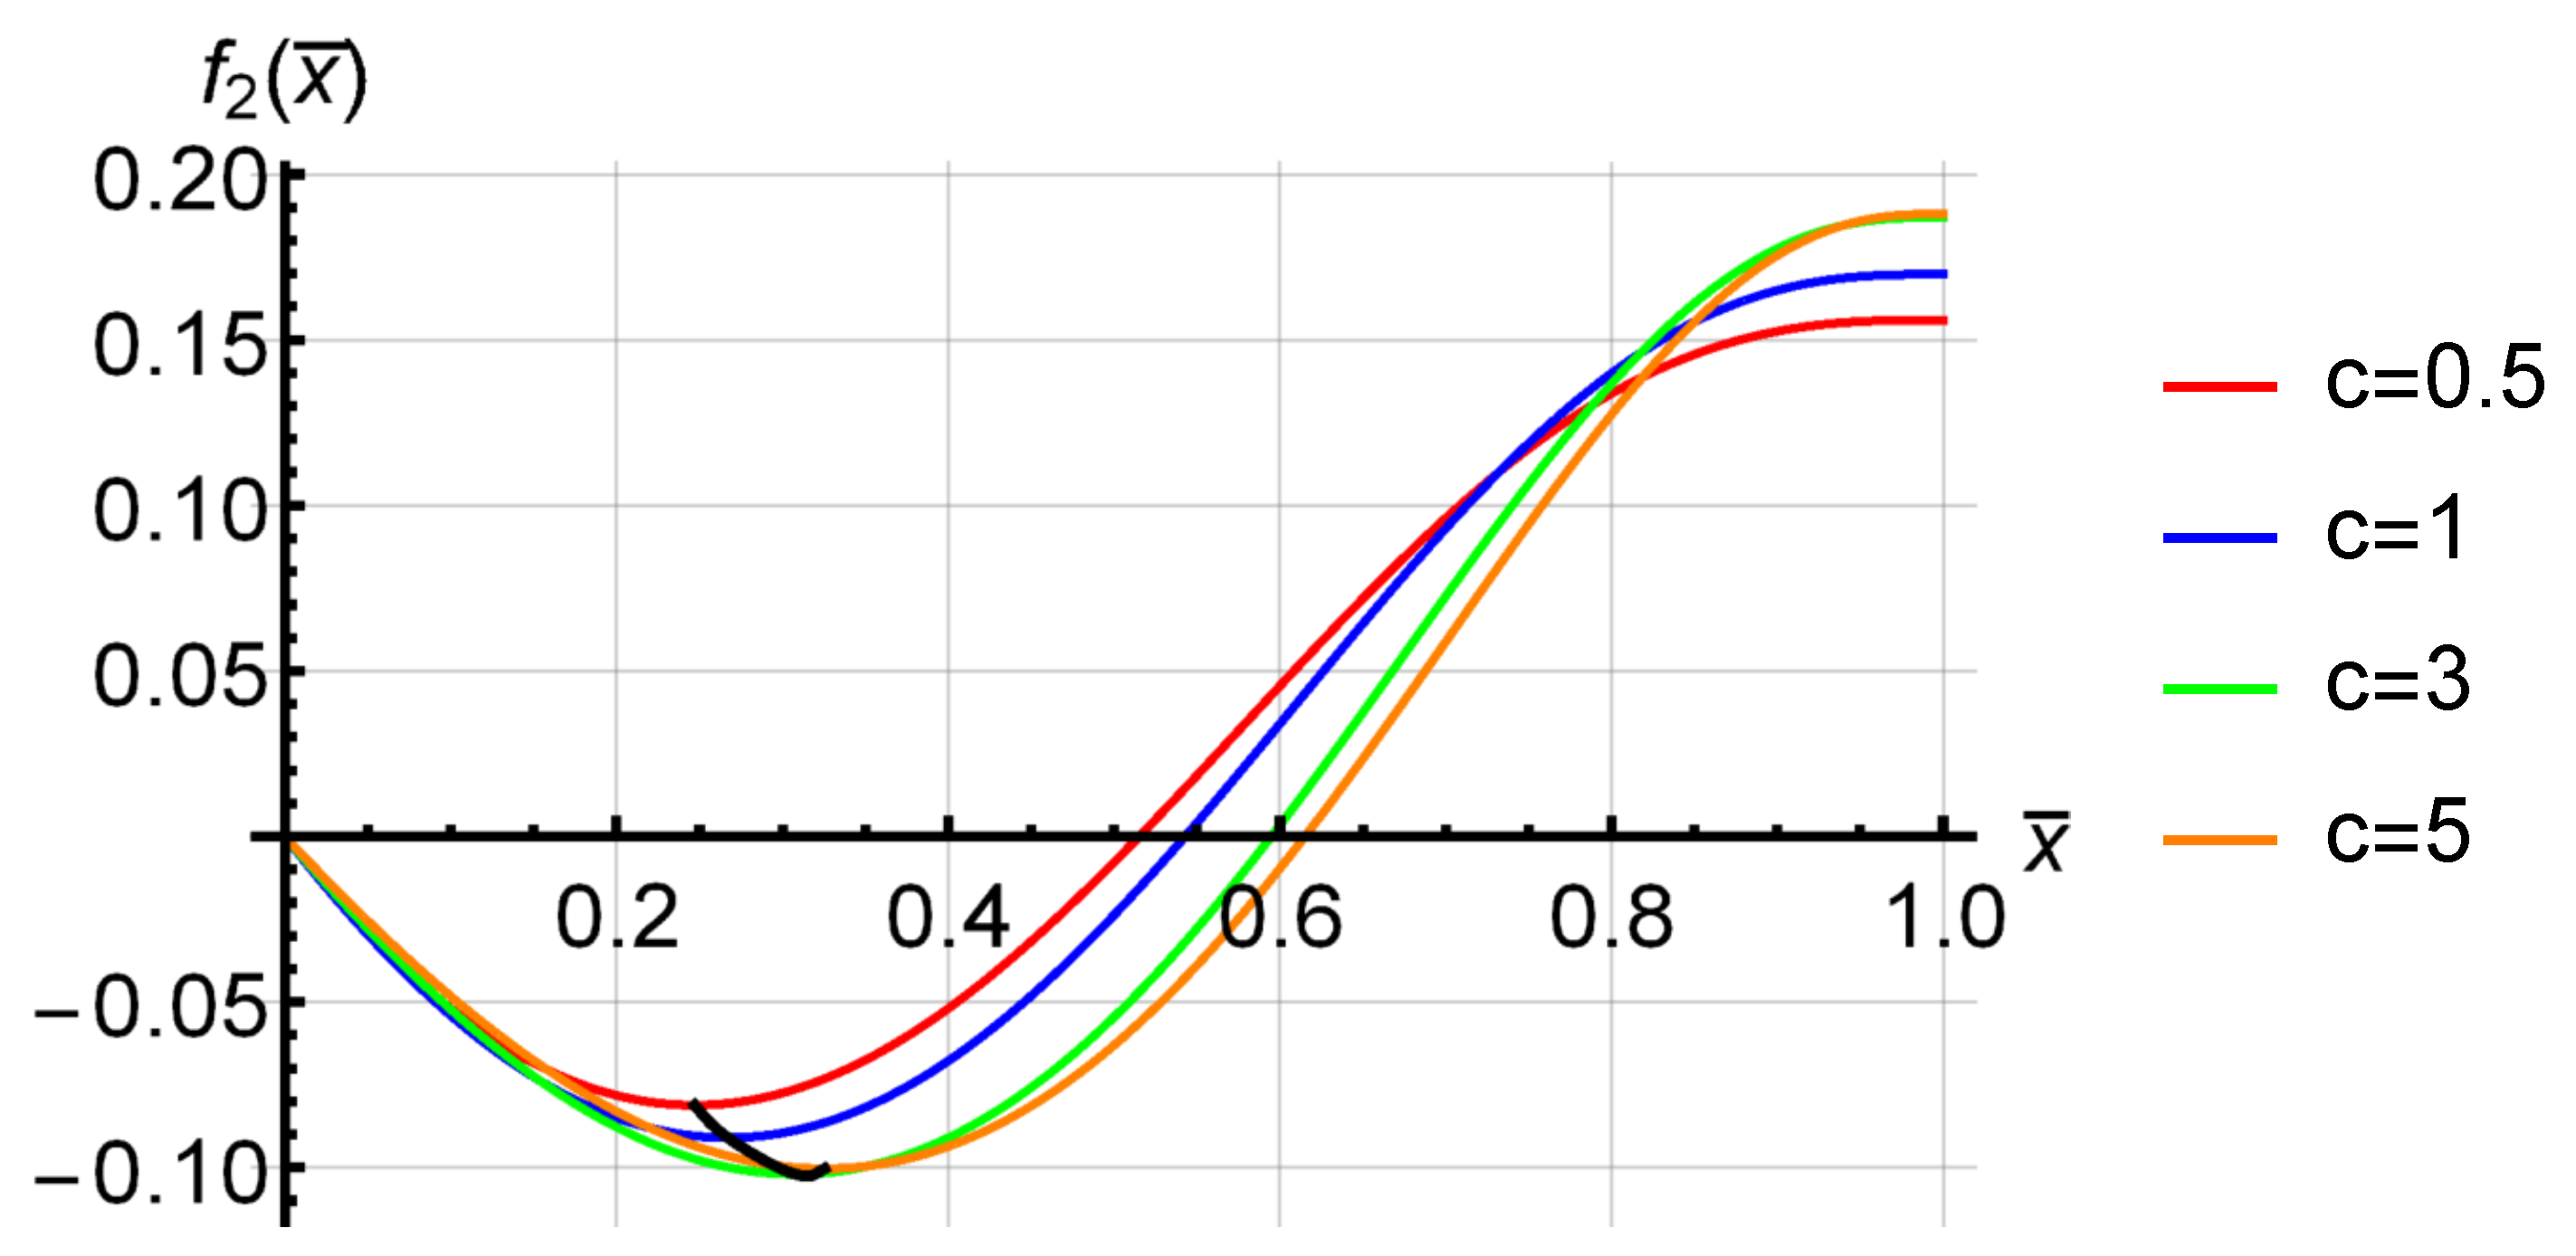
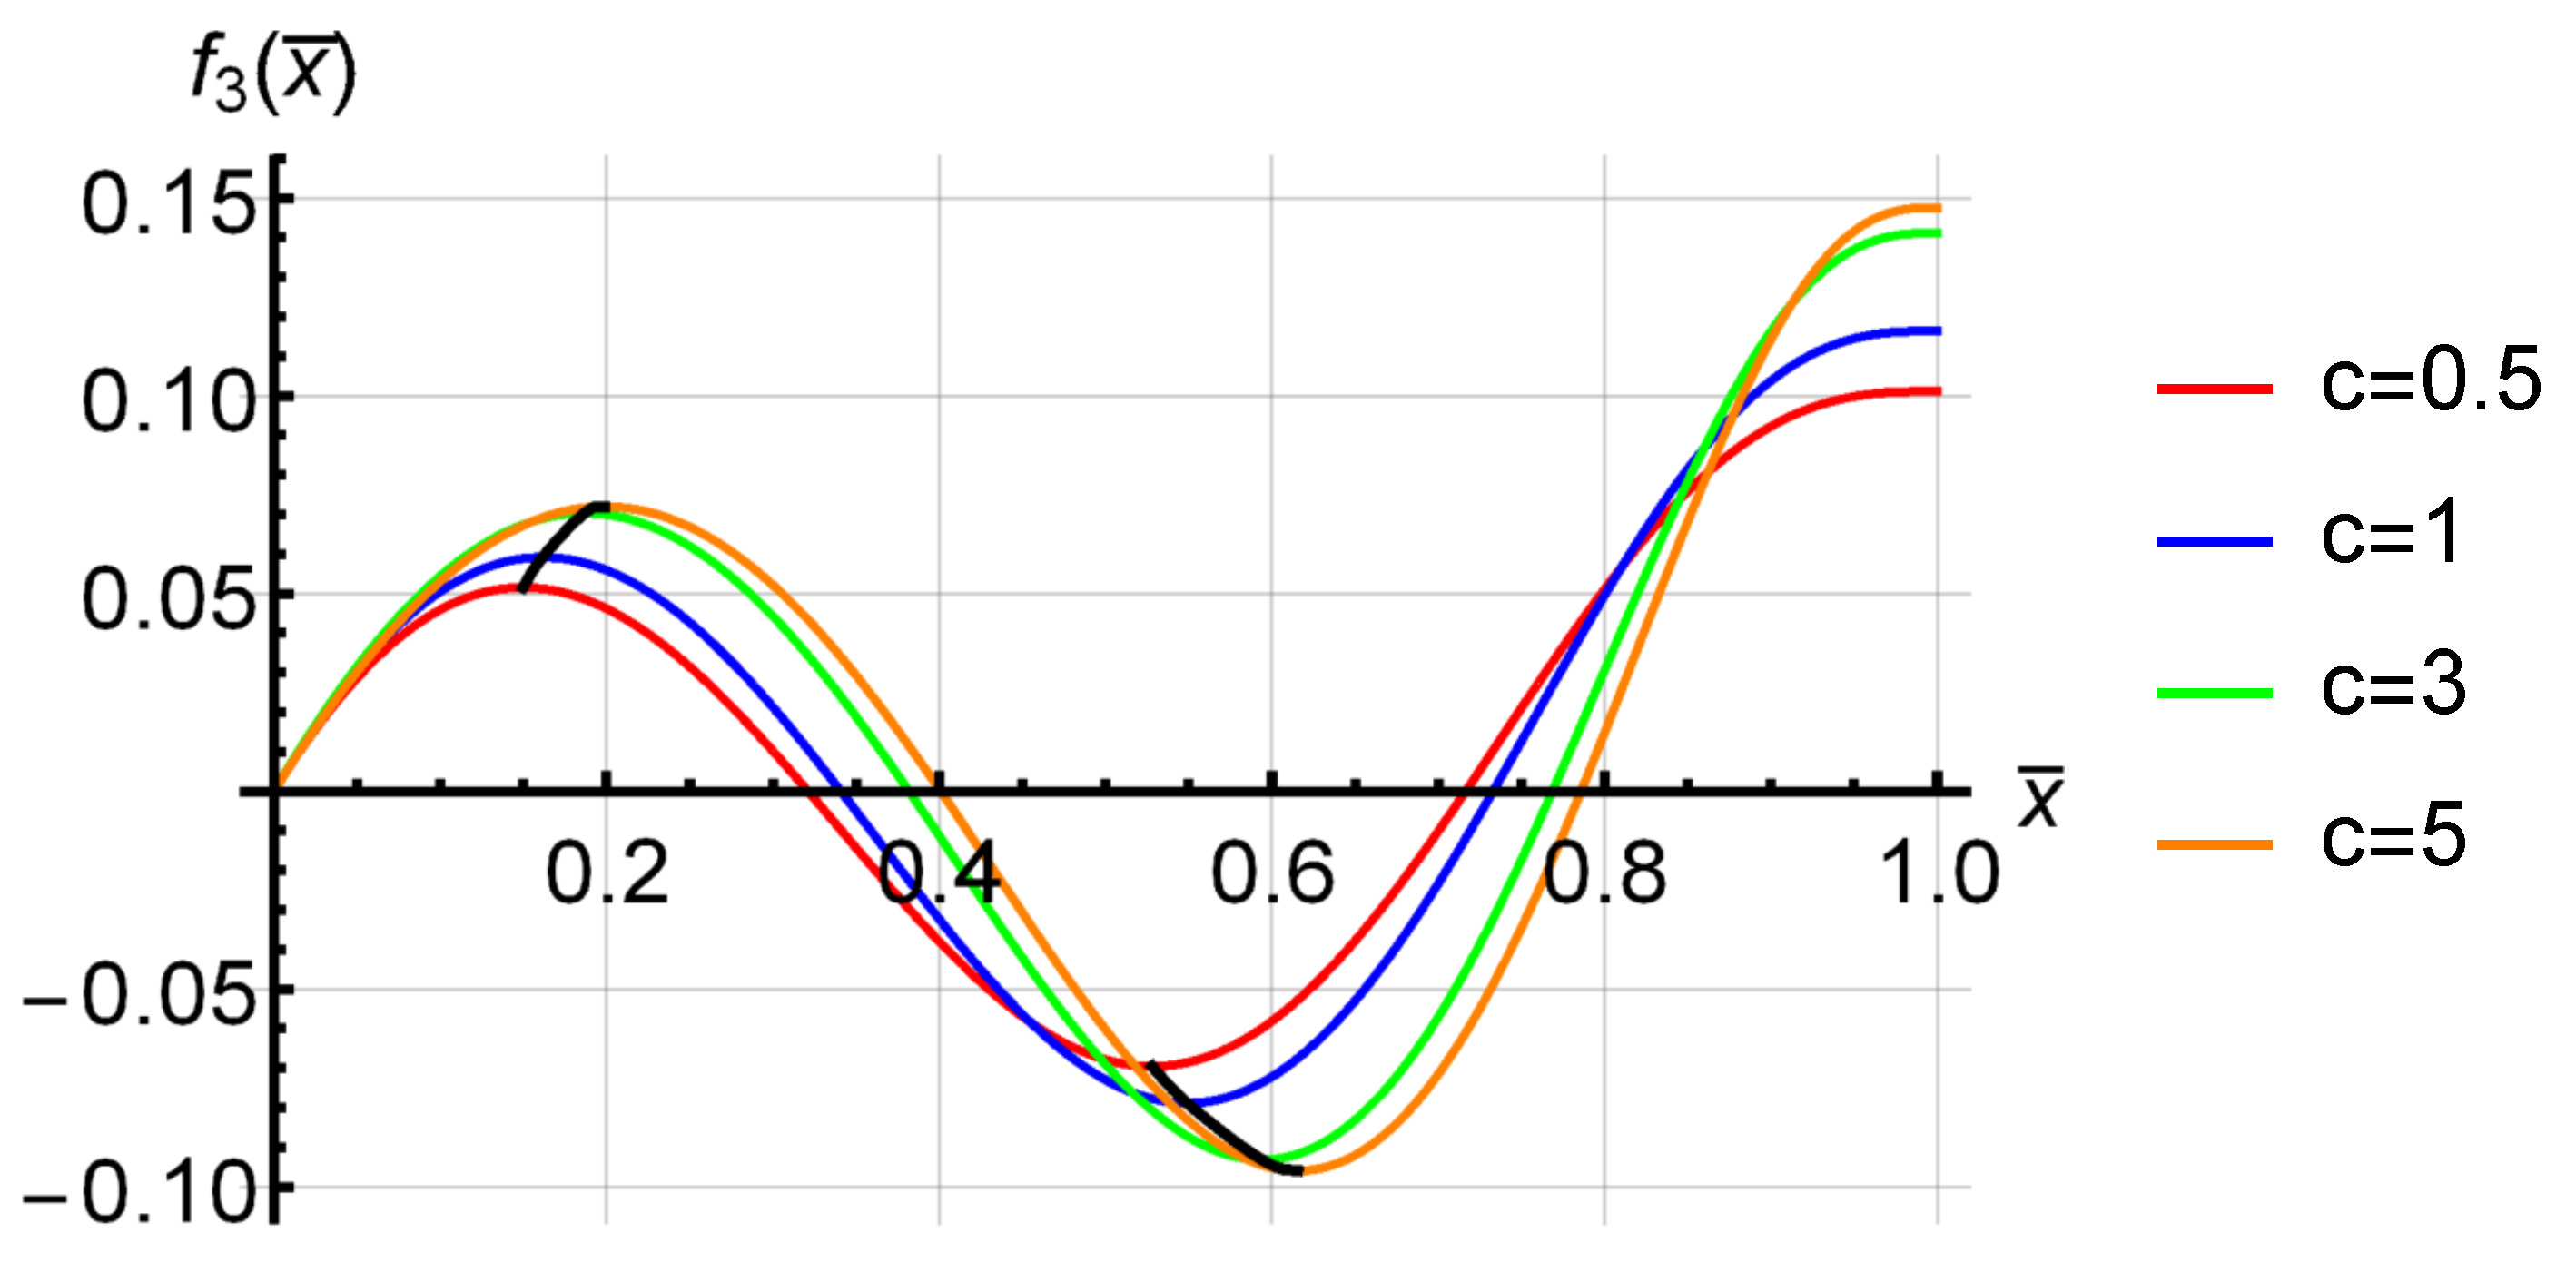
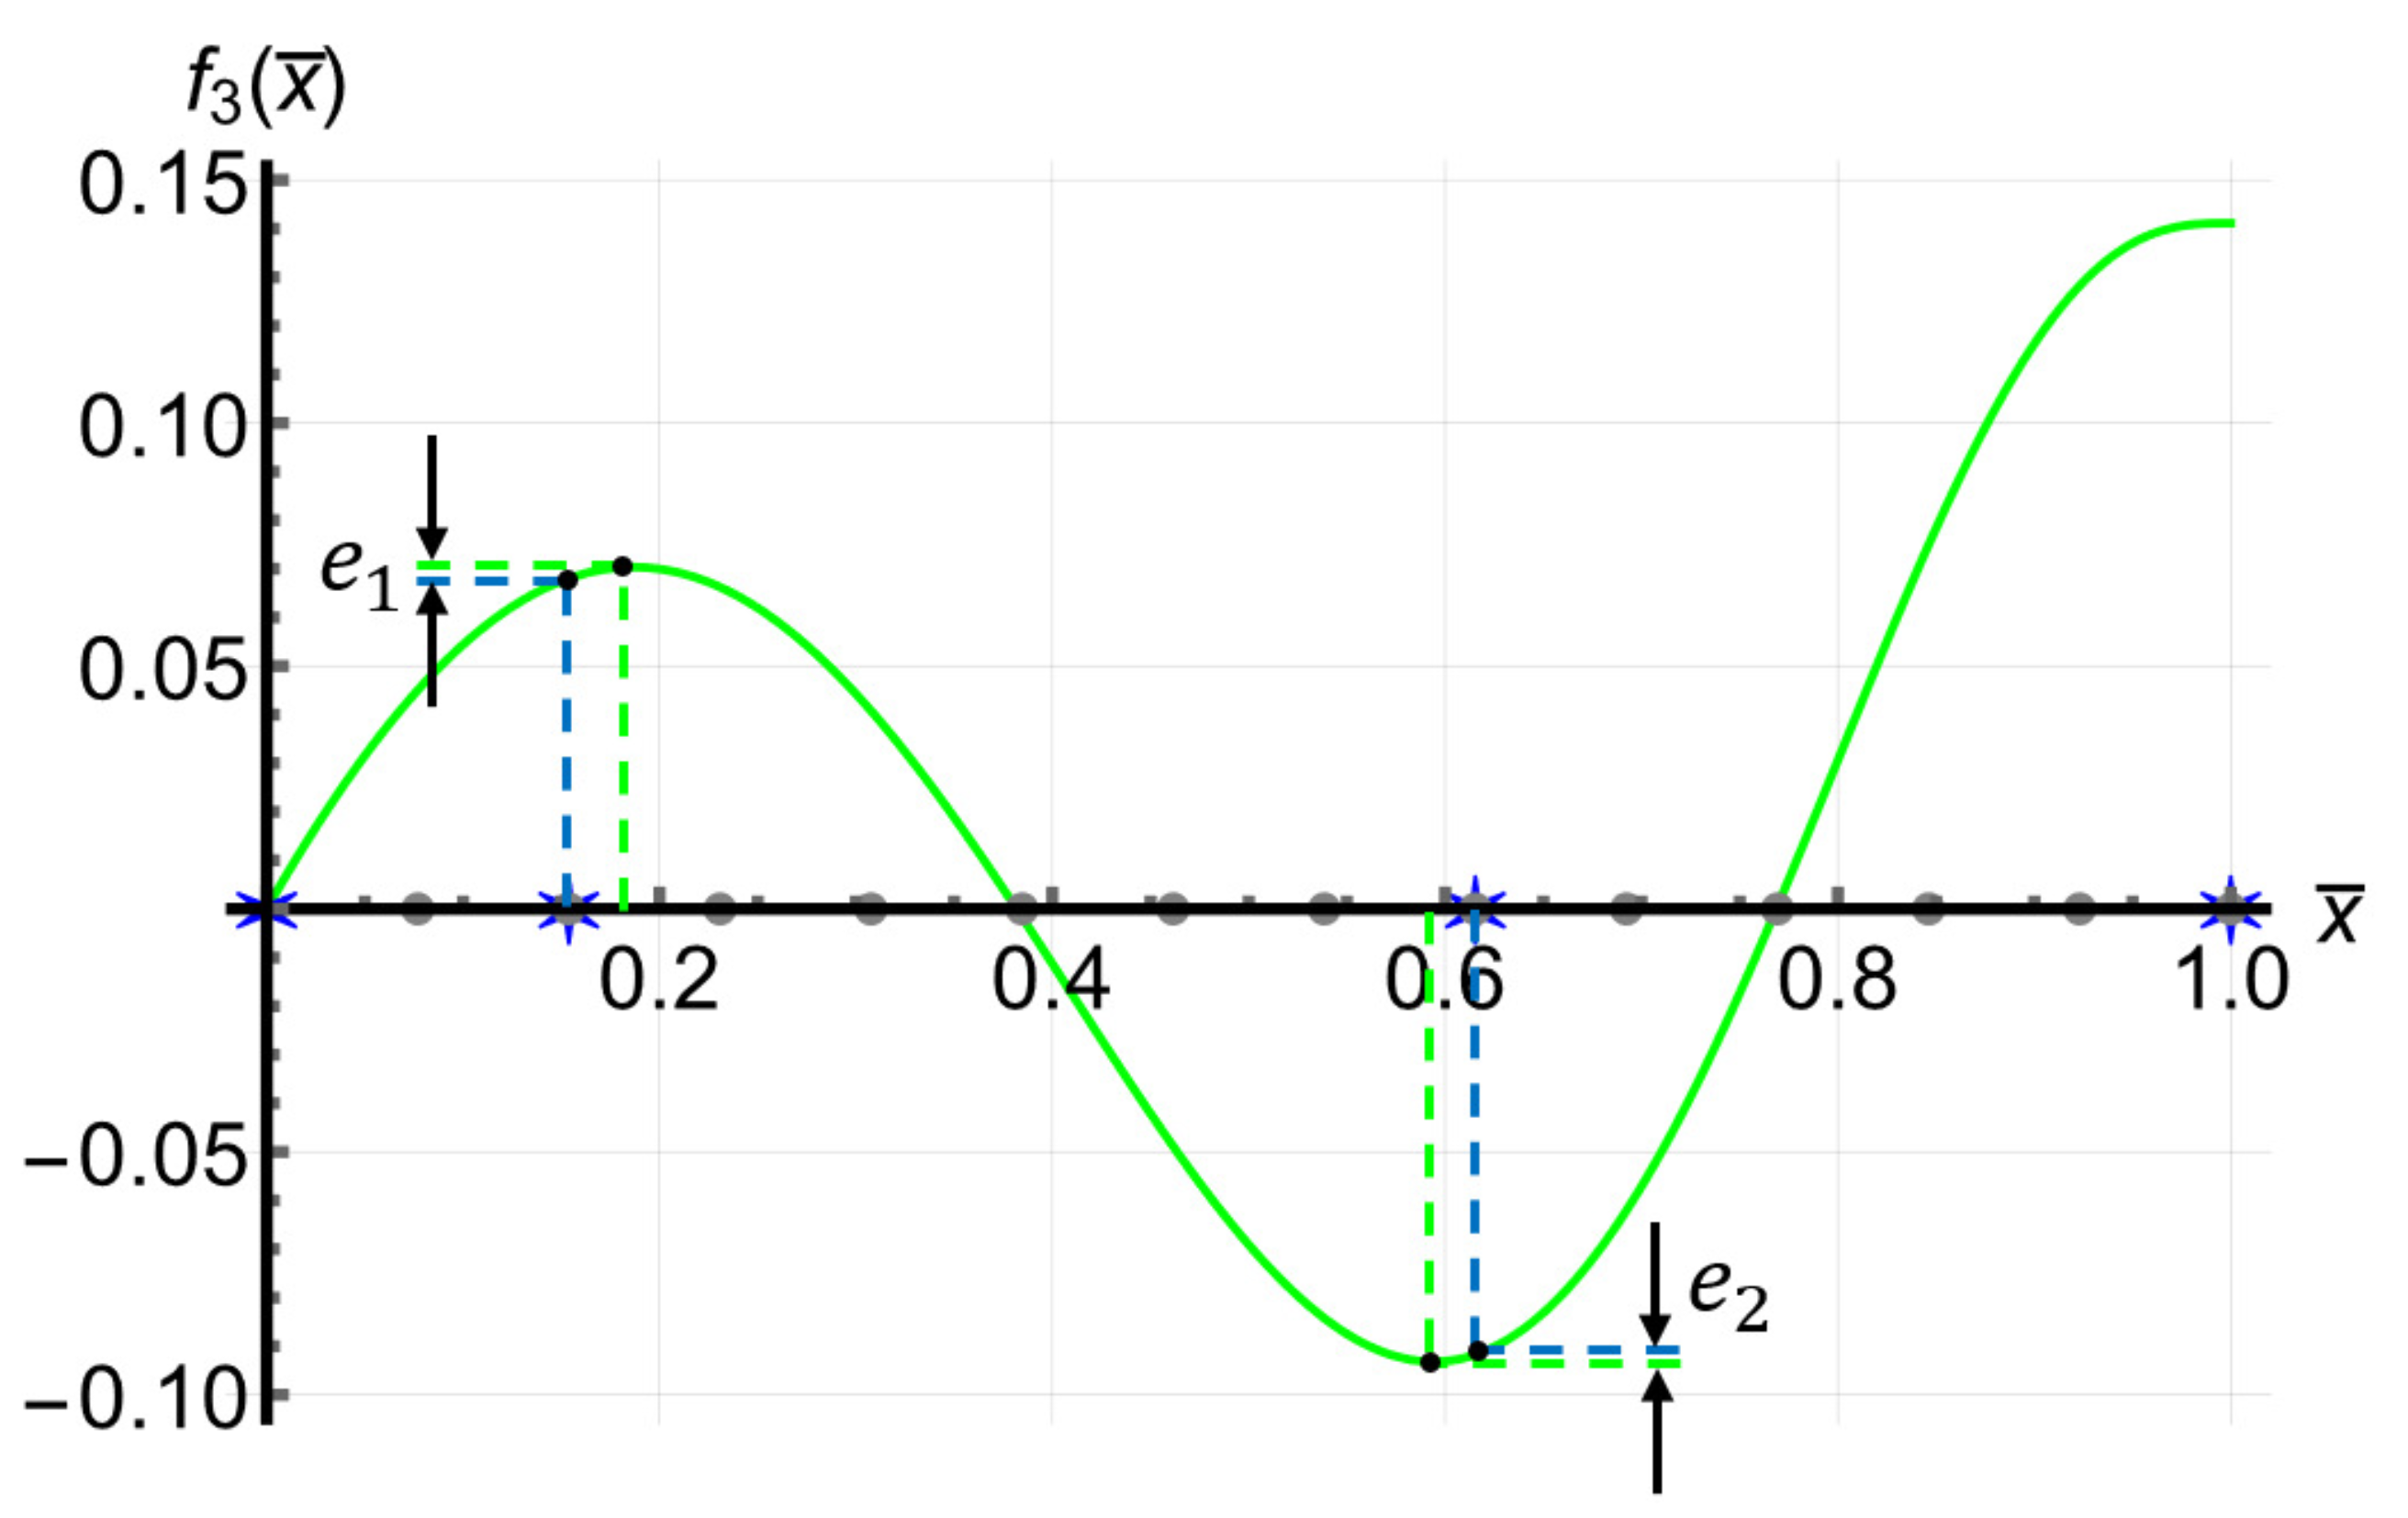
i-th flexural mode of the cantilever beam
x ¯ dimensionless length of the beam: x L b
x i 
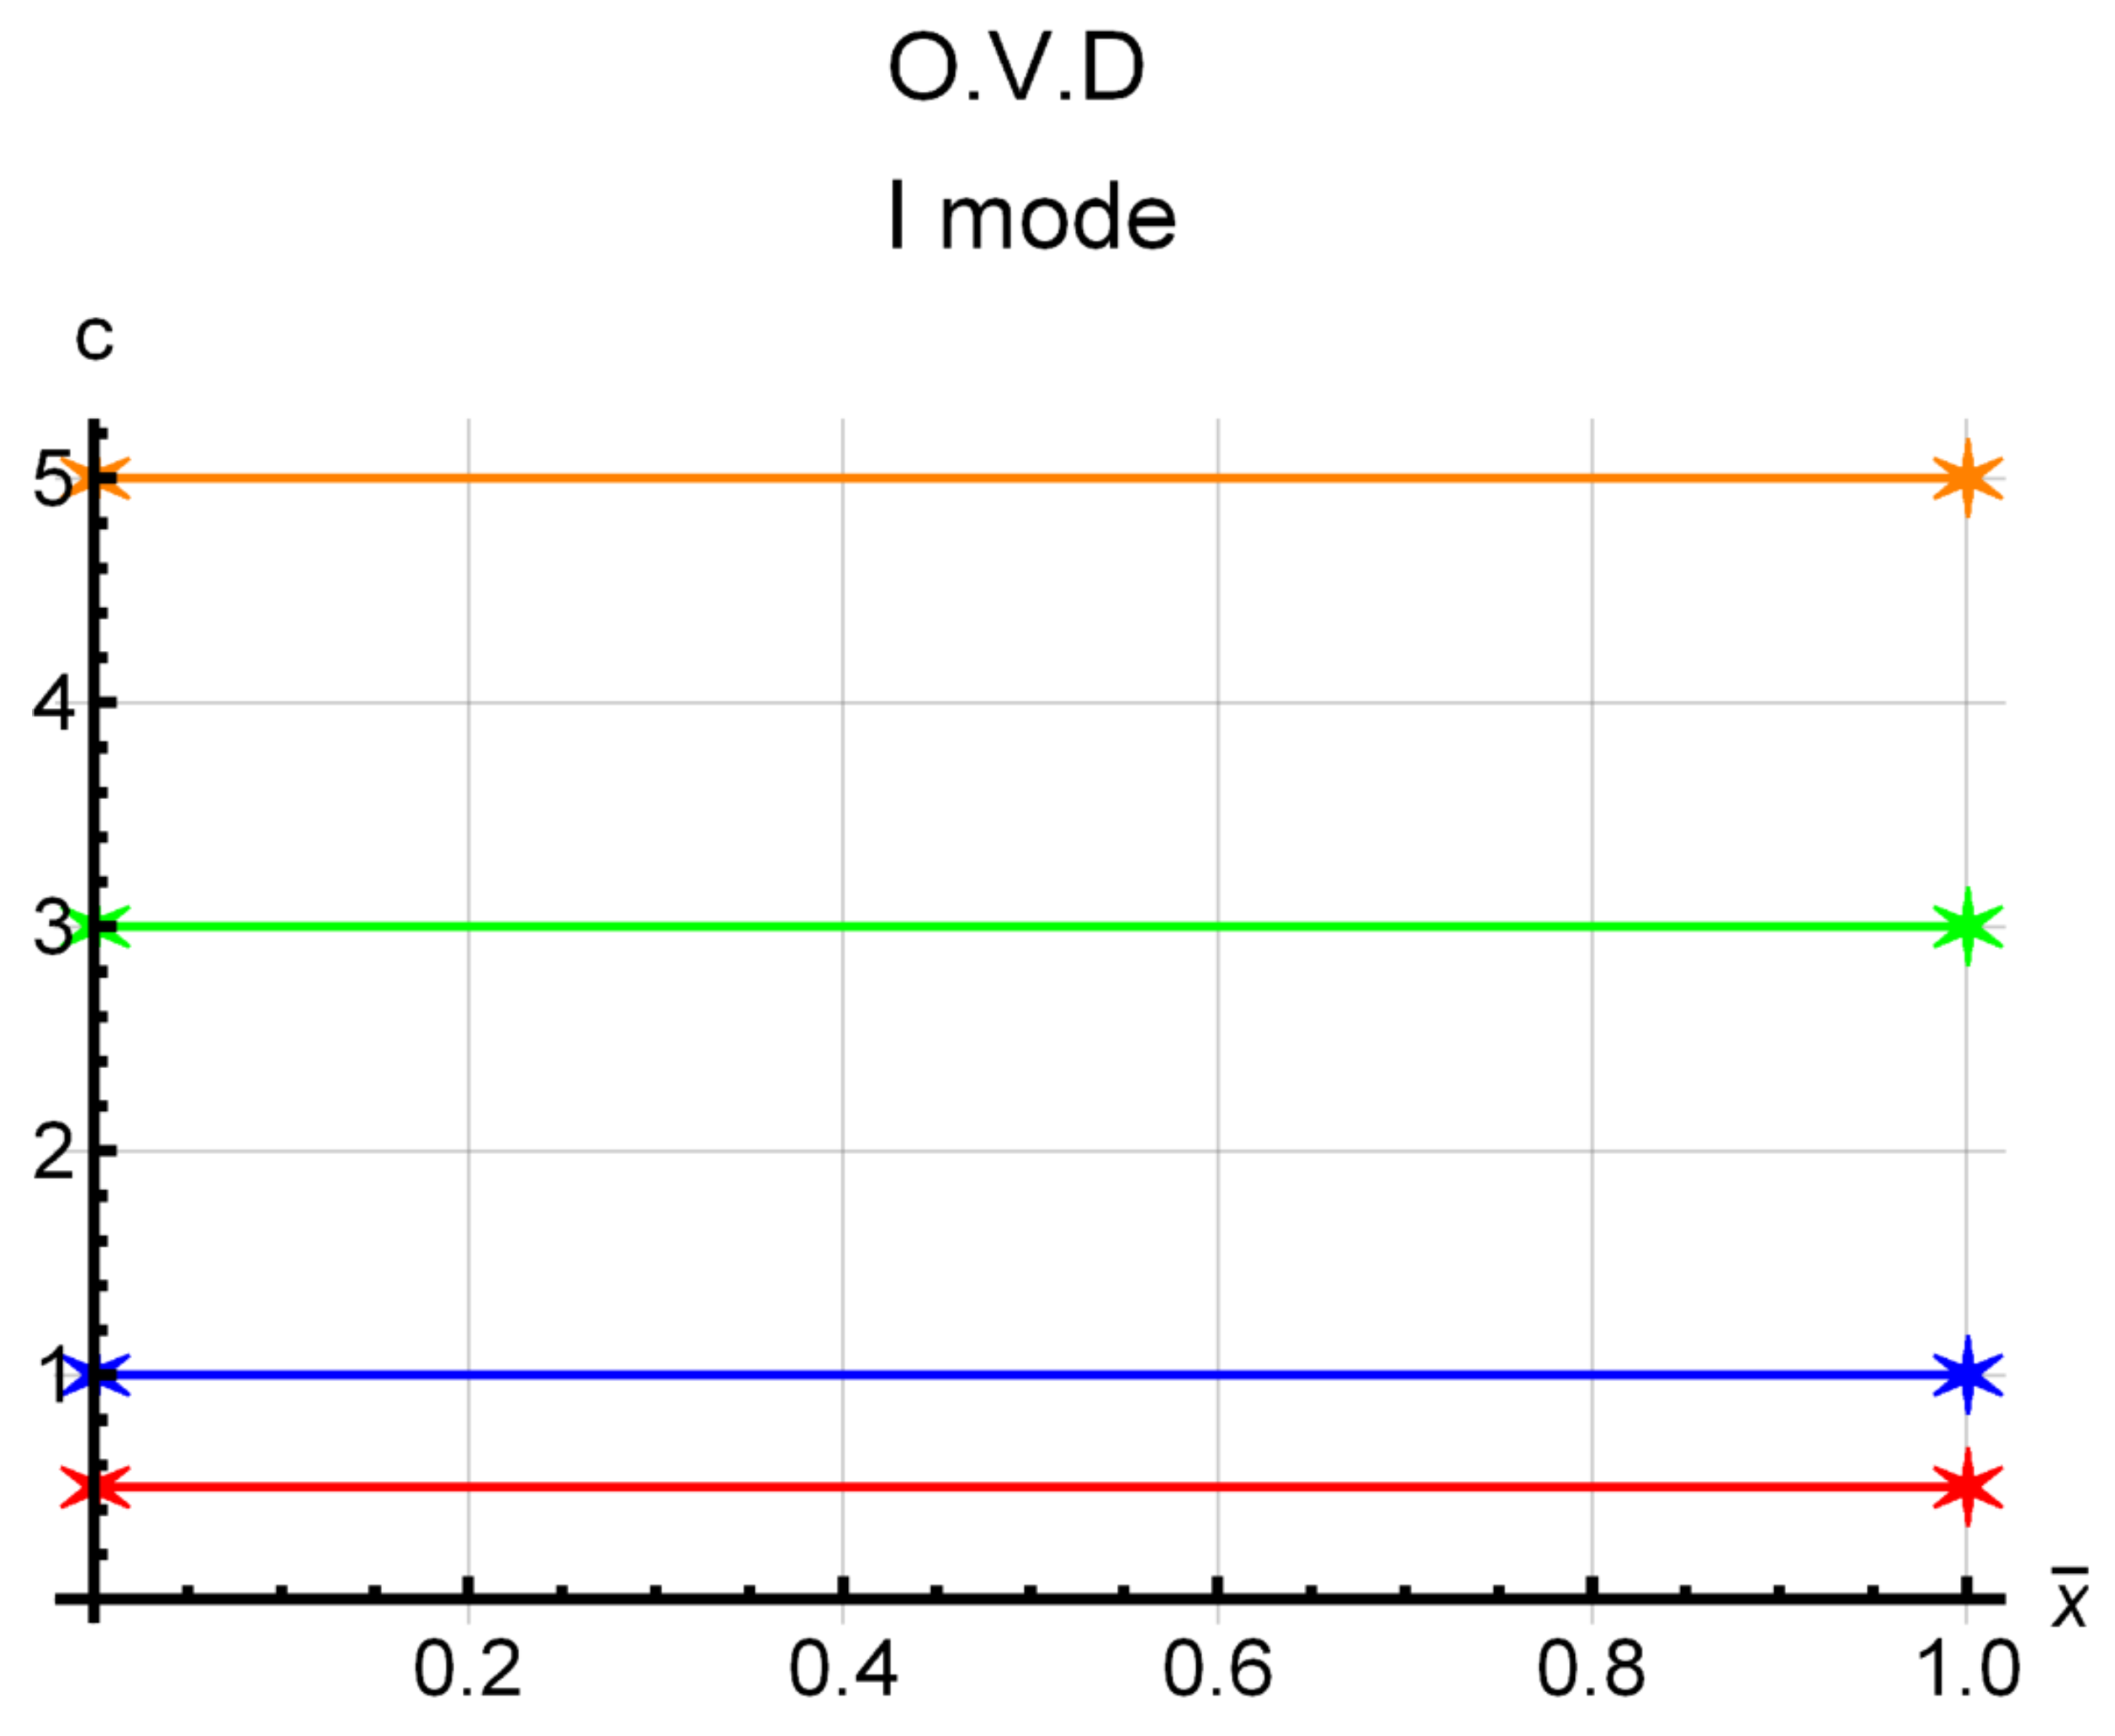
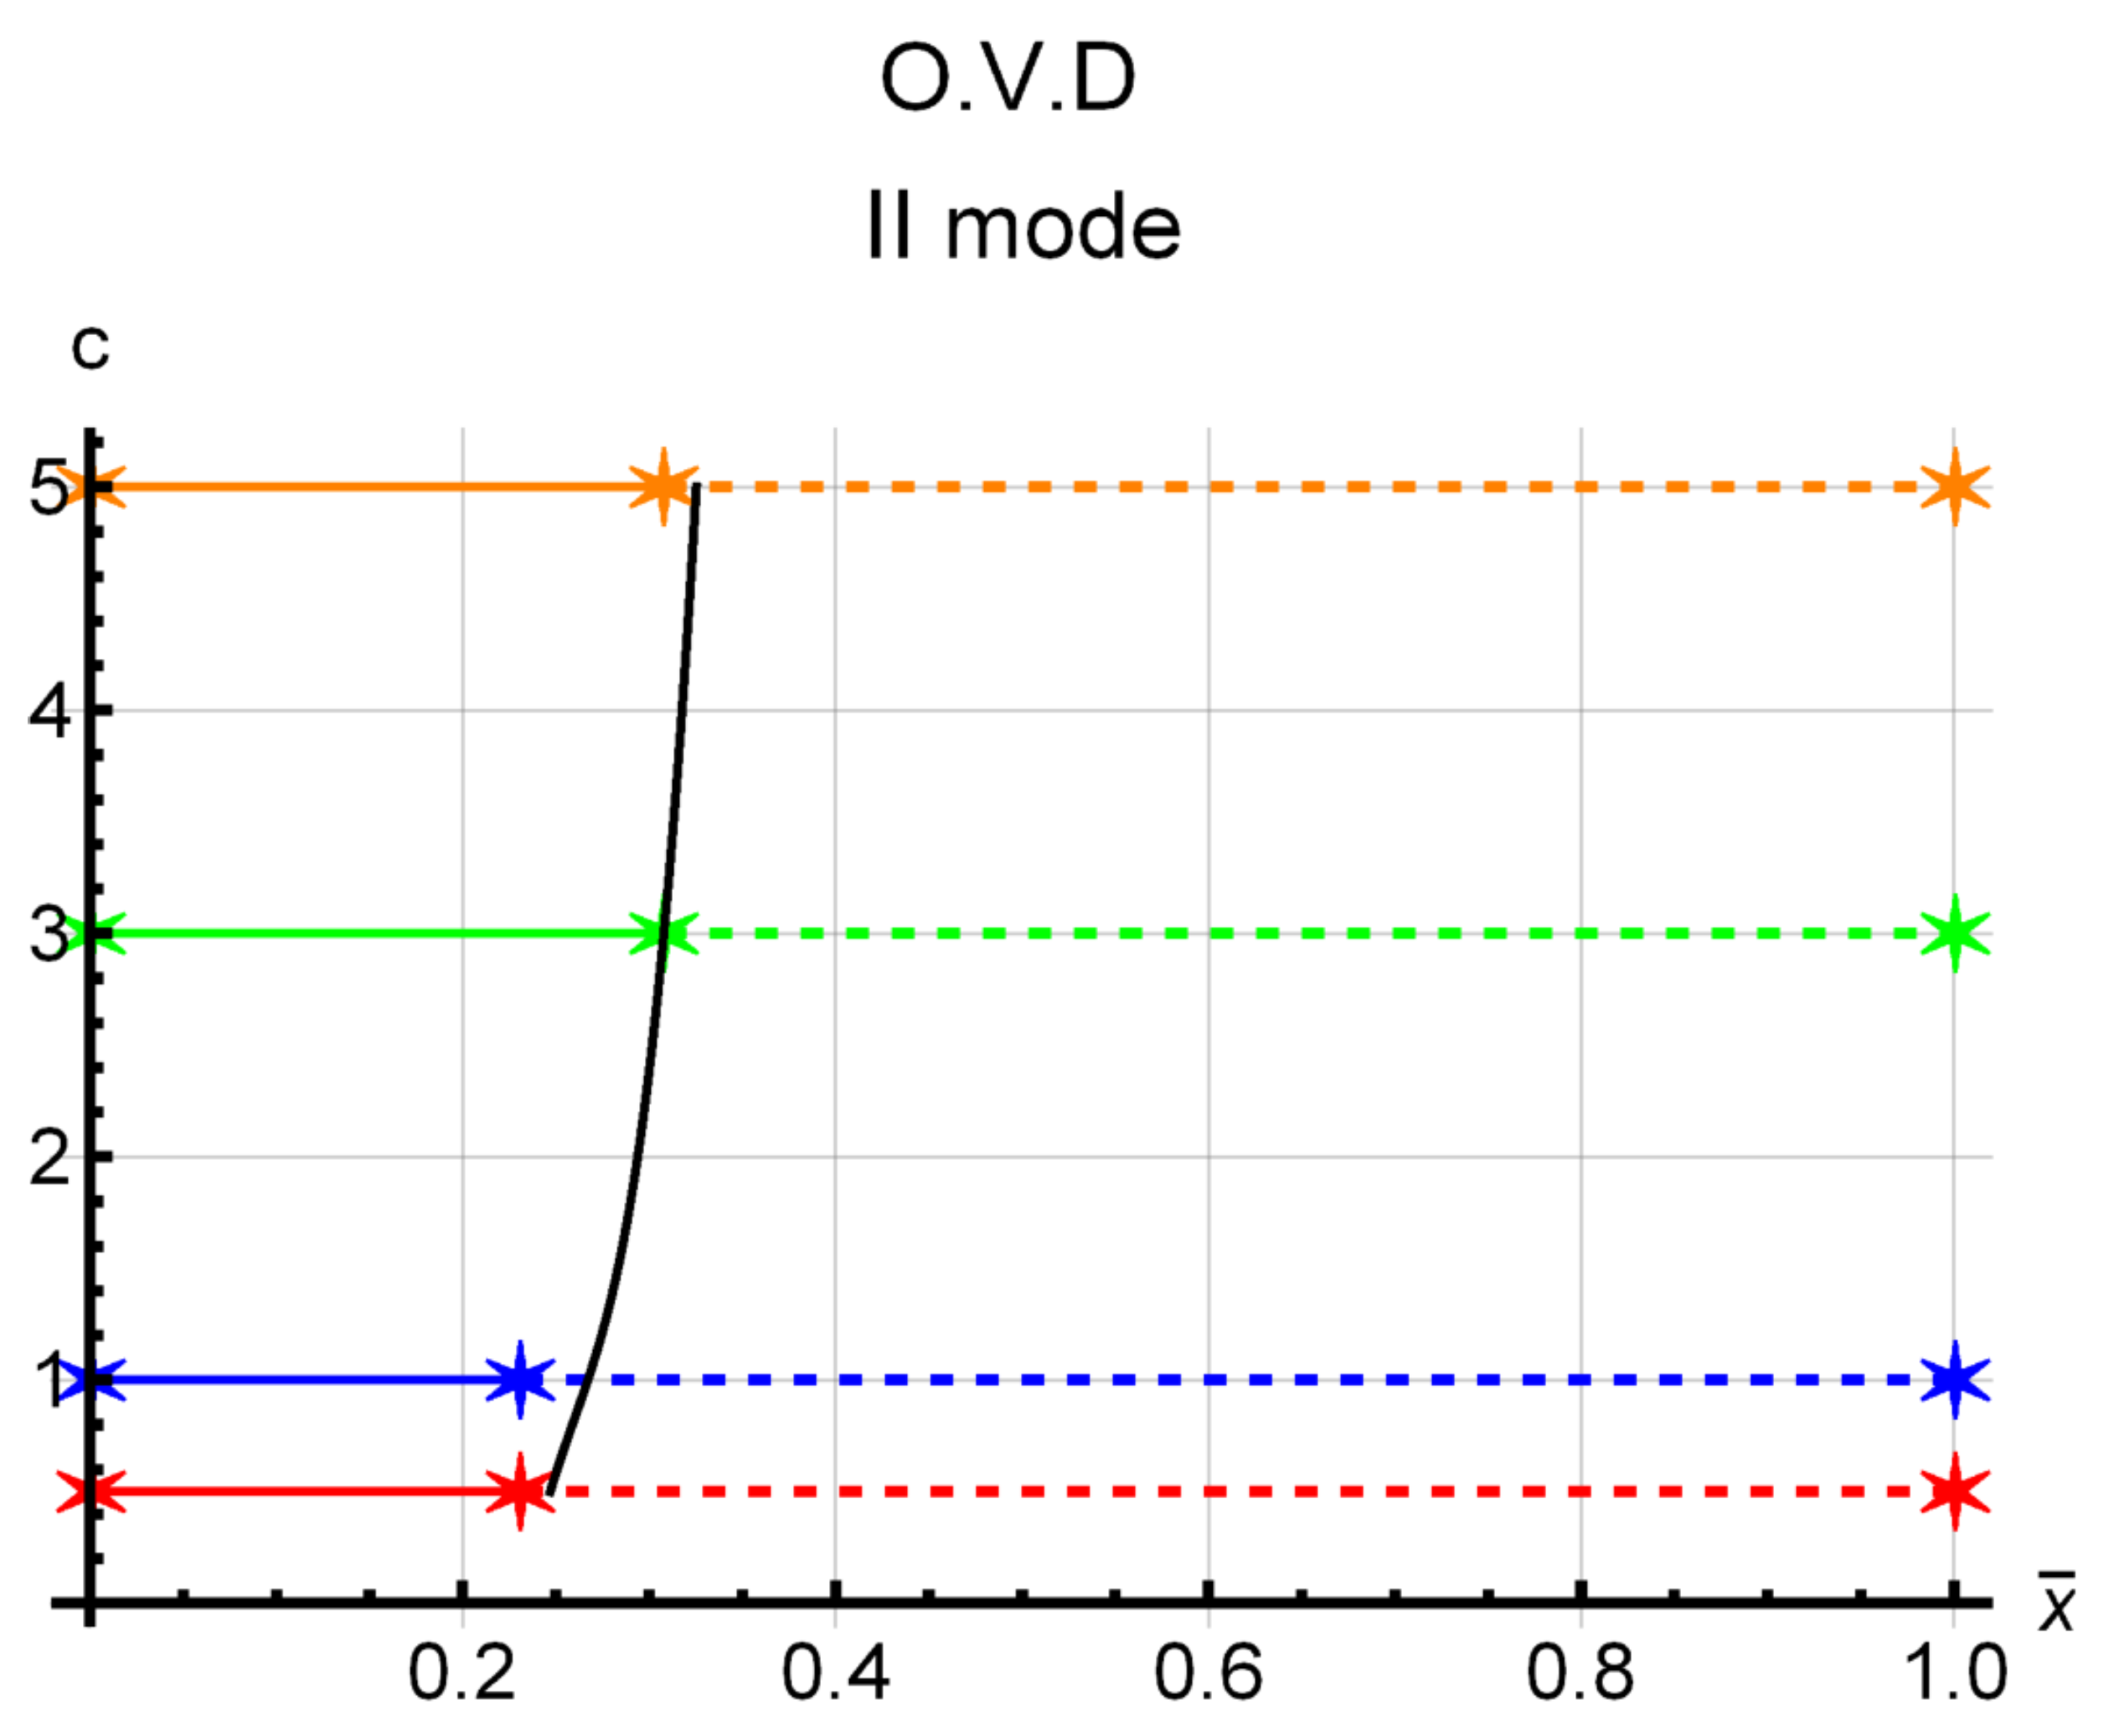
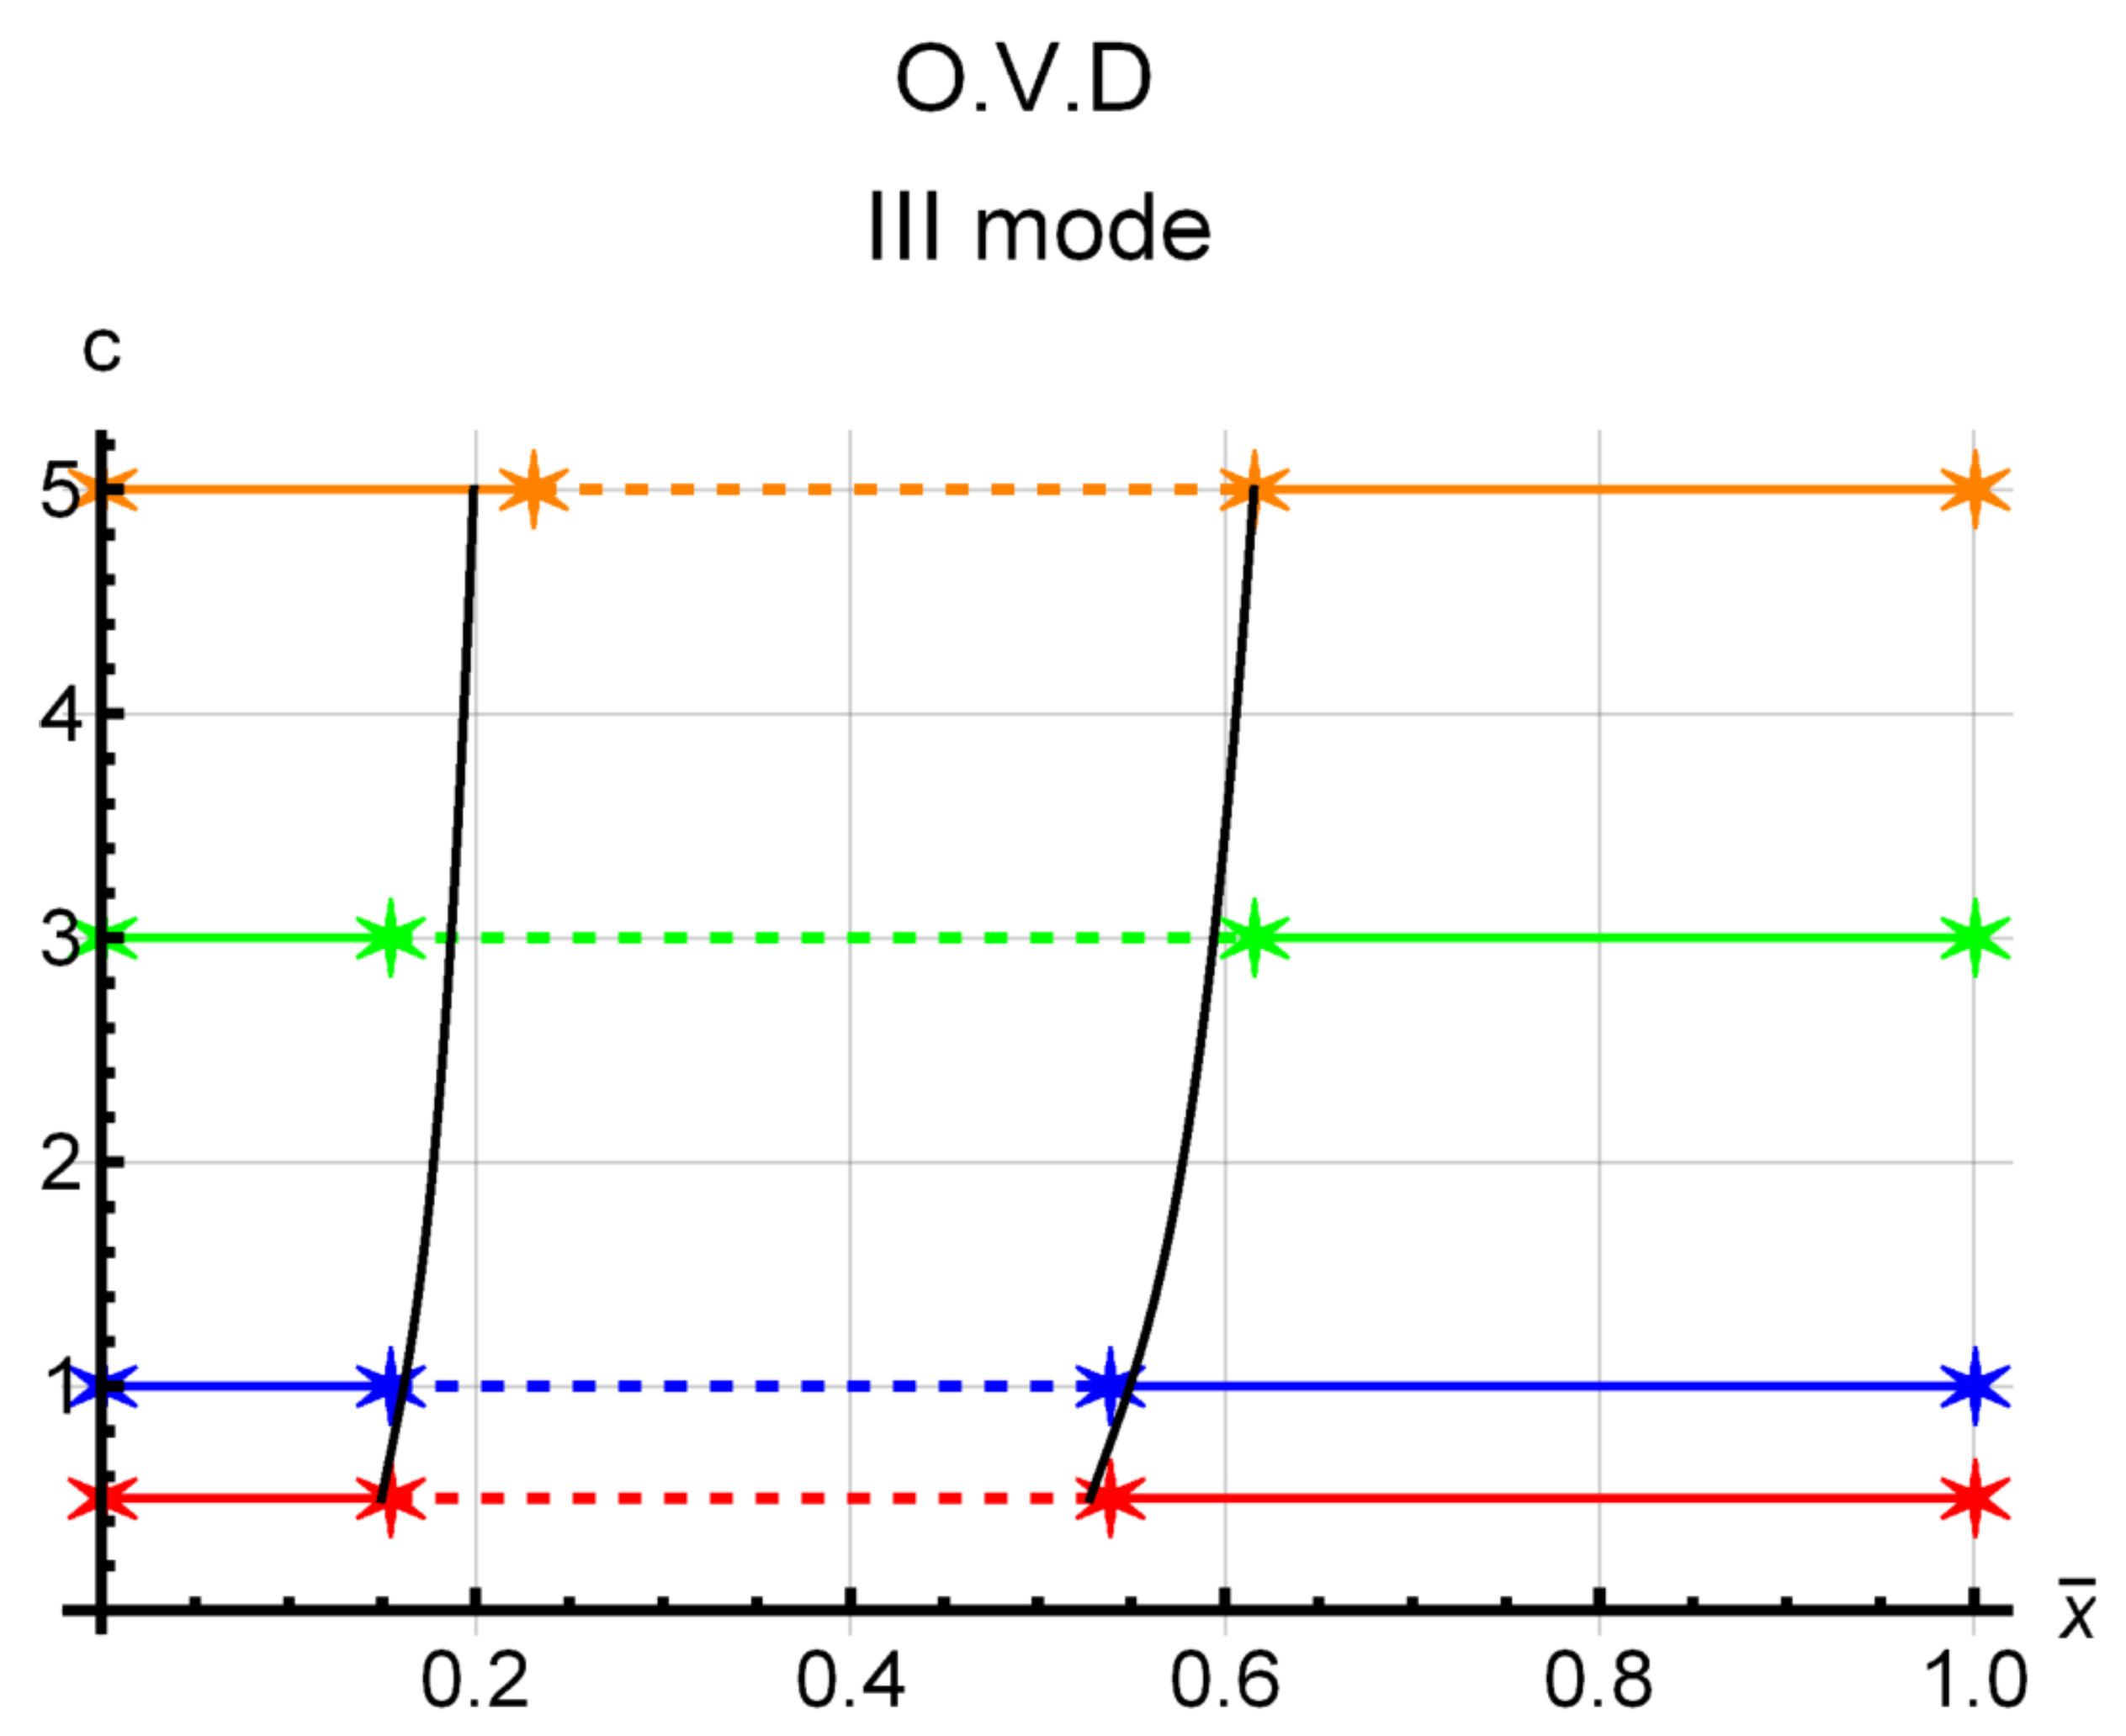
points where the potential changes its sign
derivative with respect to the x-axis

References

  1. Jacob, K.; Tan, A.S.; Sattel, T.; Kohl, M. Enhancement of Shock Absorption Using Hybrid SMA-MRF Damper by Complementary Operation. Actuators 2022, 11, 280. [Google Scholar] [CrossRef]
  2. Wei, L.; Lv, H.; Yang, K.; Ma, W.; Wang, J.; Zhang, W. A Comprehensive Study on the Optimal Design of Magnetorheological Dampers for Improved Damping Capacity and Dynamical Adjustability. Actuators 2021, 10, 64. [Google Scholar] [CrossRef]
  3. Park, Y.H.; Kwon, S.C.; Koo, K.R.; Oh, H.U. High Damping Passive Launch Vibration Isolation System Using Superelastic SMA with Multilayered Viscous Lamina. Aerospace 2021, 8, 201. [Google Scholar] [CrossRef]
  4. Hu, C.; Behdinan, K.; Moradi-Dastjerdi, R. PVDF Energy Harvester for Prolonging the Battery Life of Cardiac Pacemakers. Actuators 2022, 11, 187. [Google Scholar] [CrossRef]
  5. Soozandeh, P.; Poudel, G.; Sarkari, M.; Behdinan, K. Foot Drop Stimulation via Piezoelectric Energy Harvester. Actuators 2022, 11, 174. [Google Scholar] [CrossRef]
  6. Kang, M.G.; Jung, W.S.; Kang, C.Y.; Yoon, S.J. Recent Progress on PZT Based Piezoelectric Energy Harvesting Technologies. Actuators 2016, 5, 5. [Google Scholar] [CrossRef]
  7. Botta, F.; Marx, N.; Gentili, S.; Schwingshackl, C.W.; Mare, L.D.; Cerri, G.; Dini, D. Optimal placement of piezoelectric plates for active vibration control of gas turbine blades: Experimental results. Proc. SPIE 2012, 8345, 83452H. [Google Scholar] [CrossRef]
  8. Mokrani, B.; Bastaits, R.; Romanescu, I.; Horodinca, M.; Burda, I.; Preumont, A. Passive Damping of Rotationally Periodic Structures with Tuned Piezoelectric Inductive Shunt. Actuators 2018, 7, 41. [Google Scholar] [CrossRef]
  9. Rossi, A.; Botta, F.; Giovannelli, A.; Belfiore, N.P. High efficiency active damping on a fan rotor blade in case of resonant vibrations by means of piezoelectric actuators. In Proceedings of the ASME Turbo Expo 2021: Turbomachinery Technical Conference and Exposition, Virtual, 7–11 June 2021; Volume 9A-2021. [Google Scholar] [CrossRef]
  10. Botta, F.; Rossi, A.; Schinaia, L.; Scorza, A.; Orsini, F.; Sciuto, S.A.; Belfiore, N.P. Experimental validation on optimal placement of pzt plates for active beam multimode vibrations reduction. In Proceedings of the AIMETA 2017—Proceedings of the 23rd Conference of the Italian Association of Theoretical and Applied Mechanics, Salerno, Italy, 4–7 September 2017; Volume 3, pp. 2258–2269. [Google Scholar]
  11. Ameduri, S.; Ciminello, M.; Concilio, A.; Dimino, I.; Galasso, B.; Guida, M.; Miceli, M.F.; Riemenschneider, J.; Kalow, S.; Luebker, J.; et al. Whirl Tower Demonstration of an SMA Blade Twist System. Actuators 2022, 11, 141. [Google Scholar] [CrossRef]
  12. Tsai, C.C.; Chu, S.Y.; Chao, W.H.; Hong, C.S. A Rotary-Linear Ultrasonic Motor Using MnO2-Doped (Ba0.97Ca0.03)(Ti0.96Sn0.005Hf0. 035)O3 Lead-Free Piezoelectric Ceramics with Improved Curie Temperature and Temperature Stability. Actuators 2022, 11, 248. [Google Scholar] [CrossRef]
  13. Mizuno, A.; Kajiwara, H.; Tamura, H.; Aoyagi, M. Study on Multidegree-of-Freedom Ultrasonic Motor Using Vibration Mode Rotation of Metal Spherical Stator. Actuators 2022, 11, 27. [Google Scholar] [CrossRef]
  14. Li, T.; Lee, P. Piezoelectric Energy Harvesting with an Ultrasonic Vibration Source. Actuators 2019, 8, 8. [Google Scholar] [CrossRef]
  15. Aabid, A.; Parveez, B.; Raheman, M.A.; Ibrahim, Y.E.; Anjum, A.; Hrairi, M.; Parveen, N.; Zayan, J.M. A Review of Piezoelectric Material-Based Structural Control and Health Monitoring Techniques for Engineering Structures: Challenges and Opportunities. Actuators 2021, 10, 101. [Google Scholar] [CrossRef]
  16. Goltz, I.; Böhmer, H.; Nollau, R.; Belz, J.; Grüber, B.; Seume, J. Piezo-Electric Actuation of Rotor Blades in an Axial Compressor. In Proceedings of the ETC 2009—8th European Conference on Turbomachinery, Graz, Austria, 23–27 March 2009. [Google Scholar]
  17. Choi, B.; Morrison, C.; Duffy, K. An Active Damping at Blade Resonances Using Piezoelectric Transducers. NASA/TM-2008-215212. 2008. Available online: https://ntrs.nasa.gov/api/citations/20080023308/downloads/20080023308.pdf (accessed on 5 September 2021).
  18. Choi, B.; Kauffman, J.; Duffy, K.; Provenza, A.; Morrison, C. Active Vibration Reduction of Titanium Alloy Fan Blades (FAN1) Using Piezoelectric Materials. NASA/TM-2010-216335. 2010. Available online: https://ntrs.nasa.gov/citations/20100024330 (accessed on 18 June 2020).
  19. Provenza, A.J.; Morrison, C.R. Control of Fan Blade Vibrations Using Piezoelectrics and Bi-Directional Telemetry. In Proceedings of the ASME 2011 Turbo Expo: Turbine Technical Conference and Exposition, Vancouver, BC, Canada, 6–10 June 2011; pp. 923–930. [Google Scholar] [CrossRef]
  20. Botta, F.; Rossi, A.; Belfiore, N.P. A novel method to fully suppress single and bi-modal excitations due to the support vibration by means of piezoelectric actuators. J. Sound Vib. 2021, 510, 116260. [Google Scholar] [CrossRef]
  21. Crawley, E.F.; de Luis, J. Use of piezoelectric actuators as elements of intelligent structures. AIAA J. 1987, 25, 1373–1385. [Google Scholar] [CrossRef]
  22. Ducarne, J.; Thomas, O.; Deü, J. Placement and dimension optimization of shunted piezoelectric patches for vibration reduction. J. Sound Vib. 2012, 331, 3286–3303. [Google Scholar] [CrossRef]
  23. Botta, F.; Toccaceli, F. Piezoelectric plates distribution for active control of torsional vibrations. Actuators 2018, 7, 23. [Google Scholar] [CrossRef]
  24. Botta, F.; Scorza, A.; Rossi, A. Optimal Piezoelectric Potential Distribution for Controlling Multimode Vibrations. Appl. Sci. 2018, 8, 551. [Google Scholar] [CrossRef] [Green Version]
  25. Migliaccio, G.; Ruta, G. The influence of an initial twisting on tapered beams undergoing large displacements. Meccanica 2021, 56, 1831–1845. [Google Scholar] [CrossRef]
  26. Migliaccio, G.; Ruta, G. Rotor blades as curved, twisted and tapered beam-like structures subjected to large deflections. Eng. Struct. 2020, 222, 111089. [Google Scholar] [CrossRef]
  27. Balzarek, C.; Kalow, S.; Riemenschneider, J.; Rivero, A. Manufacturing and Testing of a Variable Chord Extension for Helicopter Rotor Blades. Actuators 2022, 11, 53. [Google Scholar] [CrossRef]
  28. Banerjee, J.R.; Ananthapuvirajah, A. Free flexural vibration of tapered beams. Comput. Struct. 2019, 224, 106106. [Google Scholar] [CrossRef]
  29. Rossi, A.; Botta, F.; Giovannelli, A.; Belfiore, N.P. A novel approach to reduce fan rotor blades stress in case of resonance due to inlet flow distortion by means of piezoelectric actuators. J. Sound Vib. 2023, 548, 117552. [Google Scholar] [CrossRef]
  30. Lumentut, M.F.; Shu, Y.C. Network segmentations of smart plate structure with attached mass and dynamic motions. Eur. J. Mech.-A Solids 2021, 85, 104061. [Google Scholar] [CrossRef]
Figure 1. Geometric characteristics of a tapered beam with linear tapering ratio c. (a) top view and front view, (b) 3D view of the tapered beam. L , b , T b L , T b R are respectively the length, width, left-end and right-end beam’s thickness.
Actuators 12 00071 g001aActuators 12 00071 g001b
Figure 2. Cantilever tapered beam coupled with n PZT actuator pairs (PPs). a denotes the axis of symmetry, x i 1 and x i are, respectively, the left and right edges of the i-th PP. The step function γ i assumes + 1 or 1 values and it is used to denote the two possible voltage distributions which can be provided to the generic i-th PP in order to induce two bending moments in the beam.
Actuators 12 00071 g002
Figure 3. Comparison of the analytical (Equation (6)) and FEM bending moment exerted by the PPs considering c = 5 and x ¯ = x L .
Actuators 12 00071 g003
Figure 4. (a) function f 1 ( x ¯ ) , (b) graph of the integrand M p ( x ¯ ) ϕ 1 ( x ¯ ) . The first mode excitation and c = 5 were considered. The O.V.D. provided no voltage sign change, since the minimum of f 1 ( x ¯ ) coincided with x ¯ = 0 , while the maximum was at x ¯ = 1 . The same result could be obtained by observing the area subtended by M p ( x ¯ ) ϕ 1 ( x ¯ ) . The area of this function was always above the x-axis, so no voltage sign change was expected for the first mode.
Actuators 12 00071 g004
Figure 5. (a) function f 2 ( x ¯ ) , (b) graph of the integrand M p ( x ¯ ) ϕ 2 ( x ¯ ) . The second mode excitation and c = 5 were considered. The O.V.D. provided one voltage sign change, since f 2 ( x ¯ ) included a minimum at x ¯ = 0.315 , while the maximum was at x ¯ = 1 . The same result could be obtained by observing the area subtended by M p ( x ¯ ) ϕ 2 ( x ¯ ) . In this case, the area of this function was negative (highlighted in red colour) within 0 x ¯ 0.315 , so by changing the voltage sign at x ¯ = 0.315 it was possible to enhance the system’s efficiency because the two areas would be on the same side of the graph.
Actuators 12 00071 g005aActuators 12 00071 g005b
Figure 6. (a) function f 3 ( x ¯ ) , (b) graph of the integrand M p ( x ¯ ) ϕ 3 ( x ¯ ) . The third mode excitation and c = 5 were considered. The O.V.D. provided two voltage sign changes: f 3 ( x ¯ ) included a local maximum at x ¯ = 0.2 , a minimum at x ¯ = 0.61 , and the absolute maximum was in x ¯ = 1 . The same result could be obtained by observing the area subtended by M p ( x ¯ ) ϕ 3 ( x ¯ ) .The area of this function was negative (highlighted in red colour) within 0.2 x ¯ 0.61 , so, by changing the voltage sign both at x ¯ = 0.2 and x ¯ = 0.61 , it was possible to enhance the system’s efficiency, because the three areas would be on the same side of the graph.
Actuators 12 00071 g006
Figure 7. Parametric plot of f 1 ( x ¯ ) considering the first flexural mode and several tapering ratios c.
Actuators 12 00071 g007
Figure 8. Parametric plot of f 2 ( x ¯ ) considering the second flexural mode and several tapering ratios c. The solid black line highlights the location of the minima of f 2 ( x ¯ ) as c varies.
Actuators 12 00071 g008
Figure 9. Parametric plot of f 3 ( x ¯ ) considering the third flexural mode and several tapering ratios c. The solid black lines highlight the location of the extrema of f 3 ( x ¯ ) as c varies.
Actuators 12 00071 g009
Figure 10. Analytical and numerical optimal voltage distributions (O.V.D.) for the first eigenmode excitation versus tapering ratio. The stars represent the numerical optimal voltage distribution for each c value, calculated considering 13 PZT couples.
Actuators 12 00071 g010
Figure 11. Analytical and numerical optimal voltage distributions (O.V.D.) for the second eigenmode excitation versus tapering ratio. Black lines highlight the analytical location of the points beyond which the voltage should be applied with the opposite phase with respect to the previous region. The dashed lines identify the PZT couples that have to be supplied with the opposite voltage sign. The stars represent the numerical optimal voltage distribution for each c value, calculated considering 13 PZT couples.
Actuators 12 00071 g011
Figure 12. Analytical and numerical optimal voltage distributions (O.V.D.) for the third eigenmode excitation versus tapering ratio. Black lines highlight the analytical location of the points beyond which the voltage should be applied with the opposite phase with respect to the previous region. The dashed lines identify the PZT couples that have to be supplied with the opposite voltage sign. The stars represent the numerical optimal voltage distribution for each c value, calculated considering 13 PZT couples.
Actuators 12 00071 g012
Figure 13. Example of numerical error in the assessment of the O.V.D. for the third mode excitation and c = 3 . The gray points highlight the position of each PP edge (13 PP were considered). The blue stars represent the FEM calculated O.V.D., the solid green line represents the function f 3 ( x ¯ ) for c = 3 . The values e 1 and e 2 represent the discrepancies among the analytical and numerical δ L p . The total error was always less than 3%.
Actuators 12 00071 g013
Figure 14. Example of damping efficacy of the O.V.D. when the first eigenmode was excited by a harmonic moment (amplitude = 1.8 Nm) concentrated at the tip. The dashed red line shows the instant of O.V.D. activation.
Actuators 12 00071 g014
Figure 15. Example of damping efficacy of the O.V.D. when the second eigenmode was excited by a harmonic moment (amplitude = 1.2 Nm) concentrated at the tip. The dashed red line shows the instant of O.V.D. activation.
Actuators 12 00071 g015
Figure 16. Example of damping efficacy of the O.V.D. when the third eigenmode was excited by a harmonic moment (amplitude = 0.9 Nm) concentrated at the tip. The dashed red line shows the instant of O.V.D. activation.
Actuators 12 00071 g016
Table 1. Tapered beam geometric specifications.
cL (m)b (m) T b L (m)
0.50.40.050.008
10.40.050.008
30.40.050.008
50.40.050.008
Table 2. Considered voltage distributions.
Configuration\PP12345678910111213
1+1+1+1+1+1+1+1+1+1+1+1+1+1
2+1+1+1+1+1+1+1+1+1+1+1+1−1
3+1+1+1+1+1+1+1+1+1+1+1−1+1
4+1+1+1+1+1+1+1+1+1+1−1+1+1
5+1+1+1+1+1+1+1+1+1−1+1+1+1
2 13 = 8192 −1−1−1−1−1−1−1−1−1−1−1−1−1
Table 3. Material details of the beam and PZT actuators.
ComponentMaterialDensity (kg/m3)Young’s Modulus (GPa)Poisson’s Ratio d 31 ( 10 12 C / N )
BeamSteel78502100.3
ActuatorPZT-5A775039374
Table 4. Comparison between analytical and numerical eigenfrequencies for the first three modes and several tapering ratios. A = analytical result, N = FEM result.
c = 0.5 c = 1 c = 3 c = 5
ModeA (Hz)N (Hz)A (Hz)N (Hz)A (Hz)N (Hz)A (Hz)N (Hz)
142.7945.2344.3646.4748.4550.3950.8851.91
2227.71238.31212.50221.66187.75201.83179.28193.49
3607.25642.64548.32590.23449.83495.8412.71456.31
Disclaimer/Publisher’s Note: The statements, opinions and data contained in all publications are solely those of the individual author(s) and contributor(s) and not of MDPI and/or the editor(s). MDPI and/or the editor(s) disclaim responsibility for any injury to people or property resulting from any ideas, methods, instructions or products referred to in the content.

