Article

An Analytical–Numerical Method for Simulating the Performance of Piezoelectric Harvesters Mounted on Wing Slats

1
Department of Industrial Engineering, University of Padova, 35131 Padova, Italy
2
Sonaca SA, 6041 Gosselies, Belgium
3
Smart Material GmbH, 01159 Dresden, Germany
*
Author to whom correspondence should be addressed.
Actuators 2023, 12(1), 29; https://doi.org/10.3390/act12010029
Submission received: 28 November 2022 / Revised: 30 December 2022 / Accepted: 5 January 2023 / Published: 7 January 2023

Abstract

:
Recently, there have been significant developments in the field of vibration energy harvesters to feed sensors for structural health monitoring in aeronautics and other high technology fields. Within the framework of the EU InComEss project, new eco-friendly piezoelectric materials are under development. A foreseen application is vibration energy harvesting from the wing slats of aircraft. Semi-analytical models of the vibrating slat make it possible to estimate the maximum voltage that can be generated by a piezoelectric patch bonded to a slat surface. A more detailed analysis must consider details of the three-dimensional geometry of both the harvester and the bonding layer. This can only be carried out with multiphysics finite element software. A finite element model of a whole slat would require a large computational effort as millions of elements are typically needed to model very thin piezoelectric layers. To simplify this analysis, an integrated analytical–numerical method is proposed in this paper. A large-scale analytical model of the whole slat was used to calculate loads on the portion of the slat where a piezoelectric patch was attached. Then, a small-scale finite element model of the portion of the slat with the piezoelectric patch was used to calculate the open circuit voltage generated by the patch. The response of the harvester to random excitation, typical of aeronautic applications, was calculated. The effects of the details of the harvester design on the generated voltage were analyzed and discussed.

1. Introduction

Vibration energy harvesting by means of piezoelectric (PE) materials is a promising technology for feeding remote sensor nodes and other microelectronic equipment, especially when weight, space and accessibility constraints are important. In aeronautics, several applications of vibration energy harvesting have been proposed [1,2], but the most important application is feeding sensors for structural health monitoring (SHM) [3,4,5]. In the framework of the EU InComEss project [6], new lead-free piezoelectric materials are under development. A foreseen application is vibration energy harvesting from wing slats. Slats are movable aerodynamic surfaces on the leading edge of the wing that increase the lift force on the wing when they are deployed. In [7], an analytical model based on the modal superposition approach [8] was used to simulate PE harvesters mounted on a deployed slat. A comparison was made between the performance of two possible design solutions: cantilever harvesters and PE patches directly bonded to the slat surface. Numerical results showed that both solutions were able to generate relevant voltage and power. The cantilever harvester optimally tuned to the most excited mode of vibration of the slat showed the best performance, since it exploited the resonance phenomenon, but this device required more mass, volume and stress inside the brittle piezoelectric material than the PE patch. Because the mass, volume and reliability of PE devices are very important issues in slat case-studies, the PE patch was selected for further development within the framework of the InComEss project. The deployed slat in [7] showed the largest vibrations; however, most of the energy could be harvested during the flight when the slat was retracted. The analytical model presented in [7] was extended in this study to investigate this operating condition. Moreover, to analyze the effect of details such as the three-dimensional geometry of the PE patch and thin adhesive layers used to bind the PE patch to the slat, an integrated approach combining a large-scale analytical model and a small-scale finite element model is proposed.
The large-scale model, implemented in MATLAB®, is fully analytical and is based on the modal expansion approach. It describes a whole slat excited by the broadband acceleration spectrum typical of wings, and it enables the calculation of the bending moment and shear force acting on the portion of the slat where the harvester is mounted. The contact between the slat and the wing edge is simulated by means of a distributed stiffness, and the variation in the value of the contact stiffness makes it possible to simulate both retracted and deployed slats.
The small-scale model, implemented in COMSOL Multiphysics®, is numerical and is based on a multiphysics finite element (FE) method. It describes the sandwich structure of the harvester mounted on an equivalent portion of the slat, which is excited by the loads calculated by means of the large-scale model. This makes it possible to compute the voltage generated by the PE material considering the effects of the adhesive layer and of the other layers that compose the sandwich.
The paper is organized as follows: Section 2 describes the problem and the structure of the combined analytical–numerical approach. Section 3 provides the input data: slat dimensions, PE patch dimensions, mechanical properties, and electrical properties. Section 4 deals with the large-scale analytical model of the whole slat. Section 5 deals with the small-scale FE model. Section 6 shows the numerical results and, in particular, the effects of the adhesive thickness on the voltage generated by the harvester. Finally, conclusions are drawn.

2. Integrated Analytical–Numerical Method

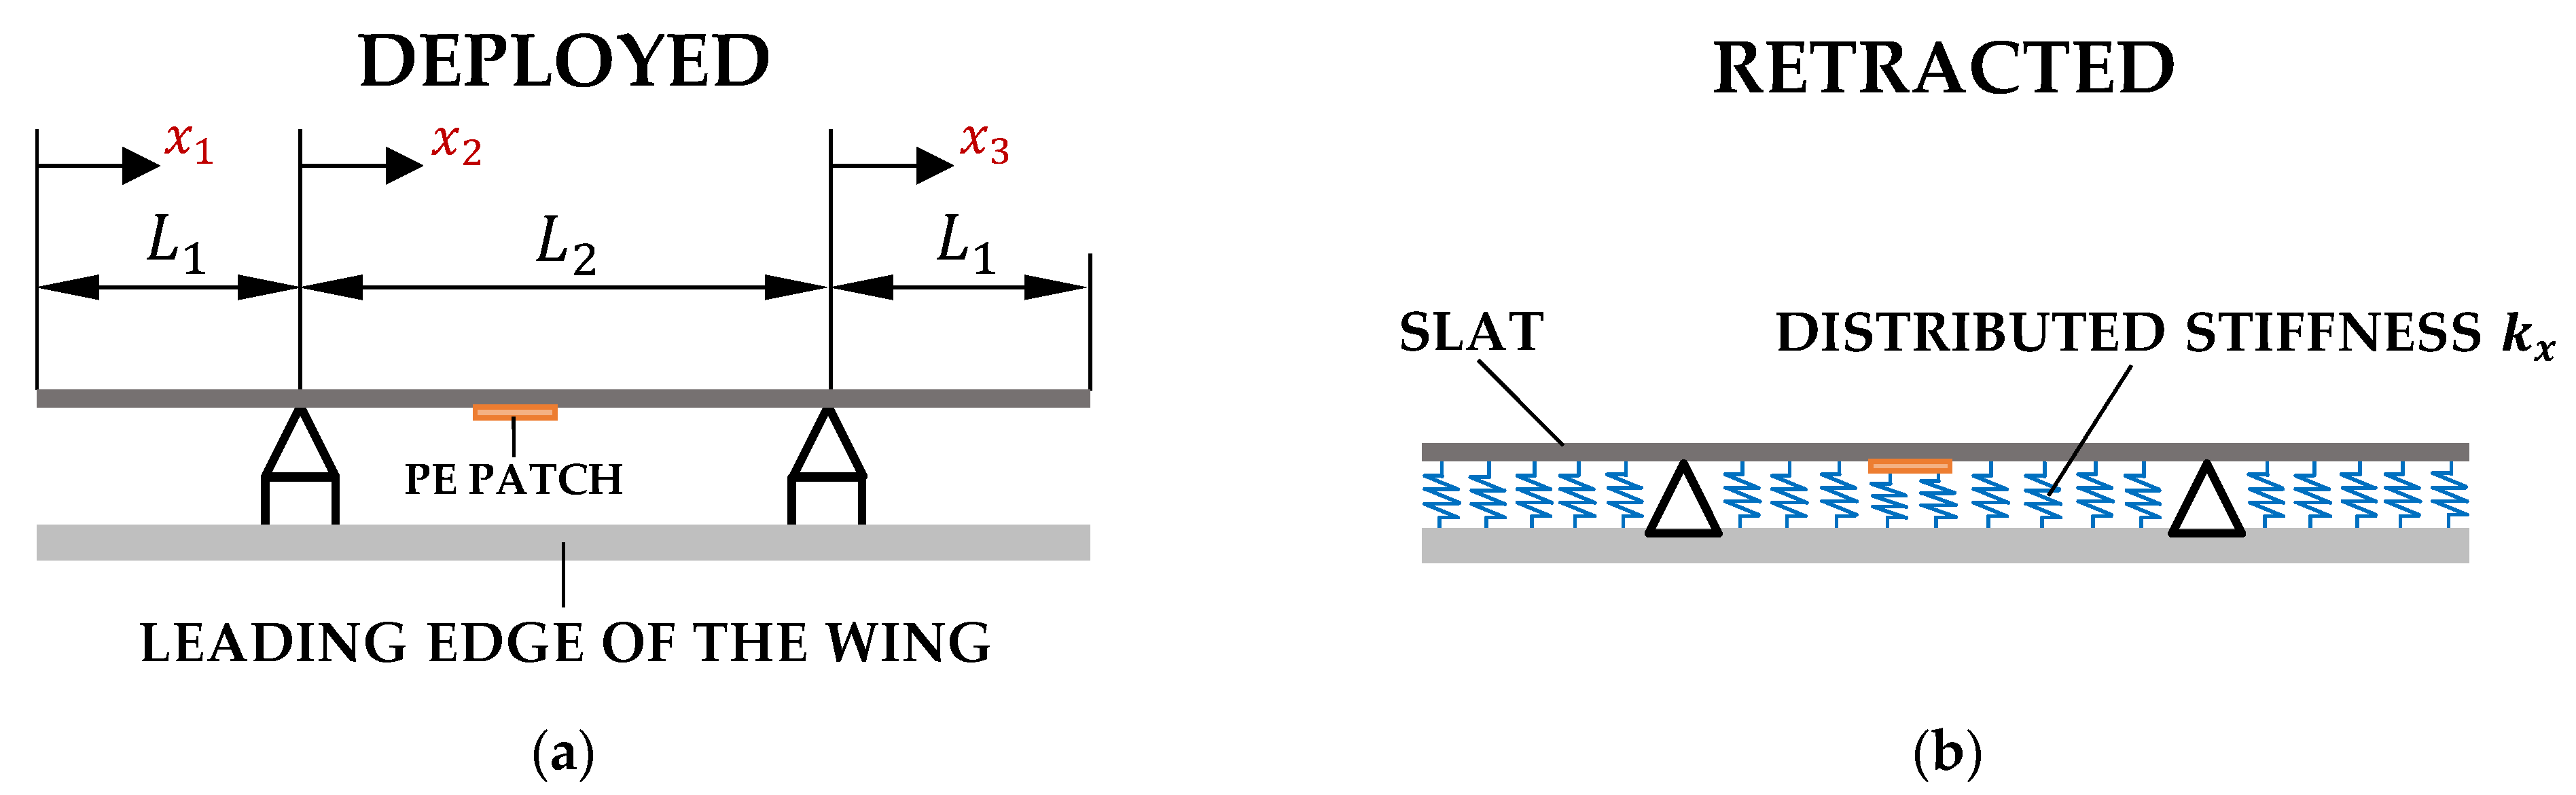
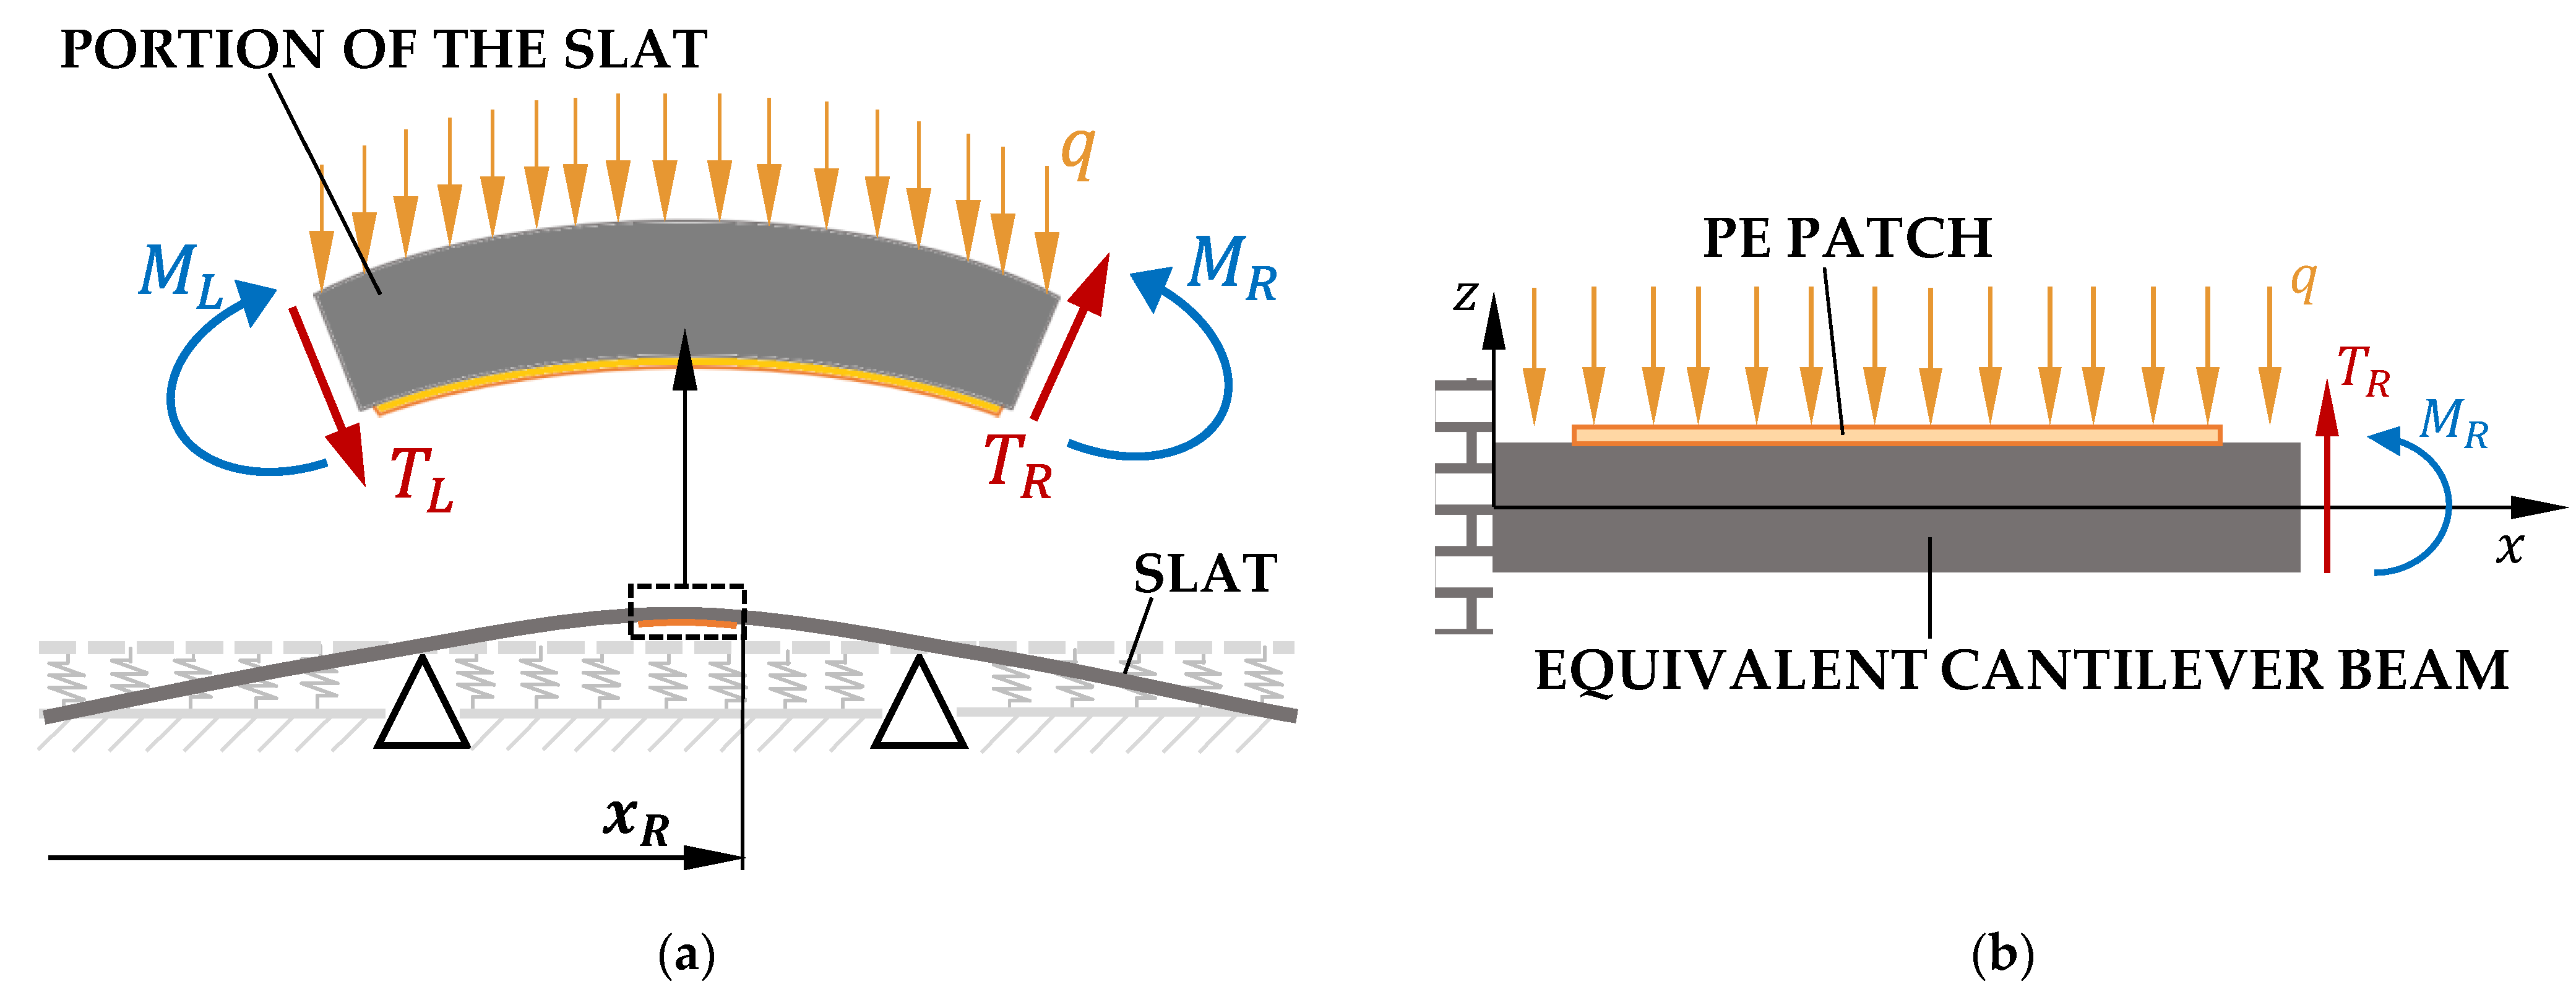
The slat is the mobile leading-edge flap of a wing of an aircraft, which is operated to increase the angle of attack of the wing during low-speed maneuvers, such as take-off and landing. The slats are retracted during flight and are forced by the aerodynamic loads to remain in contact with the leading edge of the wing. The deployment and retraction of the slat is performed by servomechanisms. In the framework of this research, it was assumed that the slat is moved by two servomechanisms, so the whole deployed slat could be schematized as a pinned beam with overhangs, as shown in Figure 1a. A distributed stiffness was added to allow for the contact force between the wing and the retracted slat. 
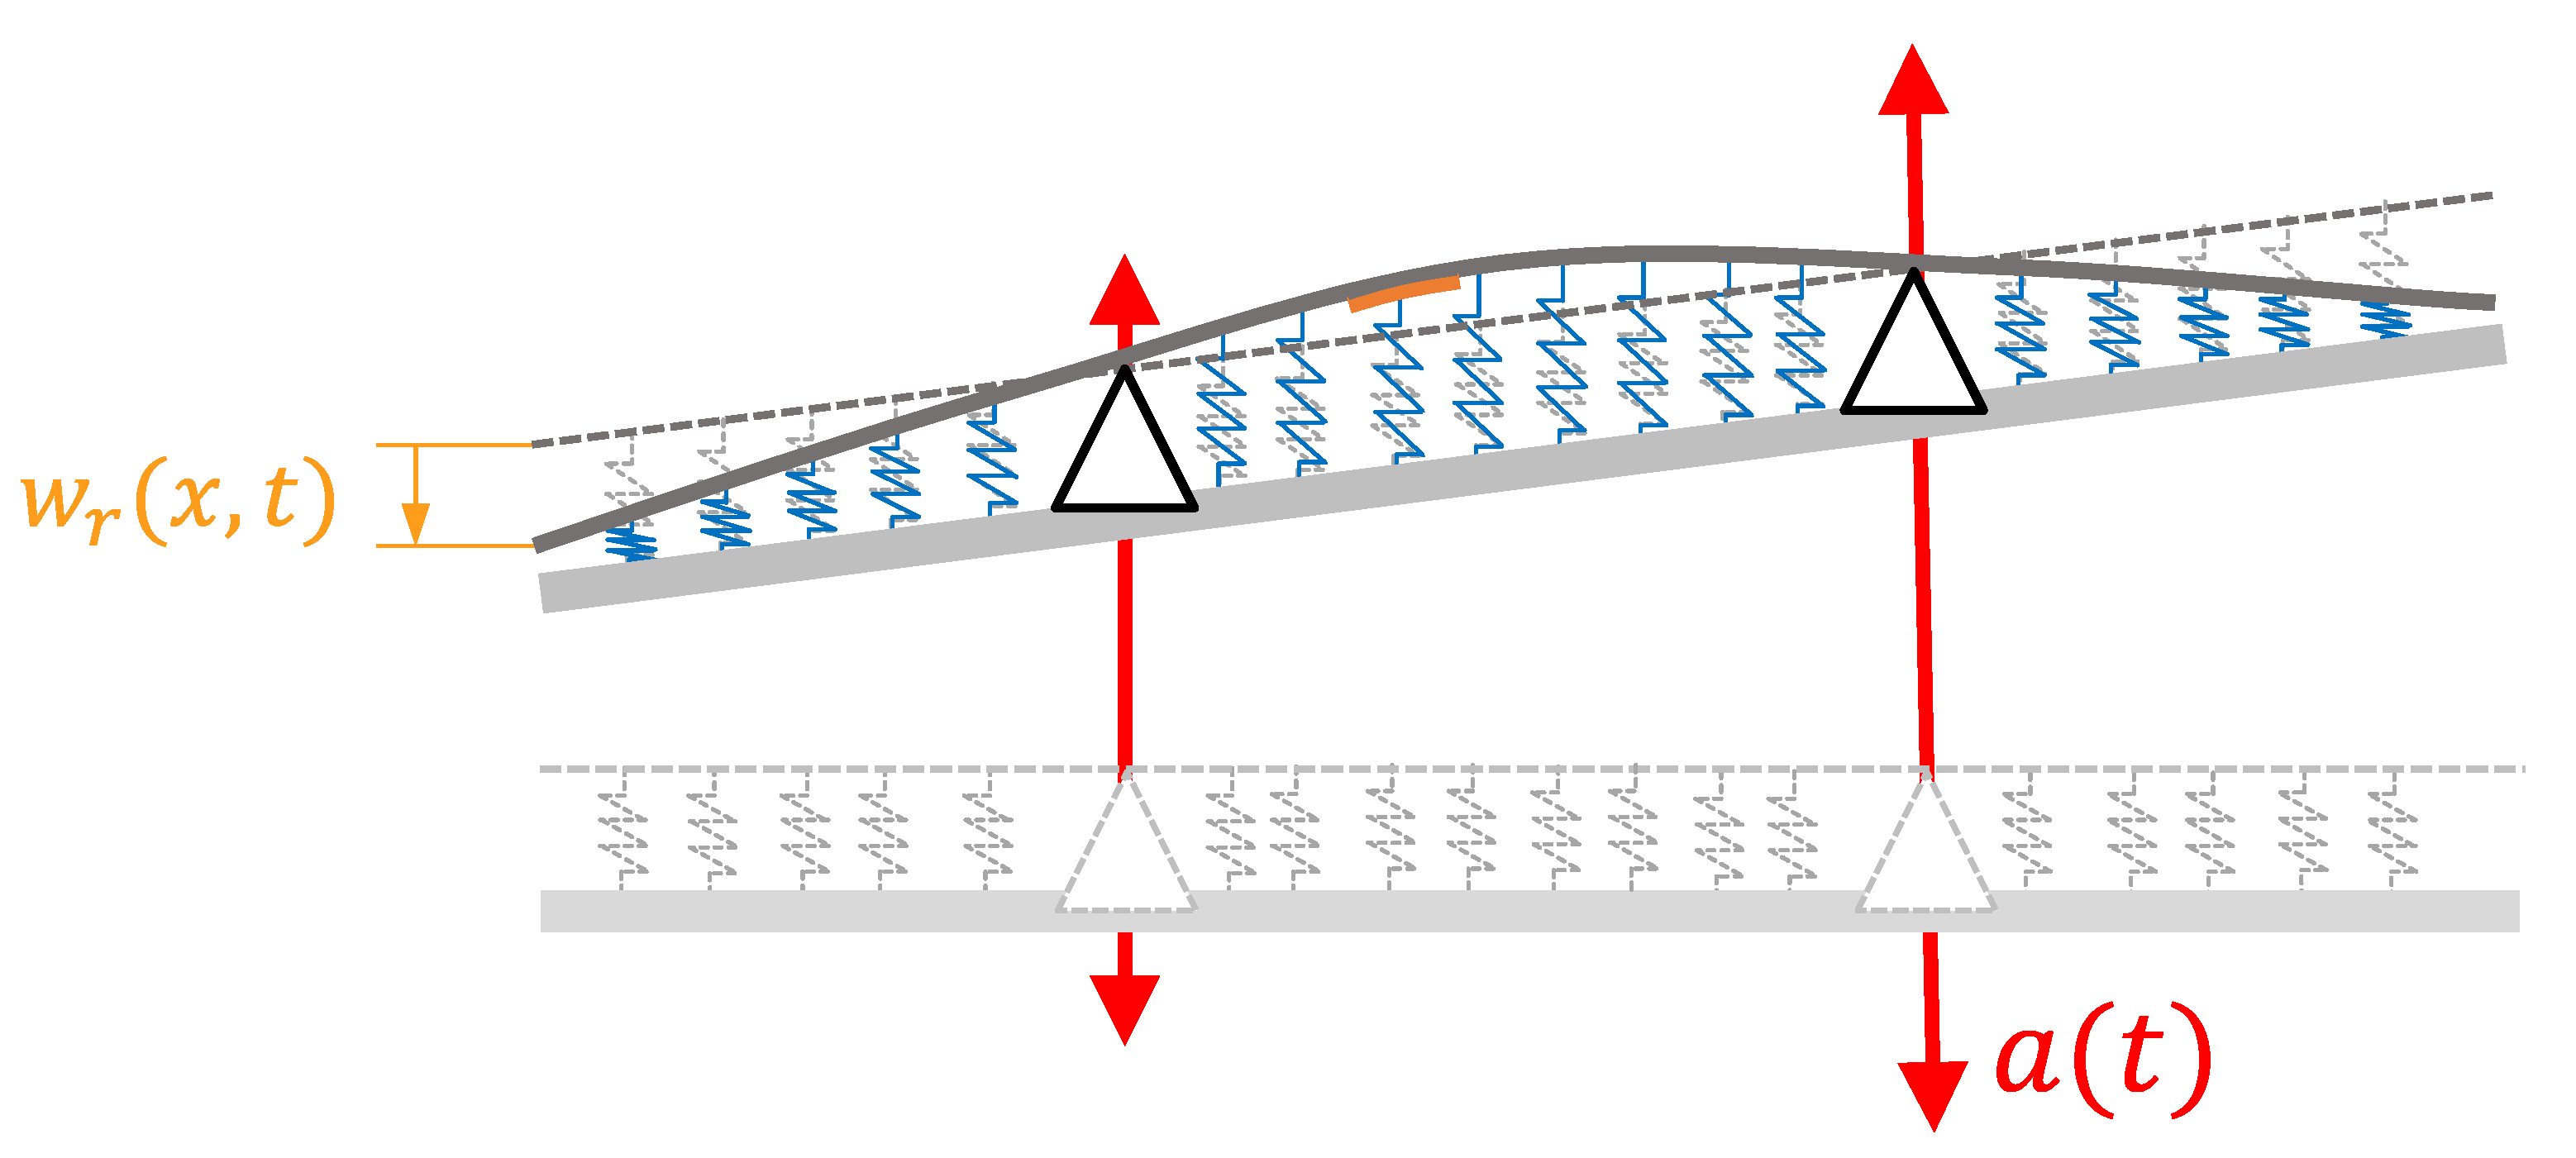
Figure 1b shows the scheme of the retracted slat. The slat vibrates since it is excited by the wing through the slat supports. The vibration levels of the supports are equal to the vibration levels of the wing’s leading edge corresponding with the connecting points. The slat is not a rigid body; hence, it deforms due to inertia force. Figure 2 shows that the vibration levels at the supports are different, since vibrations along the wing of the aircraft increase from the root towards the tip of the wing [7]. In Figure 2, w r ( x , t ) represents the displacement of the deformed slat with respect to the undeformed configuration and a ( t ) is the acceleration level of one of the two supports of the slat.
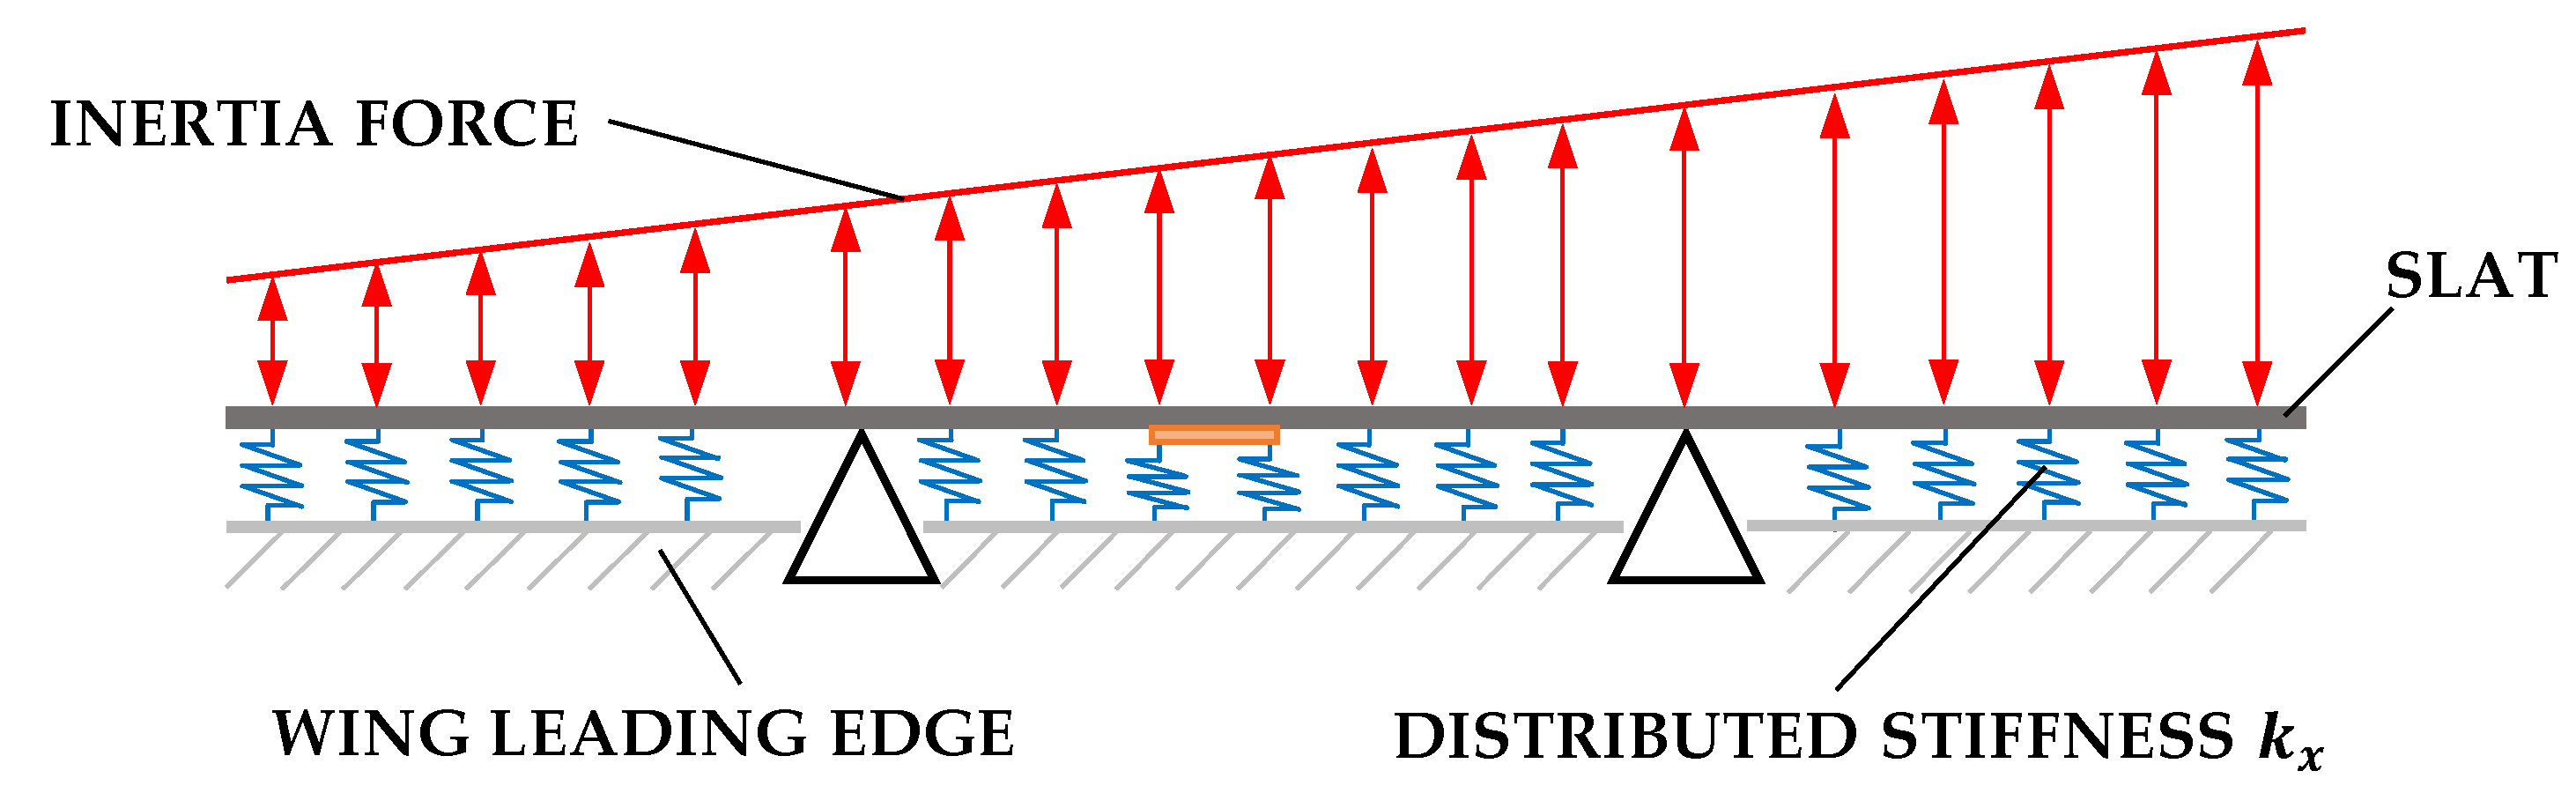
From a physical point of view, the slat can be modelled as a pinned beam excited by a trapezoidal distribution of forces (as proposed in [7]) which represents the inertia force due to the vibration of the wing; see Figure 3.
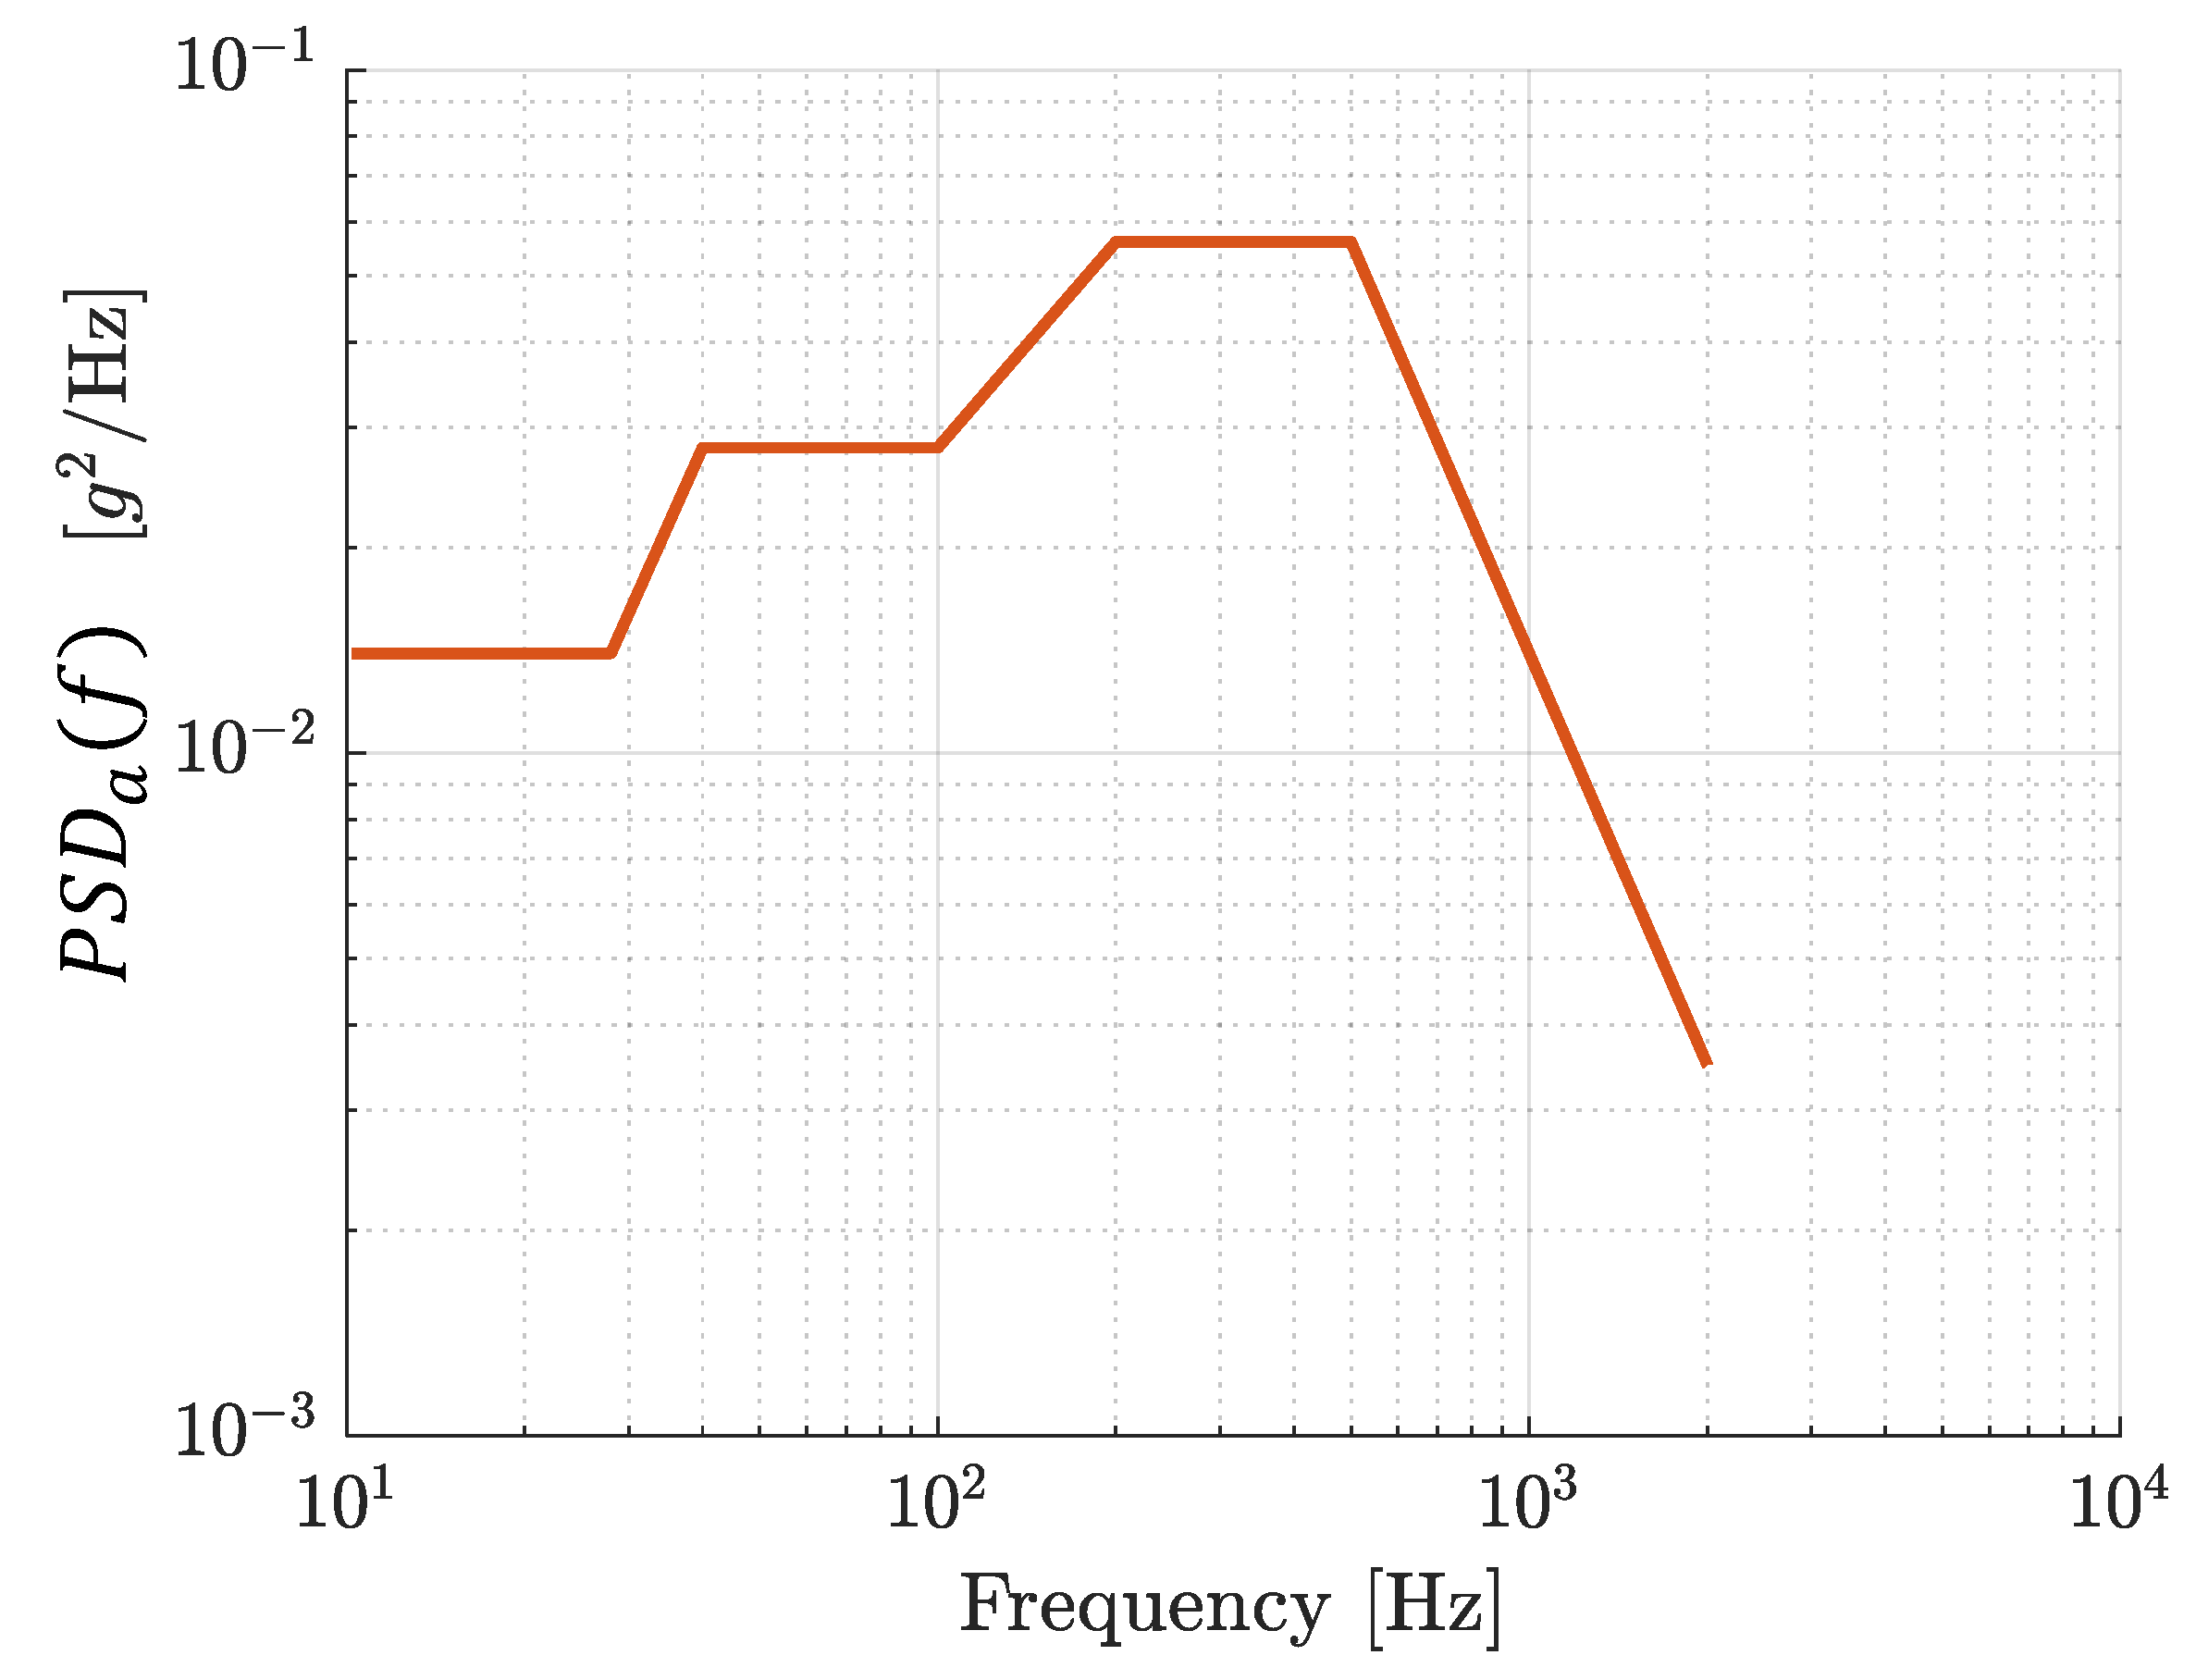
In aeronautics, acceleration levels are given in the frequency domain according to standard specifications. In this research, the standard specification RTCA-DO-160 CAT S curve E was adopted because it refers to wing components. Figure 4 shows the PSD of the acceleration of the external support of the slat. Therefore, a frequency domain analysis was needed to calculate the power spectral density (PSD) of the voltage generated by a PE patch mounted on the slat from the acceleration PSD, and then the voltage RMS value could be obtained with Parseval’s Theorem.
The piezoelectric patch is very thin and flexible and covers a very small part of the whole slat. Therefore, the vibrations of the slat caused by the motion of the supports are not influenced by the presence of the patch. Conversely, the deformation of the portion of the slat skin where the patch is attached determines the strain inside the PE patch and the generated voltage. The adhesive and protective layers that are inserted between the slat skin and the PE patch may also influence the generated voltage. For the above-mentioned reasons, a computational method based on the synergic use of a large-scale model and a small-scale model was developed. 
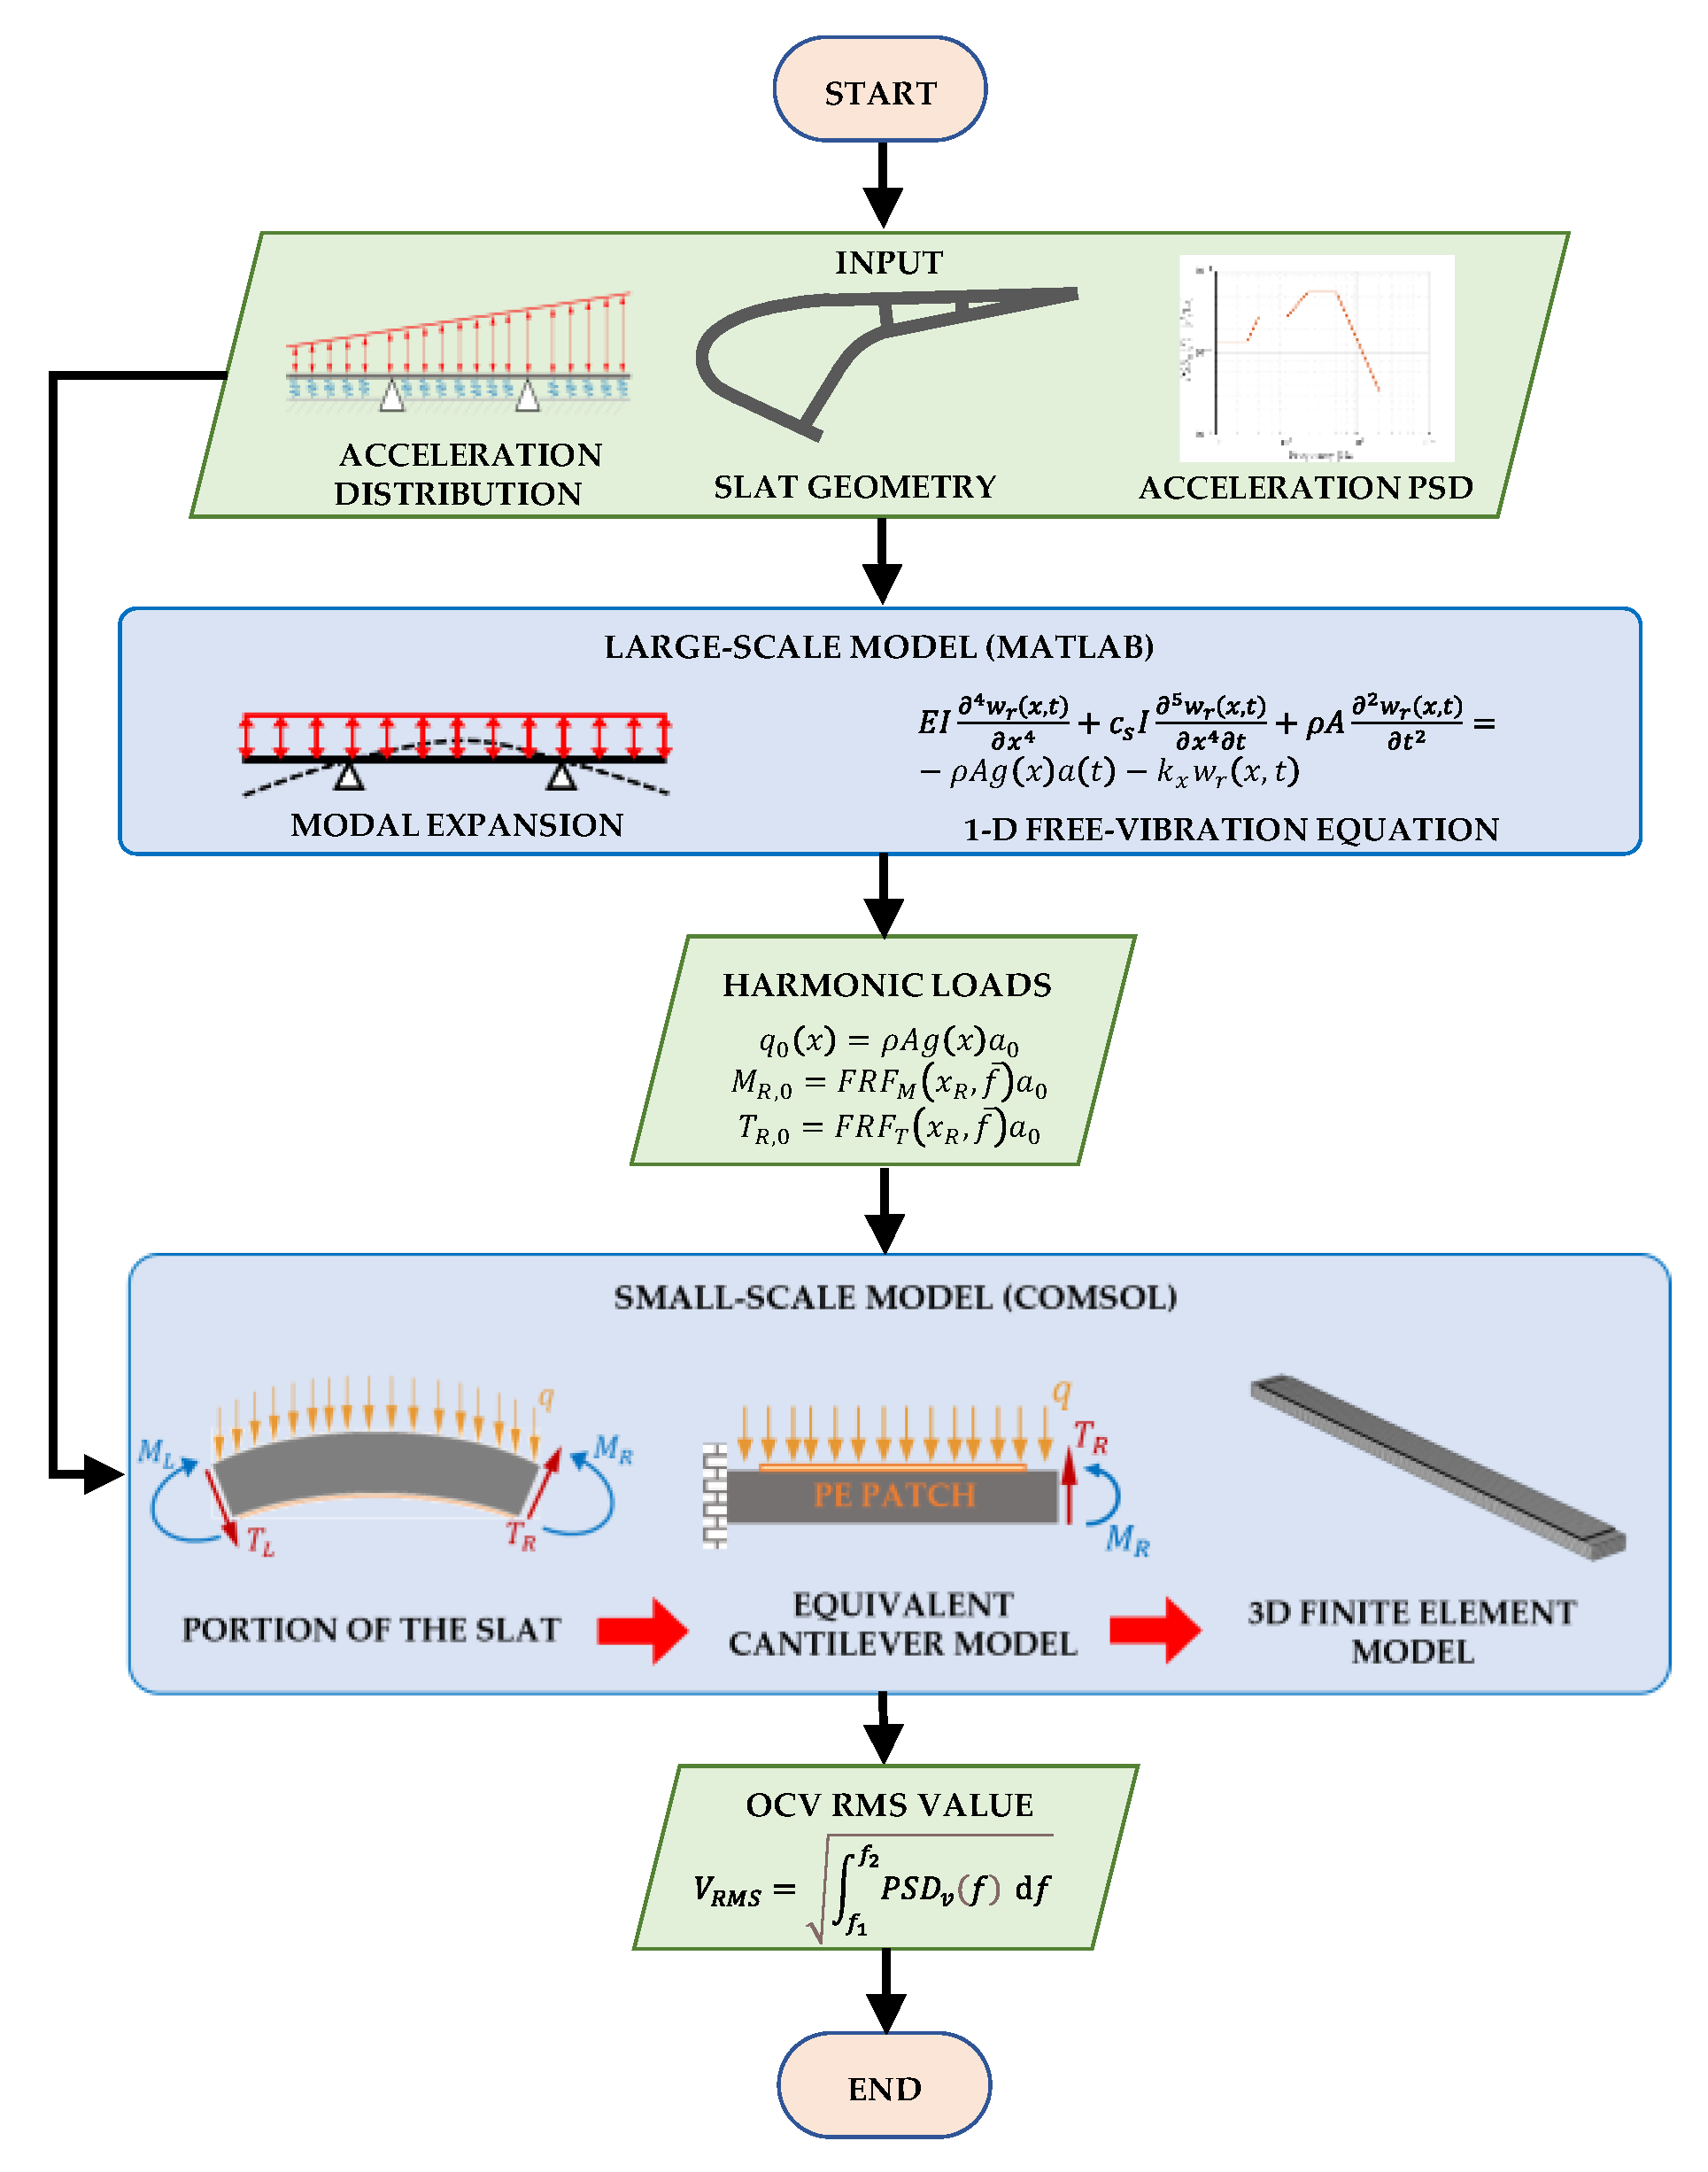
Figure 5 shows a flow chart that describes the steps and the interactions between the large-scale and small-scale models.
The large-scale model refers to the whole slat, is based on the modal expansion approach, and is implemented in MATLAB. The aim of this model is to calculate the frequency response functions (FRFs) of the points along the slat caused by a harmonic distributed inertia force having the shape depicted in Figure 3. In particular, the FRFs between bending moment, shear force, and slat acceleration are obtained. They enable the calculation of the forces and moments acting on every portion of the slat.
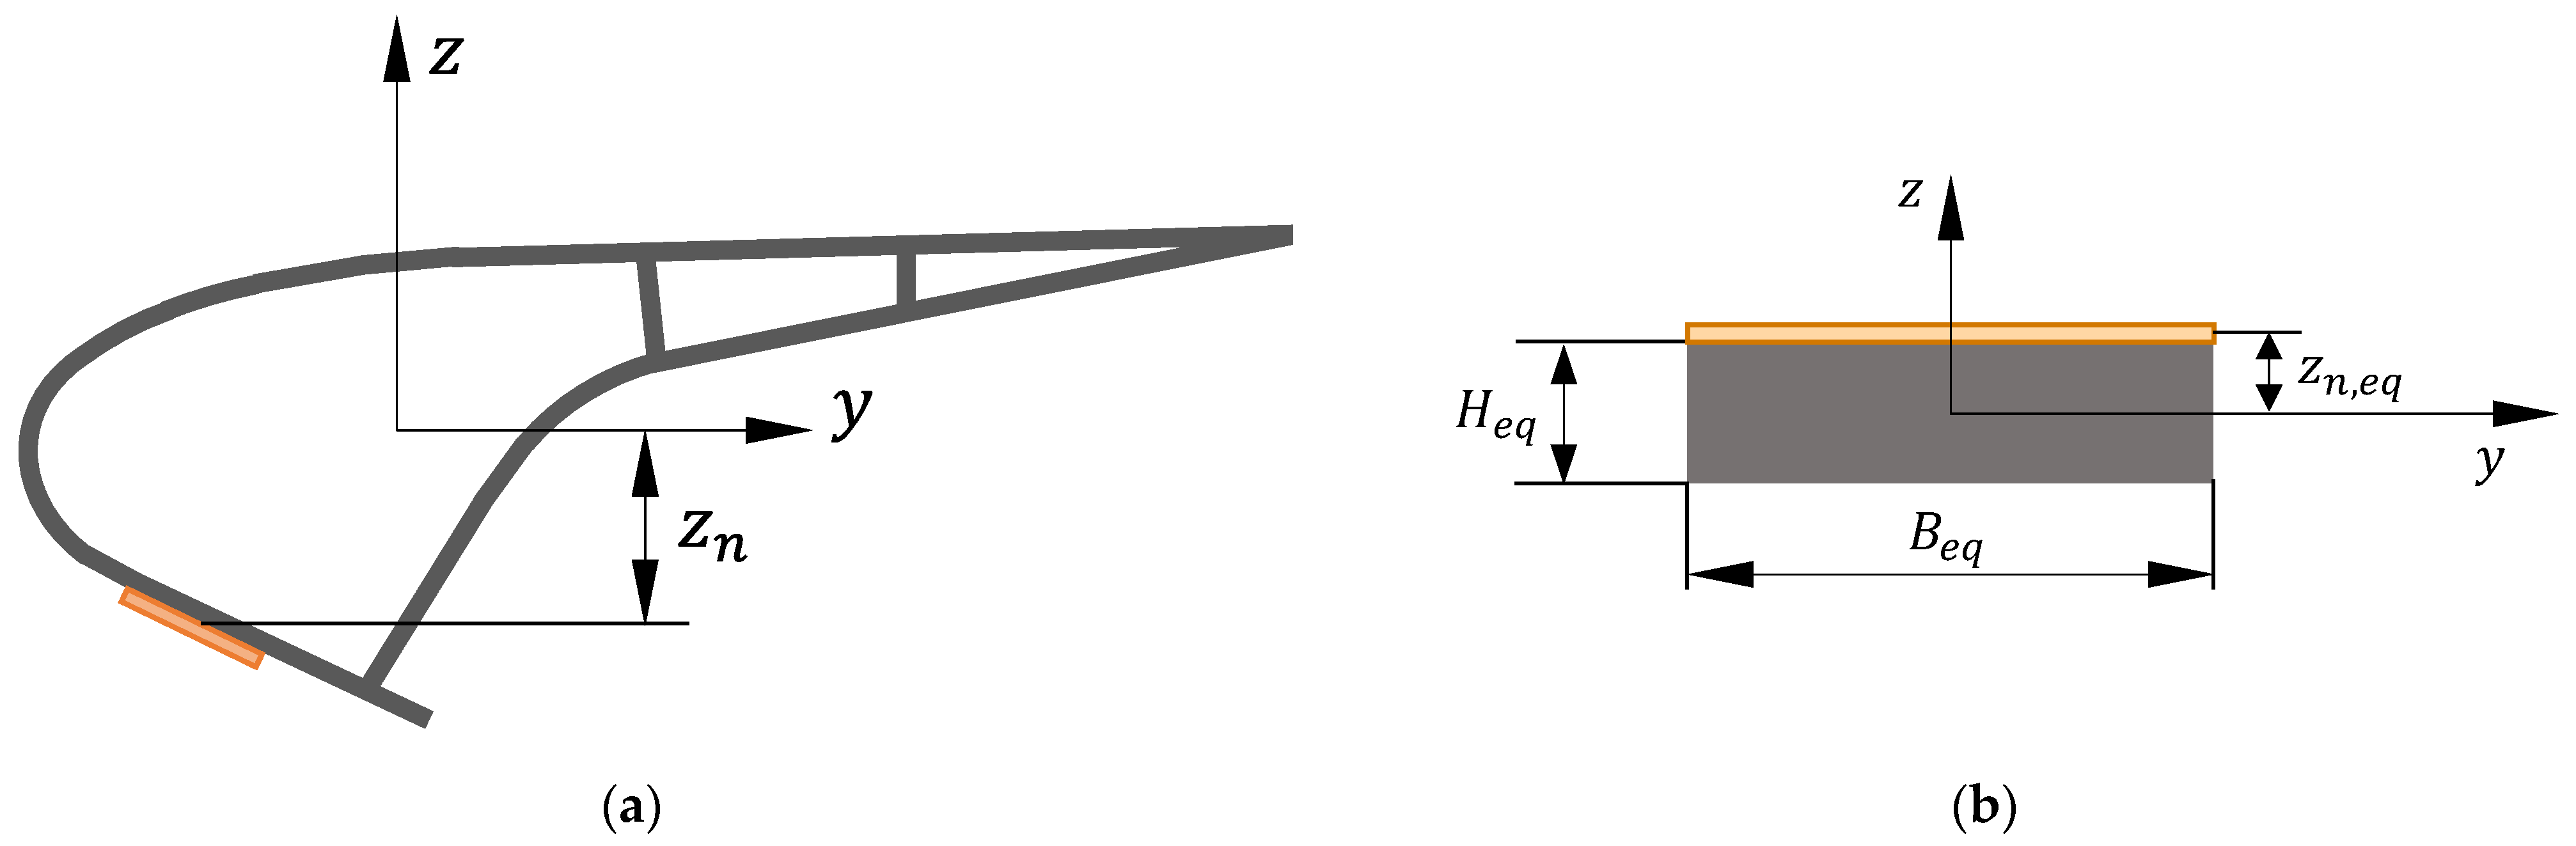
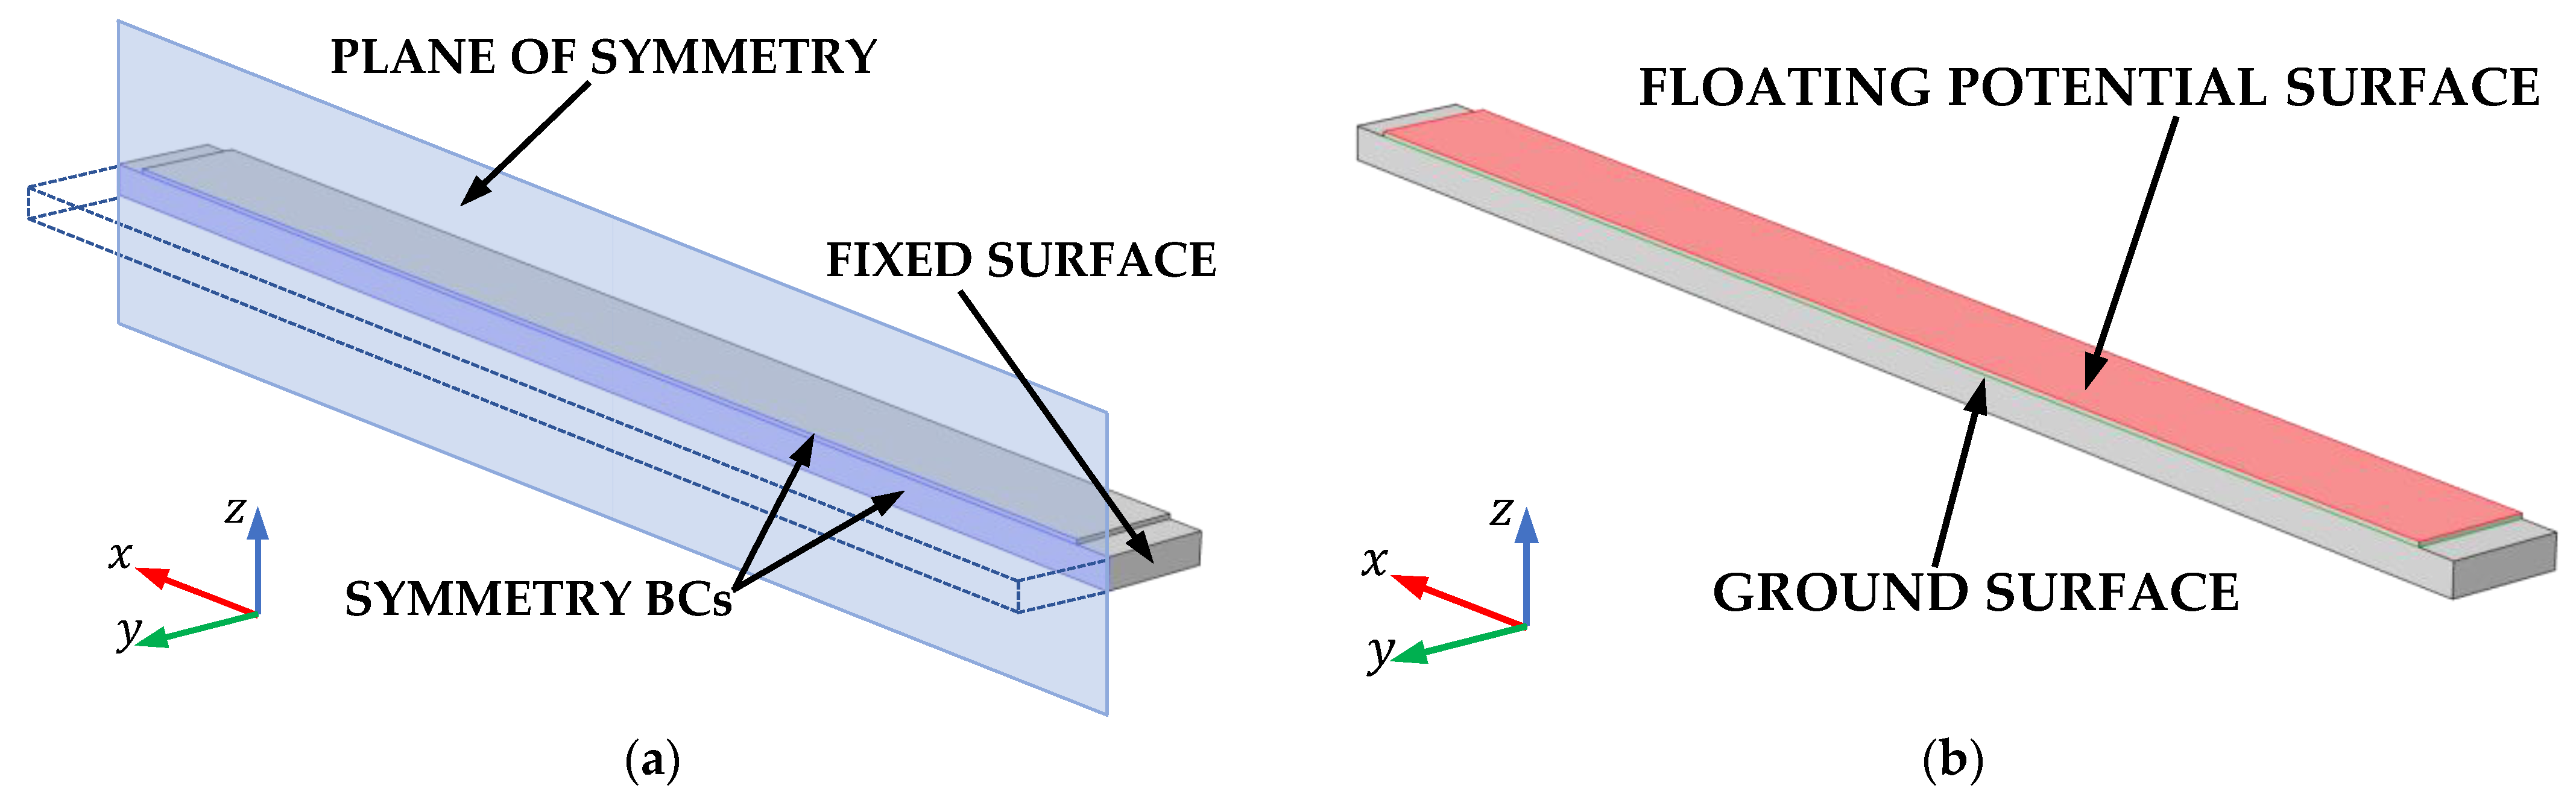
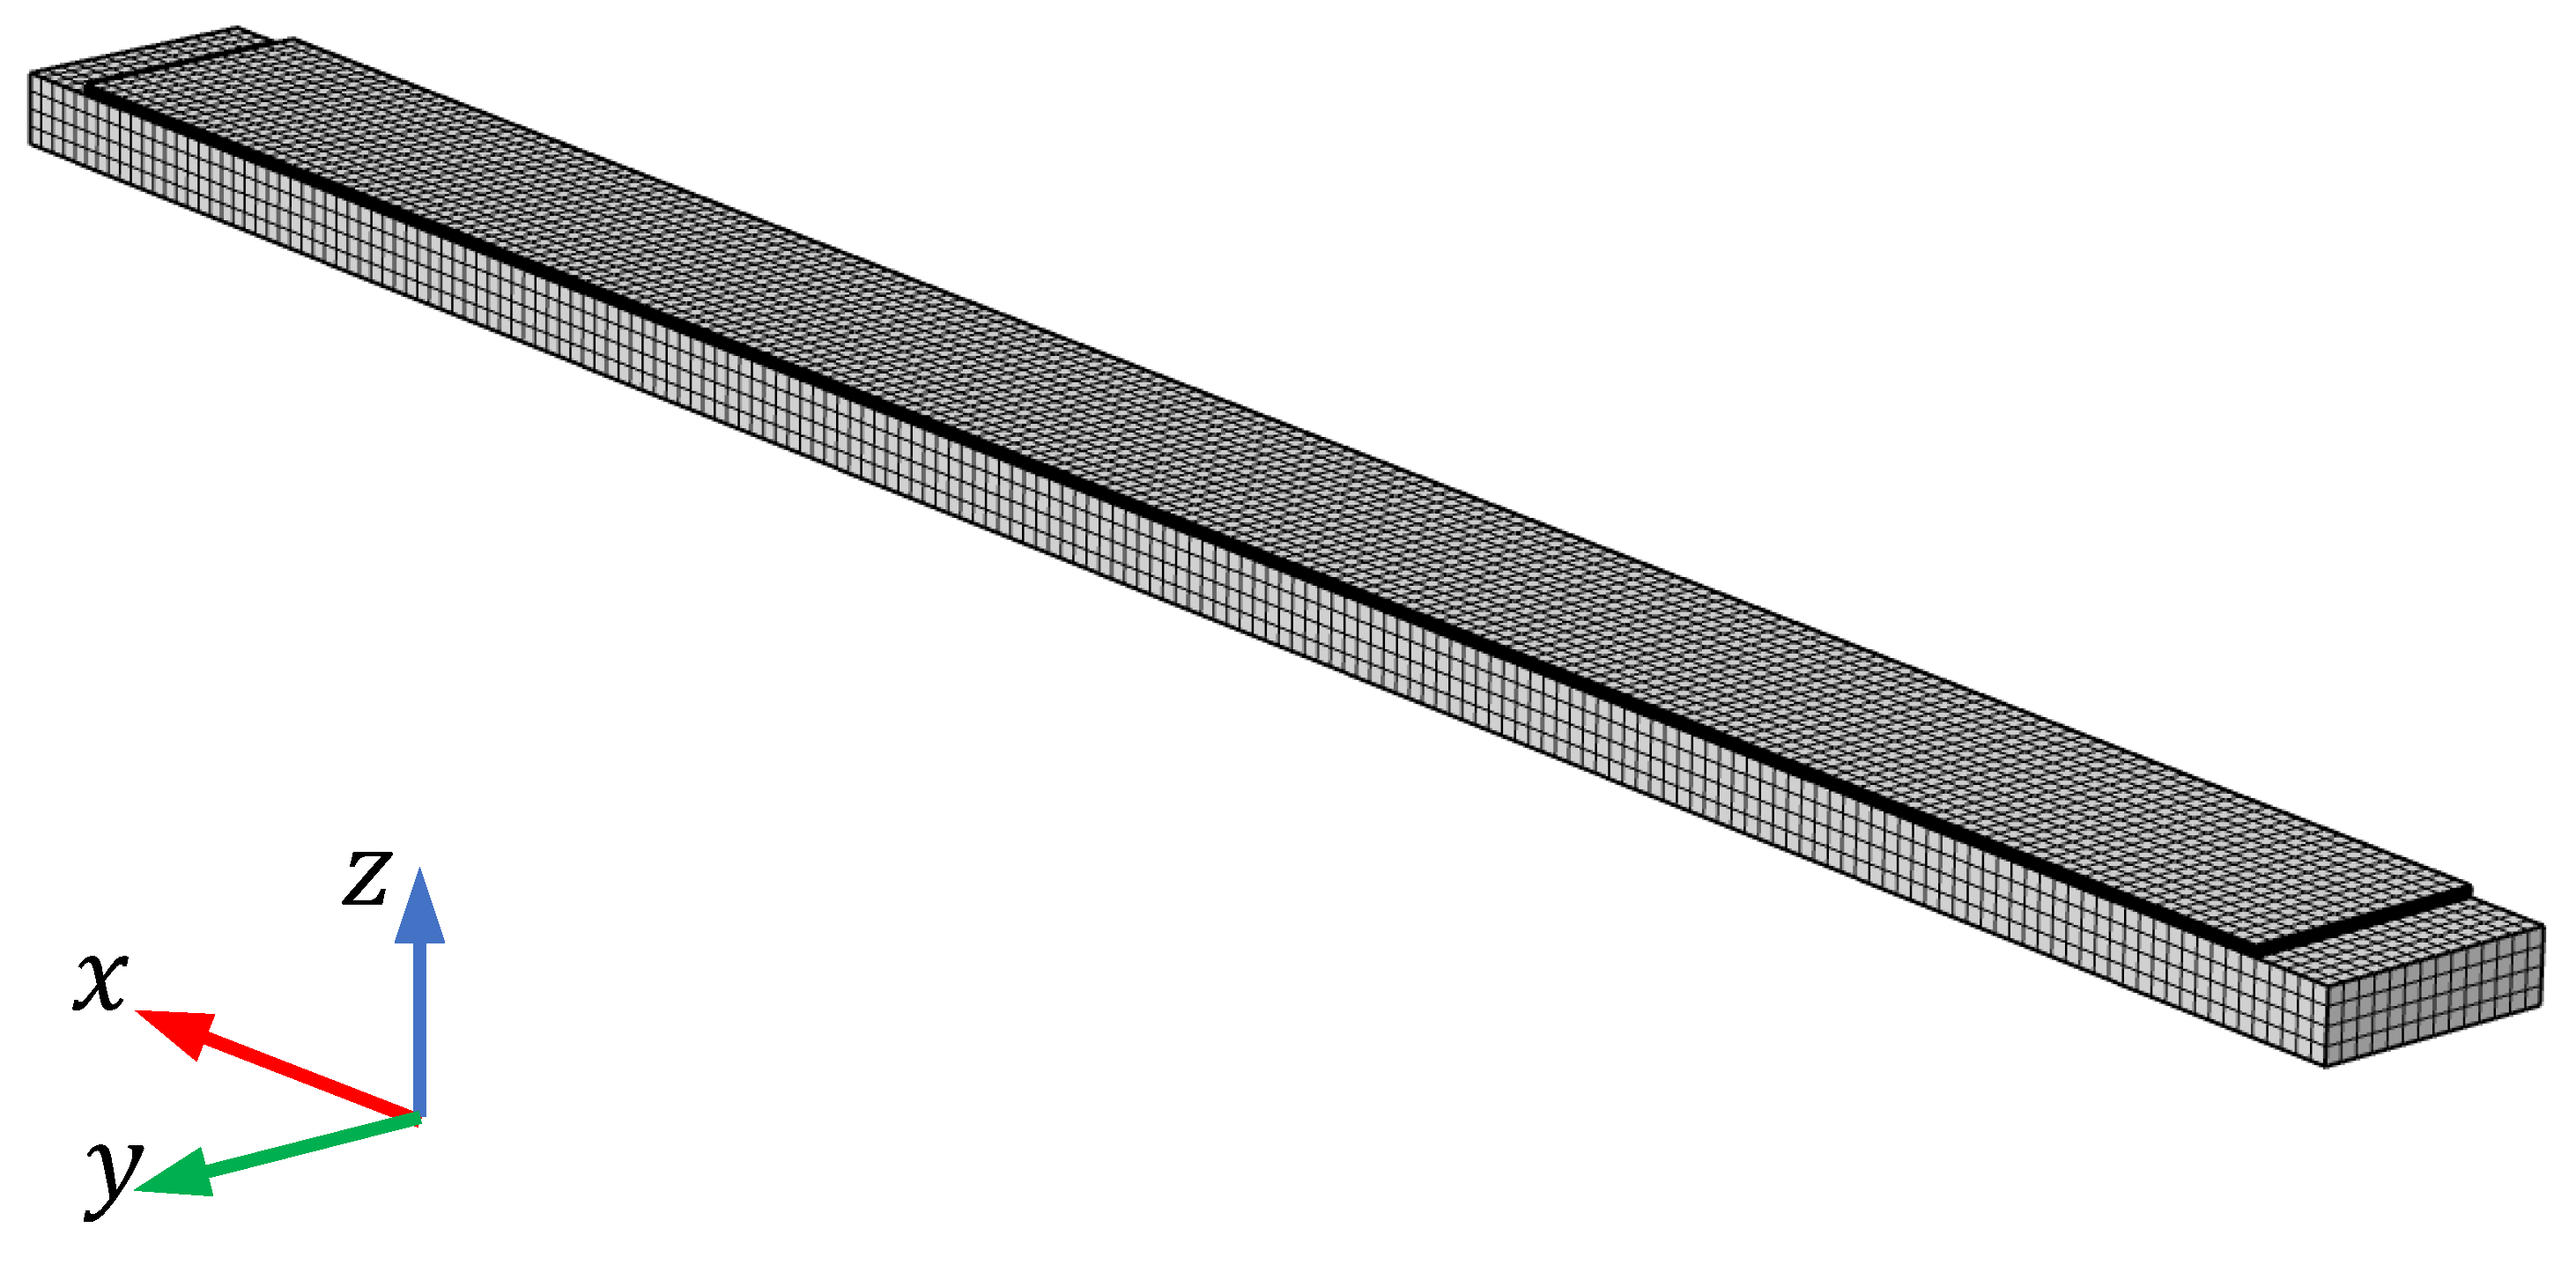
The small-scale model includes the PE patch and the portion of the slat where the patch is attached. It is developed with the FE method and implemented in COMSOL. The actual cross-section of the slat, which is rather complex, is transformed into an equivalent cross-section that generates in the slat skin the same strain pattern as the actual cross-section when the same loads are present. The small-scale FE is used to calculate, for a series of frequencies, the harmonic response of the system stimulated by the inertia distributed force and by the moments and forces deriving from the large-scale model at the assigned frequency. The fitting of the results of these analyses gives the numerical FRF ( F R F v ( f ) ) between slat acceleration and the open circuit voltage generated by the PE patch. The F R F v ( f ) relates the PSD of the OCV to the PSD of the applied acceleration:
P S D v ( f ) = | F R F v ( f ) | 2 P S D a ( f ) .
The open circuit voltage RMS value can be obtained from Parseval’s Theorem as
V R M S = f 1 f 2 P S D v ( f )   d f .
The OCV is an important merit figures since it allows for the evaluation of the electric performance of the harvester, as discussed in [9].

3. Input Data: Slat and PE Patch Properties

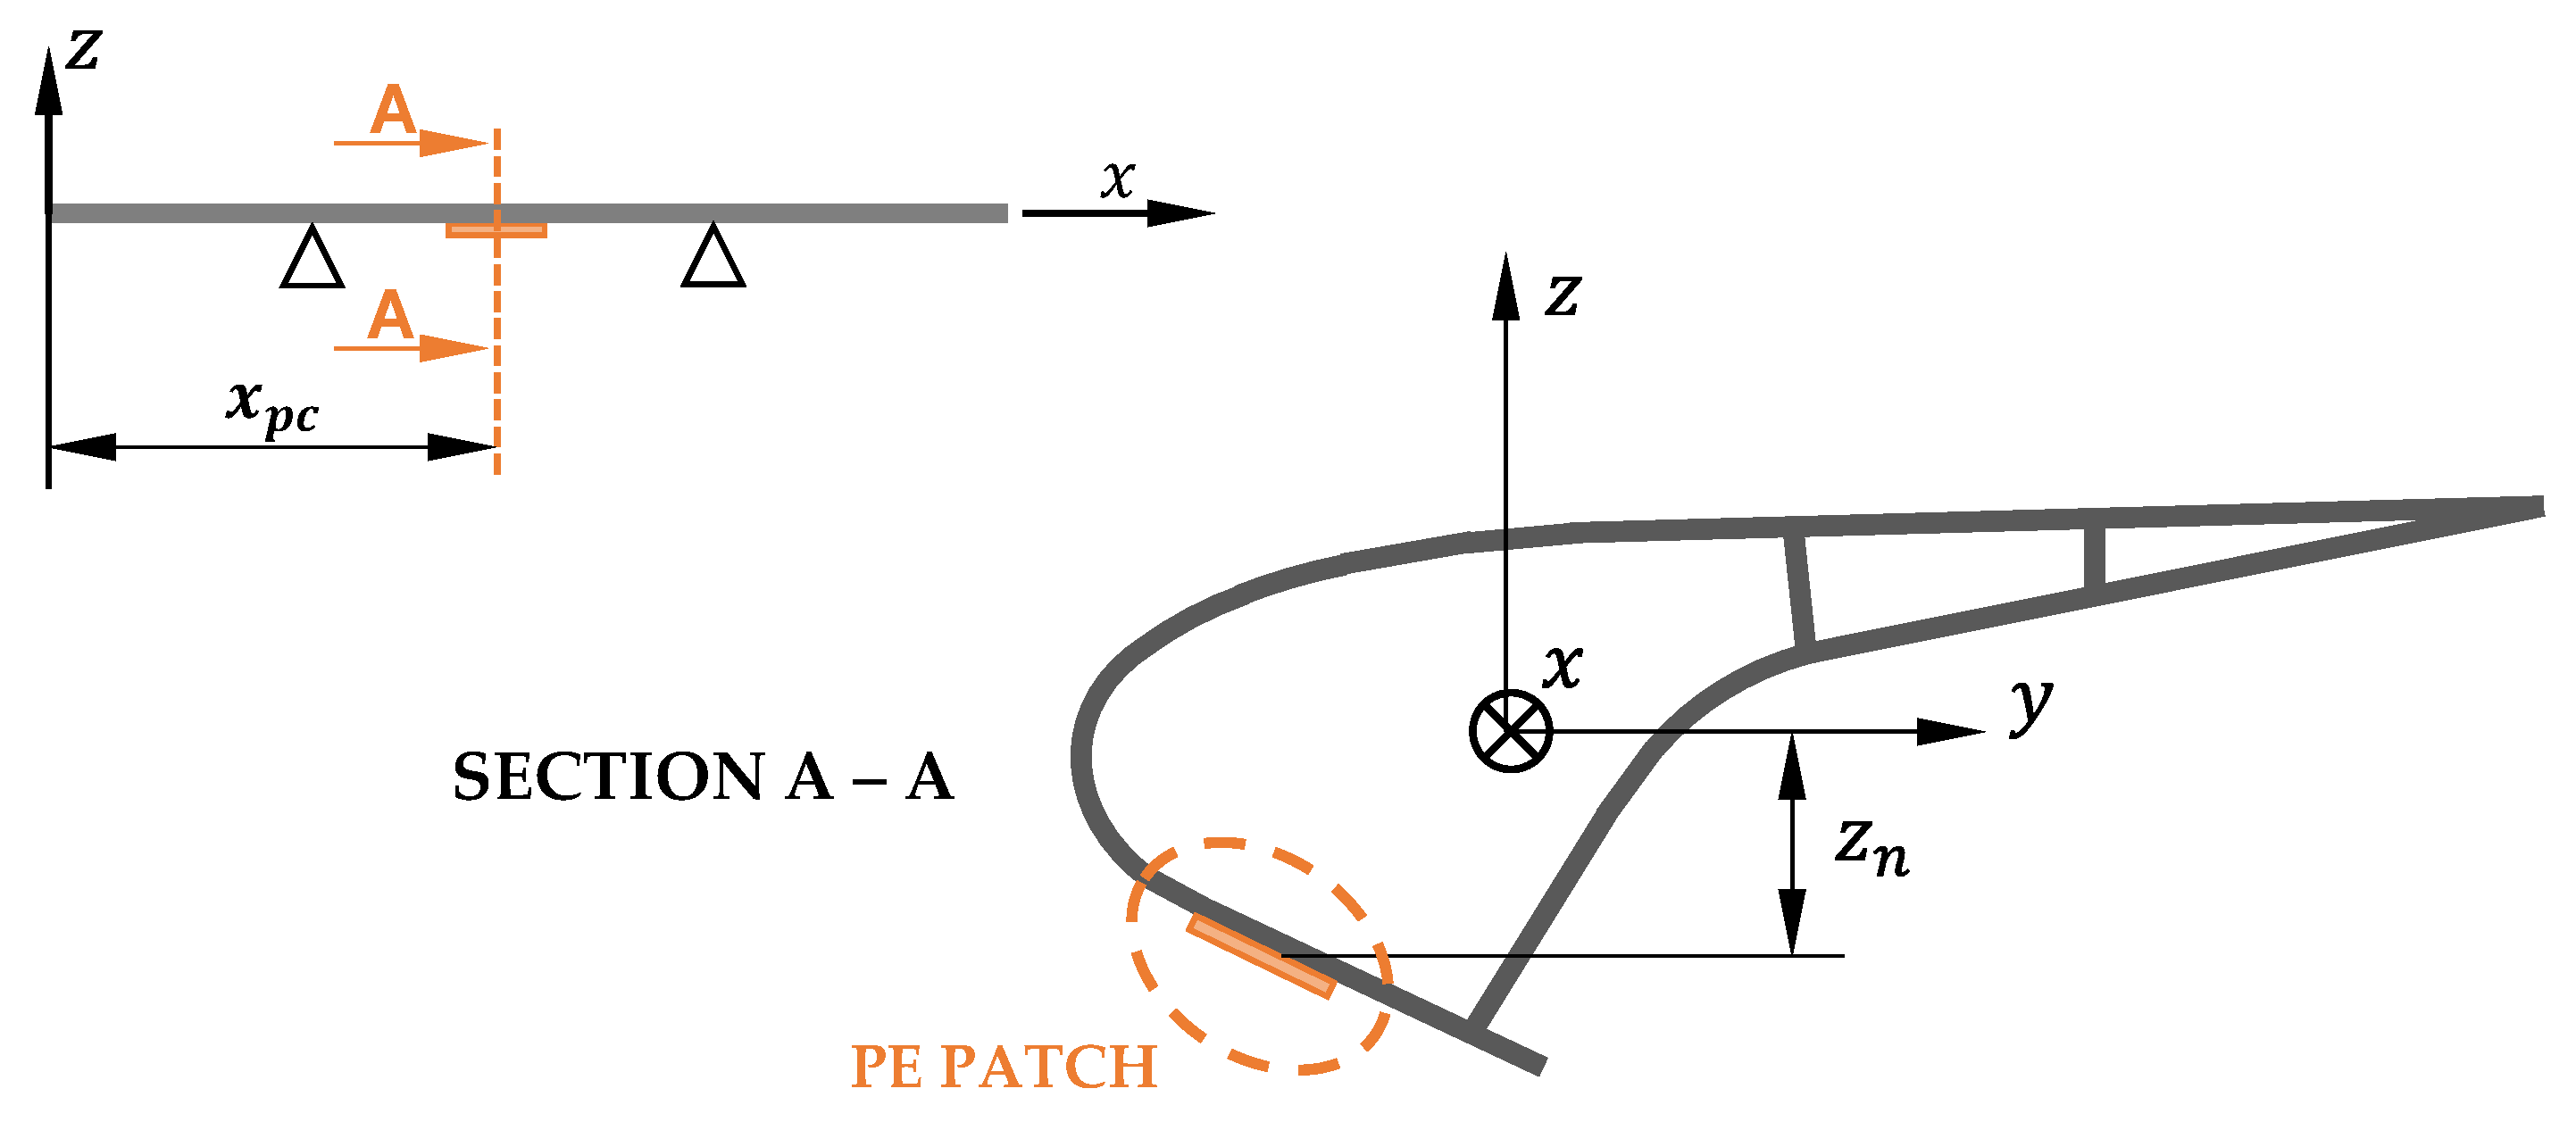
The slat considered in this paper is built by the aerospace company Sonaca Group. It is made of a composite material and has the cross-section shown in Figure 6. The properties of the material and the cross-section, provided by Sonaca, are summarized in Table 1.
A macro fiber composite (MFC) piezoelectric patch manufactured by Smart Material GmbH (patch M8514—P2 in the datasheet of [10]) and directly bonded to the slat skin was considered here. Figure 6 shows the slat, the PE patch, and the global reference frame. The y-axis is aligned to the neutral axis of the slat cross-section. The center of the patch is located at x p c = 1.45 m and z n = 0.025 m.
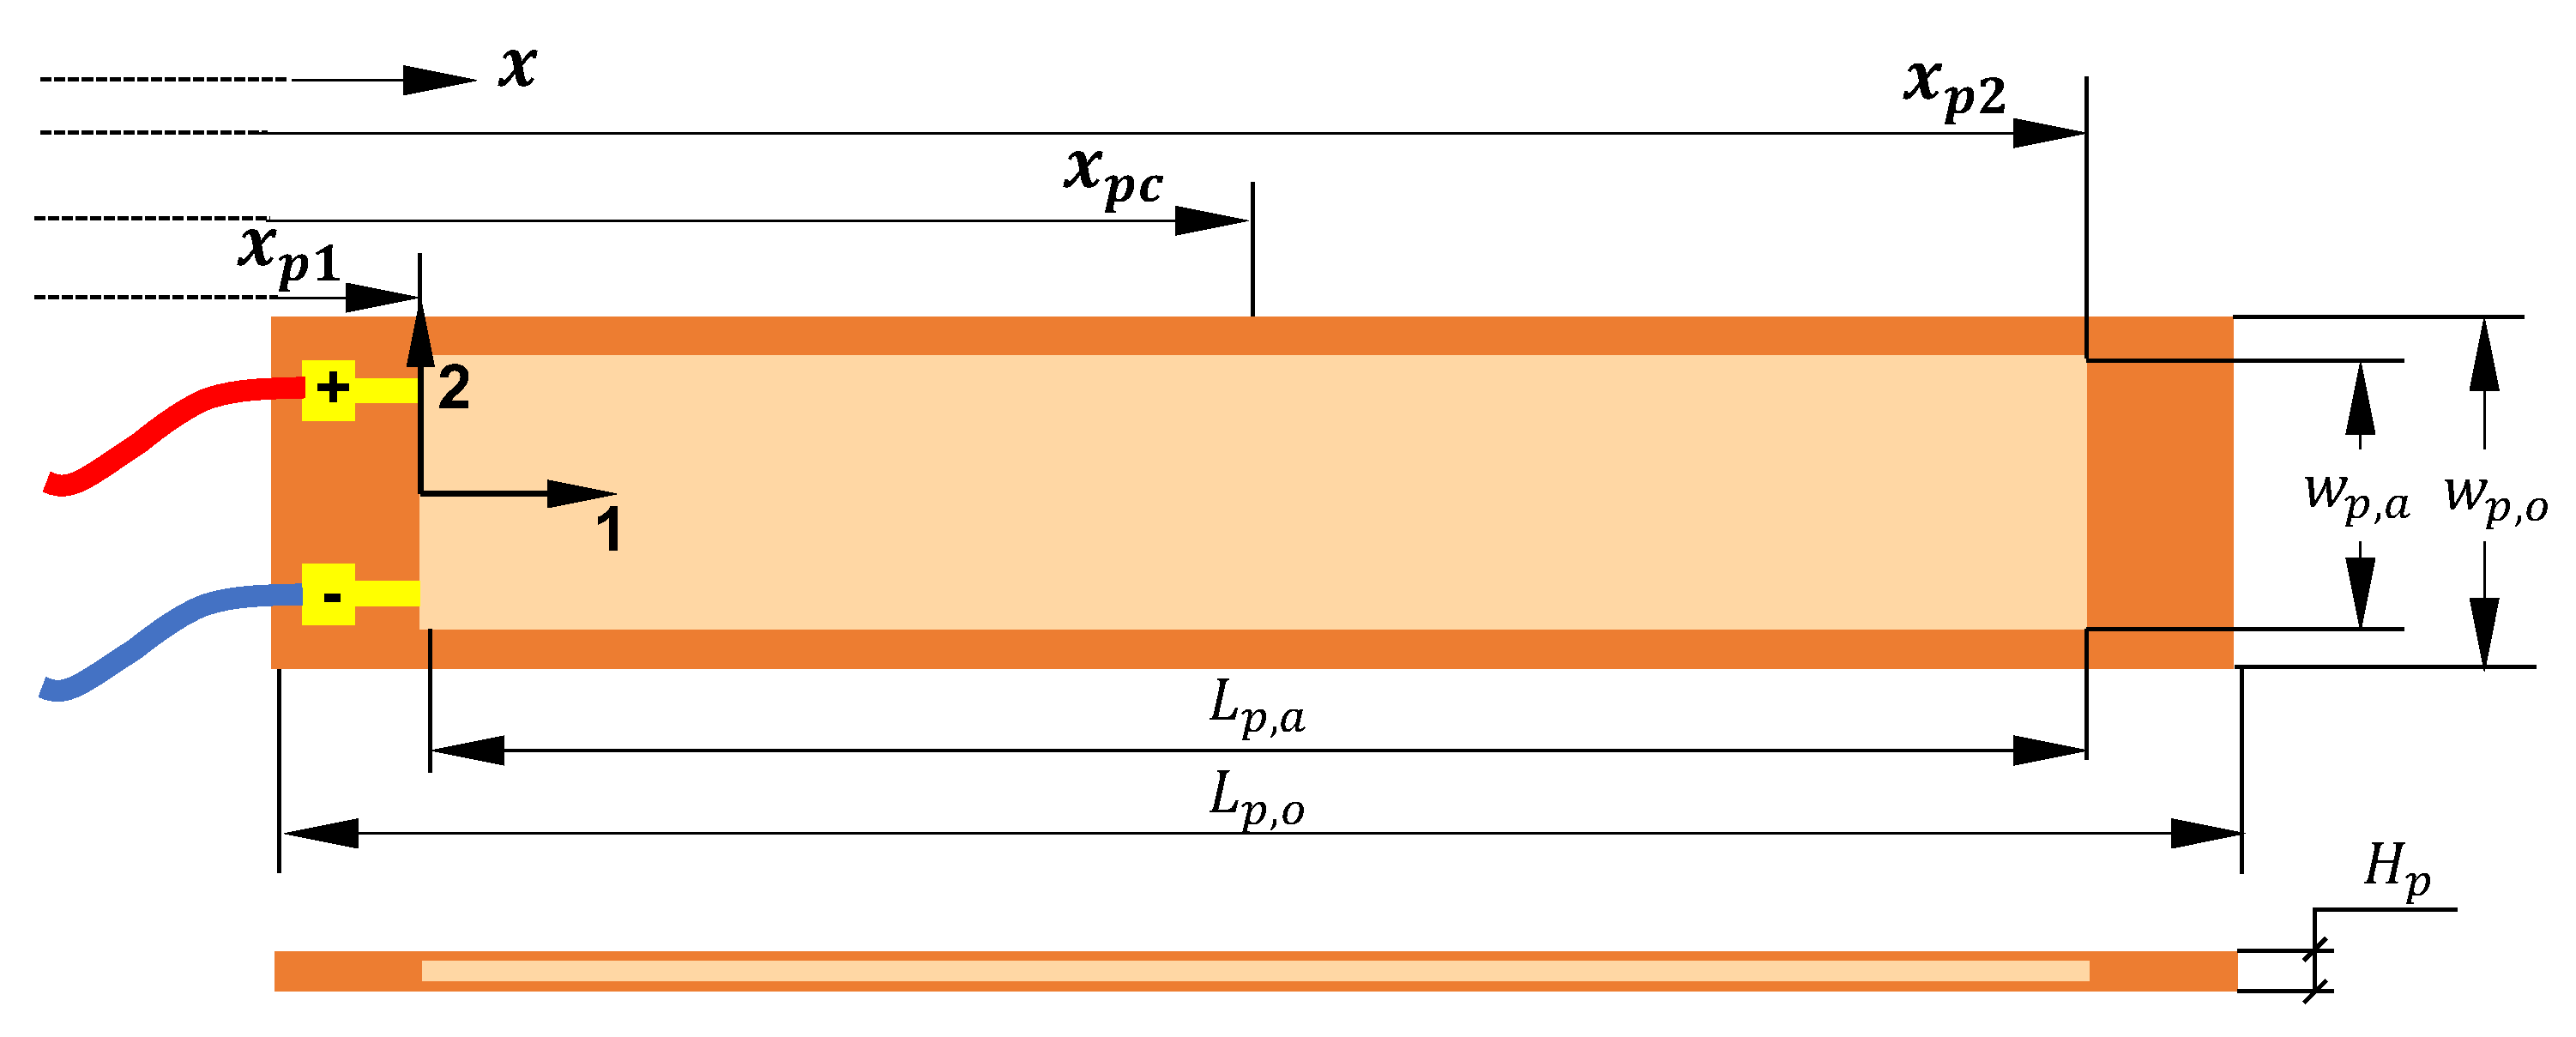
Figure 7 represents the scheme of the M8514—P2 patch and shows the local reference frame and the main dimensions of the patch. The patch is designed to exploit the strain along its longitudinal direction (axis 1), and it is poled along the direction perpendicular to its middle plane (axis 3).
Table 2 shows the values of the geometric parameters depicted in Figure 7.
To exploit the largest strain values, the PE patch is oriented to align its 1-axis with the x-axis of the global reference frame of the slat. Indeed, the slat vibrates in the z-direction due to the transverse load distribution; hence, the axial strain caused by the bending moment distribution is the main contribution.
In Table 3, the electromechanical properties of the considered PE patch are presented.

4. Large-Scale Analytical Model of the Slat

The variable inertia force that excites the slat can be expressed as
q ( x , t ) = ρ A g ( x ) a ( t )
where g ( x ) is a shape function that correlates the acceleration of any point of the slat with the acceleration a ( t ) of one of its supports (the external in the present study); see Figure 2. As demonstrated in [7], the shape function is
g ( x ) = [ α L 2 ( L 1 + L 2 x ) + 1 L 2 ( x L 1 ) ] ,
where α is a parameter related to the slope of the trapezoidal distribution and L 1   and   L 2 are the length of the spans of the slat; see Figure 1a. Here, the parameter α was set to 0.05, while L 1 = 0.81 m and L 2 = 1.38 m [7].
The vibrating slat is considered to be a Euler–Bernoulli beam with constant properties: modulus of elasticity E , cross-section moment of inertia I , mass density ρ , cross-section area A , and coefficient of strain-rate damping c s (a proportional damping is assumed). The equation of the forced vibrations of each of the three spans in Figure 1a ( k = 1 , 2 , 3 ) is
E I 4 w r , k ( x k , t ) x k 4 + c s I 5 w r , k ( x k , t ) x k 4 t + ρ A 2 w r , k ( x k , t ) t 2 = ρ A g ( x k ) a ( t ) k x w r , k ( x k , t ) ,
where k x is the distributed stiffness. The backward electromechanical coupling term [11] is not considered in Equation (5) since the length of the PE patch is much smaller than the overall slat length and because the PE patch is much thinner than the slat.
The first steps of the modal expansion approach are the calculations of the natural frequencies and modes of vibration of the undamped system.
The free undamped vibrations for the retracted slat are described by the following homogeneous equation of motion:
E I 4 w r , k ( x k , t ) x k 4 + ρ A 2 w r , k ( x k , t ) t 2 + k x w r , k ( x k , t ) = 0 .
The relative displacement can be expressed as the product of a spatial function ψ k , which represents the deformed shape of the slat, and a time function f [8]:
w r , k ( x k , t ) = ψ k ( x k ) f ( t ) .
By inserting Equation (7) in Equation (6) and separating the variables, it becomes
( E I ρ A 4 ψ k ( x k ) x k 4 + k x ρ A ψ k ( x k ) ) ψ k ( x k ) = f ¨ ( t ) f ( t )
The right-hand side of Equation (8) has the dimension of a squared angular frequency:
( E I ρ A 4 ψ k ( x k ) x k 4 + k x ρ A ψ k ( x k ) ) ψ k ( x k ) = ω 2 .
After some algebraic manipulations, the partial differential equation for the spatial component ψ k of w r , k is obtained:
4 ψ k ( x k ) x k 4 γ 4 ψ k ( x k ) = 0 ,
where
γ 4 = ( ρ A ω 2 E I k x E I ) ,
includes the unknown natural angular frequencies. The solution of differential Equation (10) for each of three spans of the slat ( k = 1 , 2 , 3 ) in Figure 1a takes the form:
ψ k ( x k ) = A k sinh ( γ x k ) + B k cosh ( γ x k ) + C k sin ( γ x k ) + D k cos ( γ x k ) ,
where A k ,   B k ,   C k and D k are unknown coefficients. By imposing the boundary conditions on the three spans of the slat and solving the corresponding eigenvalue problem, as discussed in [7], an infinite discrete set of values γ i is found and the corresponding values ( A k , i ,   B k , i ,   C k , i ,   and   D k , i ) of the unknown coefficients are calculated. From Equation (12), the ith mode of vibration of the slat becomes
ψ k , i ( x i ) = A k , i sinh ( γ i x k ) + B k , i cosh ( γ i x k ) + C k , i sin ( γ i x k ) + D k , i cos ( γ i x k ) ,           k = 1 , 2 , 3
The corresponding natural frequency f n , i of the ith mode of vibration of the slat can be calculated with Equation (11) as follows:
f n , i = 1 2 π γ i 4 E I ρ A + k x ρ A .
Equation (13) shows that the slat has the same modes of vibrations when deployed or retracted. On the other hand, Equation (14) shows that the modes are characterized by different natural frequencies due to the dependence on kx. Therefore, the interaction between the retracted slat and the wing determines an increase in the natural frequency of each mode. 
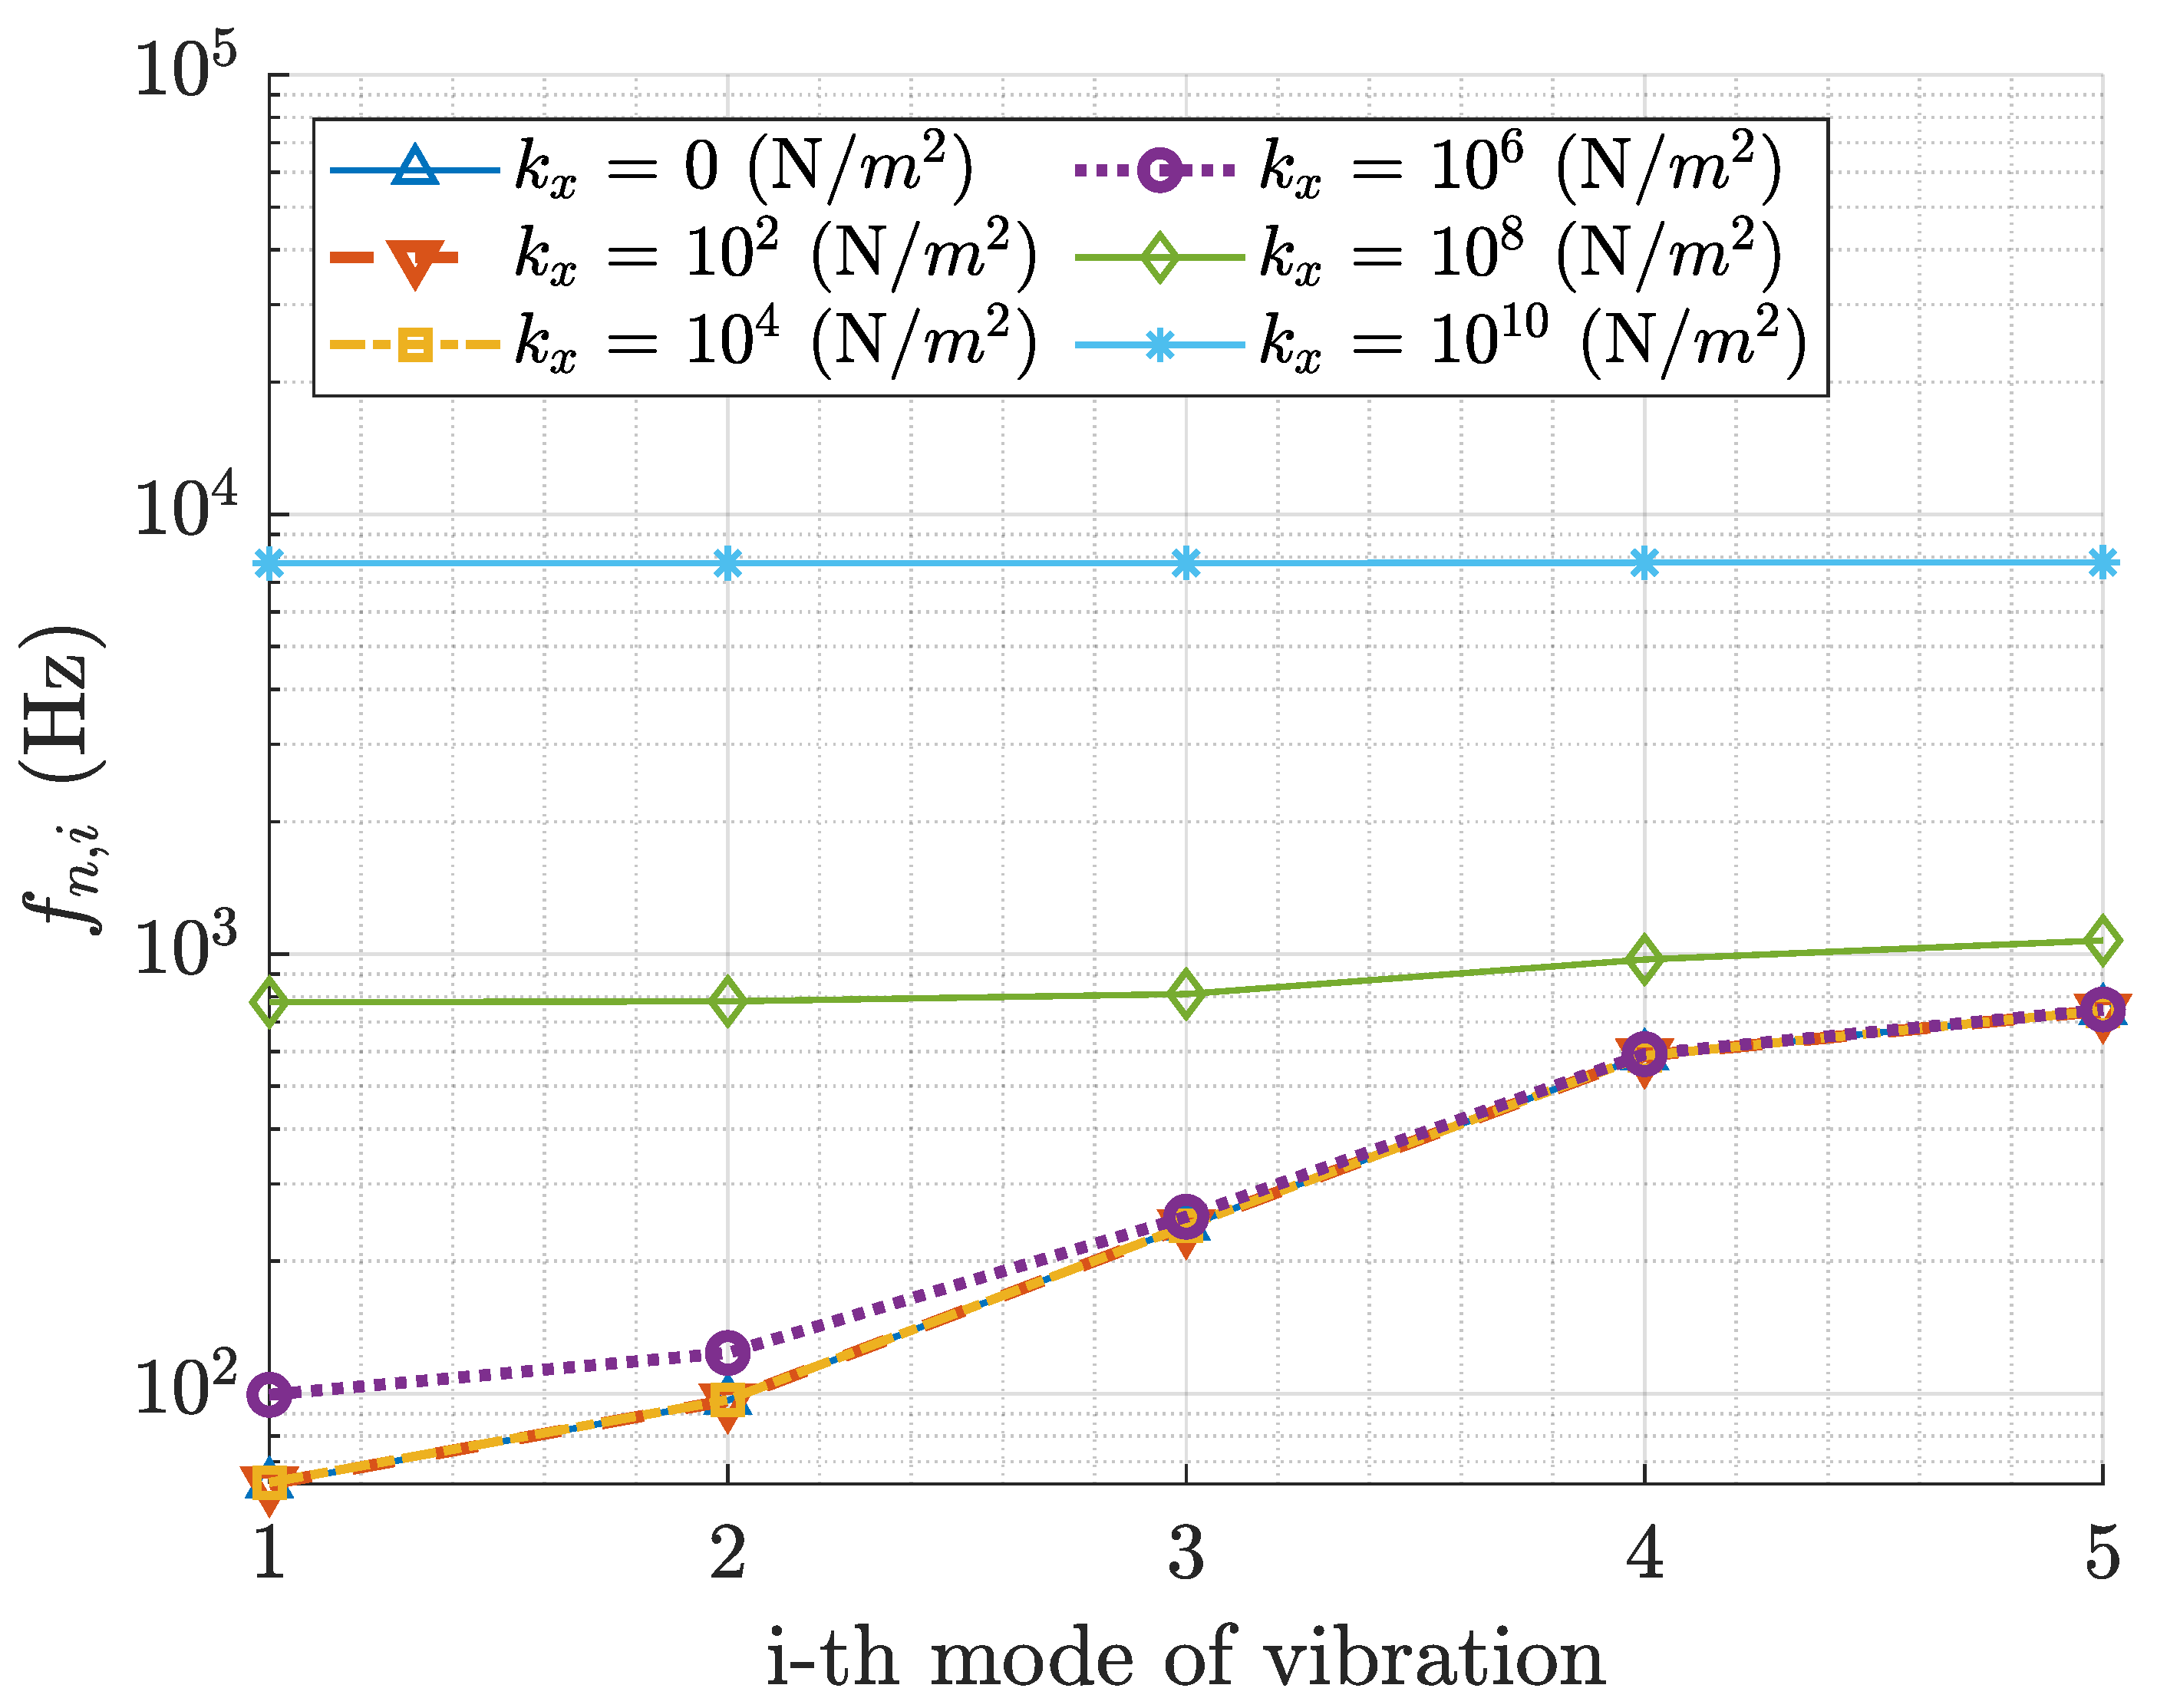
Figure 8 represents the natural frequencies of the first five modes of vibration of the retracted slat as a function of the distributed stiffness kx considering the mechanical properties of the composite slat shown in Table 1.
Figure 8 shows that when the distributed stiffness increases, all the natural frequencies of the modes converge to the same value, which means that the dynamics of the slat are close to those of a rigid body mounted on the distributed stiffness k x . On the contrary, when the distributed stiffness is much smaller than the flexural stiffness of the slat, it has a negligible effect on the natural frequencies.
The relative displacement w r ( x , t ) of any point of the slat can be expressed by using the modal expansion approach as a linear combination of the modes of vibration of the slat [8,11,12]:
w r ( x , t ) = i = 1 + ϕ i ( x ) η i ( t ) ,
where ϕ i ( x ) is the ith mass-normalized mode of vibration (that derives from the non-normalized mode [7]) and η i ( t ) is the ith modal coordinate. Hence, the equation of motion of the ith modal coordinate is obtained by introducing Equation (15) in Equation (5) and applying the orthogonality conditions [9,11]:
η ¨ i ( t ) + 4 π   ζ i   f n , i     η ˙ i ( t ) + 4 π 2 f n , i 2   η i ( t ) = 0 L ρ A   ϕ i ( x )   g ( x ) a ( t ) d x ,
where f n , i and ζ i are the natural frequency and the damping ratio of the ith mode of vibration, respectively.
In the frequency domain, the modal coordinates η i ( t ) and the acceleration a ( t ) are expressed as
η i ( t ) = η 0 , i   e i ω t ,   a ( t ) = a 0   e i ω t .
The frequency response function (FRF) between the modal coordinate amplitude η 0 , i and the amplitude of the acceleration a0 is
F R F η i ( f ) = η 0 , i a 0 = 0 L ρ A ϕ i ( x ) g ( x ) d x 4 π 2 f n , i 2 + 8 π 2 i ζ i f n , i   f 4 π 2 f 2 .
Therefore, only considering N modes of vibration of the slat, if Equation (18) is inserted into Equation (15), the FRF between the amplitude of the relative displacement of any point of the slat and the acceleration a 0 can be calculated as follows:
F R F w ( x , f ) = w r , 0 a 0 = i = 1 N ϕ i ( x ) F R F η i ( f ) .
The bending moment and the shear force along the slat are related to the relative displacement w r ( x , t ) by the following equations:
M ( x , t ) = E I 2 w r ( x , t ) x 2 ,
T ( x , t ) = E I 3 w r ( x , t ) x 3 ,
With harmonic excitation, the bending moment and shear force can be described in the frequency domain using the displacement FRF:
M 0 ( x , f ) = E I 2 x 2 ( i = 1 N ϕ i ( x ) F R F η i ( f ) ) a 0 ,
T 0 ( x , f ) = E I 3 x 3 ( i = 1 N ϕ i ( x ) F R F η i ( f ) ) a 0 ,
Finally, the bending moment and shear force FRFs are defined as
F R F M ( x , f ) = E I i = 1 N 2 ϕ i ( x ) x 2 F R F η i ( f ) ,
F R F T ( x , f ) = E I i = 1 N 3 ϕ i ( x ) x 3 F R F η i ( f ) .
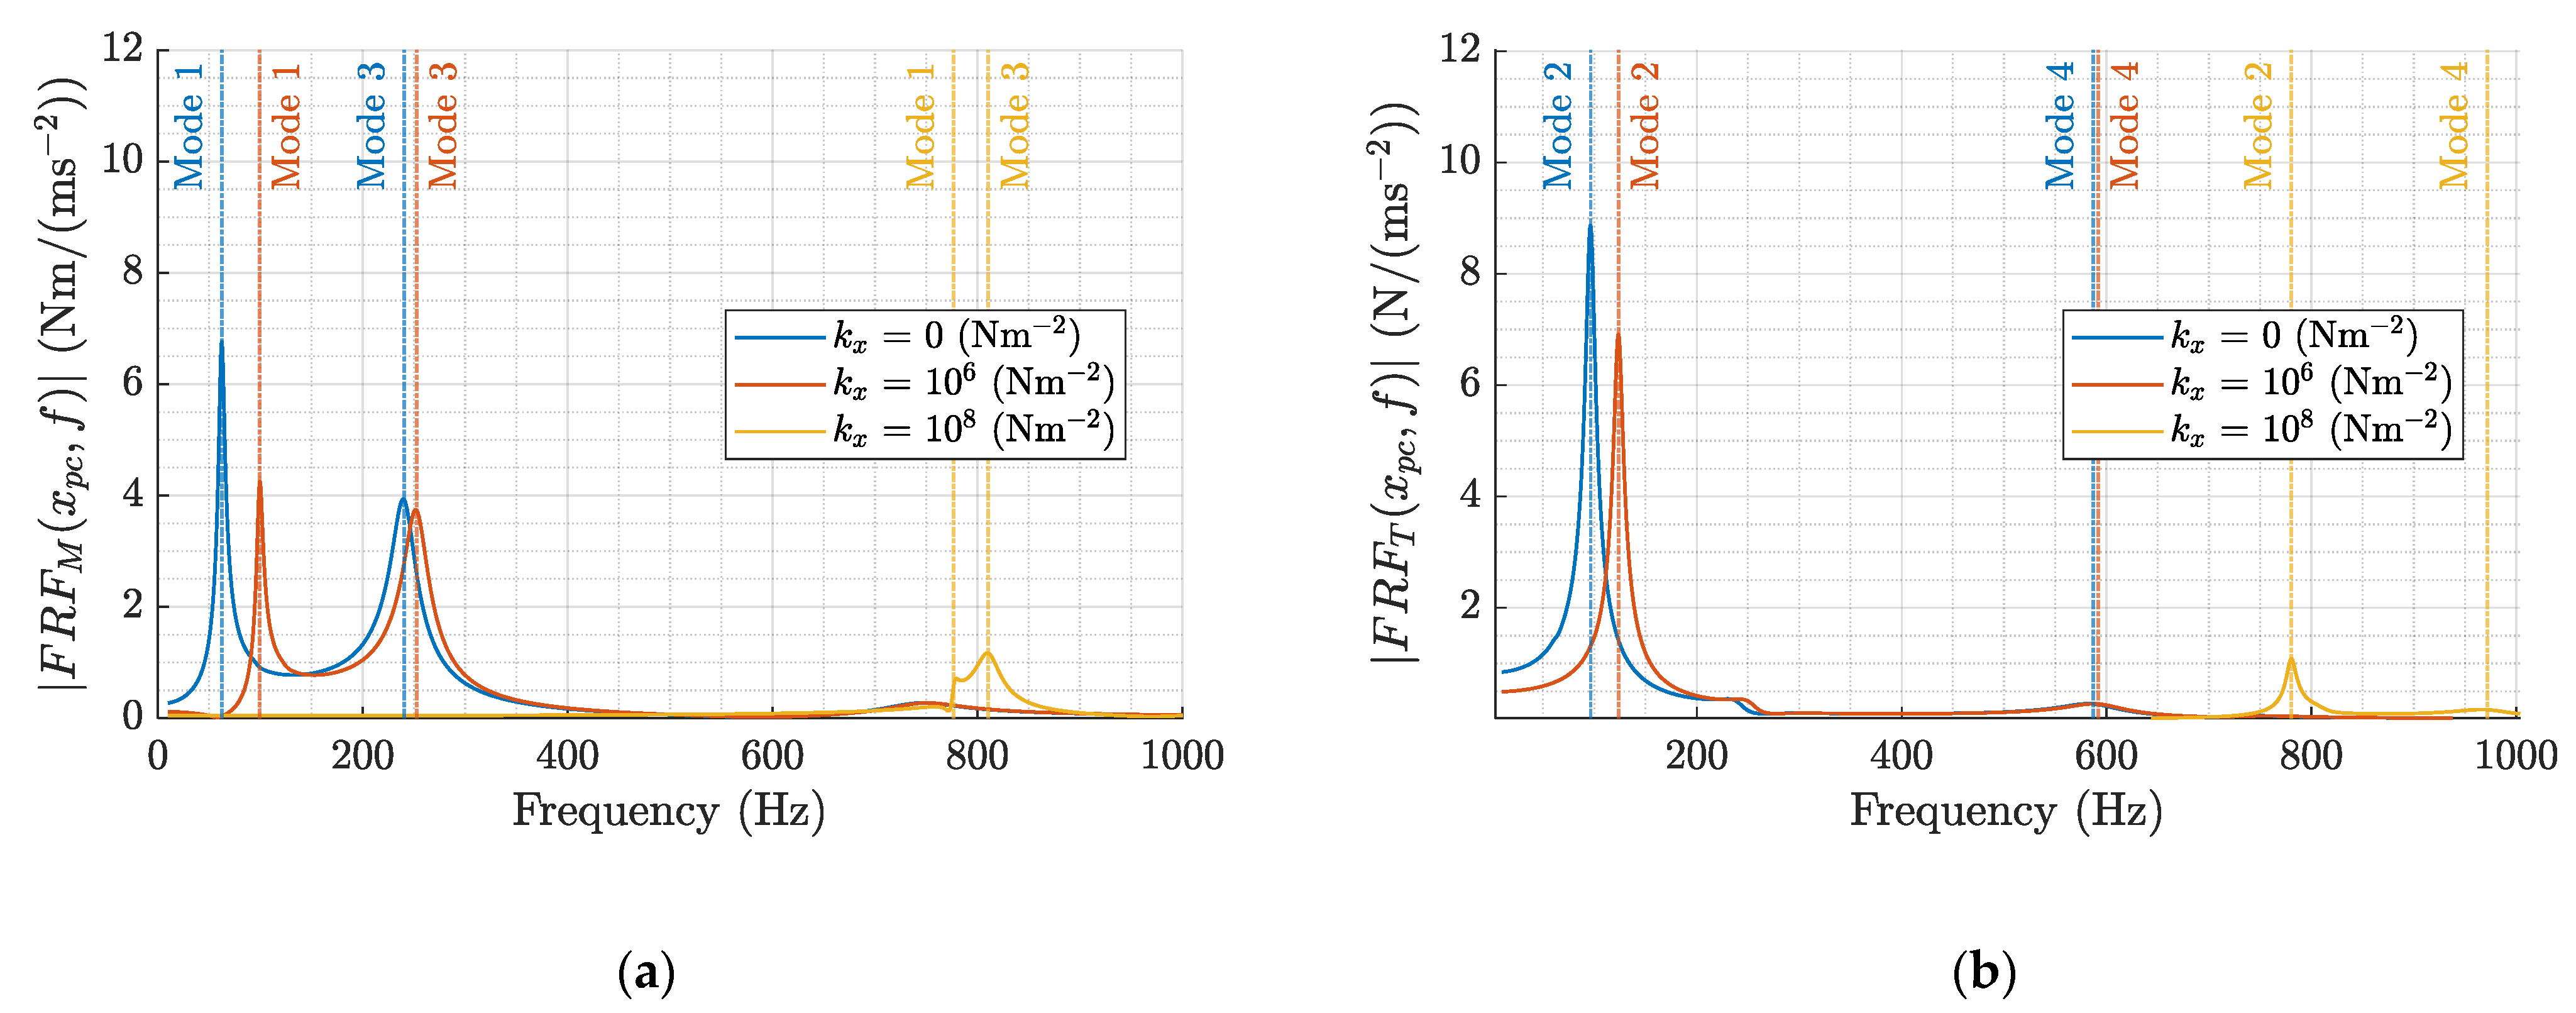
Figure 9 shows the magnitude of the FRFs related to the bending moment and shear force for different values of the distributed stiffness calculated at the center of the PE patch ( x p c ). The magnitude of the bending moment FRF in Figure 9 is characterized by peaks at the natural frequencies of the odd modes, whereas the magnitude of the shear force FRF is characterized by peaks at the natural frequencies of the even modes. Indeed, the bending moment distribution corresponds to symmetric loads acting on a portion of the slat, so it only excites the odd modes, whereas the shear force corresponds to an anti-symmetric load and only excites the even modes.

5. Small-Scale Model of a Portion of the Slat with the PE Patch

5.1. Equivalent Model of a Portion of the Slat

Typically, a PE patch has a longitudinal dimension that is much shorter than the length of the host structure. Moreover, the cross-section dimensions of the harvester are significantly smaller than those of the cross-section of the structure. These large differences in the geometrical dimensions represent an important issue related to the development of the FE model. Indeed, many very thin elements are required to discretize the system in the region close to the PE patch, resulting in a large computational effort. To overcome this drawback, a portion of the vibrating structure containing the PE patch is first considered. Then, the cross-section of this portion is reduced to a simpler and smaller equivalent cross-section to achieve a better aspect ratio between the dimensions of the equivalent cross-section and the ones of the patch.
Figure 10a shows that in each portion of the slat, the external loads are the distributed load q due to inertia force (Equation (3)), the bending moment M , and shear force T exerted by the rest of the slat (subscripts R and L refers to the left and right sides, respectively). The bending moment M L and shear force T L can be calculated from M R , TR and q by means of the equilibrium equations. Since the bending moment M L and shear force T L can also be exerted by the clamp of a cantilever beam, Figure 10b shows that the slat portion can be converted to an equivalent cantilever beam with the same length and forced by the same external loads acting on that portion of the slat. It is worth noticing that the slat portion and the cantilever beam have the same bending moment distribution. The same bending moment distribution causes the same curvature and the same strain and stress distribution, which guarantees the same performance of the PE patch.
The OCV generated by the PE patch depends on the strain distribution within the patch. Since the PE patch is very thin compared with the slat thickness, it is assumed that the strain distribution within the patch coincides with the strain distribution of the slat just below the patch. In this scenario, the OCV generated by the PE patch bonded to the slat can be reproduced by simply bonding the patch to an underlayer, which reproduces the same strain distribution of the slat just below the patch. By assuming a 1D approximation, the strain distribution S ( x ) along the longitudinal direction of the slat subject to a bending moment distribution M f ( x ) can be approximated as
S ( x , t ) = M f ( x , t ) W R ,
where W R = E I / z n is the module of resistance of the slat cross-section, z n is the distance from the neutral axis of the slat, E is the Young’s modulus, and I is the moment of inertia of the cross-section of the slat. Equation (26) shows that two structures loaded by the same bending moment distribution with different cross-section and Young’s modulus values may provide the same strain distribution if they have the same module of resistance. Therefore, it is possible to assume that the equivalent beam has a rectangular cross-section and that the PE patch is bonded to the upper surface of the beam. Figure 11a shows the actual cross-section of the slat, and Figure 11b schematizes the cross-section of the equivalent beam.
The module of resistance W R , e q of the equivalent beam with rectangular cross-section is
W R , e q = E e q I e q z n , e q = E e q B e q H e q 2 6 ,
where B e q and H e q are the width and thickness of the equivalent beam, respectively, and z n , e q = H e q / 2 . Width and thickness ( B e q   and   H e q ) are defined to obtain a suitable aspect ratio between the cross-sections of the beam and the PE patch. Consequently, the module of resistance W R , e q only equals the module of resistance W R of the cross-section of the slat if the Young’s modulus of the equivalent beam takes this value:
E e q = 6 E I z n B e q H e q 2 .

5.2. Finite Element Model

The numerical FE model of the patch can be implemented in COMSOL Multiphysics®.
As previously mentioned, the equivalent beam has a rectangular cross-section, and the PE patch is bonded to the top side of the beam. Table 2 shows that the PE patch has an overall length and width of 0.1 m and 0.018 m, respectively. However, the active portion of the patch, containing the piezoelectric material, has smaller dimensions. Indeed, the active portion is enclosed by a polymeric material (Kapton). The length of the equivalent beam was chosen to be slightly longer than the active portion of the PE patch. The width of the beam is equal to the width of the patch. The determination of the thickness of the equivalent beam must consider that the FE model will be used to perform a frequency domain analysis. The equivalent cantilever beam has its own natural frequency ( f n , e q ) that can be excited by the applied loads but does not correspond to an actual natural frequency of the slat:
f n , e q = 1.875 2 2 π L e q 2 E e q B e q H e q 3 12 ρ e q A e q .
Hence, the thickness H e q was defined to have a natural frequency of the equivalent beam far from the range of frequency of interest (above 2000 Hz). Table 4 shows the geometrical features of the FE model.
The cross-section area and moment of inertia of the equivalent beam can be easily calculated using the formulas of the rectangular cross-section. Finally, the equivalent Young’s modulus is obtained from Equation (28). The density of the beam is determined by assuming the mass per unit length μ e q of the beam equal to that of the slat μ , yielding
ρ e q = μ A e q .
Table 5 presents the mechanical parameters of the equivalent beam.
Since the geometry of the equivalent beam in Figure 11b is symmetric with respect to the x–z plane, the model only considers one half of the system to reduce the computational effort; see Figure 12a.
The constitutive equations of a PE material allow for electromechanical coupling in the multiphysics problem. The strain-charge and stress-forms are available in COMSOL Multiphysics®. In this analysis, the strain-charge form was adopted, since it leads to a drastic reduction in the number of material constants when some assumptions are made. The constitutive equations in the strain-charge form are as follows [12]:
{ S 1 S 2 S 3 S 4 S 5 S 6 D 1 D 2 D 3 } = [ s 11 E s 12 E s 13 E s 14 E s 15 E s 16 E d 11 d 21 d 31 s 21 E s 22 E s 23 E s 24 E s 25 E s 26 E d 12 d 22 d 32 s 31 E s 32 E s 33 E s 34 E s 35 E s 36 E d 13 d 23 d 33 s 41 E s 42 E s 43 E s 44 E s 45 E s 46 E d 14 d 24 d 34 s 51 E s 52 E s 53 E s 54 E s 55 E s 56 E d 15 d 25 d 35 s 61 E s 62 E s 63 E s 64 E s 65 E s 66 E d 16 d 26 d 36 d 11 d 12 d 13 d 14 d 15 d 16 ε 11 T ε 12 T ε 13 T d 21 d 22 d 23 d 24 d 25 d 26 ε 21 T ε 22 T ε 23 T d 31 d 32 d 33 d 34 d 35 d 36 ε 31 T ε 32 T ε 33 T ] { T 1 T 2 T 3 T 4 T 5 T 6 E 1 E 2 E 3 }
where S i are the mechanical strain components ( 6 × 1 ), D i represents the electric displacement components ( 3 × 1 ), T j represents the mechanical stress components (6 × 1), E j represents the electric field components ( 3 × 1 ), s i j E represents the compliance constants in a constant electric field ( 6 × 6 ), d i j represents the piezoelectric strain constants ( 3 × 6 ), and ε i j T represents the permittivity constants at constant stress ( 3 × 3 ). Therefore, the full characterization of a piezoelectric material requires 63 material constants. The following assumptions that are usually made when thin piezoelectric layers are considered [13] can be introduced:
  • Electrodes of the PE material acting along the 3-axis of the local reference frame of the material, i.e., E1 = E2 = 0, E3 ≠ 0.
  • Thin beam, i.e., T 2 = T 3 = T 4 = T 5 = T 6 = 0 ,   T 1 0 .
  • Orthotropic material.
In this case, the 9 × 9 matrix of material constants in Equation (31) can be reduced to a 2 × 2 symmetric matrix with only three material constants. The reduced constitutive equation becomes [6]
{ S 1 D 3 } = [ s 11 E d 31 d 31 T ε 33 T ] { T 1 E 3 }
The compliance constant s 11 E and the piezoelectric strain constant d31 are provided in the datasheet of the considered PE patch [10]. The permittivity constant ε 33 T is not provided in the datasheet; however, it can be calculated as [4,6]
ε 33 T = ε 0 C p H p w p L p + d 31 2 s 11 E
where ε 0 is the vacuum permittivity. Table 3 and Table 6 represent the electromechanical parameters of the PE patch implemented in COMSOL.
Two mechanical boundary conditions are applied to the model (Figure 12a). Firstly, a fixed constraint to the clamped surface of the cantilever beam is imposed. Secondly, a symmetry condition is imposed on the surfaces of the beam and the patch belonging to the plane of symmetry. Finally, both the beam and the piezo are loaded by a distributed load per unit length corresponding to the inertia force obtained from Equations (3) and (4).
Two electrostatic boundary conditions are applied (Figure 12b). A floating potential is imposed on the top side of the PE patch, whereas its bottom side is set to ground potential. In this way, the value of the floating potential, which is computed from the solution of the multiphysics problem, corresponds to the OCV at the patch terminals.
The geometry is discretized by using a mapped mesh (second-order FE elements), which is obtained by extruding a quadrilateral mesh (element size range 0.5 1 mm). To obtain accurate results, four elements are used along the thickness of the beam and six elements are used along the thickness of the patch. Figure 13 shows the mapped mesh used to discretize the geometry.

6. Numerical Results

6.1. Validation of the Integrated Analytical–Numerical Method

If the PE layer is directly bonded to the slat surface, the OCV FRFs can be calculated both by means of the integrated model proposed in this paper and by means of the analytical model presented in [7] modified to consider contact stiffness k x . Figure 14 compares the magnitude of the calculated OCV FRF considering k x = 0   Nm 2 (deployed slat, Figure 14a) and k x = 10 6   Nm 2 (retracted slat, Figure 14b).
Figure 14a,b shows that the integrated and analytical models, respectively, were in good agreement, even if different values of k x were adopted.

6.2. Effect of Contact Stiffness on Generated Voltage

The deployment and retraction of the slat modify the contact stiffness between the slat and the wing and influence the generated voltage. To analyze this effect, a parametric analysis was carried out by means of the integrated model. The scheme in Figure 5 shows that the numerical OCV FRF, obtained using COMSOL, could be imported in MATLAB to calculate the V R M S using Equations (1) and (2). Figure 15 represents the V R M S generated by the PE patch as a function of the distributed stiffness k x . It can be noted that the effect of kx on voltage output was only valuable above 10 6 Nm−2. For large values of k x the generated voltage drastically decreased because the slat began to behave as a rigid body connected to the wing edge. These results agreed with the trend of the natural frequencies against contact stiffness, which is presented in Figure 8.

6.3. Effect of Interposed Layers on Performance

The integrated model was found to be suitable for analyzing the effect of the interposed layers between the PE patch and the slat skin. Typical layers are the ones of the adhesive and Kapton, which are used to seal the PE material. The PE layer can be embedded into a more complex electric generator, such as the one presented in [6,14], which was a hybrid Thermo–Piezoelectric Generator (TPEG). Hence, not only adhesive and Kapton layers but also thermoelectric and conductive layers may be interposed between the PE layer and the surface of the structure. Finally, the FE model also allows for the evaluation of the performance of several PE generators piled one onto the other to increase the total generated electric power.
In the framework of this research, a layer of an isotropic polymeric material was added to the FE model. Figure 16 shows the cross-section of the model.
The layer can be made of two different materials: Material 1 has the mechanical properties typical of polymers such as epoxy and Kapton; Material 2 has a Young’s modulus about one order of magnitude smaller than that of Material 1. The geometrical and mechanical properties of the added layers are shown in Table 7. It is worth noticing that the Young’s modulus of the added layers was about one/two orders of magnitude smaller than the ones of the PE and slat materials.
A series of parametric simulations was carried out to evaluate the generated voltage as a function of the thickness H a of the polymeric layer. It was assumed that k x = 0   Nm 2 (deployed slat). The model was discretized using the same mesh as the previous simulations. The polymeric layer was discretized using five elements along its thickness. Figure 17a shows the RMS values of the generated OC voltage as a function of the thickness of the interposed layer and the Young’s modulus of the polymeric layer. Figure 17b shows the distance of the center of the PE patch from the neutral axis of the equivalent beam.
Figure 17 highlights that moving away the center of the PE patch from the neutral axis increased its performance, since, as shown in Equation (26), the strain within the patch increased. However, this advantageous effect gradually decreased, since the strain was not correctly transmitted from the slat to the patch when the thickness of the interposed polymeric layer was very large. Indeed, for large thicknesses, the distance from the neutral axis linearly increased, whereas the performance showed a decrease in the growth rate.
The comparison between the two curves of Figure 17 shows that if the polymeric layer had a small Young’s modulus, the positive effect due to the increased distance from the neutral axis vanished for smaller values of thickness.
It is worth noticing that if the PE patch was located inside the slat structure, the increase in the polymeric layer thickness led to a small decrease in the distance from the neutral axis, with a reduction in the generated voltage.

7. Conclusions

An integrated analytical–numerical model for the prediction of the voltage generated by a small PE patch mounted on a long slender body that vibrates due to random excitation has been presented and applied to a wing slat.
The introduction of a variable contact stiffness between the slat and the wing edge makes it possible to simulate the behavior of the PE patch, both when the slat is retracted and when the slat is deployed. Numerical results showed that the PE patch generated much less voltage when the slat was retracted, because the large contact stiffness reduced the deformability of the slat.
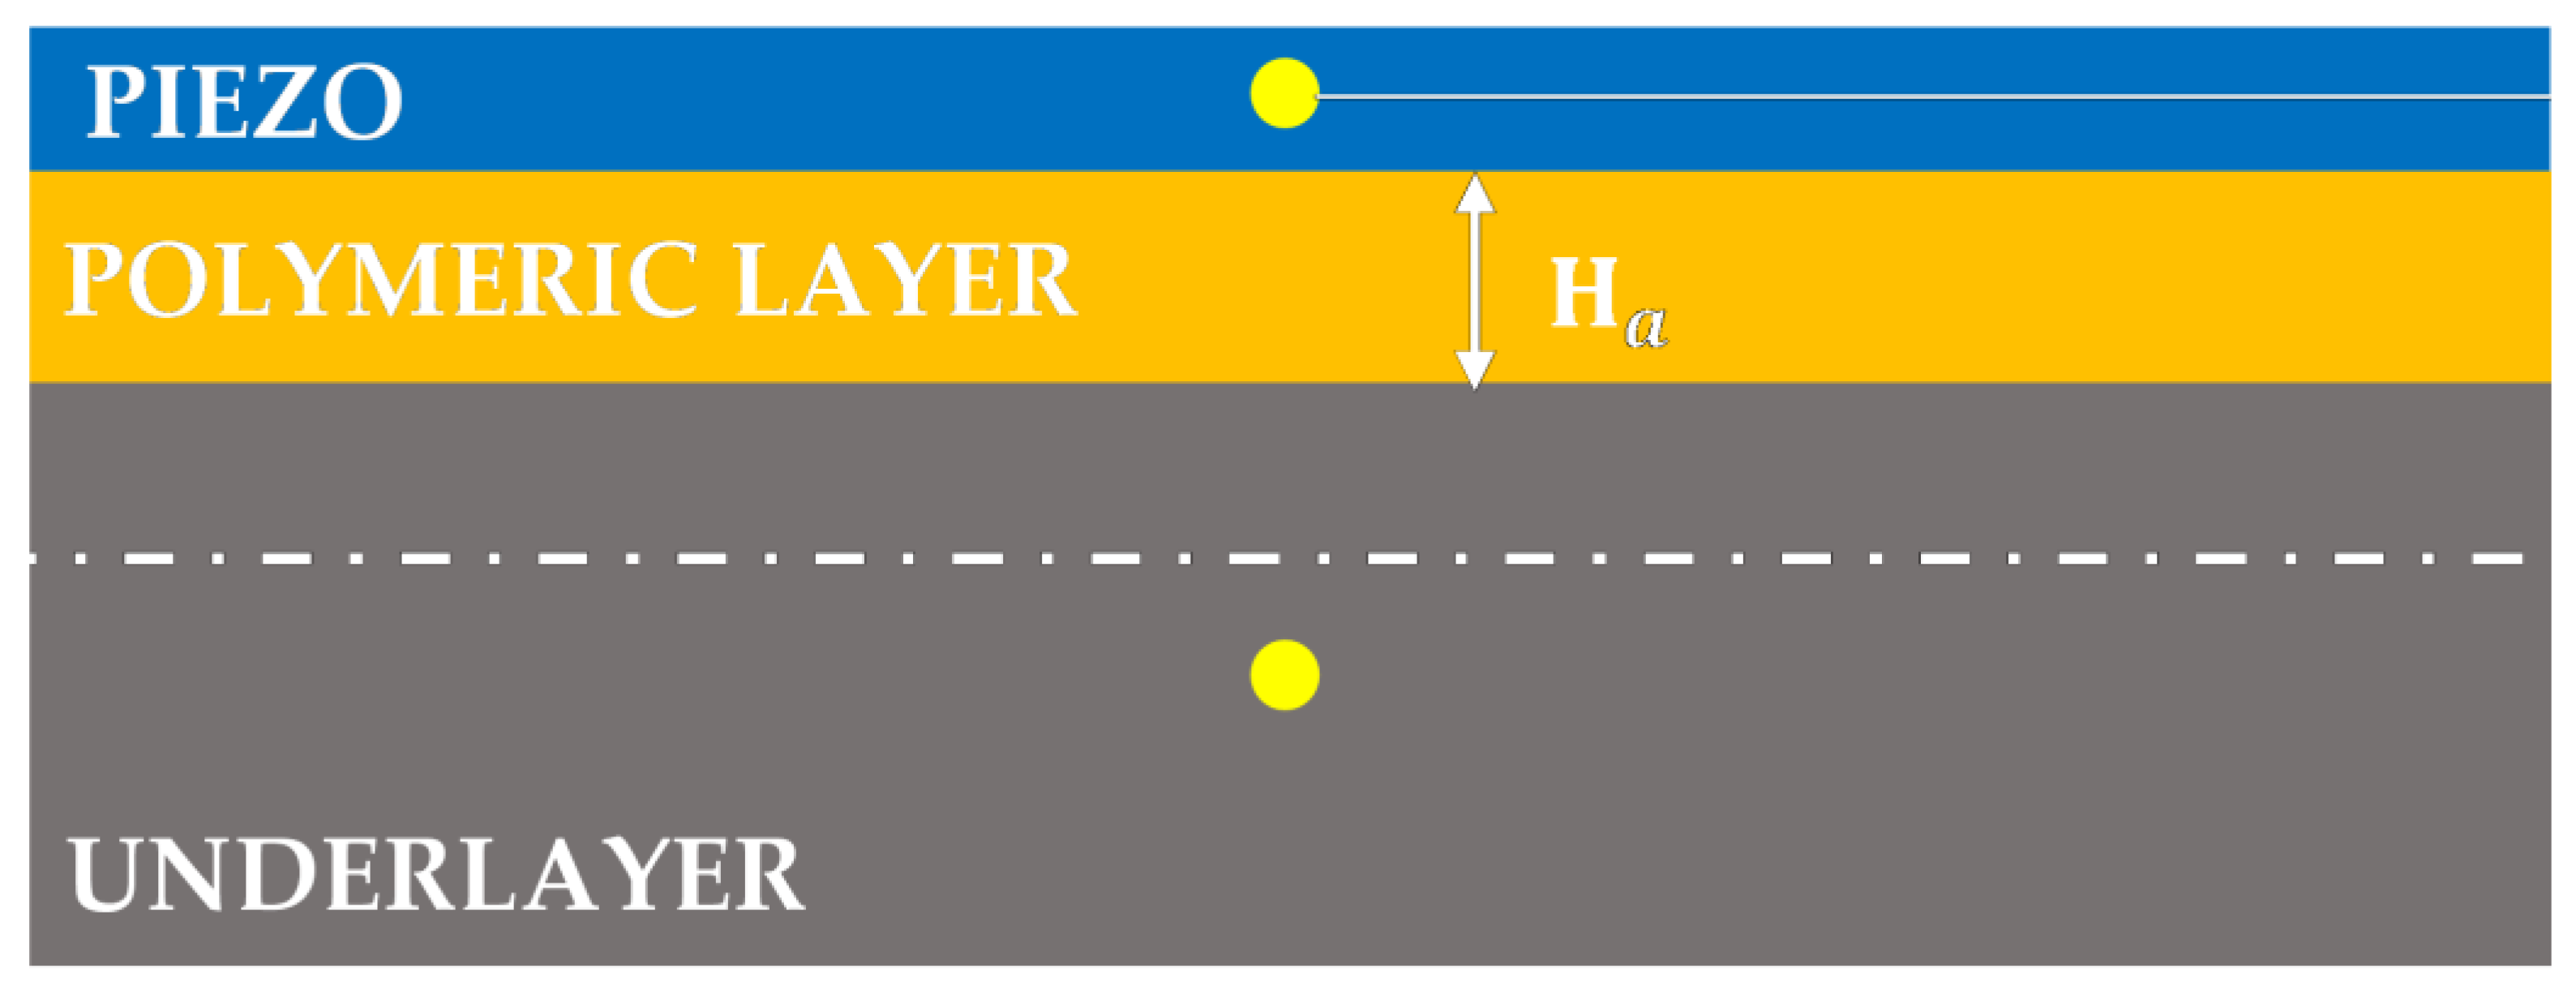
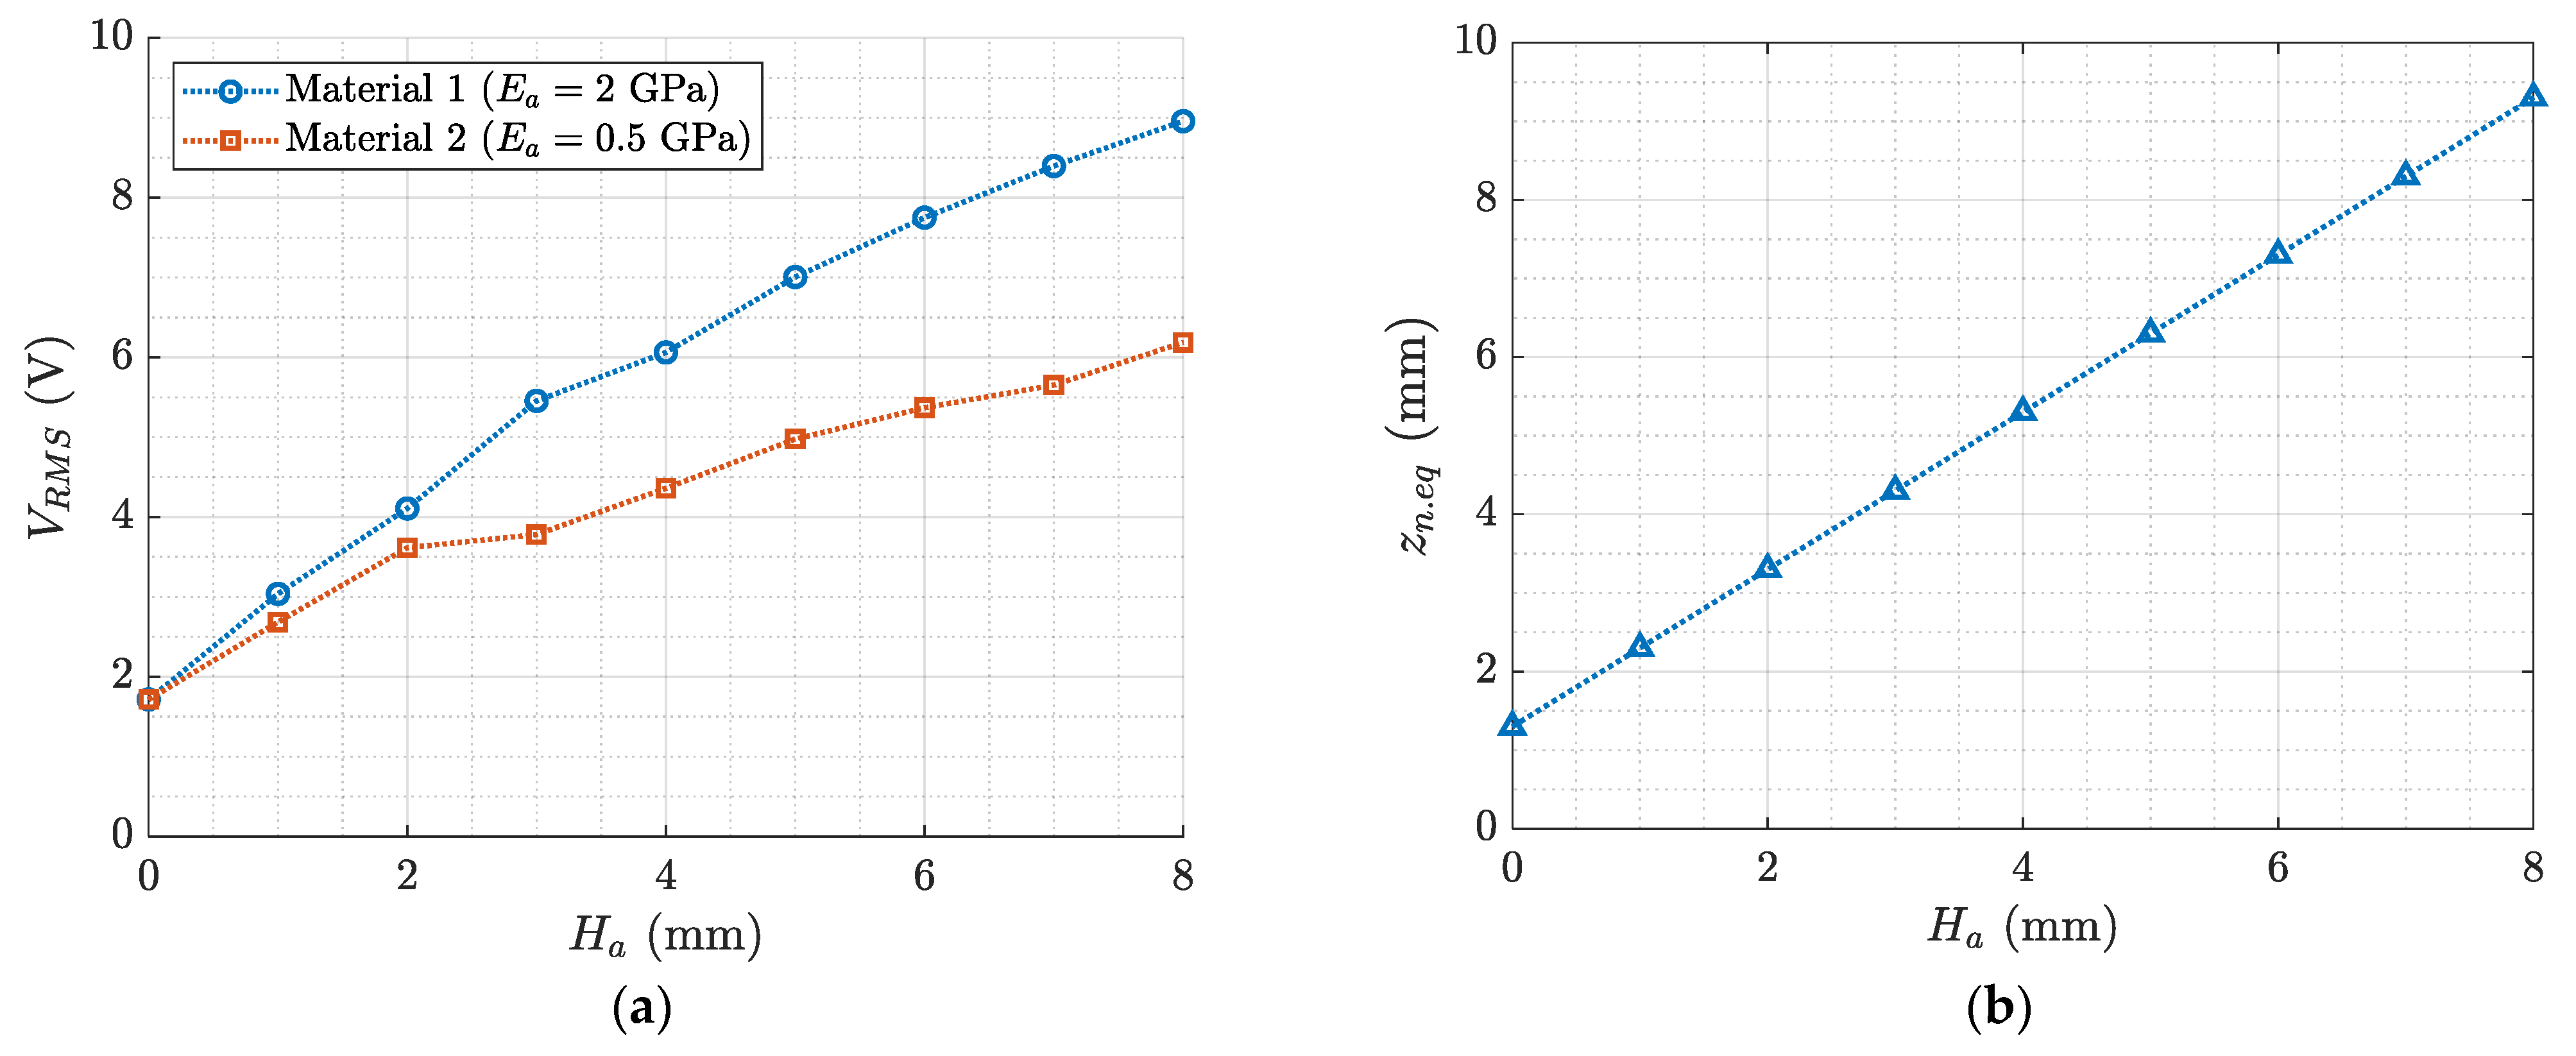
The transmission of the strain from the slat surface to the active PE layer through the intermediate layers (adhesive and protective) is an important issue. To this end, the integrated model was used to simulate the effect of a passive layer of increasing thickness located between the slat and the active PE layer. The results showed that a small increase in the thickness of the intermediate layer had a beneficial effect. This effect was the result of the increase in the distance between the PE layer and the neutral axis of the cross-section caused by the thicker layer. It vanished when the intermediate layer became very thick (some mm with the considered materials).
A further application of the integrated model will be the simulation of more complex sandwich structures such as generators that include both PE harvesters and thermo–electric harvesters based on the Seebeck effect.

Author Contributions

Conceptualization, D.T., F.M., E.Z., J.K. and A.D.; methodology, A.D., F.M. and D.T.; software, A.D., F.M. and D.T.; formal analysis, A.D., F.M. and D.T.; investigation, D.T., F.M., E.Z., J.K. and A.D.; resources, D.T., F.M., E.Z., J.K. and A.D.; data curation, D.T., F.M., E.Z., J.K. and A.D.; writing—original draft preparation, D.T., F.M., E.Z., J.K. and A.D.; writing—review and editing, D.T., F.M., E.Z., J.K. and A.D. All authors have read and agreed to the published version of the manuscript.

Funding

This research was funded by H2020 InComEss project—Innovative polymer-based composite systems for high-efficiency energy scavenging and storage (Project ID: 862597).

Data Availability Statement

Not applicable.

Conflicts of Interest

The authors declare no conflict of interest.

References

  1. Anton, S.R.; Erturk, A.; Kong, N.; Ha, D.; Inman, D. An investigation on multifunctional piezoelectric composite spars for energy harvesting in unmanned aerial vehicles. In Proceedings of the 17th International Conference on Composite Materials, Edinburgh, UK, 27–31 July 2009. [Google Scholar]
  2. Akbar, M.; Curiel-Sosa, J. Piezoelectric energy harvester composite under dynamic bending with implementation to aircraft wingbox structure. Compos. Struct. 2016, 153, 193–203. [Google Scholar] [CrossRef]
  3. Zelenika, S.; Hadas, Z.; Bader, S.; Becker, T.; Gljušcic, P.; Hlinka, J.; Janak, L.; Kamenar, E.; Ksica, F.; Kyratsi, T.; et al. Energy Harvesting Technologies for Structural Health Monitoring of Airplane Components—A Review. Sensors 2020, 20, 6685. [Google Scholar] [CrossRef] [PubMed]
  4. Wood, O.J.; Featherston, C.A.; Kennedy, D.; Eaton, M.J.; Pullin, R. Optimised vibration energy harvesting for aerospace applications. Key Eng. Mater. 2012, 518, 246–260. [Google Scholar] [CrossRef]
  5. Pozzi, M.; Guo, S.; Zhu, M. Harvesting Energy from the Dynamic Deformation of an Aircraft Wing under Gust Loading. In Proceedings of the Health Monitoring of Structural and Biological Systems (SPIE), San Diego, CA, USA, 12–15 March 2012; Volume 8348, pp. 802–812. [Google Scholar]
  6. INCOMESS Project, INnovative Polymer-Based Composite Systems for High-Efficient Energy Scavenging and Storage. Available online: https://www.incomess-project.com/ (accessed on 14 November 2022).
  7. Tommasino, D.; Moro, F.; Bernay, B.; De Lumley Woodyear, T.; de Pablo Corona, E.; Doria, A. Vibration Energy Harvesting by Means of Piezoelectric Patches: Application to Aircrafts. Sensors 2022, 22, 363. [Google Scholar] [CrossRef] [PubMed]
  8. Rao, S.S. Mechanical Vibrations; Addison Wesley: Boston, MA, USA, 1995. [Google Scholar]
  9. Erturk, A.; Inman, D.J. An experimentally validated bimorph cantilever model for piezoelectric energy harvesting from base excitations. Smart Mater. Struct. 2009, 18, 25009. [Google Scholar] [CrossRef]
  10. Datasheet of the MFC manufactured by Smart Material GmbH. Available online: https://www.smart-material.com/MFC-product-propertiesV2.html (accessed on 8 November 2022).
  11. Erturk, A.; Inman, D.J. On mechanical modeling of cantilevered piezoelectric vibration energy harvesters. J. Intell. Mater. Syst. Struct. 2008, 19, 1311–1325. [Google Scholar] [CrossRef]
  12. Erturk, A.; Inman, D.J. Piezoelectric Energy Harvesting; John Wiley & Sons: Hoboken, NJ, USA, 2011. [Google Scholar]
  13. Erturk, A.; Inman, D.J. A distributed parameter electromechanical model for cantilevered piezoelectric energy harvesters. Am. Soc. Mech. Eng. J. Vib. Acoust. 2008, 130, 41002. [Google Scholar] [CrossRef]
  14. Doraghi, Q.; Khordehgah, N.; Żabnieńska-Góra, A.; Ahmad, L.; Norman, L.; Ahmad, D.; Jouhara, H. Investigation and Computational Modelling of Variable TEG Leg Geometries. ChemEngineering 2021, 5, 45. [Google Scholar] [CrossRef]
Figure 1. (a) Scheme of the deployed slat; (b) scheme of the retracted slat.
Actuators 12 00029 g001
Figure 2. Vibrating slat. The inertia force causes an elastic deformation with respect to the rigid body motion.
Actuators 12 00029 g002
Figure 3. Physical model of the slat excited by the trapezoidal distribution of the inertia force.
Actuators 12 00029 g003
Figure 4. PSD of the acceleration of the external support of the slat.
Actuators 12 00029 g004
Figure 5. Scheme of the analytical–numerical method.
Actuators 12 00029 g005
Figure 6. Scheme of the PE patch attached to the slat skin.
Actuators 12 00029 g006
Figure 7. Scheme of M8514—P2 patch (main dimensions and the local reference frame are depicted).
Actuators 12 00029 g007
Figure 8. Natural frequencies of the first five modes of vibration of the retracted slat as a function of the distributed stiffness k x .
Actuators 12 00029 g008
Figure 9. (a) Magnitude of the bending moment FRF; (b) magnitude of the shear force FRF.
Actuators 12 00029 g009
Figure 10. (a) Equilibrium of a portion of the slat.; (b) equilibrium of the equivalent cantilever beam.
Actuators 12 00029 g010
Figure 11. (a) Actual slat structure cross-section; (b) cross-section of the equivalent beam.
Actuators 12 00029 g011
Figure 12. (a) Boundary conditions for mechanics.; (b) boundary conditions for electrostatics.
Actuators 12 00029 g012
Figure 13. Mapped mesh used to discretize the geometry.
Actuators 12 00029 g013
Figure 14. Comparison between the magnitudes of the OCV FRFs obtained using the analytical and integrated models. (a) k x = 0   Nm 2 ; (b) k x = 10 6   Nm 2 .
Actuators 12 00029 g014
Figure 15. V R M S vs. k x . The values of V R M S were derived from the numerical OCV FRFs obtained in COMSOL.
Actuators 12 00029 g015
Figure 16. Cross-section of the model with the interposed layer.
Actuators 12 00029 g016
Figure 17. (a) RMS value of OCV vs. thickness H a of the interposed layer and the Young’s modulus E a of the interposed layer; (b) distance z n , e q of the center of the PE patch from the neutral axis.
Actuators 12 00029 g017
Table 1. Mechanical properties of the slat.
ParameterUnitValue
Young’s modulus ( E ) GPa 45
Density ( ρ ) kg   m 3 1800
Cross-section area ( A ) m 2 2347.6 × 10 6
Cross-section moment of inertia ( I ) m 4 2,615,710.7 × 10 12
Table 2. Geometrical parameters of the PE patch.
ParameterUnitValue
Patch overall length ( L p , o ) m 0.100
Patch active length (Lp,a) m 0.085
Patch overall width ( w p , o ) m 0.018
Patch active width ( w p , a ) m 0.014
Patch thickness (Hp) m 0.0003
Coordinate x p 1 m 1.4075
Coordinate x p c m 1.450
Coordinate x p 2 m 1.4925
Table 3. Electromechanical properties of the PE patch.
ParameterUnitValue
Compliance constant along 1-axis at constant electric field ( s 11 E ) GPa 1 3.296 × 10 11
Piezoelectric strain constant ( d 31 )C N−1 210 × 10 12
Capacitance ( C p )F 84.04 × 10 −9
Table 4. Geometrical features of the FE model.
ParameterUnitValue
Patch length ( L p ) m 0.085
Patch width ( w p ) m 0.014
Patch thickness ( H p ) m 0.0003
Beam length (Leq) m 0.090
Beam width ( w e q ) m 0.014
Beam thickness ( H e q ) m 0.002
Table 5. Mechanical properties of the equivalent cantilever beam.
ParameterUnitValue
Young’s modulus ( E e q ) GPa 5.00 × 10 14
Density ( ρ e q ) kg   m 3 1.51 × 10 5
Cross-section area ( A e q ) m 2 2.80 × 10 5
Cross-section moment of inertia ( I e q )m4 9.33 × 10 12
Natural frequency ( f n , e q ) Hz 2297
Table 6. Electromechanical properties of the PE patch.
ParameterUnitValue
ε 33 T F   m 1 2544 ε 0
Density   ( ρ p ) kg   m 3 5440
Table 7. Electromechanical properties of the added layers.
ParameterUnitValue
Material 1Material 2
Length   ( L a ) m 0.085 0.085
Width   ( w a ) m 0.014 0.014
Young s   modulus   ( E a ) GPa 2 0.5
Poisson s   ratio   ( ν a ) 0.3 0.3
Density   ( ρ a ) kg   m 3 1100 1100
Disclaimer/Publisher’s Note: The statements, opinions and data contained in all publications are solely those of the individual author(s) and contributor(s) and not of MDPI and/or the editor(s). MDPI and/or the editor(s) disclaim responsibility for any injury to people or property resulting from any ideas, methods, instructions or products referred to in the content.

