1. Introduction
An intelligent driving system normally includes perception, prediction, planning, and control modules. Among them, the perception module, the foundation of unmanned driving systems [
1,
2,
3,
4], is a key part of intelligent driving vehicles to interact with the external environment. The accuracy of perceived information has become one of the recent research hotspots in the field of unmanned driving. To realize accurate perception, it is primarily necessary to solve the issue of object detection in the vehicle movement process. At present, the common vehicle detection methods mainly include 2D image object detection, 3D point cloud object detection, and others. The traditional methods used in 2D image object detection chiefly involve the histogram of oriented gradients (HOG), support vector machine (SVM), and the improvement and optimization of the above methods, but these methods are found to have a poor generalization and low recognition accuracy [
5,
6]. As deep learning technology progresses forward, image object detection methods are being widely used [
7,
8], representative ones including R-CNN [
9], Fast R-CNN [
10], Faster R-CNN [
11], YOLO [
12], and SSD [
13]. However, there are certain limitations of machine vision-based 2D object detection methods used for unmanned vehicles to accurately obtain environmental information, mainly because machine vision, as a passive sensor, is sensitive to the light intensity when providing high-resolution images, and produces poor imaging effect in obscured and dimly lit environments [
14]. Meanwhile, the imaging principle of machine vision based on perspective projection may cause the absence of distance information in the images, which poses difficult for machine vision to achieve accurate 3D positioning and distance measurement [
15].
As an active sensor, LiDAR demonstrates its superior performance in object detection by measuring the reflected light energy and converting the surrounding environment into 3D point cloud data. Current methods for 3D object detection based on LIDAR point cloud include two main types: One involves the voxelization of point clouds, such as VoxelNet [
16] and OcNet [
17], and the other is the projection of point cloud onto a 2D plane, such as PIXOR [
18] and BirdNet+ [
19]. Among them, VoxelNet, based on prior knowledge, divides the point cloud space into several voxels at equal distances in length, and height and encodes them, followed by the realization of object detection through a region proposal network. PIXOR is to obtain the feature map of a 2D bird’s eye view with height and reflectance as channels gained from the point cloud, and then use RetinaNet [
20] with the fine-tuned structure for object identification and localization. However, due to the sparseness of the LiDAR point cloud, the network based on 3D voxels shows poor real-time performance. However, the mapping process of projecting a point cloud to a 2D plane will cause a partial loss of information in a certain dimension, which affects the detection accuracy.
In recent years, many scholars have made use of information complementation between machine vision and LiDAR to explore new methods in object detection. For example, Premebida et al. [
21] combined LiDAR and an RGB camera for pedestrian detection in 2014 and used a deformable parts model (DPM) to detect pedestrians on a LiDAR dense depth map and RGB images to realize fusion detection. However, its guidance information appeared to be too single, which resulted in complementary values with large errors. Kang et al. [
22] designed a convolutional neural network composed of an independent unary classifier and fused CNN. The network fused the LiDAR 3D point cloud and RGB image to achieve object detection but failed to guarantee real-time performance due to the intense computation involved. In 2017, Chen et al. [
23] proposed the MV3D (multi-view 3D object detection network) method to fuse LiDAR point cloud data with RGB image information. MV3D streamlined the VGG16 network, but as it was based on the KITTI dataset, MV3D took a long time to recognize, making it difficult to meet the real-time requirements for unmanned driving. Based on that, in 2018, Ku et al. [
24] proposed an aggregate view object detection network (AVOD), which improved the detection rate and was able to meet the real-time requirement of unmanned driving systems but with declined detection accuracy. To sum up, there are still some limitations in current information fusion detection methods of LiDAR and machine vision, mainly found in two aspects: (1) the network structure of the fusion algorithm is complex, so it is difficult to realize real-time performance or high detection accuracy, resulting in poor practical effect; and (2) in the case of special working conditions such as overlapping and severe occlusion in detection, it is difficult to meet the accuracy requirement for object detection.
To address the above problems, this paper proposes an improved AVOD fusion algorithm of machine vision and LiDAR sensor. AVOD sensor fusion network is selected as the basic framework, which is divided into feature extraction and object screening modules for analysis and optimization. For the object bounding box screening module in the AVOD sensor fusion network, the 2D GIoU (generalized intersection over union) loss function is upgraded to 3D and a 3D-IoU criterion is designed, with the pose estimation loss function further obtained. The NMS algorithm in the original network is replaced with a Gaussian-weighted NMS algorithm, into which 3D-IoU is introduced. The method is robust even for scenes with occlusion and performs well for small targets at a distance.
The remainder of the paper is structured as follows:
Section 2 presents related work, including a brief description of the deep learning-based image detection algorithm, as well as the LiDAR point cloud detection algorithm; in
Section 3, an improved AVOD algorithm is proposed, detailing the improvements for the algorithmic network; in
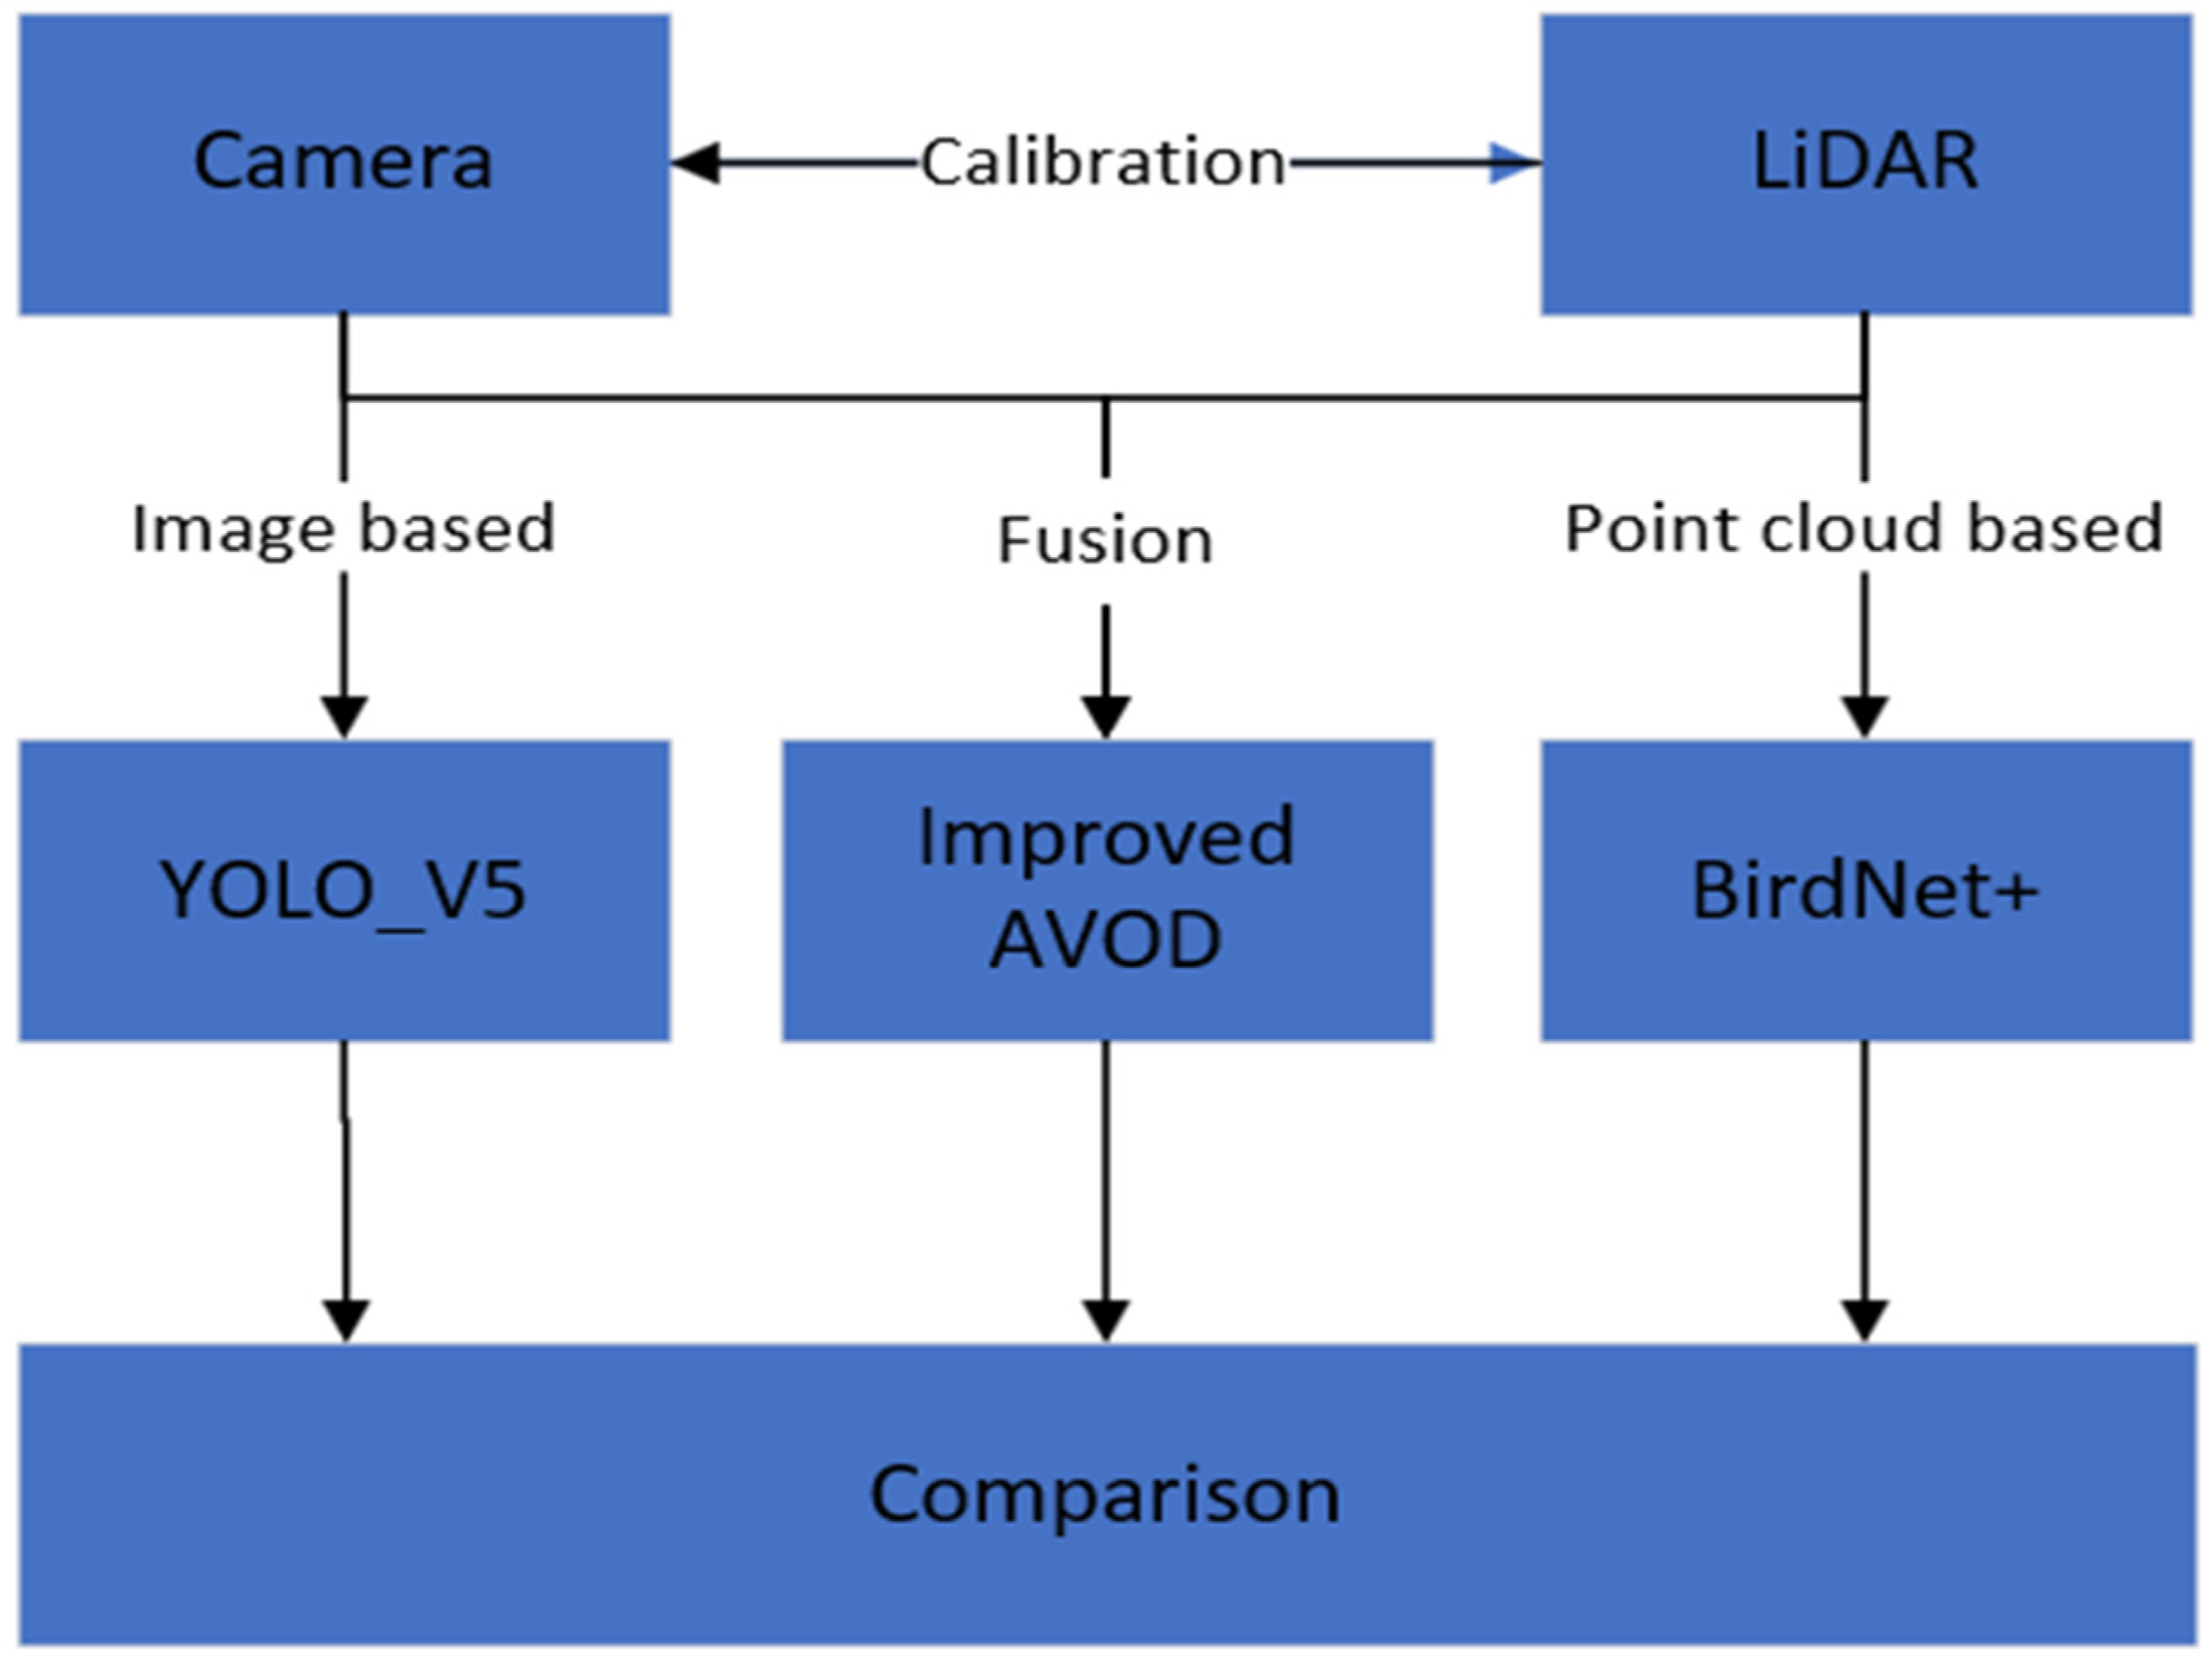
Section 4, based on the KITTI dataset under the same working conditions, the verification and analysis are made in comparison with a single-sensor object detection network through a comparative trial; and
Section 5 presents a summary of the study.
3. Improvement of AVOD Sensor Fusion Network
To improve the detection accuracy of machine vision and LiDAR point cloud for small objects and the ability of information complementation in specific cases, point cloud and image need to be fused at the pixel level by projecting the point cloud onto the image after joint calibration. AVOD sensor fusion network can be divided into feature extraction module and object bounding box screening module. AVOD is weak in extracting small object features from point cloud information, which leads to its poor effect on pedestrian detection, and because its object screening scheme is harder to adapt to complex situations [
27], so 3D-IoU is introduced to improve the effect of sensor fusion detection.
The input data of the AVOD algorithm includes two parts: The first part is an RGB image, and the second is the BEV of the LiDAR point cloud corresponding to the RGB image. The input data is then processed with the FPN network to obtain its full-resolution feature map. The regions corresponding to the feature maps obtained by BEV in the RGB image are fused to extract 3D candidate bounding boxes. The obtained 3D candidate bounding boxes are then used for 3D object detection. The improved AVOD algorithm proposed in this paper is to replace the red box shown in
Figure 5 with 3D IOU and introduce Gaussian-weighted Soft-NMS to improve the performance of the algorithm.
3.1. Gaussian Weighting NMS Algorithm
The quantitative box to be detected is an issue that cannot be ignored by common algorithms (e.g., region proposal network (RPN), pre-division), whose computational speed is drastically reduced by the computational redundancy for irrelevant regions. Based on Soft-NMS, this paper introduces a Gaussian weighting algorithm for non-maximum suppression screening, and the confidence is weighted with the Gaussian function, with the ranking repositioned. The box successfully detected is directly replaced by the box to be detected with the highest confidence, based on which the distribution parameter of Gaussian weighting coefficients is replaced by the intersection area between the successfully detected box and another detection box, which can effectively introduce the intersection degree of detection boxes into the confidence so that the detection accuracy of the occluded object can be significantly improved [
28]. Algorithm 1 shows the pseudo codes for Gaussian weighting NMS algorithm.
| Algorithm 1: Pseudo codes for Gaussian weighting NMS algorithm |
- 1:
Input:whereis score of,
|
- 2:
Step1: Screening the detection frame by vanishing point detection method;
|
- 3:
Step2: Calculate the area of all detection frames in set B,
|
- 4:
Step3: Merge all bounding boxes and sort them from low to high according to the score S,
|
- 5:
Step4:
|
- 6:
For
|
- 7:
|
- 8:
|
- 9:
End
|
- 10:
Output:
|
where
B is the initial set of recognition boxes,
S is the confidence corresponding to the recognition box, and
is the NMS threshold.
The conventional NMS processing can be visualized by the following fractional reset function:
Compared with the NMS algorithm [
29], the intersection degree of detection bounding boxes is introduced into the confidence level through Gaussian weighting and the scores of predicted bounding boxes are also weighted. All detection bounding boxes obtained are combined to form a new set
, and they are circularly calculated from high to low to obtain their coincidence degree
with other detection boxes in the results of the new set
. The main improvements are manifested as follows.
Step 1: The position of the vanishing point of the intelligent driving vehicle in the corrected visual field and the center of the detection result B are used as the basis for the calculation of the predicted bounding boxes.
Step 2:
is the storage mode of
in the set B, and the area of each detection bounding box can be expressed as:
Effective image edge completion is achieved by adding 1 to the numerator and the denominator respectively.
Step 3: The intersection degree of the detection bounding boxes is introduced into the confidence level through Gaussian weighting and the predicted bounding boxes scores are also weighted, all the detection bounding boxes obtained are combined to form a new set
, and the elements in the new set
are sorted by score S from lowest to highest:
Step 4: All detection bounding boxes are circularly calculated from high to low to obtain their coincidence degree
with other detection bounding boxes in the new set
results:
The Gaussian parameters of the weighted coefficient of the detection bounding box score
are replaced by the coincidence degrees
. The calculated score is then compared with the detection threshold previously set, and the output result is the detection bounding box that meets the requirements [
30].
3.2. The Loss of Bounding Box Regression
The result of object detection is described with a bounding box, which contains important information such as the location, size, and category of the object, so an accurate bounding box is essential for object detection. Intersection over Union (IoU) is an indispensable basis for judging and selecting multiple 2D bounding boxes, which reflects the detection effect of the detection bounding box and the ground truth bounding box,
Figure 6 shows the various cases of overlapping target boxes. The traditional IoU [
31] can be expressed as:
In the formula, is the loss function; is the detection bounding box; and is the ground truth bounding box. If the value of is 0, the algorithm makes no response to the distance between the ground truth bounding box and the object one, and the training and gradient conduction cannot be performed either; in the meantime, the evaluation standard is too singular and may have the same value due to the angle problem, leading to nonoverlapping between two bounding box and low detection accuracy.
To reduce the problem that the object bounding boxes do not intersect in 2D object detection to a certain extent, the loss function
is used in this paper. The main steps involve (1) to assume that
and
of the smallest rectangular box of the object bounding box C containing
and
must exist; (2) to calculate the smallest rectangular box of the object bounding box C containing
and
; (3) to estimate the ratio of the area of C not covered by
and
to the total area of C; and (4) to subtract the ratio from the
of
and
to obtain:
In which the coordinates of the ground truth bounding boxes
and predicted bounding boxes
are defined as:
The area
of the ground truth bounding boxes
and that of
of the predicted bounding boxes
are defined as:
Then, the intersection area of
and
can be calculated as:
Therefore, the coordinates of the smallest object bounding box
containing
and
can be calculated as follows:
So, the area of the minimum bounding box can be calculated as:
Finally, based on
, the final loss can be calculated as:
3.3. 3D Bounding Box Coding Mode
There are more 3D bounding boxes than 2D ones in terms of regression point quantity, and the definitions of regression parameters in the loss function are directly affected by how assuming that 3D bounding boxes are encoded and angles are pinned down. For a cuboid 3D bounding box, the analogous 2D bounding box is traditionally represented with the length, width, and height of the spatial centroid of the cube, but the regression of the spatial centroid is very inaccurate, and the direction angle information cannot be obtained. As shown in
Figure 7, three main ways can be employed to encode a common 3D bounding box.
Figure 7a goes through the 8 vertices of the cuboid to regress the 3D position of the detection box while taking the direction of the long side vector as the vehicle heading angle, but the geometric constraints of the cuboid are not taken into account, thus resulting too much redundant output information. The regression method adopted in
Figure 7b can minimize redundant parameters, and the cuboid is represented with the undersurface center point
, the axial distance
, and the intersection angle
, but this encoding easily leads to the drift of the bounding box. As shown in
Figure 7c, considering that the 3D box is a cuboid with its top surface parallel to the road surface, and the reliance on vertex information for accurate angle regression, the 3D-IoU AVOD algorithm proposed in this paper uses the four vertex coordinates of the bottom surface
and the bottom and top surface heights to represent a 3D bounding box. Therefore, the encoding method shown in
Figure 7c is selected.
Based on the encoding method of the 3D bounding box shown in
Figure 7c and the derivation process of the 2D object loss function, it is assumed that the ground truth of 3D bounding boxes is
, so the coordinates of the predicted values
of the 3D detection box can be expressed as:
In Formula (23), the volumes
and
of the predicted 3D bounding box
can be expressed as:
Further, the intersection volume of
and
can be calculated as:
The volume
of the minimum object bounding box
containing
and
can be calculated as:
Then, the loss function of the 3D bounding box detection algorithm based on sensor fusion can be calculated as:
The IoU discrimination criterion in the traditional object bounding box screening algorithm is simple, and it is difficult to determine the direction, height, and length of the object contained in the 3D bounding box. In this paper, a screening algorithm for a 3D bounding box is designed and put forward. In the object bounding box screening stage, the idea of the GIoU algorithm is taken for reference in designing the 3D-IoU evaluation standard, and the 3D-IOU proposed in formulating (24)–(27) in this section is replaced by 3D-IOU in Formula (6)
, and a new pose estimation loss function is obtained, which improves the screening accuracy and the efficiency of the 3D bounding box and reduces the occurrence of intersections. Finally, based on the proposed 3D-AP detection criteria, the object detection results are analyzed and compared to the KITTI dataset. The network framework is shown in
Figure 8.
4. Experimental Validation
4.1. Test Environment and Parameter Configuration
To make a fair comparison with existing methods, 7481 frames from the KITTI dataset were trained and divided into training and verification sets by the ratio of 1:1. Based on the simple, medium, and difficult classifications proposed by the KITTI dataset, the dataset was set up in the same way as the pre-modified AVOD network, and the detection objects included vehicles and pedestrians. We used Ubuntu 18.04, a virtual environment built with anaconda, we trained the network with the mini-batches containing one image with 512 and 1024 ROIs, and the network is trained for 120k iterations with an initial learning rate of 0.0001.
The experiment in this paper used the PyTorch deep learning framework, with python and C++ as the main languages. Other hardware conditions are shown in
Table 1.
4.2. Evaluation Criteria of the Detection Algorithm
In terms of the KITTI criterion, all objects were classified into three difficulty levels by size, truncation, and occlusion, namely, easy (E), medium (M), and hard (H). The evaluation indexes of object detection algorithms mainly include precision, recall, and average precision (AP). The main task of 3D object detection is to estimate the position and the direction of the 3D bounding box of the object. General detection and evaluation indicators on the KITTI dataset include 3D average accuracy (
AP3
D), the average accuracy of the bird’s eye view (
APb
ev), and average orientation similarity (AOS) [
31] When the average accuracy is calculated, based on the 3D IoU between the 3D predicted bounding box and the ground truth bounding box, whether the bounding box is detected correctly is determined. The IoU threshold is set to 0.7 for a vehicle object, and 0.5 for a pedestrian object. The data to be detected are input into the improved AVOD fusion algorithm network framework, and the point cloud and image data are passed through the feature extraction module and the object bounding box screening module; through the counting of the correct, missed, and false detection results, the precision, recall, and mean average precision (mAP) can be calculated using the formulas below:
In the formula, TP refers to the true case, that is, the number of vehicles and pedestrians detected correctly; FP means false positive, that is, the number of the objects incorrectly detected as vehicles or pedestrians; FN means false negative, that is, the number of vehicles or pedestrians but not detected as vehicles or pedestrians. Accuracy indicates the proportion of correct predictions in a category of prediction objects to the total correct samples, and recall indicates the proportion of correct prediction objects to the total prediction samples. Since the training set in this paper only contains two samples, mAP is calculated as shown in Equation (34).
4.3. Comparison and Visualization of Experimental Results
The test results on the KITTI dataset are shown in
Figure 9 below. For the same vehicle and pedestrian training set, image object detection algorithm YOLOv5, point cloud bird’s eye view object detection algorithm BirdNet+, pre-improved AVOD fusion algorithm, improved AVOD fusion algorithm proposed in this paper, and 3D object detection PointRCNN algorithm are used to test each frame data of the dataset, with image detection results shown in
Figure 10. In RGB images, the red box represents a detected object bounding box and confidence level. In point cloud bird’s eye view, the red box stands for a detected vehicle, and the yellow box for a detected pedestrian, as shown in
Figure 11 below.
Figure 12 shows the results of the PointRCNN detection.
It can be observed from the above detection results that there are different degrees of missed and false detections in both images and point cloud bird’s eye view detections. The missing and falsehood in image detection more often occur in the case of a vehicle being obscured. The falsehood in point cloud detection is mostly caused by the fact that the shrubs, leaves, and other objects on both sides of the road, which are similar in shape to the point cloud of vehicles and pedestrians, are detected as vehicles.
4.4. Further Discussion
From the above results, it can be seen that the improved AVOD algorithm proposed in this paper was significantly better in detection accuracy, compared to the YOLOv5 image object detection algorithm, BirdNet+ point cloud bird’s eye view object detection algorithm, PointRCNN algorithm, and the pre-improved AVOD fusion algorithm without optimized object screening module which were applied alone. The improved AVOD fusion algorithm improved the accuracy by 6.38% compared to the YOLOv5 algorithm, and reduced the number of falses and missed objects by 13.3%, with the overall mAP index going up by 5.57%. Compared with the BirdNet+ algorithm, the accuracy was improved by 8.01%, the number of false and missed objects was reduced by 16.62%, and the overall mAP was enhanced by 3.06%. Compared with the PointRCNN algorithm, the accuracy was improved by 6.72%, the number of false and missed objects was reduced by 14.37%, and the overall mAP rose by 4.54%. In addition, compared with the AVOD fusion algorithm before improvement, the accuracy was improved by about 5.10%, the number of false and missed objects was cut down by 7.9%, and the overall mAP index was raised by 1.35%.
The comparison of vehicle and pedestrian detection results in the AVOD fusion algorithm without an optimized object bounding box screening module before and after the improvement is shown in
Figure 13 above. It can be seen from the following scenarios that the introduction of the 3D-IoU pose estimation loss function into the AVOD network object bounding box screening module ensures accuracy while reducing the ratio of false detection. Moreover, the improved AVOD fusion point cloud and RGB image information object detection framework score the highest mAP values in
Figure 13 on object categories E and M, indicating that the optimization scheme of the object bounding box screening module proposed in this paper can improve the detection accuracy of certain small and medium objects, reduce the occurrence of missed detections, and have certain robustness in the actual unmanned driving.
5. Real Vehicle Verification
To test the accuracy and effectiveness of the algorithms in this paper, the experimental core setup is a 32-line LiDAR and a camera. In addition, there are two new energy vehicles, a laptop computer, a LiDAR adaptor box with an RJ45 port for a network cable, a Dspace domain controller, battery power supplies and an inverter, and other auxiliary equipment. The sensor data acquisition system in the upper computer is capable of real-time information acquisition, in addition to the functions of adding time stamps, recording, synchronization, and playback of the collected information data, as well as supporting the data acquisition from multi-millimeter wave radar, BeiDou and other sensors. The data acquisition system can receive LiDAR data through the network port and camera data through the USB interface. The real-time and synchronous data acquisition from LiDAR and camera can be realized, as shown in
Figure 14.
The topic node names of the two sensors were to be opened before the test, and Rosbag was then used to record the sensor data represented by the topic node names, and the data was collected in the following scenarios. The vehicle was driven around the main road of JAC Technology Center Park, recording as many cars, pedestrians, dense occlusion scenes, and small distant objects as possible during the driving process. The actual test scenario is shown in
Figure 15, and the different experimental scenarios in
Figure 15.
Next, the LiDAR point cloud data parsed by Rosbag were preprocessed, and since the image data and the corresponding LiDAR point cloud bird’s eye view data were used as the inputs for the AVOD sensor fusion network, the image data obtained from the camera and the point cloud data acquired by the LiDAR were modified according to the KITTI dataset format.
Figure 16 below shows the detection results based on the improved AVOD sensor fusion algorithm.
Figure 16a,e shows road scenes with relatively sparse vehicles and pedestrians. It can be seen from the figure that the improved AVOD sensor fusion detection algorithm in this paper was still able to accurately detect occluded and distant pedestrian objects even when the pedestrians were in a scene with illumination or severe occlusion.
Figure 16b,c shows a complex road scene with the dense occlusion of vehicles and strong light. Light, leaving shadows and the occlusion of vehicles in front had a great impact on the image information. It can be seen that most vehicles on the left side of the road in
Figure 16b were accurately detected, while the vehicle objects on the structured road and even small objects in a relatively long distance in
Figure 16d,f were detected with a certain accuracy, which demonstrated that the improvement of the object box screening module of the AVOD sensor fusion network in this paper had a better detection capability for densely occluded objects as well as small objects at long distances. However, for the vehicle objects which were densely obscured in the distance and only a small part of the vehicle top was exposed on the image, there was a partial loss of point cloud information corresponding to the vehicle objects in the LiDAR point cloud data as well, resulting the missing of a small number of objects. The average detection accuracy of the improved AVOD algorithm was calculated to be 96.3% in the real vehicle test. Tests showed that the possibility of missed and false detections exists in the following two cases: (1) when the vehicles were densely parked and placed far away, the point cloud data was sparse, and the image data obtained less feature information about the objects; (2) the trees on both sides of the road were incorrectly detected as pedestrian objects.


