Article

Effect of Education on the Economic Income of Households in Peru, Application of the Mincer Theory in Times of Pandemic (COVID-19)

by
Julio Cesar Quispe-Mamani
1,*,
Miriam Serezade Hancco-Gomez
2,
Amira Carpio-Maraza
2,
Santotomas Licimaco Aguilar-Pinto
3,
Adderly Mamani-Flores
4,
Giovana Araseli Flores-Turpo
2,
Wily Leopoldo Velásquez-Velásquez
5,
Balbina Esperanza Cutipa-Quilca
2 and
Maria Isabel Alegre-Larico
6
1
Facultad de Ingeniería Económica, Universidad Nacional del Altiplano, Av. Floral 1153, Puno 352206, Peru
2
Facultad de Ciencias Contables y Administrativas, Universidad Nacional del Altiplano, Av. Floral 1153, Puno 352206, Peru
3
Facultad de Ciencias Administrativas, Universidad Andina Néstor Cáceres Velásquez, Urbanización Taparachi Km 4.5 salida a Puno, Juliaca 322213, Peru
4
Facultad de Ciencias Sociales, Universidad Nacional del Altiplano, Av. Floral 1153, Puno 352206, Peru
5
Escuela Profesional de Gestión Pública y Desarrollo Social, Universidad Nacional de Juliaca, Jirón Nueva Zelandia 631, Juliaca 332927, Peru
6
Instituto de Educación Superior San Marcelo, Av. los Álamos S/N, Puno 352749, Peru
*
Author to whom correspondence should be addressed.
Soc. Sci. 2022, 11(7), 300; https://doi.org/10.3390/socsci11070300
Submission received: 25 May 2022 / Revised: 29 June 2022 / Accepted: 4 July 2022 / Published: 12 July 2022

Abstract

:
The objective was to determine the effect of education on the economic income of households in Peru in times of the pandemic (COVID-19), for which a quantitative research approach was applied, of a non-experimental type and of descriptive-correlational design; the econometric model of log-linear type was used, based on the Mincer equation, with the information from the database of the National Household Survey, for the period of 2021. The economic income on average was 275.96 soles, with a standard deviation of 1451.41 soles, with high variability, identifying very precarious economic income ranging from 15.00 to 15,000.00 soles/month per worker; the years of schooling of the worker on average were 12 years, showing the scope of complete secondary training, with a population without years of education, and on the contrary, there are workers with postgraduate education, with the variability of 4 years. Finally, the effect of education measured through years of schooling on economic income is positive, or direct, since education explains 14.34% of economic income; the experience of the worker, gender, area of residence, age and marital status, in the same way, have a positive effect on economic income, strongly highlighting gender and area of residence which explain 19.86% and 30.45% of the economic income in the household in Peru.

1. Introduction

The Mincer theory considers that education as part of an educational system in a country has the main role of guaranteeing socialization, providing and developing the necessary skills for its development in society, guaranteeing all this through its certification, always seeking to ensure the efficient allocation of potential resources according to the needs of society and promoting a dynamic in social mobility. Under this assumption, the theory of human capital supports that quality education, according to the demands of the market, allows obtaining an optimal and efficient human capital, which guarantees society to provide a population with knowledge, sociable, competitive and ready to face the challenges of the labor market and consequently guarantee a space in the labor market and contribute in this way to the improvement of the economic income of the worker and their household (Bornacelly 2013; Martin et al. 2013; Mincer 1974, 1984, 2016; Prados de la Escosura and Rosés Vendoiro 2010; Unger et al. 2011).
The theory of human capital and consequently the empirical application of the Mincer model emerged in 1974. It considers the assumptions of a classic model and highlights the importance of the opportunity costs of investment in education, since the demanding competitive market increasingly requires workers endowed with greater specialized knowledge, skills and capabilities due to the accelerated technological change that occurs in these globalized times (Ishfaq et al. 2021). This is why the existence of the direct relationship between education and production in the different markets of productive factors, goods and services and products has been determined (Mincer 1974, 2015; Mincer and Polachek 1978). In this sense, when making an investment in education to have a more competitive human capital, educational training becomes relevant, since in the medium and long term, meritorious results will be obtained in the improvement of the economic income of the worker and individual economic well-being as a family; therefore, guaranteeing the educational training of the school population has positive results over time, since in this way, it is guaranteed to have democratic systems according to the reality of each country (Abbasa and Foreman-Peck 2007; Huggett et al. 2006; Kuzminov et al. 2019; Mincer 2016).
Therefore, the equation proposed by the Mincer model considers economic income as a dependent variable and is subject to the behavior of variables such as education, measured in number of years of education received by the worker, the work experience of the worker and the skills developed by the worker, in addition to some demographic variables such as age, gender, marital status and the area of residence of the worker that can be rural and urban (World Bank Group 2018, 2020; Korres et al. 2014; Lemieux 2006).
Globally, many countries were lifted out of poverty and positioned themselves in the first level thanks to education. For example, in Africa in 1950, the average schooling was less than 2 years, but in 2015, it increased to 5 years; the difference in East Asia and the Pacific is significant, as schooling on average increased from 1950 to 2010 from 2 years to 7 years, and by 2050, an increase to 10 years on average is expected. According to the human capital index, which incorporates an evaluation of 157 countries, to 2018 the World Bank analyzed the quantity and quality of education offered worldwide under 45 years, considering their mortality rates, it could be determined that Singapore occupies the first place with 0.88, followed by South Korea with an index of 0.84, Japan with an index of 0.84 and Hong Kong with an index of 0.82, demonstrating that in Asian countries, children receive quality educational training and have quality health services. Some countries complement this ranking such as Finland with an index of 0.81, Ireland with an index of 0.81, Germany located in 11th place with an index of 0.79, followed by the United Kingdom in 15th place with an index of 0.78; interestingly, the United States and China, although they are countries of world economic power, are located in 24th and 46th place, whose indices are 0.76 and 0.67, respectively (Chatani 2012; De la Fuente and Ciccone 2003; Fraumeni and Liu 2020; Monroy and Flores 2009; Pérez-Fuentes and Castillo-Loaiza 2016; Ranis and Stewart 2002; Terrones and Calderón 1990; World Economic Forum 2017).
The aforementioned results are not so outstanding for Latin America, given that the indices obtained are low, such as in the case of Chile which ranked 45th out of 157, Costa Rica ranked 57th, followed by Argentina in 63rd place and Mexico in 64th place. In addition, Haiti was the country that ranked last in Latin America and the Caribbean and ranked 112th. That is why the existence of inequality in the provision of education service in this region is very evident (Giménez et al. 2005; Hall and Patrinos 2006; Katz 2018; McLauchlan de Arregui 1993). In this understanding, it is shown that although receiving an education training is a human right, evidence suggests that in developed countries and mainly in Latin America, it is not fulfilled due to different aspects that are mainly political, social, economic and cultural. Complementary to the existence of a problem in the contribution toward the formation of human capital, since the beginning of 2020, Latin America and the world have been facing the problem of the COVID-19 pandemic, since more than 190 countries ordered a total closure of educational institutions of primary, secondary, higher and postgraduate levels, affecting a student population greater than 1.5 billion in the world and 160 million in Latin America and the Caribbean (Bakker et al. 2020; Birdsall and Londono 1997; Katz 2018; Cerquera et al. 2022; Mungaray et al. 2021; Osiobe 2020).
Despite the already existing global crisis in that period, where 53% of children worldwide could not read or understand what they read and the provisions of SDG 4 were in danger, 90% of this belonging to the countries of sub-Saharan Africa, the pandemic (COVID-19) caused the closure of educational institutions at all levels, looking for other types of educational development actions of distance or virtual learning modality, using various types of formats and electronic platforms, such as Google Meet, Zoom, Cisco Webex, Moodle and Classroom, among others, which allowed the gap of the goals established in the countries in terms of learning to widen, increasing the rate of educational dropout, increasing a learning poverty in the student population by 20% and increasing the average of the learning poor to 7.6 million, where more than two out of three students of the first grade of secondary level may fall below the minimum level of expected performance (Espinosa and Marín 2022; Ferrada-Bustamante et al. 2021; Murillo Lozano 2021; Vázquez-Rodríguez et al. 2021).
The indicators mentioned for Peru are more complex, in view of the fact that the levels of educational training are initial, primary, secondary, higher, postgraduate and postdoctoral, which respectively demand a period of educational training of 3 years at the initial level, 6 years at the primary level, 5 years for the secondary level, 5 years for higher-level studies, 5 years for the postgraduate level (2 years for master’s degree and 3 years for doctoral studies) and 1 year for postdoctoral studies, demanding on average 25 years in total to guarantee the completion of all the studies required to reach the highest level, which is not reached by the largest part of the population and mainly those who live in and are from the rural areas of Peru, reaching on average the primary and secondary levels. This deficiency in education can be seen in the different competitions and evaluations applied mainly to the student population of the primary and secondary levels; for example, the ranking results developed by the IMES of the University of Washington show that the human capital of Peru is one of the lowest in Latin America, in view of the fact that in 1990, it ranked 93rd out of 195 countries, and in 2016, it decreased to 103; however, despite this decrease between these periods, they also show an improvement in the health status of the population, obtaining better educational achievements, learning and with a better scenario of life expectancy at birth, which is why human capital improved by 44%. Still, it is still one of the lowest with respect to other countries.
In addition, even before the pandemic, serious challenges were seen in Peru, one of them being the need to improve the quality of education, since this is the basis for guaranteeing improvement in the current and future labor market, implementing actions to develop strategies that guarantee the improvement of capacities and development of skills, seeking the practice of teamwork, with greater adaptability in the different scenarios that the labor market may demand (Pacheco Lay and Miranda Blanco 2021; Quispe et al. 2022; Varona-Castillo and Gonzales-Castillo 2021).
However, after Latin America became the epicenter of COVID-19, the impact it had on the health, education and social protection system was catastrophic, since there was a total restriction in the labor market, evidencing in Peru the widening in the pre-existing inequality gaps between regions and mainly between rural and urban areas, where the economic conditions of families and households are very different and variable, making the pandemic one of the most lethal factors that affect the educational conditions of the Peruvian population, accompanied by the poor conditions of the health service, complemented by the limitations they have to cover the basic basket, strongly affecting the progress achieved by human capital (Giménez 2005; Katz 2018; Ramió and Salvador 2005; Varona-Castillo and Gonzales-Castillo 2021). Therefore, despite the fact that from 2000 onwards Latin American countries implemented different reforms in the educational systems, where the most outstanding were in Ecuador and Peru, since the results obtained in the PISA tests support this, and Paraguay and Peru reduced stunting from 17.5% to 5.6% and from 23.3% to 12.2%, this suffered a setback in times of the pandemic, in view of the fact that educational, health and labor policies were not framed to be able to counteract unforeseen scenarios such as the stage of social confinement and restriction of the development of economic and complementary activities (Carrasco and Castillo 2021; Graham and Pozuelo 2022; Katz 2018; Urrunaga and Aparicio 2012).
In times of the pandemic, the human capital index for Peru in 2020 was 0.61, showing its considerable potential productivity, which represents a considerable advance with respect to previous years, where in 2018, it was 0.59, in 2010, it was 0.55, and it was above the average at the Latin American level which was 0.56, where the beginning of their educational training is 4 years, waiting to complete 13 years of study, until they reach the age of majority which is 18 years. The score obtained in the last PISA exam was 415 of the maximum of 625, and 89% of the population over 15 years have a life expectancy greater than 60 years, but 88% of Peru is still ranked 65th of 174 countries, and this is very demotivating. According to the National Household Survey (ENAHO), in the population aged 17 to 29, 26% of the population of that group enrolled in an educational center or program, whose value was 7% lower than in 2019 and was below the average of the last five years, and of those who did not enroll, only 16% were trained in some relevant subject, which shows that the important human capital in Peru was neglected in times of COVID-19, directly affecting the economic income of households in the country, since in the scenario of social confinement declared from March 2020 onwards, no measures were implemented in favor of guaranteeing continuity in personal or professional development, since the government in turn only at the end of that year implemented public policies for the acquisition of modems for students and teachers, for financing the maintenance of infrastructure and to try to close the digital divide that still exists mainly in the rural areas of the country (Carrasco and Castillo 2021; INEI 2021).
Considering the results of the National Household Survey (ENAHO), between 2019 and 2020, household income in Peru decreased by 30% on average, affecting family savings, since in 2019, a family saved on average the amount of S/636.00 soles/month—that is, it saved 21% of the income generated—but in 2020, this value decreased to S/104.00 soles/month—that is, they only saved 5% of the income generated—thus showing damage to the income of the members of the families and their homes. This situation was very noticeable in urban and rural areas of the country, given that the savings capacity in the first zone decreased from 20.50% of family income in 2019 to 2.40% in 2020, while in the second zone, it fell from 28.4% to 23.2%. In addition, Lima was the area most affected by this situation, given that family savings fell from 20.7% to 0.40%, affecting urban employment by a reduction of 16.40% and in the rural areas by a reduction of 1.1% (De La Cruz-Vargas 2020; Figallo et al. 2020; Miyashiro 2022).
The reduction in households’ saving capacity occurred mainly in urban areas, where the savings rate fell from 20.5% of household income in 2019 to only 2.4% in 2020. In contrast, in rural areas, this fell from 28.4% to 23.2%. Overall, the hardest-hit area was Metropolitan Lima, where savings fell from 20.7% in 2019 to 0.4% in 2020. This reduction is consistent with the sharp fall in urban employment (−16.4%), well above that observed in rural areas (−1.1%) (Delgado 2020; Figallo et al. 2020; INEI 2021; Miyashiro 2022).
Therefore, despite the fact that Peru contributed enormously to the reduction in monetary poverty from 54% to 20.20% between 2004 and 2019, it was able to establish a poverty line in 2019 of S/.352.00 soles/per capita/monthly (USD 100). However, it was one of the countries most affected by COVID-19, economically, in health and education, since in the first half of 2020, the PIB had a decrease of 17.4%, implementing restrictive quarantine policies to avoid the contagion of the virus that affected families of all social statuses, experiencing one of the largest losses of employment and income in all of Latin America, reducing employment nationwide by 40%, where the most affected were young workers and women; although this loss of employment occurred in the urban area, the rural area was also affected, as the rate of unpaid employment increased. Seeking the reactivation of the economy and implementing some measures to resume educational training through virtual sessions and in some cases at a distance, the impacts in this sector were enormous, and the challenges to guarantee the continuity of education despite the restrictions were a challenge, since the integral learning of the student population has been put at risk, because the dropout rates increased, and the most affected were those populations that are part of the present and future human capital and are poor and extremely poor, with low and medium economic incomes (De La Cruz-Vargas 2020; Figallo et al. 2020; Laderas et al. 2020; Meza et al. 2020; Miyashiro 2022).
This research sought to answer the following question: What is the effect of education on the economic income of households in Peru in times of the pandemic (COVID-19)? The objective of the research was to determine the effect of education on the economic income of households in Peru in times of the pandemic (COVID-19). In addition, the hypothesis to be tested was that the effect of education on the economic income of households in Peru in times of the pandemic (COVID-19) was positive, or direct.

2. Materials and Methods

2.1. Research Methodology

Because we used the Mincer model and as an existing source of information the database of the National Household Survey (ENAHO) of the INEI, the research methodology was of a hypothetical-deductive type (Mendoza Bellido 2014).

2.2. Research Approach, Type and Design

The present research used a quantitative approach, of a non-experimental type and with a descriptive-correlational research design, for which, the econometric model of log-linear type was used, estimating by ordinary least squares, but based on the Mincer equation, where the information was taken from the database of the National Household Survey (ENAHO) of the INEI for the period of 2021 (Mendoza Bellido 2014).

2.3. Population

According to the information managed and processed from the database of the National Household Survey (ENAHO), the modules “Characteristics of Household Members”, “Education” and “Employment and income” consider as the study population those groups of people who by 2021 met the characteristics of being part of the object of the study, classified by the level of economic income, years of schooling, area of residence (rural and urban), age, marital status, gender and experience in the workplace, all this at the level of all of Peru.

2.4. Sample Type and Size

According to the ENAHO of 2021, the type of sampling to which the research corresponds is probabilistic, area, stratified, multistage and independent, since its application was carried out in each region determined at the level of Peru, considering the confidence level of the sample results of 95% (Juárez et al. 2002). To determine the sample size at the regional level, it was applied to all members of the household, who were aged 14 and older, highlighting the number of years reached by each of them. The total sample for the study group amounted to n = 554 observations.

2.5. Variable Analysis

According to the objective set out in the research, the variables analyzed were the economic income of the worker, years of schooling of the worker, age of the worker, experience of the worker, experience of the worker squared, gender of the worker, marital status of the worker and the area of residence of the worker, whose characteristics are detailed in Table 1.

2.6. Mincer Econometric Model Approach

The Mincer model, a model that allows quantifying and analyzing the returns of human capital measured by education in economic income, is a tool that explains the particular realities of a region or a country, among others. The present research sought to estimate the impact of education measured in years of education received on the economic income of people (Abbasa and Foreman-Peck 2007; Lemieux 2006; Mincer 2016).
In this sense, the traditional Mincer equation for ordinary least squares (MCO) was considered, with the characteristic of being a semilogarithmic model, where the dependent variable is considered the logarithm of income and the independent variables the years of education, work experience and the square of it (Equation (1)). The data used for its estimation traditionally come from cross-sectional data.
Therefore, the econometric approach of the Mincer equation in the present research was as follows:
Ln ( Economic   income   of   the   worker ) = β 0 + β 1   Y e a r s   o f   s c h o o l i n g   o f   t h e   w o r k e r   +   β 2   Age   of   the   worker   + β 3   Experience   of   the   worker   +   β 4   Experience   of   the   worker   squared + β 5   G e n d e r   o f   t h e   w o r k e r   +   β 6   Gender   of   the   worker + β 7   Area   of   residence   of   the   worker   +   u t
where β represents the coefficients of the econometric model.

3. Results

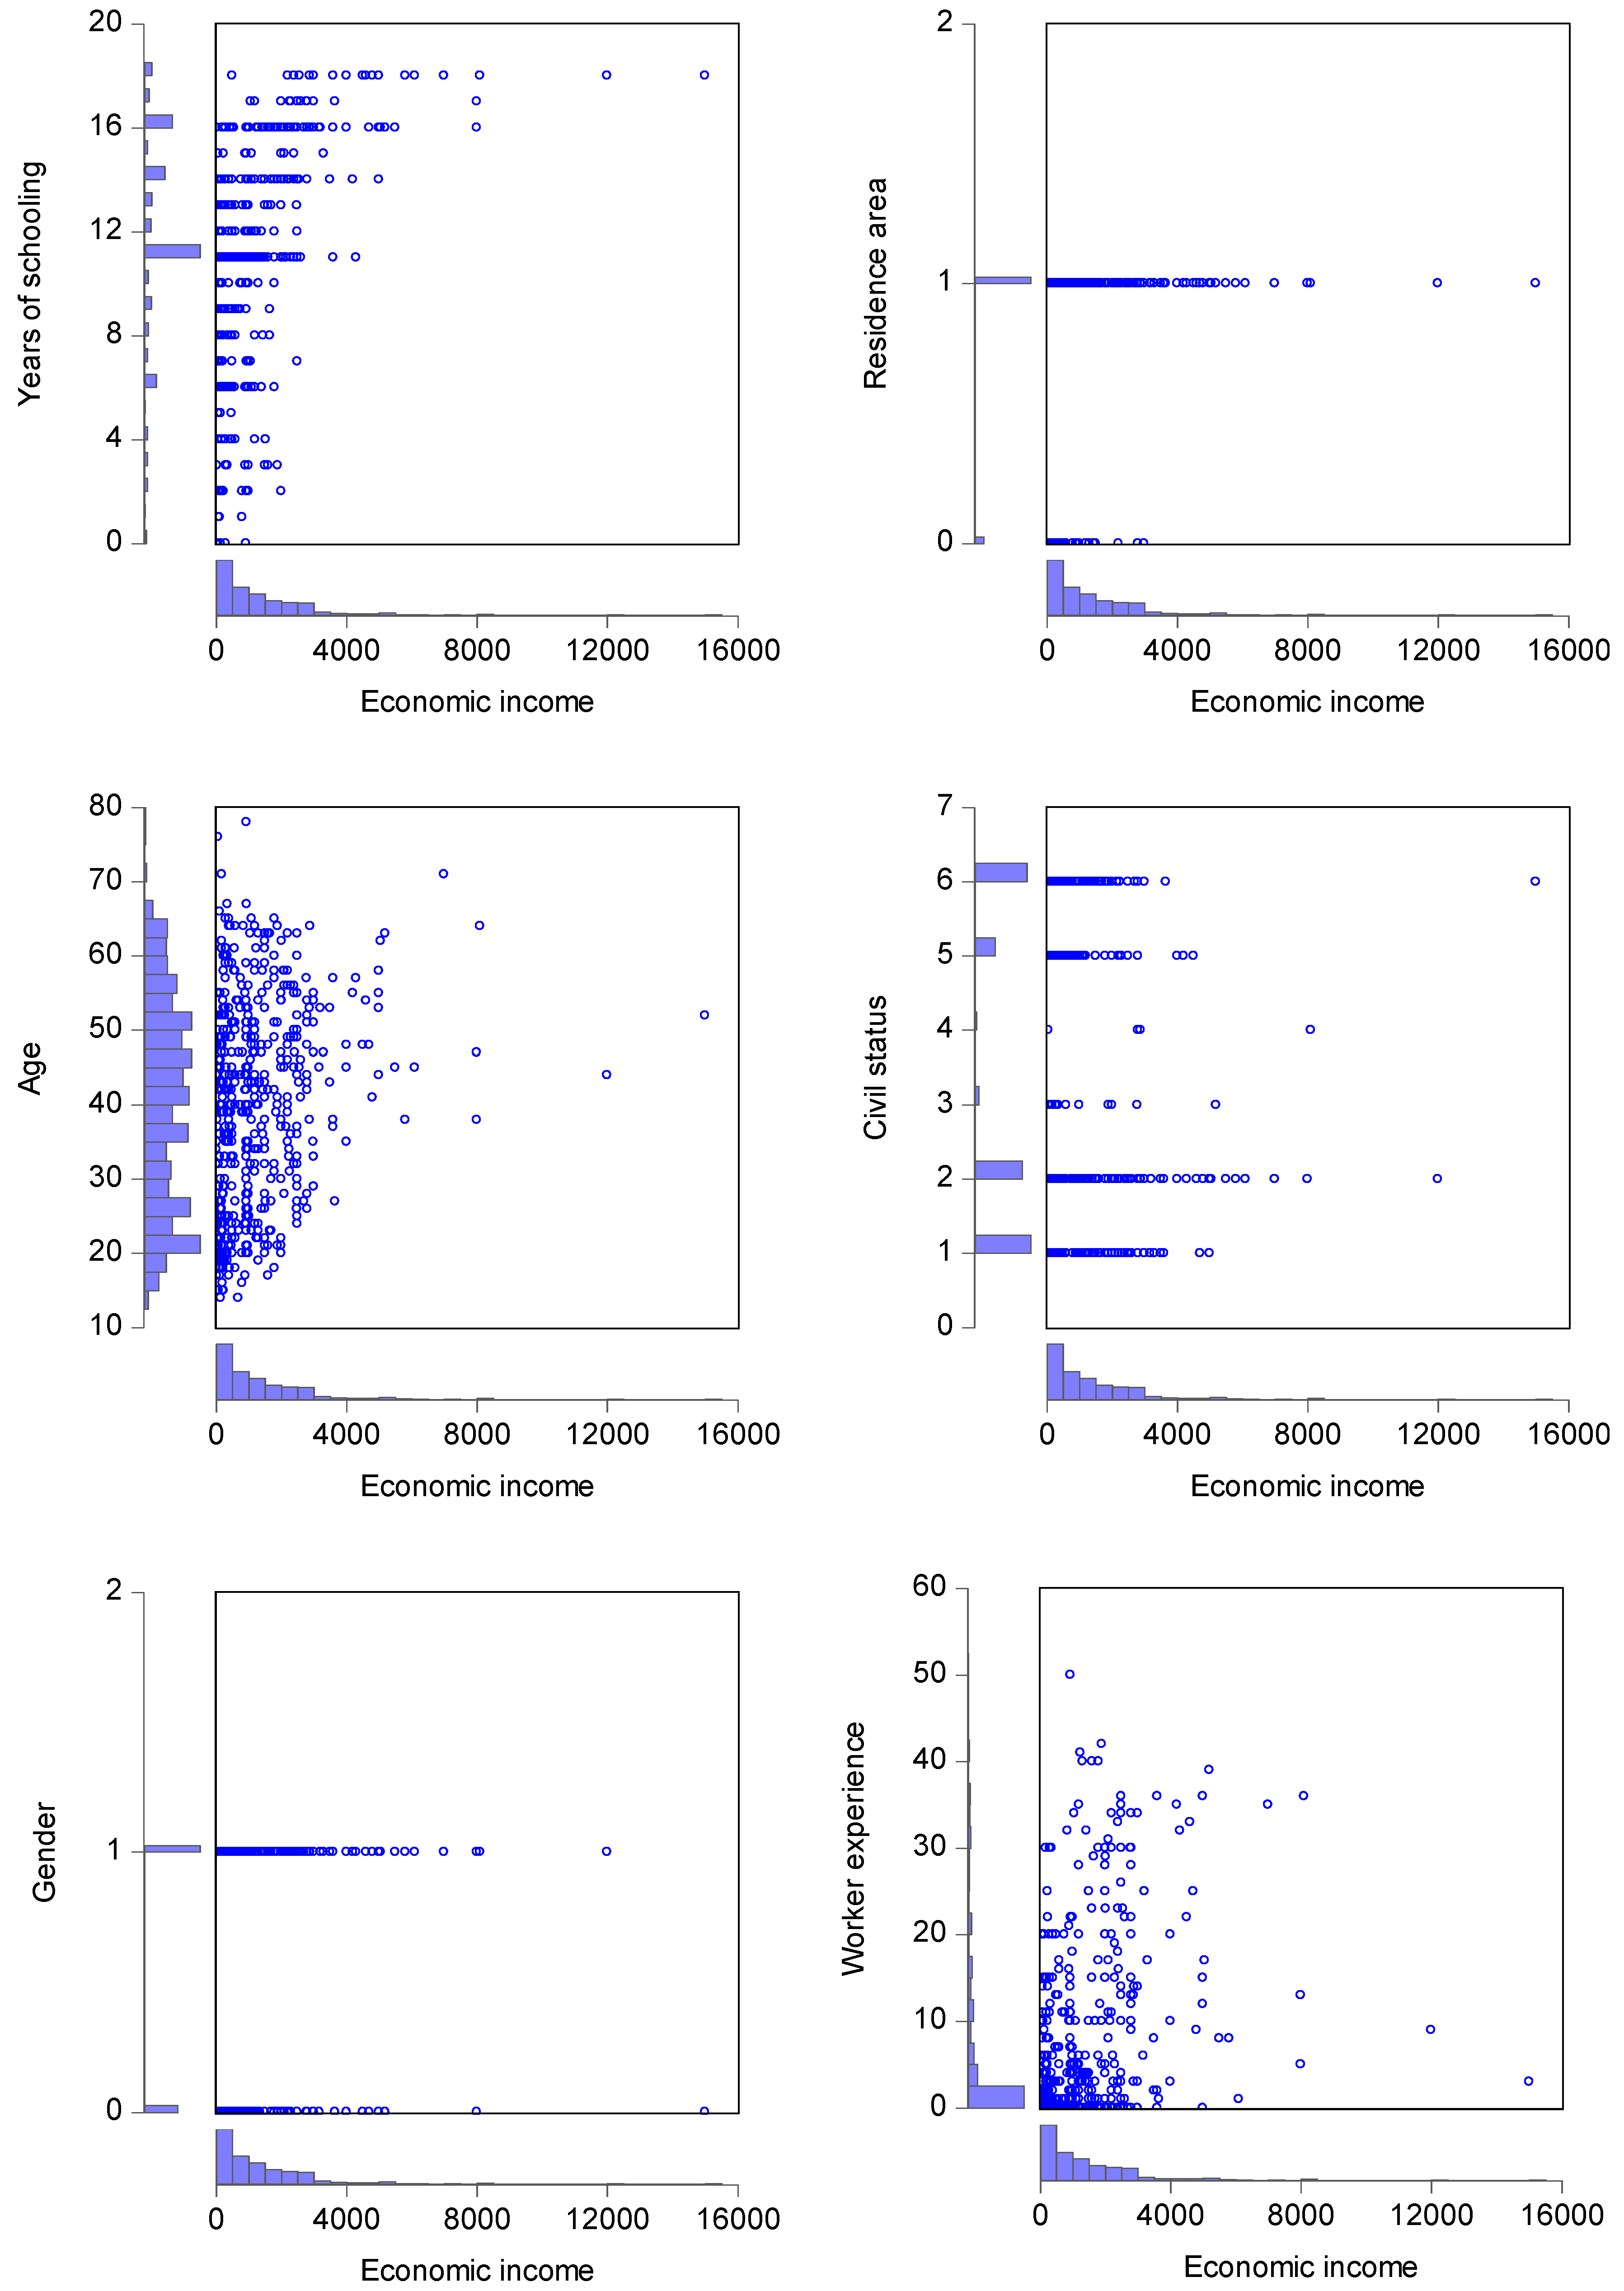
3.1. Descriptive Analysis of the Variables That Explain the Economic Income of Households in Peru

The role of education measured in years of schooling of the worker is important in the economic income, in view of the fact that any variation has effects not only on the economic part but also on the social and cultural parts. In Peru in 2021, the years of schooling of the worker on average were 12 years, showing the scope of the level of complete secondary training, with a population existing without years of education, and on the contrary, there are workers with a postgraduate education level; the variability in years is 3.97 (Table 2).
The experience of the worker is related to the years of schooling, which shows that on average they have an experience of 6 years, with a standard deviation of 10 years among workers. It is also shown that there are workers without work experience that are mainly the new ones that are inserting themselves into the labor market and those who have very advanced experience that reaches 50 years (Table 2).
Other social variables that have a lot of implications in the generation of economic income are the gender, age and marital status of the worker, since these complement the years of schooling to boost the family economy. At the level of Peru, the gender that predominates is female, showing greater participation in the family, but in many cases, the head of the family is the man, which is why their education is important, since they represent the 62.64% that generate economic income. The education of women should not be neglected either, since, although they develop non-remunerative activities, these are of vital contribution to the family and society. In the case of age, on average, workers were 40 years old, with workers from 14 years to 78 years, while in terms of marital status, on average, they were cohabitants or married (Table 2).
The outstanding variable is the area of residence of the worker, which, at the level of Peru, suggests that most migrate to urban areas and large cities to look for new opportunities: 86.46% are located in the urban area, and the rest are still in the rural area (Table 2). In this sense, the economic income of the worker on average is 1275.96 soles, which shows a standard deviation of 1451.41 soles, with high variability, identifying precarious economic income ranging from 15.00 soles to a monthly economic income equal to 15,000.00 soles (Table 2).

3.2. Analysis of the Relationship of Years of Education and Social Factors with Economic Income

By studying the relationship between the economic income of the worker and the years of schooling, it can be determined there is a direct, or positive, relationship: in the face of an increase or decrease in the years of schooling, the economic income of the worker also tends to increase or decrease (Table 3), which is corroborated by the scatter plot of these variables (Figure 1), which shows that there is a positive or direct relationship between the years of schooling received and the economic income, with a correlation coefficient value equal to 0.5022, suggesting that there is a moderate positive correlation.
Similarly, the relationship between the area of residence, age and experience of the worker and economic income is direct, or positive: in the face of an increase or decrease in these variables, the economic income of the worker also tends to increase or decrease (Table 3), which can be seen in the scatter plot of these variables (Figure 1), with a correlation coefficient value equal to 0.2025, 0.2343 and 0.3332, suggesting that there is a weak positive correlation between the area of residence, the age and experience of the worker and the economic income.
In the case of the worker’s marital status and age, the relationship they have with economic income is inverse, or negative: in the face of an increase in these variables, the economic income of the worker will decrease (Table 3), and this statement can be verified in the scatter plot of these variables (Figure 1), in view of the fact that they have a correlation coefficient value equal to −0.1002 and −0.0057, suggesting that there is a weak negative correlation.

3.3. Determination of the Effect of Education on Household Income in Peru

After analyzing the behavior of the social variables that explain the behavior of economic income in households in Peru and the relationship between them, we proceeded to apply the Mincer theory in times of the pandemic (COVID-19); therefore, when considering the econometric equation of log-linear type, estimating using ordinary least squares, the following regression was obtained the regression of Table 4 was obtained.
In Table 4, the individual significance can be verified. All the variables have individual significance at 95% confidence except for the worker’s marital status, which has an individual significance of 90%. In the case of global significance, it can be indicated that the proposed model has global significance at 95%. The R-square of 35.44% indicates that the independent variables explain 35.44% of the economic income of workers in households in Peru.
Therefore, after the evaluation of the inferential statistics, the results obtained in the model are suitable for analysis, which is presented below:
Ln(Economic income of the worker) = 3.9133 + 0.1434(Worker’s schooling
years) + 0.0295(Worker’s experience) + 0.0003(Experience of the worker
squared) + 0.1986(Worker’s gender) + 0.3045(Operation of residence of
the worker) + 0.0142(Age of the worker) + 0.0384(Civil status of the
worker) + u.
From the aforementioned model, we can establish that at an increase of 1 year of the worker’s schooling, the economic income will increase by 14.34%; when the work experience increases by 1 year, the economic income increases by 2.95%; in the case of gender, if the gender of the worker is male, then the economic income increases by 19.86%; if the worker’s area of residence is the urban area, then the economic income increases by 30.45%; if the age of the worker increases by 1 year, then the economic income increases by 1.42%; and if the worker’s marital status changes from single to other scenarios, then the economic income increases by 3.84%.
In this sense, according to the results obtained, it can be indicated that the years of schooling in a pandemic scenario contribute efficiently to the improvement of the conditions of economic income in households in Peru, complemented by the work experience of the worker who is equally important. According to the characteristics of the country, the head of household is the male, and his responsibility to generate economic income is important. In times of COVID-19, this was a double responsibility, since social isolation did not allow the normal development in the labor market and his participation was limited. Access to better opportunities is a determining option that many households seek, which is why the area of residence was very decisive for the improvement of the economic income in the home.
Therefore, the effect of education measured through the years of schooling on the economic income of households in Peru in times of the pandemic (COVID-19) was positive, or direct, since when applying the Mincer, it was possible to determine that the years of schooling explain 14.34% of the economic income at home. In addition, the experience of the worker, the gender of the worker, the area of residence of the worker, the age of the worker and the marital status of the worker, in the same way, have a positive effect on the economic income, strongly highlighting the gender of the worker which explains 19.86% and the area of residence of the worker which explains 30.45%. In this sense, it can be indicated that education was decisive for the improvement in the generation of economic income in households in times of the pandemic, and therefore the approach of public policies oriented toward the generation of better opportunities was very important.

4. Discussion

The important results of the implication of education on the economic income in households in Peru agree with the results obtained by Briceño (2013), in view of the fact that the effect of education both on the generation of human capital for the present and future generations and on the improvement of economic incomes and therefore on economic development is positive, which makes it an important factor in ensuring higher productivity. By seeking to guarantee the insertion of human capital with greater capacity into the labor market, its positioning and permanence in it would be guaranteed. This also coincides with the results of Björklund and Kjellström (2002), since when comparing the present value of income throughout life between the education of young people and adults, they show considerable differences, generating greater returns in the young population group, and this is justified by the levels of education achieved by the young population which are normally university and postgraduate levels, which allows them to have greater opportunities to access the labor market.
Similarly to the previous authors, Freire et al. (2010) sought to calculate the impact of education on the performance of economic income in the young population, whose ages were 16 and 34 years, of Galicia by applying an expanded Mincer model, demonstrating the education returns of these groups that have a level below the higher level and others that are above it and obtaining a coefficient of 28.25% and 14.6% in economic income; this is closely related to the result in our research that amounts to 14.32% in general.
In addition, we agree with the results found by Giménez et al. (2005), since when applying the Mincer equation to the case of Paraguay, they determined that education does have positive effects on the economic income of people throughout their working lives. The expected signs were the same as those found in the present research and fully coincide with this theory, in view of the fact that they affirm that the years of education received, the work experience they have, the gender and the area of residence of the worker have positive effects on economic income, despite the fact that the experience that the worker has shows returns at decreasing rates. In this research, they also obtained positive and considerable rates of return on educational level, which amounted to 11.15%, while in our case, it reached 14.34%; in the case of work experience, they obtained a return of 3.57%, and in our case, it was 0.03%; in the case of gender, they obtained a return of 2.28%, and in our case, it was 19.86%; and in the variable area of residence for Paraguay, it was 36.05%, and in the Peruvian case, a rate of return of 30.45% was obtained. Therefore, this demonstrates the consistency and compatibility of similar results. In addition, these results coincide with those obtained by Alfonzo (2000): the higher the level of education of low-income families, the greater the impact in the medium and long term on the reduction of inequality in economic income. In this sense, the aforementioned authors assessed the importance of the Mincer theory, given that its application is very efficient.
The application of the Mincer equation for the case of regions of Argentina carried out by Galassi and Andrada (2011) showed results similar to the present research. Using data from Argentina’s Permanent Household Survey, they were able to determine that socioeconomic variables showed a significant effect on wages and labor participation, even though they did not suffer a considerable variation in returns to education. In addition, they detailed that, at the level of the regions, those with a higher rate of return on education were the Northeast (NEA) with 10.30%, followed by with 9.30% and the Northwest region with 8.80%, while the expected return in the other regions was very low.
The results obtained by Navarro-España (2011) in the case of Cartagena, Colombia, show that the economic income of women has a lower adjustment than that of men; therefore, compared with the results of our research, when assuming the responsibility of the head of household, the man obtains a return of 19.86%, but in the case of Cartagena, women generate a return of 11%, and men generate a return of 10%, which is very coincident and similar in the two investigations—the income of women is lower and the rate of return on investment in education for women is lower compared to those of men.
In this sense, similar to Digdowiseiso (2009), the growth of an economy is significantly related to the equitable distribution of economic income, and therefore inequality and economic growth are directly related to its lagging values; that is why the realization of investment in the improvement of human capital through education is positively related to economic income and economic growth.

5. Conclusions

The effect of education measured through the years of schooling on the economic income of households in Peru in times of the pandemic (COVID-19) was positive, or direct, since the years of schooling explain 14.34% of the economic income in the household; the experience of the worker, the gender of the worker, the area of residence of the worker, the age of the worker and the marital status of the worker, in the same way, have a positive effect on the economic income, strongly highlighting the gender of the worker that explains 19.86% of the economic income in the home and the area of residence of the worker which explains 30.45% of the economic income in households in Peru.
In order to improve the expected performance of education in economic income, it is recommended to establish public policies not of a welfare type but with actions that guarantee the conditions of infrastructure at the different educational levels, complemented with equipment programs but with technology according to the countries of the first world, such as access to laboratories, workshops, network systems, internet and implementation in the educational model research, development and innovation.

Author Contributions

The authors contributed to this research according to the following details: Conceptualization, M.S.H.-G.; methodology, S.L.A.-P.; software, A.M.-F.; validation, G.A.F.-T.; formal analysis, B.E.C.-Q.; data curation, M.I.A.-L.; research, writing—preparing the original draft, writing—reviewing and editing, J.C.Q.-M.; display, W.L.V.-V.; supervision, A.C.-M. All authors have read and agreed to the published version of the manuscript.

Funding

This research received no external funding.

Data Availability Statement

The data used in this research is available to the public in the database of the National Household Survey (ENAHO), of the National Institute of Statistics and Informatics (INEI) of Peru.

Conflicts of Interest

The authors declare that they have no conflict of interest of any kind in this scientific research.

References

  1. Abbasa, Qaisar, and James Foreman-Peck. 2007. The Mincer human Capital Model in Pakistan: Implications for Educational Policy. Available online: https://www.econstor.eu/handle/10419/83948 (accessed on 3 July 2022).
  2. Alfonzo, Leonardo. 2000. La Educación en la determinación de los ingresos laborales en el Paraguay. Economía & Sociedad 1: 21. Available online: http://biblioteca.clacso.edu.ar/Paraguay/cadep/20160721042551/1.pdf (accessed on 3 July 2022).
  3. Bakker, Bas, Manuk Ghazanchyan, Alex Ho, and Vibha Nanda. 2020. The Lack of Convergence of Latin-America Compared with CESEE. IMF Working Papers. Washington, DC: International Monetary Fund. [Google Scholar] [CrossRef]
  4. Birdsall, Nancy, and Juan Luis Londono. 1997. Inequality and human capital accumulation in Latin America (With some lessons for Egypt). Egyptian Center for Economic Studies 1. Available online: https://www.eces.org.eg/cms/NewsUploads/Pdf/2019_1_6-10_9_37qqq.pdf (accessed on 3 July 2022).
  5. Björklund, Anders, and Christian Kjellström. 2002. Estimating the return to investments in education: How useful is the standard Mincer equation? Economics of Education Review 21: 195–210. [Google Scholar] [CrossRef]
  6. Bornacelly, Iván. 2013. Educación técnica y tecnológica para la reducción de la desigualdad salarial y la pobreza. Desarrollo y Sociedad 71: 83–121. [Google Scholar] [CrossRef]
  7. Briceño, Mosquera Andrea. 2013. La educación y su efecto en la formación de capiltal humano y en el desarrollo económico de los países. Apuntes Del Cenes 30: 45. [Google Scholar] [CrossRef]
  8. Carrasco, Choque Freddy, and Araujo Rudy Francheska Castillo. 2021. Human capital and job opportunities according to educational level in Perú. Universidad Ciencia y Tecnología 25: 48–57. [Google Scholar] [CrossRef]
  9. Cerquera, Losada, Oscar Hernán, María de los Ángeles Clavijo Tovar, and Carla Yanella Pérez Peña. 2022. Capital humano y crecimiento económico: Evidencia empírica para Suramérica. Apuntes del CENES 41. Available online: https://revistas.uptc.edu.co/index.php/cenes/article/view/13679/11460 (accessed on 3 July 2022). [CrossRef]
  10. Chatani, Kazutoshi. 2012. Human capital and economic development. In Diagnosing the Indonesian Economy: Toward Inclusive and Green Growth. London: Anthem Press, pp. 275–300. [Google Scholar] [CrossRef]
  11. De La Cruz-Vargas, Jhony. 2020. Protegiendo al personal de la salud en la pandemia Covid-19. Revista de La Facultad de Medicina Humana 20: 7–9. [Google Scholar] [CrossRef]
  12. De la Fuente, Angel, and Antonio Ciccone. 2003. Human Capital in a Global and Knowledge-Based Economy. Education + Training 45. [Google Scholar] [CrossRef] [Green Version]
  13. Delgado, Pugley Deborah. 2020. La COVID-19 en el Perú: Una pequeña tecnocracia enfrentándose a las consecuencias de la desigualdad. Análisis Carolina, 1–16. [Google Scholar] [CrossRef]
  14. Digdowiseiso, Kumba. 2009. Education Inequality, Economic Growth, and Income Inequality: Evidence from Indonesia, 1996–2005. SSRN Electronic Journal. Available online: https://papers.ssrn.com/abstract=1602642 (accessed on 25 May 2022). [CrossRef] [Green Version]
  15. Espinosa, Angélica Buendía, and José Miguel Natera Marín. 2022. Educación Superior, CTI y desigualdad: Límites y contradicciones sistémicas en tiempos de COVID-19. Revista del Núcleo de Estudios e Investigaciones en Educación Superior de Mercosur 11: 54–69. [Google Scholar] [CrossRef]
  16. Ferrada-Bustamante, Victoria, Nicolás González-Oro, Marco Ibarra-Caroca, Aldo Ried-Donaire, Danalla Vergara-Correa, and Franklin Castillo-Retamal. 2021. Formación docente en TIC y su evidencia en tiempos de COVID-19. Revista Saberes Educativos 6: 144–68. Available online: https://sintesisdejurisprudencia.uchile.cl/index.php/RSED/article/view/60715/64525 (accessed on 25 May 2022).
  17. Figallo, Flavio, María Teresa González, and Verioska Diestra. 2020. Perú: Educación superior en el contexto de la pandemia por el COVID-19. Revista de Educación Superior en América Latina 8: 20–28. [Google Scholar] [CrossRef]
  18. Fraumeni, Barbara, and Gang Liu. 2020. A Brief Introduction to Human Capital Measures (Issue 13494). Available online: https://www.nber.org/papers/w27561 (accessed on 3 July 2022).
  19. Freire, Seoane, María Jesús, and Mercedes Teijeiro Álvarez. 2010. La inversión en capital humano de los jóvenes gallegos: ¿sigue siendo rentable la educación? Cuadernos de Economía 33: 45–69. [Google Scholar] [CrossRef] [Green Version]
  20. Galassi, Gabriela Liliana, and Marcos Javier Andrada. 2011. Relación entre educación e ingresos en las regiones geográficas de Argentina. Papeles de Poblacion 17: 257–90. Available online: http://www.scielo.org.mx/scielo.php?pid=S1405-74252011000300009&script=sci_arttext (accessed on 3 July 2022).
  21. Giménez, Dora Liz Cardozo, Katya María Fogel Artemenko, Liliana Raquel Molinas Montiel, and María Raquel Rabito de Franco. 2005. Efectos de la educación en los ingresos: Una exploración de la teoría de Mincer aplicada a la realidad paraguaya. Población y Desarrollo 16: 60–75. Available online: https://dialnet.unirioja.es/servlet/articulo?codigo=5654300 (accessed on 3 July 2022).
  22. Giménez, Gregorio. 2005. La dotación de capital humano de América Latina y el Caribe. Revista de La CEPAL 2005: 103–22. Available online: https://repositorio.cepal.org/bitstream/handle/11362/11071/086103122_es.pdf?sequence=1&isAllowed=y (accessed on 3 July 2022). [CrossRef]
  23. Graham, Carol, and Julia Ruiz Pozuelo. 2022. Do high aspirations lead to better outcomes? Evidence from a longitudinal survey of adolescents in Peru. Journal of Population Economics. [Google Scholar] [CrossRef]
  24. Hall, Gillette, and Harry Anthony Patrinos. 2006. Pueblos indígenas, pobreza y desarrollo humano en América Latina: 1994–2004. Banco Mundial: Direcciones Para El Desarrollo 2: 10–11, 16. Available online: http://www.crin.org/docs/bid_indigenous.pdf (accessed on 3 July 2022).
  25. Huggett, Mark, Gustavo Ventura, and Amir Yaron. 2006. Human capital and earnings distribution dynamics. Journal of Monetary Economics 53: 265–90. [Google Scholar] [CrossRef] [Green Version]
  26. INEI. 2021. Evolucion de la Pobreza Monetaria 2009–2020. Reporte Anual INEI. Available online: https://www.inei.gob.pe/media/MenuRecursivo/publicaciones_digitales/Est/pobreza2020/Pobreza2020.pdf (accessed on 3 July 2022).
  27. Ishfaq, Mubashir, Ahsan Muhammad, and Yousaf Muhammad. 2021. Human Capital Formation and Income Disparity in Developing Nations: A Panel Data Analyses. Journal of Contemporary Macroeconomic Issues 2: 1–9. Available online: http://scekr.org/wp-content/uploads/2021/07/1_JCMI_the_paper_June21.pdf (accessed on 3 July 2022).
  28. Juárez, García Francisco, Jorge Villatoro Velázquez, and Elsa Karina López Lugo. 2002. Apuntes de Estadística Inferencial. Available online: https://d1wqtxts1xzle7.cloudfront.net/58715087/Estadistica_Inferencial-with-cover-page-v2.pdf?Expires=1652822788&Signature=edb~vBVQFXTNca3jKXxQ832izhg7xmXpp2vU8yqG0ZAtmIt~GL-GvxzpYslncg9Fa5oJ3ZwSUXWg4swx9RcgZWRi2dHVPJ4HcAavGNGpiLcoDzrTG2Hek9ZkXIrqg5LsJv-g (accessed on 3 July 2022).
  29. Katz, Raúl. 2018. Capital humano para la transformación digital en América Latina. Desarrollo Productivo 219: 40. Available online: https://repositorio.cepal.org/handle/11362/43529 (accessed on 3 July 2022).
  30. Korres, George, Elias Kourliouros, George Tsobanoglou, and Kokkinou Aikaterini. 2014. Socio-economic sustainability, regional development and spatial planning: European and international dimensions and perspectives. Mytilene. [Google Scholar] [CrossRef]
  31. Kuzminov, Yaroslav, Pavel Sorokin, and Isak Froumin. 2019. Generic and specific skills as components of human capital: New challenges for education theory and practice. Foresight and STI Governance 13: 19–41. [Google Scholar] [CrossRef]
  32. Laderas, Huillcahuari Edison, Pedro Huauya Quispe, and Víctor Alcides Coaquira Cárdenas. 2020. COVID-19, un desafío para la educación inclusiva en el Perú. Nvestigación 18: 45–74. [Google Scholar] [CrossRef]
  33. Lemieux, Thomas. 2006. The “Mincer Equation” Thirty Years After. Jacob Mincer A Pioneer of Modern Labor Economics, 127–145. Available online: https://link.springer.com/chapter/10.1007/0-387-29175-X_11 (accessed on 22 May 2022). [CrossRef]
  34. Martin, Bruce, Jeffrey McNally, and Michael Kay. 2013. Examining the formation of human capital in entrepreneurship: A meta-analysis of entrepreneurship education outcomes. Journal of Business Venturing 28: 211–24. [Google Scholar] [CrossRef] [Green Version]
  35. McLauchlan de Arregui, Patricia. 1993. Empleo, ingresos y ocupaciόn de los profesionales y técnicos en el Perú. Notas Para el Debate 9. Available online: http://repositorio.grade.org.pe/handle/20.500.12820/331 (accessed on 22 May 2022).
  36. Mendoza Bellido, Waldo. 2014. Cómo Investigan los Economístas? Guía Para Elaborar y Desarrollar un Proyecto de Investigación. Available online: https://files.pucp.education/departamento/economia/lde-2014-05.pdf (accessed on 22 May 2022).
  37. Meza, Revatta, Lucas Fernando, Julio Samuel Torres Miranda, and Oscar Mamani-Benito. 2020. Gestión educativa como factor determinante del desempeño de docentes de educación básica regular durante la pandemia Covid-19, Puno-Perú. Apuntes Universitarios 11: 23–35. [Google Scholar] [CrossRef]
  38. Mincer, Jacob, and Solomon Polachek. 1978. An Exchange: The Theory of Human Capital and the Earnings of Women: Women’s Earnings Reexamined. The Journal of Human Resources 13: 118. [Google Scholar] [CrossRef]
  39. Mincer, Jacob. 1974. Progress in Human Capital Analysis of the Distribution of Earnings. Economics of Education Review 3: 195–205. [Google Scholar] [CrossRef] [Green Version]
  40. Mincer, Jacob. 1984. Human capital and economic growth. Economics of Education Review 3: 195–205. [Google Scholar] [CrossRef] [Green Version]
  41. Mincer, Jacob. 2015. The Production of Human Capital and the Life Cycle of Earnings: Variations on a Theme. Journal of Labor Economics 15: 26–47. [Google Scholar] [CrossRef]
  42. Mincer, Jacob. 2016. Human Capital and the Labor Market: A Review of Current Research. Educational Researcher 18: 27–34. [Google Scholar] [CrossRef]
  43. Miyashiro, Manuel José Kamichi. 2022. Pobreza y desigualdad en el Perú en medio de la COVID-19. Praxis Social, Revista de Trabajo Social 5: 180–216. Available online: https://revistapraxissocial.com/index.php/praxis/article/view/42/28 (accessed on 3 July 2022).
  44. Monroy, Guadalupe Villalobos, and René Pedroza Flores. 2009. Perspectiva de la Teoría del Capital Humano acerca de la relación entre educación y desarrollo económico. Tiempo de Educar. Available online: http://www.redalyc.org/articulo.oa?id=31112987002 (accessed on 3 July 2022).
  45. Mungaray, Alejandro, Nidia Gonzalez Arzabal, and Germán Osorio Novela. 2021. Educación financiera y su efecto en el ingreso en México. Problemas Del Desarrollo. Revista Latinoamericana de Economía 52: 55–78. [Google Scholar] [CrossRef]
  46. Murillo Lozano, Margalida. 2021. El rol de la Distribución de Capital Humano en el Crecimiento Económico: Teoría y Evidencia. Available online: https://repositorio.unal.edu.co/bitstream/handle/unal/79667/38791894.2021.pdf?sequence=2&isAllowed=y (accessed on 3 July 2022).
  47. Navarro-España, Jorge Luis. 2011. Comportamiento de los perfiles de edad-ingreso y educación-ingreso según género en Cartagena en 1999. Panorama Económico 19: 53–74. [Google Scholar] [CrossRef]
  48. Osiobe, Ejiro Uriri. 2020. Human Capital and Economic Growth in Latin America: A Cointegration and Causality Analysis. The Economics and Finance Letters 7: 218–35. [Google Scholar] [CrossRef]
  49. Pacheco Lay, Gonzalo Alaberto, and Arturo Rafael Omar Miranda Blanco. 2021. Impacto de la crisis económica en el financiamiento y gasto público en educación en el Perú: Periodo 2020–2021. Revista Educación 45: 21. [Google Scholar] [CrossRef]
  50. Pérez-Fuentes, Dewin Iván, and Jorge Leonardo Castillo-Loaiza. 2016. Capital humano, teorías y métodos: Importancia de la variable salud. Economía Sociedad y Territorio, 651. [Google Scholar] [CrossRef] [Green Version]
  51. Prados de la Escosura, Leandro, and Joan Ramón Rosés Vendoiro. 2010. Human capital and economic growth in Spain, 1850–2000. Explorations in Economic History 47: 520–32. [Google Scholar] [CrossRef] [Green Version]
  52. Quispe, Mamani, Julio Cesar, Giovana Araseli Flores Turpo, Dominga Asunción Calcina Álvarez, Cristóbal Rufino Yapuchura Saico, Wily L. Velásquez Velásquez, Santotomas Lisimaco Aguilar Pinto, Betsy Quispe Quispe, Nelly Beatriz Quispe Maquera, and Balbina E. Cutipa Quilca. 2022. Gap and Inequality in the Economic Income of Independent Workers in the Region of Puno-Peru and the Effect of the Pandemic, 2019–2020. Frontiers in Sociology, 31. Available online: https://www.frontiersin.org/articles/10.3389/fsoc.2022.858331/full (accessed on 3 July 2022). [CrossRef]
  53. Ramió, Carles, and Miguel Salvador. 2005. Instituciones y nueva gestión pública en América Latina. Available online: http://uaer.humanidades.unam.mx/boletin/Boletin-73-2020-Marzo.pdf (accessed on 3 July 2022).
  54. Ranis, Gustav, and Frances Stewart. 2002. Crecimiento económico y desarrollo humano en América Latina. Revista de La CEPAL 2002: 7–24. [Google Scholar] [CrossRef]
  55. Terrones, Marco, and César Calderón. 1990. Educación, capital humano y crecimiento económico: El caso de América Latina. Grade. Available online: http://repositorio.grade.org.pe/handle/20.500.12820/332 (accessed on 3 July 2022).
  56. Unger, Jens Marcus, Andreas Rauch, Michael Frese, and Nina Rosenbusch. 2011. Human capital and entrepreneurial success: A meta-analytical review. Journal of Business Venturing 26: 341–58. [Google Scholar] [CrossRef] [Green Version]
  57. Urrunaga, Roberto, and Carlos Aparicio. 2012. Infraestructura y crecimiento económico en el Perú. Revista de La CEPAL 2012: 157–77. [Google Scholar] [CrossRef]
  58. Varona-Castillo, Luis, and Jorge Ricardo Gonzales-Castillo. 2021. Economic growth and income distribution in Peru. Problemas Del Desarrollo 52: 79–107. [Google Scholar] [CrossRef]
  59. Vázquez-Rodríguez, Ana, Jesús García Álvarez, and Miguel Ángel Santos Rego. 2021. Movilidad internacional y empleabilidad: El impacto en el capital humano y social de la juventud. Educar 57. [Google Scholar] [CrossRef]
  60. World Bank Group. 2018. Human Capital the Human. Available online: https://elibrary.worldbank.org/doi/abs/10.1596/30498 (accessed on 3 July 2022).
  61. World Bank Group. 2020. Human Capital Project. Available online: https://documents1.worldbank.org/curated/en/363661540826242921/pdf/The-Human-Capital-Project.pdf (accessed on 3 July 2022).
  62. World Economic Forum. 2017. The Global Human Capital Report 2017: Preparing for the Future of Work. Available online: https://www3.weforum.org/docs/WEF_Global_Human_Capital_Report_2017.pdf (accessed on 3 July 2022).
Figure 1. The relationship between economic income and education.
Socsci 11 00300 g001
Table 1. Operationalization of model variables.
Variable TypeVariable Categorization Detail
Dependent variableEconomic income of the worker Percentage Ln of economic income
Independent variablesYears of worker schooling Continuous and quantitativeYears
Age of the worker Continuous and quantitativeYears
Worker experience Continuous and quantitativeYears of work experience
Experience of the worker squaredContinuous and quantitativeYears of work experience squared
Gender of the worker Qualitative and dichotomous 1 = Man
0 = Woman
Civil status of the worker Qualitative and categorical 1 = Cohabitant
2 = Married
3 = Widower
4 = Divorced
5 = Separated
6 = Single
Worker’s area of residenceQualitative and dichotomous1 = Urban
0 = Rural
Table 2. Descriptive analysis of the variables under analysis.
VariableMedian Standard Deviation Minimum ValueMaximum Value
Years of schooling of the worker11.610113.972278018
Worker experience6.40252710.10606050
Worker’s gender0.62635380.484208601
Worker’s age40.0433213.956211478
Marital status of the worker3216
Worker’s area of residence0.86462090.342437201
Economic income of the worker1275.961451.4171515,000
Table 3. Correlation between income and education.
VariableIndicator
Economic income of the worker1.0000
Years of schooling of the worker0.50221.0000
Worker’s area of residence0.20250.32541.0000
Worker’s age0.2343−0.06050.11551.0000
Marital status of the worker−0.10020.10790.0184−0.47861.0000
Worker’s gender−0.0057−0.1530−0.03300.0602−0.12101.0000
Worker’s experience0.33320.16240.11040.5192−0.19100.00341.0000
Table 4. Regression between economic income and years of schooling and others, Mincer model.
VariableCoefficientStandard ErrorStatistical TP > t[95% Confidence Interval]
Years of schooling of the worker0.14340.011812.17000.00000.12020.1665
Worker experience0.02950.01312.24000.02500.00360.0553
Squared worker experience0.00030.0004−0.89000.3730−0.00110.0004
Worker’s gender0.19860.08922.23000.02600.02340.3737
Worker’s area of residence0.30450.13242.30000.02200.04440.5647
Worker’s age0.01420.00413.50000.00100.00620.0221
Marital status of the worker0.03840.0231−1.66000.0970−0.08370.0070
Constant3.91330.256115.28000.00003.41024.4164
Statistics SSdfMSNumber of obs554
F(7, 546)42.82
Model297.243503742.4633576Prob > F0.0000
Residual541.5091115460.99177493R-squared 0.3544
Adj R-squared0.3461
Total838.7526145531.51673167Root MSE0.99588
Publisher’s Note: MDPI stays neutral with regard to jurisdictional claims in published maps and institutional affiliations.

