Article

Dynamic Displacement of an Aluminum Frame Using Close Range Photogrammetry

by
Setareh Ghaychi Afrouz
1,*,
Mohammad Reza Razavi
2,
Ashkan Pourkand
3 and
Claudia Mara Dias Wilson
4
1
Department of Mining and Mineral Engineering, Virginia Tech, Blacksburg, VA 24060, USA
2
Department of Mineral Engineering, New Mexico Tech, Socorro, NM 87801, USA
3
Department of Computer Science, University of Utah, Salt Lake City, UT 84112, USA
4
Department of Civil and Environmental Engineering, New Mexico Tech, Socorro, NM 87801, USA
*
Author to whom correspondence should be addressed.
Buildings 2019, 9(8), 176; https://doi.org/10.3390/buildings9080176
Submission received: 8 July 2019 / Revised: 25 July 2019 / Accepted: 25 July 2019 / Published: 29 July 2019
(This article belongs to the Special Issue Non-destructive Testing for Building Evaluation)

Abstract

:
Dynamic displacement measurement of objects can be challenging due to the limitations of conventional methods and pricey instrumentation of unconventional methods, such as laser scanners. In this research, Close Range Photogrammetry (CRP) is used as an affordable non-contact method to measure 3D dynamic displacements. It is proposed as a reliable alternative to traditional dynamic deformation measurement methods such as displacement sensors or accelerometers. For this purpose, dynamic displacements of a three-dimensional one-story building frame model on a one-dimensional shake table are determined by using the traditional method of attached accelerometer and CRP. The results of the CRP method are compared with the results of the traditional methods as well as numerical models. The results show a good agreement which evidences the reliability of the CRP with regular cameras.

1. Introduction

Dynamic loads are time-dependent vectors applied to structures which may cause deformation in the subjected elements, such as an increase or decrease in beams’ length. The adverse influence of dynamic load on structures can exceed the equivalent static load [1]. Therefore, it is essential to measure deflections subjected to dynamic loading systems accurately. Traditional displacement and acceleration measurement methods such as extensometers, accelerometers, and LDVTs are widely used to determine the dynamic deformation despite their limitations in measurement; for instance, they have to be in contact with the monitored surface that is not always accessible. Besides, the number of monitoring points is generally limited to the number of instruments and increasing the number of instruments would increase the monitoring cost significantly. The other problems associated with these methods are difficulty in installation, possible damages to the sensor during installation, and interference with the structure or adjacent structures. Close Range Photogrammetry (CRP), on the other hand, can measure three-dimensional displacements remotely without any direct contact of sensors.
The changes in objects subjected to a specified loading system can be determined by Digital Image Correlation (DIC) based on the comparison of the location of corresponding points in at least two sequential images [2,3]. 2D and 3D digital images have been used to measure the displacement of objects such as rock specimen subjected to static loading [4,5,6], masonry walls in buildings [7] and bridge deflection measurement [8].
Likewise, CRP uses digital images taken from different angles to determine the 3D coordinates of every common point in the photographs [9,10]. Displacement of a particular point is measured by comparing the coordinates of that point at the current time with the coordinates of the same point at a previous time. Dynamic displacements are determined by reducing the time interval between photographs. Measurement of the dynamic displacement of different points on an object allows for three-dimensional modeling of the deformation over the loading time [11,12].
CRP has been extensively used to determine the displacements due to static loads in soil and rock slopes [13,14], and in open pit and underground mining [15,16,17,18]. However, it has just recently began to be applied to dynamic problems due to advances in the resolution and capabilities of affordable digital cameras [12,19,20,21,22].
To increase the accuracy of 3D measurements of a vibrating structure, Lee et al. (2016) introduced the least-square image matching for sub-pixel targeting. In this method, a finer pixel spacing is created by determining sub-pixels based on the least square method of the matched pixels in two overlapping images [23]. The accuracy of measurements using CRP is affected considerably by the quality of the photographs [24] which is a function of lighting conditions, camera resolution, distance to the object, and additional factors such as lens distortion.
In this study, the practicality of the CRP application to monitor and measure the displacement of structures subjected to dynamic loads is discussed. For this purpose, optimized photo shooting conditions are evaluated for a pair of digital single-lens reflex (DSLR) cameras to reduce the error in the CRP measurements. The test model is a small-scale one-story aluminum frame made of four columns and subjected to base acceleration induced by a shake table. Frames’ displacements are measured by accelerometers as well as by CRP. The accelerometer results are used to validate the CRP results. In addition, the accuracy of a 3D numerical model to predict the dynamic displacements is evaluated.

Dynamic Displacements Using CRP

As mentioned previously, CRP may be used to measure displacements that happen in a short time or dynamic displacements by using two synchronized digital single lens reflex (DSLR) cameras with the capability of capturing videos at the same frame rate per second (fps). In this study, two identical DSLR cameras (Canon EOS 1100D Rebel T3) with 50 mm focal length prime lenses are fixed at a distance of approximately 1 m from the test model. The resolution of cameras is 12 Megapixels (MP). Based on the cameras’ characteristics and their distance to the test model, the precision of the measurement is expected to be close to 0.3 mm. A multi-channel remote is used to trigger the cameras and capture video simultaneously. A stopwatch is placed within the field of view of both cameras to synchronize the video frames, as sometimes one camera receives the remote signal with a short delay. To minimize the error in the determination of coordinates of different points in the CRP method and achieve the best results, both cameras point to the test model at a right angle to each other. To verify the CRP result during the test, first the distance of two coded targets on a rigid body is measured via caliper. During the test, the 3D Euclidean distance of the measured targets are computed and compared to the measurement. The maximum residual error in distance never exceeded 1 mm.
Figure 1 shows the location of the cameras relative to the test model fixed on the shake table. Points i´ and i″ represent the projections of an arbitrary point on the test model on each camera charge coupled device (CCD). Coordinates of each point projected on the CCD are calculated by knowing the lens and camera specifications, such as focal length and CCD size and resolution [25].
Figure 2 presents the test setup using background light and two synced cameras focused on the shake table. Also visible in Figure 2 are targets or unique known shapes that can be recognized in picture series. Some of these coded targets are stationary and installed outside the moving parts of the structure and the shake table. The coordinates of the moving targets over time are calculated based on the location of the stationary ones. The moving direction, shown in Figure 2, is along the Y axis. A uniaxial accelerometer is used to measure the acceleration of the top frame analog the Y axis. A fixed global coordinate frame is defined in the PMM code attached to the stationary targets. The displacement of the moving targets and accelerometer’s location are measured with respect to the fixed global coordinate frame. Figure 3 demonstrates the locations of these targets in concurrent images.

2. Materials and Methods

The coded targets in the concurrent images are tracked by PhotoModeler Motion(TM) (PMM) computer program (CRP code) in this project. PMM records four-dimensional measurements: three spatial dimensions at different times. This code accepts video data or sequences of frames from a camera and tracks targets over time [26]. Targets in PMM have high-contrast and are easily identifiable points on the object or the scene. Coded targets, that are, targets with a unique code ring around them that makes them automatically recognized by PMM, are used in this study.
The coordinate of each point in a single image is based on the known focal length of the camera, which is the distance between the lens and the imaging sensors [26]. The focal point is where light rays intersect in the camera. The coordinate of objects in two overlapping images taken by two cameras can be computed based on the known coordinate of their focal points. These coordinate calculations should be corrected based on the radial and decentering lens distortions, which are calculated during camera calibration when actual distances of objects in the image are known [27]. The shake table used in this study is a single degree of freedom aluminum table with dimensions of 76.2 × 76.2 cm. Its operating frequencies range from 1 Hz to 100 Hz. The maximum nominal payload of the table is 113.4 kg. The peak displacement and acceleration are ±7.62 cm, and 1.5 g, respectively.
A simple and light temporary 3D aluminum frame is built to determine the required size of the final test model and the desired locations of targets. After a few preliminary tests and adjustments, a 3D one-story frame, with the dimensions shown in Figure 4 and Table 1 is built. Beams and columns are made of aluminum box sections while the roof and base are made of plywood with a thickness of 13 mm. Beam to column and column to base connections are made of aluminum angles, bolts, and nuts. A mass of 8 kg is fixed on the roof diaphragm to increase the mass of the frame and the dynamic displacements. Coded targets to be traced by PMM are fixed on the roof and base of the structure. Additionally, two single access accelerometers with a logging time step of 0.00125 sec are installed along the Y access of the coordinates (defined at Figure 2) on the roof and the surface of shake table.
The lateral stiffness of the test model is obtained by measuring the lateral displacements corresponding to lateral static loads (Figure 5). The average lateral stiffness and mass of the frame are estimated to be 4.5 kN/m and 8.1 kg, respectively.

Numerical Model: 3-D Frame under Dynamic Linear Load Model

A finite element model (FEM) of the test frame is developed using a commercial finite element code, SAP2000, to compare the FEM predictions with the actual measurements. Beams and columns are modeled by beam elements and the roof diaphragm is modeled by shell elements. Simple hinge connections are used for all beam-to-column connections. Torsional springs are used for the connections of columns to the base. The stiffness of these springs is determined to be 186 N-m/rad to allow a lateral stiffness of 4500 N/m assuming the columns are almost rigid. The system is subjected to a dead load of 85 N on the roof and a 1 Hz sinusoidal displacement with an amplitude of 2 cm at the base.

3. Results and Discussion

The dynamic deformation during loading is recorded by two identical cameras. The initial experiments are repeated with different test settings to obtain the best results of the CRP. The burst mode, known as continuous high-speed mode, and videos are used for taking sequential photos. Also, the tests are replicated in manual focus, automatic focus and different lighting situations, such as natural daylight and supplementary background lights. The video records with a bright background, using high temperature LED lights, show the least difference in triggering time and the most synchronized frames for the two cameras. As such, this mode was selected for the measurements. Figure 6 shows the displacements of the test model’s roof along the direction of the dynamic load applied by the shake table measured by CRP as well as the accelerometers. In general, CRP results match well with the accelerometer results. Although some noise in the displacements obtained by integrating the accelerometer data is expected, larger discrepancies are observed at the beginning, when the shake table starts to move and at the end, when the shake table prepares to stop. These discrepancies are due to the abrupt change in frequency of the movement by the shake table at the beginning and the end of its movement. Moreover, they could be due to the lack of CRP data for these intervals and could be rectified by a larger fps rate (or a higher speed camera).
It is important to notice that the test model is a 3D model and can move along different directions. The accelerometers measured the acceleration only along one direction, more accelerometers would be needed to measure the acceleration in the other two directions. However, CRP measured the displacements along three independent directions at once, which is one of the advantages of CRP over the traditional measurements of displacements using accelerometers. Figure 7 shows the displacements of the test model’s roof in all three directions: vertical (Z), perpendicular to the load in a horizontal plane (X), and in along the loading direction (Y).
Figure 8 shows the displacements obtained by CRP, accelerometers, and the FEM model. The results show the location error after compensating for 0.32 degrees of lead never exceeded 0.5 cm; though at the beginning and end of the displacement-time history the FEM results differed from the actual measurements, due to ragged increase in the frequency of shake table in a short time. As the structure is modeled with measured stiffness of connections in the direction of the applied dynamic load, the FEM model is not considering the displacement in other directions perpendicular to the dimension of the applied load.

4. Conclusions

In this study, the dynamic displacements of a small scale 3D one-story frame subjected to dynamic loading by a shake table are monitored using two different techniques: the traditional contact method of installing accelerometers on the frame and CRP, a noncontact method. Additionally, the frame is modeled using FEM and its results are compared to the actual measurements. CRP results are matched against the accelerometers results and FEM results in phase and amplitude.
The manual synchronization by using a stop-watch generated results with 0.32 degrees lead between the accelerometer and CRP. It is possible to avoid this error and improve the result by using only one computer for both measurement tools. Moreover, there are multiple ways to improve the CRP resolution, including using higher resolution cameras, locating the cameras in an optimized location, and increasing the number of cameras.
One of the main advantages of the CRP method is that it measures the displacements in three independent directions at once, while different accelerometers would be needed in each direction to obtain the same results. For CRP, the measurement accuracy increases with increasing image resolution and the number of captured frames per second. Moreover, the cost and required time for instrumentation and analysis are relatively low compared to similar contact and noncontact methods.

Author Contributions

Conceptualization, S.G.A. and M.R.R.; Data curation, S.G.A.; Formal analysis, S.G.A.; Investigation, M.R.R. and A.P.; Methodology, S.G.A.; Project administration, S.G.A.; Resources, M.R.R. and C.M.D.W.; Software, M.R.R.; Validation, S.G.A., M.R.R. and A.P.; Visualization, A.P.; Writing—original draft, S.G.A.; Writing—review & editing, M.R.R., A.P. and C.M.D.W.

Funding

This research received no external funding.

Acknowledgments

We thank our colleagues from the Department of Mining and Mineral Engineering at New Mexico Tech who provided the convenience of access to licenses of software and adequate data.

Conflicts of Interest

The authors declare no conflict of interest.

References

  1. Chopra, A.K. Dynamics of Structures, 4th ed.; Prentice Hall: Upper Saddle River, NJ, USA, 2007. [Google Scholar]
  2. Roncella, R.; Romeo, E.; Barazzetti, L.; Gianinetto, M.; Scaioni, M. Comparative Analysis of Digital Image Correlation Techniques for In-plane Displacement Measurements. In Proceedings of the 5th International Congress on Image and Signal Processing (CISP 2012), Chongqing, China, 16–18 October 2012. [Google Scholar]
  3. Ackermann, F. Digital Image Correlation: Performance and Potential Application in Photogrammetry. Photogramm. Rec. 1984, 11, 429–439. [Google Scholar] [CrossRef]
  4. Razavi, M.R.; Pourkand, A.; Mojtabai, N. Challenges in Determination of Brazilian Test Rock Specimens Surface Displacements by Using Digital Image Cross-Correlation. In Proceedings of the 48th US Rock Mechanics, Minneapolis, MN, USA, 1–4 June 2014. [Google Scholar]
  5. Pourkand, A. Determination of Micro Displacement Fields on the Rock Surface Using Digital Image Correlation. Master’s Thesis, New Mexico Institute of Mining and Technology, Socorro, NM, USA, 2014. [Google Scholar]
  6. Abanto-Bueno, J.; Lambros, J. Investigation of crack growth in functionally graded materials using digital image correlation. Eng. Fract. Mech. 2002, 14–16, 1695–1711. [Google Scholar] [CrossRef]
  7. Ramos, T.; Furtado, A.; Eslami, S.; Alves, S.; Rodrigues, H.; Arede, A.; Tavares, P.J.; Moreira, P. 2D and 3D Digital Image Correlation in Civil Engineering-Measurements in a Masonry Wall. In Proceedings of the 1st International Conference on Structural Integrity, Madeira, Portugal, 1–4 September 2015. [Google Scholar]
  8. Yoneyama, S.; Kitagawa, A.; Iwata, S.; Tani, K.; Kikuta, H. Bridge Deflection Measurement Using Digital Image Correlation. Exp. Tech. 2007, 34–40, 258–290. [Google Scholar] [CrossRef]
  9. Mikhail, E.; Bethel, J.; McGlone, J. Introduction to Modern Photogrammetry; John Wiley and Sons: Hoboken, NJ, USA, 2001. [Google Scholar]
  10. Pourkand, A.; Salas, C.; Regalado, J.; Bhakta, K.; Tufaro, R.; Mercer, D.; Grow, D. Objective Evaluation of Motor Skills for Orthopedic Residents Using a Motion Tracking Drill System: Outcomes of an ABOS Approved Surgical Skills Training Program. Iowa Orthop. J. 2016, 36, 13–19. [Google Scholar] [PubMed]
  11. Schmidt, T.; Tyson, J.; Revilock, D.M.; Padula, S.; Pereira, J.M.; Melis, M.; Lyle, K. Performance Verification of 3D Image Correlation Using Digital High-Speed Cameras. In Proceedings of the SEM Annual Conference & Exposition on Experimental and Applied Mechanics, Portland, OR, USA, 7–9 June 2005. [Google Scholar]
  12. Ghaychi Afrouz, S. Application of Close Range Photogrammetry (CRP) in Dynamic Displacement Measurement of Structures. Master’s Thesis, New Mexico Institute of Mining and Technology, Socorro, NM, USA, 2014. [Google Scholar]
  13. Ohnishi, Y.; Nishiyama, S.; Yano, T.; Matsuyama, H. A study of the application of digital photogrammetry to slope monitoring systems. Int. J. Rock Mech. Min. Sci. 2006, 43, 756–766. [Google Scholar] [CrossRef]
  14. Salvini, R.; Francioni, M.; Riccucci, S.; Bonciani, F. Photogrammetry and laser scanning for analyzing slope stability and rock fall runout along the Domodossola-Iselle railway, the Italian Alps. Geomorphology 2013, 185, 110–112. [Google Scholar] [CrossRef]
  15. David, W.; Take, W.; Bolton, M.; Munauchen, S. A deformation measuring system for geotechnical testing based on digital imaging, close range photogrammetry and PIV image analysis. In 15th International Conference on Soil Mechanics and Geotechnical Engineering; AA Balkema Publishers: Lisse, The Netherlands, 2001; pp. 539–542. [Google Scholar]
  16. Dunn, M.L. Recent developments in close range photogrammetry for mining and reclamation. In Proceedings of the America Society of Mining and Reclamation, Billings, MT, USA, 30 May–5 June 2009; pp. 390–399. [Google Scholar]
  17. Rezaei, S. Application of Close Range Photogrammetry to Monitor Displacements in Mines. Ph.D. Thesis, New Mexico Institute of Mining and Technology, Socorro, NM, USA, 2012. [Google Scholar]
  18. Lato, M.; Kemeny, J.; Harrap, R.M.; Bevan, G. Rock bench: Establishing a common repository and standards for assessing rock mass characteristics using LiDAR and photogrammetry. Comput. Geosci. 2013, 50, 106–114. [Google Scholar] [CrossRef]
  19. Carrivick, J.L.; Smith, M.W. Fluvial and aquatic applications of Structure from Motion photogrammetry and unmanned aerial vehicle/drone technology. Wiley Interdiscip. Rev. Water 2019, 6, 1328. [Google Scholar] [CrossRef]
  20. Lee, H.; Rhee, H. 3-D measurement of structural vibration using digital close-range photogrammetry. Sens. Actuators 2013, 196, 63–69. [Google Scholar] [CrossRef]
  21. Choi, H.; Cheung, J.; Kim, S.; Ahn, J. Structural Dynamic Displacement Vision System Using Digital Image Processing. NDT E Int. 2011, 44, 597–608. [Google Scholar] [CrossRef]
  22. Ozbek, M.; Rixen, D.; Erne, O.; Sanow, G. Feasibility of Monitoring Large Wind Turbines Using Photogrammetry. Energy 2010, 35, 4802–4811. [Google Scholar] [CrossRef]
  23. Lee, H.; Rhee, H.; Jae Hong, O.; Jin Ho, P. Measurement of 3-D Vibrational Motion by Dynamic Photogrammetry Using Least-Square Image Matching for Sub-Pixel Targeting to Improve Accuracy. Sensors 2016, 16, 359. [Google Scholar] [CrossRef] [PubMed]
  24. Baqersad, J.; Poozesh, P.; Niezrecki, C.; Avitabile, P. Photogrammetry and optical methods in structural dynamics—A review. Mech. Syst. Signal Process. 2017, 86, 17–34. [Google Scholar] [CrossRef]
  25. Kavzoglu, T.; Karsli, F. Calibration of a Digital Single Lens Reflex (SLR) Camera Using Artificial Neural Networks. Int. Arch. Photogramm. Remote Sens. Spat. Inf. Sci. 2008, 37, 27–32. [Google Scholar]
  26. PhotoModeler. The Manuals and Guides Help Files of Photomodeler; EOS Systems Inc.: Boston, MA, USA, 2013. [Google Scholar]
  27. Xu, W.; Liu, Z.; Nie, H. The Algorithm of Measuring in Close-Range Photogrammetry based on Grid. Trans Tech Publ. 2012, 759–759, 542–545. [Google Scholar]
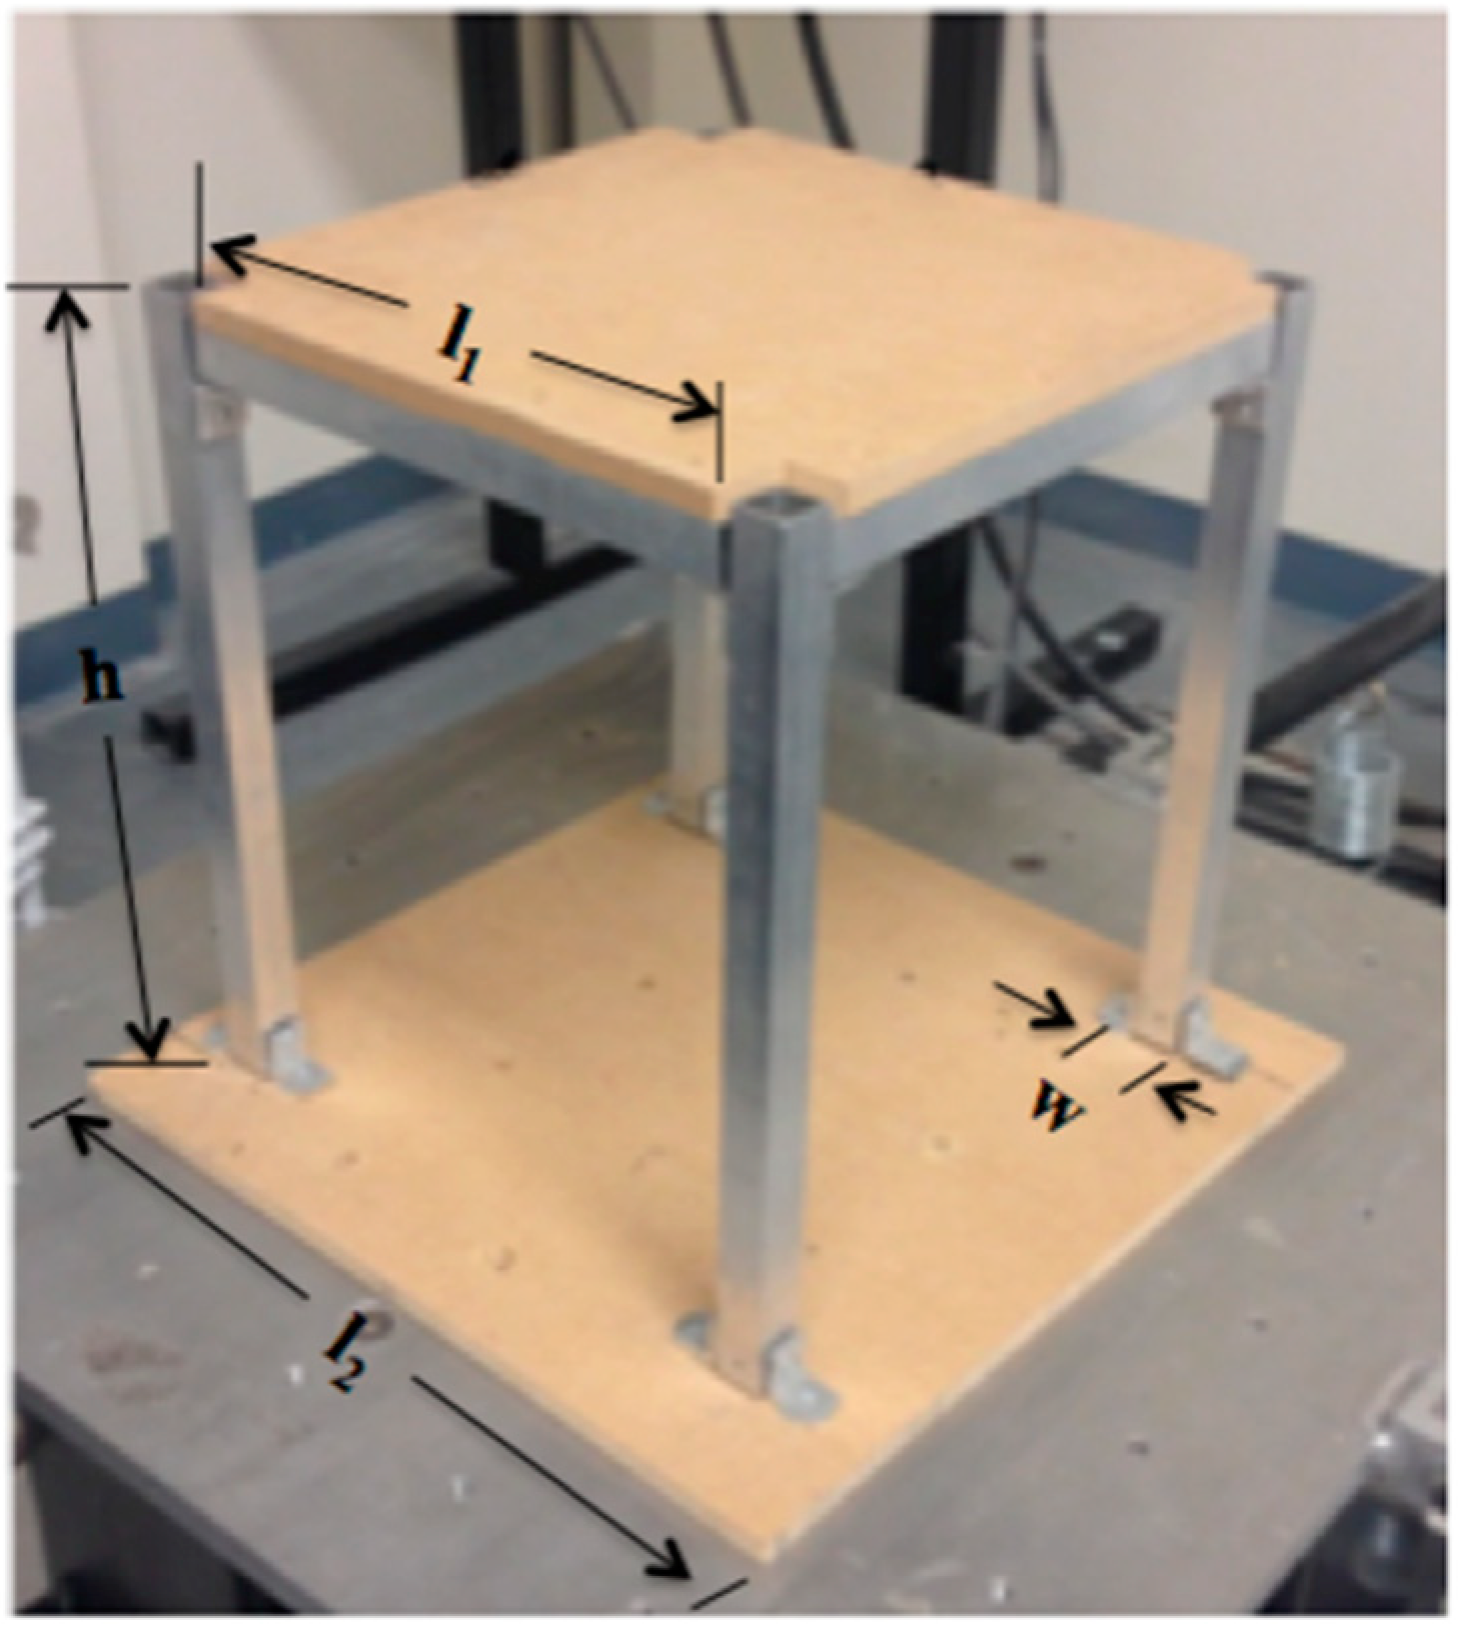
Figure 1. Schematic view of camera location relative to the aluminum test model on the shake table. Both cameras are at the equal distance of 1 meter from the shake table.
Buildings 09 00176 g001
Figure 2. Cameras setup with respect to the shake table including the global coordinate frame, which is defined manually using stationary targets. Y shows the loading direction.
Buildings 09 00176 g002
Figure 3. Location of stationary and dynamic coded targets in two synchronized pictures.
Buildings 09 00176 g003
Figure 4. 3D one-story frame on the shake table.
Buildings 09 00176 g004
Figure 5. Force-displacement curve for the frame.
Buildings 09 00176 g005
Figure 6. Comparison of CRP results and accelerometer’s measurement at top of the one-story structure due to the 1 Hz sinusoidal displacement with an amplitude of 2 cm at the base.
Buildings 09 00176 g006
Figure 7. Displacement of the frame measured by shake table along the loading direction (Y), the horizontal plane perpendicular to the y-direction (X), and the vertical direction (Z).
Buildings 09 00176 g007
Figure 8. Measured (CRP and accelerometer) and predicted (FEM results) displacements of the test model measurement at top of the one-story structure due to the 1 Hz sinusoidal displacement along the Y direction with an amplitude of 2 cm at the base.
Buildings 09 00176 g008
Table 1. Dimensions of the frame demonstrated in Figure 4.
DimensionLength (cm)
l129.85
l245.72
w2.54
h40.64

