Article

Damage Detection of Gantry Crane with a Moving Mass Using Artificial Neural Network

1
Faculty of Mechanical Engineering, University of Tabriz, Tabriz 5166616471, Iran
2
Faculty of Design, Tabriz Islamic Art University, Tabriz 5164736931, Iran
3
Faculty of Civil Engineering and Geosciences, Delft University of Technology, 2628 CN Delft, The Netherlands
*
Author to whom correspondence should be addressed.
Buildings 2024, 14(2), 458; https://doi.org/10.3390/buildings14020458
Submission received: 29 December 2023 / Revised: 1 February 2024 / Accepted: 4 February 2024 / Published: 7 February 2024
(This article belongs to the Special Issue Recent Developments in Structural Health Monitoring)

Abstract

:
Gantry cranes play a pivotal role in various industrial applications, and their reliable operation is paramount. While routine inspections are standard practice, certain defects, particularly in less accessible components, remain challenging to detect early. In this study, first a finite element model is presented, and the damage is introduced using random changes in the stiffness of different parts of the structure. Contrary to the assumption of inherent reliability, undetected defects in crucial structural elements can lead to catastrophic failures. Then, the vibration equations of healthy and damaged models are analyzed to find the displacement, velocity, and acceleration of the different crane parts. The learning vector quantization neural network is used to train and detect the defects. The output is the location of the damage and the damage severity. Noisy data are then used to evaluate the network performance robustness. This research also addresses the limitations of traditional inspection methods, providing early detection and classification of defects in gantry cranes. The study’s relevance lies in the need for a comprehensive and efficient damage detection method, especially for components not easily accessible during routine inspections.

1. Introduction

Gantry cranes play a pivotal role in various industrial applications, and their reliable operation is paramount. While routine inspections are common, certain defects, particularly in less accessible components, remain challenging to detect early. This research introduces a novel approach utilizing a learning vector quantization (LVQ) neural network for precise defect detection in gantry cranes. Contrary to the assumption of inherent reliability, undetected defects in crucial structural elements can lead to catastrophic failures. The current study is motivated by the need for an advanced defect detection method to enhance crane safety and reliability.
With the advances in the transportation industry, the mass, the size, and the crane structure strength have improved, but the crane structure stiffness has not improved as much. This means that the dynamic response of the crane is affected by the moving payload and changes as the trolley moves or with a change in payload and its speed, and it could cause bending, cracking, or failure at different regions of the crane structure. Another problem with the gantry crane is the inherent vibrations of a suspending payload. Using the moving load in the dynamics of cranes in engineering research has received special attention in recent years; but unfortunately, not many studies are available about the impact of the moving load on the modeling, dynamic simulation, and damage assessment of gantry cranes [1]. Gantry crane dynamics consist of structural and suspended-load dynamics. But analyzing the dynamic behavior of the crane has two main subjects: (1) how to model the structural dynamics and (2) how to model external loads [2,3,4,5]. The provided dynamical analysis presented foundational knowledge on crane dynamics; however, a comprehensive damage detection approach was not considered. An experimental modal analysis and finite element method (FEM) were used to identify the dynamic behavior of different structures [6,7,8,9]. The other subject in this field is minimizing payload swinging caused by the positioning process by utilizing different approaches, such as sliding mode control, adaptive tracking control, and error monitoring control [10,11,12,13,14,15]. Structural damage is always a possibility, and it is particularly prone to propagation because of numerous mechanical reasons. Long- and short-term damages eventually lead to the reduction of the design lifespan; therefore, timely damage assessment becomes an important aspect of the structure [16]. Various methods are proposed to identify, localize, and assess structural damages in an attempt to increase the feasibility of the monitoring process. These methods include vibration-based methods, finite element analysis, acoustic tests, ultrasonic tests, image processing, etc. [17,18,19]. These studies acknowledge the limitations of traditional methods; however, they do not specifically address the gantry crane defect detection problem. The propagation of the surface and subsurface cracks in different steel structures and their mechanism could be analyzed by parameter-based or signal-based methods [20,21]. A majority of the methods measure either regional or overall properties, but not both types of properties at the same time. The vibration method is one of the methods that can analyze local and general properties of large-scale complex structures. In this method, the vibrational response of the supervised structure is documented and analyzed to evaluate structural damages and assess the health of the structure [22,23]. The benefits of the vibration methods include simple tests and data analyses and real-time damage recognition. Vibration-based damage detection methods rely on the fact that structural damage affects the dynamic characteristics, such as frequency response function (FRF) and modal parameters [24,25]. There are also two other methods to detect structural damage: model-based and model-free techniques. Typically, model-based methods consist of an analytical model of the structure, and this model is used to analyze the structural behaviors and establish a correlation between the specific damage conditions and the dynamic characteristics changes, such as changes in mode shapes and natural frequencies [26,27,28]. Usually, the dynamic response of a healthy structure is established, and the differences between the response of the reference and a faulty sample are used as an indicator of a defect, and defect-recognition algorithms are utilized to determine its location and severity [29]. Among the defect-recognition methods, the neural network method is an important tool [30]. With neural networks, the measured FRFs of the healthy and faulty structures are used without relying on the modeling methods. A neural system is trained to distinguish the frequency responses of a healthy structure from a structure with damaged elements with different intensities and in different locations [31,32]. Therefore, a trained neural network can diagnose the position and intensity of each defect in every single faulty element [33]. In the context of structural damage detection methodologies, the combination of AR models and ANNs has been recognized as an effective tool for damage classification and estimation. Building on this foundation, we now turn our attention to the specific application of these techniques in the study of gantry cranes, aiming to address the vital aspect of structural damage detection in dynamically loaded crane systems. The combinations of autoregressive (AR) models and ANNs are efficient tools for damage classification and estimation and perform well using a small number of damage-sensitive features and limited sensors [34]. Support vector machine is a machine learning method based on statistical theory with good regression prediction ability for small sample data. This method has a good effect on the damage degree identification of crane girder model and has certain engineering application prospect [35]. The Generalized Network Autoregressive (GNAR) method was used to perform crane girder damage identification without the need for the data from the healthy structure [36]. The best feature of this model is that it can recognize damages without prior knowledge of the structure model. Unlike error detection through complicated structural model reconstruction, a trained network would recognize defect patterns that avoid using extensive calculations like large-scale finite element analysis [37]. Developing an efficient network is obviously the primary step in making a health monitoring system [25]. Some methods require modal data of healthy structures as a reference, while others do not. The use of modal curvature for damage detection is very well known. The method based on changes in modal curvature combined with Convolutional Neural Network (CNN) can be used for damage detection and localization [38].
Considering various types of cranes having a wide range of applications in different fields and the importance of their structural damage detection, in this study, the damage diagnosis of a gantry crane was performed, which is essential for ensuring their safety, reliability, and efficiency. The primary focus of the research is on specific aspects of the gantry crane’s behavior that can be adequately addressed within the scope of in-plane dynamics. In-plane dynamics are computationally less intensive compared to a full three-dimensional analysis and simulation of model in-plane, provide a simplified representation that is easier to analyze, and address the key research questions and objectives without introducing unnecessary complexity. Moreover, in-plane dynamics are more relevant to real-world scenarios and the practical applications of gantry cranes, and the existing literature and research have predominantly focused on in-plane dynamics for similar structures. After developing a simplified finite element mathematical model, the vibration equations for the intended structure were established, and the displacement, velocity, and acceleration of different points of the structure were determined by coding and solving the aforementioned equations under MATLAB. Moreover, the finite element model (FEM) and the dynamic response of a defected structure in different conditions were acquired by putting defects with three different severities, i.e., low, medium, and high, in four different points in the structure by random changes in the stiffness of different elements of the crane structure, which fills the gap existing in the literature. This study introduces a novel approach to address the limitations of current inspection methods. By employing the LVQ neural network, the study aims to achieve precise defect detection in gantry cranes, especially in components not easily accessible during routine inspections. This paper also evaluates the performance of the neural network under more realistic conditions by introducing noise to the data. This assessment demonstrates the network’s ability to handle noisy data and accurately detect defects in a real-world environment. The noisy inputs with Gaussian white noise of different percentages were used to increase the result’s certainty. In summary, the contribution of this paper lies in its application of advanced modeling techniques and artificial neural networks to address the significant issue of structural damage detection in gantry cranes, with a focus on both accuracy and real-world applicability. This research serves as a valuable step toward improving the safety and performance of gantry crane systems in various industries.

2. Gantry Crane Modeling
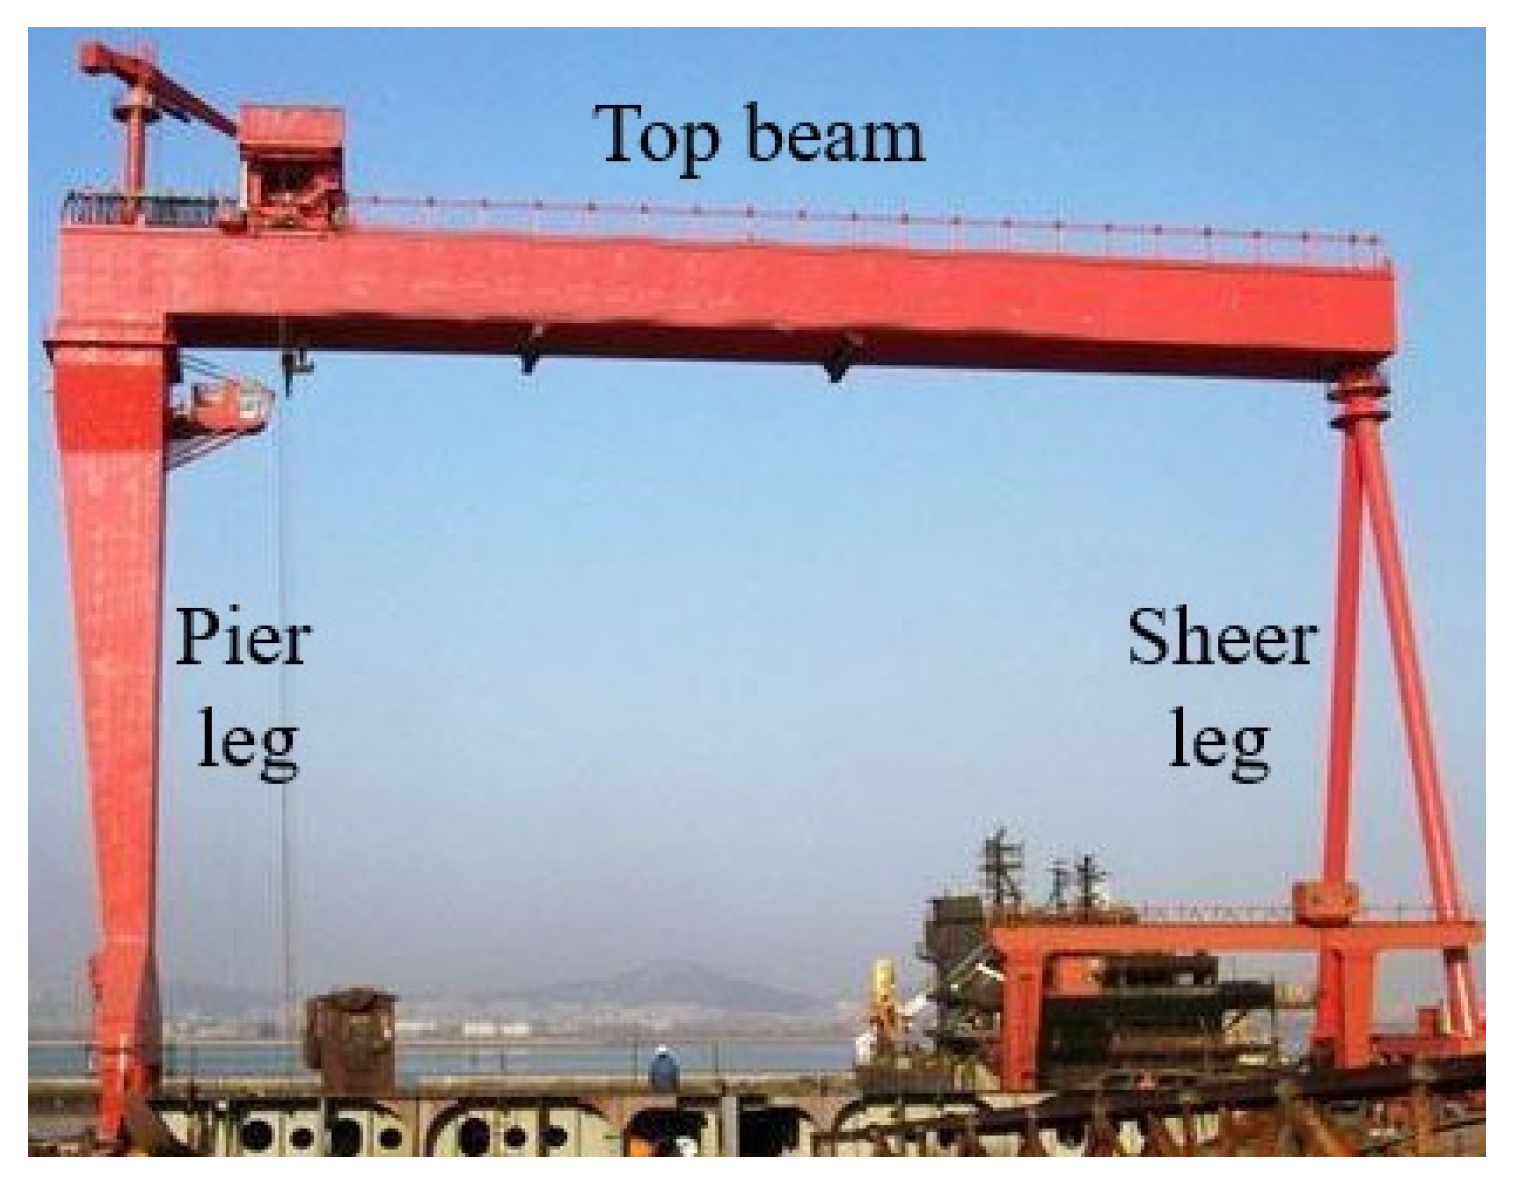
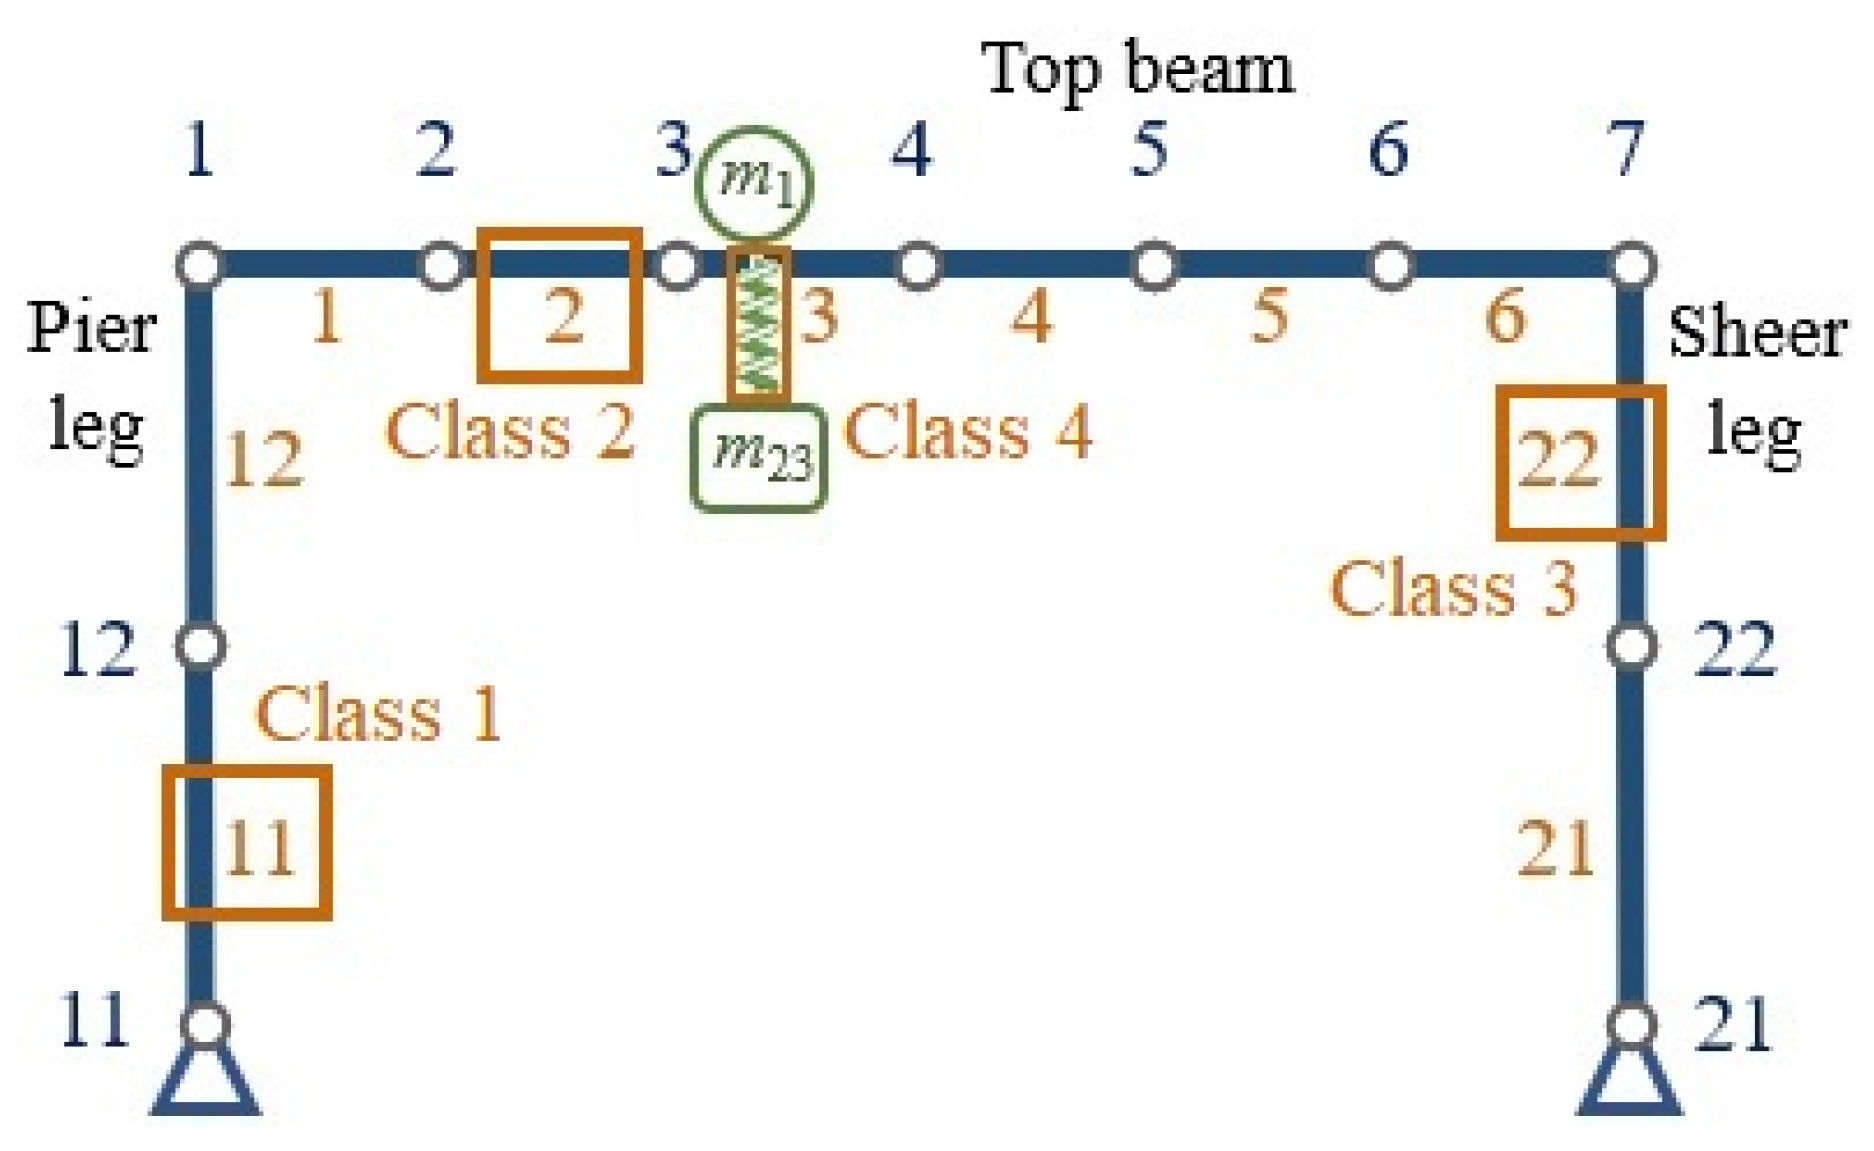
2.1. Gantry Crane

Nowadays, there is a huge tendency toward the performance improvement of machines and mechanical systems, including heavy vehicles used for transporting heavy and big loads, as the lifespan of these systems could be improved by timely repairs. The gantry crane is an example of these systems and equipment, and it is utilized extensively throughout almost the whole world. Gantry cranes are also large and complex structures that are used to move very heavy loads, and this provides a damaging environment for cranes. Gantry cranes usually consist of a pair of supporting foundations that connect a payload to the trolley through a cable. The trolley moves left and right along a vertical rail until it reaches its destination. Therefore, the problem in this study is a gantry crane on which a mass is moving (Figure 1).

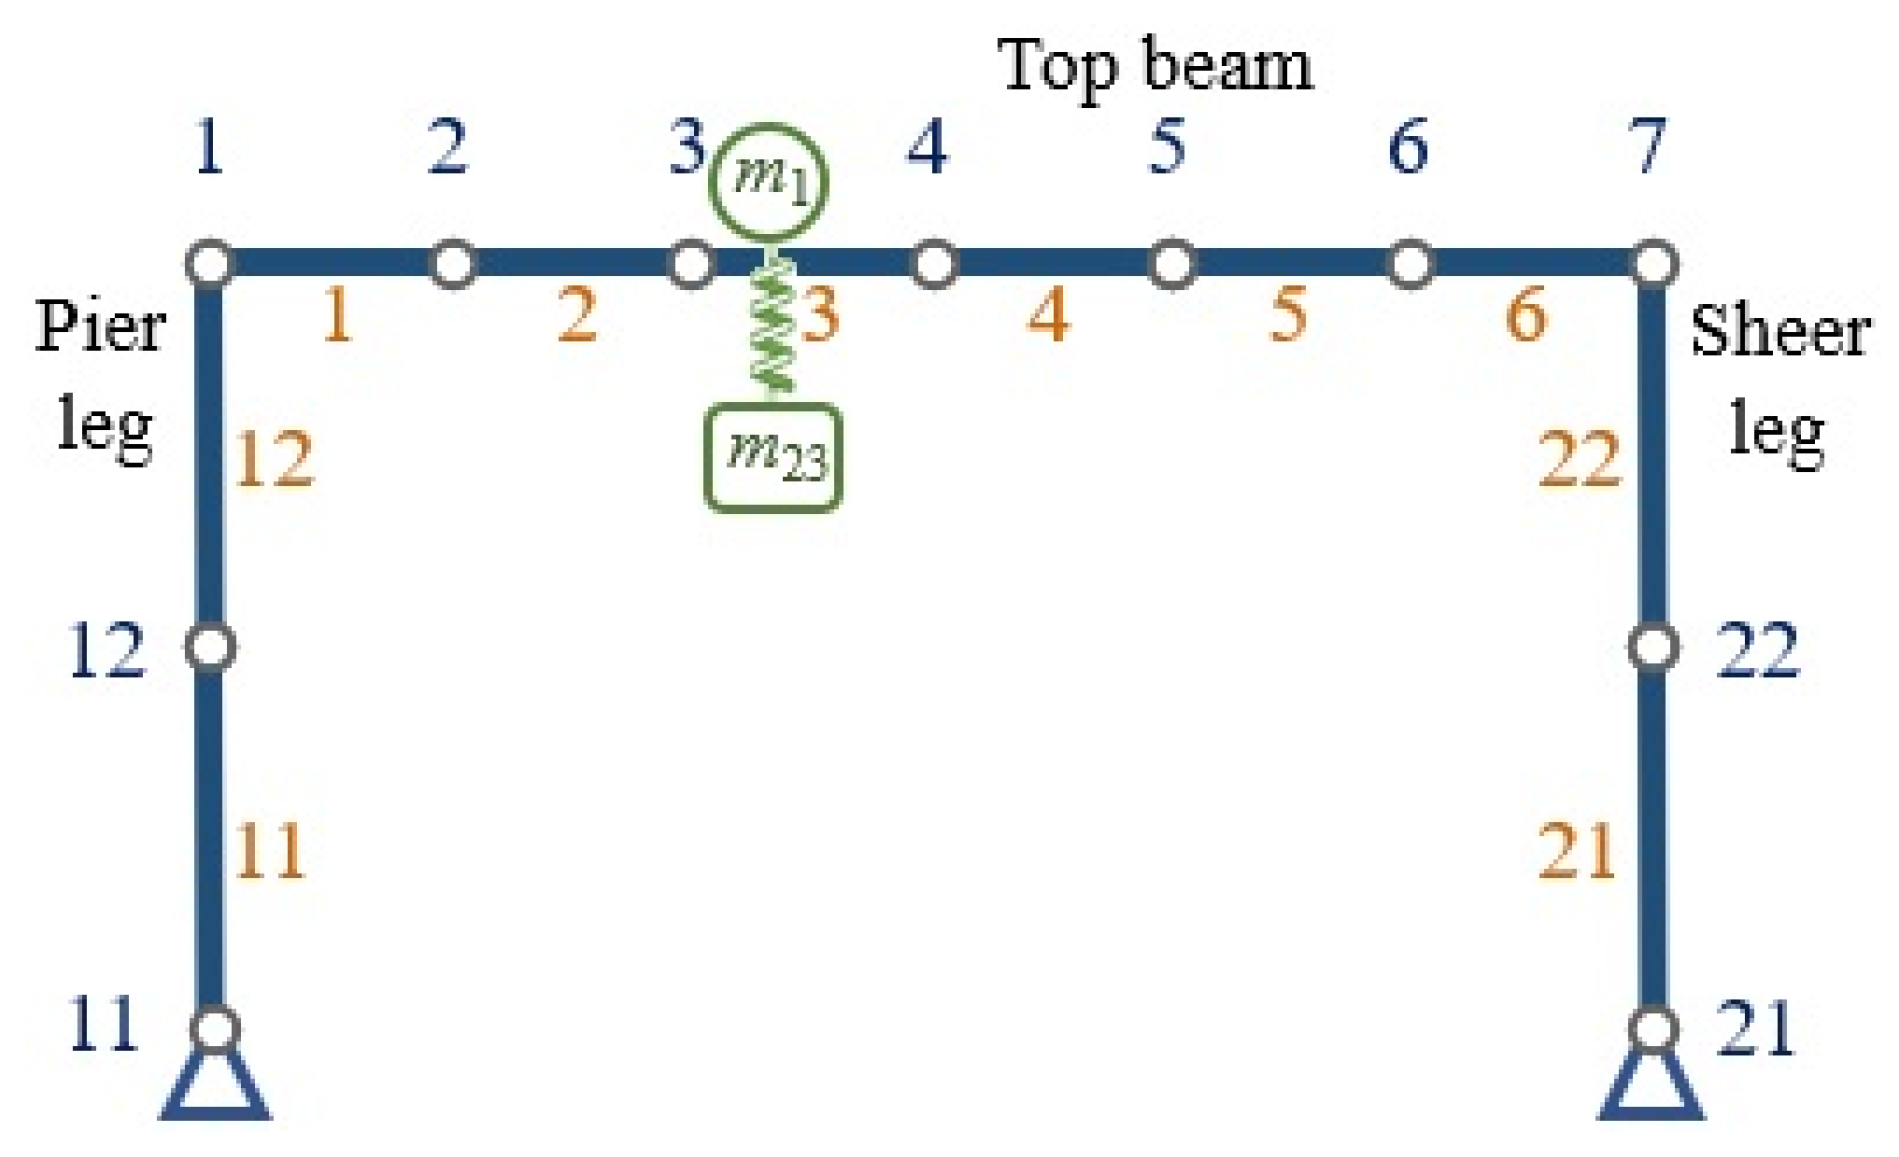
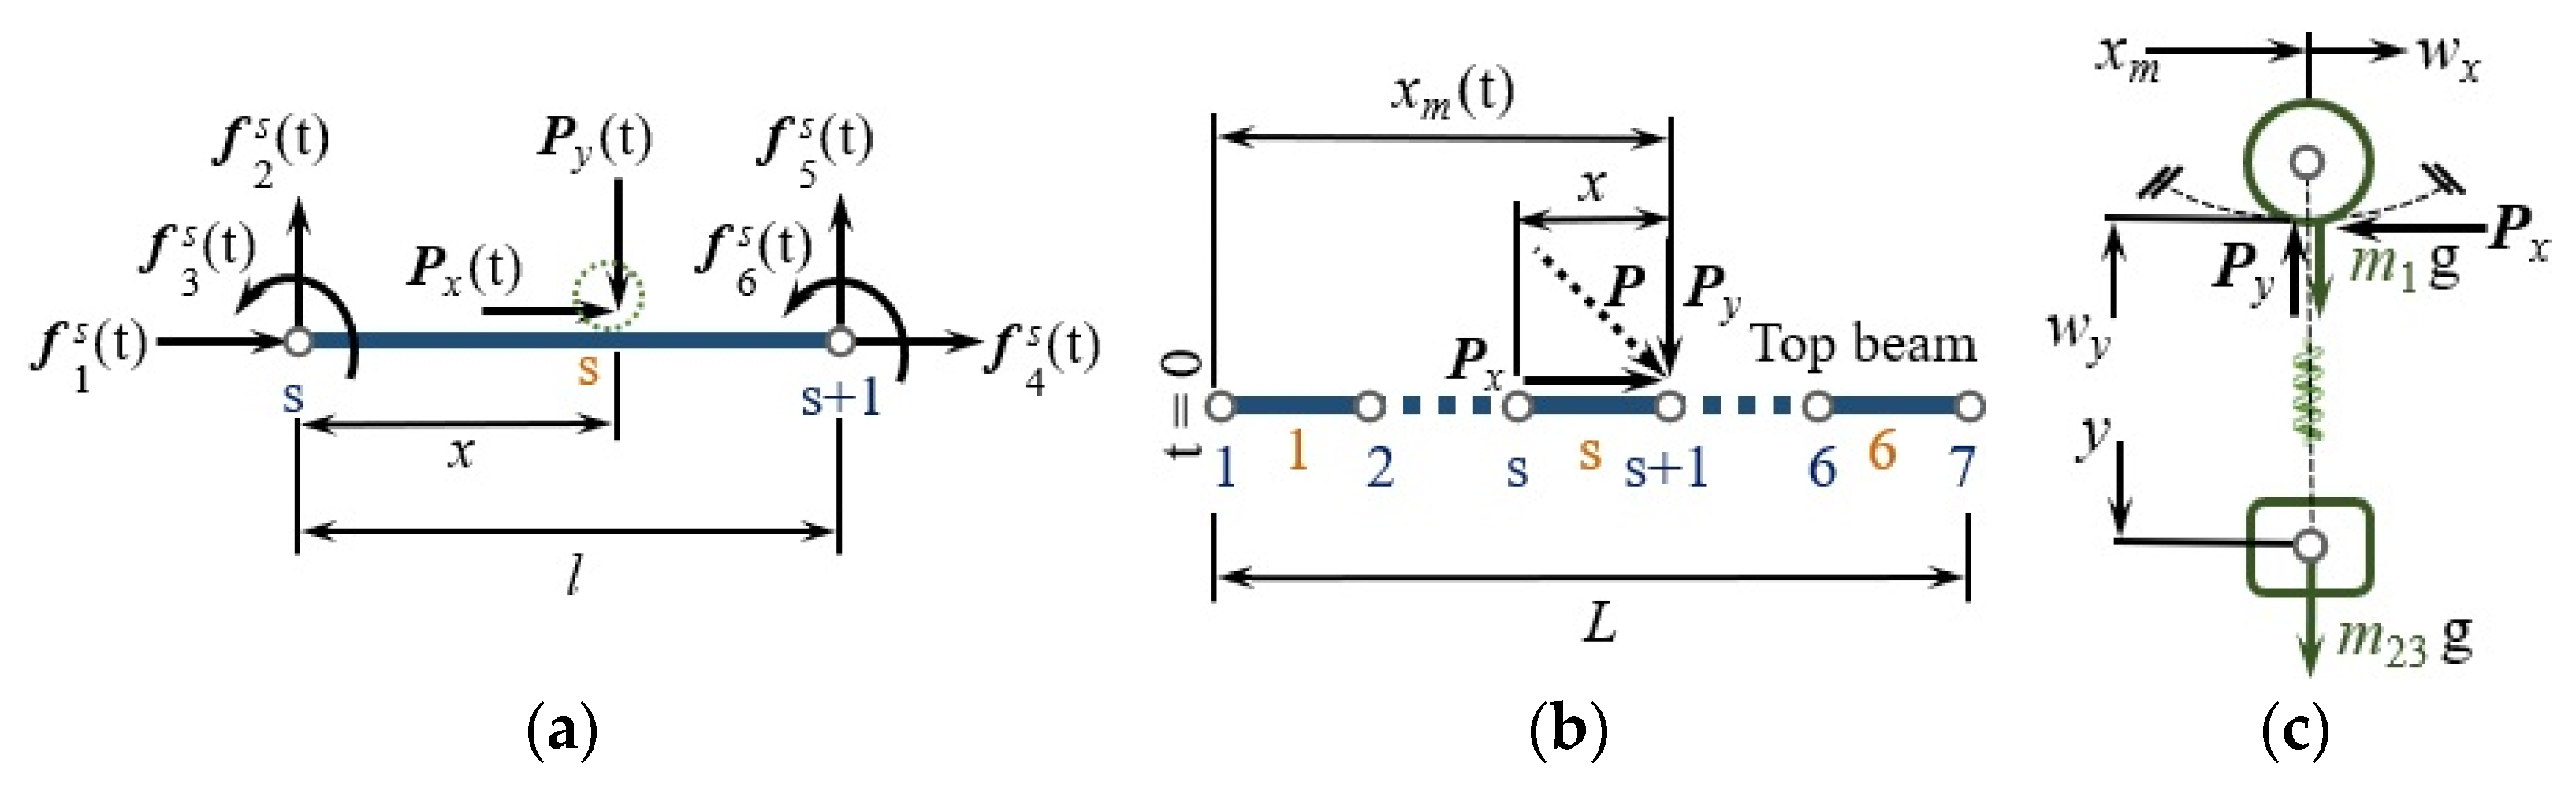
2.2. Gantry Crane Dynamic Model

The in-plane finite element and vibration analysis of the gantry crane was studied in [1]. Here, a similar FEM with some simplifications and alterations is addressed. A brief presentation of the mathematical modeling of the gantry crane, which was developed in [1], is also addressed. This model was utilized to acquire the results required for initiating the damage detection process. The obtained results are compared to the results obtained in [1] and validated.
The gantry crane system in Figure 2 is assumed to be an in-plane two-dimensional system and consists of three beams connected to each other. The beam on the left is considered to be a sheer leg with a height of H, the horizontal beam is a top beam with a length of L, and the right beam is a pier leg with a height of h. Table 1 lists the geometrical and dynamic characteristics of the test gantry crane.
Figure 2 shows the structure’s characteristics when each of the three beams is meshed and coupled together. The structure is divided into ten elements, of which the pier leg has two, the sheer leg has two, and the top beam has six. Therefore, the structure consists of 11 nodes in total. The load on the horizontal beam is the moving mass on the crane that has a suspended payload, and it is considered to be a mass and spring system that has one degree of freedom in mashing (Figure 2).
The vector of forces acting on nodes of each element of the crane system with a moving mass is depicted in Figure 3.
Each node in the mentioned structure has three degrees of freedom. Therefore, each element has six degrees of freedom, which leads to a six-by-six mass and stiffness matrix for each element. Considering s as the element number, the vector of forces acting on nodes of each element of the crane system, f s t , can be obtained as follows:
f s t = f 1 s t f 2 s t f 3 s t f 4 s t f 5 s t f 6 s t T
Considering the free-body diagram in Figure 3a, the forces acting on nodes can also be obtained as follows:
f 1 s = N 1 x P x t f 2 s = N 2 x P y t f 3 s = N 3 x P y t f 4 s = N 4 x P x t f 5 s = N 5 x P y t f 6 s = N 6 x P y t
where x is the distance from where the force is applied. Considering l as the length of each element, and the relative length as ξ = x l , the equation of state can be written as follows:
N 1 = 1 ξ N 2 = 1 3   ξ 2 N 3 = l ξ 2 ξ 2 + ξ 3 N 4 = ξ N 5 = 3   ξ 2 2   ξ 3 N 6 = l ξ 2 + ξ 3
The element number that the force caused by the moving mass act upon at each time can be calculated as:
s = x m t l + 1
where s is the element number, and xm (t) is the moving mass position in time, t. The mass that is moving on the crane moves at the initial time, t = 0, and reaches the position xm (t) in t seconds, following a trapezoidal velocity profile with constant acceleration at the beginning and constant deceleration at the end of the top length.
The vector of the general external force acting on the structure can be represented as follows:
P t = 0     0     0 f 1 s t     f 2 s t     f 3 s t     f 4 s t     f 5 s t     f 6 s t 0     0
Considering Equations (1)–(3), which represent the forces acting on the nodes, the vector of the external forces acting on the structure, P(t), can be expressed as follows:
P t = N x T P x N y T P y
where N x = N 1   0   0   N 4   0   0   a n d   N y = 0   N 2   N 3   0   N 5   N 6 .
Considering Mst, Cst, and Kst as mass, damping, and stiffness matrices, respectively; and q = U y T , q ˙ , and q ¨ , respectively, as the overall displacement, velocity, and acceleration vectors, U represents the displacement vector, and y represents the vertical displacement of a particular point or element. Thus, the vibration equation can be written as follows:
M s t q ¨ + C s t q ˙ + K s t q = P t
The overall mass and stiffness matrices are obtained from the FEM and coupling of the elements, and the damping matrix are assumed to be proportional to the mass and stiffness matrices (Rayleigh damping theory: C s t = α M s t + β K s t ).
According to Figure 3c, the internal forces between the structure and the moving mass can be represented as follows:
P x = m 1 + m 23 x ¨ m m 1 + m 23 w ¨ x
P y = m 1 + m 23 g m 1 w ¨ y m 23 y ¨
where w x = w x x   t and w y = w y x   t are, respectively, the horizontal and vertical displacements at each position of the FEM, which can be obtained in a matrix form as w x = N x U and w y = N y U . Therefore, the second time derivatives of w x and w y can, respectively, be obtained as follows:
w ¨ x N x U ¨  
w ¨ y = N y U x ˙ 2 + N y U x ¨ + 2 N y U ˙ x ˙ + N y U ¨
where the symbols with (′) and (″) are, respectively, the first-and second-order derivatives with respect to x; and x ˙ and x ¨ are the velocity and acceleration of the moving mass, respectively.
Considering the free body diagram of the moving mass in Figure 3c, its motion equation can be obtained via Newton’s second law:
m 23 y ¨ + k y + w y = 0
Finally, the overall motion equation of the structure is expressed as follows:
M s t + M 1 m 23 N y T 0 m 23 U ¨ y ¨ + C s t + C 1 0 0 0 U ˙ y ˙ + K s t + K 1 0 k N y k U y = N y T m s s g N x T m s s x ¨ m 0
where m s s is the overall mass of the moving system on the crane, and
M 1 = m 1 N y T N y + m s s N x T N x C 1 = 2 m 1 x ˙ N y T N y K 1 = m 1 x ˙ 2 N y T N y + m 1 x ¨ N y T N y

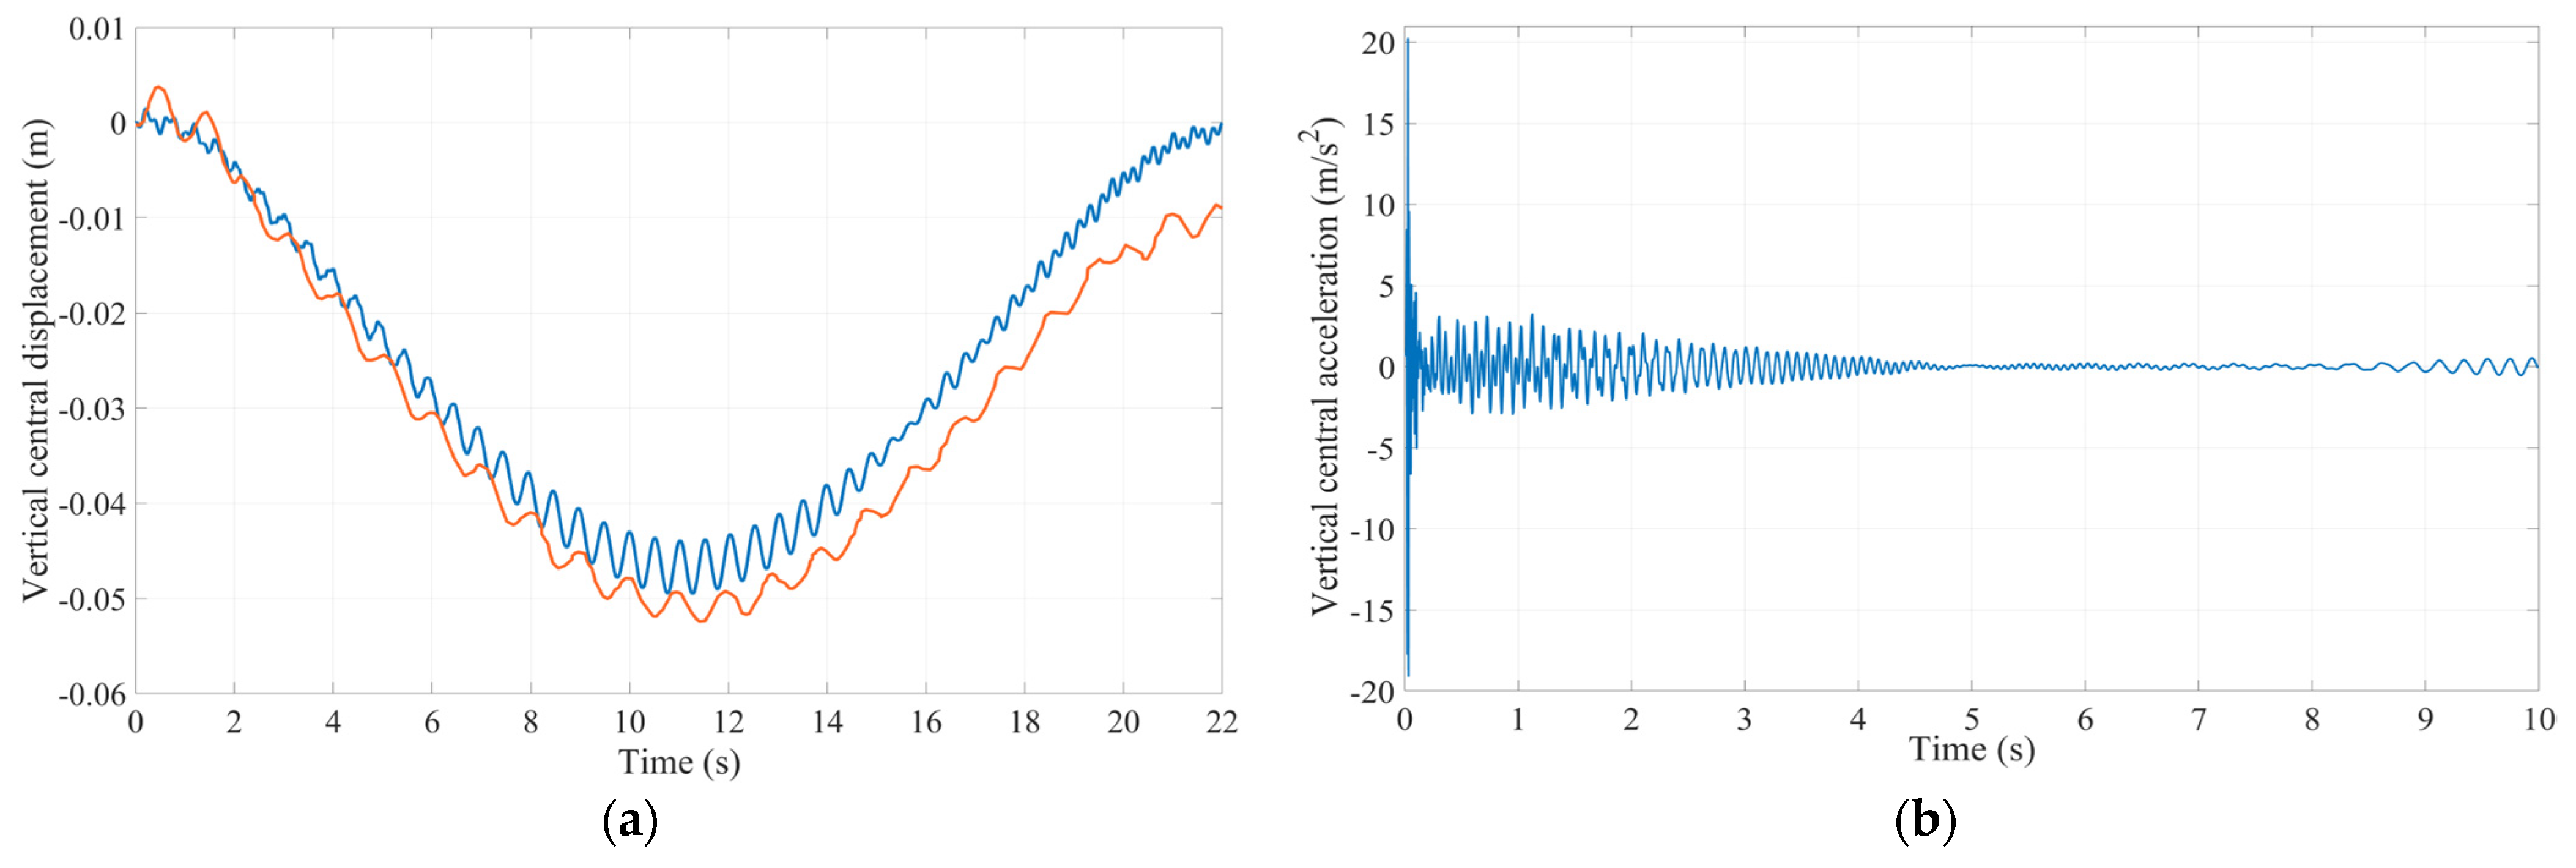
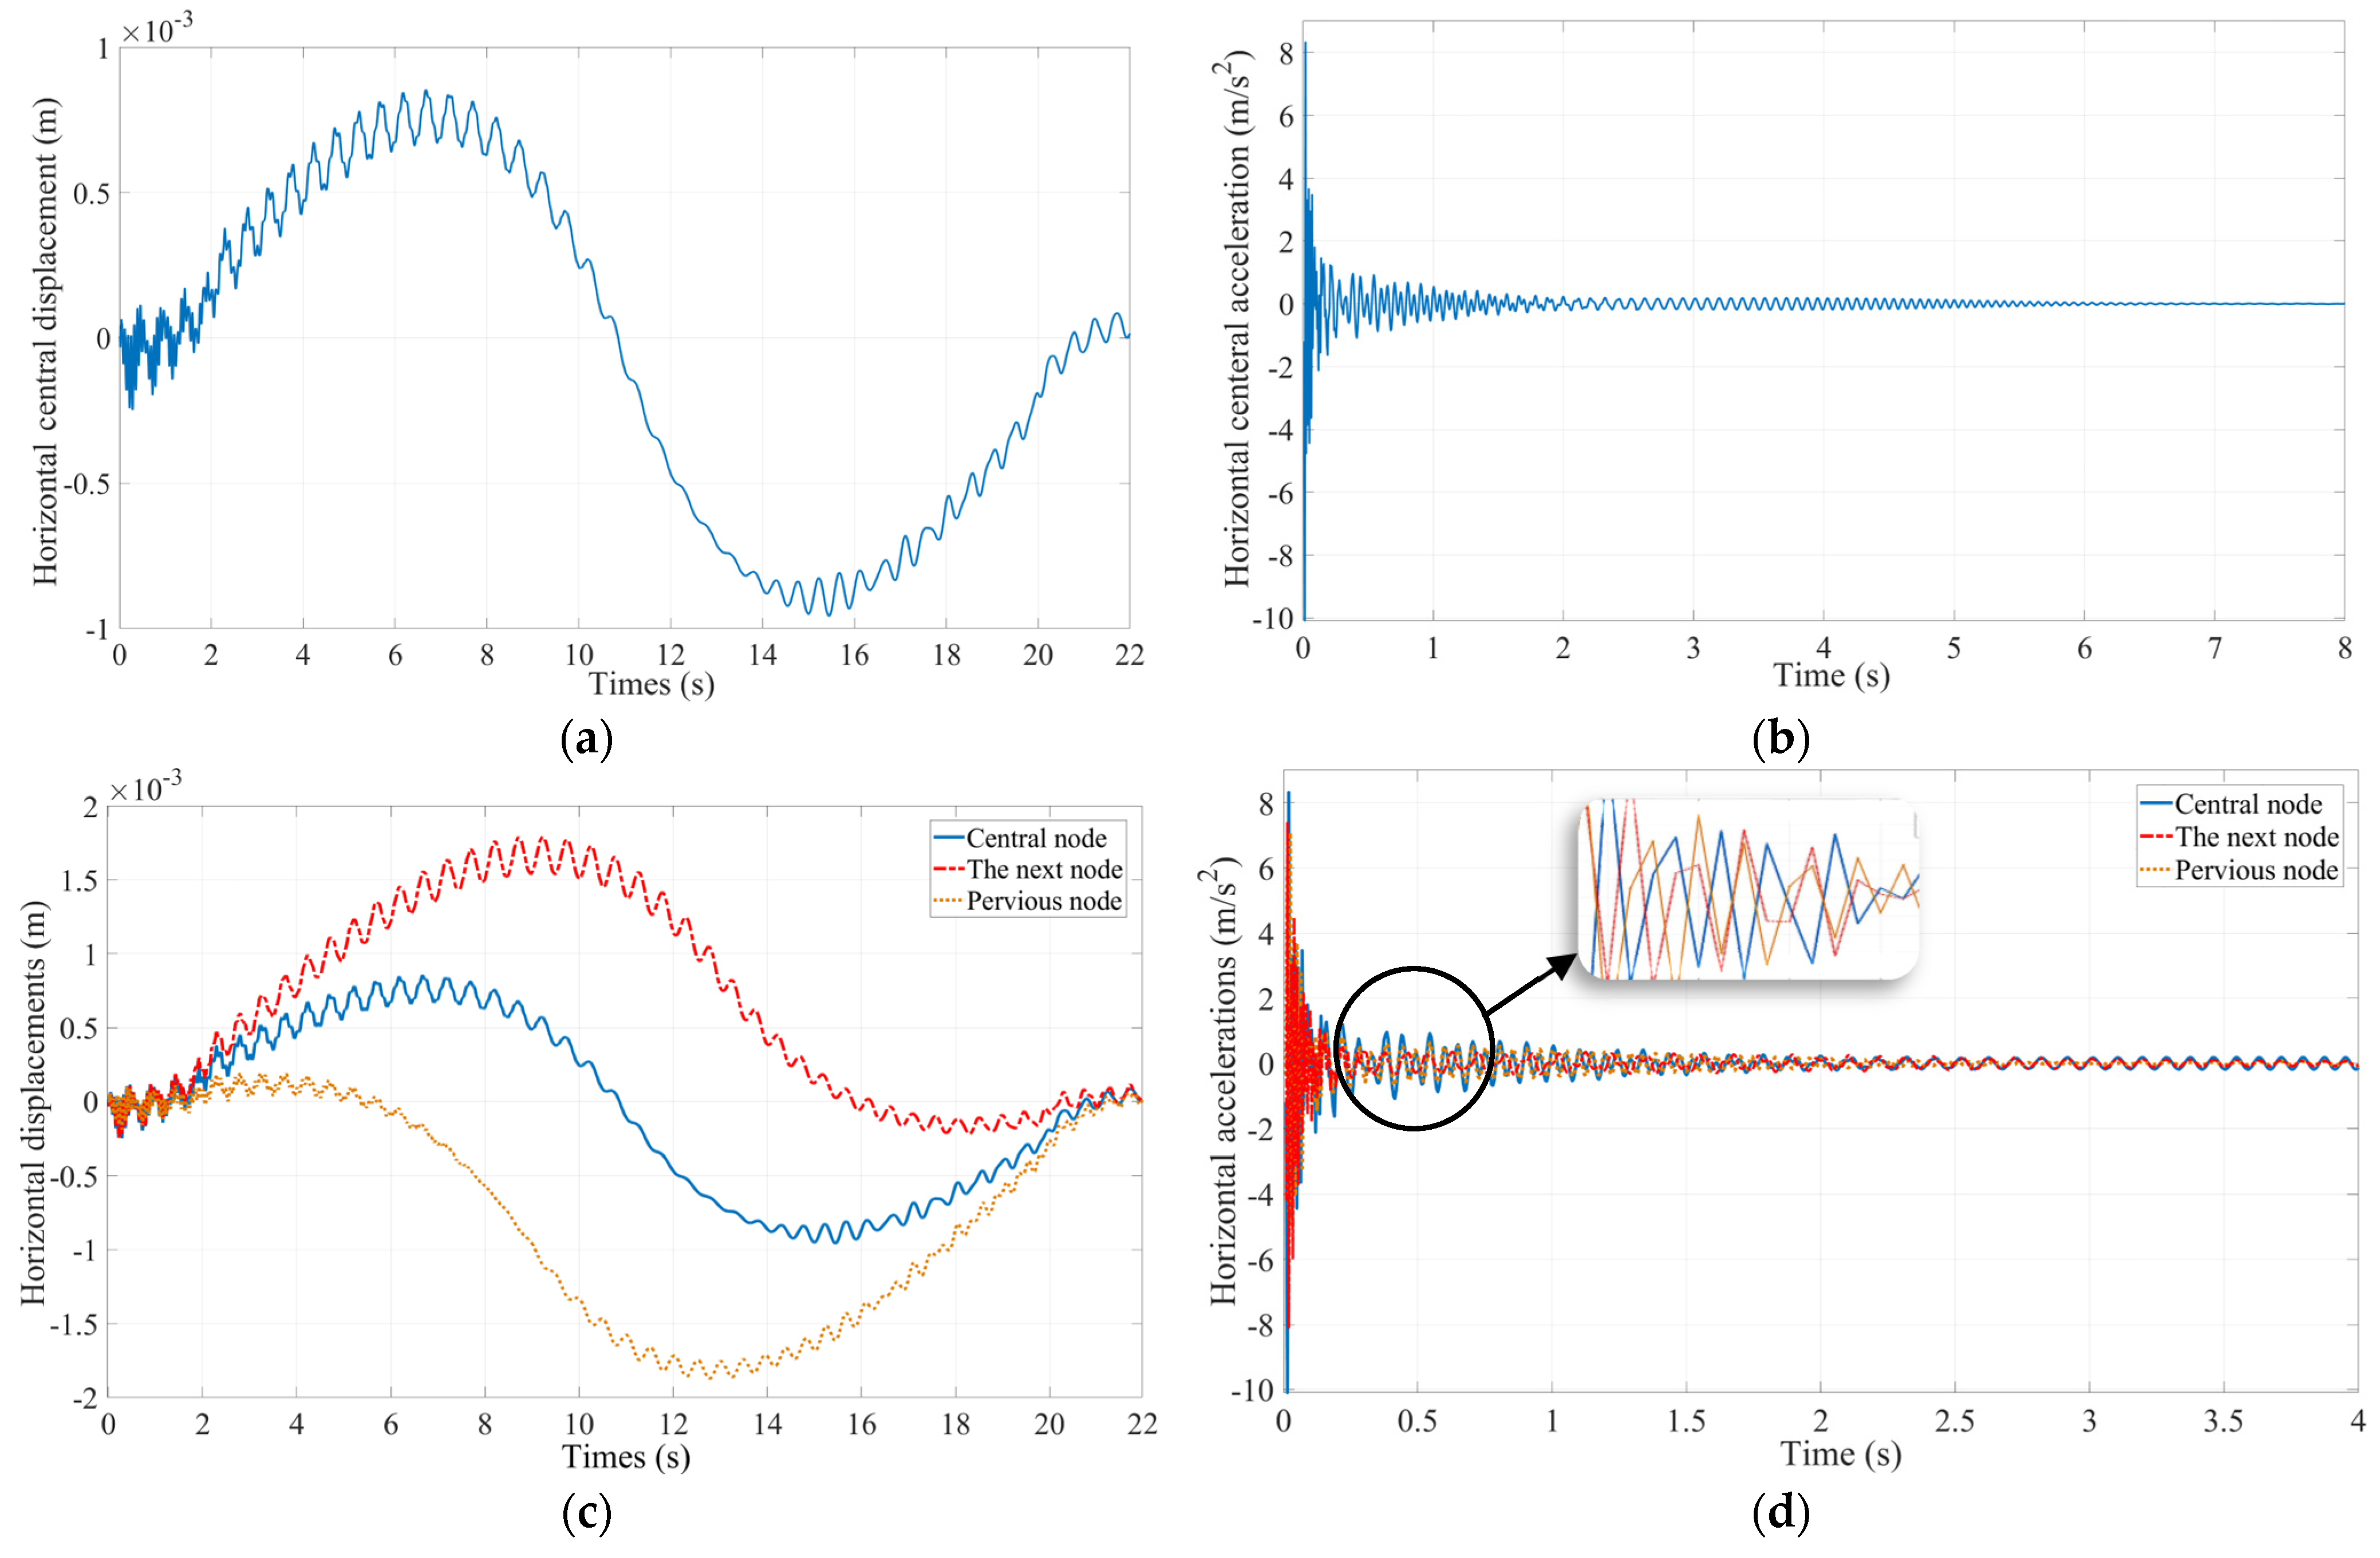
2.3. Model Evaluation

To solve Equation (13), which identifies the crane’s dynamic behavior, MATLAB R2022b programming was utilized. The differential equations were solved using MATLAB’s ODE45 routine, which uses the adaptive step-size 4th- and 5th-order Runge–Kutta formulas. The test structure is made out of steel, and the crane characteristics, velocity pattern, time, and intervals are considered as inputs of the code, according to Reference [1]. The overall time of the test is assumed to be 22 seconds, and each time interval is 0.005 s. The velocity pattern for the mass on the crane is presented in Appendix A.
The simulation results are illustrated in Figure 4 and Figure 5 as the displacement–time and acceleration–time graphs of the top beam.
The beam vertical displacement–time graph obtained from the developed model in this study was also compared to the results obtained in [1] (Figure 4a). The minimum displacement value in [1] is −0.052, yet the same value, −0.049, is obtained by the developed model in this study. The mean square error of the two diagrams is 0.0027%. Therefore, the results are sufficiently validated. The differences in the two graphs could be due to simplifications. These simplifications consist of the number and the shape of the elements of the left element (the pier leg), as well as the number of top beam elements. Specifically, the number of elements decreased from 10 to 7, and in [1], the cross-sectional area of element 12 was greater than that of element 11, but in this research, both elements have the same cross-sectional area. Figure 4b shows the acceleration–time graph of the central point of the top beam. As the moving mass moves on the beam, the beam starts to vibrate, and then its vibrations are damped and finally reach zero. Figure 5a shows the horizontal displacement–time graph for the top beam. As can be seen from Figure 5a, the center of the beam has a symmetrical amplitude. In Figure 5c, the comparison between the nodes before and after the central node shows that the node before has a negative amplitude, and the node after the central node has a positive amplitude. The displacement of all three nodes has finally reached zero, and because of the horizontal displacements of the beam, the amplitudes are very small and close to zero. Figure 5b,d are the same as Figure 4b, with the difference that these two graphs are damped earlier due to horizontal vibrations. By modeling the dynamic behavior of the crane structure, it is possible to perform the defect detection process on the structure, as the main goal of this study is, in fact, to detect the defects of the system and design a network to distinguish the existing damage in the desired structure.

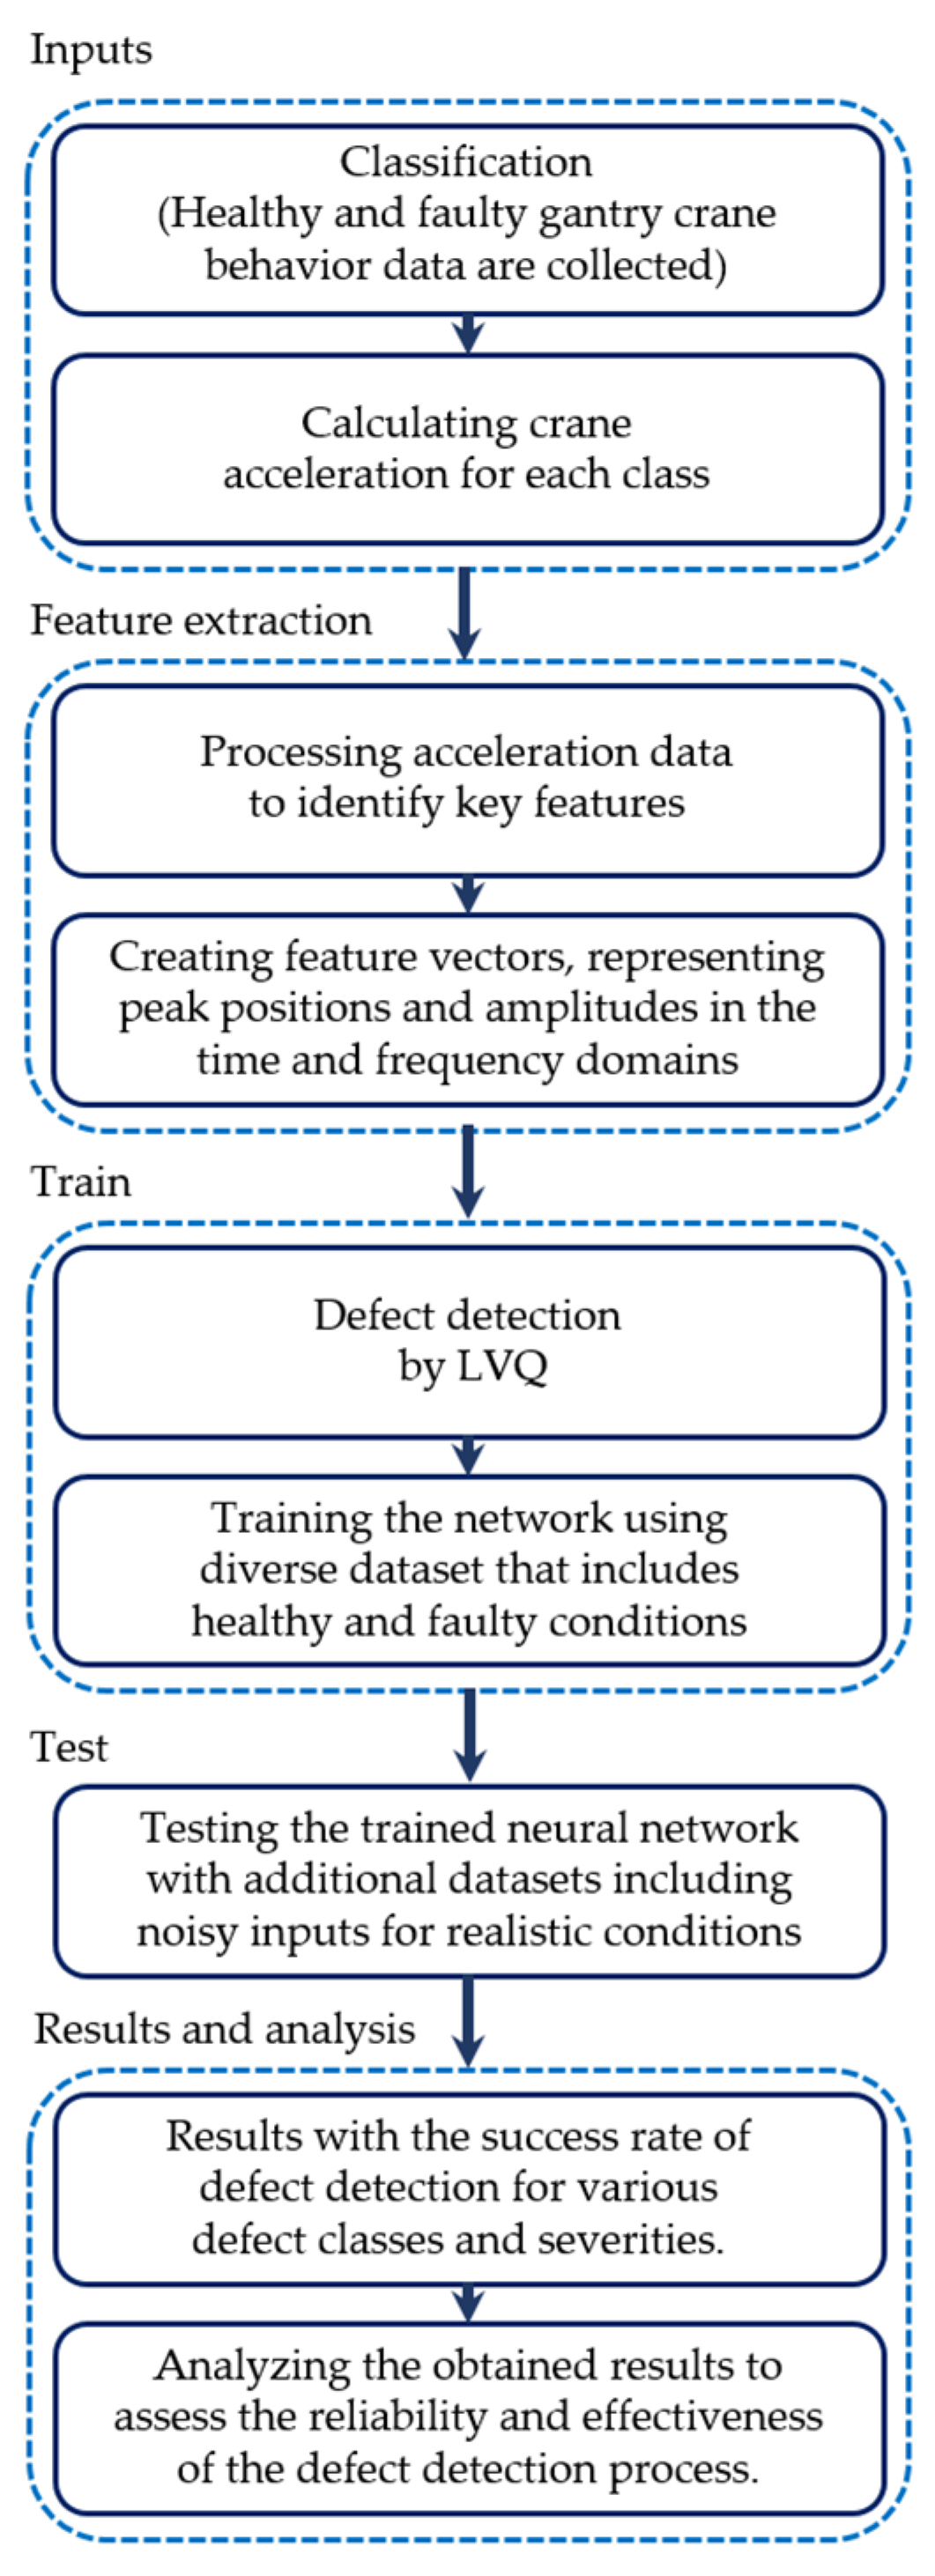
3. Defect Detection Process

In Figure 6, a framework graph is presented to illustrate the defect detection process. The graph visually outlines the key stages of the process, starting from data collection and feature extraction to the training and testing of the LVQ neural network. The last stage highlights the network’s ability to identify defect locations and severities.
This framework provides a clear understanding of the systematic approach employed in the defect detection and can also be explained in detail as follows:

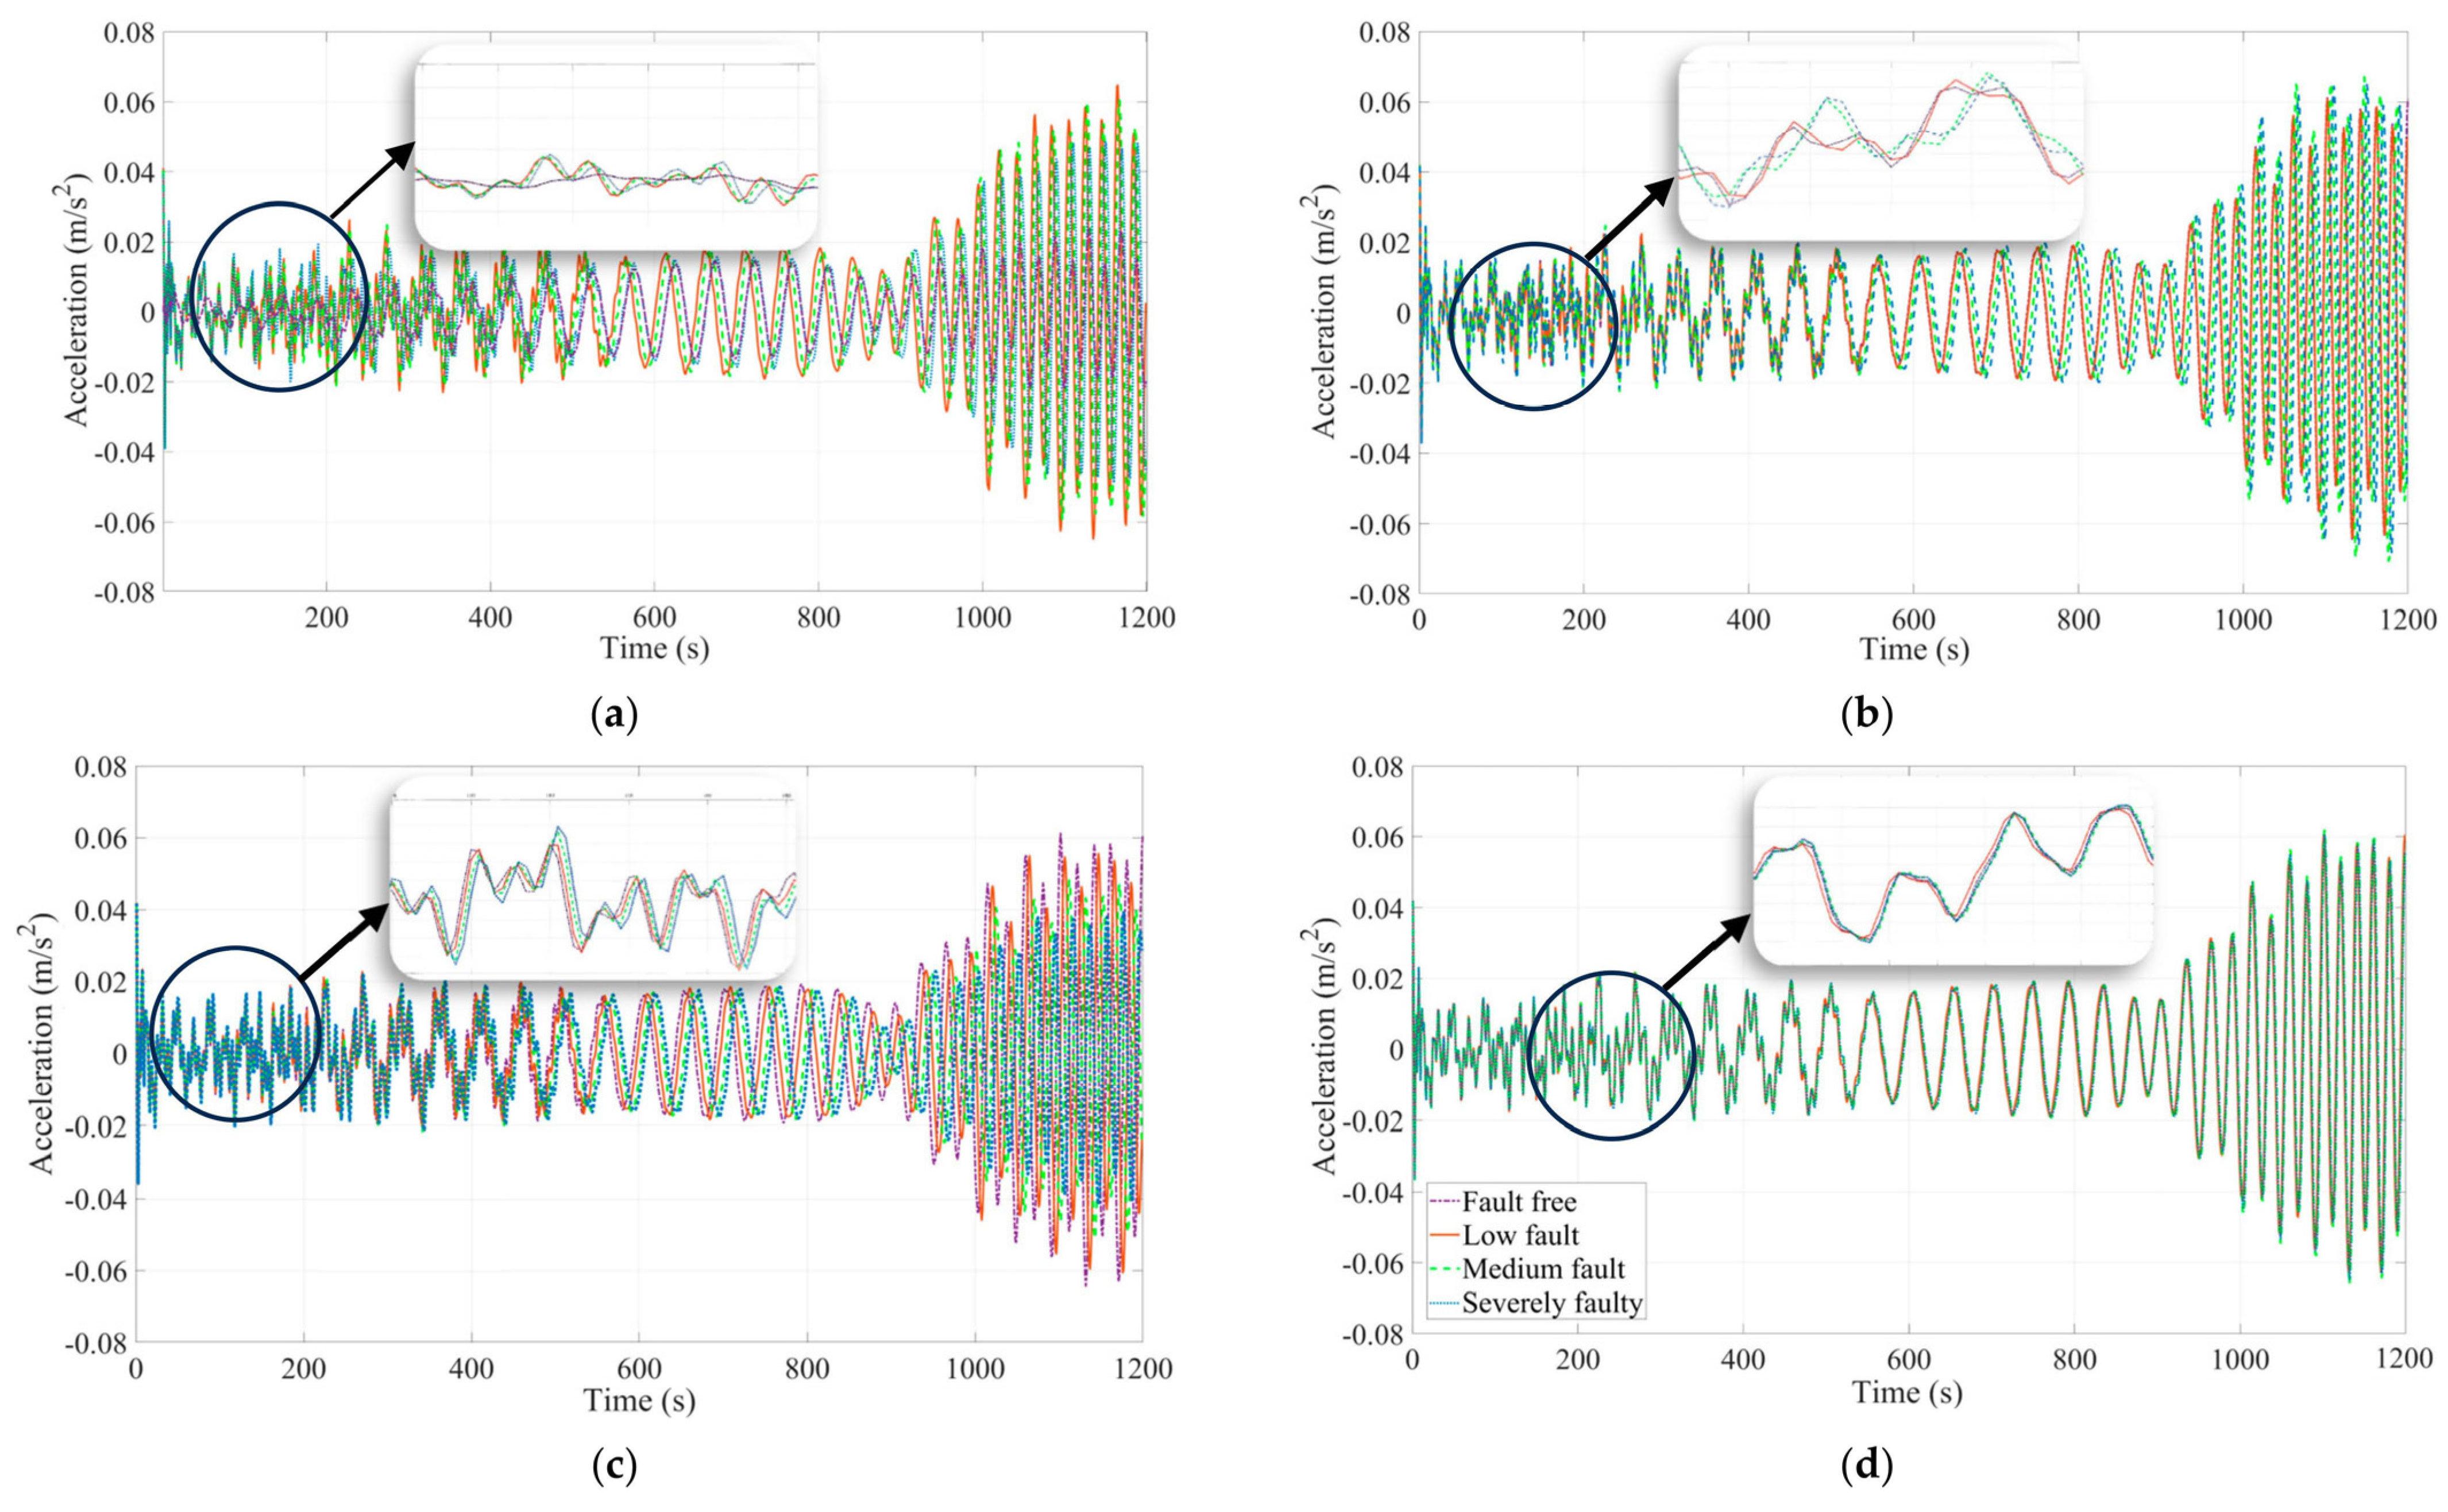
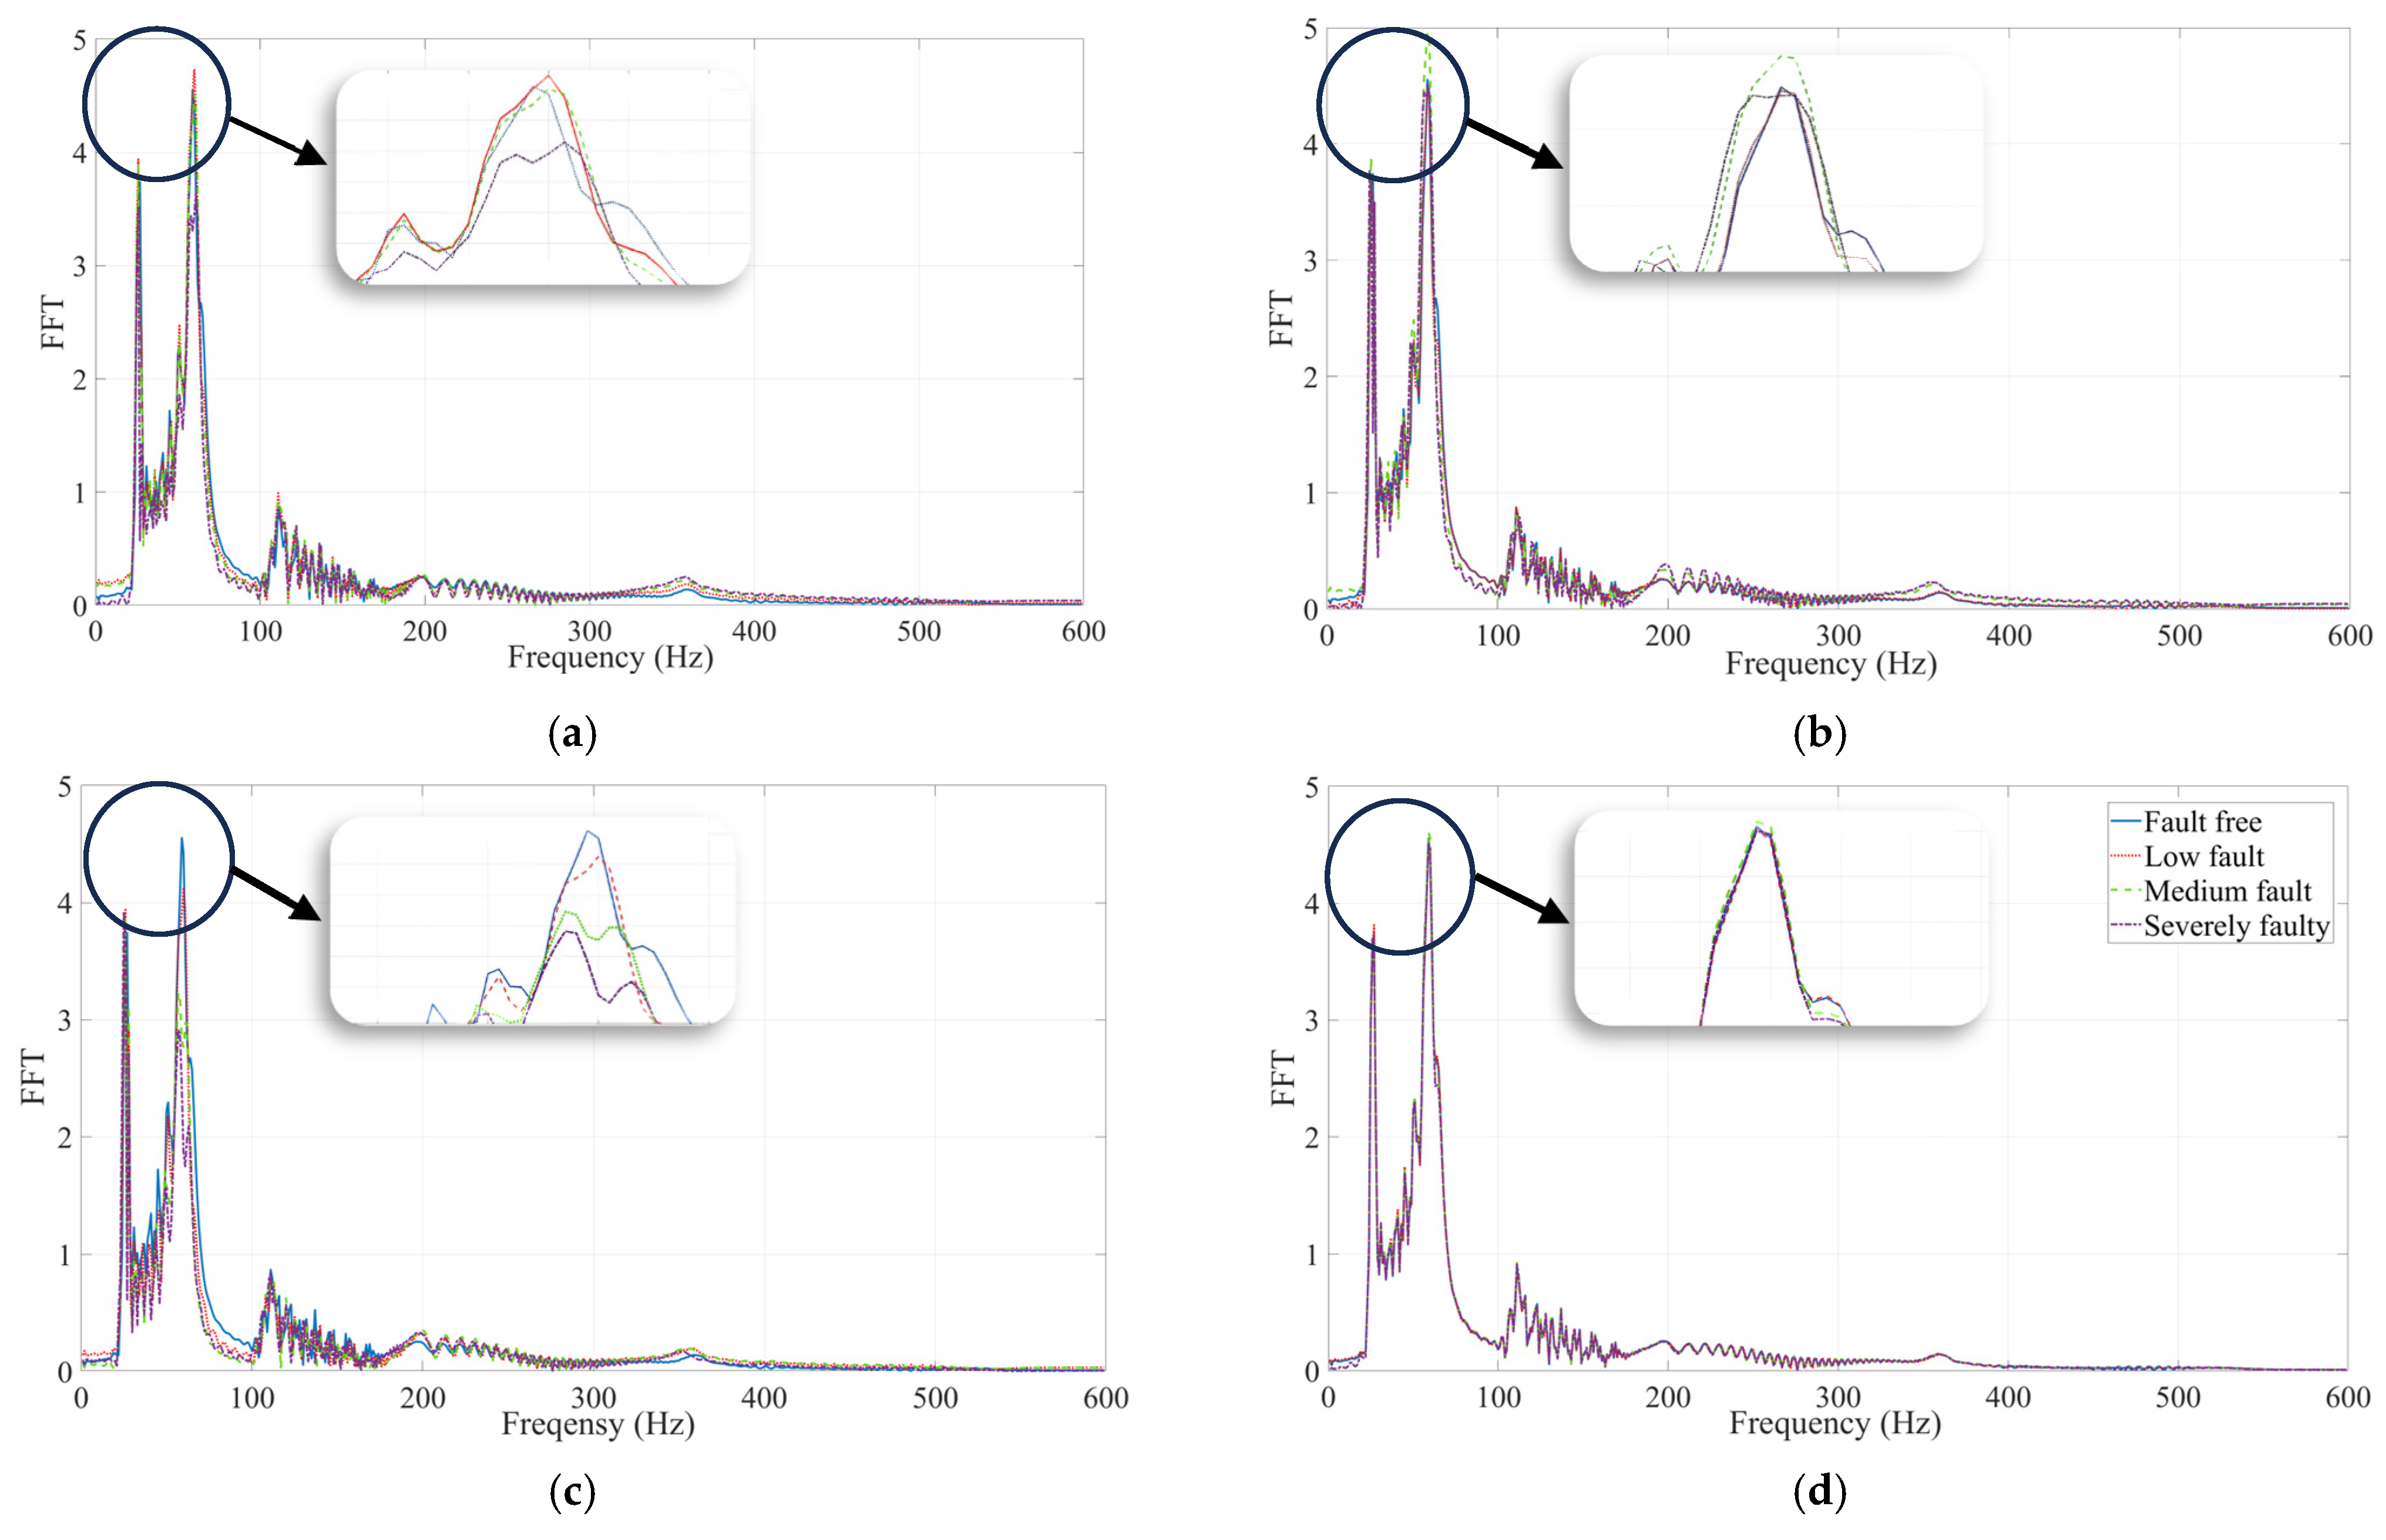
3.1. Making Defects in the System

The stiffness matrices could be used to cause defects in the mentioned structure. In fact, the desired defects are made by changing the values of the stiffness matrices of each element. The response of the system could be acquired and compared to the fault-free conditions after making the appropriate adjustments and solving and simulating the problem multiple times.

3.2. System Classification

The number of categorized classes of the system must be determined before causing a defect. The defects are categorized into four different classes in this study. Considering Figure 6, the first class of defects is caused in element number 11 of the pier leg, the second class consists of defects in elements 1 and 2 of the top beam, the third class consists of faults in element 22 of sheer leg and finally, and the fourth class consists of defects in the spring connected to the moving mass on the crane. The location of the classes is specified precisely in Figure 7.
After determining the defect classifications, the defects’ severity can be determined. Defects are classified into four magnitudes, fault-free, low-fault, medium-fault, and severely faulty. The defects are caused by a random change in the values of the stiffness matrix in certain ranges. The fault-free system has a range of (0–2)%, the low-fault system has a range of (3–12)%, the medium-fault system has a range of (13–22)%, and the severely faulty system has a range of (23–32)% random changes in stiffness matrix values [39]. Therefore, there is a total of 13 subclasses. These subclasses are, respectively, listed in Table 2.

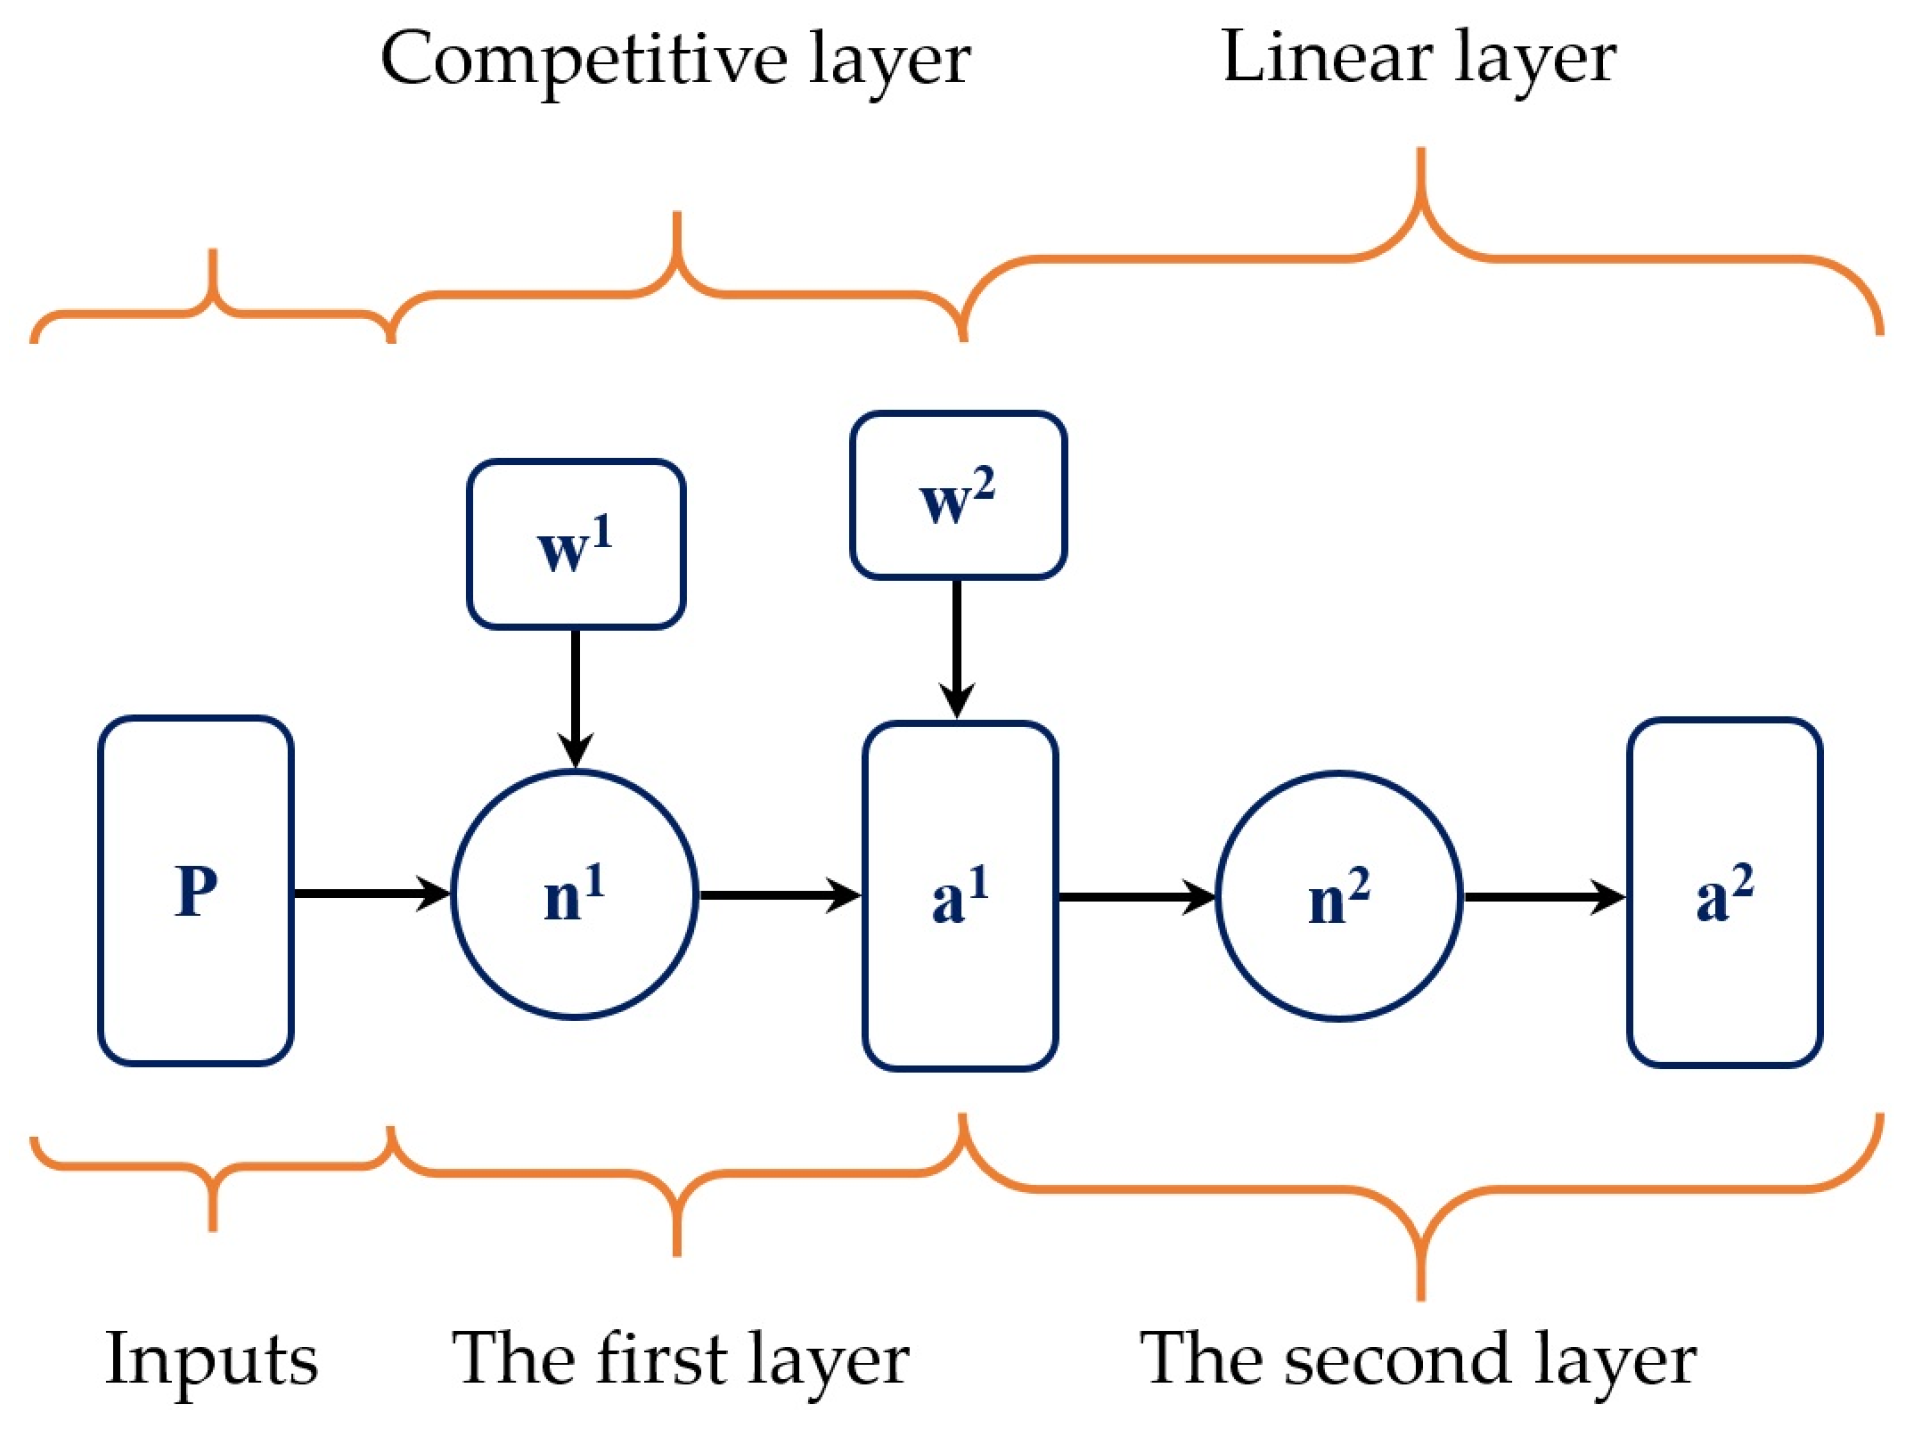
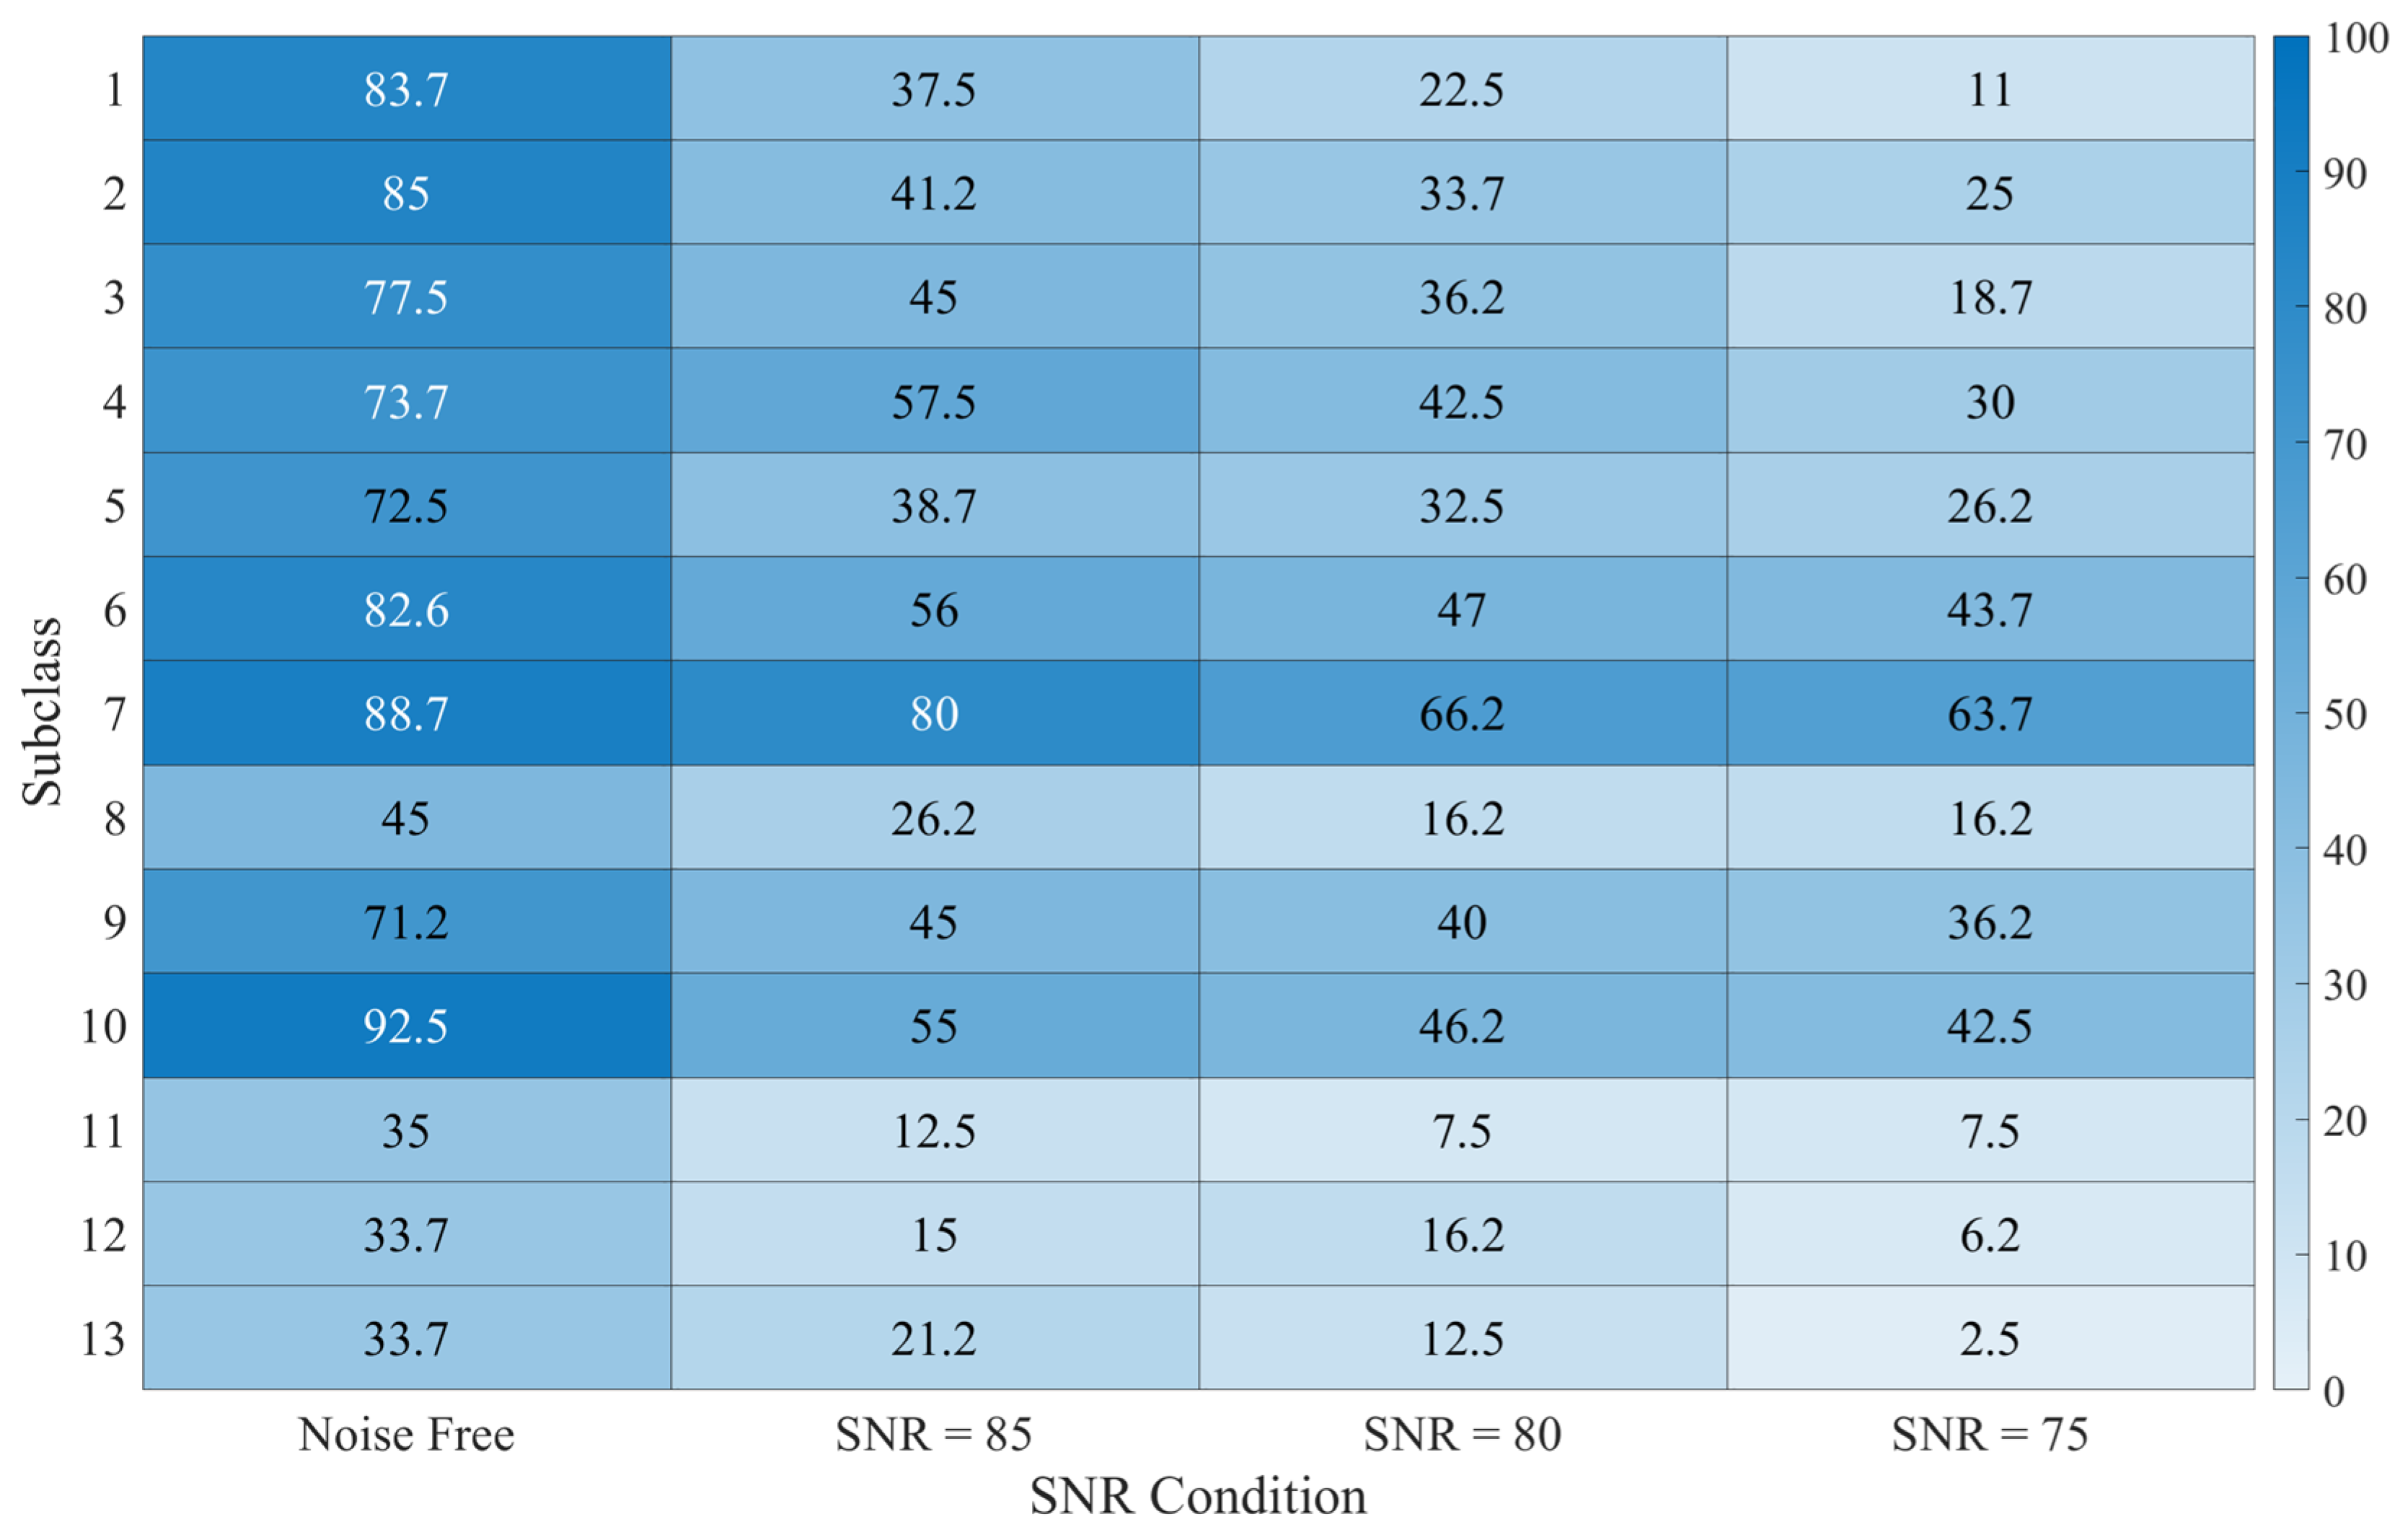
3.3. Defect Detection Using Artificial Neural Network

In this study, we employed neural networks, computational models inspired by the human brain, to detect defects in gantry cranes. Neural networks consist of interconnected nodes called neurons, organized into layers. They have the remarkable ability to learn patterns and make predictions based on data, making them a valuable tool for structural defect detection. The artificial neural network’s capacity to model basic linear and nonlinear functions makes it possible to assess a wide range of complicated issues for which it would be challenging to find answers using solely conventional approaches [24,34]. Therefore, a network should be designed after causing defects in the system. Considering the existing damages in the system, the network should be trained by some of the existing defects to be able to distinguish and predict the location and severity of other possible defects. Inputs and outputs of the system should be determined before beginning the defect detection process and considering the various types of neural networks, and a network should be designed that fits these data and the need of this problem. Afterward, a proper characteristic should be chosen from faulty and faultless data to train the preferred neural network, and at the end, the network should be able to specify the location and intensity of the system defects with any input. The advantages of using neural networks for defect detection in various applications are as follows:
  • Nonlinearity detection: Neural networks excel at identifying subtle, nonlinear patterns in data (dynamic behavior of complex systems often exhibits intricate, nonlinear patterns that may not adhere to conventional linear relationships), making them crucial for spotting structural defects [40,41].
  • Generalization: They adapt to new defect types not in their training data, enhancing their flexibility.
  • Real-time detection: Neural networks can quickly process data, making them ideal for timely defect identification.
  • Noise robustness: They can handle noisy data, filtering out irrelevant information for effective defect detection in real-world scenarios [42,43].
Neural networks have advantages but also face challenges, such as the need for sufficient training data and the overfitting concern. It is important to consider these limitations when interpreting the results.
The LVQ neural network employed in this study is a critical component of our defect detection methodology. LVQ is an artificial neural network that supports both supervised and unsupervised learning. It excels in classifying data through competitive learning and assigning classes to neurons in a second layer. LVQ is specifically used in this research to detect defects and determine their position and severity. It is a combined network that utilizes both supervised and unsupervised learning. The nonlinearity detection in this article refers to the network’s inherent ability to discern and understand subtle, nonlinear patterns within the structural dynamics of the gantry crane. Unlike linear approaches, which assume a direct proportionality between input features and output, the proposed neural network excels at capturing complex relationships that may involve intricate interactions among various factors. Each neuron in the first layer classifies a portion of the input space, and multiple neurons are typically assigned to a class. In the second layer, each class is assigned to a neuron. The number of neurons in the first layer should be equal to or greater than the number in the second layer (Figure 8). This network’s competitive layer makes it suitable for the classifications in this research.
In Figure 8, P and a2 are, respectively, the input and output vectors; n1 and n2 are also specific functions related to the structure; and a1 is simultaneously the input of the second layer and the output of the first layer. To train our neural network effectively, we utilized a dataset that consists of both healthy and faulty gantry crane behavior. This inclusion of diverse data is essential for enabling the network to accurately differentiate between normal and defective structural conditions. In total, we employ 4160 input vectors, encompassing 13 subclasses, 80 simulation iterations, and 4 positions to receive answers from the structure to train the network.
The weights of the second layer ( w 2) are defined as follows:
w 2 = 1       0       0       0       0       0       0       0 0       1       0       0       0       0       0       0 0       0       1       0       0       0       0       0 0       0       0       1       0       0       0       0 0       0       0       0       1       0       0       0 0       0       0       0       0       1       0       0 0       0       0       0       0       0       1       0 0       0       0       0       0       0       0       1
This weight always remains constant, because, in fact, the weights of the second layer determine the position and severity of the defect. The matrix of second-layer weights is 8 × 4160. The first row of this matrix represents the inputs from the health structure. The second-to-fifth rows are, respectively, classes 1 to 4, and the fifth-to-eighth rows represent defect severity of low to high, respectively. Therefore, when the training input is similar with a class and severity, that row of the w 2 matrix would be 1, and the rest of the rows will be zero.
The weight matrix of the first layer ( w 1) is adjusted during training based on competitive learning. The calculation involves comparing the input vector with the existing weights and updating the weights based on the winner-takes-all principle. Therefore, considering α to be the learning rate, we have the following:
w 1 = w 1 + α ( w 1 P ) n 1 = w 1 P a 1 = c o m p e t   ( n 1 )
The proposed network is tested with inputs other than the training inputs (P) to validate the accuracy of the network. The difference between the newly imported data and each row of the first layer weight matrix is calculated, and each row that has the least difference with the input becomes 1 in a competitive layer, and the other rows would be zero. The results acquired from the first layer are then exported to the second layer (a1) as input to calculate the final result, which is the location and severity of the defect (Equation (17)).
n 2 = a 2 = w 2 a 1
The network acquires inputs through feature extraction from acceleration data obtained after simulating defect-free and faulty structures and evaluating the velocity of different parts. Figure 9 and Figure 10 depict the acceleration of various classes of the crane structure in both the time and frequency domains. The extracted characteristics, serving as input vectors for the network, include the position and amplitude of acceleration data peaks in the frequency domain. Each input vector is a 1 × 156 vector, with 1 × 78 data for peak positions and 1 × 78 data for acceleration peak amplitudes within a frequency range of 0–400, which are the dominant frequencies according to Figure 10.
According to Figure 9 and Figure 10, it is apparent that the acceleration diagrams in the time and frequency domains for various structure classes and defect severities are different. The frequency spectrum analysis results, illustrated in Figure 10, reveal a noticeable leftward shift in the peak as the defect severity increases. This shift signifies a reduction in natural frequency, a crucial indicator of structural damage.
The system’s output is a 1 × 8 vector that indicates the position and severity of the defect. The first row represents a fault-free system, followed by rows representing classes 1 to 4, and finally rows indicating the severity of the faults, from low to high. Figure 9 and Figure 10 demonstrate that acceleration diagrams in the time and frequency domains differ for various structure classes and defect severities. It is evident that as the defect severity increases, the peaks in the diagrams shift toward the left. However, these changes are subtle and may go unnoticed to untrained observers, underscoring the need for neural network methods to accurately detect the presence, position, and severity of defects.

4. Result and Discussion

In this section, we present the results of extending our neural network evaluation with two different moving mass block ( m 23 ) velocities. This load velocity can have a substantial impact on the dynamic response of the structure. To comprehensively assess the robustness of our defect detection methodology, we conducted simulations, providing insights into the network’s performance under different operational conditions. The initial condition remained consistent during the simulation. (Details for both velocity profiles are given in Appendix A).
In Figure 11, the central point displacement of the top beam is illustrated under two different moving mass velocities. As expected, if the moving mass passes over the crane with the second velocity pattern, the displacement and vibration amplitude will increase.
After applying the neural network to the system and training it, the network was tested, and the results are reported. It should be mentioned that, in the extracted characteristics, out of 100 simulated iterations for each subclass, 80 iterations were used for training, and 20 iterations were used to test the network. The stiffness matrix values are randomly altered in each iteration to create 100 simulated iterations in each subclass to acquire the mentioned properties. Noises were also added to the test inputs, with white Gaussian noise and different signal-to-noise ratios (using the awgn function in MATLAB R2022b), in order to further ensure the validity of the network.
The results from testing the network are reported as the success rate (SR) percentage, and its equation is as follows:
S R = N C N T × 100
where NC represents the number of input vectors in a test in which the system defect is classified correctly, and NT is the total number of input networks in each test. The SR is reported as a percentage and is therefore dimensionless. The SR of each subclass is shown in Figure 12, where the related input, under the first moving mass velocity profile, is imported separately into the network, and its results are obtained.
The defect detection of the gantry crane with the desired classification was performed. The results for each class are presented in Figure 13, representing the outcomes under the influence of the first velocity profile of the moving mass. The noisy inputs were used to further validate the performance of the network, and all the results are given as success rate percentages.
Similar simulations were conducted for the same crane, but considering the second moving mass velocity, and the results of the SR of each subclass are shown in Figure 14. Moreover, the obtained results of each class are also illustrated in Figure 15.
As the severity of the defect in an element rises, the accuracy should increase as well. It can be observed that, in noise-free mode, the success rate improves as the defect severity increases in most of the subclasses according to the simulation studies. To bring the intended system closer to reality, noises were added to the simulation outputs, and the noisy data were fed into the desired network for testing, with the results shown in Figure 12, Figure 13, Figure 14 and Figure 15. According to the findings, the success rate tends to increase with growing defect severity. This suggests that the neural network performs effectively under varying degrees of defect severity. The fourth class has the least success rate according to Figure 13 and Figure 15, as this class, which belongs to the moving system and its suspended load, has the highest stiffness compared to the others, and no significant changes are observed by a modest change in the stiffness of this element, making it more difficult for the network to identify the defect. The second class has the best success rate. This class is related to the structure’s top beam, and the middle point of the beam, which has the highest displacement, is in this classification; thus, the network will distinguish defects better. According to Figure 14 and Figure 15, it can also be seen that by increasing the velocity of the moving mass, the results of damage detection have also improved compared to the first case. With increasing moving mass velocity, the amplitude of vibrations has increased; therefore, the difference between defective and healthy crane signals is more than previous velocity, and its damage detection will be easier. Also, the effect of noise in the results of this part is less compared to the previous part, and despite the noise of the input signals, we are still able to detect the damages with an acceptable success rate. Finally, the obtained findings demonstrate that the network is capable of detecting defects in the target system.

5. Conclusions

In undertaking this research, our objectives were multifaceted, encompassing an in-depth exploration of gantry crane dynamics and the development of a robust defect detection mechanism.
  • Key findings and results: The finite element model adeptly encapsulated the two-dimensional in-plane dynamics of the gantry crane, focusing intricately on vertical and horizontal displacements. While acknowledging the relevance of out-of-plane dynamics, our concentration on the presented two-dimensional model was influenced by computational efficiency. The study illuminated valuable insights into the system’s behavior under diverse conditions, with a specific emphasis on the influence of varying stiffness matrices on structural response.
  • Implications and applications: The findings hold substantial implications for structural health monitoring of gantry cranes. The established finite element model and defect detection mechanism lay a foundation for enhancing maintenance practices, thereby ensuring the longevity and safety of these vital industrial assets.
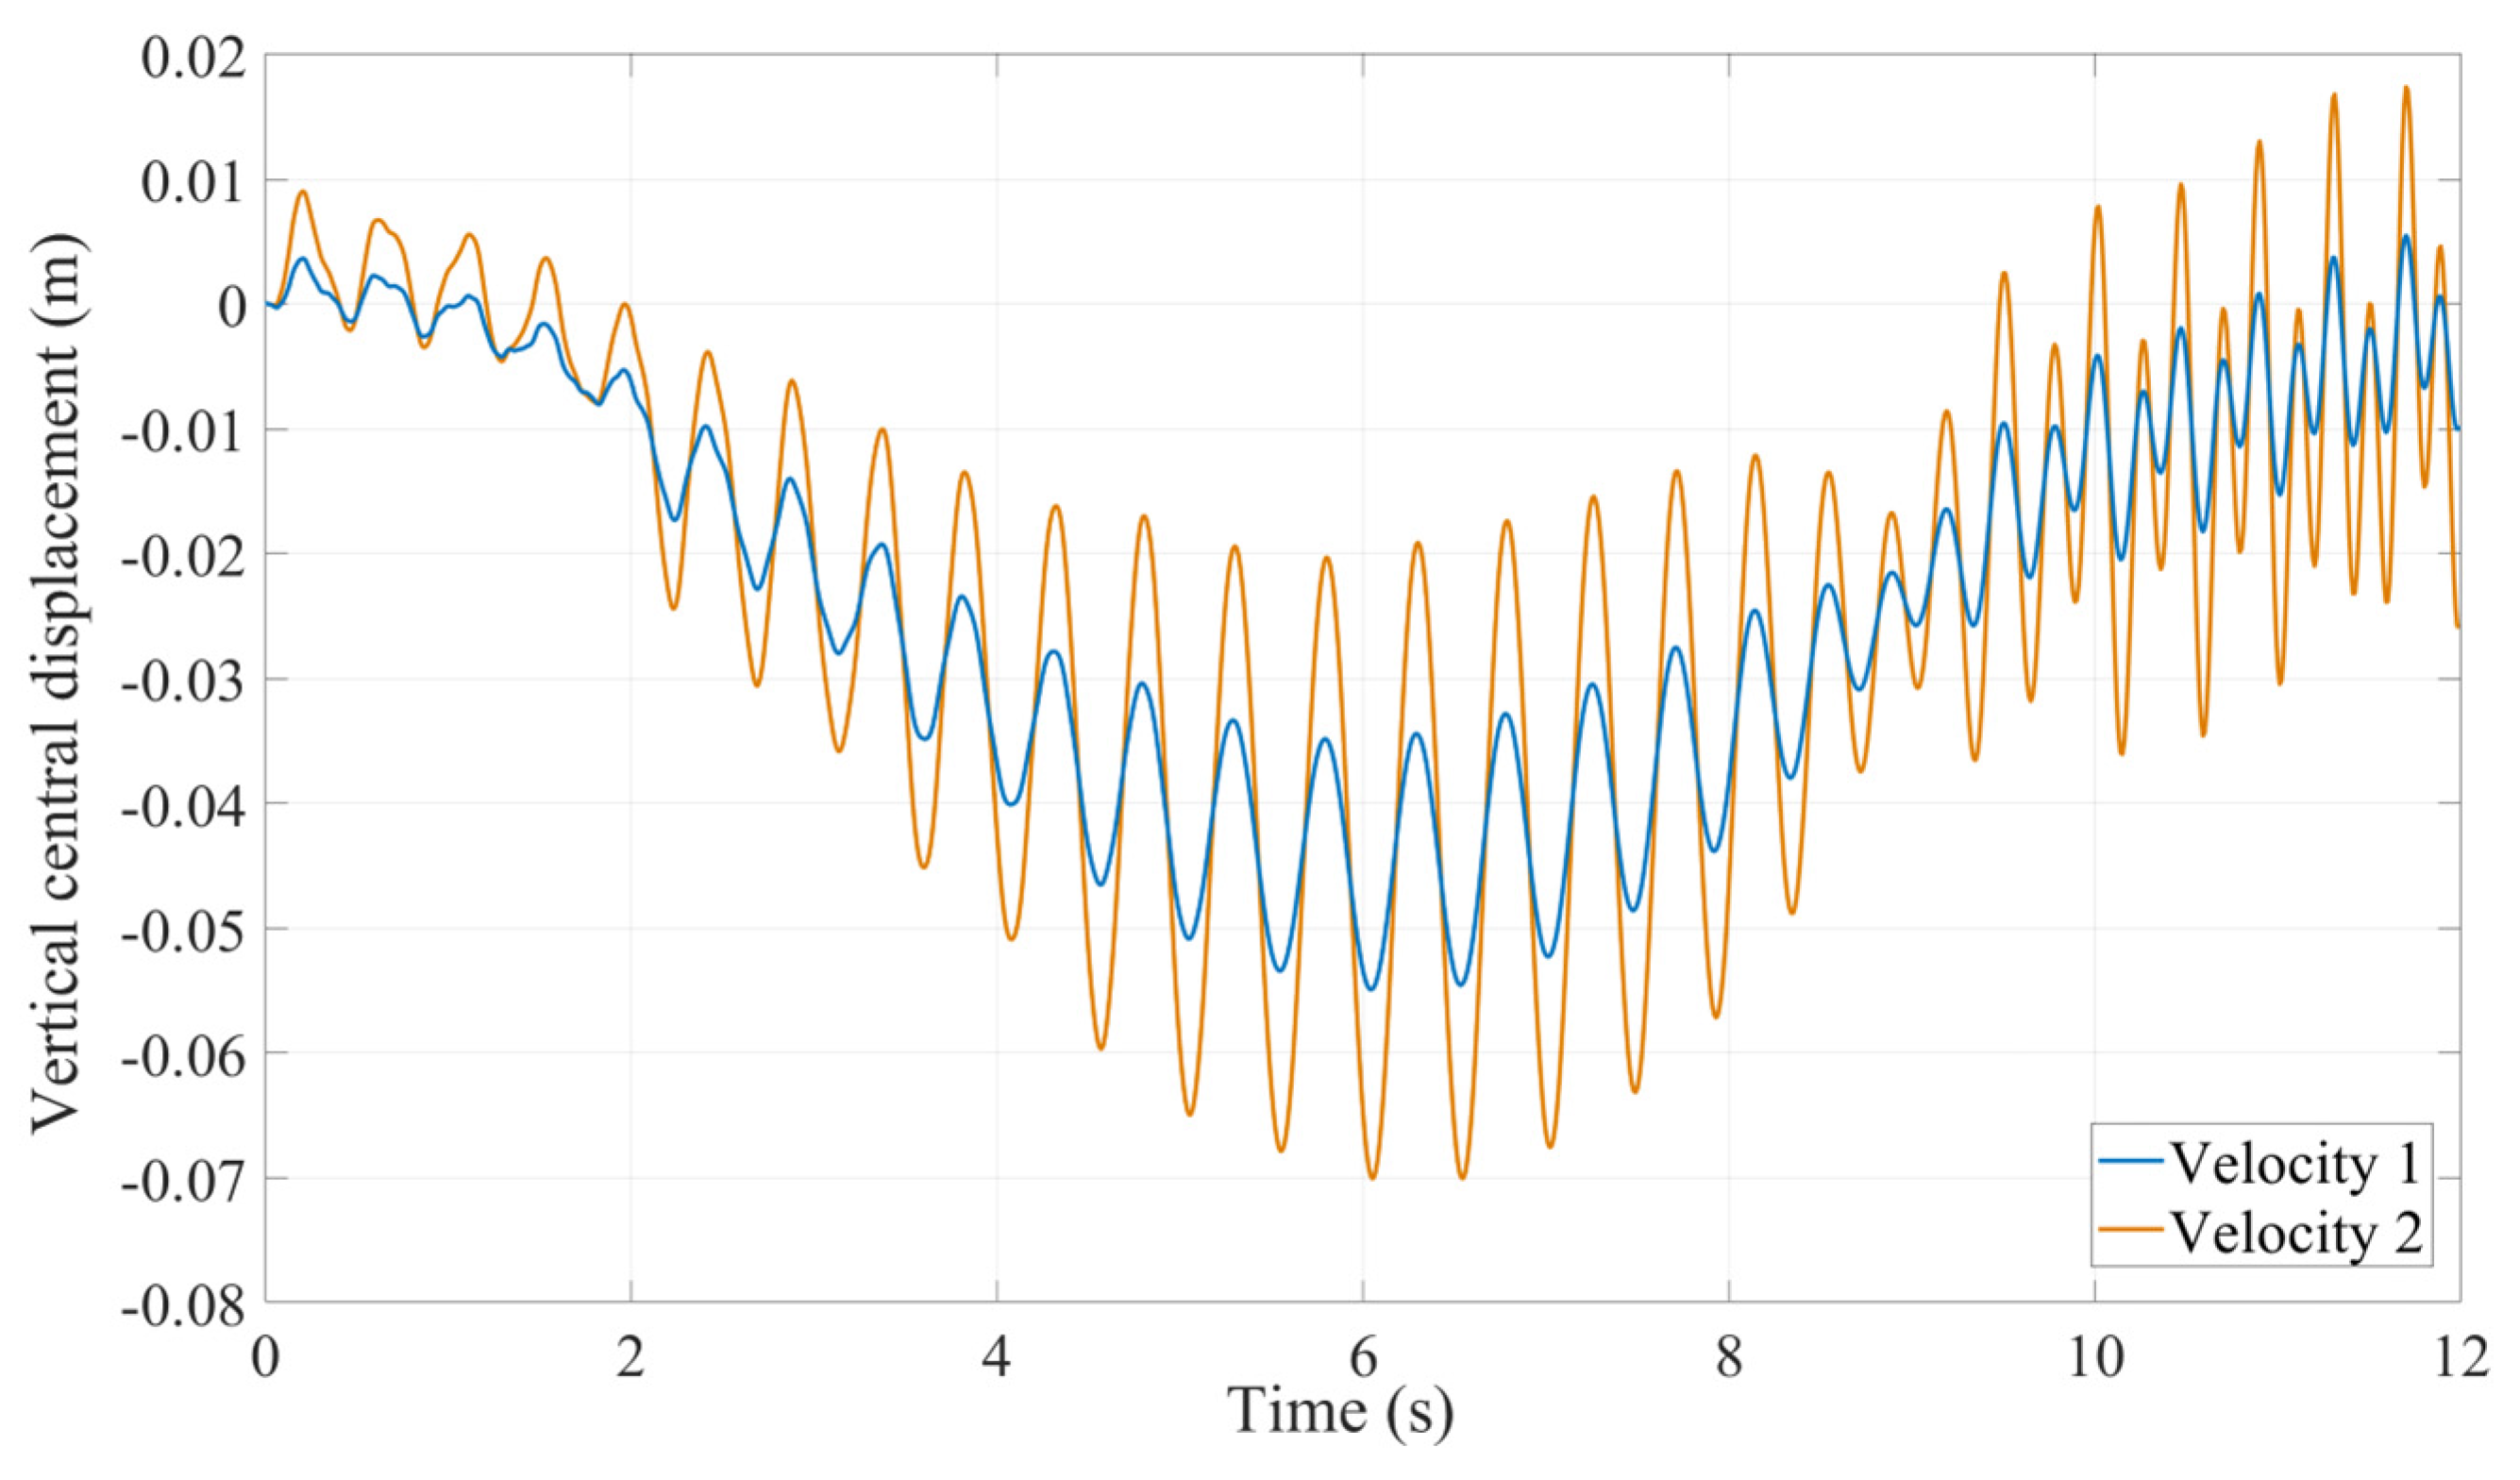
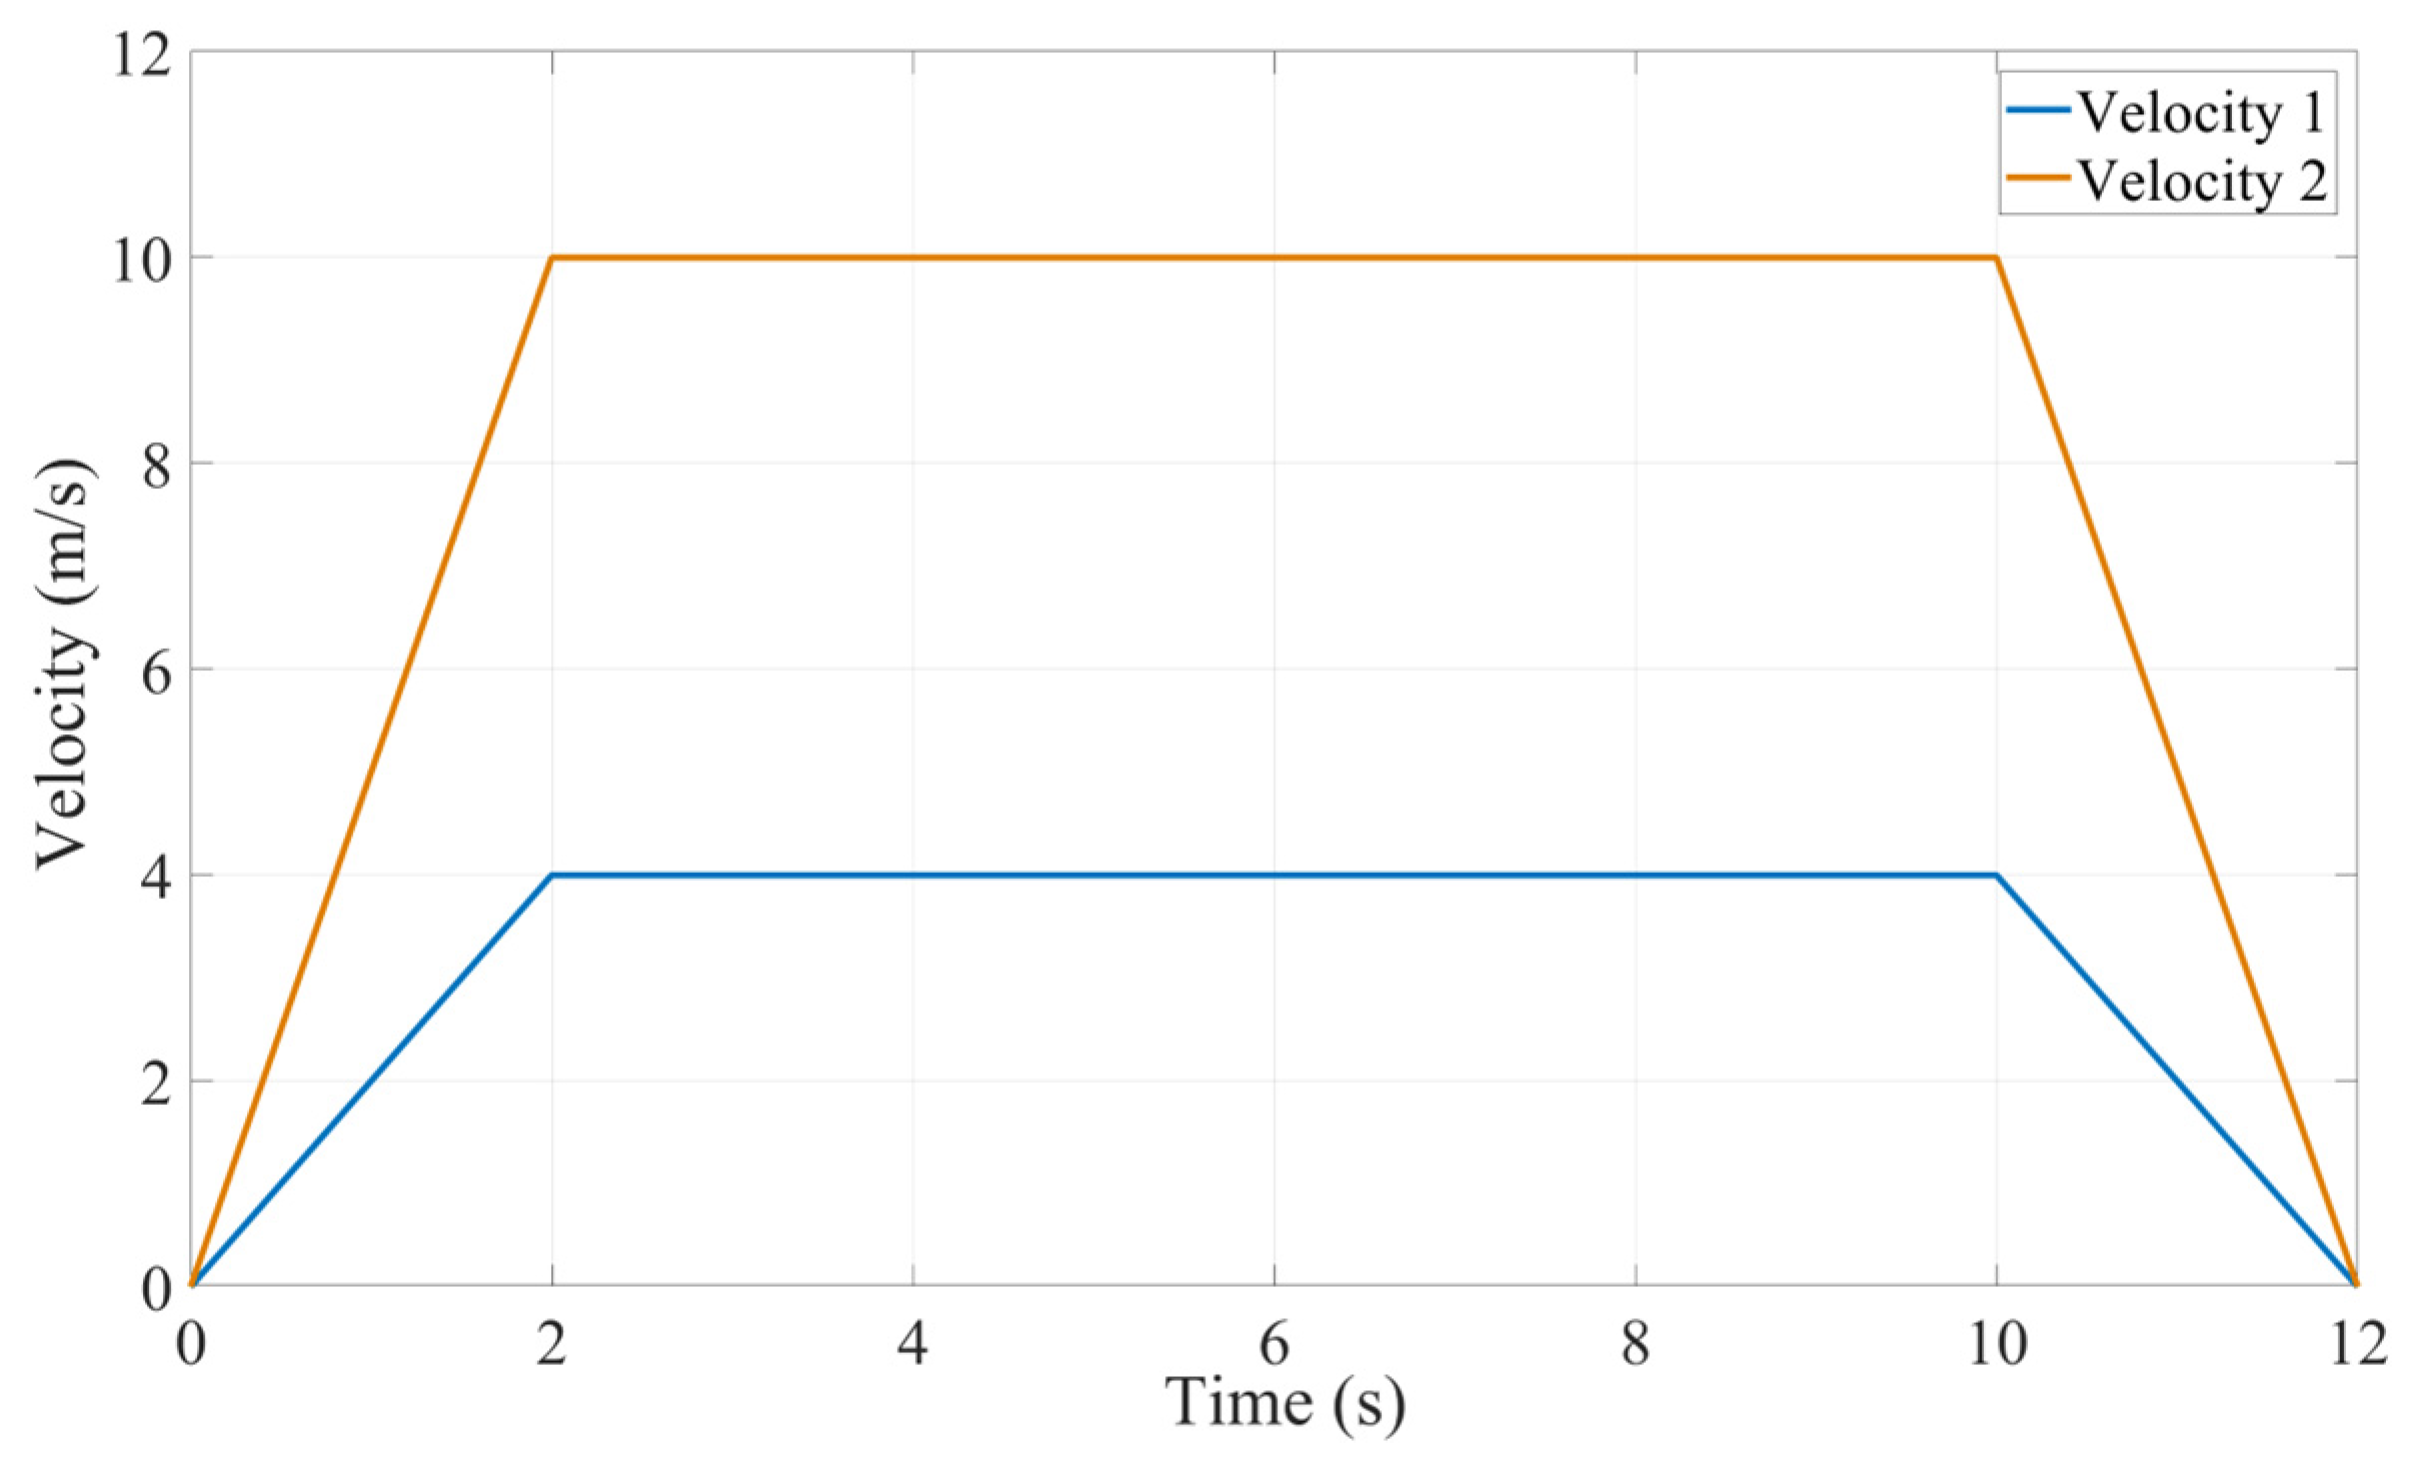
  • Effects of moving mass velocity: The research rigorously considered all modeling and damage detection steps for two different speeds of the moving mass. A comparative analysis of the results obtained for two distinct velocity profiles enriched our understanding of dynamics and damage detection in gantry cranes.
  • Limitations and future work: Acknowledging the study’s limitations, future research endeavors could focus on incorporating out-of-plane dynamics, thereby providing a more comprehensive analysis.
  • Summary and closing thoughts: In summary, this research propels our comprehension of gantry crane dynamics and establishes a groundwork for effective defect detection. Through discussions on key findings, implications, and limitations, we aim to inspire future research that refines our understanding and contributes to the continuous improvement of gantry crane safety and efficiency.
Additionally, the introduction of a novel LVQ neural network-based approach for defect detection in gantry cranes showcases the method’s efficacy in accurate classification and location of defects in critical structural elements. This contribution extends beyond gantry cranes, offering a valuable framework for defect detection in similar industrial equipment.
To further enhance the comprehensiveness of this research, future investigations should delve into the effects of temperature on the system in greater detail. A dedicated study on thermal aspects and their implications for structural integrity and performance, coupled with a nuanced analysis of how temperature-induced deflection interacts with established nonlinear patterns in dynamic behavior, could provide crucial insights for crane system design and operation. Researchers are encouraged to explore recent works in the field for a comprehensive understanding of the interplay between temperature and dynamic response, as these studies offer valuable insights into the broader scope of temperature effects on structural systems [44,45]. Incorporating these perspectives into future research endeavors will advance our understanding of gantry crane dynamics and contribute to the development of more robust and resilient systems.

Author Contributions

All authors contributed equally to writing, editing, and reviewing the manuscript. All authors have read and agreed to the published version of the manuscript.

Funding

This research received no external funding.

Data Availability Statement

The data presented in this study are available on request from the corresponding author.

Conflicts of Interest

The authors declare no conflicts of interest.

Appendix A

The velocity profiles used to describe the motion of the moving mass are shown in Figure A1. The first velocity profile is used for validation and the first damage detection. The second profile is then used for the secondary damage detection and investigating the effects of change in the moving mass velocity on the obtained neural network results.
Figure A1. The velocity profile of gantry crane moving mass.
Buildings 14 00458 g0a1

References

  1. Zrnić, N.D.; Gašić, V.M.; Bošnjak, S.M. Dynamic responses of a gantry crane system due to a moving body considered as moving oscillator. Arch. Civ. Mech. Eng. 2015, 15, 243–250. [Google Scholar] [CrossRef]
  2. Alhassan, A.B.; Muhammad, B.B.; Danapalasingam, K.A.; Sam, Y.M. Optimal analysis and control of 2D nonlinear gantry crane system. In Proceedings of the International Conference on Smart Sensors and Application (ICSSA), Kuala Lumpur, Malaysia, 26–27 July 2022; pp. 30–35. [Google Scholar]
  3. Xiao, F.; Zhu, W.; Meng, X.; Chen, G.S. Parameter Identification of Frame Structures by considering Shear Deformation. Int. J. Distrib. Sens. Netw. 2023, 2023, 6631716. [Google Scholar] [CrossRef]
  4. Meng, X.; Xiao, F.; Yan, Y.; Chen, G.S.; Ma, Y. Non-Destructive Damage Evaluation Based on Static Response for Beam-like Structures Considering Shear Deformation. Appl. Sci. 2023, 13, 8219. [Google Scholar] [CrossRef]
  5. Xiao, F.; Meng, X.; Zhu, W.; Chen, G.S.; Yan, Y. Combined Joint and Member Damage Identification of Semi-Rigid Frames with Slender Beams Considering Shear Deformation. Buildings 2023, 13, 1631. [Google Scholar] [CrossRef]
  6. Nie, X.P.; Li, X.G.; Fan, H.W.; Ding, K.Q.; Xu, L.B. The research of gantry crane girder damage problem by modal analysis method. Appl. Mech. Mater. 2014, 578–579, 872–876. [Google Scholar] [CrossRef]
  7. Pedrammehr, S.; Mahboubkhah, M.; Khani, N. Natural Frequencies and Mode Shapes for Vibrations of Machine Tools’ Hexapod Table. In Proceedings of the 1st International Conference on Acoustics & Vibration (ISAV2011), Tehran, Iran, 21–22 December 2011. [Google Scholar]
  8. Xu, X.; Zhang, X.; Zhu, W.; Gu, X. Modal parameter identification of a quayside container crane based on data-driven stochastic subspace identification. J. Vib. Eng. Technol. 2021, 9, 919–938. [Google Scholar] [CrossRef]
  9. Wang, H.F.; Noori, M.; Zhao, Y. A wavelet-based damage identification for large crane structures. In Proceedings of the 2014 6th World Conference on Structural Control and Monitoring, Barcelona, Spain, 15–17 July 2014. [Google Scholar]
  10. Goubej, M.; Helma, V. Vibration damping in gantry crane systems: Finite horizon optimal control approach. In Proceedings of the 2019 24th IEEE International Conference on Emerging Technologies and Factory Automation (ETFA), Zaragoza, Spain, 10–13 September 2019; pp. 877–882. [Google Scholar]
  11. Zhao, Y.; Wu, X.; Li, F.; Zhang, Y. Positioning and Swing Elimination Control of the Overhead Crane System with Double-Pendulum Dynamics. J. Vib. Eng. Technol. 2024, 12, 971–978. [Google Scholar] [CrossRef]
  12. Golovin, I.; Palis, S. Robust control for active damping of elastic gantry crane vibrations. Mech. Syst. Signal Process. 2019, 121, 264–278. [Google Scholar] [CrossRef]
  13. Rigatos, G. Nonlinear Optimal Control for the Underactuated Double-Pendulum Overhead Crane. J. Vib. Eng. Technol. 2023. [Google Scholar] [CrossRef]
  14. Entessari, F.; Najafi Ardekany, A.; Alasty, A. Exponential stabilization of flexural sway vibration of gantry crane via boundary control method. J. Vib. Control 2020, 26, 36–55. [Google Scholar] [CrossRef]
  15. Mori, Y.; Tagawa, Y. Vibration controller for overhead cranes considering limited horizontal acceleration. Control Eng. Pract. 2018, 81, 256–263. [Google Scholar] [CrossRef]
  16. Avci, O.; Abdeljaber, O.; Kiranyaz, S.; Hussein, M.; Gabbouj, M.; Inman, D.J. A review of vibration-based damage detection in civil structures: From traditional methods to Machine Learning and Deep Learning applications. Mech. Syst. Signal Process. 2021, 147, 107077. [Google Scholar] [CrossRef]
  17. Ku, N.; Ha, S. Dynamic response analysis of heavy load lifting operation in shipyard using multi-cranes. Ocean Eng. 2014, 83, 63–75. [Google Scholar] [CrossRef]
  18. Xu, B.; Wu, Q. Stress fatigue crack propagation analysis of crane structure based on acoustic emission. Eng. Fail. Anal. 2020, 109, 104206. [Google Scholar] [CrossRef]
  19. Wang, X.; Wang, X.; Hu, X.-L. Damage assessment in structural steel subjected to tensile load using nonlinear and linear ultrasonic techniques. Appl. Acoust. 2019, 144, 40–50. [Google Scholar] [CrossRef]
  20. Rivera, F.G.; Edwards, G.; Eren, E. Acoustic emission technique to monitor crack growth in a mooring chain. Appl. Acoust. 2018, 139, 156–164. [Google Scholar] [CrossRef]
  21. Luczaka, M.M.; Telega, J.; Zagatob, N. On the damage detection of a laboratory scale model of a tripod supporting structure by vibration-based methods. Mar. Struct. 2019, 64, 146–160. [Google Scholar] [CrossRef]
  22. Ferjaoui, A.; Abdel Wahab, M.; Hojjati-Talemi, R. Prediction of fretting fatigue crack initiation in double lap bolted joint using continuum damage mechanics. Int. J. Fatigue 2015, 73, 66–76. [Google Scholar] [CrossRef]
  23. Yoon, M.K.; Heider, D.; Gillespie, J.W., Jr.; Ratcliffe, C.P.; Crane, R.M. Local damage detection with the global fitting method using operating deflection shape data. J. Nondestruct. Eval. 2010, 29, 25–37. [Google Scholar] [CrossRef]
  24. Assaad, B.; Eltabach, M.; Antoni, J. Vibration based condition monitoring of a multistage epicyclic gearbox in lifting cranes. Mech. Syst. Signal Process. 2014, 42, 351–367. [Google Scholar] [CrossRef]
  25. Fang, X.; Luo, H.; Tang, J. Structural damage detection using neural network with learning rate improvement. Comput. Struct. 2005, 83, 2150–2161. [Google Scholar] [CrossRef]
  26. Zang, C.; Grafe, H.; Imergun, M. Frequency-domain criteria for correlating and updating dynamic finite element models. Mech. Syst. Signal Process. 2001, 15, 139–155. [Google Scholar] [CrossRef]
  27. Pedrammehr, S. Investigation of Factors Influential on the Dynamic Features of Machine Tools’ Hexapod Table. In Proceedings of the 2nd International Conference on Acoustics and Vibration (ISAV 2012), Tehran, Iran, 26–27 December 2012. [Google Scholar]
  28. Xiao, F.; Sun, H.; Mao, Y.; Chen, G.S. Damage identification of large-scale space truss structures based on stiffness separation method. Structures 2023, 53, 109–118. [Google Scholar] [CrossRef]
  29. Tran-Ngoc, H.; Khatir, S.; De Roeck, G.; Bui-Tien, T.; Abdel Wahab, M. An efficient artificial neural network for damage detection in bridges and beam-like structures by improving training parameters using cuckoo search algorithm. Eng. Struct. 2019, 199, 109637. [Google Scholar] [CrossRef]
  30. Kao, C.Y.; Hung, S.L. Detection of structural damage via free vibration responses generated by approximating artificial neural networks. Comput. Struct. 2003, 81, 2631–2644. [Google Scholar] [CrossRef]
  31. Zou, Y.; Tong, L.; Steven, G.P. Vibration-based model dependent damage (delamination) identification and health monitoring for composite structures: A review. J. Sound Vib. 2000, 230, 357–378. [Google Scholar] [CrossRef]
  32. Gajjal, P.; Lathkar, G.S. Fault diagnosis in an optimized rolling bearing using an intelligent approach. Arch. Appl. Mech. 2022, 92, 1585–1601. [Google Scholar] [CrossRef]
  33. de Lautour, O.; Omenzetter, P. Damage classification and estimation in experimental structures using time series analysis and pattern recognition. J. Mech. Syst. Signal Process. 2010, 24, 1556–1569. [Google Scholar] [CrossRef]
  34. Li, X.; Xi, H.; Zhou, C.; Gu, W.; Gao, T. Damage Degree Identification of Crane Girder Based on the Support Vector Machine. In Proceedings of the 2018 Prognostics and System Health Management Conference (PHM-Chongqing), Chongqing, China, 26–28 October 2018. [Google Scholar] [CrossRef]
  35. Li, B.W.; Huang, K.; Xu, F.Y.; Jiang, Y.; Yang, H.C. Research on Crane Damage Identification Based on GNAR Model without Baseline. In Proceedings of the DMCIT’17: 2017 International Conference on Data Mining, Communications and Information Technology, Phuket, Thailand, 25–27 May 2017; ACM: New York, NY, USA, 2017. ISBN 978-1-4503-5218-5/17/05. [Google Scholar]
  36. de Assis, F.M.; Gomes, G.F. Crack identification in laminated composites based on modal responses using metaheuristics, artificial neural networks, and response surface method: A comparative study. Arch. Appl. Mech. 2021, 91, 4389–4408. [Google Scholar] [CrossRef]
  37. Nguyen, D.H.; Nguyen, Q.B.; Bui-Tien, T.; De Roeck, G.; Wahab, M.A. Damage detection in girder bridges using modal curvatures gapped smoothing method and Convolutional Neural Network: Application to Bo Nghi bridge. Theor. Appl. Fract. Mech. 2020, 109, 102728. [Google Scholar] [CrossRef]
  38. Tsou, P.; Shen, M.-H.H. Structural damage detection and identification using neural network. AIAA J. 1994, 32, 176–183. [Google Scholar] [CrossRef]
  39. Jamalkia, A.; Ettefagh, M.M.; Mojtahedi, A. Damage detection of TLP and Spar floating wind turbine using dynamic response of the structure. Ocean Eng. 2016, 125, 191–202. [Google Scholar] [CrossRef]
  40. Zhao, H.; Ding, Y.; Li, A.; Chen, B.; Zhang, X. State-Monitoring for Abnormal Vibration of Bridge Cables Focusing on Non-Stationary Responses: From Knowledge in Phenomena to Digital Indicators. Measurement 2022, 205, 112148. [Google Scholar] [CrossRef]
  41. Zhao, H.; Ding, Y.; Li, A.; Ren, Z.; Yang, K. Live-Load Strain Evaluation of the Prestressed Concrete Box-Girder Bridge Using Deep Learning and Clustering. Struct. Health Monit. 2020, 19, 1051–1063. [Google Scholar] [CrossRef]
  42. Cao, K.; Liu, M.; Su, H.; Wu, J.; Zhu, J.; Liu, S. Analyzing the Noise Robustness of Deep Neural Networks. IEEE Trans. Vis. Comput. Graph. 2021, 27, 3289–3304. [Google Scholar] [CrossRef] [PubMed]
  43. Zhang, X.; Ding, Y.; Zhao, H.; Yi, L.; Guo, T.; Li, A.; Zou, Y. Mixed Skewness Probability Modeling and Extreme Value Predicting for Physical System Input–Output Based on Full Bayesian Generalized Maximum-Likelihood Estimation. IEEE Trans. Instrum. Meas. 2024, 73, 1–16. [Google Scholar] [CrossRef]
  44. Zhao, H.; Ding, Y.; Meng, L.; Qin, Z.; Yang, F.; Li, A. Bayesian Multiple Linear Regression and New Modeling Paradigm for Structural Deflection Robust to Data Time Lag and Abnormal Signal. IEEE Sens. J. 2023, 23, 19635–19647. [Google Scholar] [CrossRef]
  45. Zhao, H.-W.; Ding, Y.-L.; Nagarajaiah, S.; Li, A.-Q. Behavior Analysis and Early Warning of Girder Deflections of a Steel-Truss Arch Railway Bridge under the Effects of Temperature and Trains: Case Study. J. Bridge Eng. 2019, 24, 05018013. [Google Scholar] [CrossRef]
Figure 1. Gantry crane.
Buildings 14 00458 g001
Figure 2. The meshing of the gantry crane (FE model) with the mass moving on the structure.
Buildings 14 00458 g002
Figure 3. (a) Equivalent forces acting on the nodes of each structure element, (b) external forces acting on the top beam, and (c) forces acting on the moving system of the gantry crane.
Buildings 14 00458 g003
Figure 4. The vertical displacement and acceleration of the top beam center: (a) vertical central displacement and the comparison between the obtained results of the proposed model, represented as the red line, and the model developed in reference [1], represented as the blue line (b) vertical central acceleration.
Buildings 14 00458 g004
Figure 5. The horizontal displacement and acceleration of the top beam: (a) displacement of central node; (b) acceleration of central node; (c) displacement of before central, central, and after central nodes; and (d) acceleration of before central, central, and after central nodes.
Buildings 14 00458 g005
Figure 6. The framework for defect detection.
Buildings 14 00458 g006
Figure 7. The classified elements for defect detection.
Buildings 14 00458 g007
Figure 8. The LVQ neural network structure.
Buildings 14 00458 g008
Figure 9. The vertical acceleration of the structure center in fault-free, low-fault, medium-fault, and severely faulty cases in the time domain: (a) class 1, (b) class 2, (c) class 3, and (d) class 4.
Buildings 14 00458 g009
Figure 10. The vertical acceleration of the structure center in fault-free, low-fault, medium-fault, and severely faulty cases in the frequency domain: (a) class 1, (b) class 2, (c) class 3, and (d) class 4.
Buildings 14 00458 g010
Figure 11. The vertical displacement of top beam center with different moving mass speeds.
Buildings 14 00458 g011
Figure 12. The success rate percentage of the LVQ neural network in the defect detection of the gantry crane system in each subclass.
Buildings 14 00458 g012
Figure 13. The averaged success rate of the mentioned system classes.
Buildings 14 00458 g013
Figure 14. The success rate percentage of the LVQ neural network in the defect detection of the gantry crane system in each subclass for the second speed profile.
Buildings 14 00458 g014
Figure 15. The averaged success rate of the mentioned system classes for second speed profile.
Buildings 14 00458 g015
Table 1. The geometrical and dynamic characteristics of the test gantry crane.
Top beam length:L = 40 (m)
Top beam cross section area:AL = 0.09 (m2)
Top beam moment of inertiaIL = 0.014 (m4)
Sheer leg height:h = 15 (m)
Sheer leg cross section area:AS = 0.048 (m2)
Sheer leg moment of inertiaIS = 0.01 (m4)
Pier leg height:H = 15 (m)
Pier leg cross section area:AP = 0.07 (m2)
Pier leg moment of inertia:IP = 0.024 (m4)
Stiffens coefficient for moving mass spring:k = 109 (N/m)
Damping coefficient: ξ 1 , ξ 2 = 0.5%
Density of structure: ρ = 7850 (kg/m3)
Modulus of elasticity:E = 2.1 × 10¹¹ (Pa)
Table 2. The designated subclasses to solve the defect detection problem.
SubclassClassFault TypeChanges in Stiffness Matrix
1Fault-free classFault free(0–2)%
21The first class of defects in element 11 of the pier leg.Low fault(3–12)%
3Medium fault(13–22)%
4Severely faulty(23–32)%
52The second class of defects in elements 1 and 2 of the top beam.Low fault(3–12)%
6Medium fault(13–22)%
7Severely faulty(23–32)%
83The third class of faults in element 22 of sheer leg.Low fault(3–12)%
9Medium fault(13–22)%
10Severely faulty(23–32)%
114The fourth class of defects in the spring connected to the moving mass.Low fault(3–12)%
12Medium fault(13–22)%
13Severely faulty(23–32)%
Disclaimer/Publisher’s Note: The statements, opinions and data contained in all publications are solely those of the individual author(s) and contributor(s) and not of MDPI and/or the editor(s). MDPI and/or the editor(s) disclaim responsibility for any injury to people or property resulting from any ideas, methods, instructions or products referred to in the content.

