Article

An Output-Only, Energy-Based, Damage Detection Method Using the Trend Lines of the Structural Acceleration Response

1
School of Civil Engineering, Shandong Jianzhu University, Jinan 250101, China
2
Multidisciplinary Center for Infrastructure Engineering, Shenyang University of Technology, Shenyang 110870, China
*
Author to whom correspondence should be addressed.
Buildings 2023, 13(12), 3007; https://doi.org/10.3390/buildings13123007 (registering DOI)
Submission received: 12 October 2023 / Revised: 7 November 2023 / Accepted: 9 November 2023 / Published: 1 December 2023
(This article belongs to the Special Issue Recent Developments in Structural Health Monitoring)

Abstract

:
Using the trendlines of an acceleration response as a tool to decompose a structural response is a new topic that was proposed by authors in 2020. This paper provides a numerical/experimental investigation of using a Savitzky–Golay filter (SGF) in a method to calculate the trendline and decompose building acceleration responses when subjected to a seismic load. Hence, this paper proposes an output-only, energy-based, damage detection method in which the trend lines of a building’s structural acceleration responses are used to locate the damage. For this purpose, an adjusted SGF is utilized to calculate an especial trend line for each floor’s acceleration response of the building structural model. The energy of these trend lines is then calculated and normalized. Two damage indices are used, of which, the second one is being proposed for the first time in this paper. The accuracy of the proposed method is numerically and experimentally investigated using a five-floor building structural model subjected to white noise excitation through a shake table. The results prove that the proposed method is capable of accurately locating and quantifying structural damages with a severity of more than 10% in a noisy environment. In view that the proposed method locates the damage with no need of determining the structural modal properties or parameters, it can be categorized as an online and quick structural damage detection method.

1. Introduction

Structural health monitoring (SHM) is a tool used to monitor and detect structural damage based on the local or global vibration response of a building. It has been proved that structural damage changes the dynamic modal properties of a structure [1,2,3]. Vibration-based SHM attempts to measure these changes from the global vibration response of a structure. Recording structural vibration responses using accelerometers is an easy and cheap way to obtain the general vibration response of a structure. Although it has been proved that an acceleration response has the signatures of structural damage, these signatures cannot be seen by the naked eyes; therefore, it is necessary to utilize some signal processing techniques (methods). Some of these techniques (methods) are 1—transformer-based methods such as wavelet or Hilbert–Huang transformers [4,5,6,7], 2—special averaging-based techniques such as the random decrement technique (RDT) [8,9,10,11,12,13], 3—filtering-based methods such as Savitzky–Golay-filter-based or Kalman-based methods [14,15,16,17,18], and 4—source-separation-based methods such as the blind source separation technique [19,20,21,22,23]. The techniques (methods) mentioned in this paper are not the only techniques used, and we do not claim that our method provides the maximum accuracy. There are also other techniques that can be found in the literature such as [24,25,26,27].
Wavelet coefficients extracted from the acceleration data using wavelet analysis have been widely used for modal identification and damage localization in structures. Zheng et al. utilized discrete wavelet transform to identify the damage location in a dome subjected to an earthquake [4]. Combining wavelet analysis and fractal dimensions, a baseline-free damage detection method for frame structures under seismic excitations was developed [5] and verified experimentally [6]. Pnevmatikos et al. proved that the discrete wavelet coefficients extracted from the seismic acceleration response show spikes when damage occurs [7]. Delgadillo and Casas [28] used the results of the Hilbert–Huang transform in a machine learning algorithm and successfully located the damage in a real bridge under a moving load in Japan. Kildashti et al. [29] numerically investigated the effect of various vehicle parameters on the accuracy of their damage detection method in a cable-stayed bridge. There are also some other transformer-based methods such as that of Wang et al. [30], who proposed a Laplace-transform-based spectral element method, which utilizes strain statistical moments as a damage index for beam-like structures. Based on the results, they claimed that the use of the Laplace transform can avoid some limitations of the conventional Fourier-transform-based spectral element method. Hester and González [31] conducted a parameter study on the advantages and restrictions of using a wavelet-transform-based damage detection method to identify the structural damage from a bridge acceleration response.
The RDT is a promising special averaging technique that calculates a signal similar to the free vibration of a structure with no need of determining the input excitations. Therefore, the RDT receives a large amount of attention in SHM, especially when the input excitations are hard to estimate. Although a mathematical basis is only available for linear and stationary input [8,9], some researchers successfully employed it for non-stationary excitations [8,10,11]. A comparison of the application of the RDT for modal property identification in both the frequency and time domains was addressed in [12,13].
The use of filters to extract/remove a certain part of a structural response and attenuate the noise has been addressed in many studies. Kordestani et al. utilized a band-pass filter to extract the second vibration mode from a bridge seismic acceleration response [14]. They used an energy-based damage index (DI) and successfully located the damaged cable in a tied-arch bridge. The Savitzky–Golay filter (SGF) was also utilized to decompose a signal and find the first vibration mode of a bridge subjected to a moving sprung mass [15,16]. The use of a moving average filter to locate the damage was also addressed in [17,18].
The source separation technique is an output-only technique that identifies either dynamic modal parameters or input excitations. Independent component analysis and second-order blind identification are two well-known techniques for the blind source separation approach [19,20]. Kerschen et al. proved that each column of the mixing matrix in independent component analysis shows a vibration mode for low-damped structures [21]. A combination of the blind source separation approach with wavelet analysis was also addressed in [22]. Loh et al. utilized a blind-source-separation-based damage detection method and compared their results with other damage detection methods [23]. Li et al. [32] utilized the bridge acceleration response and identified the bridge frequencies using blind modal identification and singular-spectrum analysis. They provided numerical and experimental proof for their proposed method.
The abovementioned methods employ some complex signal processing techniques to identify the dynamic modal parameters, which is a time-consuming task. Authors numerically proved that the adjusted SGF can calculate a special trend line that has the signature of bridge structural damage when subjected to a moving sprung mass [15,16]. In these studies, authors showed that the adjusted SGF can remove most of the noise and calculate a special trendline that only has the first natural frequency of the structure and, therefore, that the calculated trendlines can be used as an input for damage detection techniques.
Using trendlines as an input for damage detection methods has rarely been studied in the literature. Additionally, those papers that use this topic mainly provide numerical proof that a trendline of an acceleration response can really help to identify structural damage [17]. Therefore, the main purpose of this paper is to provide a more advanced version of this topic with experimental proof of damage detection in buildings subjected to seismic excitation. Hence, in this paper, the application of the SGF to calculate the trendline of acceleration response and locate the structural damage of a building is experimentally investigated. This paper develops an output-only, SGF-based, damage detection method in which there is no need to determine and monitor the dynamic modal properties to locate and quantify the structural damage. Additionally, a new, energy-based DI is developed to locate the damage more accurately. The results of the new DI and the DI reported in previous works [15,16] are also compared with each other. To verify the developed method, numerical and experimental tests of a five-floor building were designed and built in the laboratory of Qingdao University of Technology. These tests could be considered as a simplified building model of a real building. The tests were subjected to white noise, and the acceleration responses were recorded at each floor. The results show that the developed method can accurately locate the structural damage in different damage scenarios. Since the developed method does not need to determine and monitor the dynamic modal properties, it can be categorized as an online and quick damage detection method. The flowchart of the proposed method is shown in Figure 1.

2. Savitzky–Golay Filter

For each observation of a signal at point t , the SGF finds a polynomial curve that fits the M observations around the signal at point t . This process is then repeated for all other observations, resulting in a unique polynomial curve at each point along the signal. The centers of the determined polynomial curves are then considered as the trend line of the signal. The full details of how this filter determines a trend line can be found in [33,34,35,36]. To calculate a trend line using the SGF, the span of the SGF, M , and the order of the polynomial function need to be specified in advance. Kordestani and Zhang [16] numerically proved that the trend line calculated using an adjusted SGF behaves similar to the first vibration mode of a simply supported bridge. They used a polynomial function with order 3 and chose the SGF span, M , based on the first natural frequency to adjust the SGF. In this paper, the same suggestion for adjusting the SGF is used to determine the structural acceleration’s trend lines and localize the damage in a building excited by a shake table.

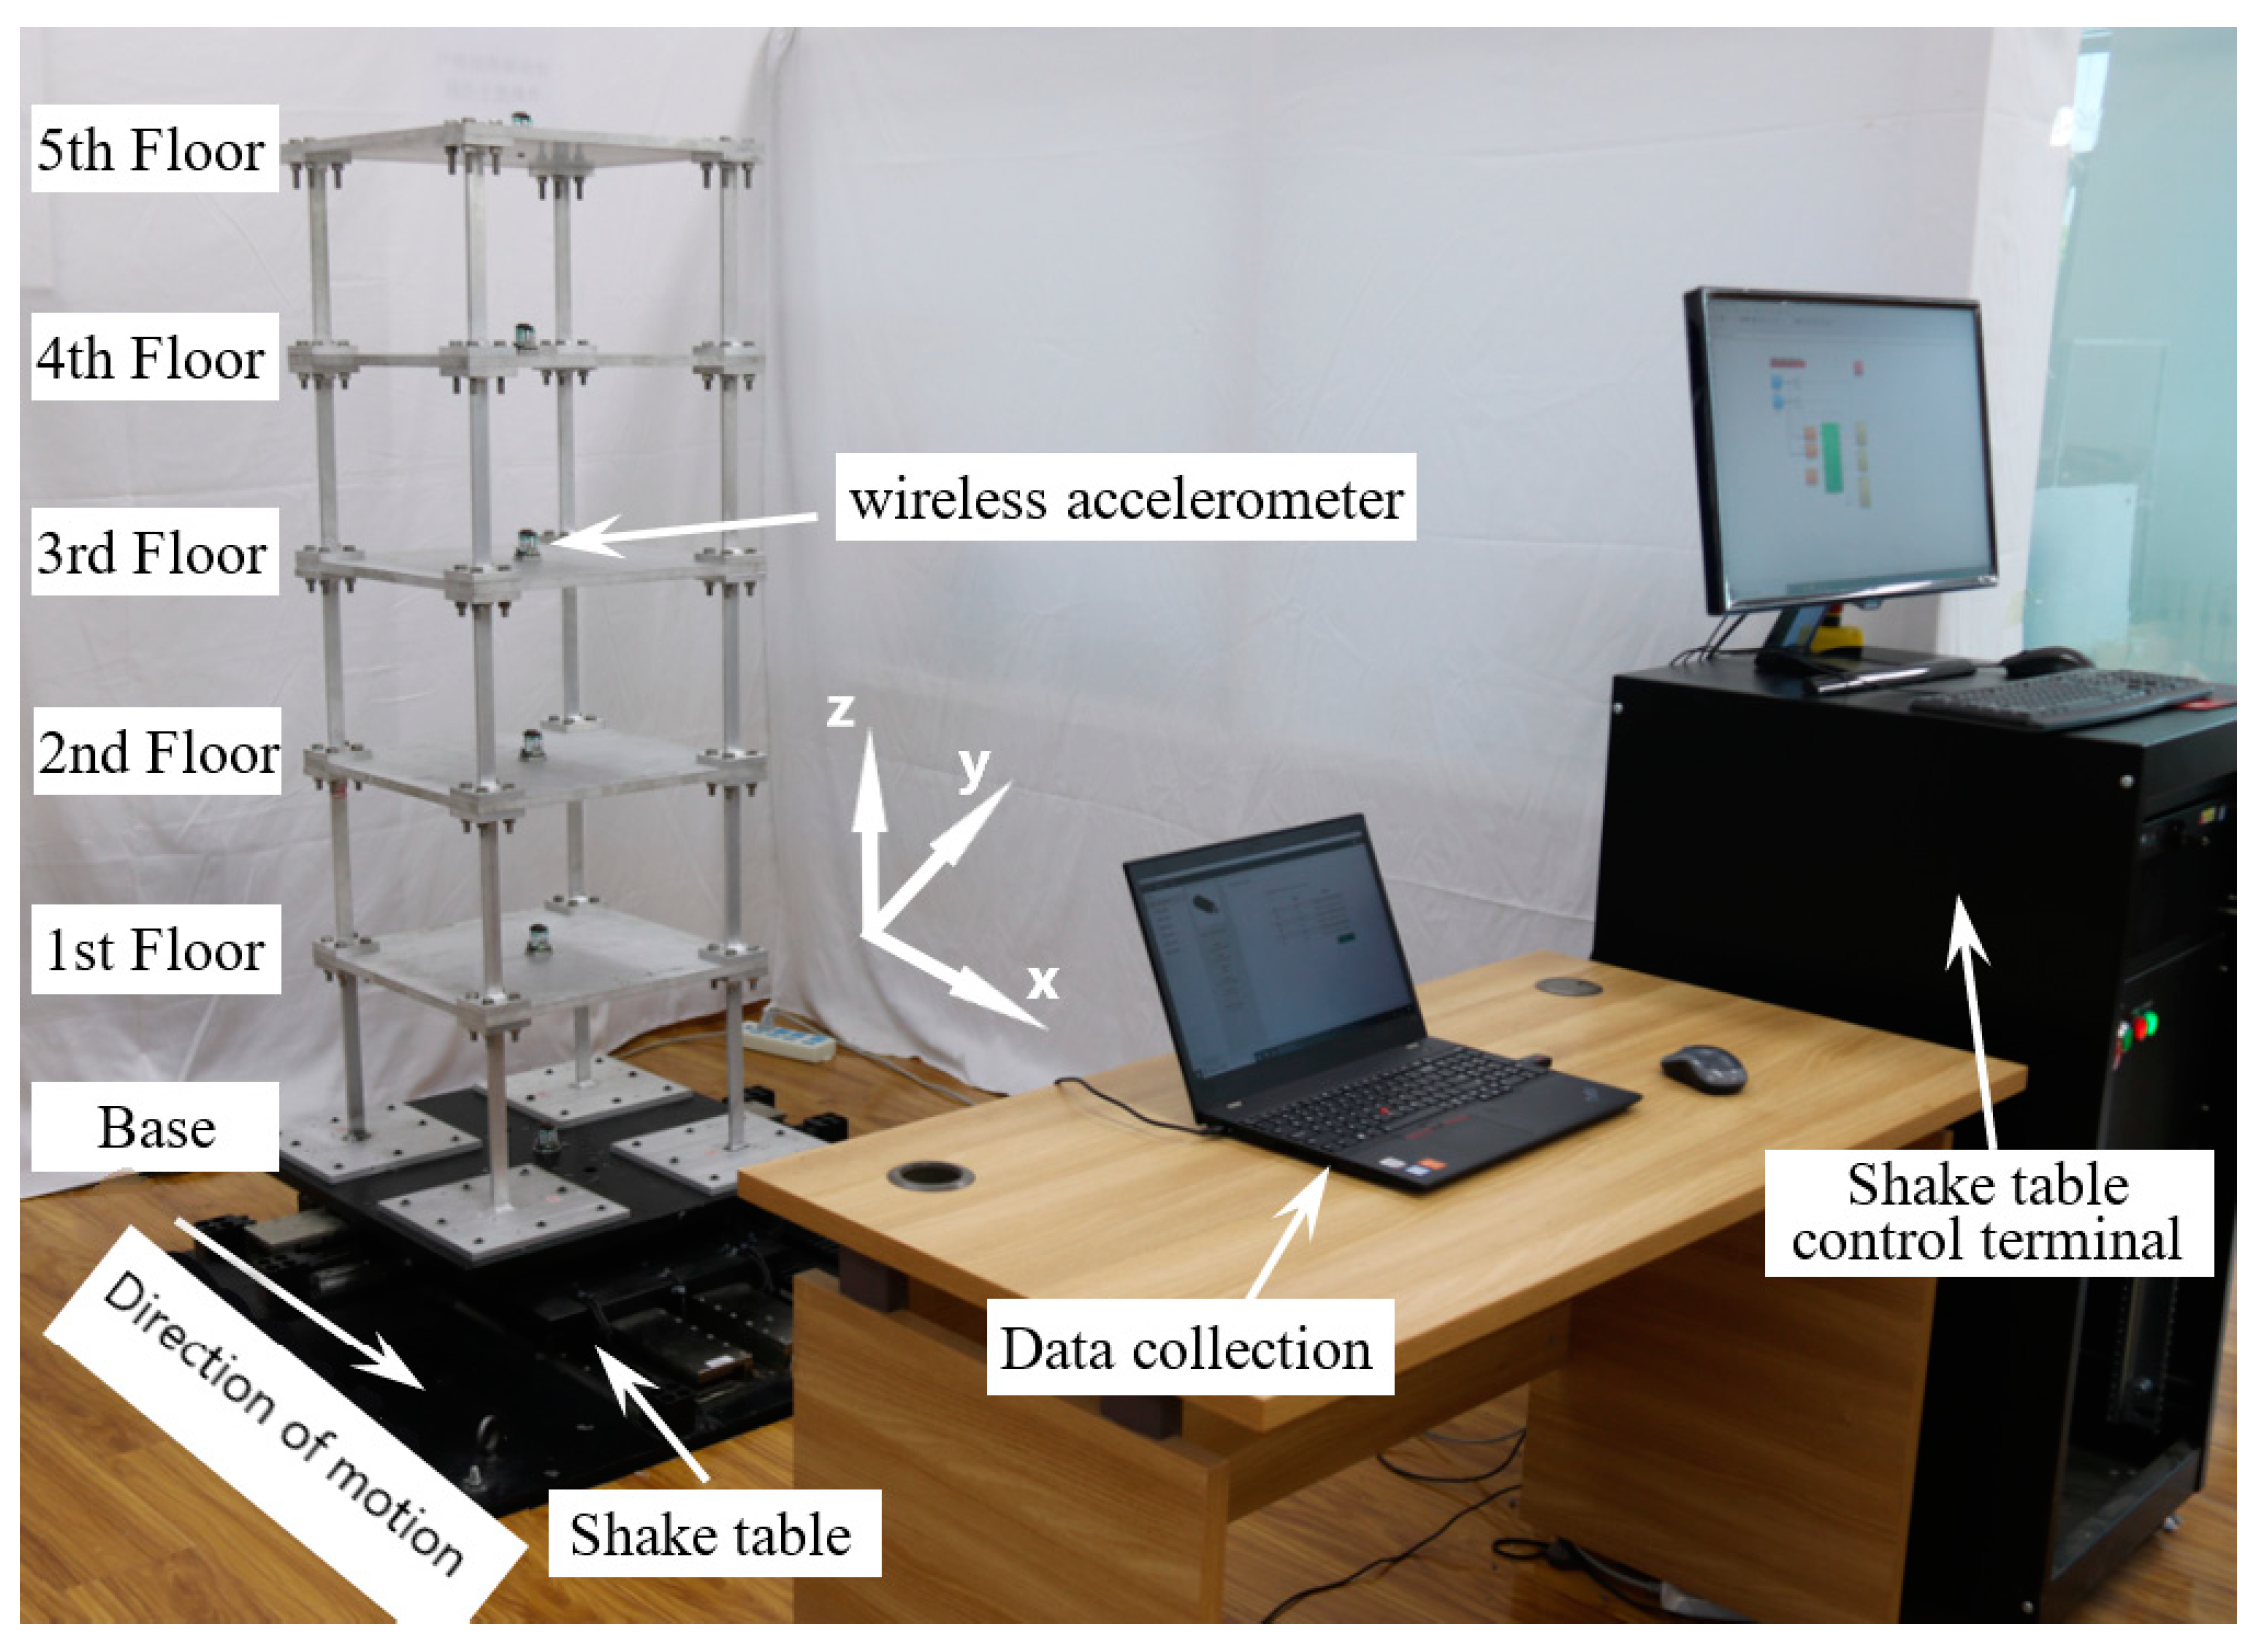
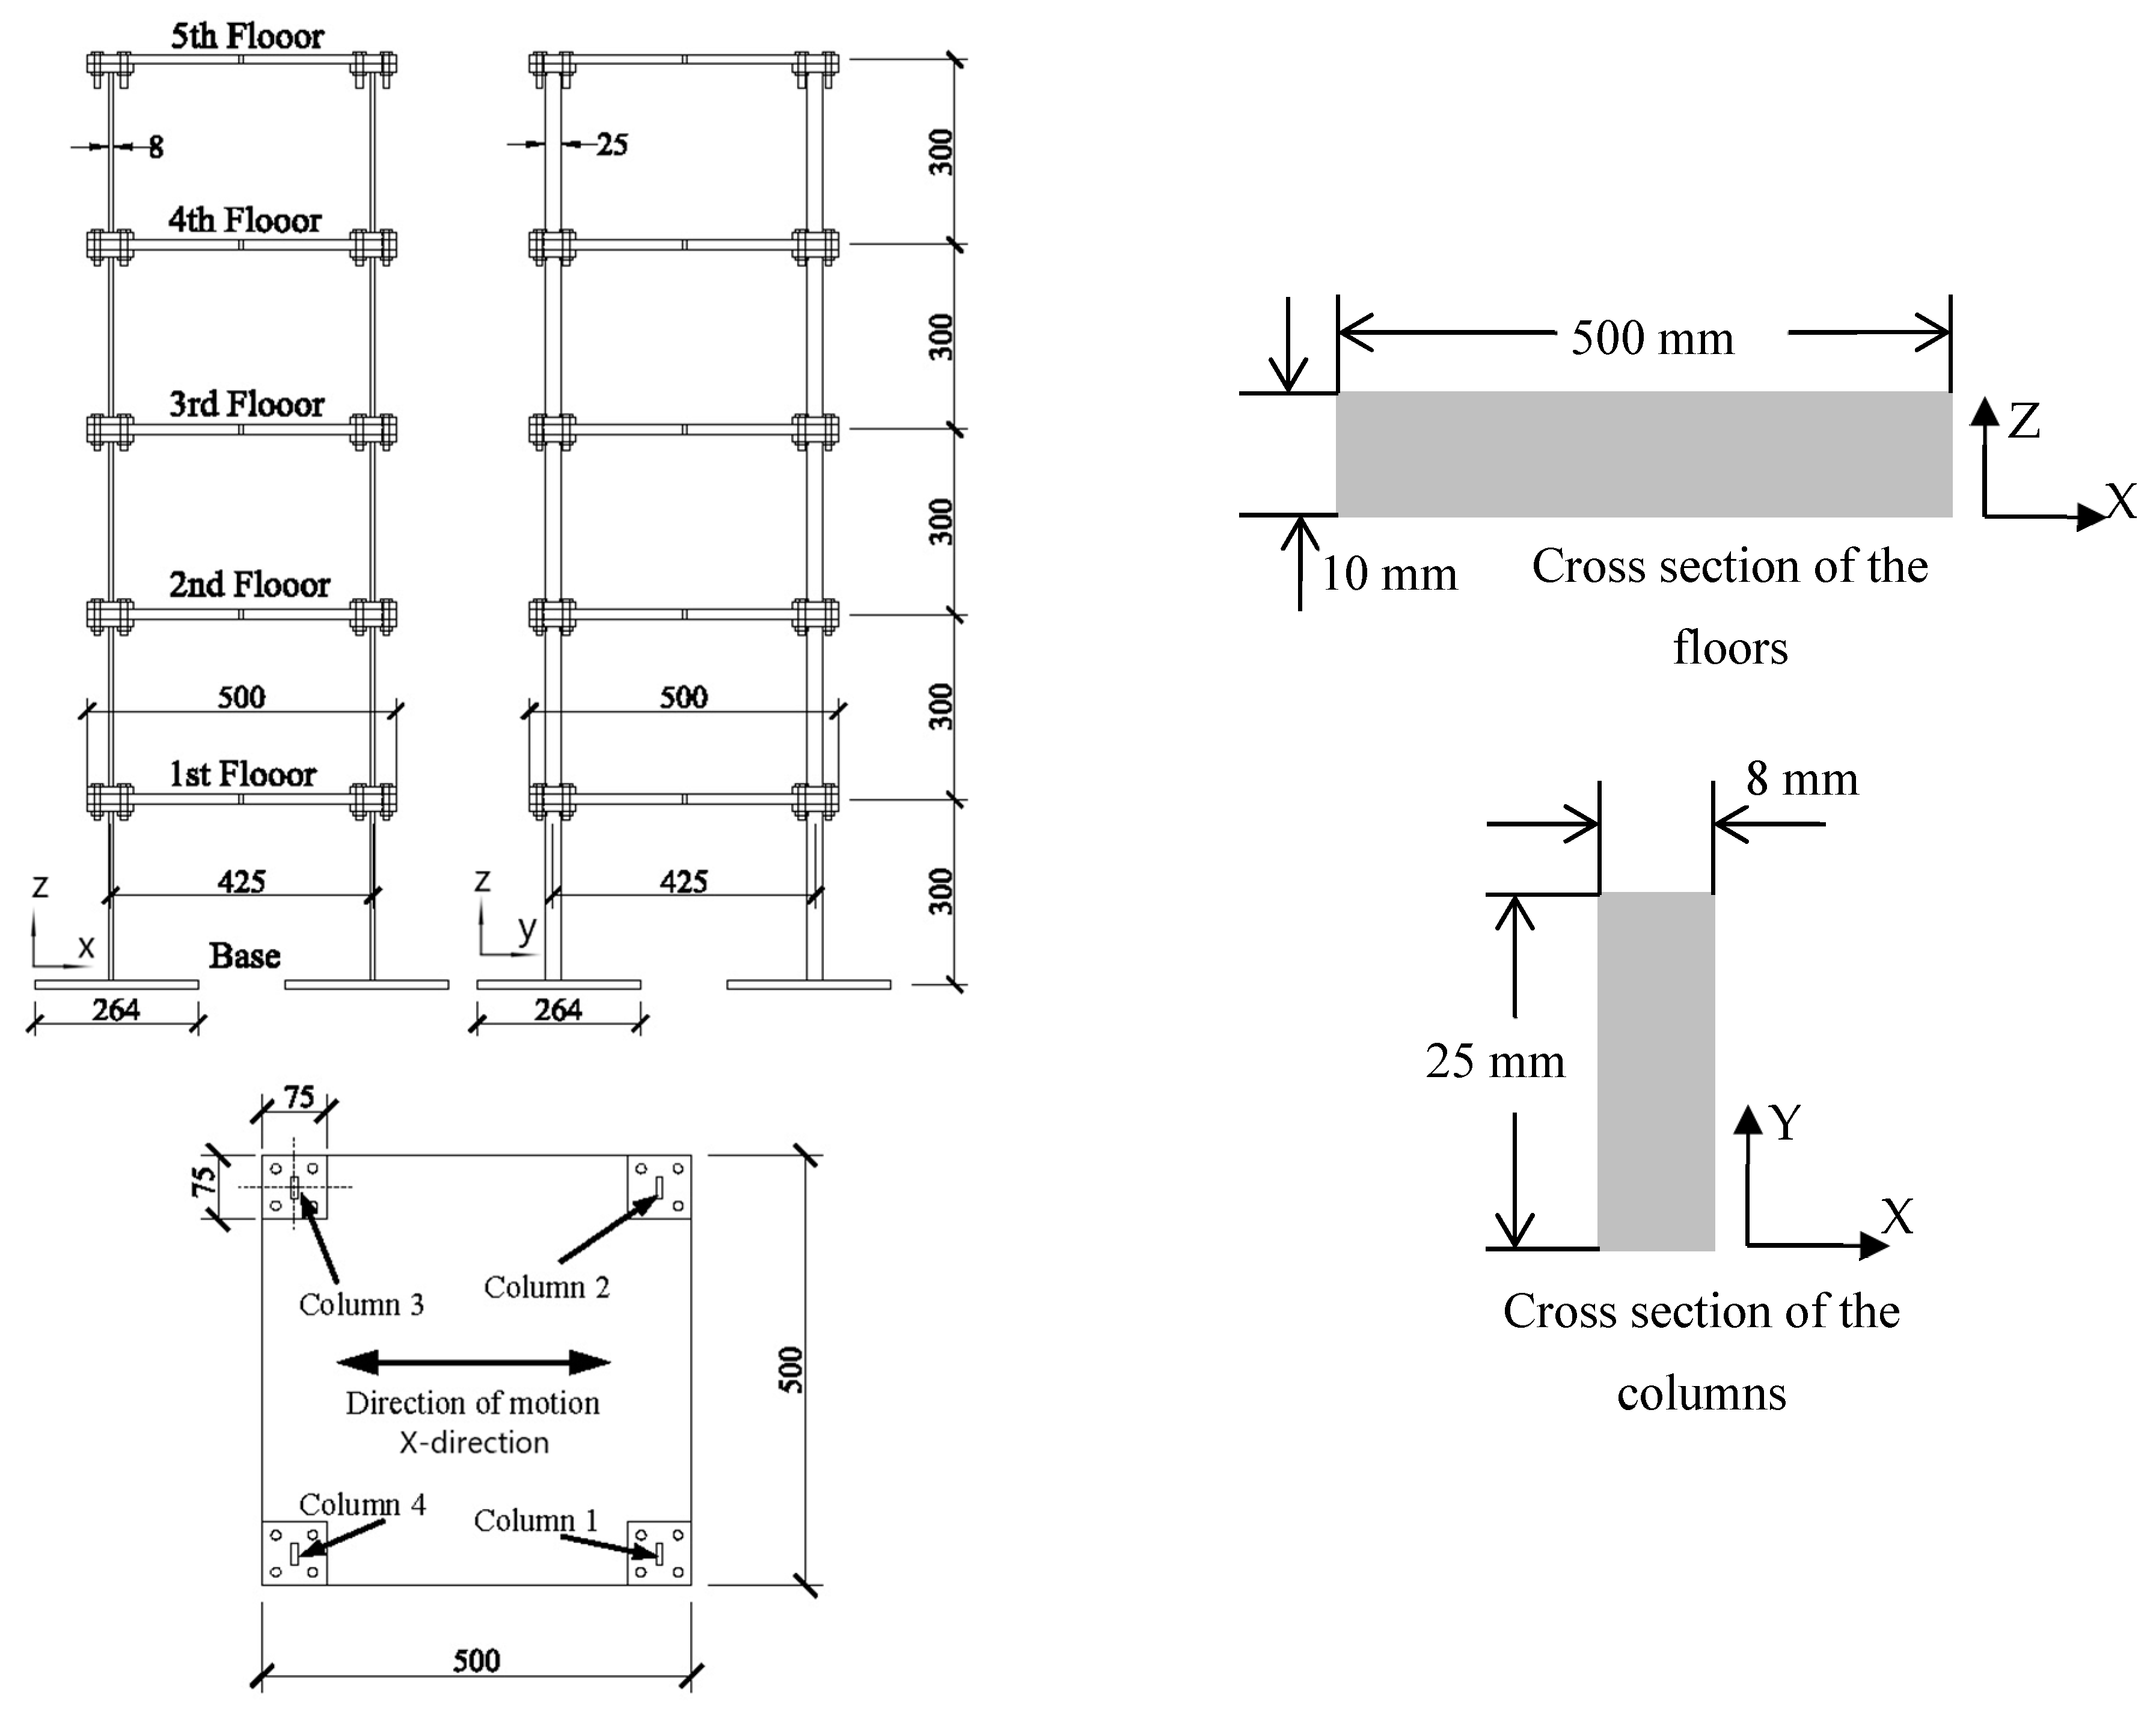
3. Experimental Model and Numerical Simulation of a Five-Floor Building

The ultimate goal of damage detection methods is to use them in real practice. However, in the initial step of proposing a new damage detection method, it should be checked and verified using numerical and experimental examples. These kinds of examples are designed to verify the methods in controlled situations. In real practice, the boundary conditions and excitations cannot be fully controlled; therefore, there are a lot of uncertainties that need to be considered. In this study, only numerical and experimental tests of an aluminum moment frame are used to verify the proposed method. Since the damage is modeled through the replacement of columns with new columns with a lower section area, using an aluminum moment frame is a suitable way to prepare an easy-to-work test model.
A building with five floors was designed and built in the laboratory of Qingdao University of Technology, China. The building was excited using a shake table as shown in Figure 2. The building was made using alloy material. The columns and floor dimensions were 25 × 8 and 500 × 500 mm. In order to make a rigid connection between the columns and floors, aluminum plates with dimensions of 75 × 75 mm and a thickness of 10 mm were welded to both ends of each column. Then, using four bolts and nuts, a rigid connection was achieved between the columns and floors as shown in Figure 3. In this test, we used bolts with a diameter of 7 mm. The position of the bolts and columns are schematically shown in Figure 3. Moreover, the columns of the building were rigidly fixed to the shake table (Quanser XY shake table III). To model the seismic load, the white noise was considered as input excitation and exerted on the building through the shake table in the x-direction. More details of the building are shown in Figure 3. Wireless accelerometers (model G-Link 200 from Lord, Microstrain® Sensing Systems, Williston VT, USA), as shown in Figure 4, were installed at the center of each floor to provide the x-direction acceleration response at a sampling frequency of 512 Hz. The full details of this accelerometer can be found in [37]. This building was also numerically studied using ABAQUS software 6.14 in this paper. An alloy material with a linear behavior was considered in this numerical simulation in which the Young’s modulus, Poisson’s ratio, and density were 72.8 GPa, 0.34, and 2800 kg/m3, respectively. Moreover, the Rayleigh damping was also set to alpha = 0.546. During the numerical analysis, the acceleration data were obtained at each floor with a sampling frequency of 512 Hz.
Lateral loads such as those generated by wind or earthquake will excite buildings in the lateral direction. In this situation, considering horizontal members such as floors as rigid elements, the vertical members such as columns and walls must resist these lateral forces. Therefore, in terms of having a lateral excitation, mostly the vertical members are vulnerable to receiving structural damage. Hence, the columns in this paper were modeled as damaged members. The structural damage was introduced to the building by changing the size of the columns. Therefore, to model the damage in a column, a new column with lower section area was used. Table 1 shows six column sections used in this study. Table 2 shows twenty-one damage scenarios considered for this paper (the first scenario had no damage (baseline)).

4. Results

Some of the natural frequencies calculated using numerical simulation are shown in Figure 5. Because of the laboratory limitations, the shake table used for this experimental test was not able to provide an excitation with a frequency higher than 10 Hz. Since only the first natural frequency of the building is less than 10 Hz, the experimental acceleration data recorded at each floor mostly show the first natural frequency.
For the sake of brevity, the experimental results are fully reported in this paper and the numerical results are only presented for cases in which the experimental results did not show enough accuracy, i.e., in those scenarios in which the level of damage is so small so that the noise available in the experimental test hides the effect of damage on the structure. For simplicity, the experimental results are called “results”, and for cases in which the numerical results are shown, the expression “numerical results” is used to point to the numerical results.

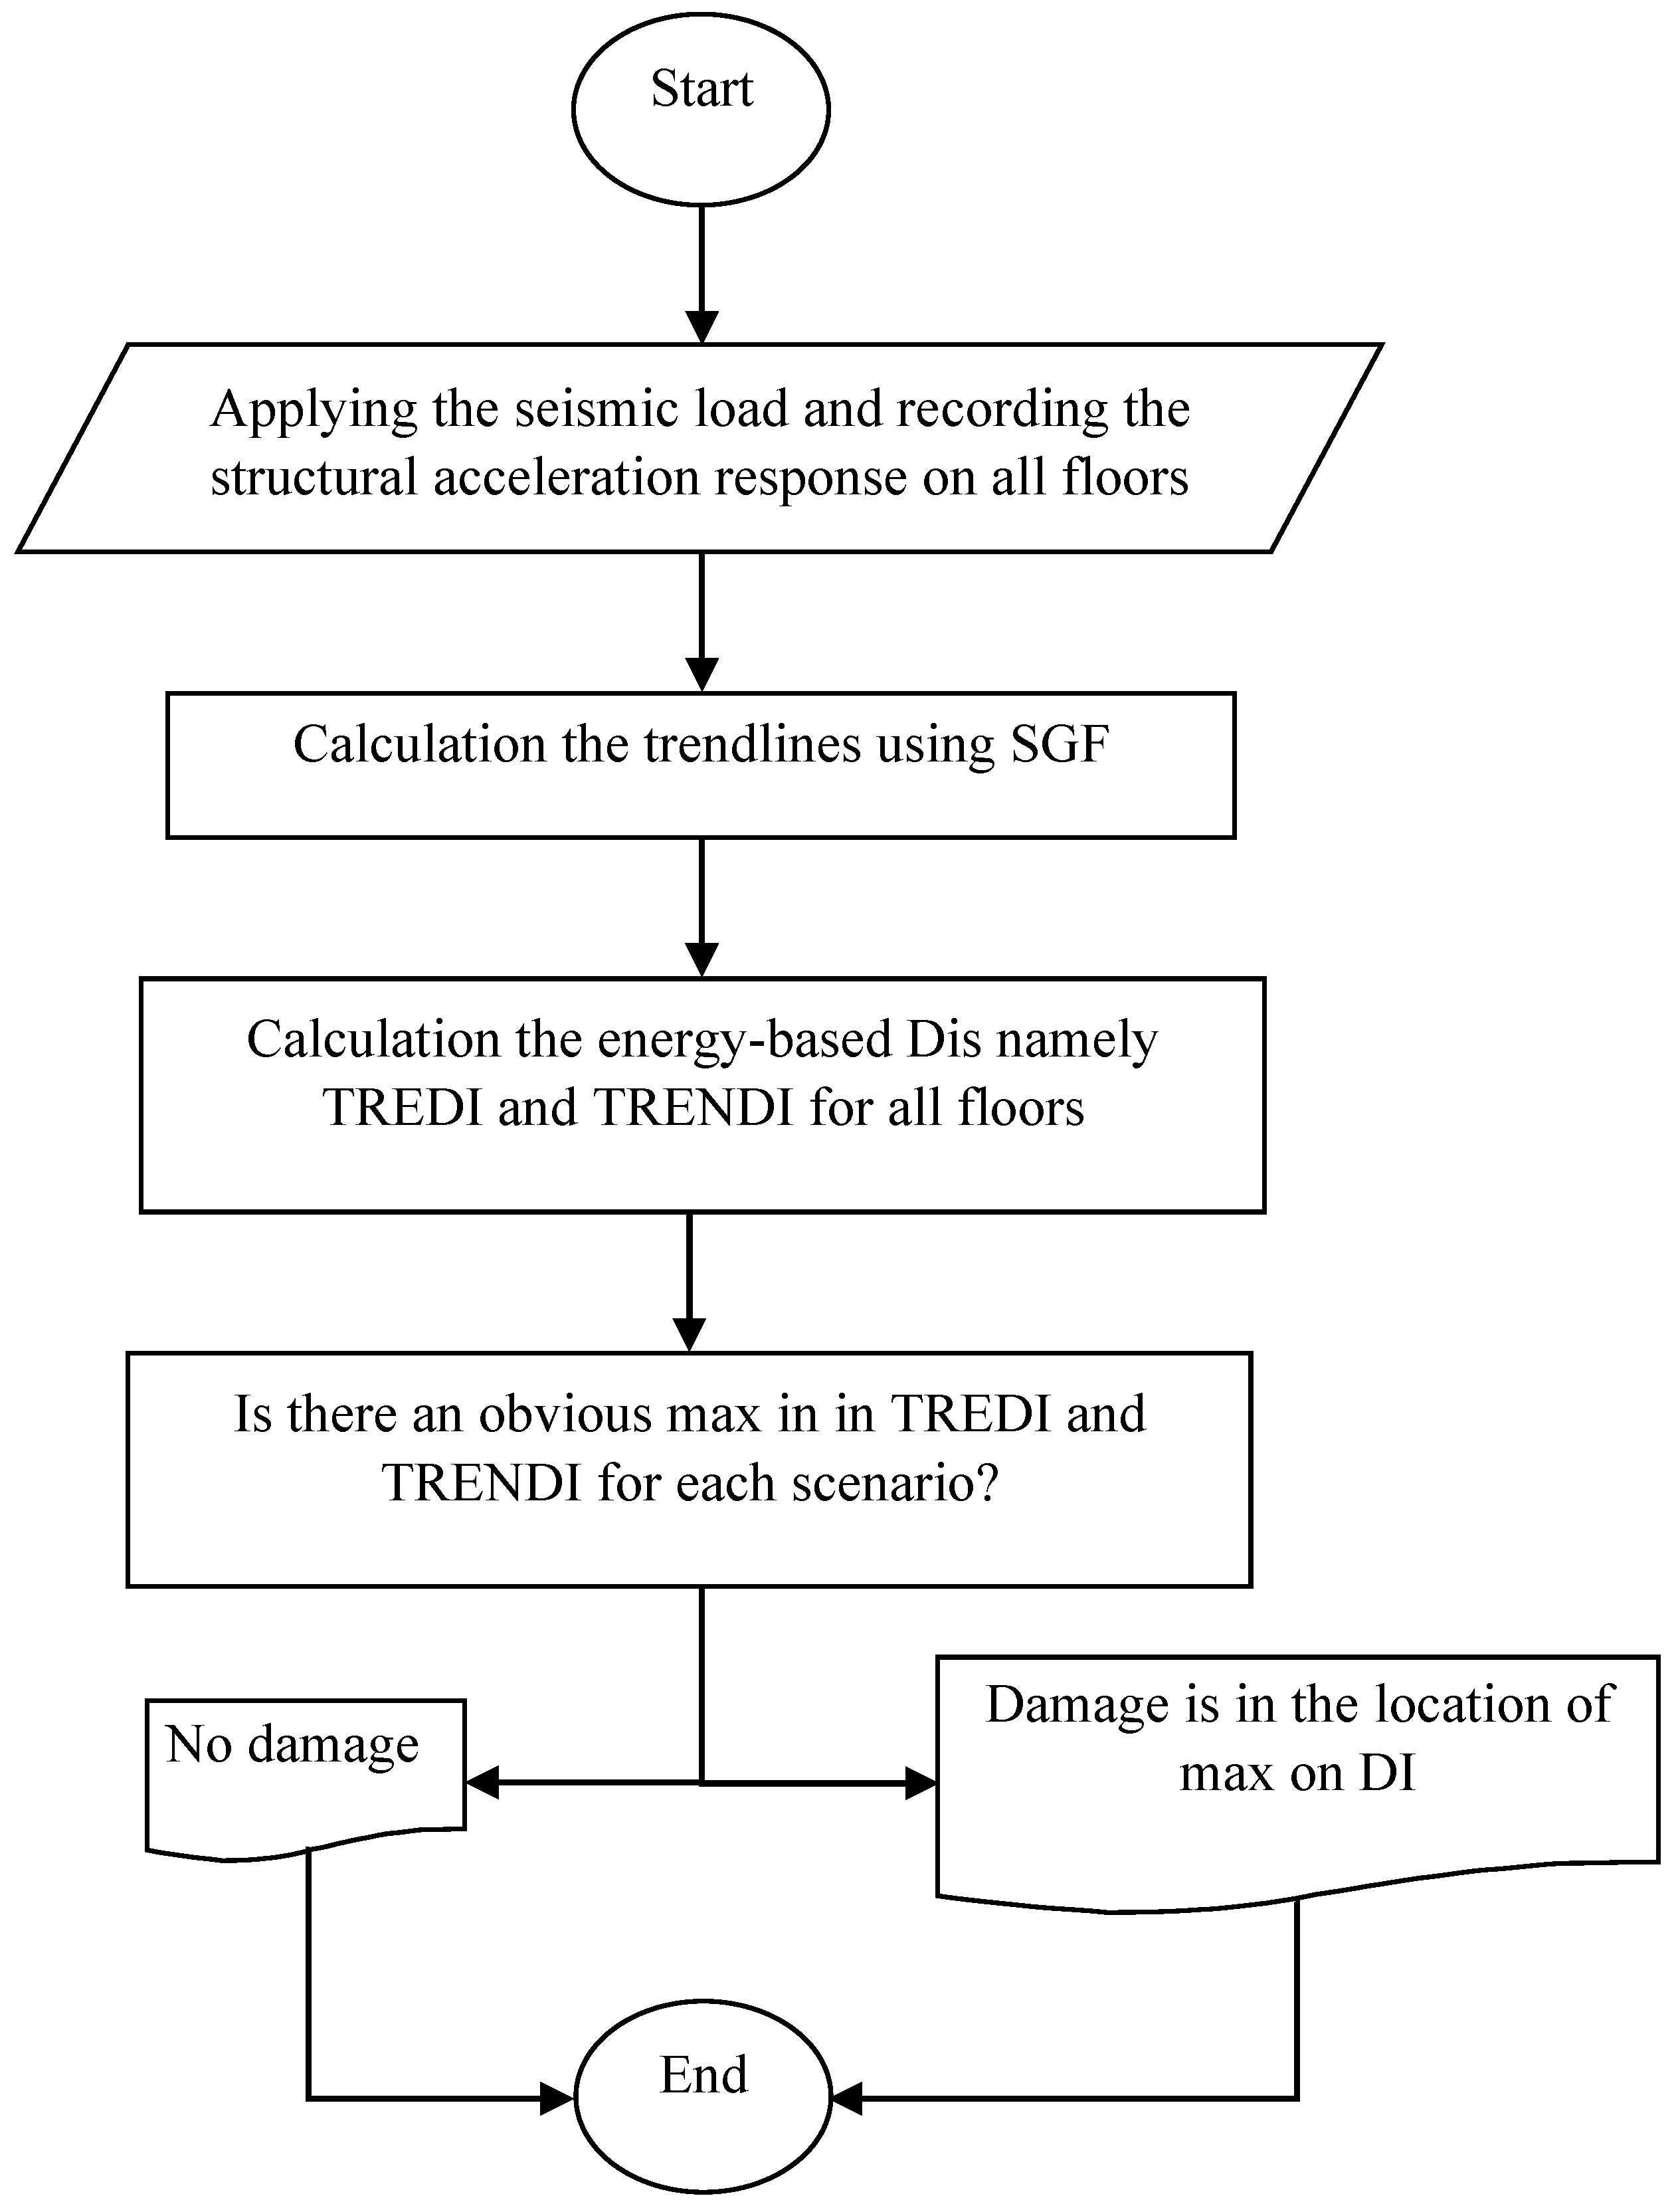
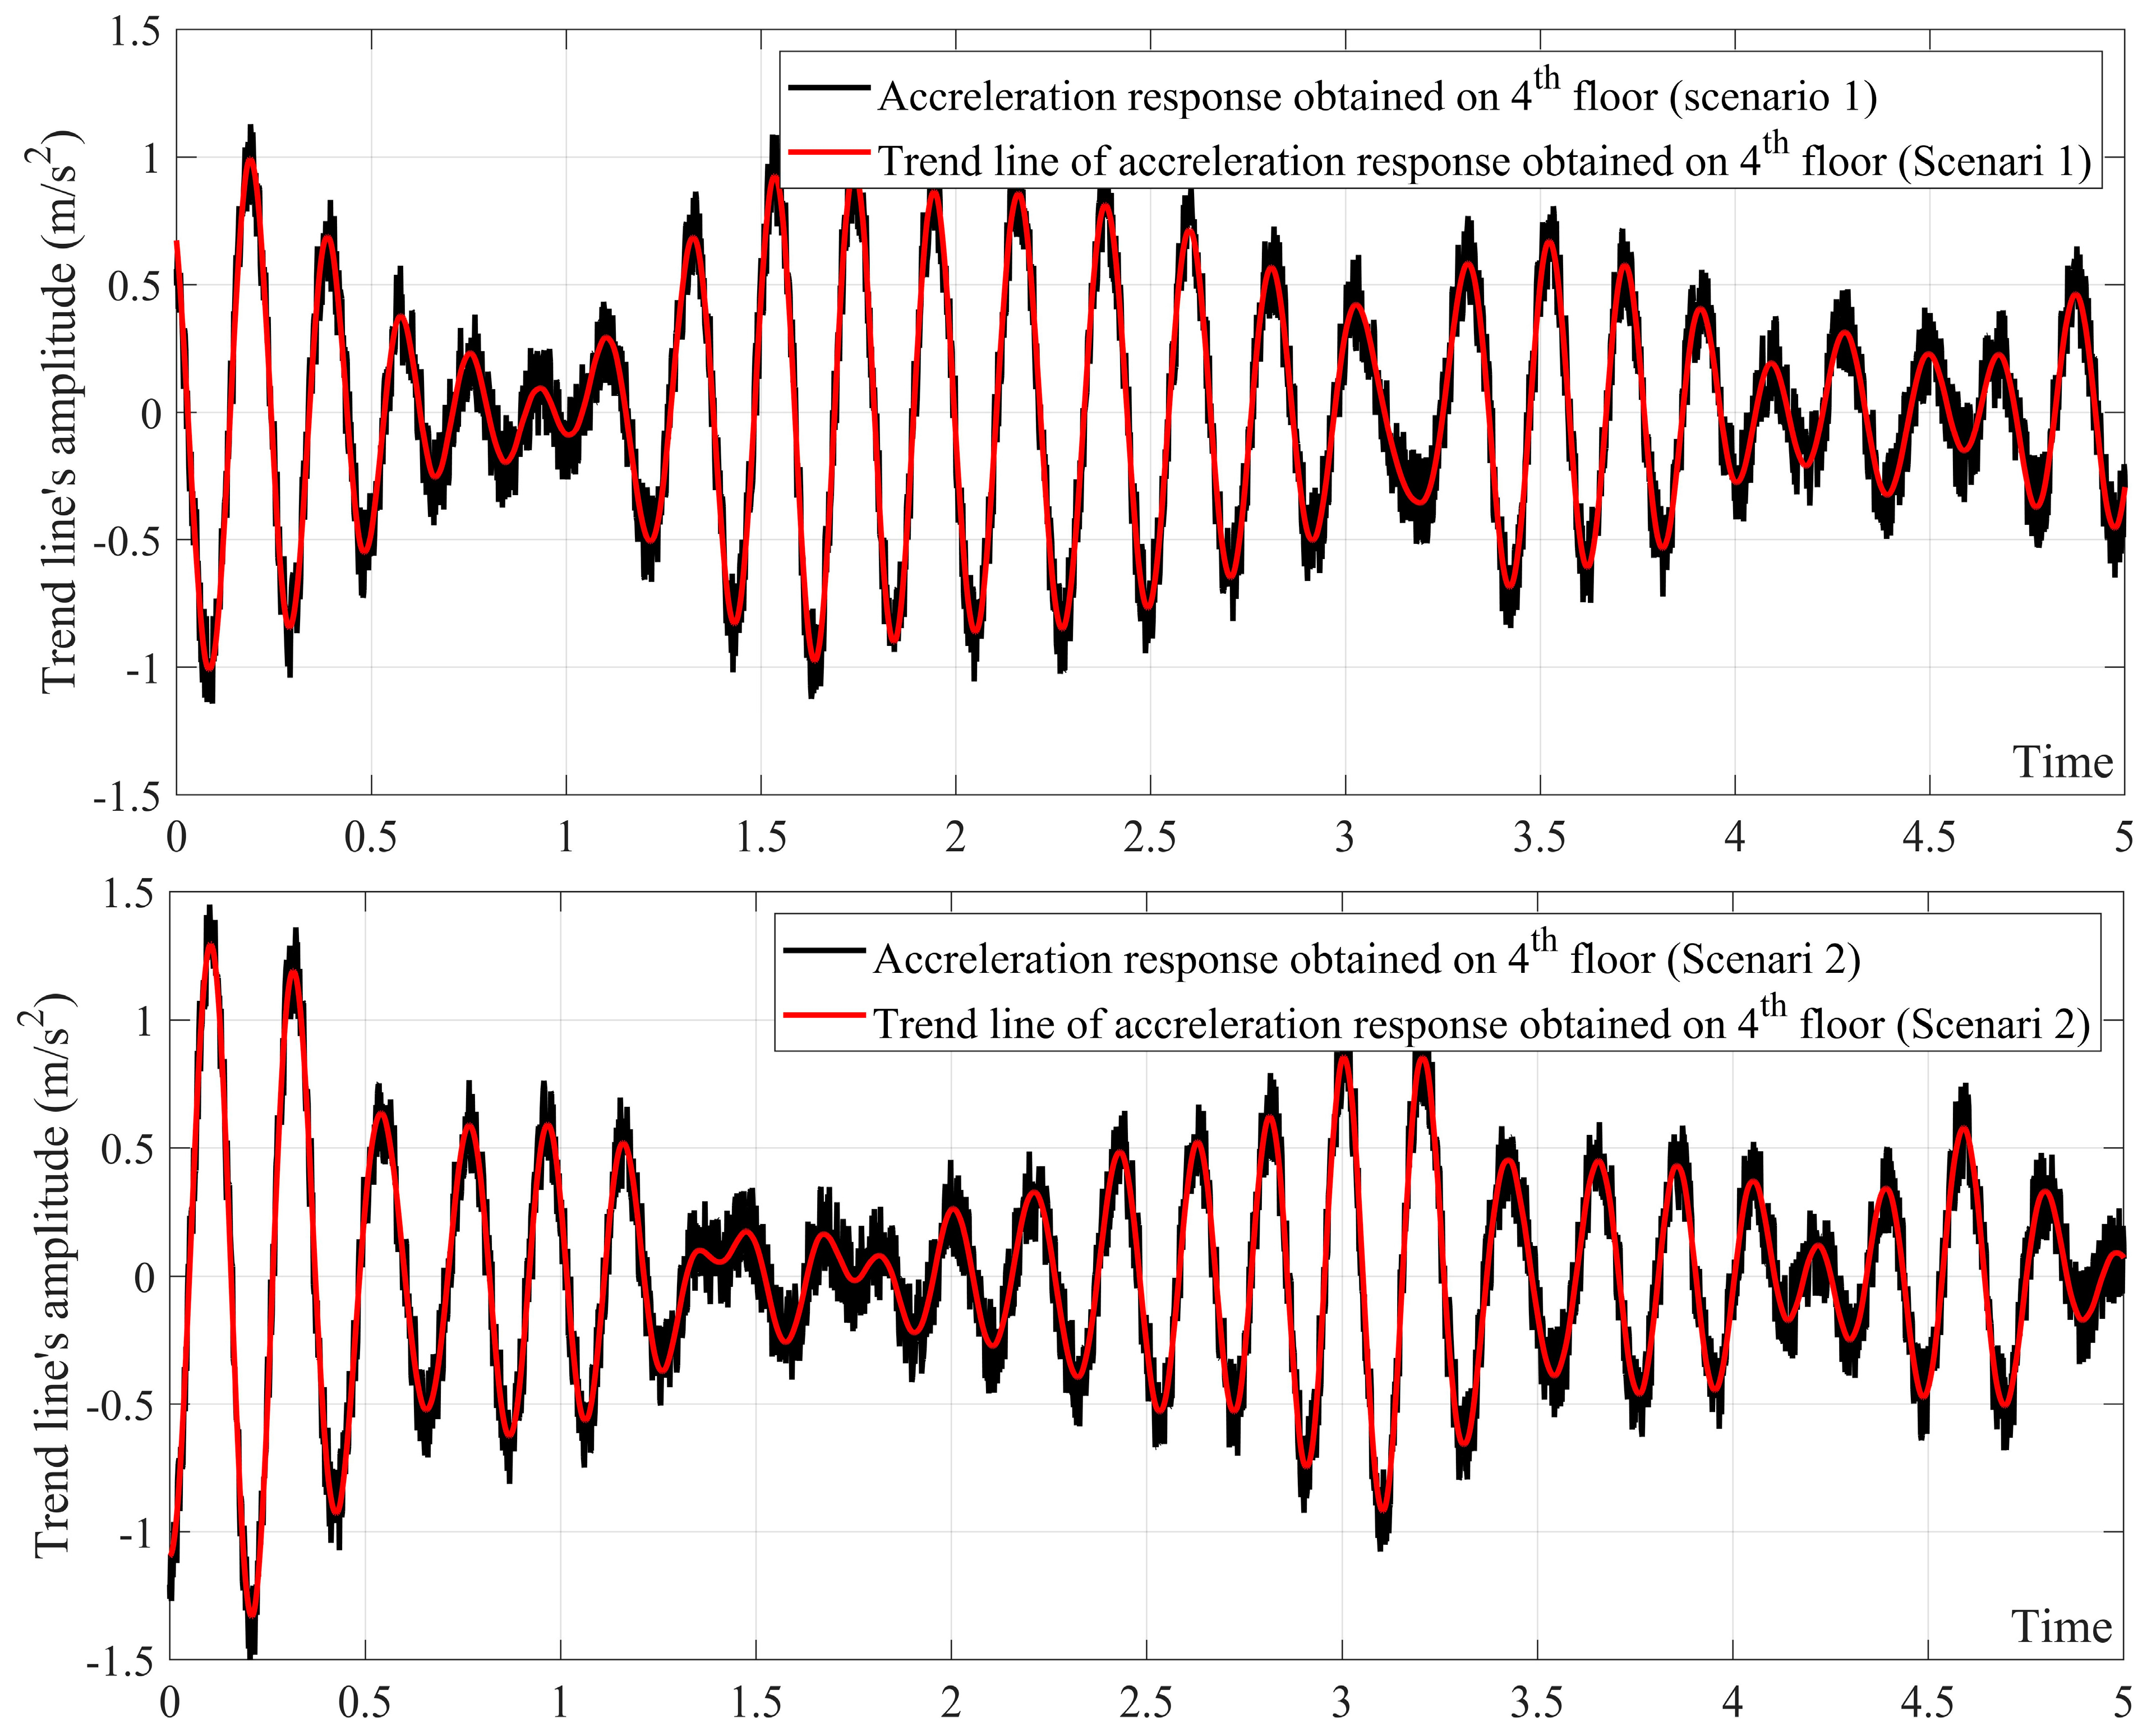
4.1. Applying SGF to All Acceleration Responses

As mentioned above, a set of acceleration responses were recorded on each floor at a sampling frequency of 512 Hz for all scenarios. The first natural frequency of the building was 4.9 Hz. As explained in [15,16], the suitable span for the SGF in this study is “sampling frequency/first natural frequency” namely: 512/4.9 105. Therefore, the SGF was considered with an order of 3 and a span of 105. After applying the SGF to all acceleration responses, the resultant trend lines are expected to behave only similar to the first natural frequency of the building as shown in Figure 6. Figure 6 only shows 5 s of the trend line of the acceleration response obtained on the fourth floor for scenarios 1 and 2.

4.2. Energy-Based Damage Indices

The use of dynamic modal parameters such as the natural frequency of the structure as a DI is well studied by many researchers. However, the limitations of dynamic-modal-parameter-based DI in locating the damage have also been addressed [38,39,40]. Since structural damage is a local physical phenomenon, it may not cause enough change in the general response of a structure. The dynamic modal parameters are calculated using the general structural response; therefore, they are not very sensitive to local damage. Additionally, in order to employ a dynamic-modal-parameter-based DI, these modal parameters have to be determined in advance, which is a time-consuming task. Therefore, the use of non-dynamic-modal-parameter-based DIs such as an energy-based DI is addressed in some studies [10,14,15,16,18]. The energy-based DI defined in [16] is briefly expressed in this paper. The energy of the signal can be calculated using the following:
E = T r 2 d t
where T r is the trend line calculated using the SGF for the acceleration response of the building. E is the energy of the trend line. Since the amplitudes of acceleration responses obtained on different floors of the building are not the same, the amplitude of the trend lines and the energy calculated for each trend line are also different. Therefore, the energy for each scenario should be normalized as follows:
γ i = E I N i E I N ¯
where E I N i is the trend line’s energy for an intact building on floor i and E I N ¯ is the arithmetic mean of E I N i for all floors of the intact building. In Equation (2), γ i is the normalization factor, which is only calculated for all floors of the intact building. The energy-based DI, TREDI, finally, can be expressed as follows:
T R E D I i = E i E ¯ × 100 γ i
where E i and E ¯ are the energy of the trend line for a damaged building on floor i and the arithmetic mean of E i for all floors of the damaged building. If there is no damage, the T R E D I i should normalize all the energies to 100.
A new DI is also proposed here in which the way of normalization of the energy is changed. For simplicity, the new energy-based DI is called TRENDI in this paper. To this end, the new normalization factor, N γ i , for each floor is determined as follows:
N E I N i = E I N i E I N i 1 , E I N 0 = 0
N γ i = N E I N i N E I N ¯
where N E I N i is the absolute difference in the energy of the trend line calculated from the structural acceleration response between adjacent floors of the intact building. In Equation (4), there is no floor 0, so the energy of the trend line belongs to floor 0; E I N 0 , is considered as 0. N E I N ¯ is the arithmetic mean of N E I N i for all floors determined without considering E I N 0 . In Equation (5), N γ i is the new normalization factor, which is only calculated for all floors of the intact building. The TRENDI is then calculated as follows:
N E i = E i E i 1 , E 0 = 0
T R E N D I i = N E i N E ¯ × 100 N γ i
where N E i is the difference in energy between two floors of the damaged building. E 0 is considered as zero because there is no floor 0. N E ¯ is the arithmetic mean of N E i for all floors determined without considering E 0 .
The main concept of the energy-based DI is based on the fact that the structural damage changes the distribution of the energy along the building; therefore, the energy-based D I belonging to the damaged floor should give a normalized energy more than 100. Hence, the TREDI and TRENDI increase to their maximum value while approaching the damaged floor.

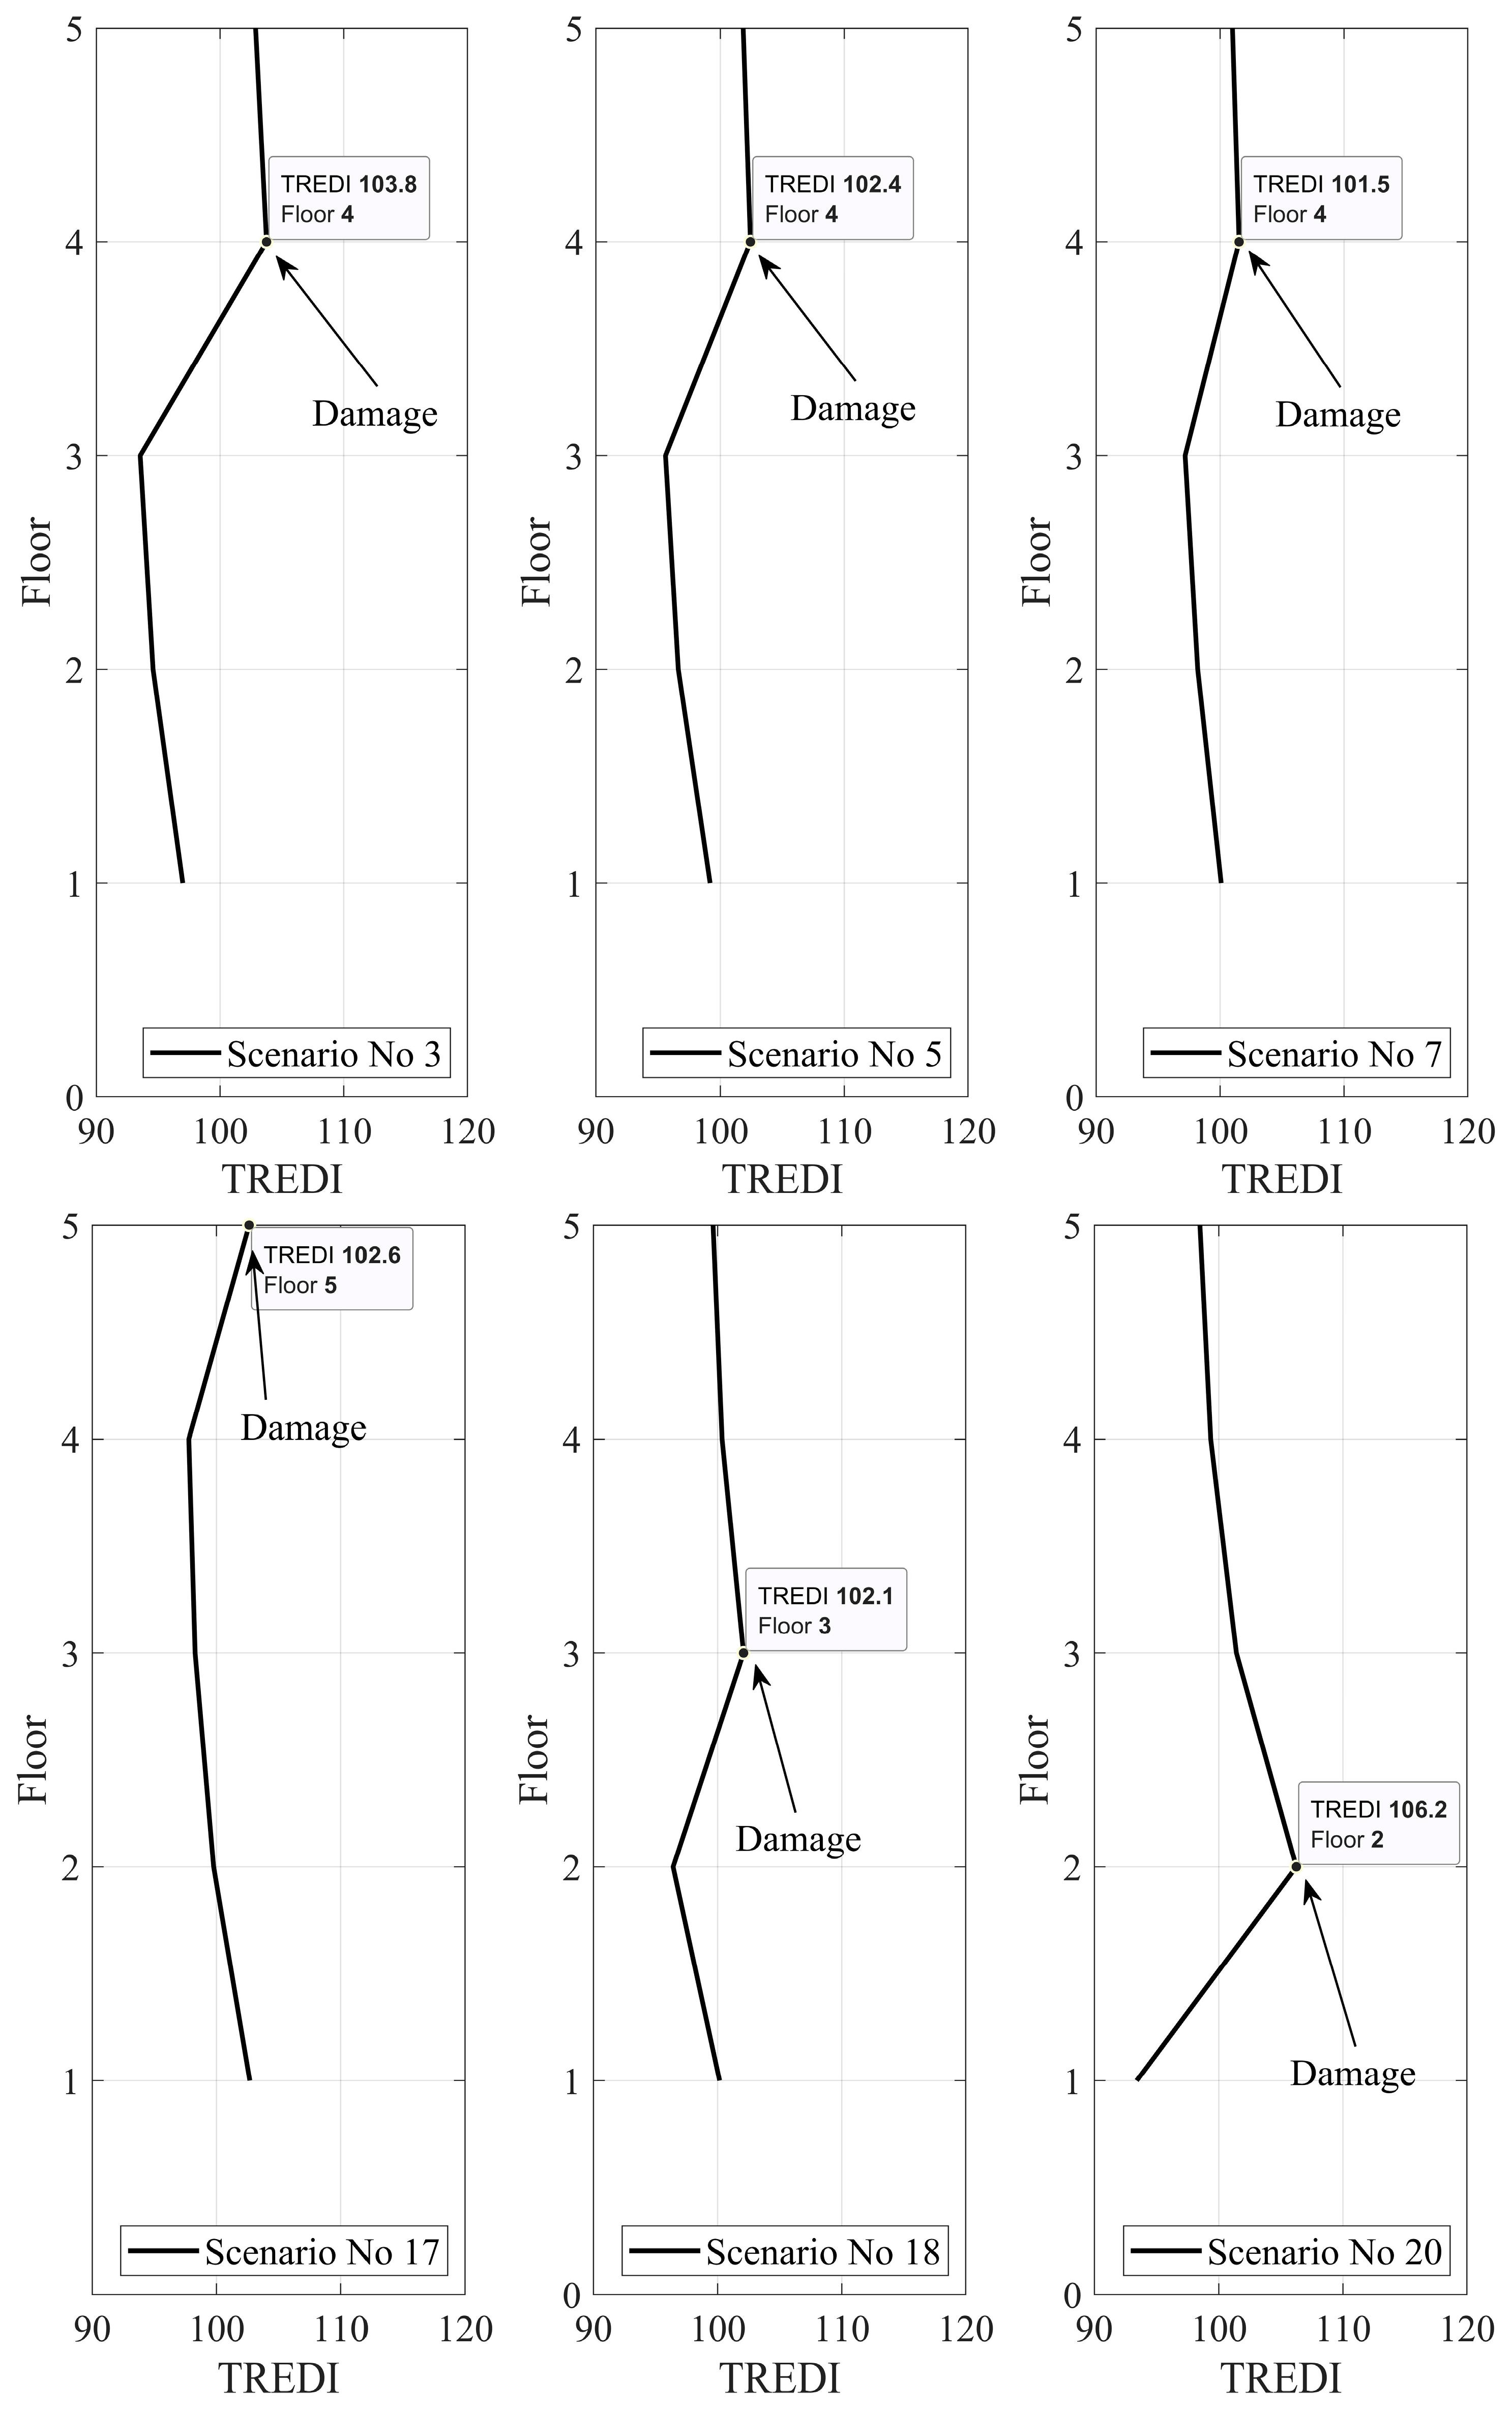
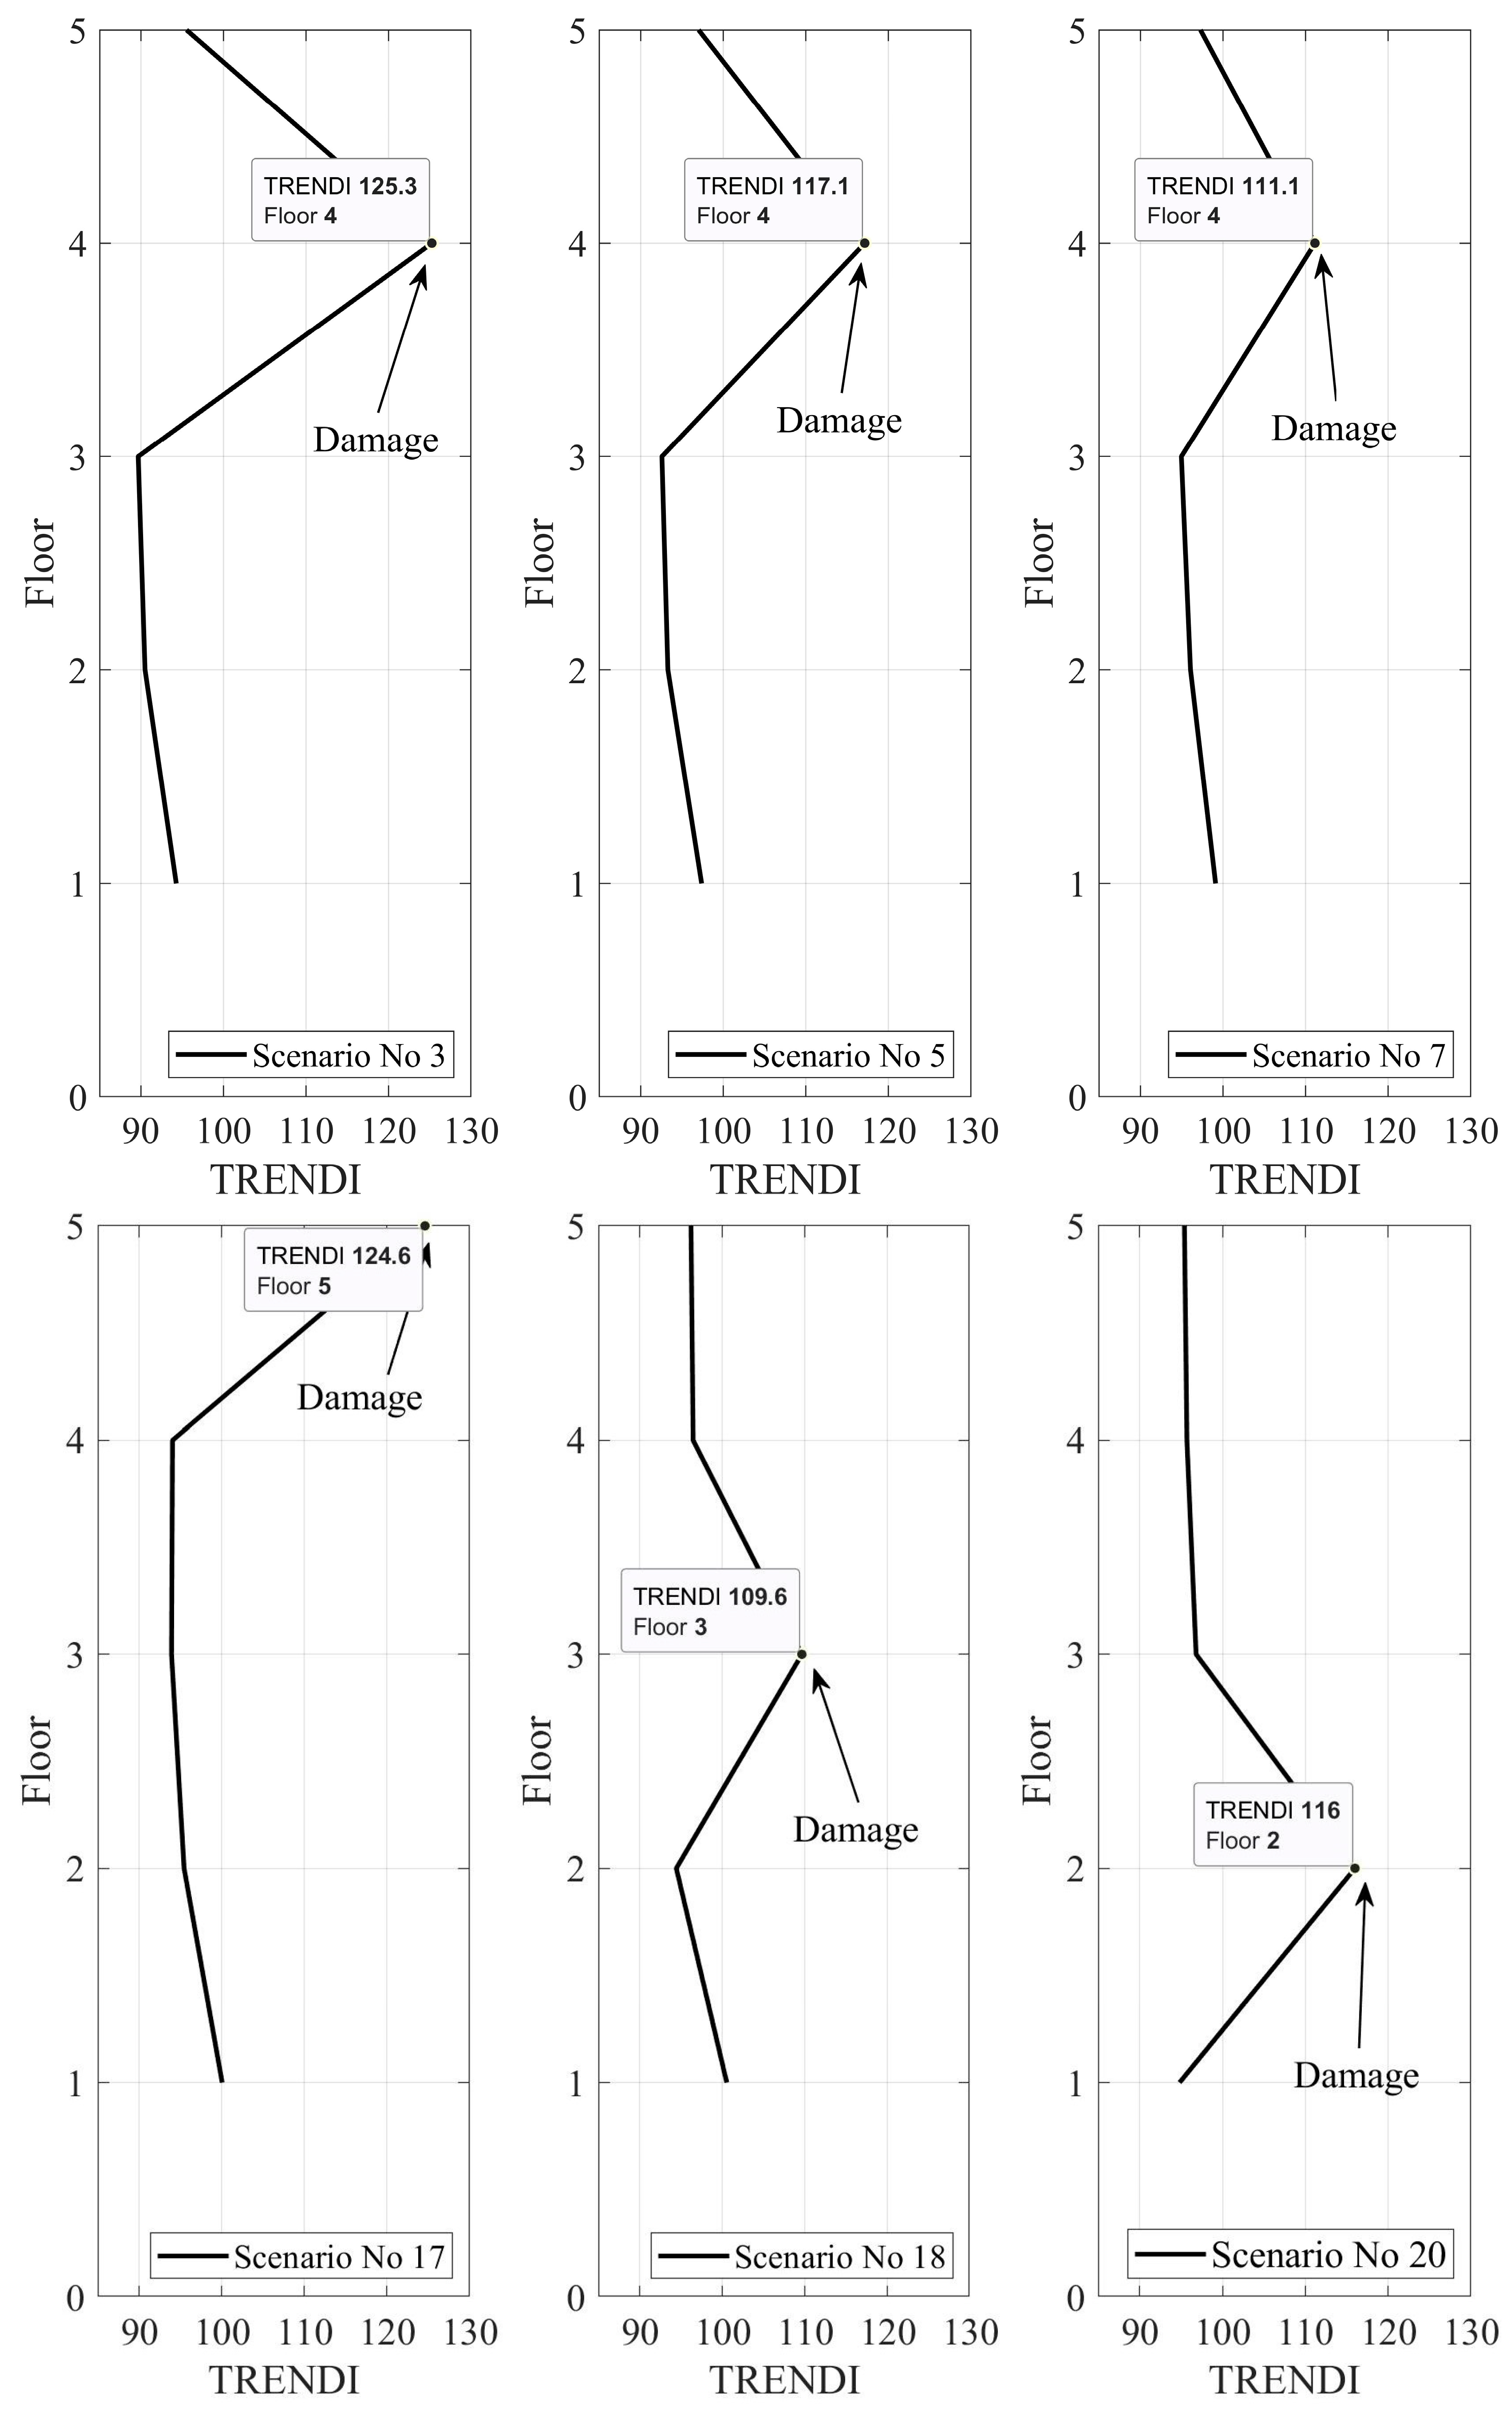
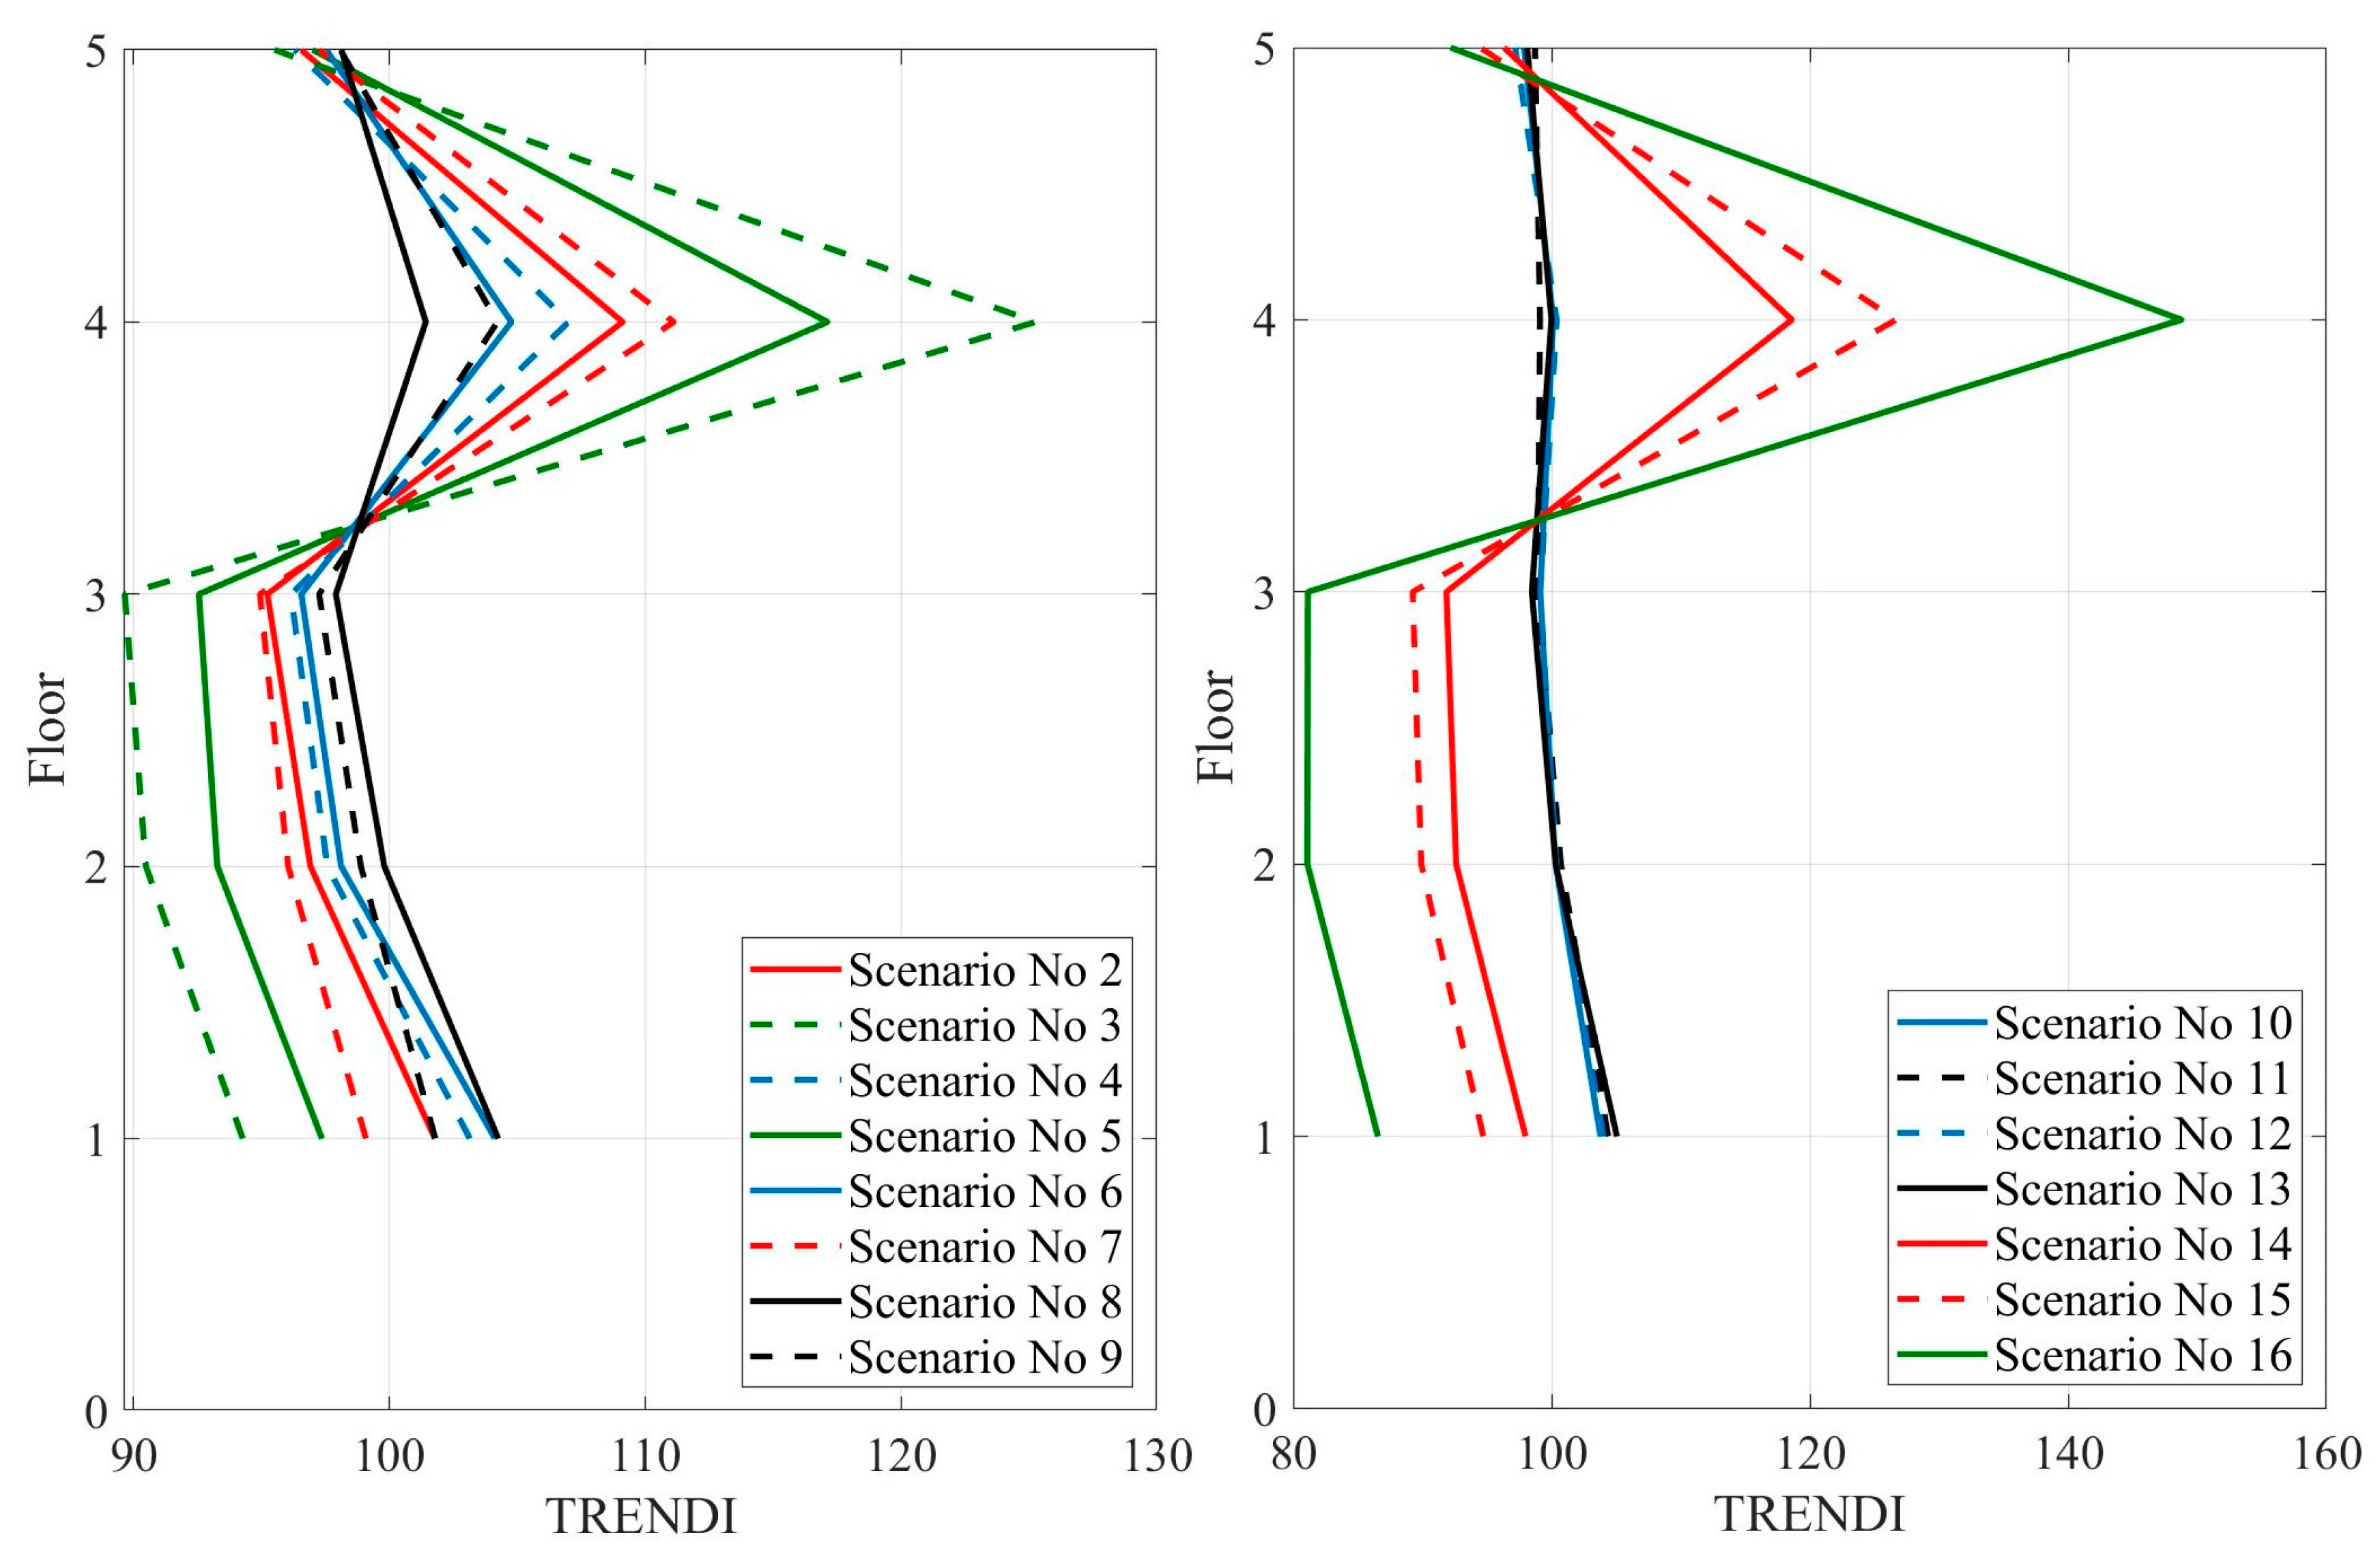
4.3. Damage Localization

In this section, the results of damage localization using TREDI and TRENDI are presented. The damage detected using TREDI and TRENDI for scenarios No. 3, 5, 7, 17, 18, and 20 are shown in Figure 7 and Figure 8 as samples of results.
The TREDIs and TRENDIs in Figure 7 and Figure 8 have the maximum amplitude in the horizontal direction (should be more than 100) at the place of damage. The vertical direction shows the floor number in these two figures. As shown in Figure 7, although the TREDI can accurately locate the damage in scenarios No. 3, 5, 7, 18, and 20, it fails to locate the damage in scenario No. 17. Moreover, a comparison of Figure 8 with Figure 7 shows the location of the damage very clearly. Additionally, the TRENDI can locate the damage in scenario No. 17 also, which shows that it performs better than TREDI.

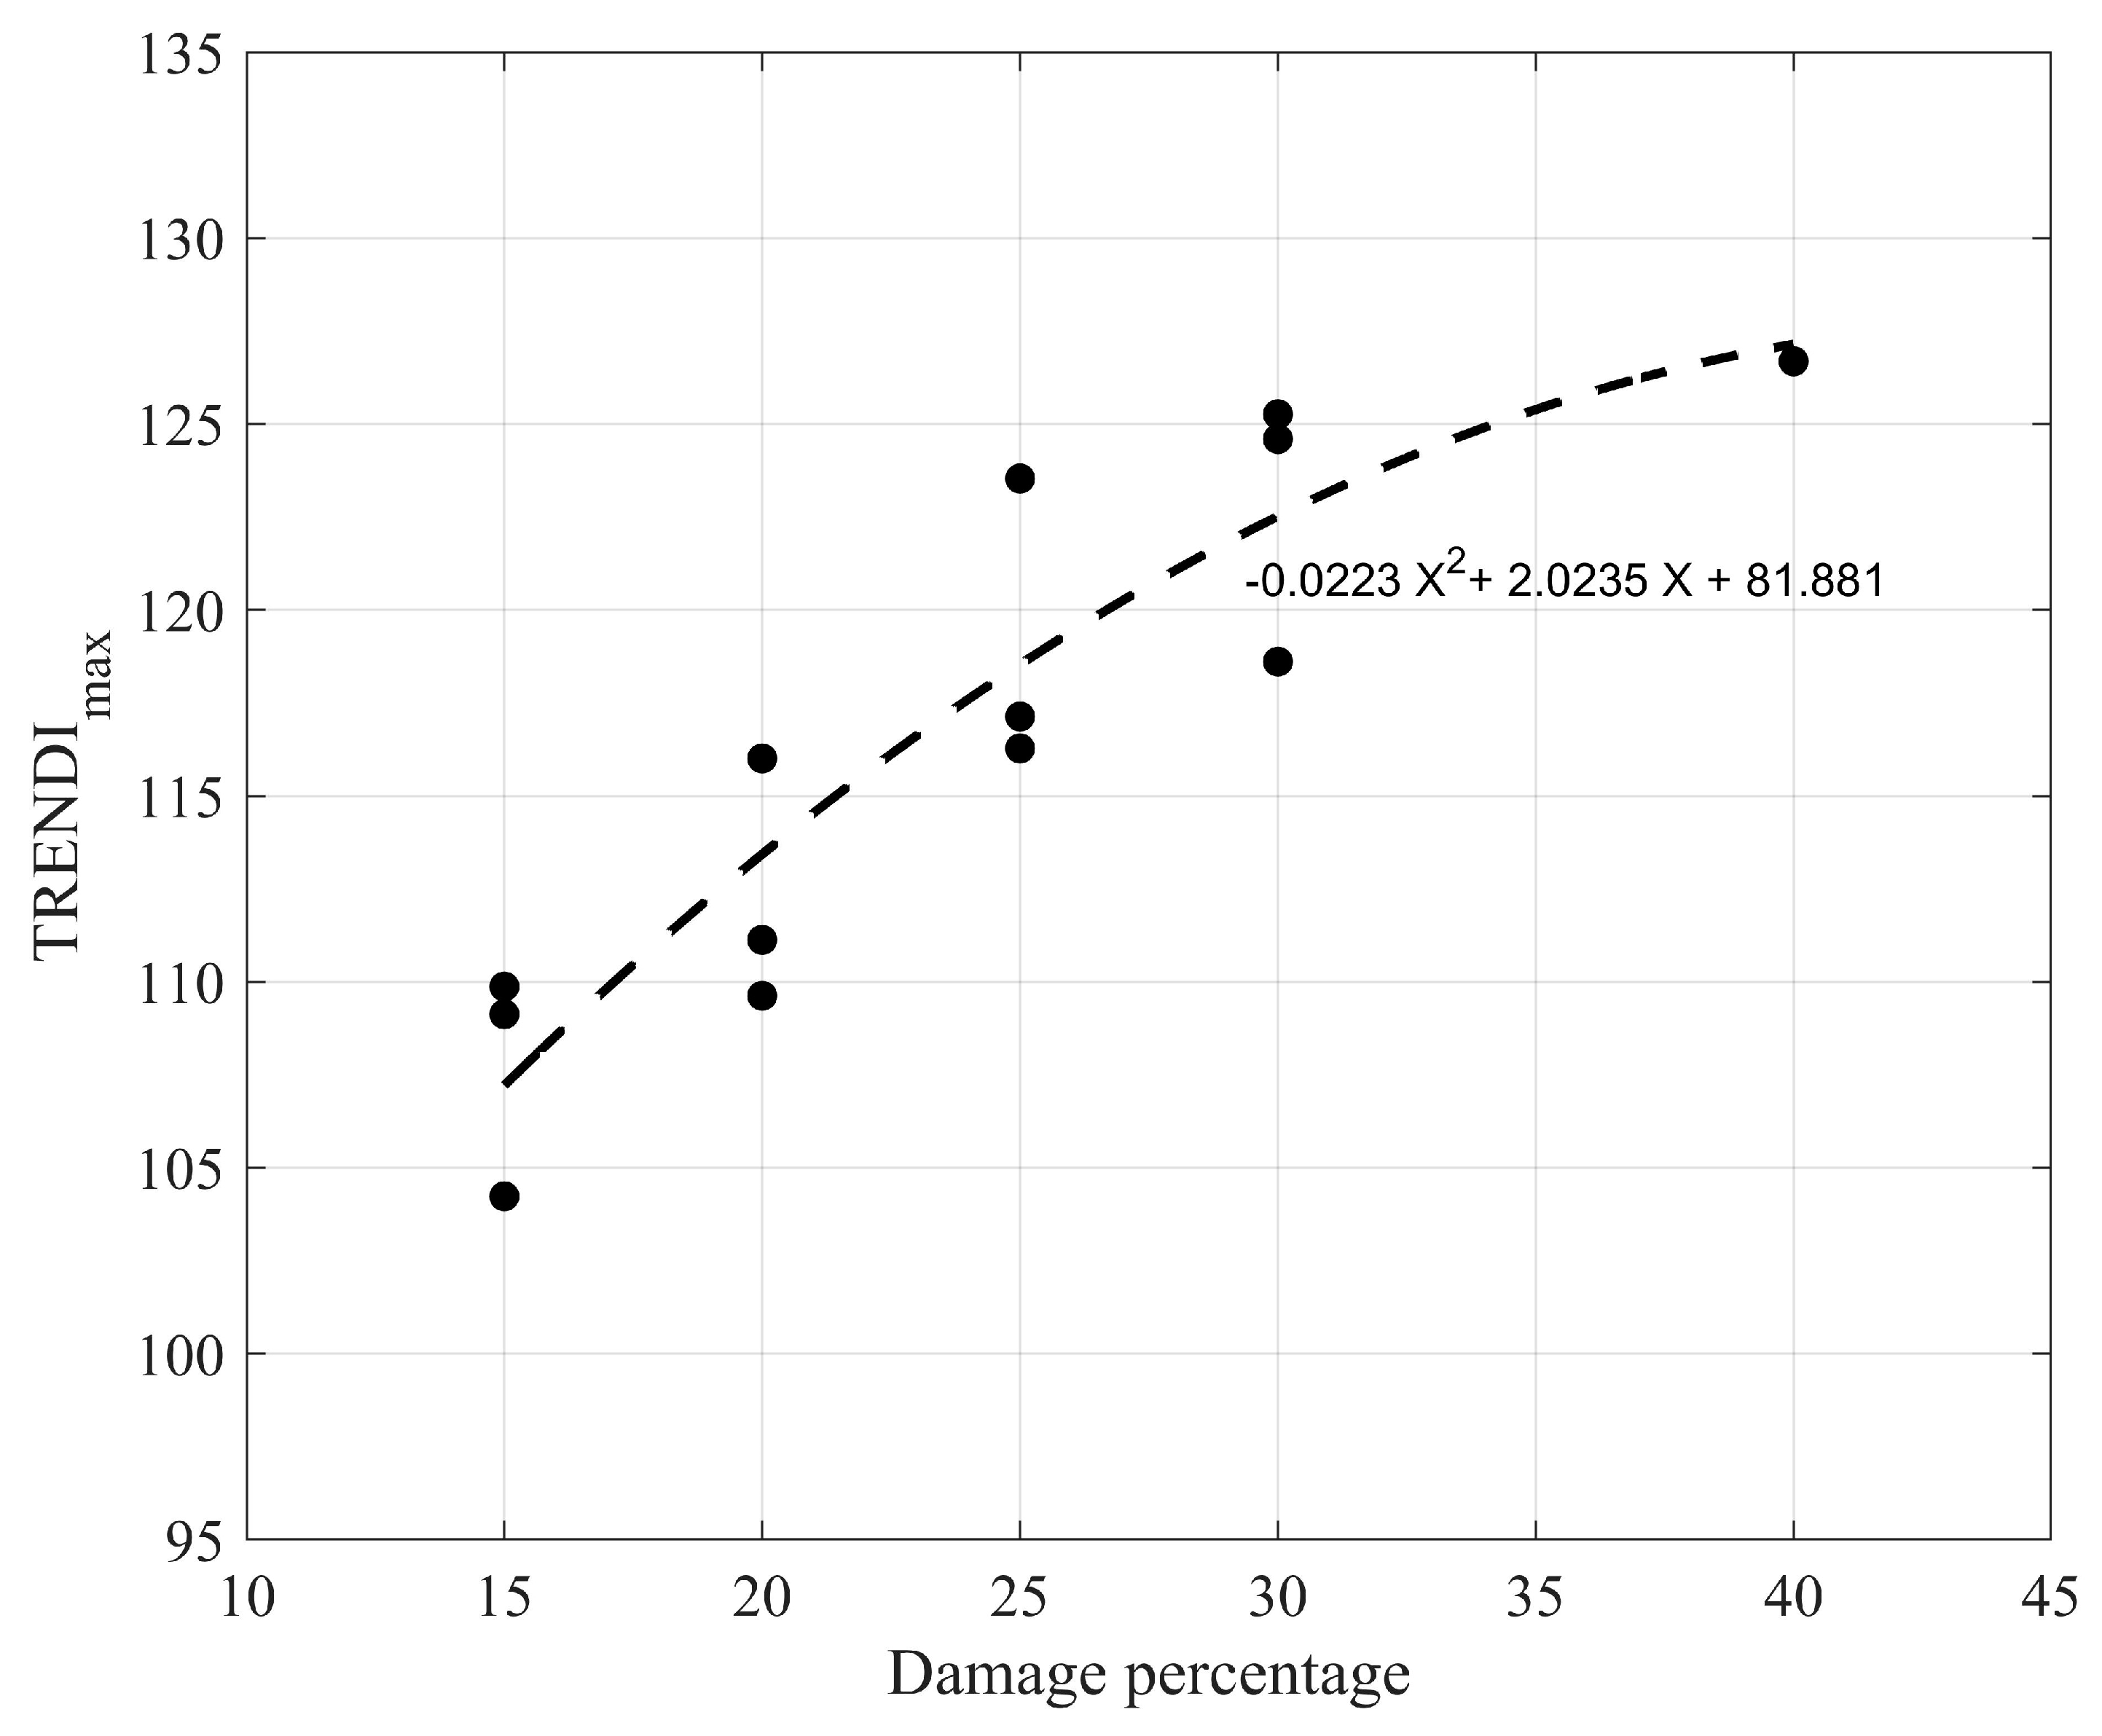
4.4. Damage Quantification

In this section, all scenarios are investigated to find a relationship between the T R E N D I m a x and the percentage of structural damage. The TRENDIs for scenarios 2 to 16 are plotted in Figure 9.
As shown in Figure 9, increasing the percentage of structural damage will increase the amplitude of the TRENDI at the place of damage. Additionally, Figure 9 shows that the damage in some scenarios at a level less than 10% cannot be identified. Figure 10 shows the TRENDIs of the numerical results for those scenarios with a damage level of less than 10%.
As shown in Figure 10, in the absence of any noise, the proposed method can accurately locate damage with a severity of less than 10%. Since there are always noises incorporated with the real acceleration data, the experimental noisy data were considered here to find a relationship for damage quantification in those scenarios in which the damage severity is more than 10%. Figure 11 shows a scatter plot of T R E N D I m a x for those scenarios with a damage level of 15% and more. Hence, at the moment, it is assumed that the proposed method cannot identify floors with a damage less than 15% in a laboratory.
The following equation, as shown in Figure 11, gives a good approximation for the severity of damage using TRENDI.
S e v e r i t y = 0.0223 X 2 + 2.0235 X + 81.881
where X is the T R E N D I m a x calculated for different scenarios with a damage level of 15% and more.

5. Discussion

It has been proved that structural damage changes the structural stiffness matrix and makes the structure softer. However, the natural frequency of a structure should be changed by at least 5% to be sure that a frequency-based damage detection method identifies the structural damage accurately [41,42]. In most cases, structural damage cannot change the natural frequency of structure by at least 5%. For the experimental test provided in this paper, the maximum damage is defined in scenario No. 15, which is a 40% stiffness reduction in the fourth floor. Such a damage changes the first natural frequency of the building by about 3.8%, which is less than 5%. The frequency content of the acceleration response recorded at the roof of the building for a non-damaged building and a damaged building (scenario No. 15) is shown in Figure 12. The trend lines calculated using the SGF for a non-damaged building and a damage building (scenario No. 15) are shown in Figure 13.
Due to the limitations of the shaking table used for this study, the higher frequency of the structure could not be excited. Therefore, the first natural frequency of the building has more amplitude compared with its other natural frequencies. This is the reason that Figure 12 only shows the first natural frequency. As shown in Figure 13, since the natural frequency of the damaged building in scenario No. 15 is decreased by about 3.8%, its trend line compared with a non-damaged building’s trend line is a bit elongated. It should be mentioned that the damage defined in the other scenarios was smaller than that in scenario No. 15; therefore, it caused a smaller shift in the natural frequency of the structure. Hence, from Figure 12 and Figure 13, it can be concluded that the proposed method is able to locate and quantify damage that causes even a small shift in the natural frequency of the structure.

6. Conclusions

The aim of this paper is to investigate and provide numerical/experimental proofs that the trendline of the acceleration data can be used as an input for damage detection methods in a building subjected to seismic load. Hence, this paper developed an output-only, damage localization/quantification method in which only the trend lines of the building’s acceleration responses were used. To this end, first the SGF was adjusted using the first natural frequency of the building, and the adjusted SGF was then employed to calculate an especial trend line for each acceleration response. Two damage indices were used to locate the structural damage, of which, one of them was proposed for the first time in this paper. The accuracy of the developed method was numerically and experimentally verified using a building with five floors subjected to white noise using a shake table. Structural damage was introduced to the building by changing the cross-section of the columns. To study the accuracy of the developed method, twenty-one different damage scenarios with different damage severities were considered. Considering the experimental results, it is proved that the new damage index (TRENDI) proposed in this paper can accurately locate damage with a severity equal to or greater than 15% of stiffness reduction.
The main advantages of the developed method are listed below:
  • Since the SGF has the ability to attenuate noise, the proposed method is essentially insensitive to the noise incorporated in the experimental data if the damage severity is more than 10%.
  • The proposed method can locate damage with no need of determining the dynamic modal properties.
Additionally, the proposed method does not need to know the place of damage in advance or have knowledge of the input excitation. To model the proposed method in real practice, it is recommended to install an accelerometer on the center of each floor and record the acceleration response of the building. Another accelerometer is also needed on the foundation to record the input excitation. Then, by repeating this process after an event such as an earthquake, it is possible to identify the damaged floor. The acceleration recorded on the foundation will be used to be sure that the excitation loads before and after an earthquake can be considered the same. It means that we should repeat the test many times to be able to find a situation in which the input excitation can be considered the same. Our future study will consider the accuracy of the proposed method in real practice.

Author Contributions

Conceptualization, methodology, simulation, investigation, and writing—original draft were carried out by H.K.; conceptualization, scope of question, supervision, funding, experimental tests, writing, and revision were carried out by C.Z.; writing, and revision were carried out by A.A. All authors have read and agreed to the published version of the manuscript.

Funding

This research is financially supported by National Science Foundation of China (NSFC, Project: 52350410476 No. 35234921) and the Ministry of Science and Technology of China (Grant No. 2019YFE0112400) and the Department of Science and Technology of Shandong Province (Grant No. 2021CXGC011204).

Data Availability Statement

The data presented in this study are available online at 10.13140/RG.2.2.20075.72481.

Conflicts of Interest

The authors declare no conflict of interest.

Abbreviations

The following abbreviations are used in this manuscript:
SHM Structural health monitoring
NDI New damage index
DI Damage index
RDT Random decrement technique
SGF Savitzky–Golay filter

References

  1. Nie, Z.; Hao, H.; Ma, H. Structural damage detection based on the reconstructed phase space for reinforced concrete slab: Experimental study. J. Sound Vib. 2013, 332, 1061–1078. [Google Scholar] [CrossRef]
  2. Ghanem, R.; Shinozuka, M. Structural-System Identification. I: Theory. J. Eng. Mech. 1995, 121, 255–264. [Google Scholar] [CrossRef]
  3. Shinozuka, M.; Ghanem, R. Structural System Identification. II: Experimental Verification. J. Eng. Mech. 1995, 121, 265–273. [Google Scholar] [CrossRef]
  4. Zheng, J.; Chen, B.; Ye, C.Y. Damage detection of steel domes subjected to earthquakes by using wavelet transform. Adv. Mater. Res. 2011, 150, 1580–1583. [Google Scholar] [CrossRef]
  5. Tao, D.; Li, H.; Huang, Y.; Bao, Y. Output only earthquake damage detection of moment resist frame using wavelet analysis and fractal dimension. Health Monit. Struct. Biol. Syst. 2012, 8348, 20. [Google Scholar]
  6. Dongwang, T.; Chenxi, M.; Dongyu, Z.; Hui, L. Experimental validation of a signal-based approach for structural earthquake damage detection using fractal dimension of time frequency feature. Earthq. Eng. Eng. Vib. 2014, 13, 671–680. [Google Scholar]
  7. Pnevmatikos, N.G.; Hatzigeorgiou, G.D. Damage detection of framed structures subjected to earthquake excitation using discrete wavelet analysis. Bull. Earthq. Eng. 2017, 15, 227–248. [Google Scholar] [CrossRef]
  8. Liu, C.; Teng, J.; Liu, J. Improvement of the decentralized random decrement technique in wireless sensor networks. In Proceedings of the 2014 Word Congress on Advance in Civil, Environmental, and Materials Research (ACEM14), Busan, Republic of Korea, 24–28 August 2014. [Google Scholar]
  9. Vandiver, J.K.; Dunwoody, A.B.; Campbell, R.B.; Cook, M.F. A Mathematical Basis for the Random Decrement Vibration Signature Analysis Technique. J. Mech. Des. 1982, 104, 307–313. [Google Scholar] [CrossRef]
  10. Lee, J.W.; Kim, J.D.; Yun, C.B.; Yi, J.H.; Shim, J.M. Health-monitoring method for bridges under ordinary traffic loadings. J. Sound Vib. 2002, 257, 247–264. [Google Scholar] [CrossRef]
  11. Lin, C.S.; Chiang, D.Y. Modal identification from non-stationary ambient response data using extended random decrement algorithm. Comput. Struct. 2013, 119, 104–114. [Google Scholar] [CrossRef]
  12. Ku, C.J.; Cermak, J.E.; Chou, L.S. Random decrement based method for modal parameter identification of a dynamic system using acceleration responses. J. Wind Eng. Ind. Aerodyn. 2007, 95, 389–410. [Google Scholar] [CrossRef]
  13. Rodrigues, J.; Brincker, R. Application of the Random Decrement Technique in Operational Modal Analysis. In Proceedings of the 1st International Operational Modal Analysis Conference, Copenhagen, Denmark, 26–27 April 2005; pp. 191–200. [Google Scholar]
  14. Kordestani, H.; Xiang, Y.Q.; Ye, X.W.; Yun, C.B.; Shadabfar, M. Localization of damaged cable in a tied-arch bridge using Arias intensity of seismic acceleration response. Struct. Control. Health Monit. 2019, 27, e2491. [Google Scholar] [CrossRef]
  15. Kordestani, H.; Zhang, C.; Shadabfar, M. Beam Damage Detection Under a Moving Load Using Random Decrement Technique and Savitzky-Golay Filter. Sensors 2020, 20, 243. [Google Scholar] [CrossRef]
  16. Kordestani, H.; Zhang, C. Direct use of the Savitzky-Golay filter to develop an output-only trend line-based damage detection method. Sensors 2020, 20, 1983. [Google Scholar] [CrossRef] [PubMed]
  17. Gonzalez, A.; Hester, D. An investigation into the acceleration response of a damaged beam-type structure to a moving force. J. Sound Vib. 2013, 332, 3201–3217. [Google Scholar] [CrossRef]
  18. Kordestani, H.; Xiang, Y.Q.; Ye, X.W. Output-only damage detection of steel beam using moving average filter. Shock Vib. 2018, 2018, 2067680. [Google Scholar] [CrossRef]
  19. Poncelet, F.; Kerschen, G.; Golinval, J.C.; Verhelst, D. Output-only modal analysis using blind source separation techniques. Mech. Syst. Signal Process. 2007, 21, 2335–2358. [Google Scholar] [CrossRef]
  20. Zhou, W.; Chelidze, D. Blind source separation based vibration mode identification. Mech. Syst. Signal Process. 2007, 21, 3072–3087. [Google Scholar] [CrossRef]
  21. Kerschen, G.; Poncelet, F.; Golinval, J.C. Physical interpretation of independent component analysis in structural dynamics. Mech. Syst. Signal Process. 2007, 21, 1561–1575. [Google Scholar] [CrossRef]
  22. Huang, C.; Nagarajaiah, S. Experimental study on bridge structural health monitoring using blind source separation method: Arch bridge. Struct. Monit. Maint. 2014, 1, 69–87. [Google Scholar] [CrossRef]
  23. Loh, C.H.; Hung, T.Y.; Chen, S.F.; Hsu, W.T. Damage detection in bridge structure using vibration data under random travelling vehicle loads. J. Phys. Conf. Ser. 2015, 628, 012044. [Google Scholar] [CrossRef]
  24. Kordestani, H.; Zhang, C.; Masri, S.F. Normalized energy index-based signal analysis through acceleration trendlines for structural damage detection. Measurement 2023, 210, 112530. [Google Scholar] [CrossRef]
  25. Schaumann, M.; Scislo, L.G.; Gamba, D.; Guinchard, M.; Garcia Morales, H.; Corsini, R.; Wenninger, J. The Effect of Ground Motion on the LHC and HL-LHC Beam Orbit. Nucl. Instrum. Methods Phys. Res. Sect. A Accel. Spectrometers Detect. Assoc. Equip. 2022, 1055, 168495. [Google Scholar] [CrossRef]
  26. Abedini, M.; Zhang, C. Dynamic vulnerability assessment and damage prediction of RC columns subjected to severe impulsive loading. Struct. Eng. Mech. 2021, 77, 441–461. [Google Scholar] [CrossRef]
  27. Zhang, C.; Kordestani, H.; Masri, S.F.; Wang, J.; Sun, L. Data-driven system parameter change detection for a chain-like uncertainties embedded structure. Struct. Control Health Monit. 2021, 28, e2821. [Google Scholar] [CrossRef]
  28. Delgadillo, R.M.; Casas, J.R. Bridge damage detection via improved completed ensemble empirical mode decomposition with adaptive noise and machine learning algorithms. Struct. Control. Heal. Monit. 2022, 29, e2966. [Google Scholar] [CrossRef]
  29. Kildashti, K.; Alamdari, M.M.; Kim, C.W.; Gao, W.; Samali, B. Drive-by-bridge inspection for damage identification in a cable-stayed bridge: Numerical investigations. Eng. Struct. 2020, 223, 110891. [Google Scholar] [CrossRef]
  30. Wang, D.; Zhou, P.; Jin, T.; Zhu, H. Damage Identification for Beam Structures Using the Laplace Transform-Based Spectral Element Method and Strain Statistical Moment. J. Aerosp. Eng. 2018, 31, 04018016. [Google Scholar] [CrossRef]
  31. Hester, D.; González, A. A discussion on the merits and limitations of using drive-by monitoring to detect localised damage in a bridge. Mech. Syst. Signal Process. 2017, 90, 234–253. [Google Scholar] [CrossRef]
  32. Li, J.; Zhu, X.; Law, S.-S.; Samali, B. Drive-By Blind Modal Identification with Singular Spectrum Analysis. J. Aerosp. Eng. 2019, 32, 04019050. [Google Scholar] [CrossRef]
  33. Ostertagova, E.; Ostertag, O. Methodology and application of Savitzky_Golay moving average polynomial smoother. Glob. J. Pure Appl. Math. 2016, 12, 3201–3210. [Google Scholar]
  34. Guinon, J.; Ortega, E.; Garcia-Anton, J.; Perez-Herranz, V. Moving average and Savitzki-Golay smoothing filters using mathcad. In Proceedings of the International Conference on Engineering Education-ICEE 2007, Coimbra, Portugal, 3–7 September 2007. [Google Scholar]
  35. Savitzky, A.; Golay, M.J.E. Smoothing and Differentiation of Data by Simplified Least Squares Procedures. Anal. Chem. 1964, 36, 1627–1639. [Google Scholar] [CrossRef]
  36. Schafer, R. What Is a Savitzky-Golay Filter? (A lecture note). IEEE Signal Process. Mag. 2011, 28, 111–117. [Google Scholar] [CrossRef]
  37. Available online: https://www.microstrain.com/wireless-sensors/g-link-200 (accessed on 8 November 2023).
  38. OBrien, E.J.; Malekjafarian, A.; González, A. Application of empirical mode decomposition to drive-by bridge damage detection. Eur. J. Mech. 2017, 61, 151–163. [Google Scholar] [CrossRef]
  39. Fan, W.; Qiao, P. Vibration-based damage identification methods: A review and comparative study. Struct. Health Monit. 2011, 10, 83–111. [Google Scholar] [CrossRef]
  40. Qiao, P.; Cao, M. Waveform fractal dimension for mode shape-based damage identification of beam-type structures. Int. J. Solids Struct. 2008, 45, 5946–5961. [Google Scholar] [CrossRef]
  41. Salawu, O.S. Detection of structural damage through change in frequency: A review. Eng. Struct. 1997, 19, 718–723. [Google Scholar] [CrossRef]
  42. Ralbovsky, M.; Deix, S.; Flesch, R. Frequency changes in frequency-based damage identification. Struct. Infrastruct. Eng. 2010, 6, 611–619. [Google Scholar] [CrossRef]
Figure 1. Flowchart of the proposed method.
Buildings 13 03007 g001
Figure 2. A five-floor building with shake table at the laboratory of Qingdao University of Technology.
Buildings 13 03007 g002
Figure 3. The dimensions of the experimental test.
Buildings 13 03007 g003
Figure 4. G-Link®-200—ruggedized high-speed triaxial accelerometer node.
Buildings 13 03007 g004
Figure 5. The natural frequencies calculated from numerical simulation. (a) First natural frequency: 4.9 Hz; (b) second natural frequency: 10.289 Hz; (c) third natural frequency: 11.808 Hz; (d) fourth natural frequency: 14.496 Hz; (e) fifth natural frequency: 23.407 Hz; (f); sixth natural frequency: 30.811 Hz.
Buildings 13 03007 g005
Figure 6. The trend line calculated using adjusted SGF for the 4th floor in scenarios 1 and 2.
Buildings 13 03007 g006
Figure 7. The TREDIs for scenarios No. 3 (30% damage on the 4th floor), 5 (25% damage on the 4th floor), 7 (20% damage on the 4th floor), 17 (30% damage on the 5th floor), 18 (20% damage on the 3rd floor), and 20 (20% damage on the 2nd floor).
Buildings 13 03007 g007
Figure 8. The TRENDIs for scenarios No. 3 (30% damage on the 4th floor), 5 (25% damage on the 4th floor), 7 (20% damage on the 4th floor), 17 (30% damage on the 5th floor), 18 (20% damage on the 3rd floor), and 20 (20% damage on the 2nd floor).
Buildings 13 03007 g008
Figure 9. The TRENDIs for scenarios 2 to 16.
Buildings 13 03007 g009
Figure 10. The TRENDIs calculated from numerical data for scenarios No. 8 (7.5% damage on the 4th floor), 10 (5% damage on the 4th floor), and 12 (2.5% damage on the 4th floor).
Buildings 13 03007 g010
Figure 11. The scatter plot of T R E N D I m a x for scenarios with a damage level of 15% and more.
Buildings 13 03007 g011
Figure 12. The frequency content of acceleration response recorded at the roof of the building for a non-damaged building and a damaged building (scenario No. 15).
Buildings 13 03007 g012
Figure 13. The trend lines calculated using the SGF for a non-damaged building and a damage building (scenario No. 15).
Buildings 13 03007 g013
Table 1. Different column cross-sections used for this paper.
No.Length (mm)Width (mm)Moment of Inertia (mm4)Degree of Change
1 (no damage)2581066.7No damage
2208853.320%
317.58746.730%
415864040%
512.58533.350%
6108426.760%
Table 2. Different damage scenarios used in this paper.
TypeScenario No.FloorStiffness Reduction
in the Floor
Description
Baseline1----No damageIntact structure
Damage scenarios on the 4th floor24th15%60% stiffness reduction in column 1
34th30%60% stiffness reduction in columns 1 and 2
44th12.5%50% stiffness reduction in column 1
54th25%50% stiffness reduction in columns 1 and 2
64th10%40% stiffness reduction in column 1
74th20%40% stiffness reduction in columns 1 and 2
84th7.5%30% stiffness reduction in column 1
94th15%30% stiffness reduction in columns 1 and 2
104th5%20% stiffness reduction in column 1
114th10%20% stiffness reduction in columns 1 and 2
124th2.5%10% stiffness reduction in column 1
134th5%10% stiffness reduction in columns 1 and 2
144th30%40% stiffness reduction in columns 1, 2 and 3
154th40%40% stiffness reduction in all columns
Damage scenarios on different floors165th15%60% stiffness reduction in column 1
175th30%60% stiffness reduction in columns 1 and 2
183rd20%40% stiffness reduction in columns 1 and 2
193rd25%50% stiffness reduction in columns 1 and 2
202nd20%40% stiffness reduction in columns 1 and 2
212nd25%50% stiffness reduction in columns 1 and 2
Disclaimer/Publisher’s Note: The statements, opinions and data contained in all publications are solely those of the individual author(s) and contributor(s) and not of MDPI and/or the editor(s). MDPI and/or the editor(s) disclaim responsibility for any injury to people or property resulting from any ideas, methods, instructions or products referred to in the content.

