

Seismic Performance Evaluation and Comparative Study of Reinforced Concrete Building on a Sloped Terrain with Regular Building by Considering the Effect of URM Infill Walls

 ,
,  , , ,
, , ,  and
and
Abstract
:1. Introduction
2. Past Studies
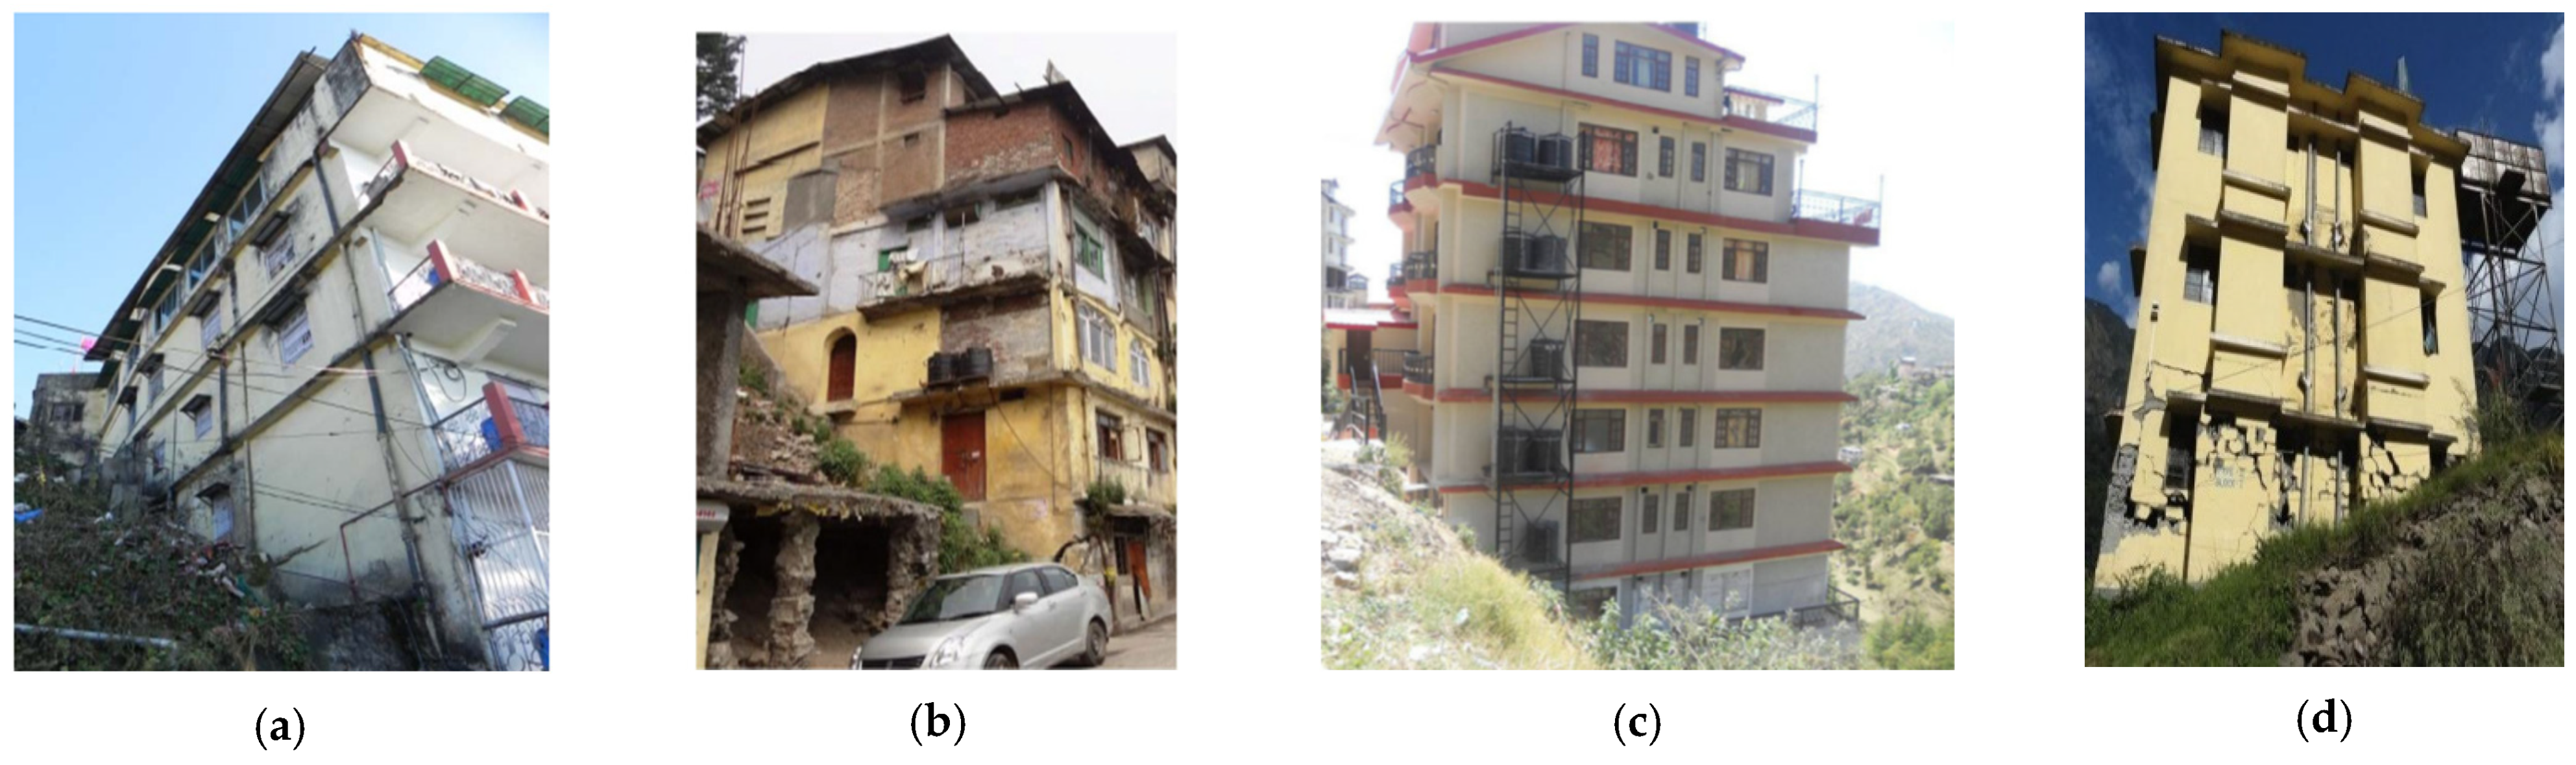
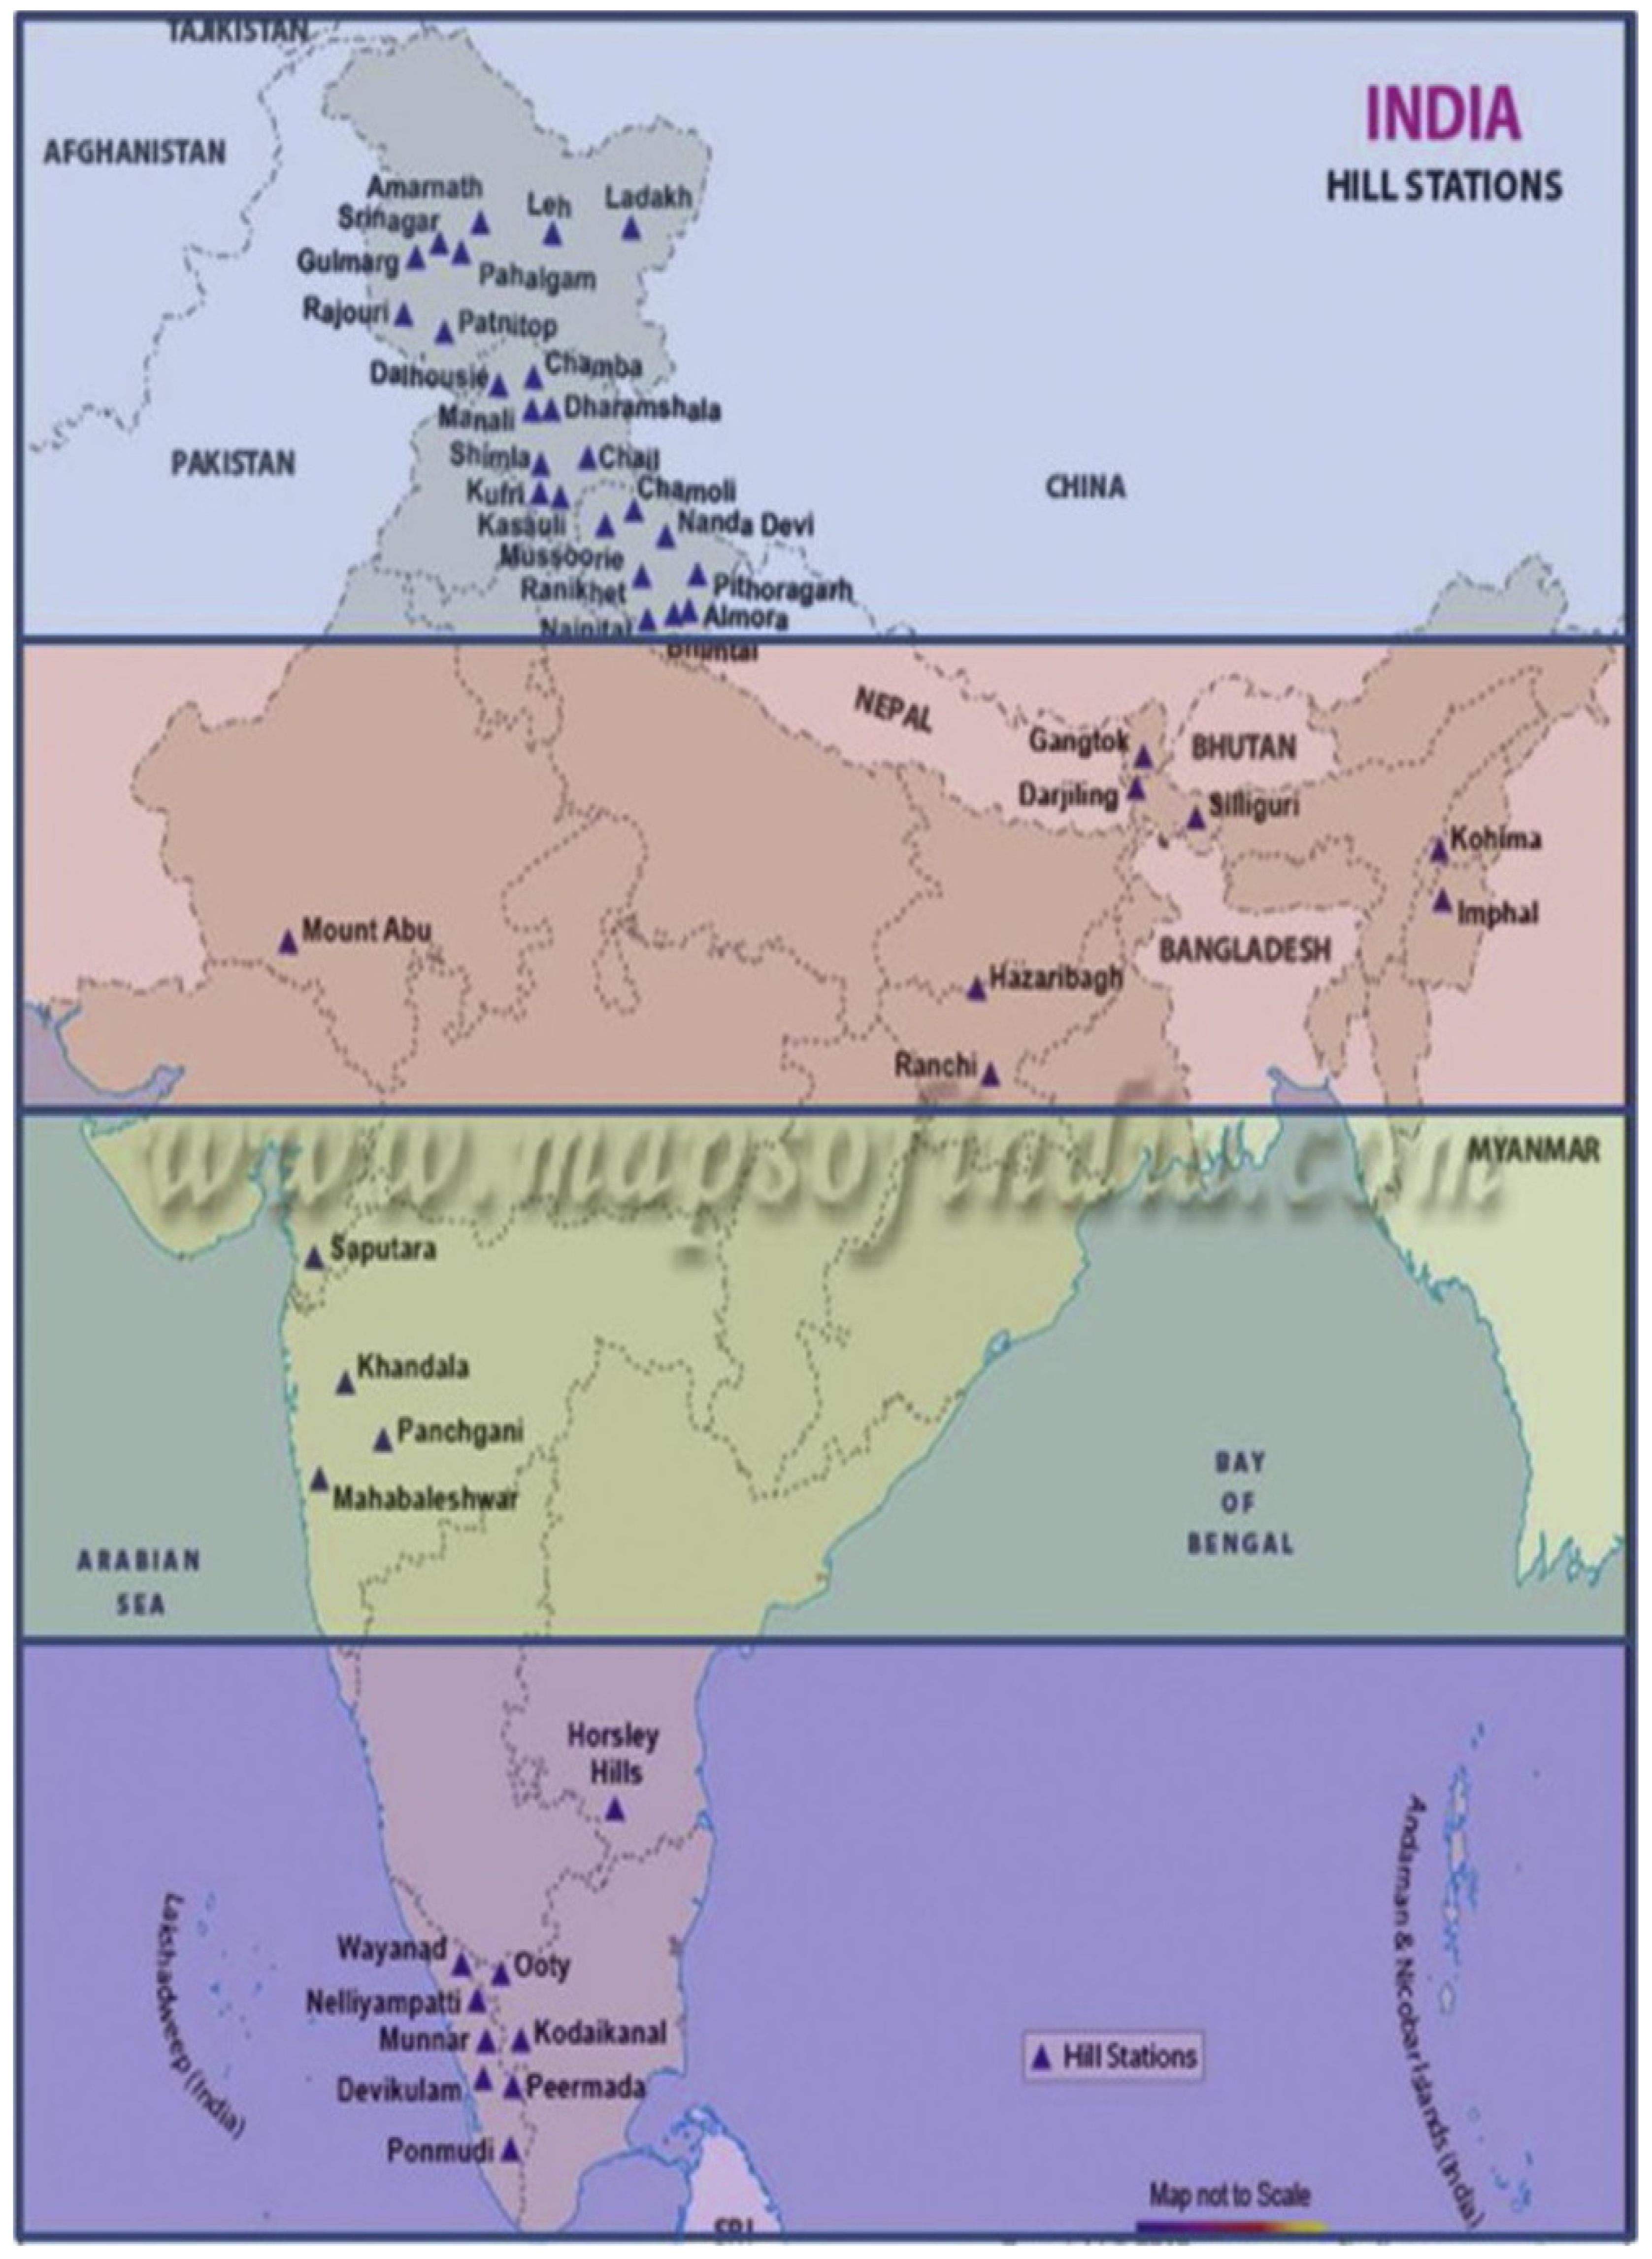
3. Land Categorization
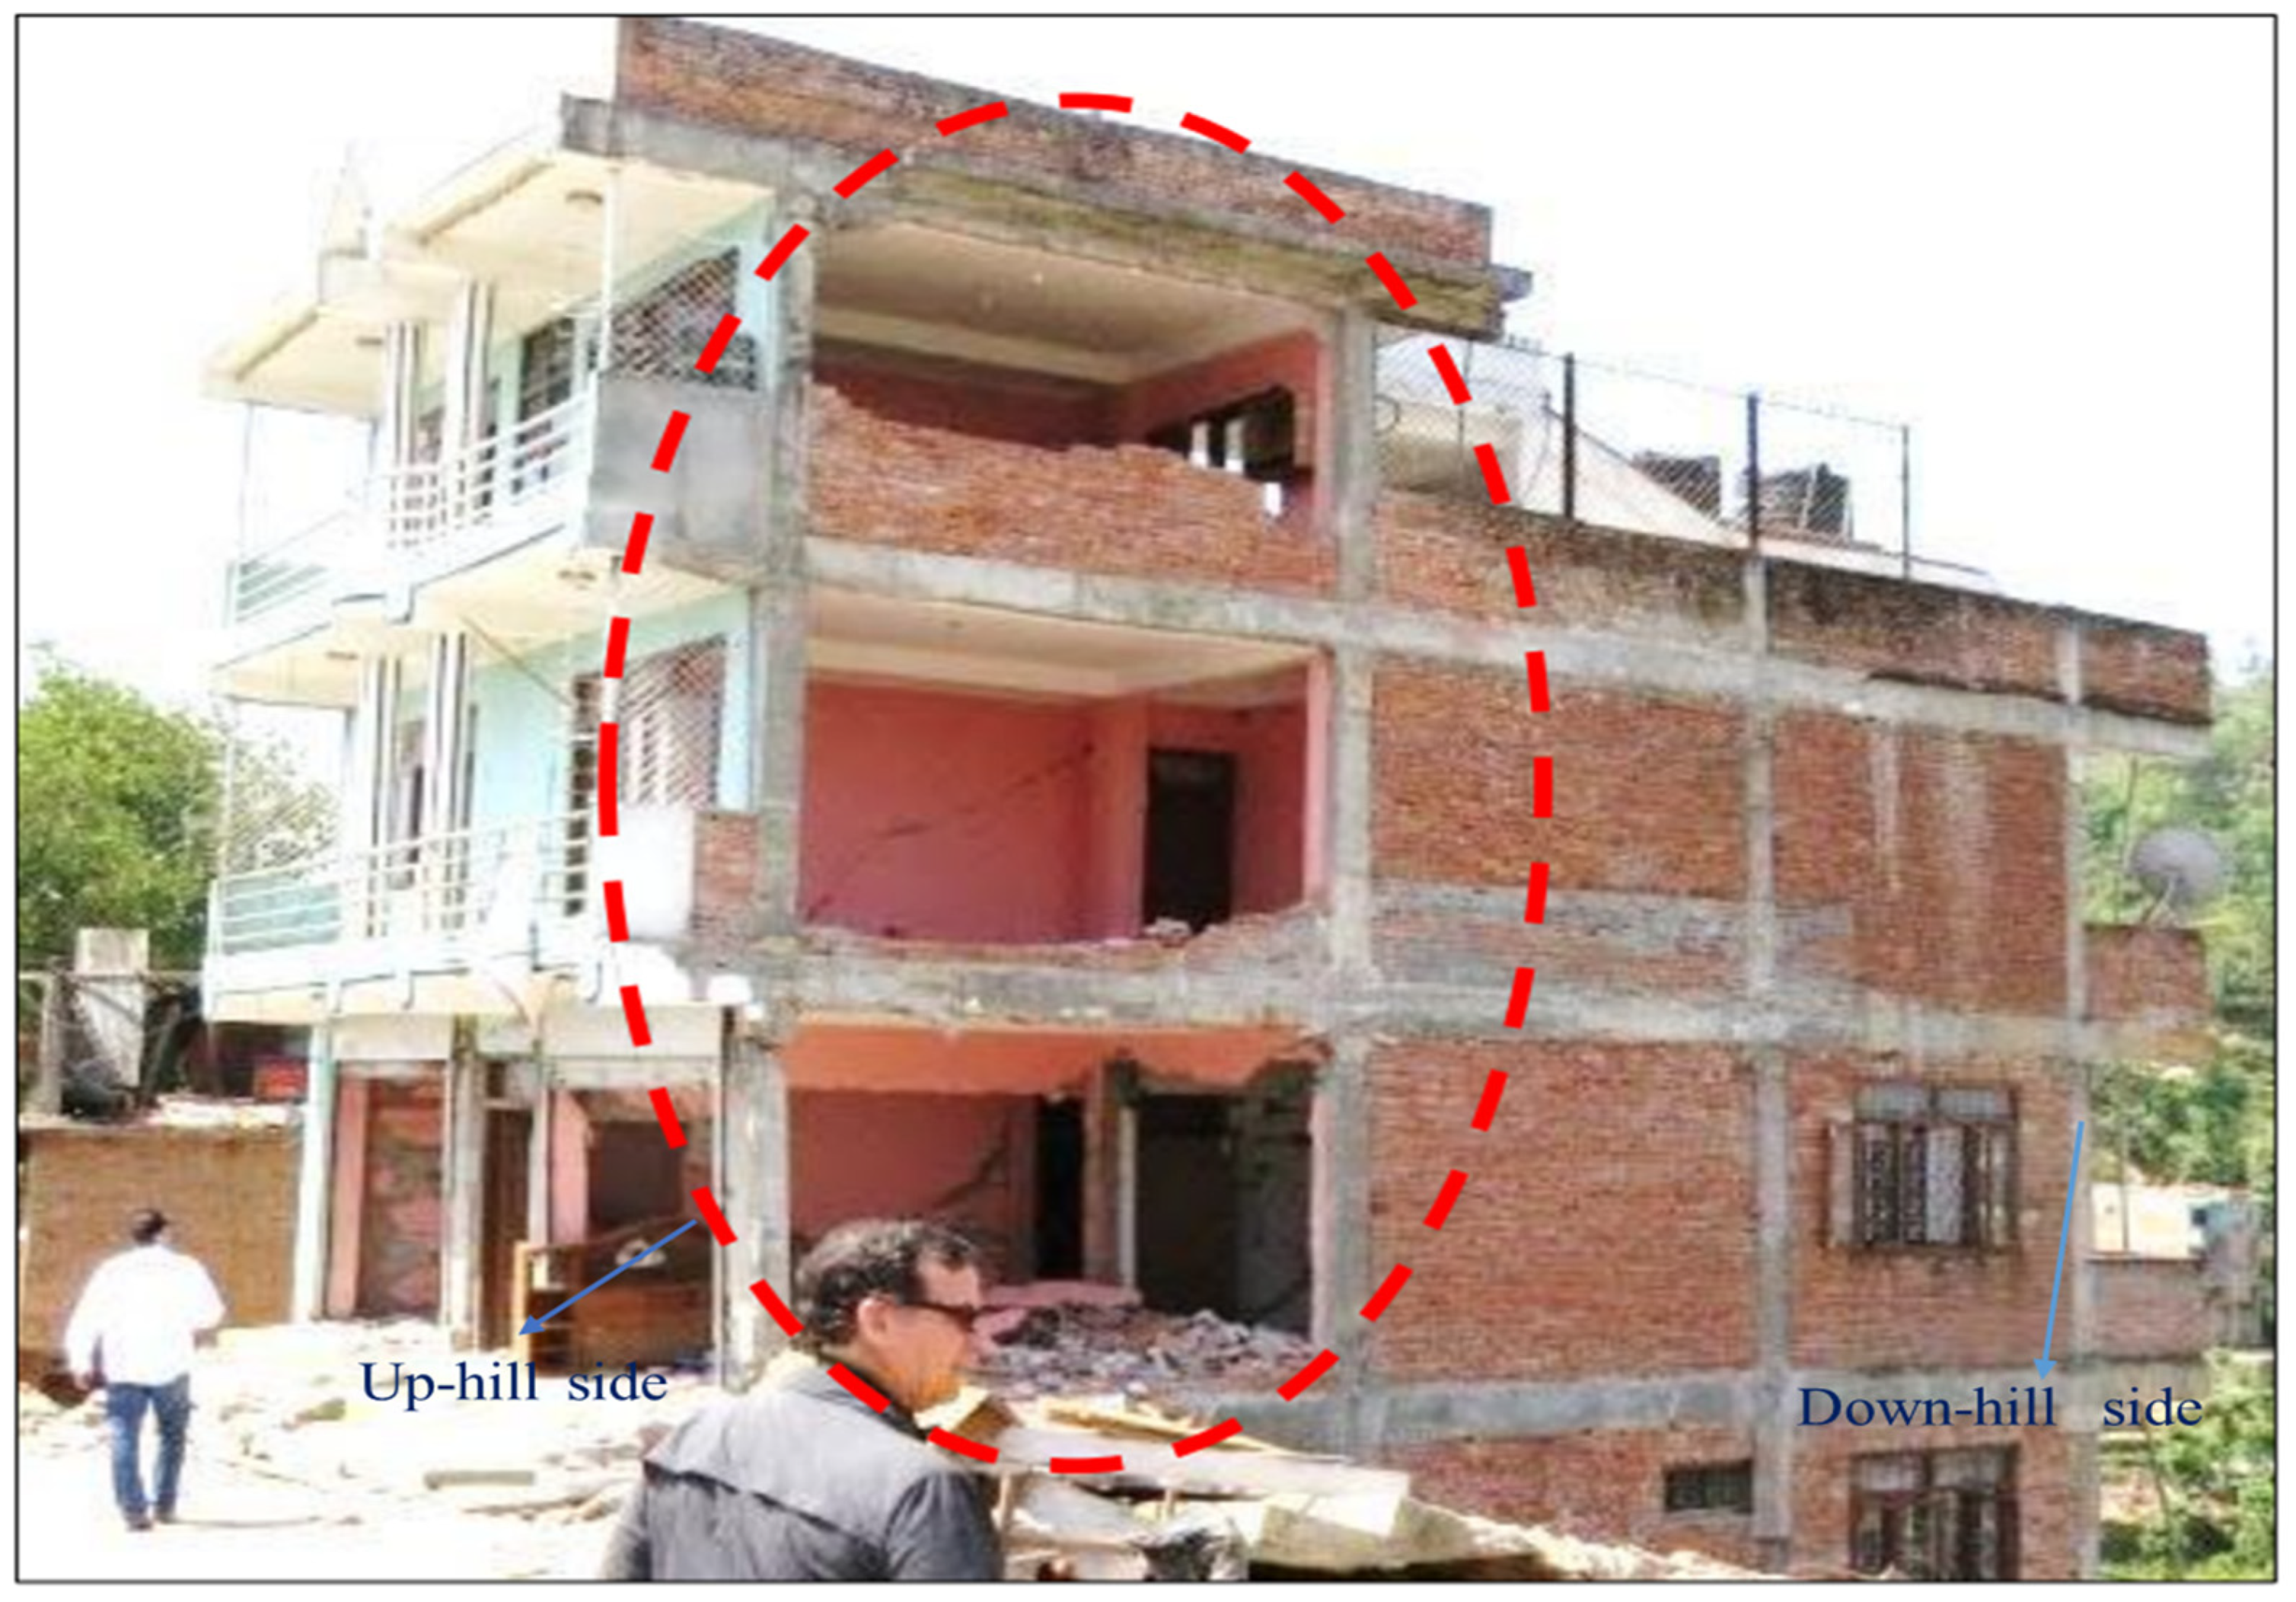
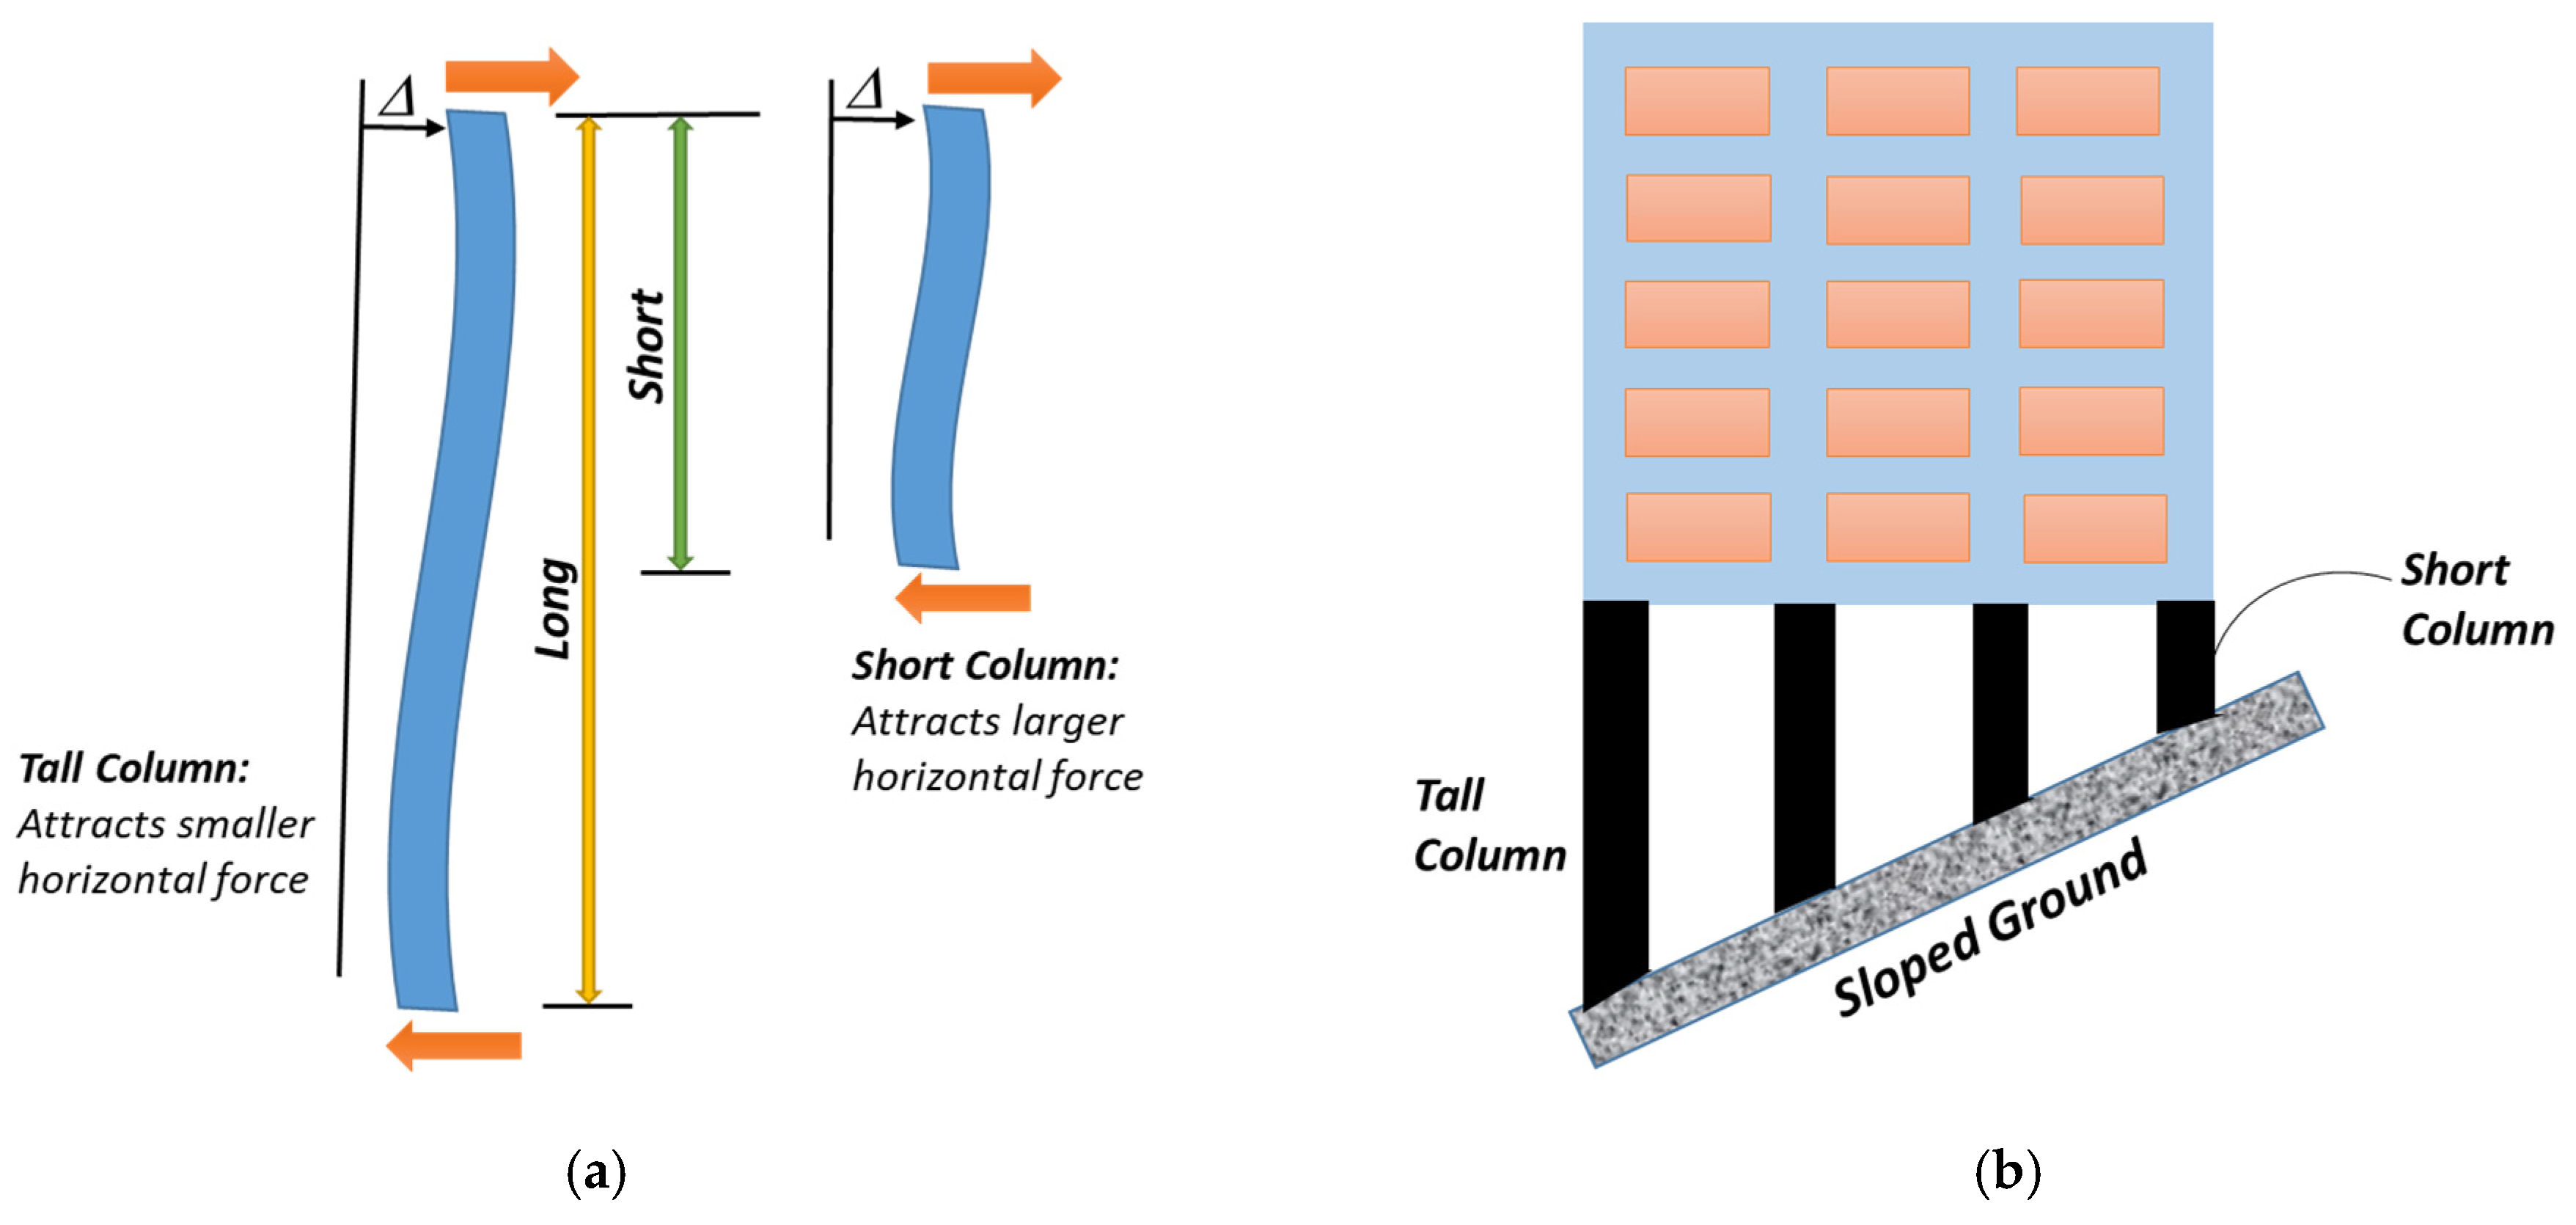
4. Effect of the Short Column in Hilly Slope Building
5. Effect of Infill Walls in Building
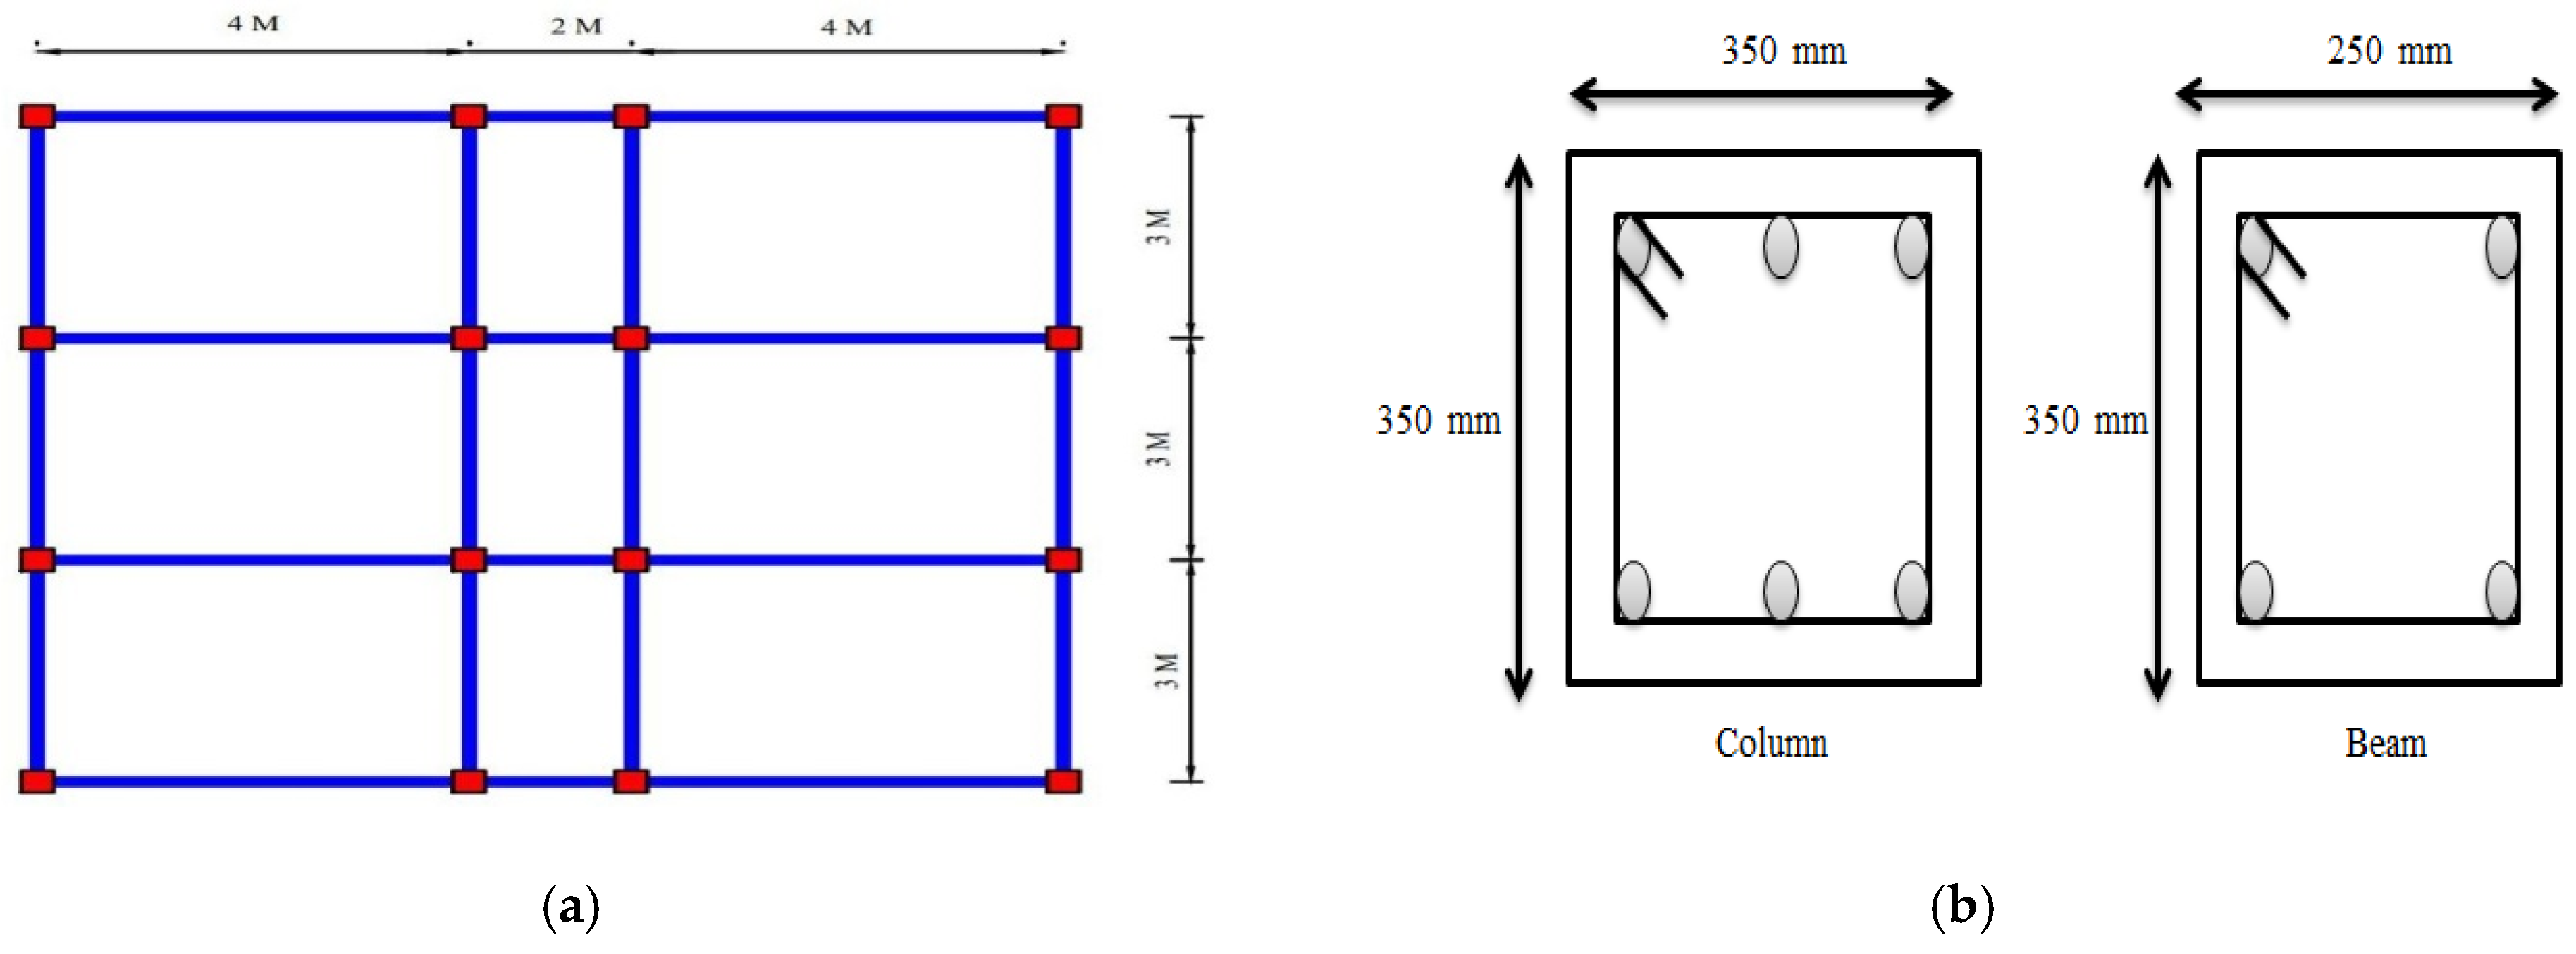
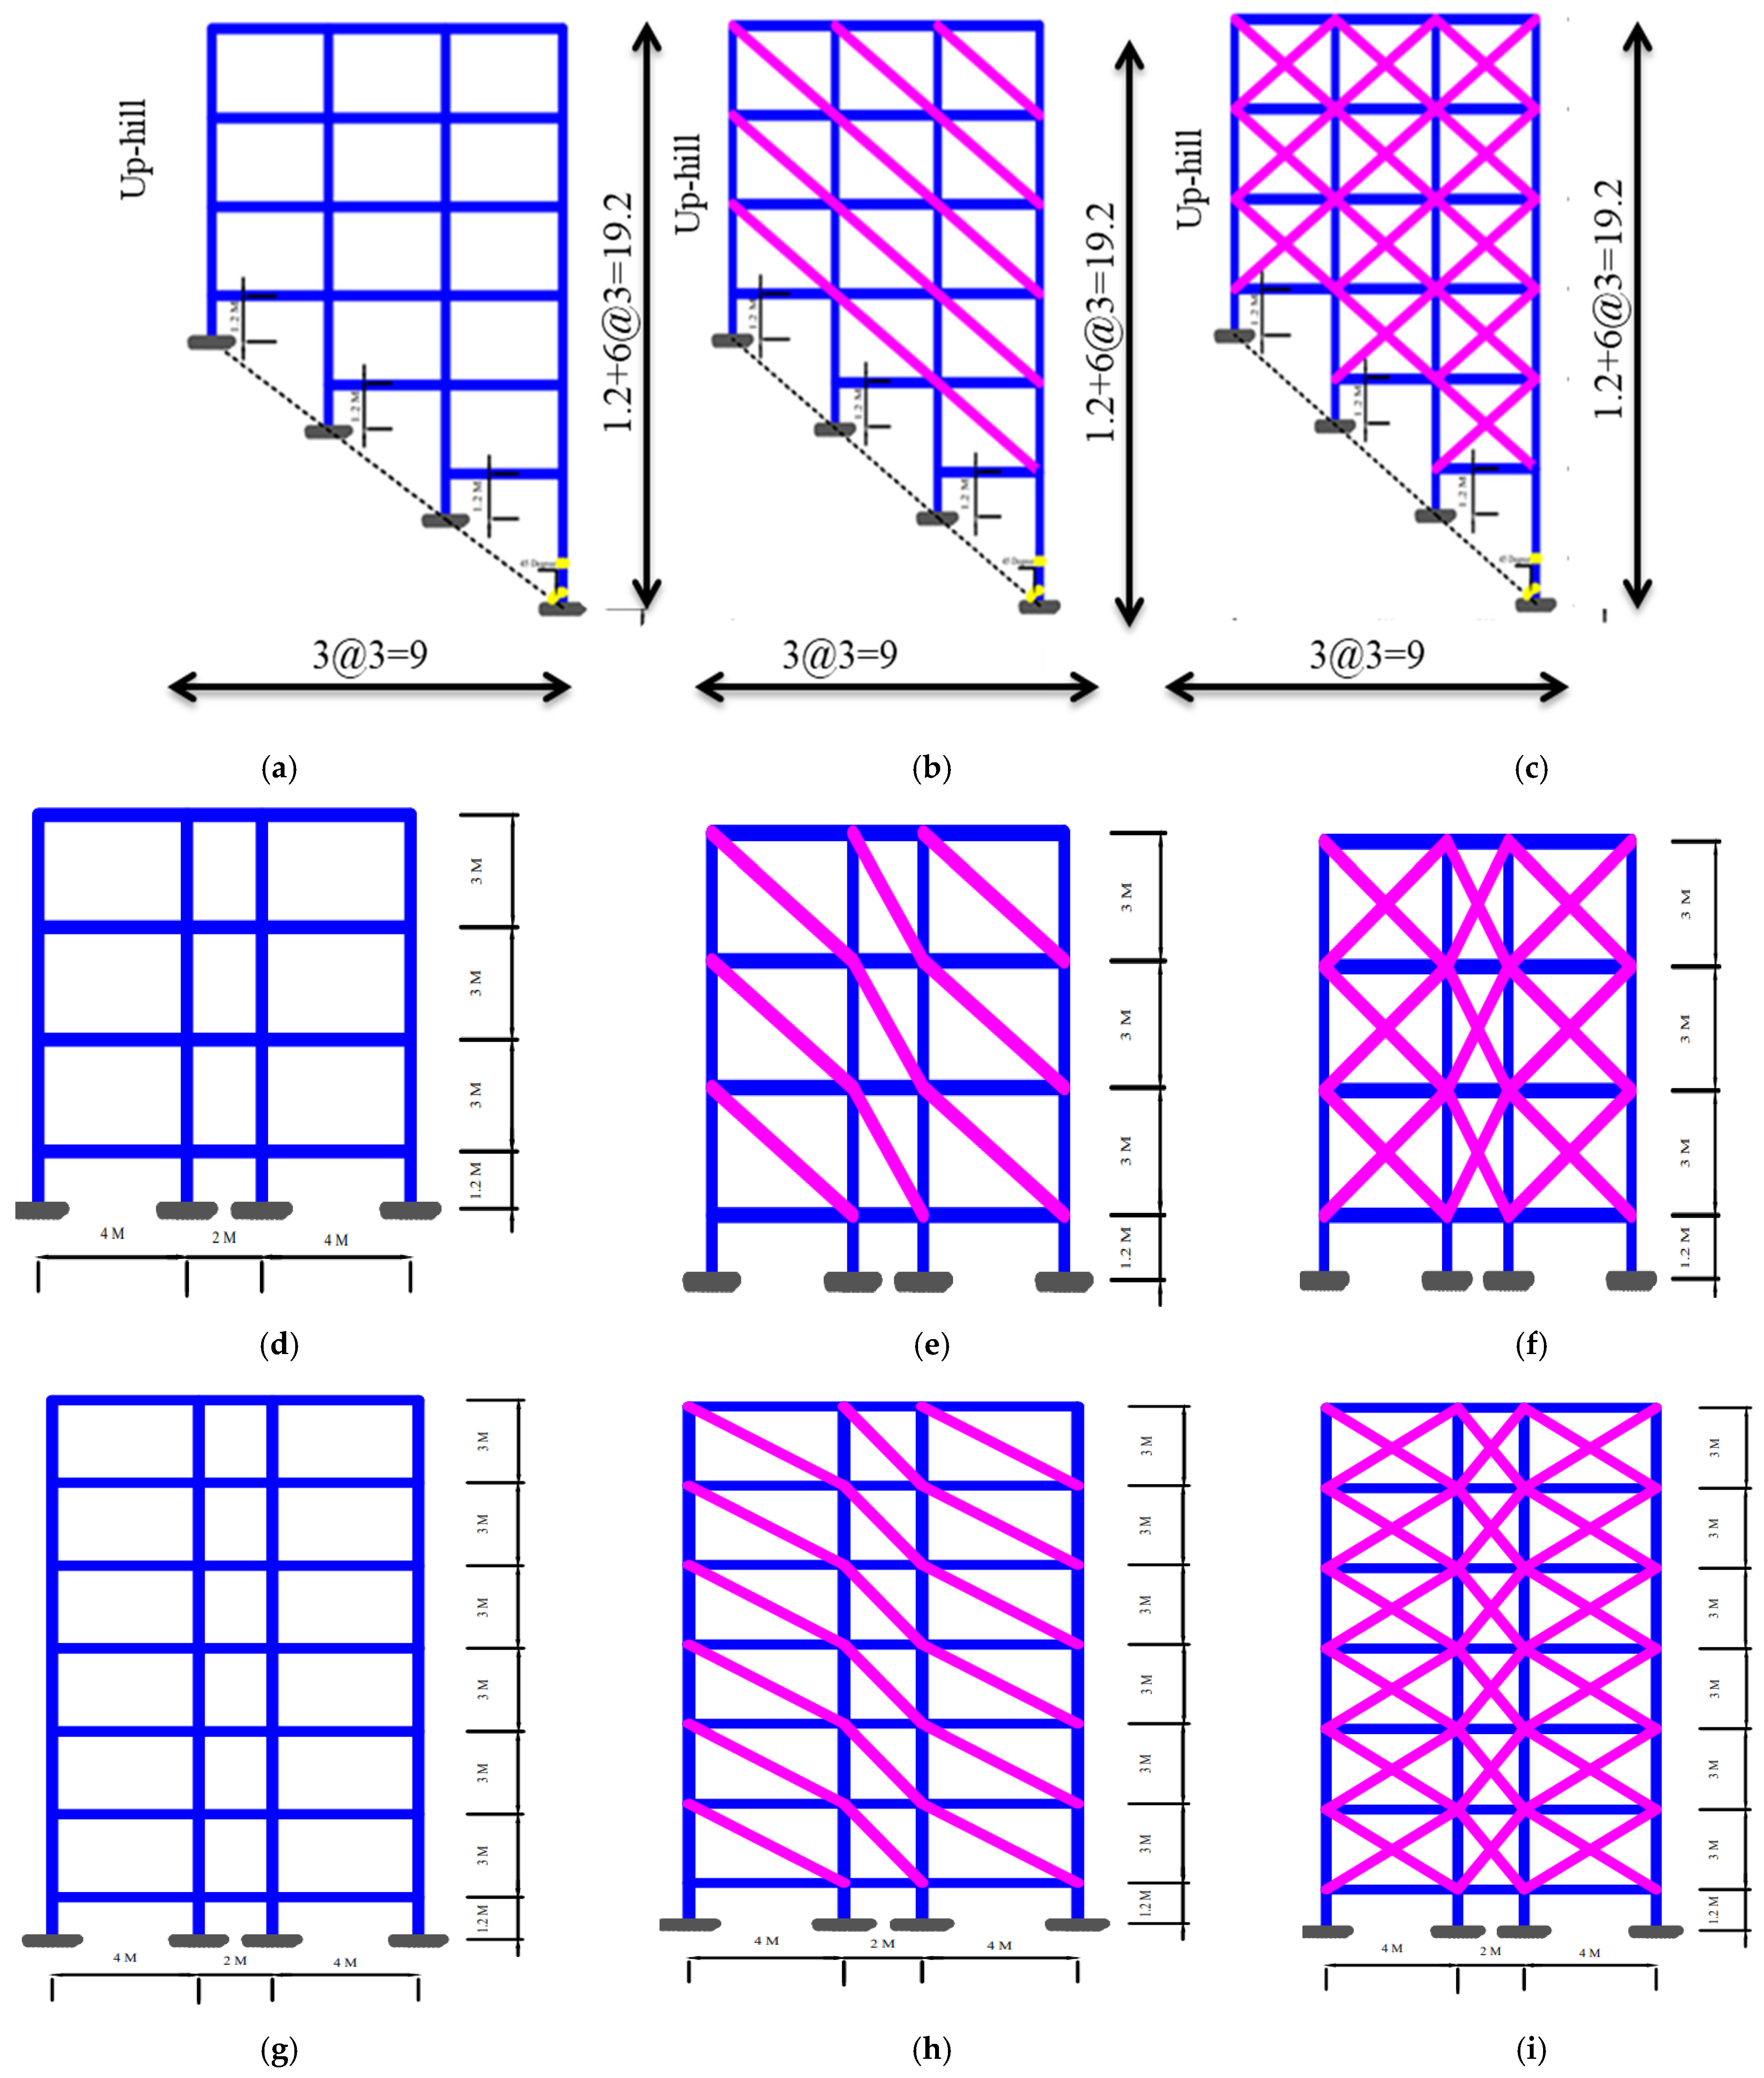
6. Numerical Modelling of Buildings
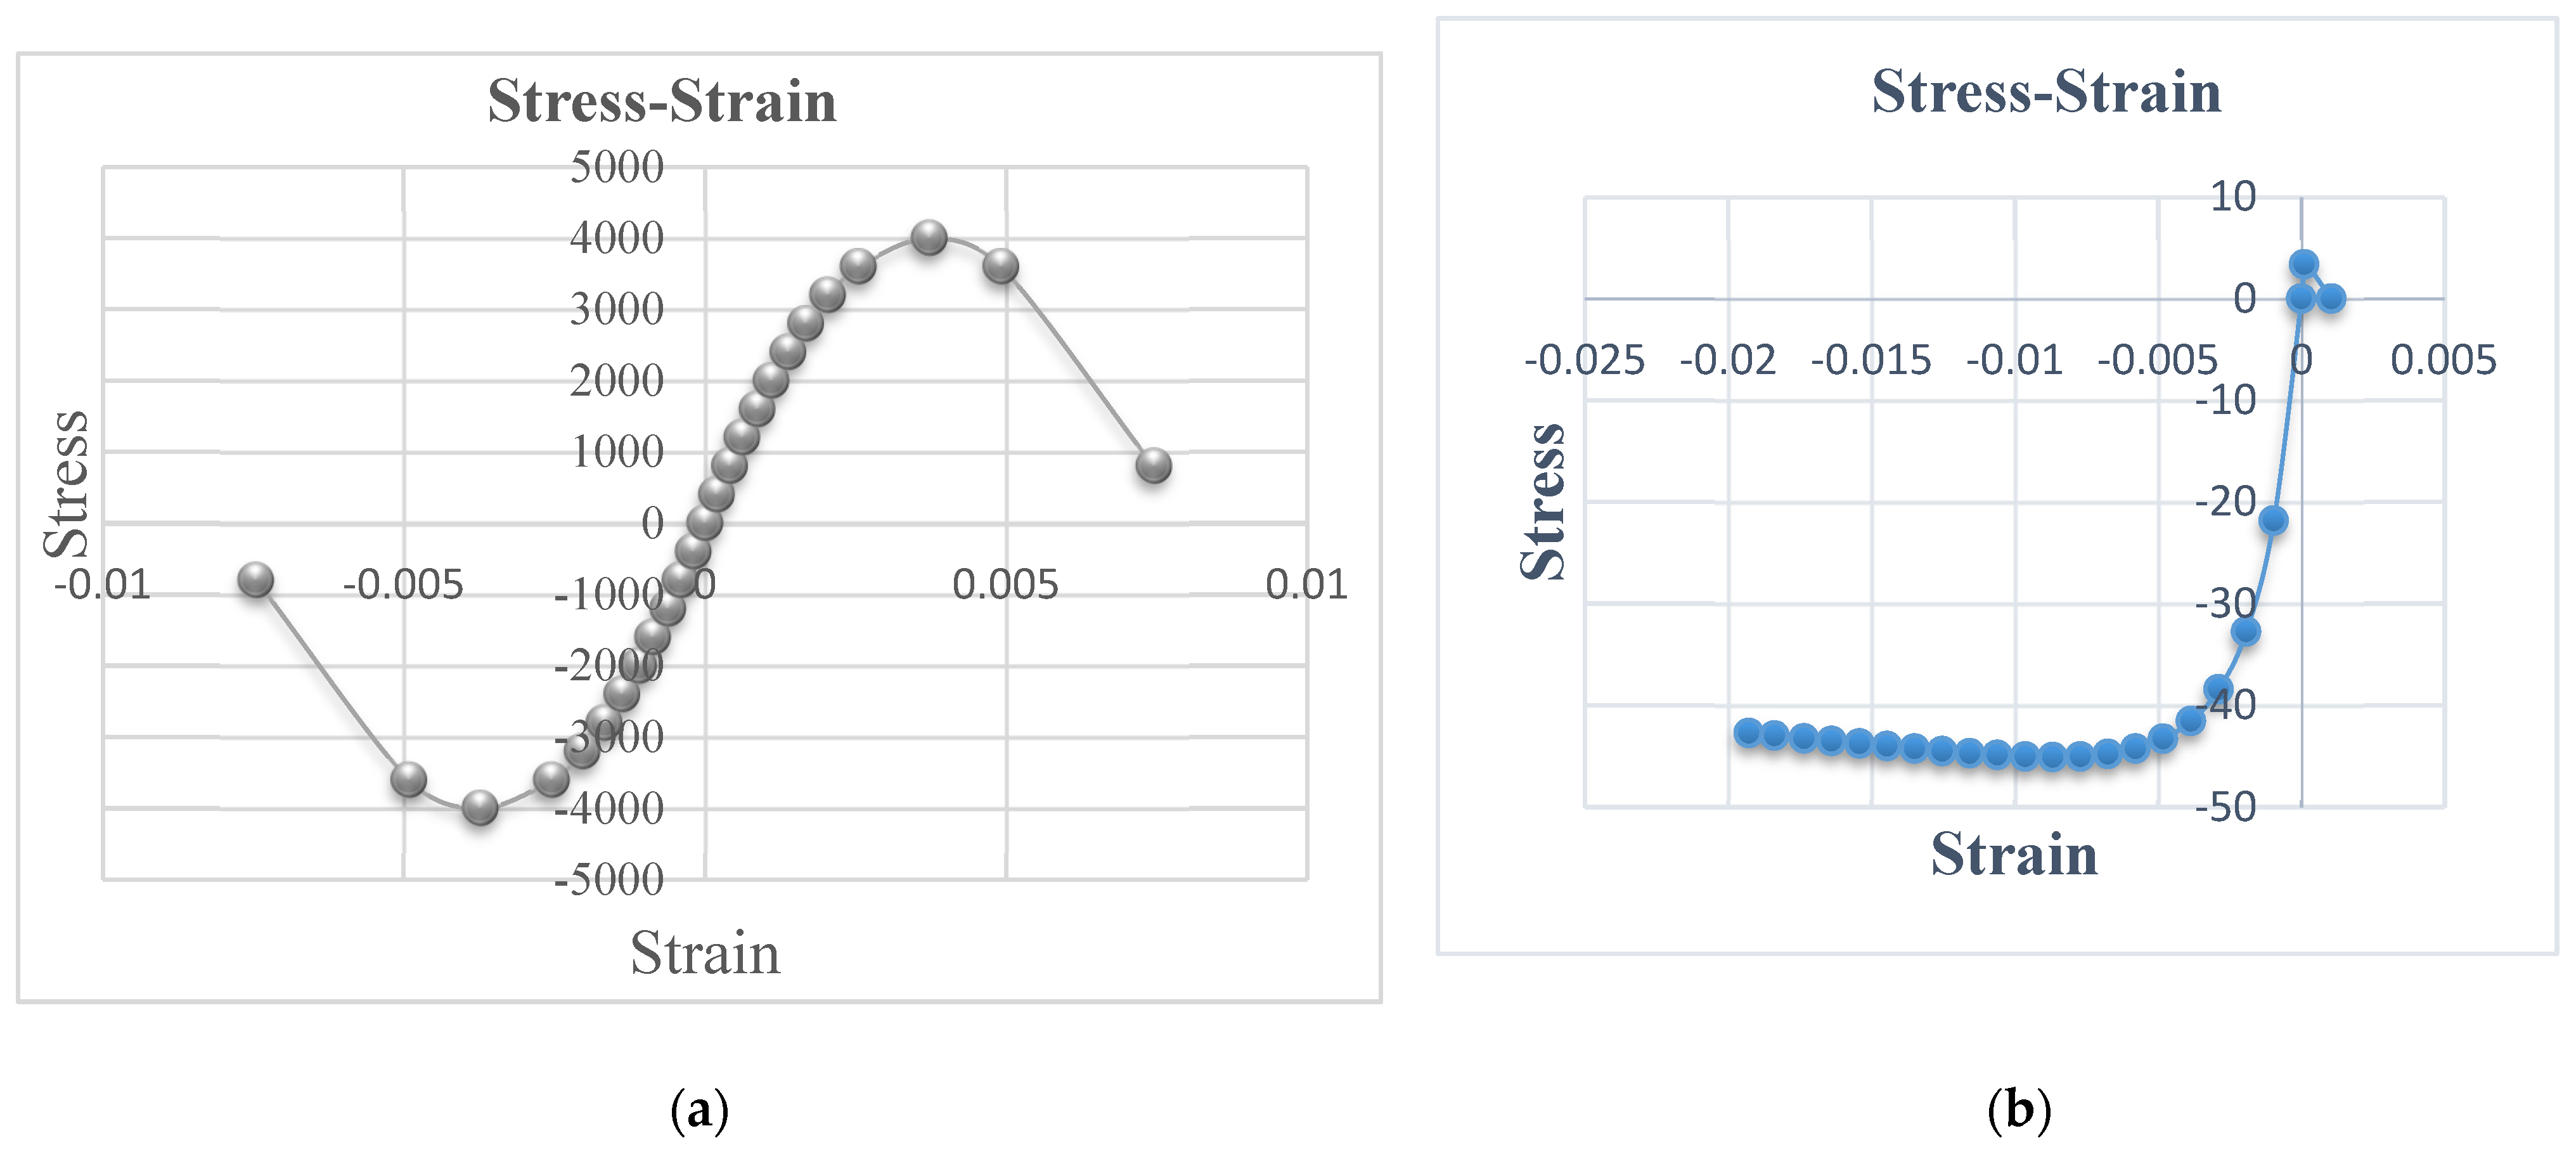
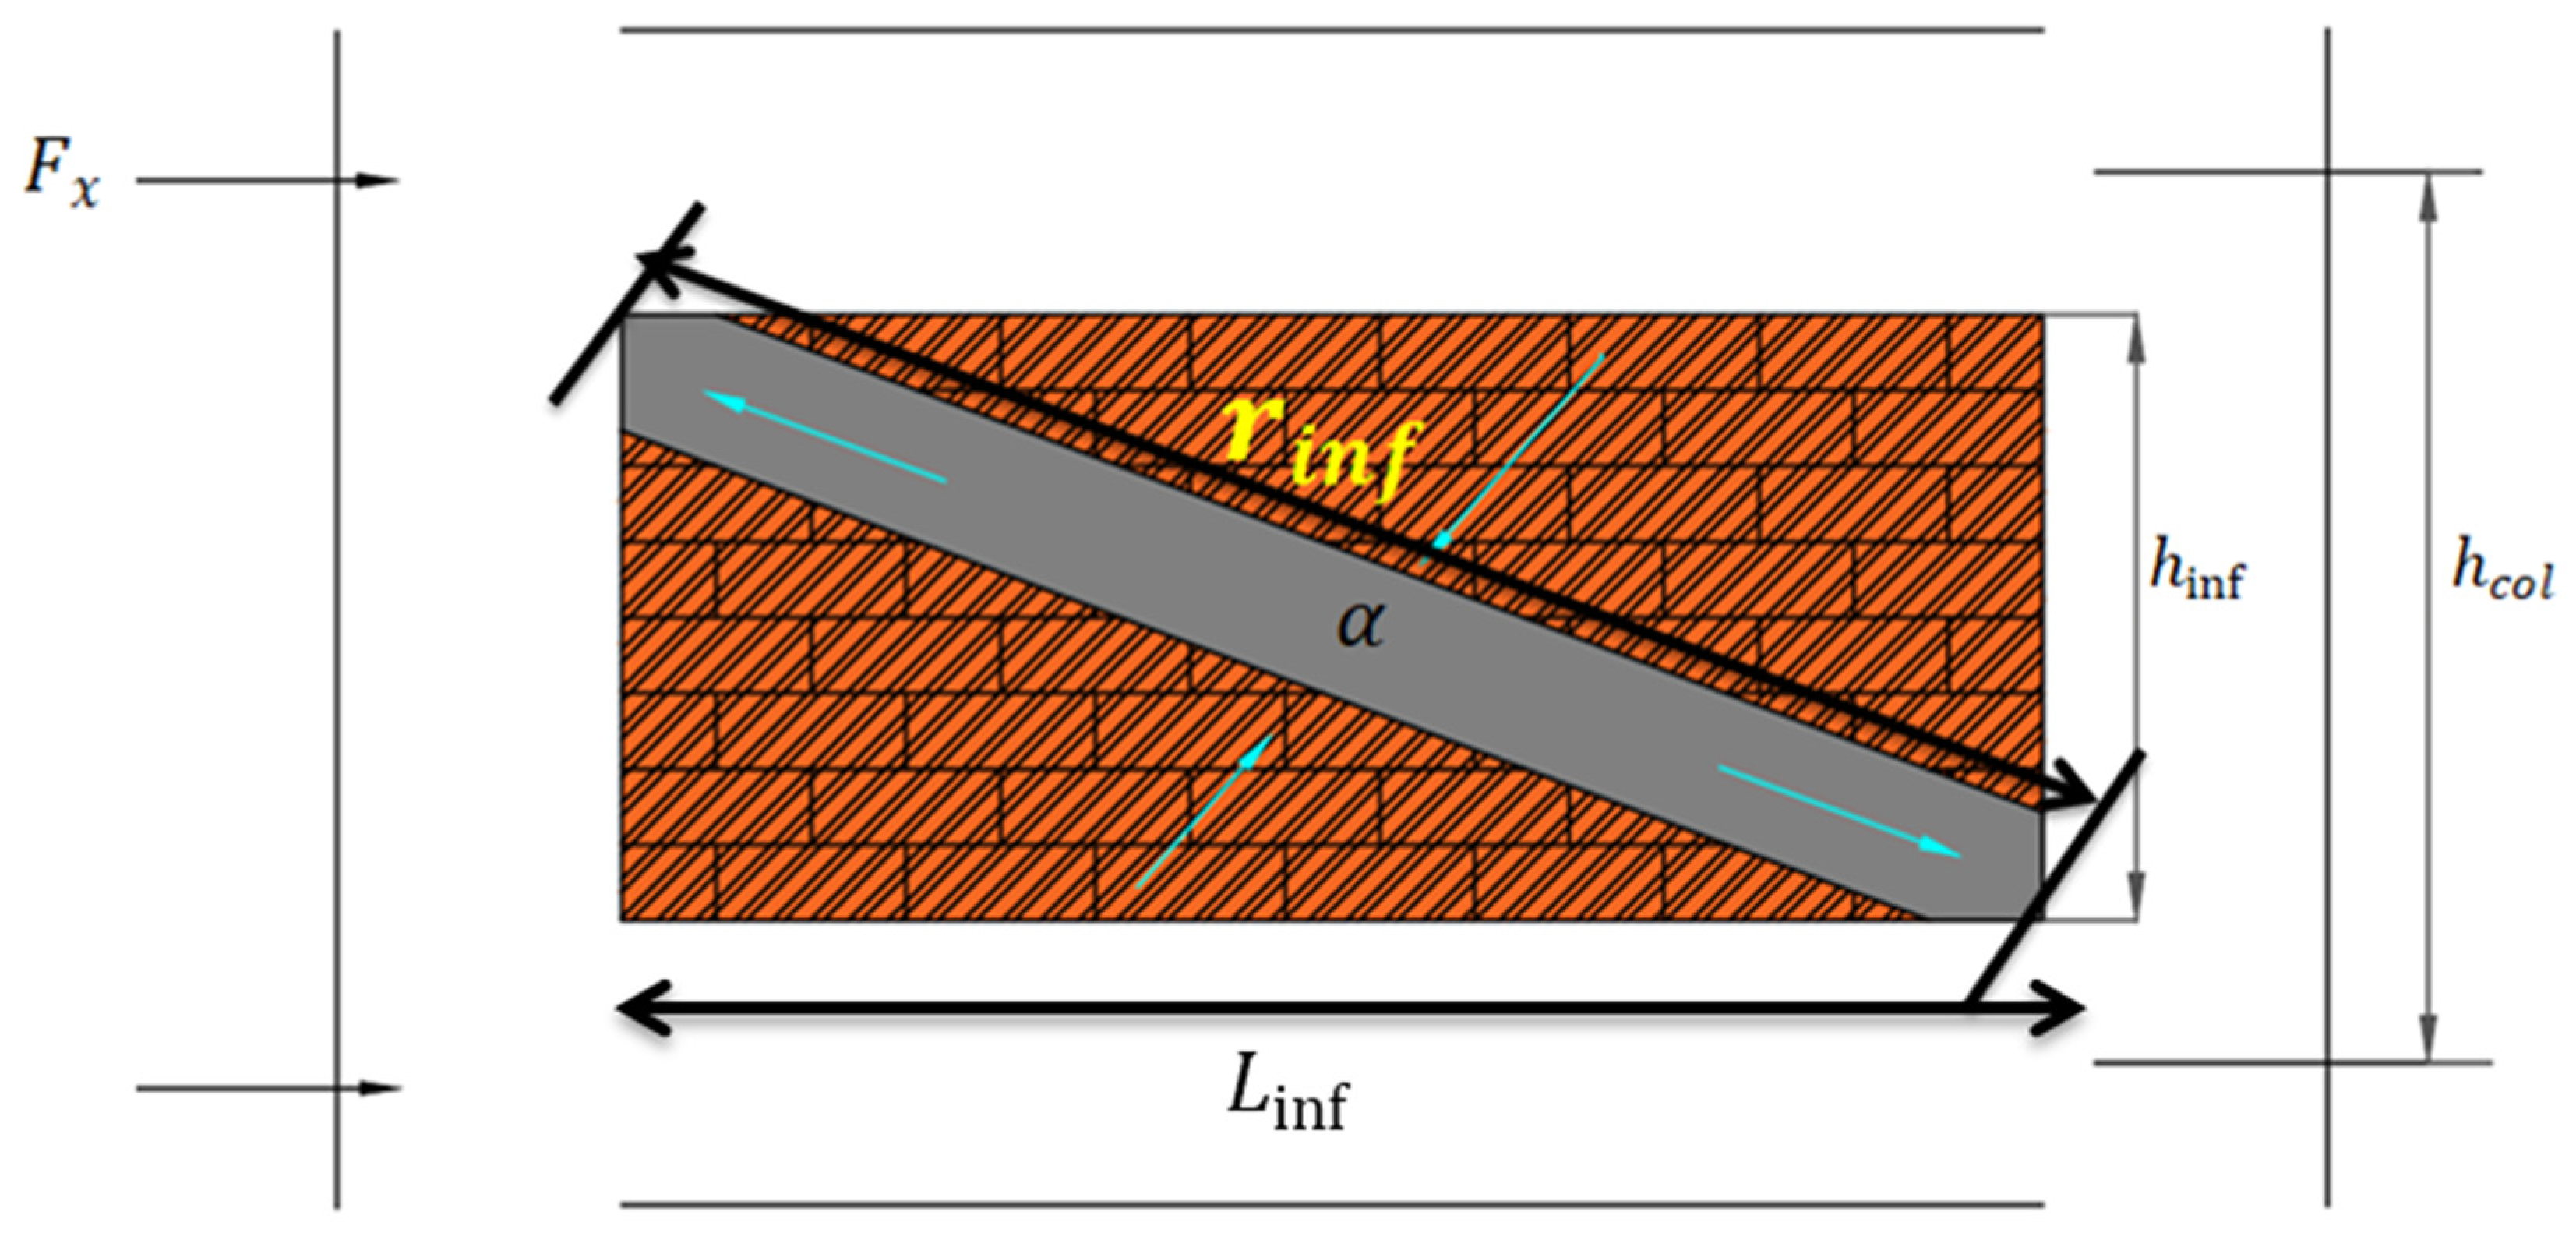
6.1. Modelling of Masonry Infill
7. Non-Linear Analysis to Assess Capacity and Demand
7.1. Non-Linear Static Analysis
7.2. Non-Linear Dynamic Analysis
8. Results and Discussion
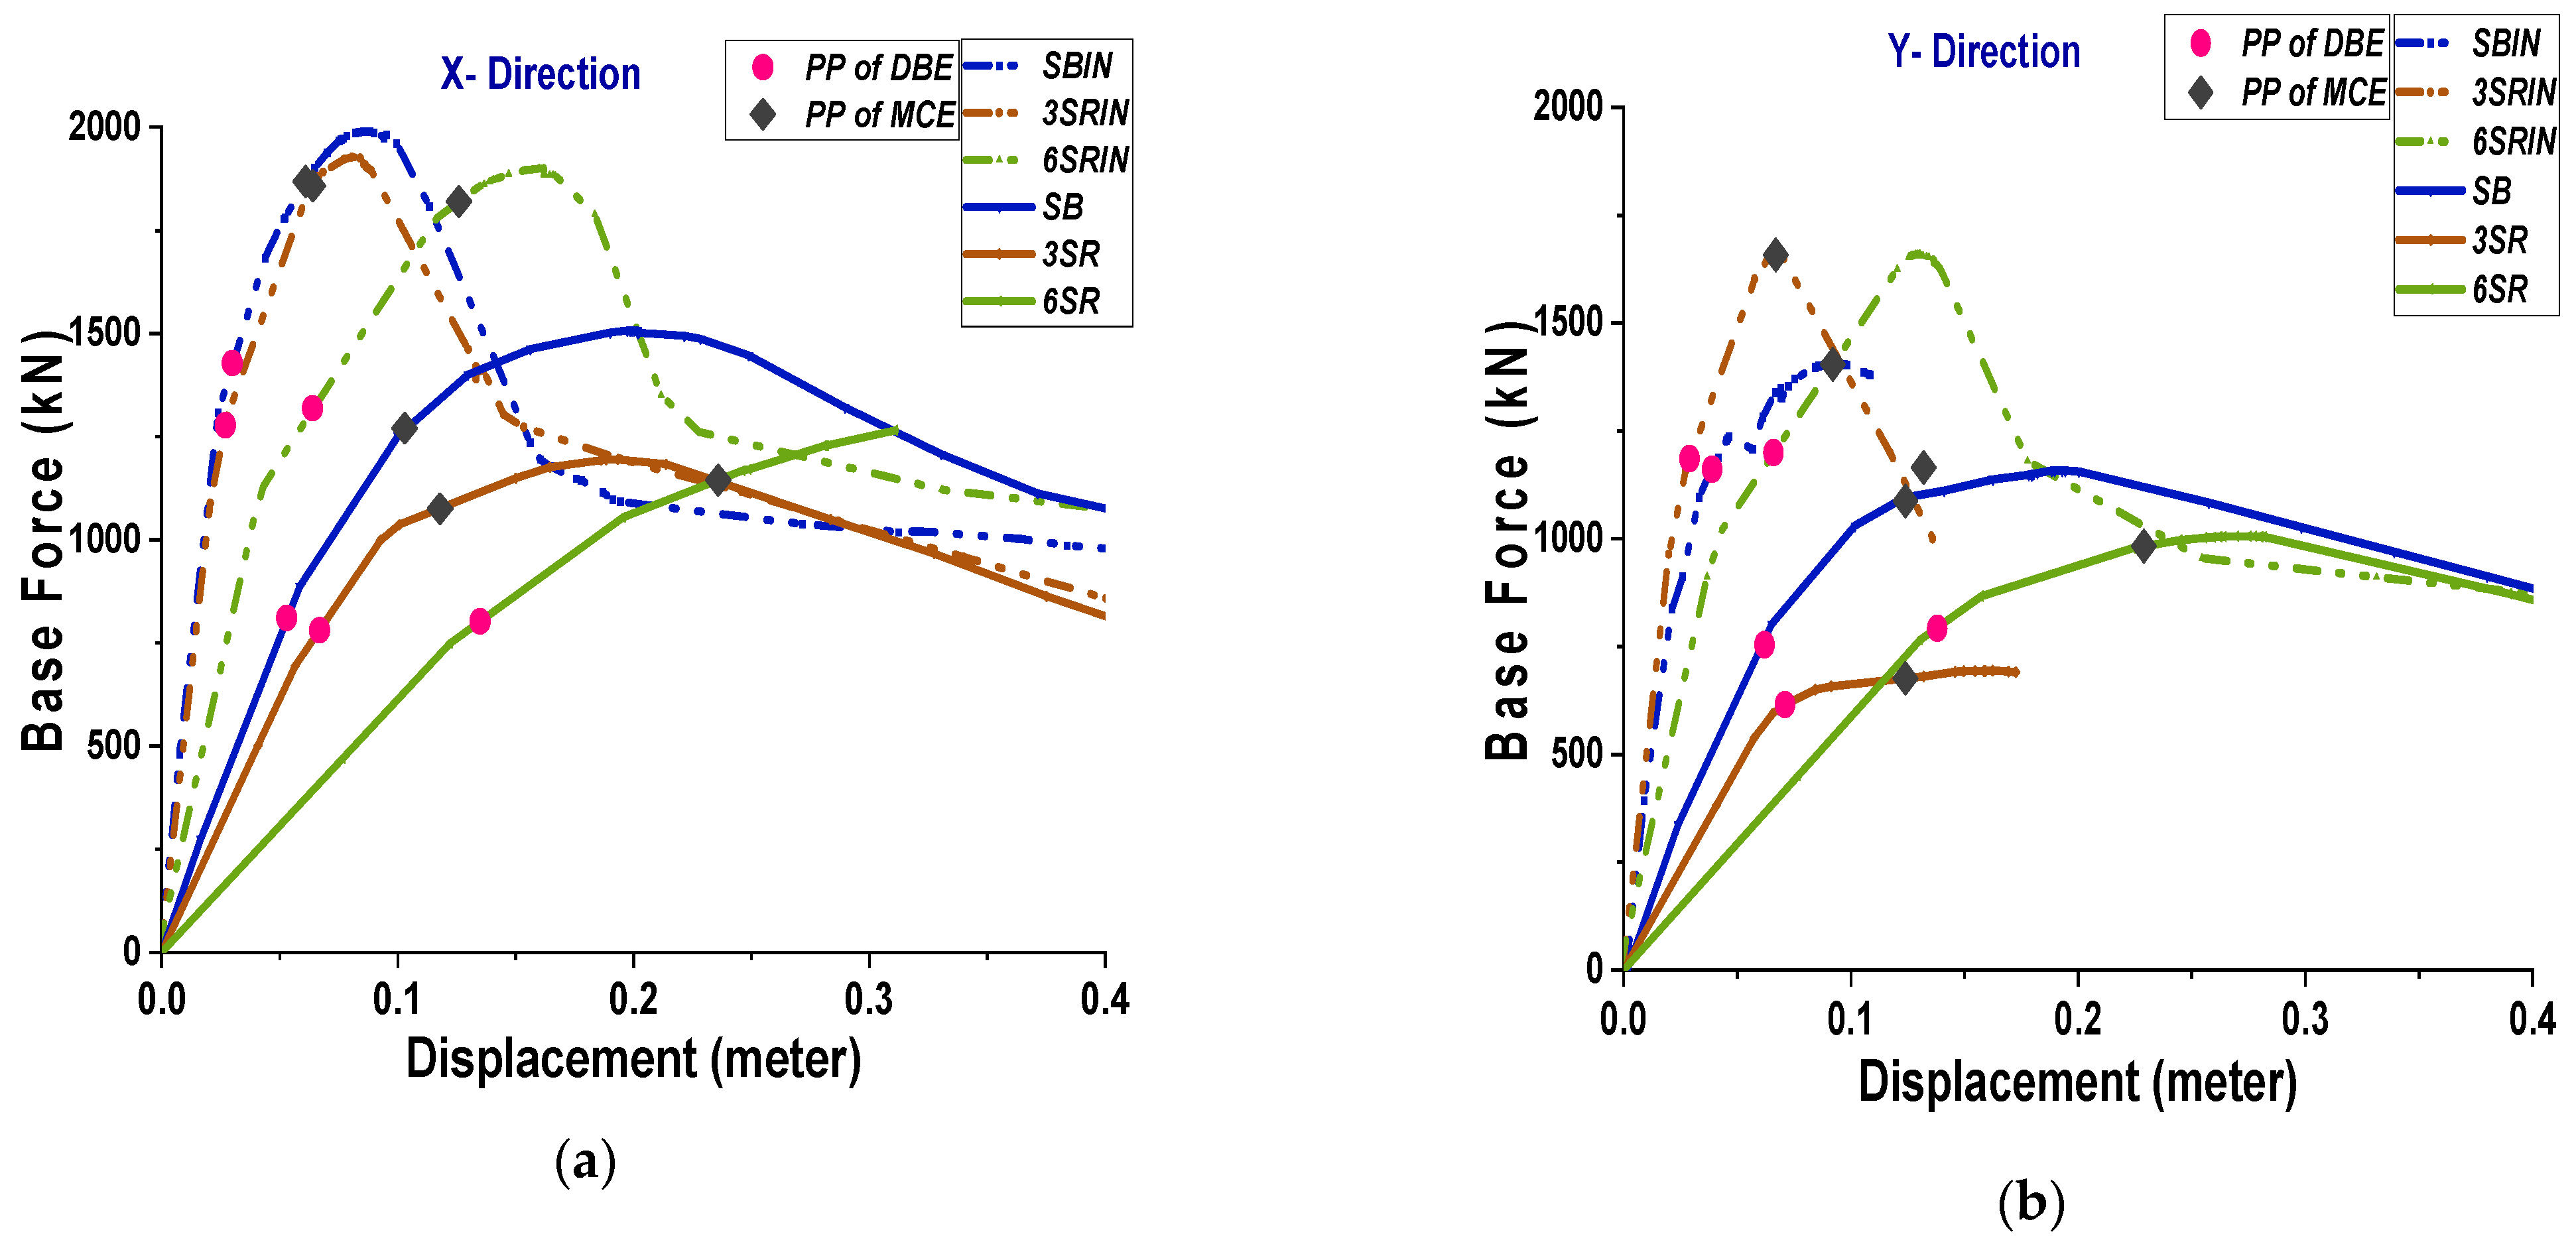
8.1. Capacity Curve
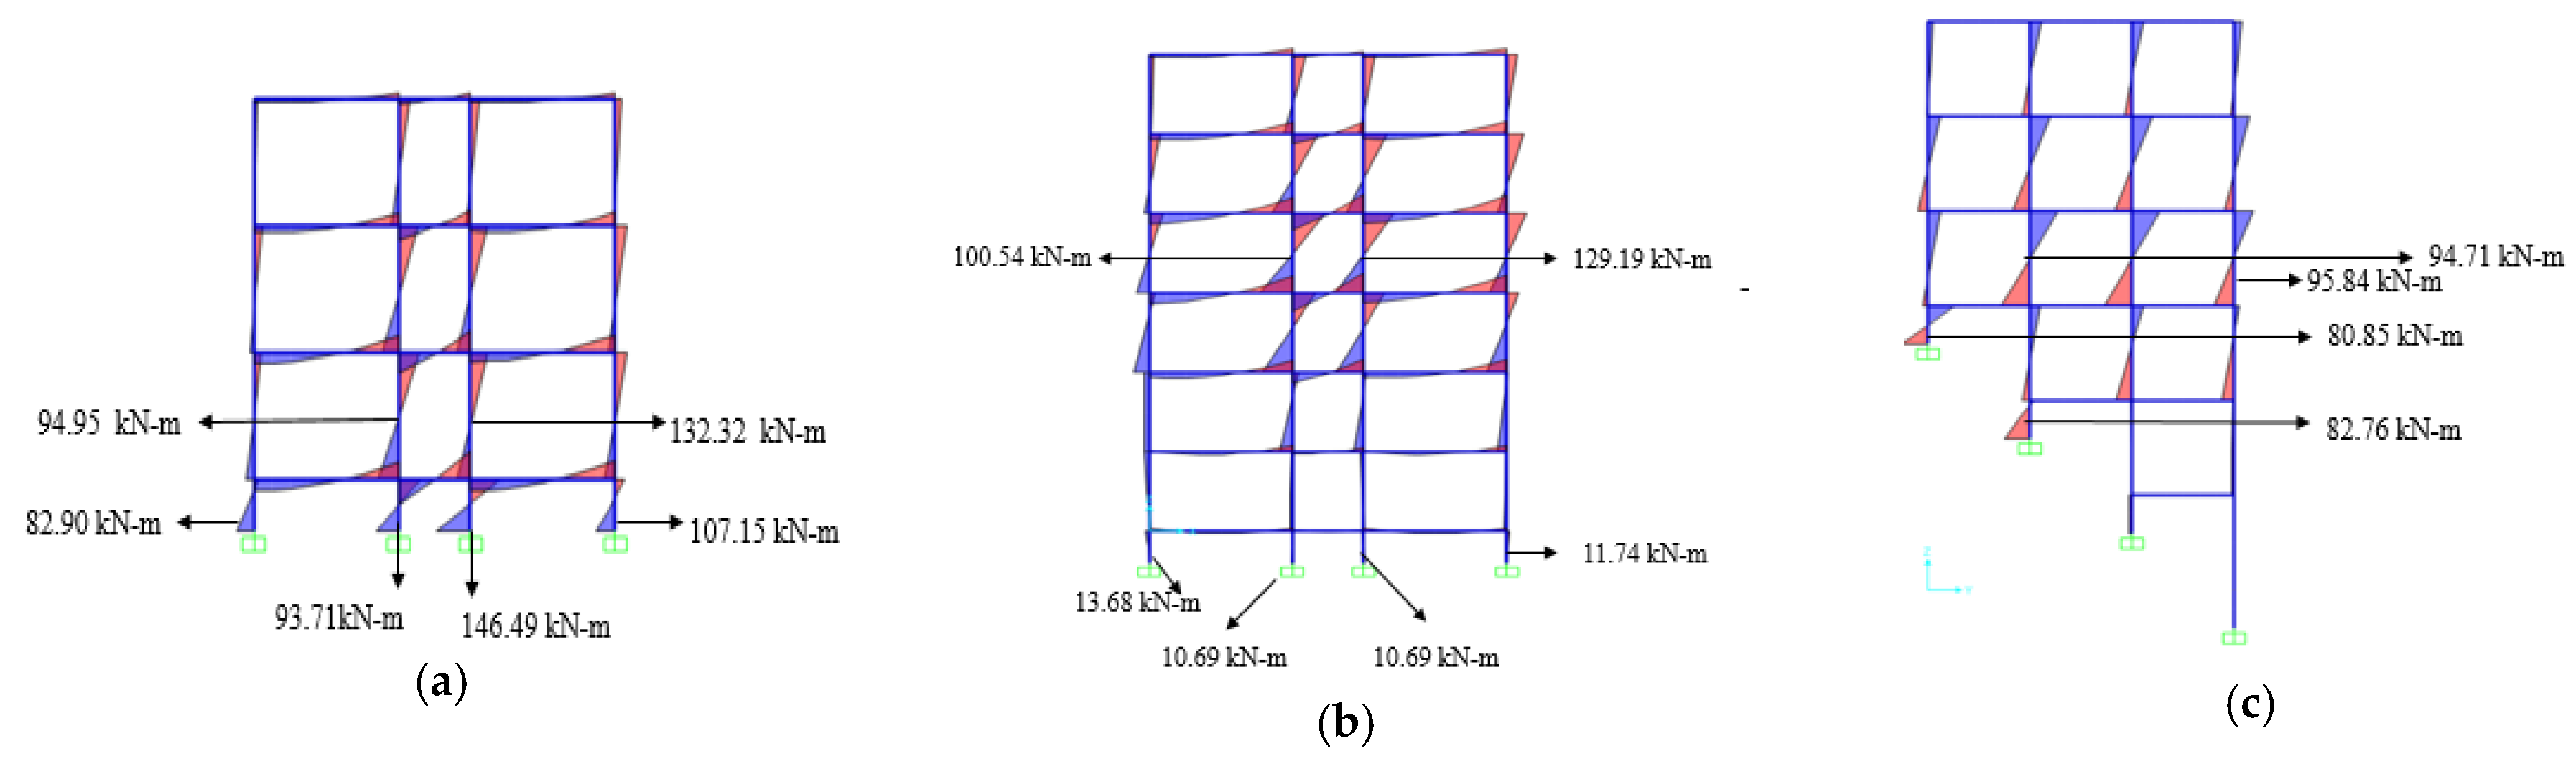
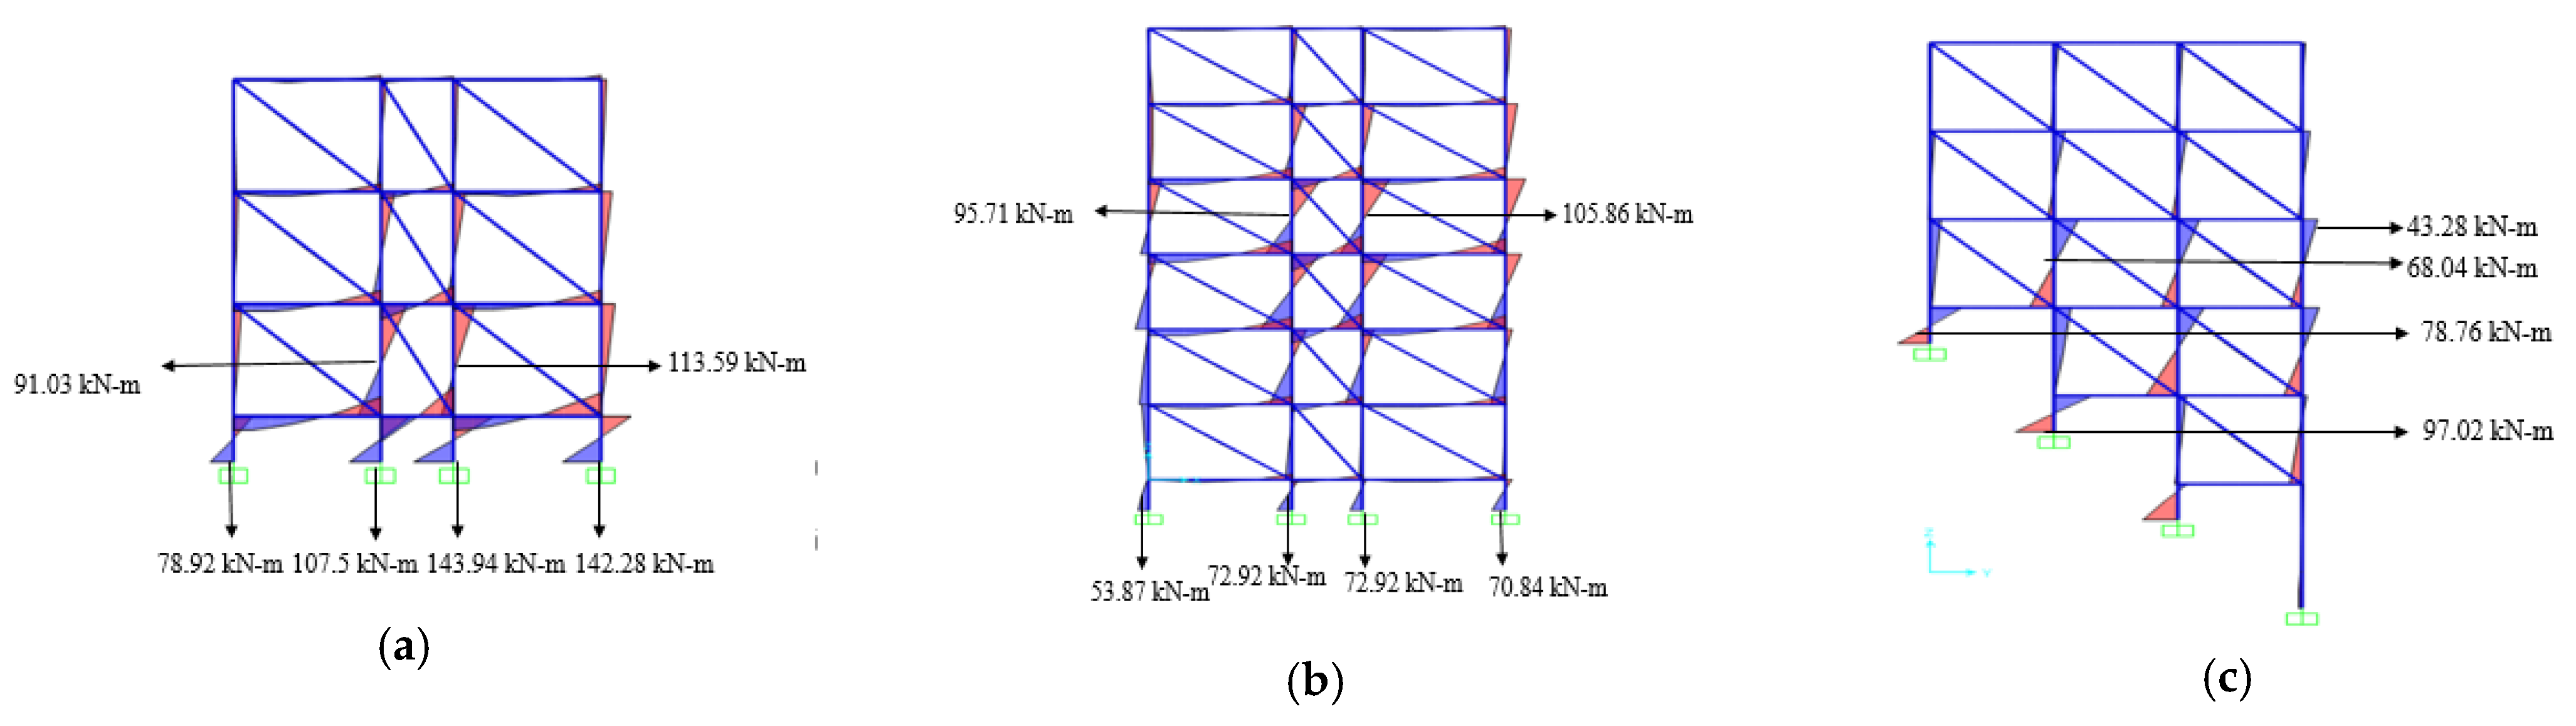
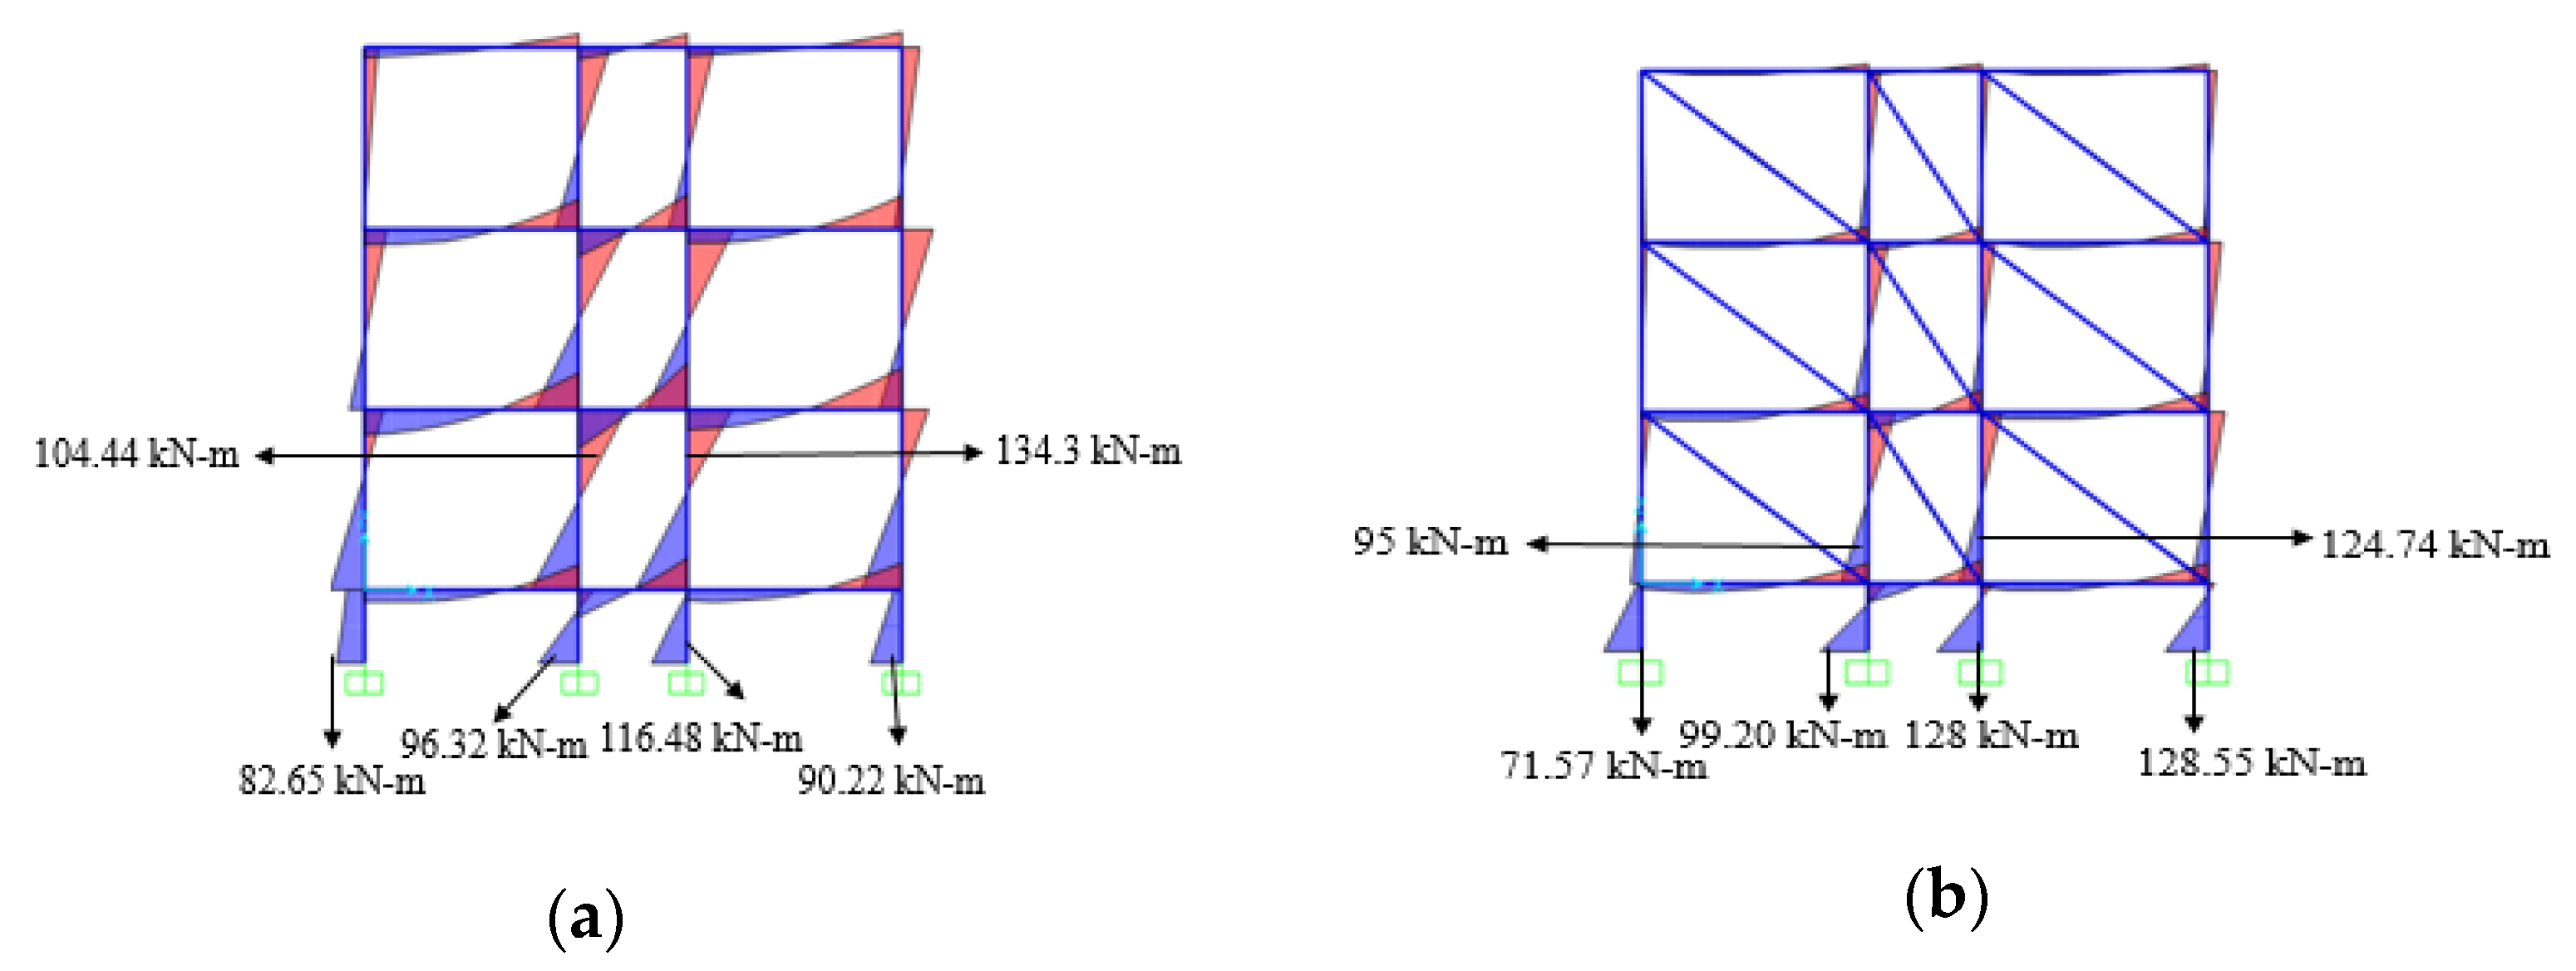
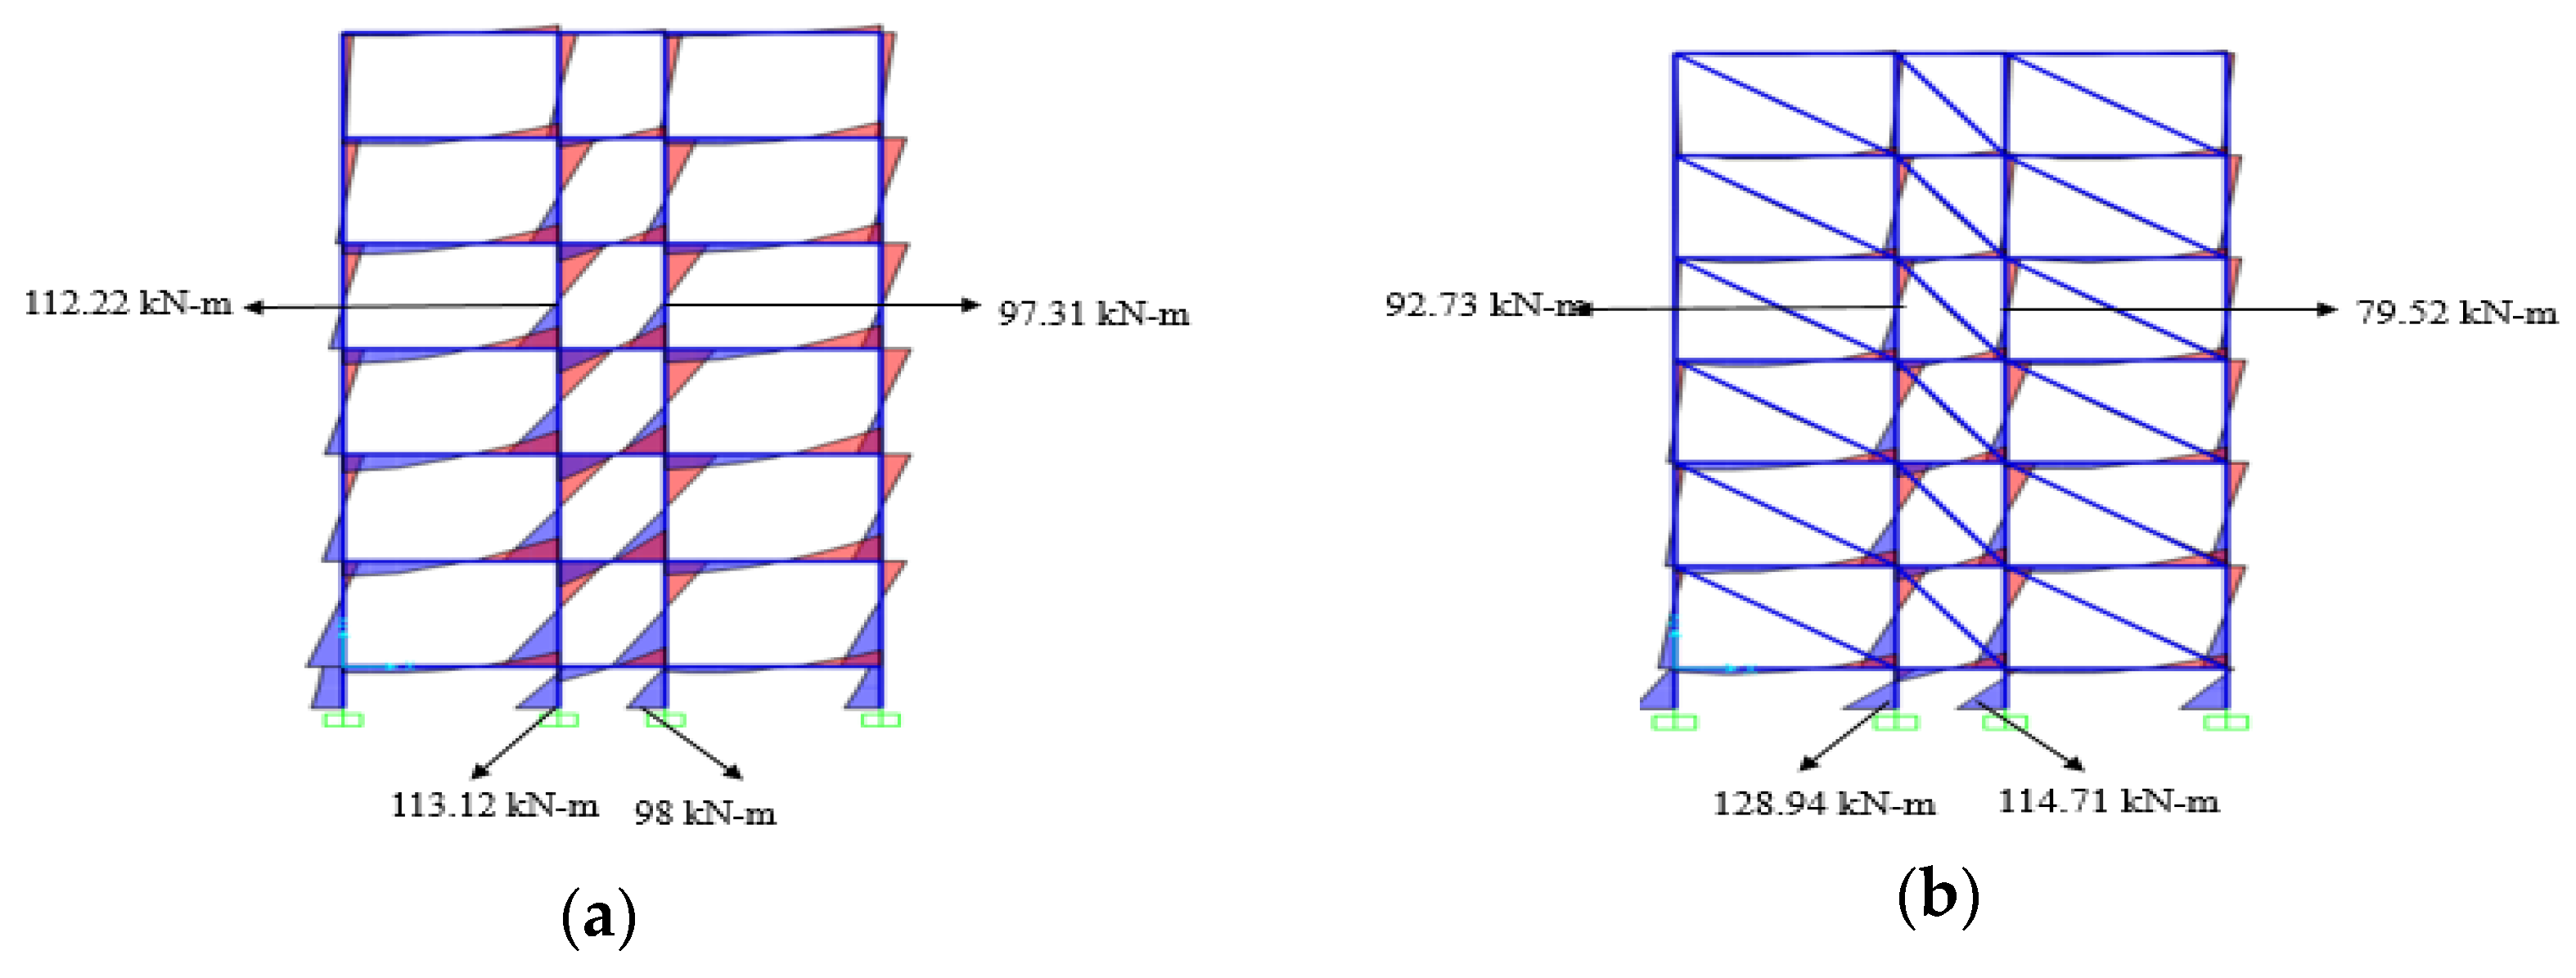
8.2. Variations in Bending Moments in Step-Back Buildings and Regular Buildings with and without Infills
8.3. Results of Non-Linear Time History Analysis
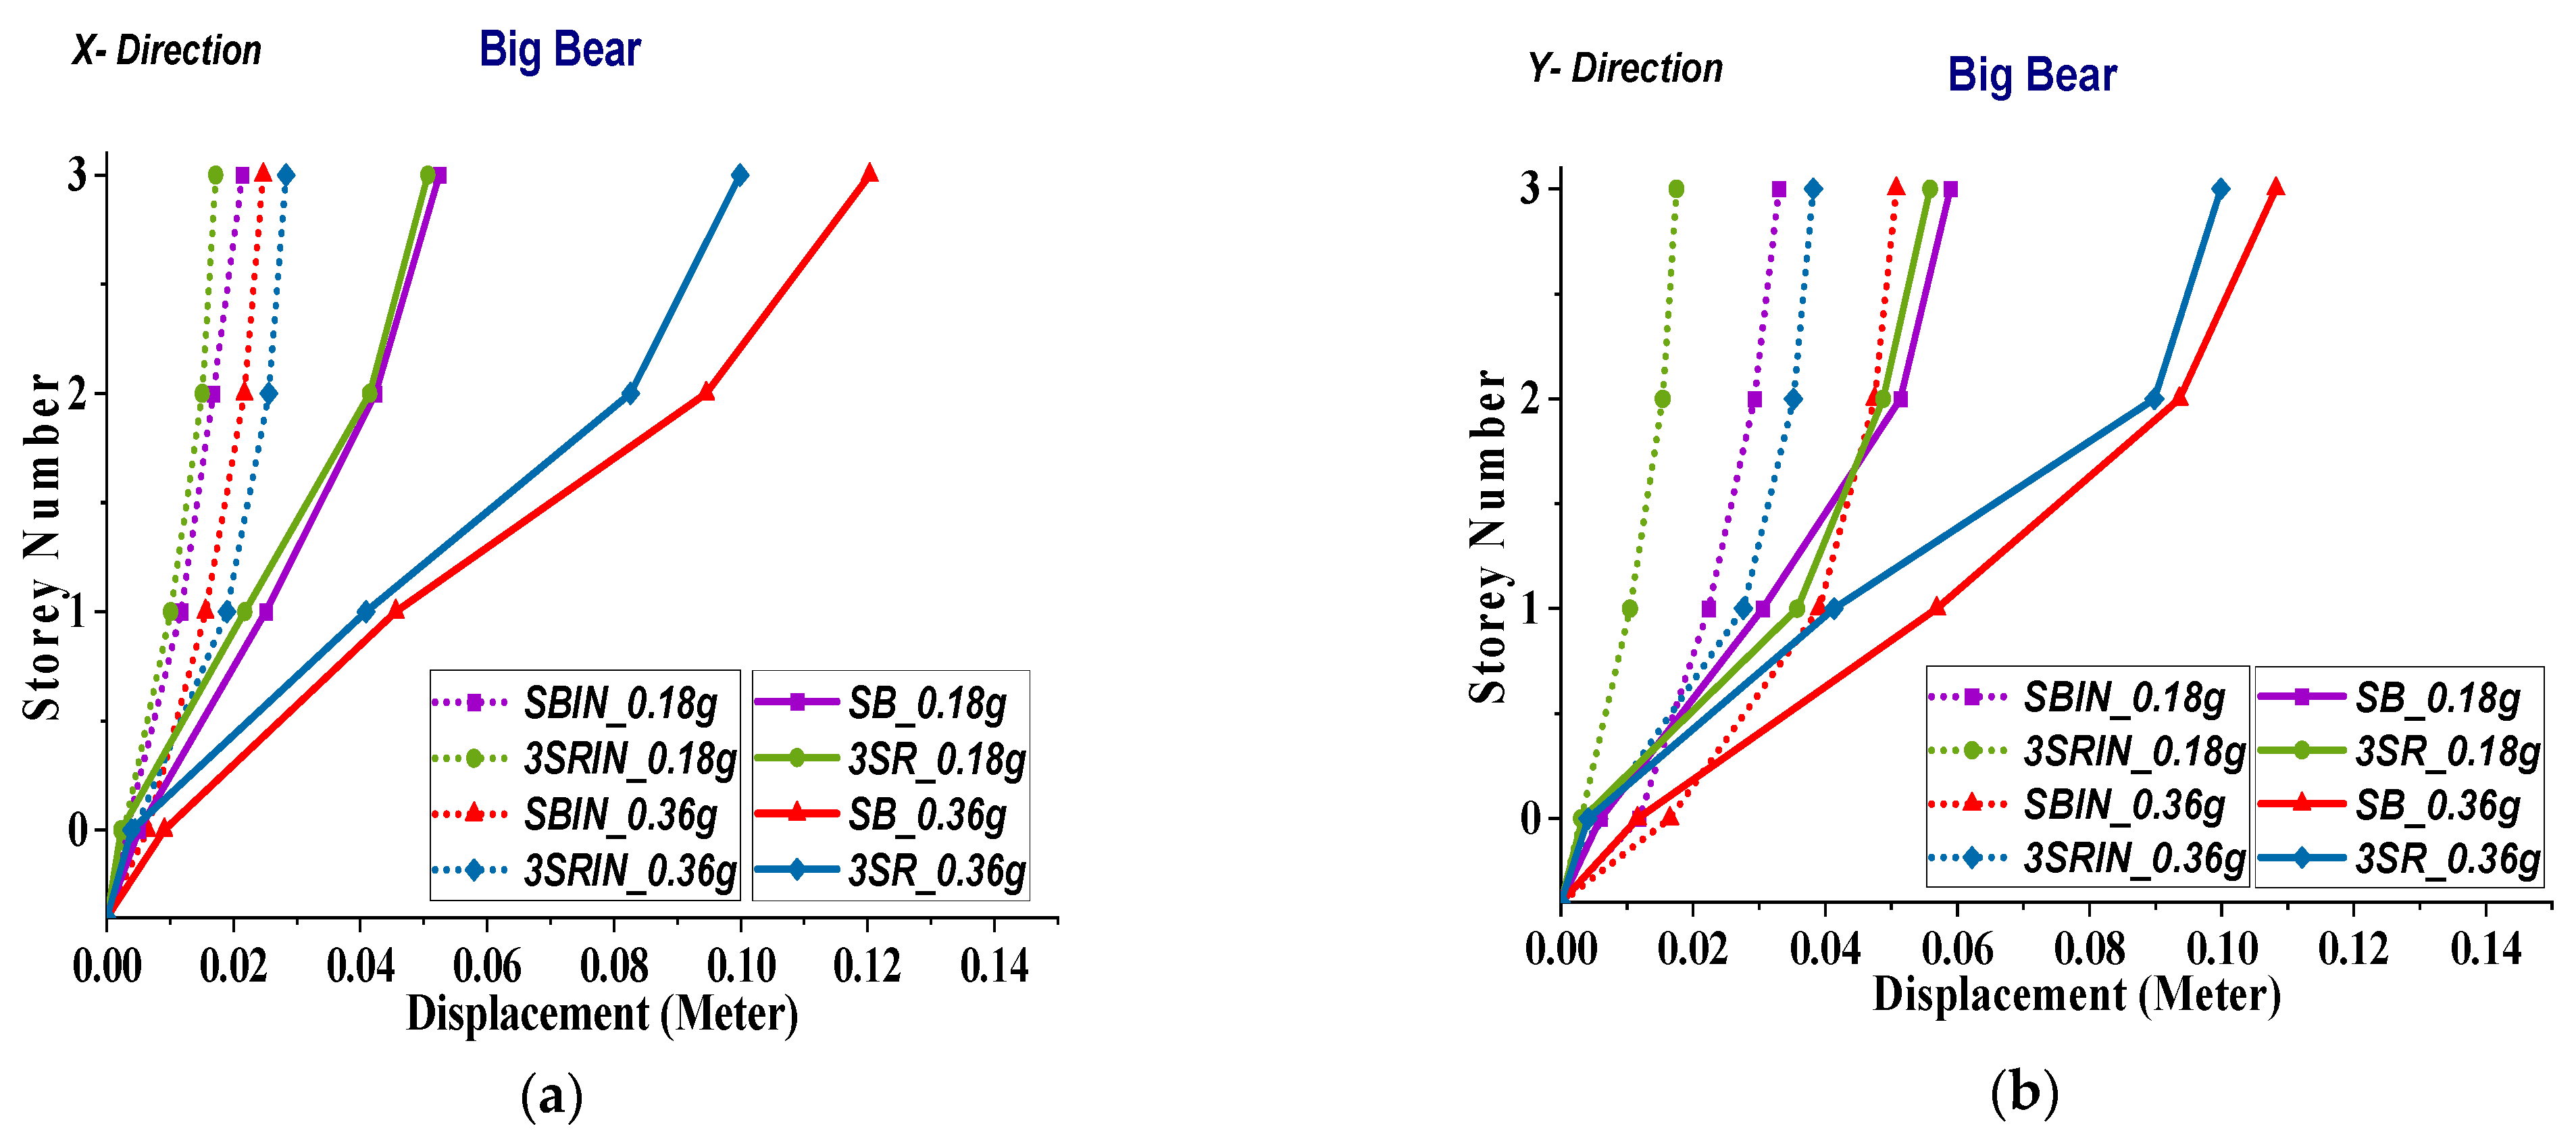
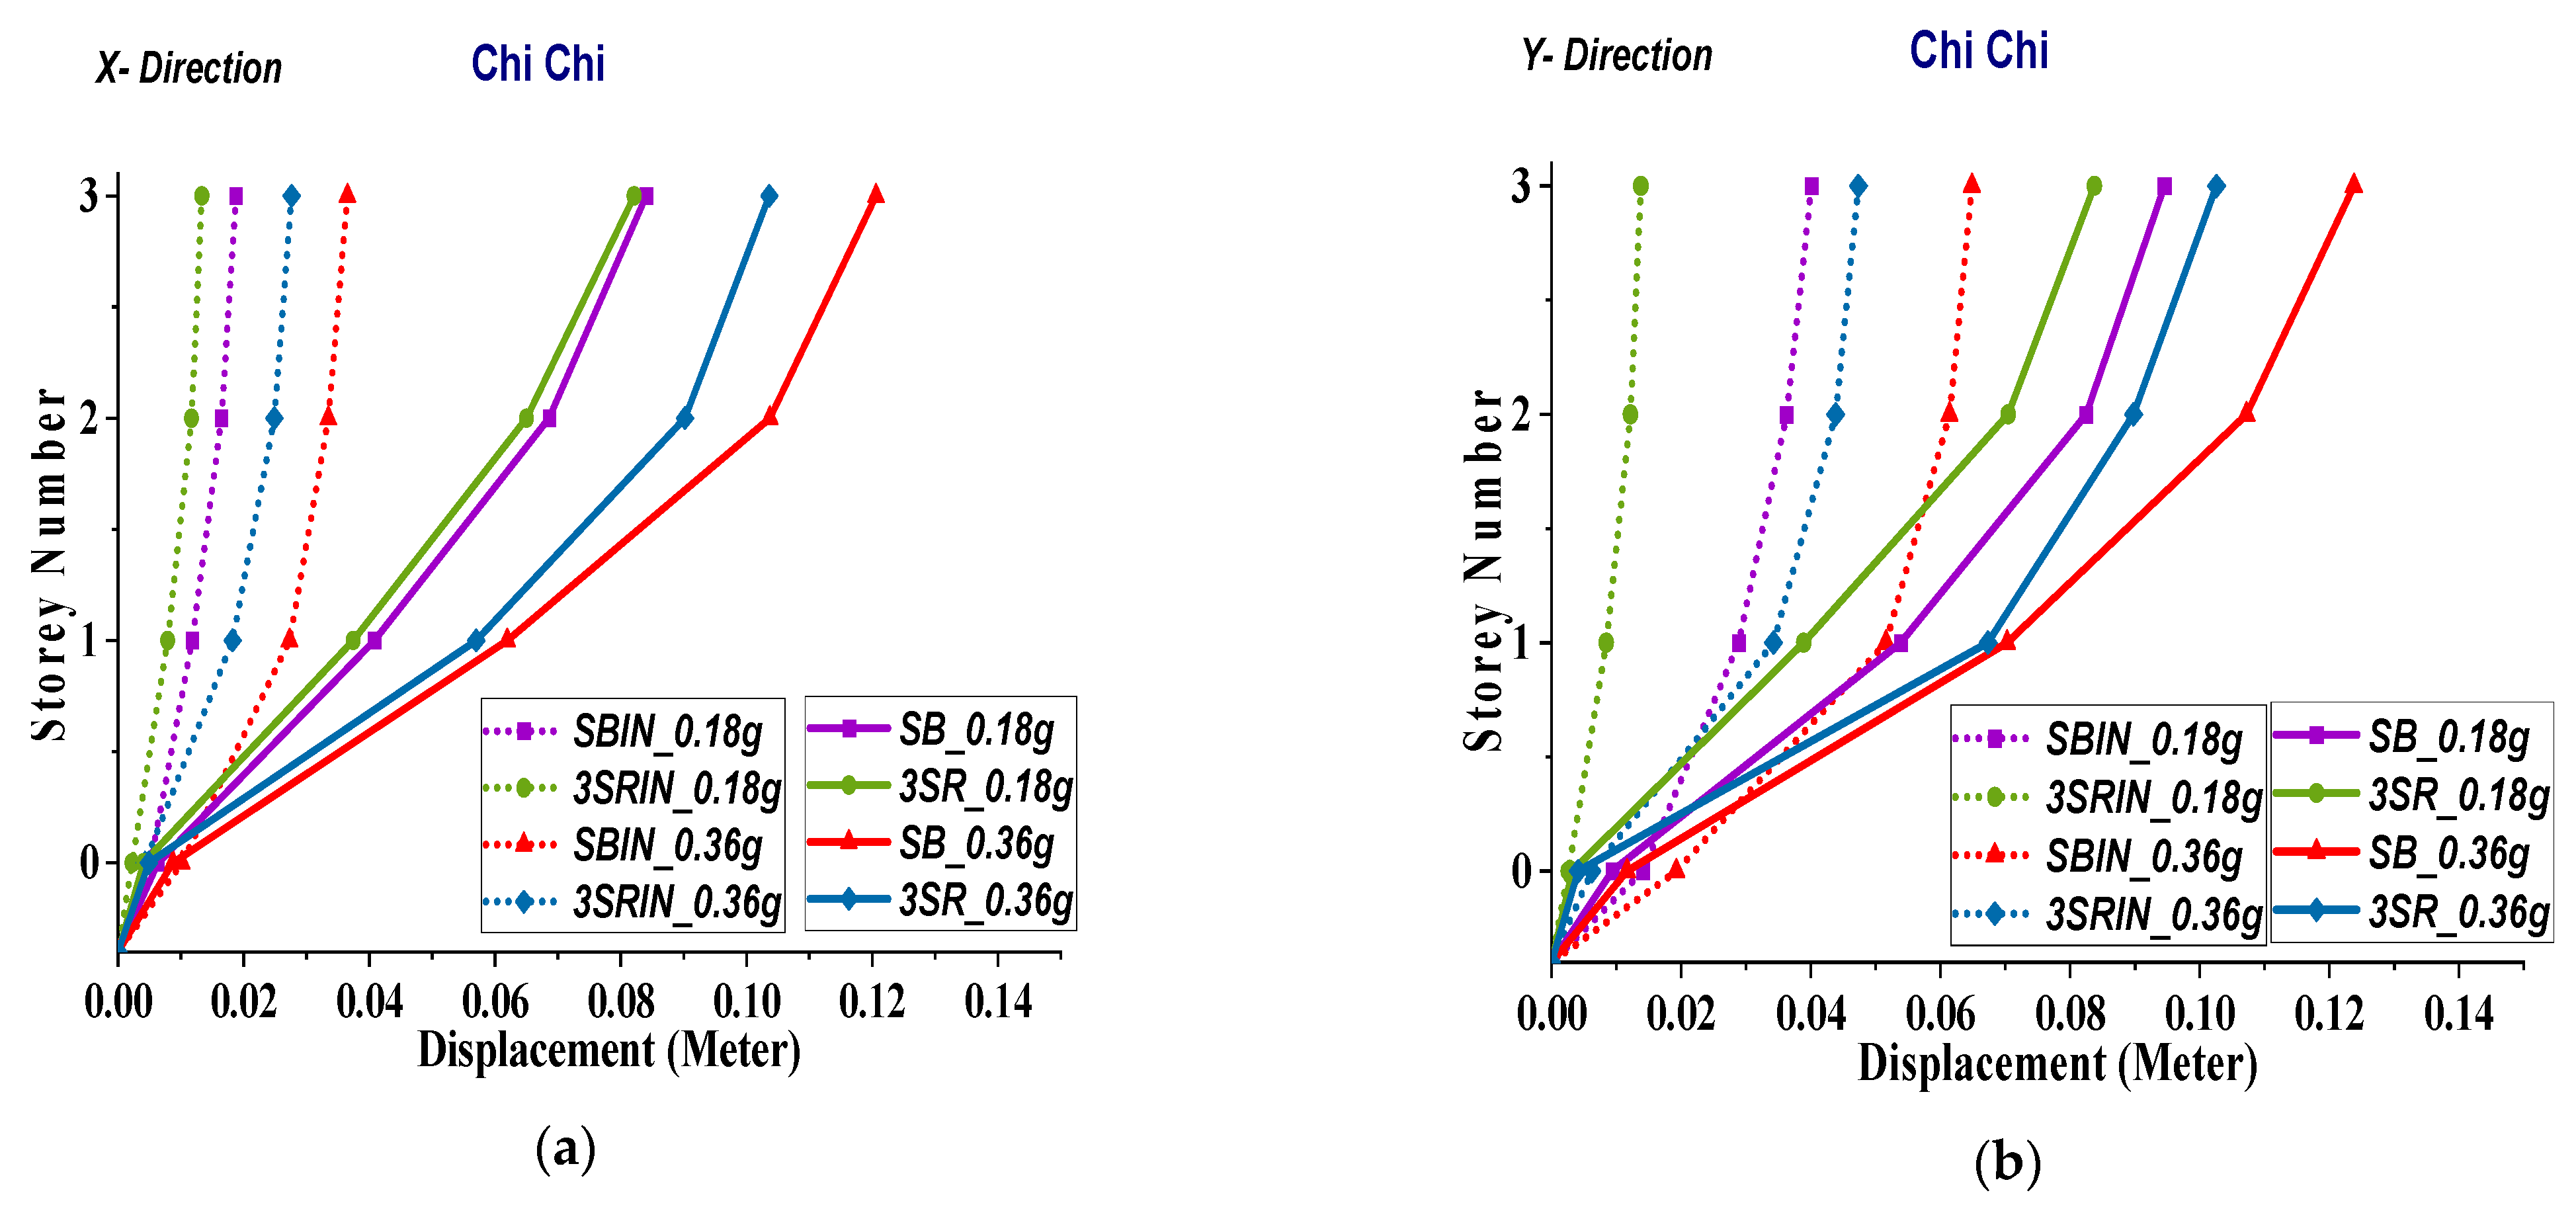
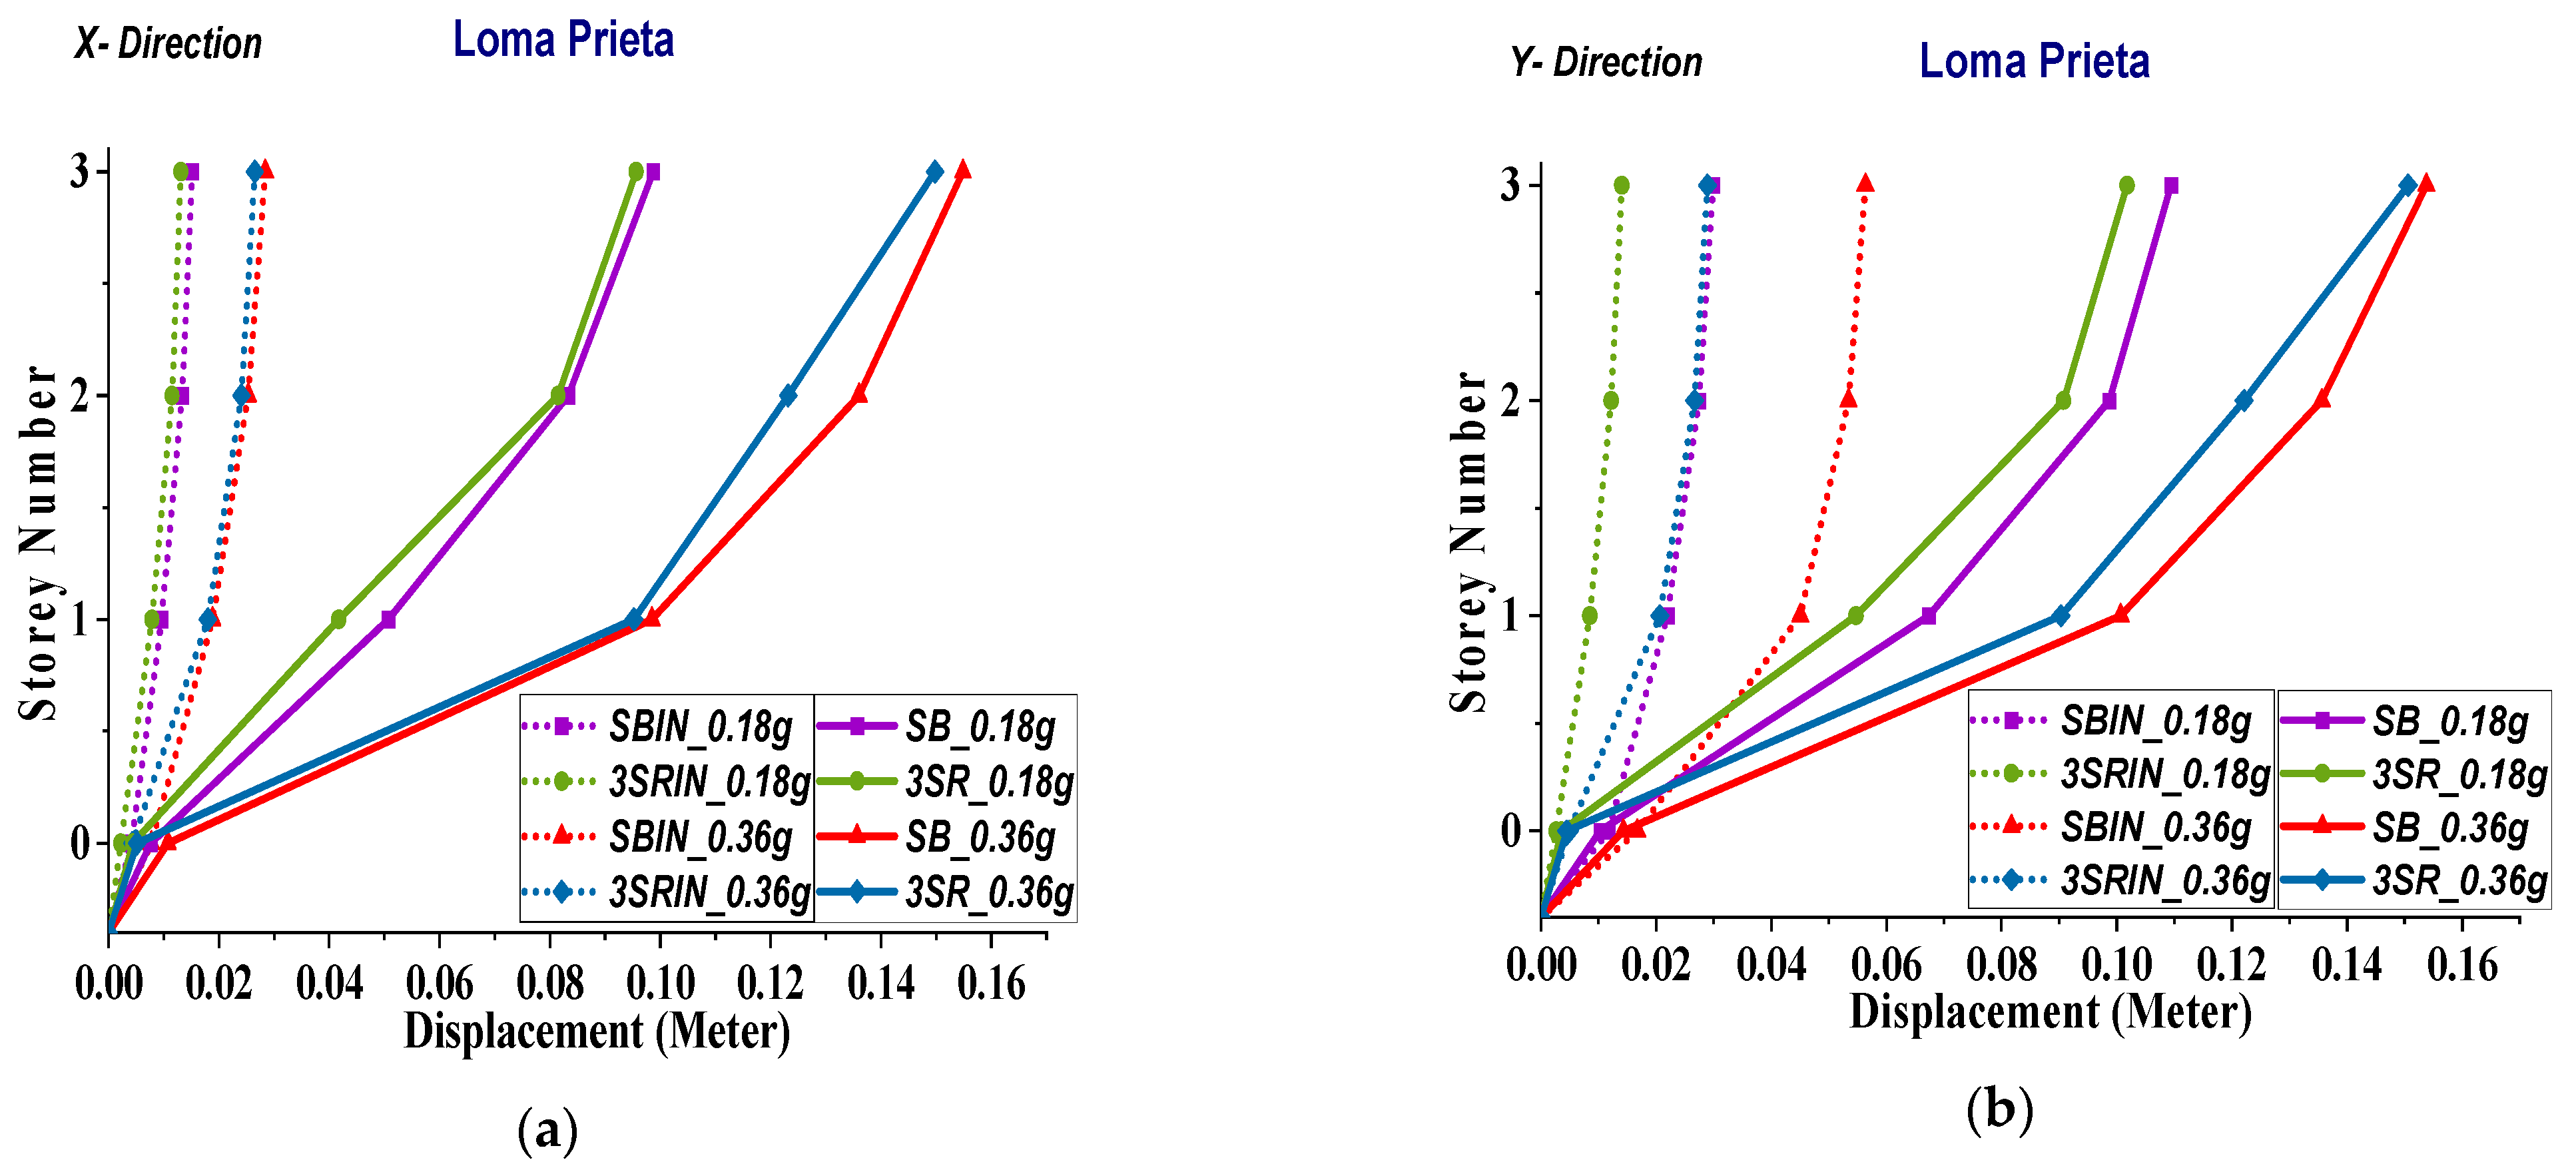
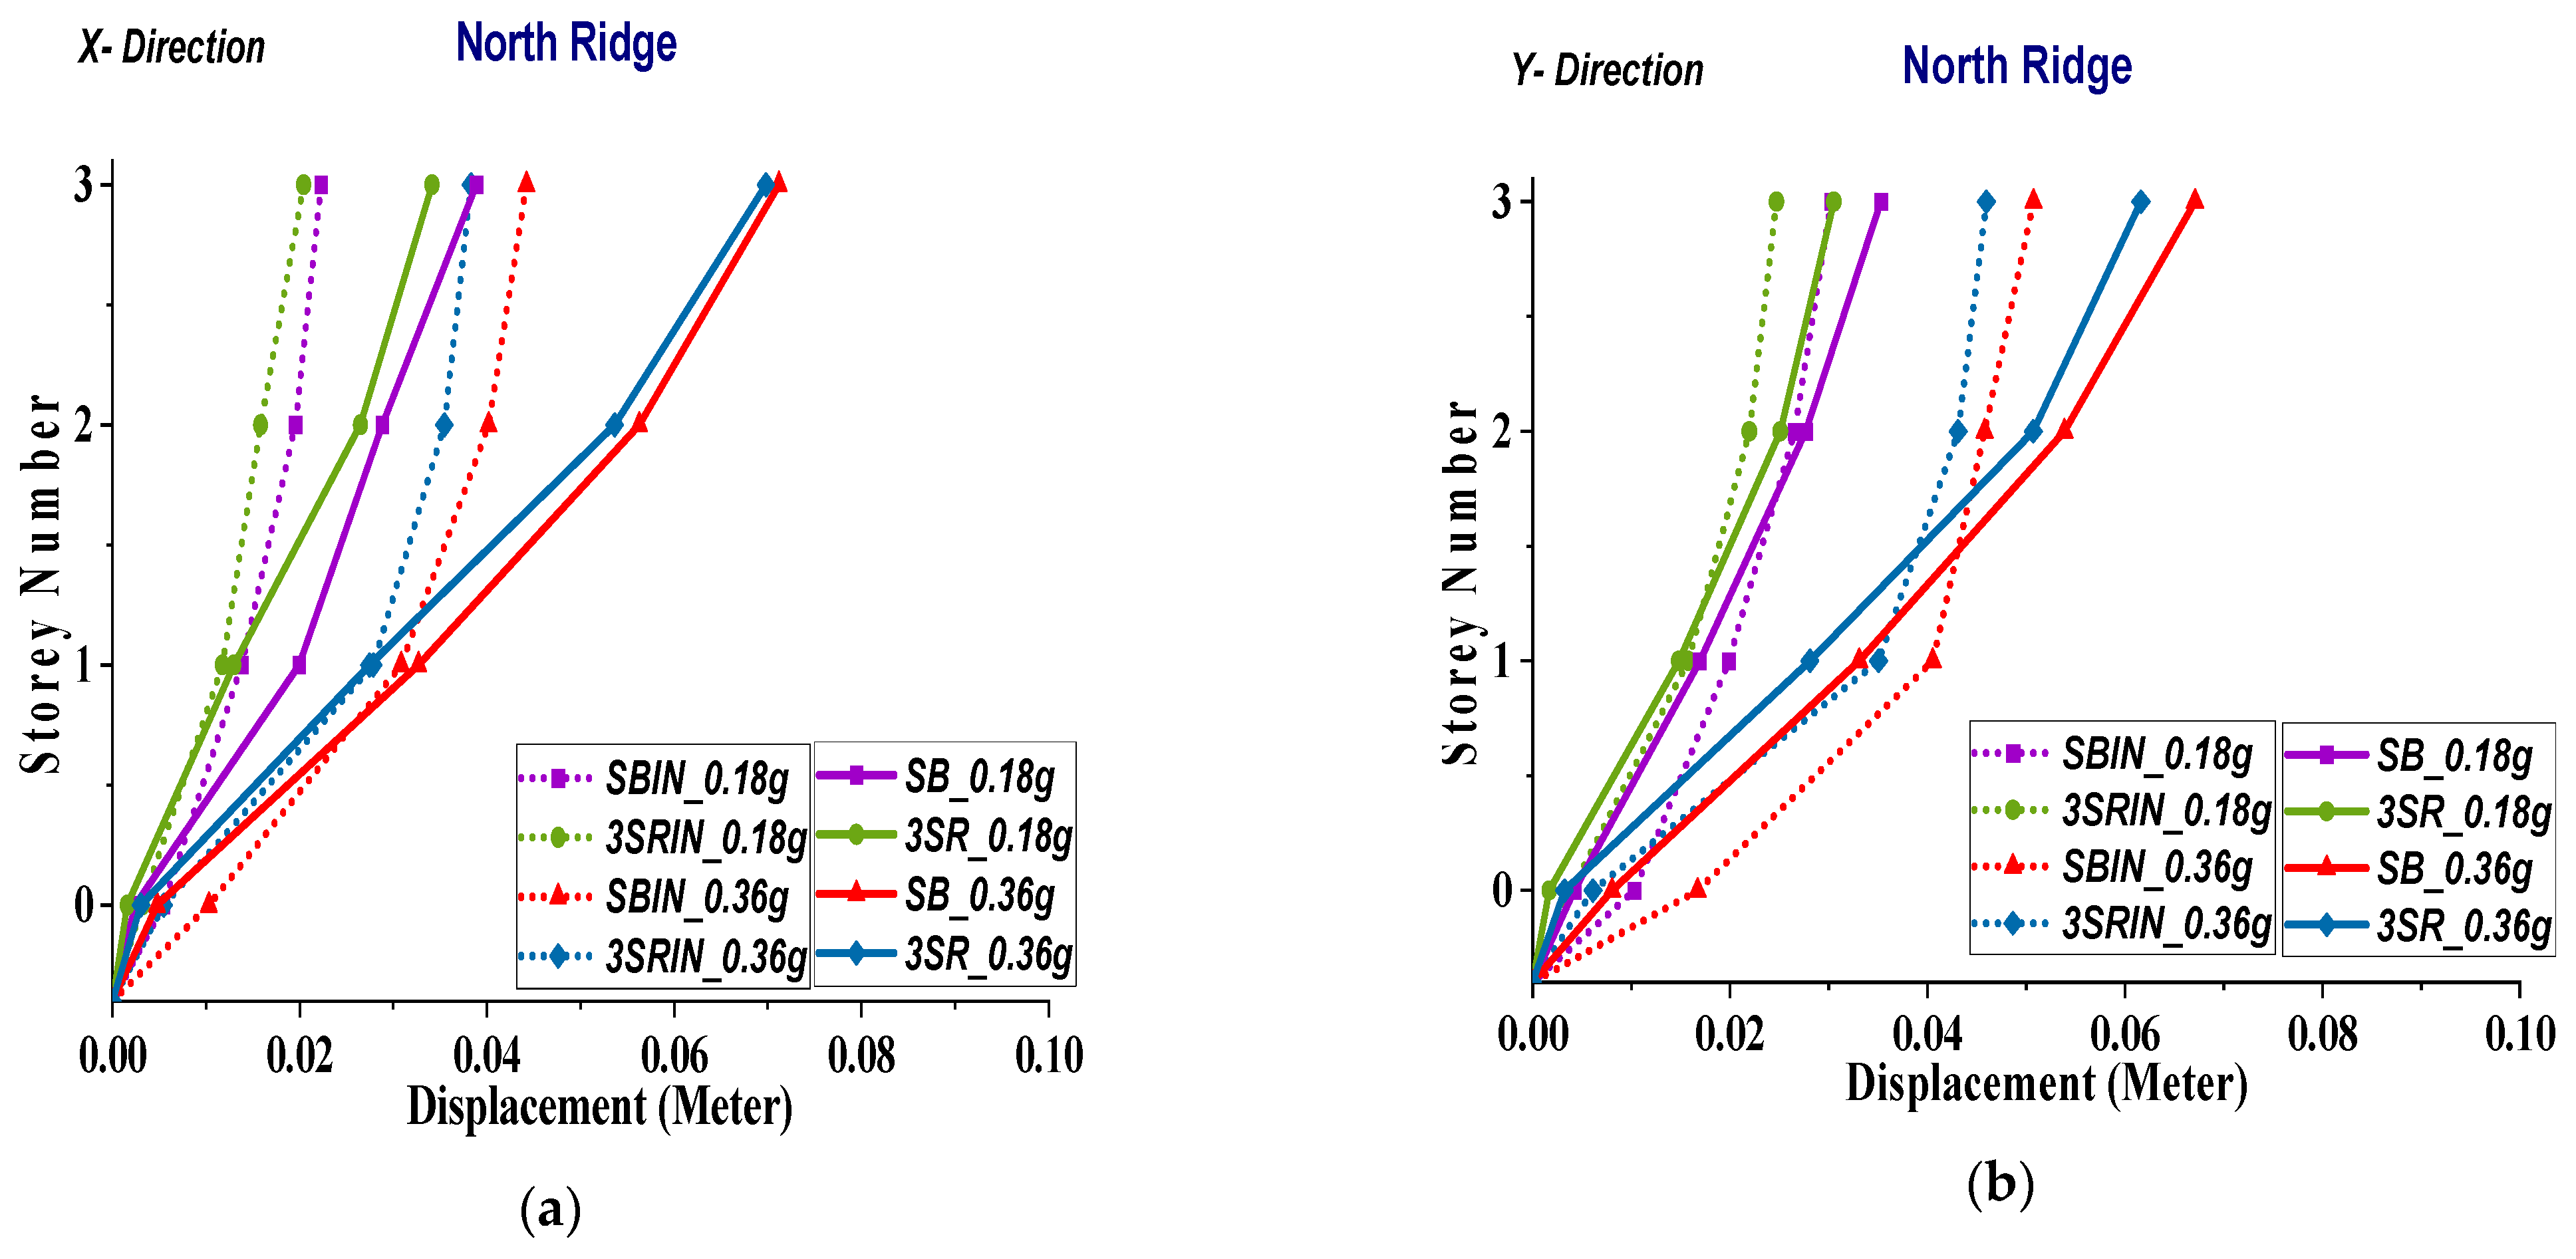
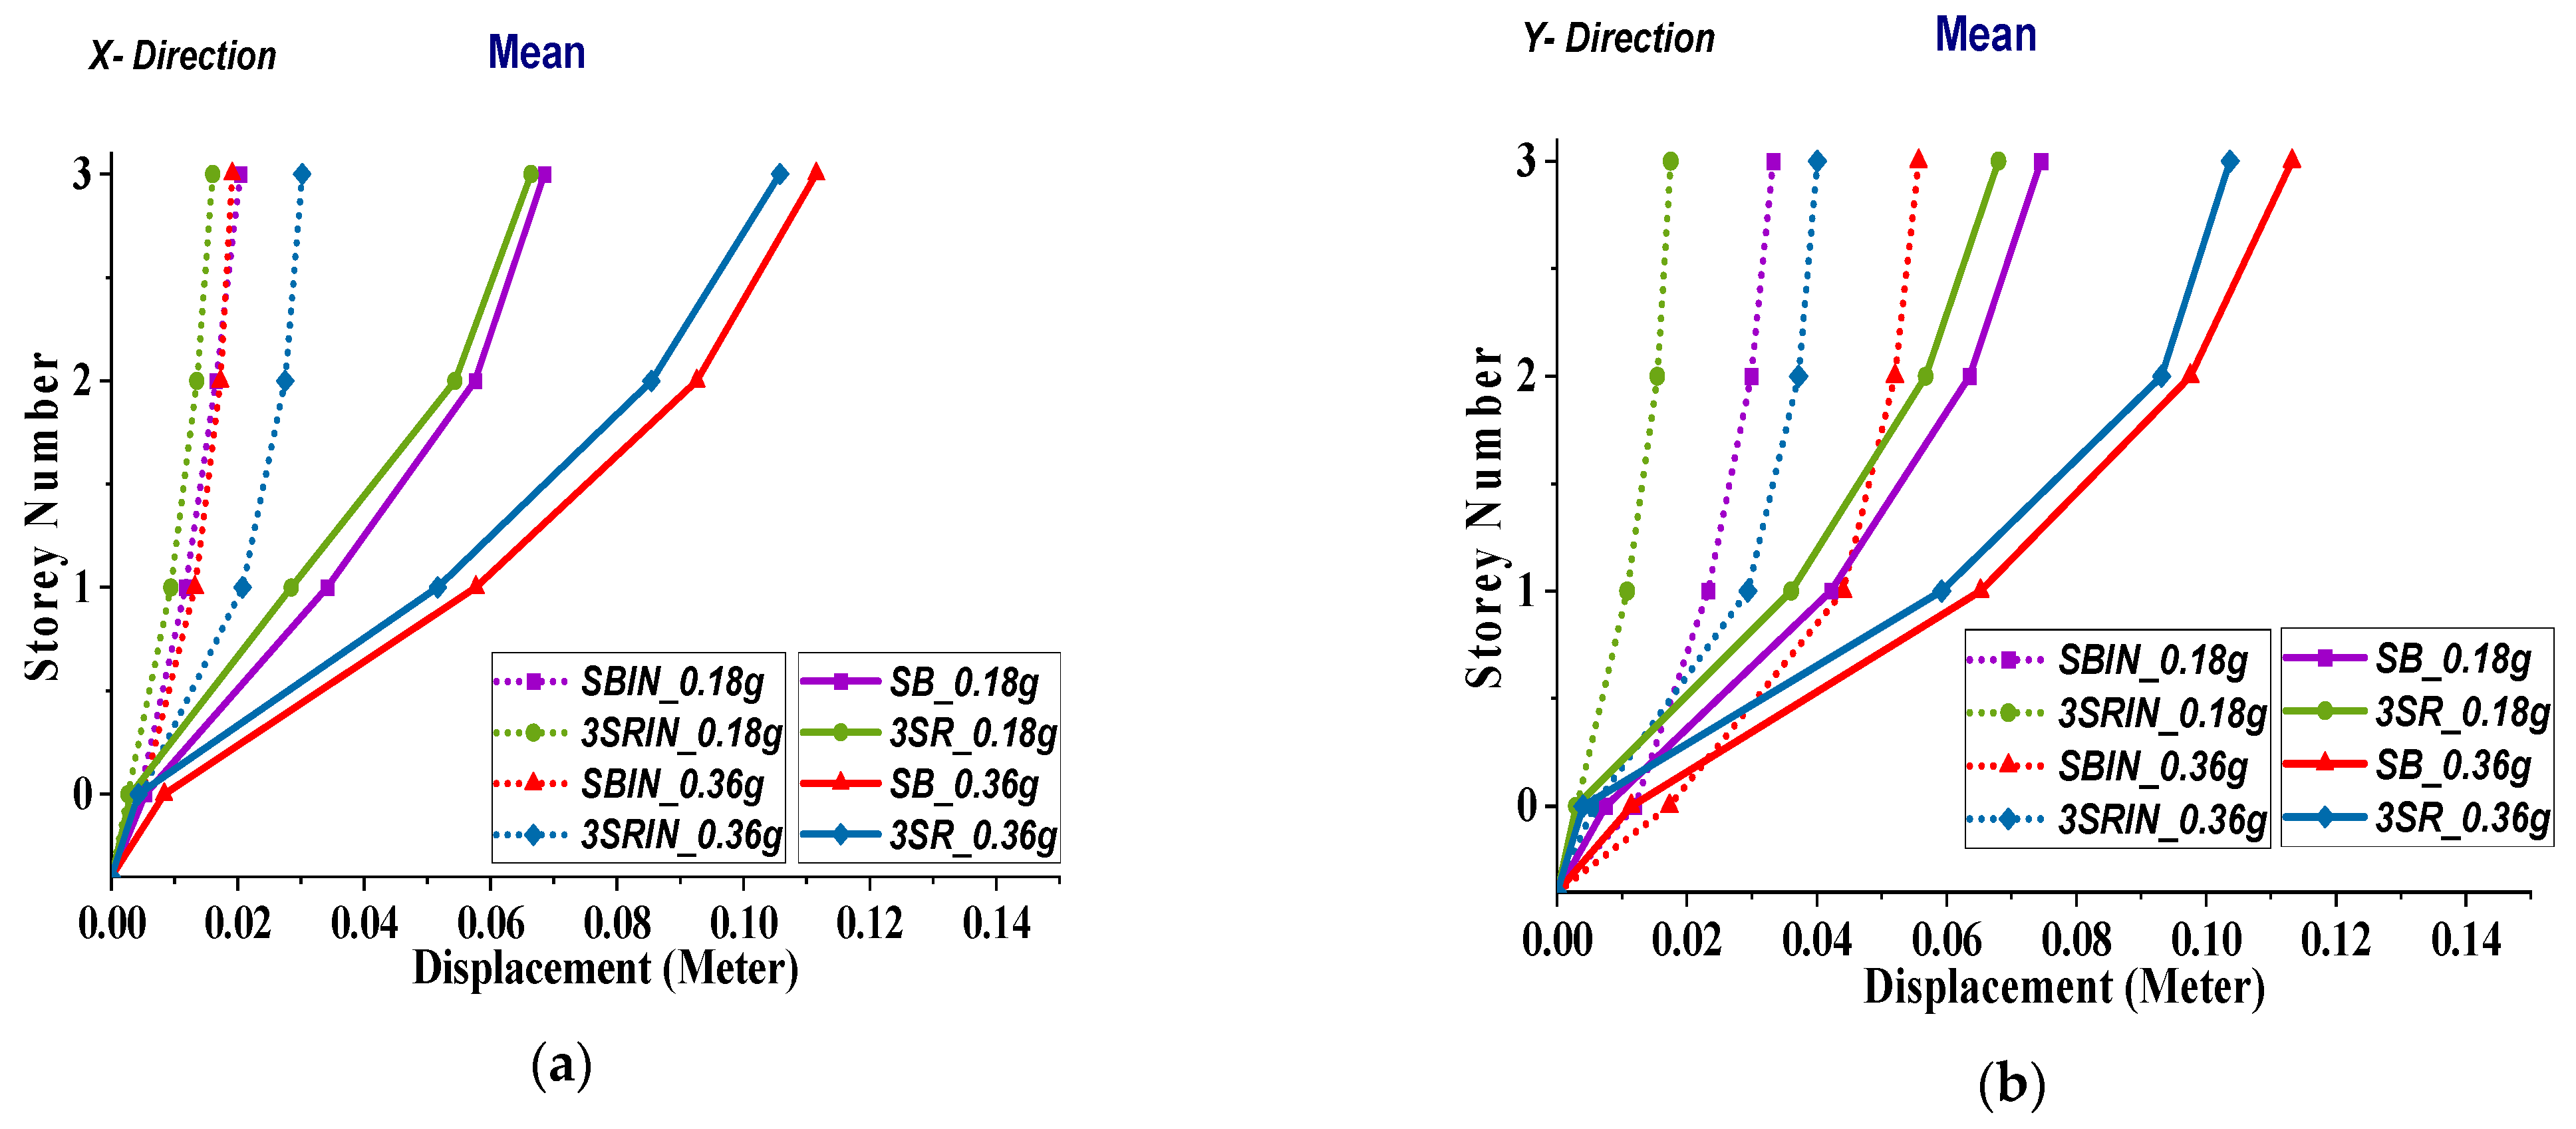
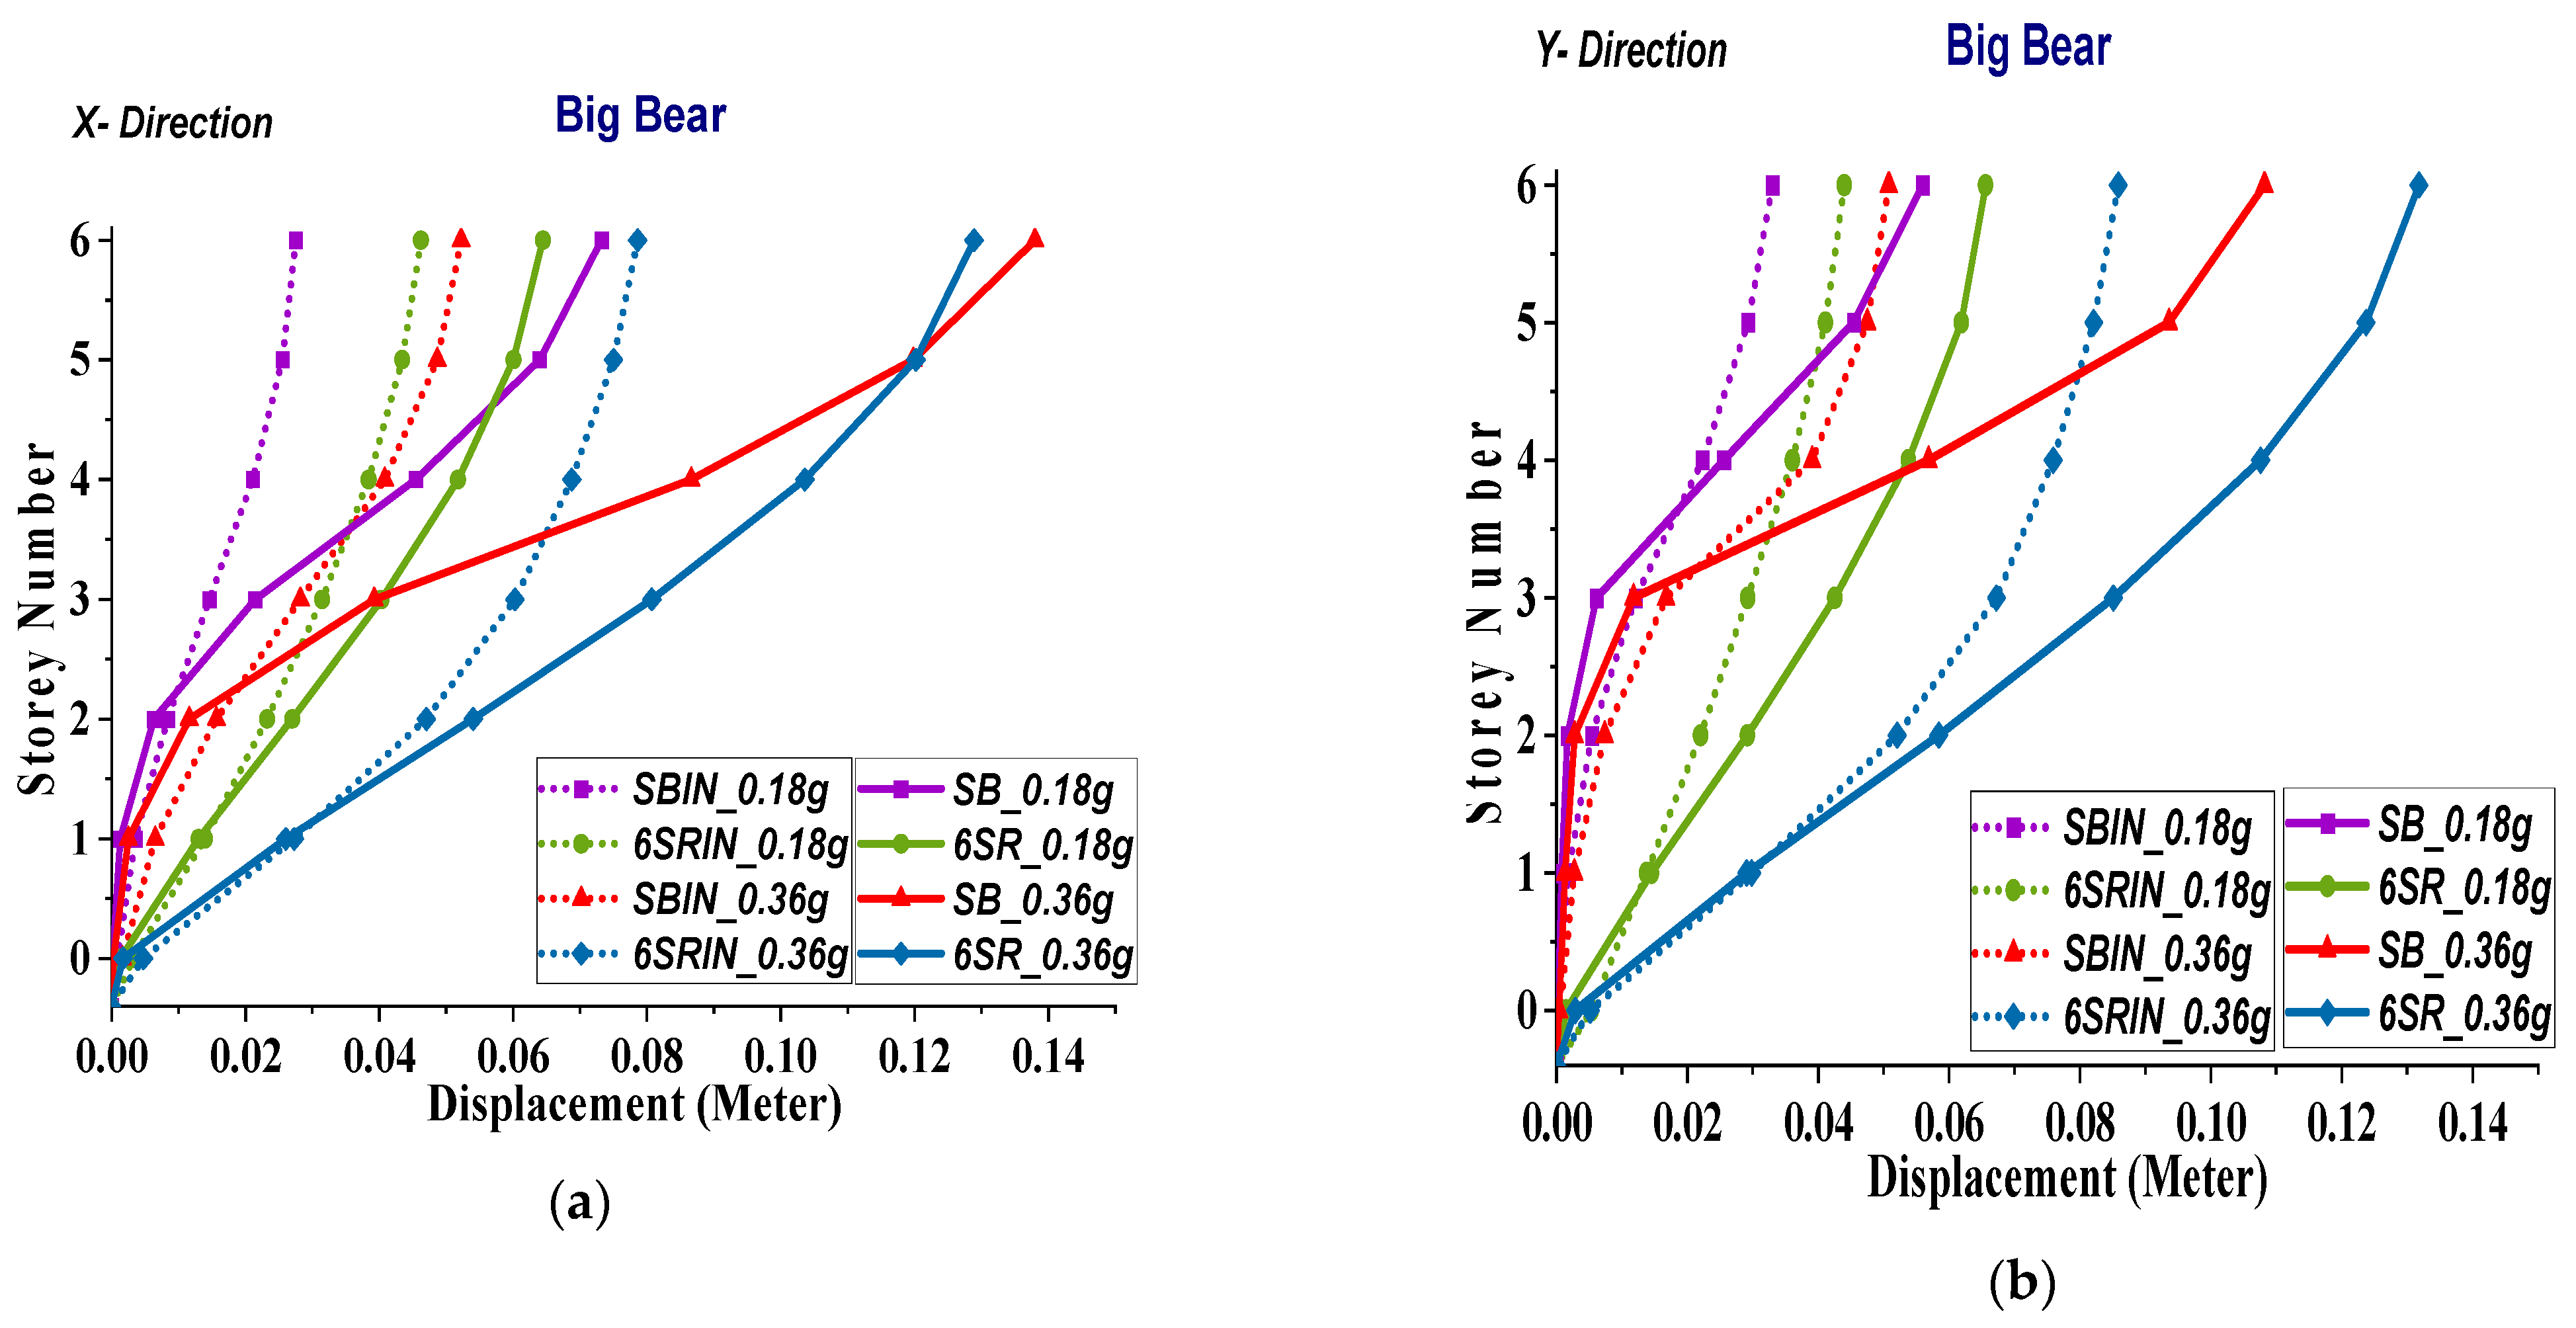
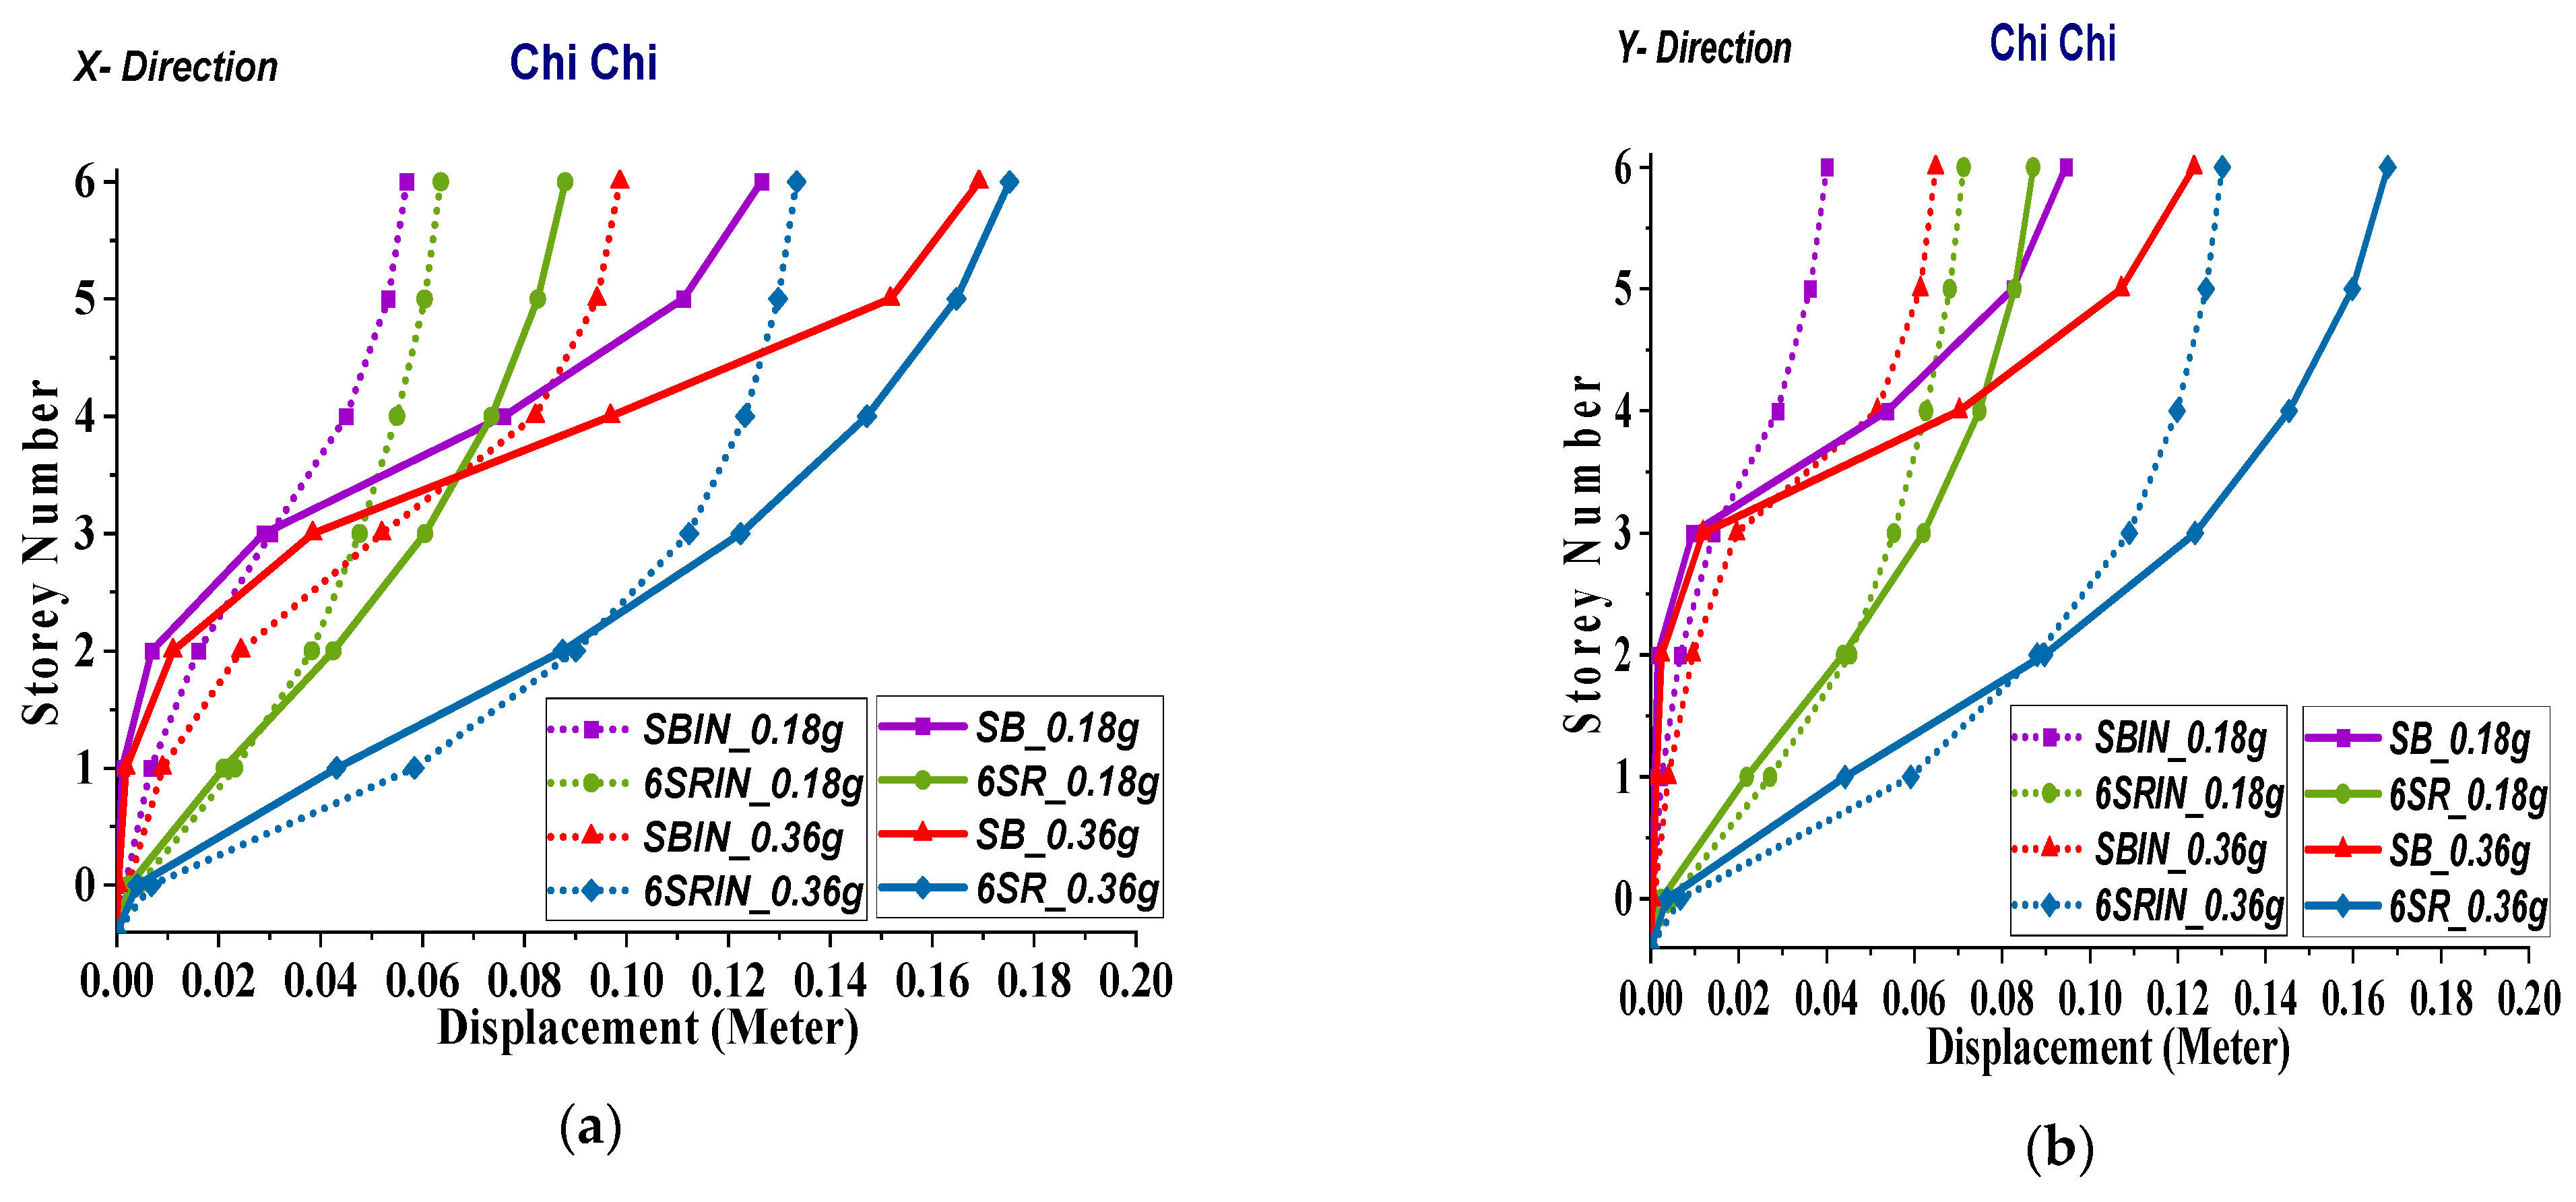
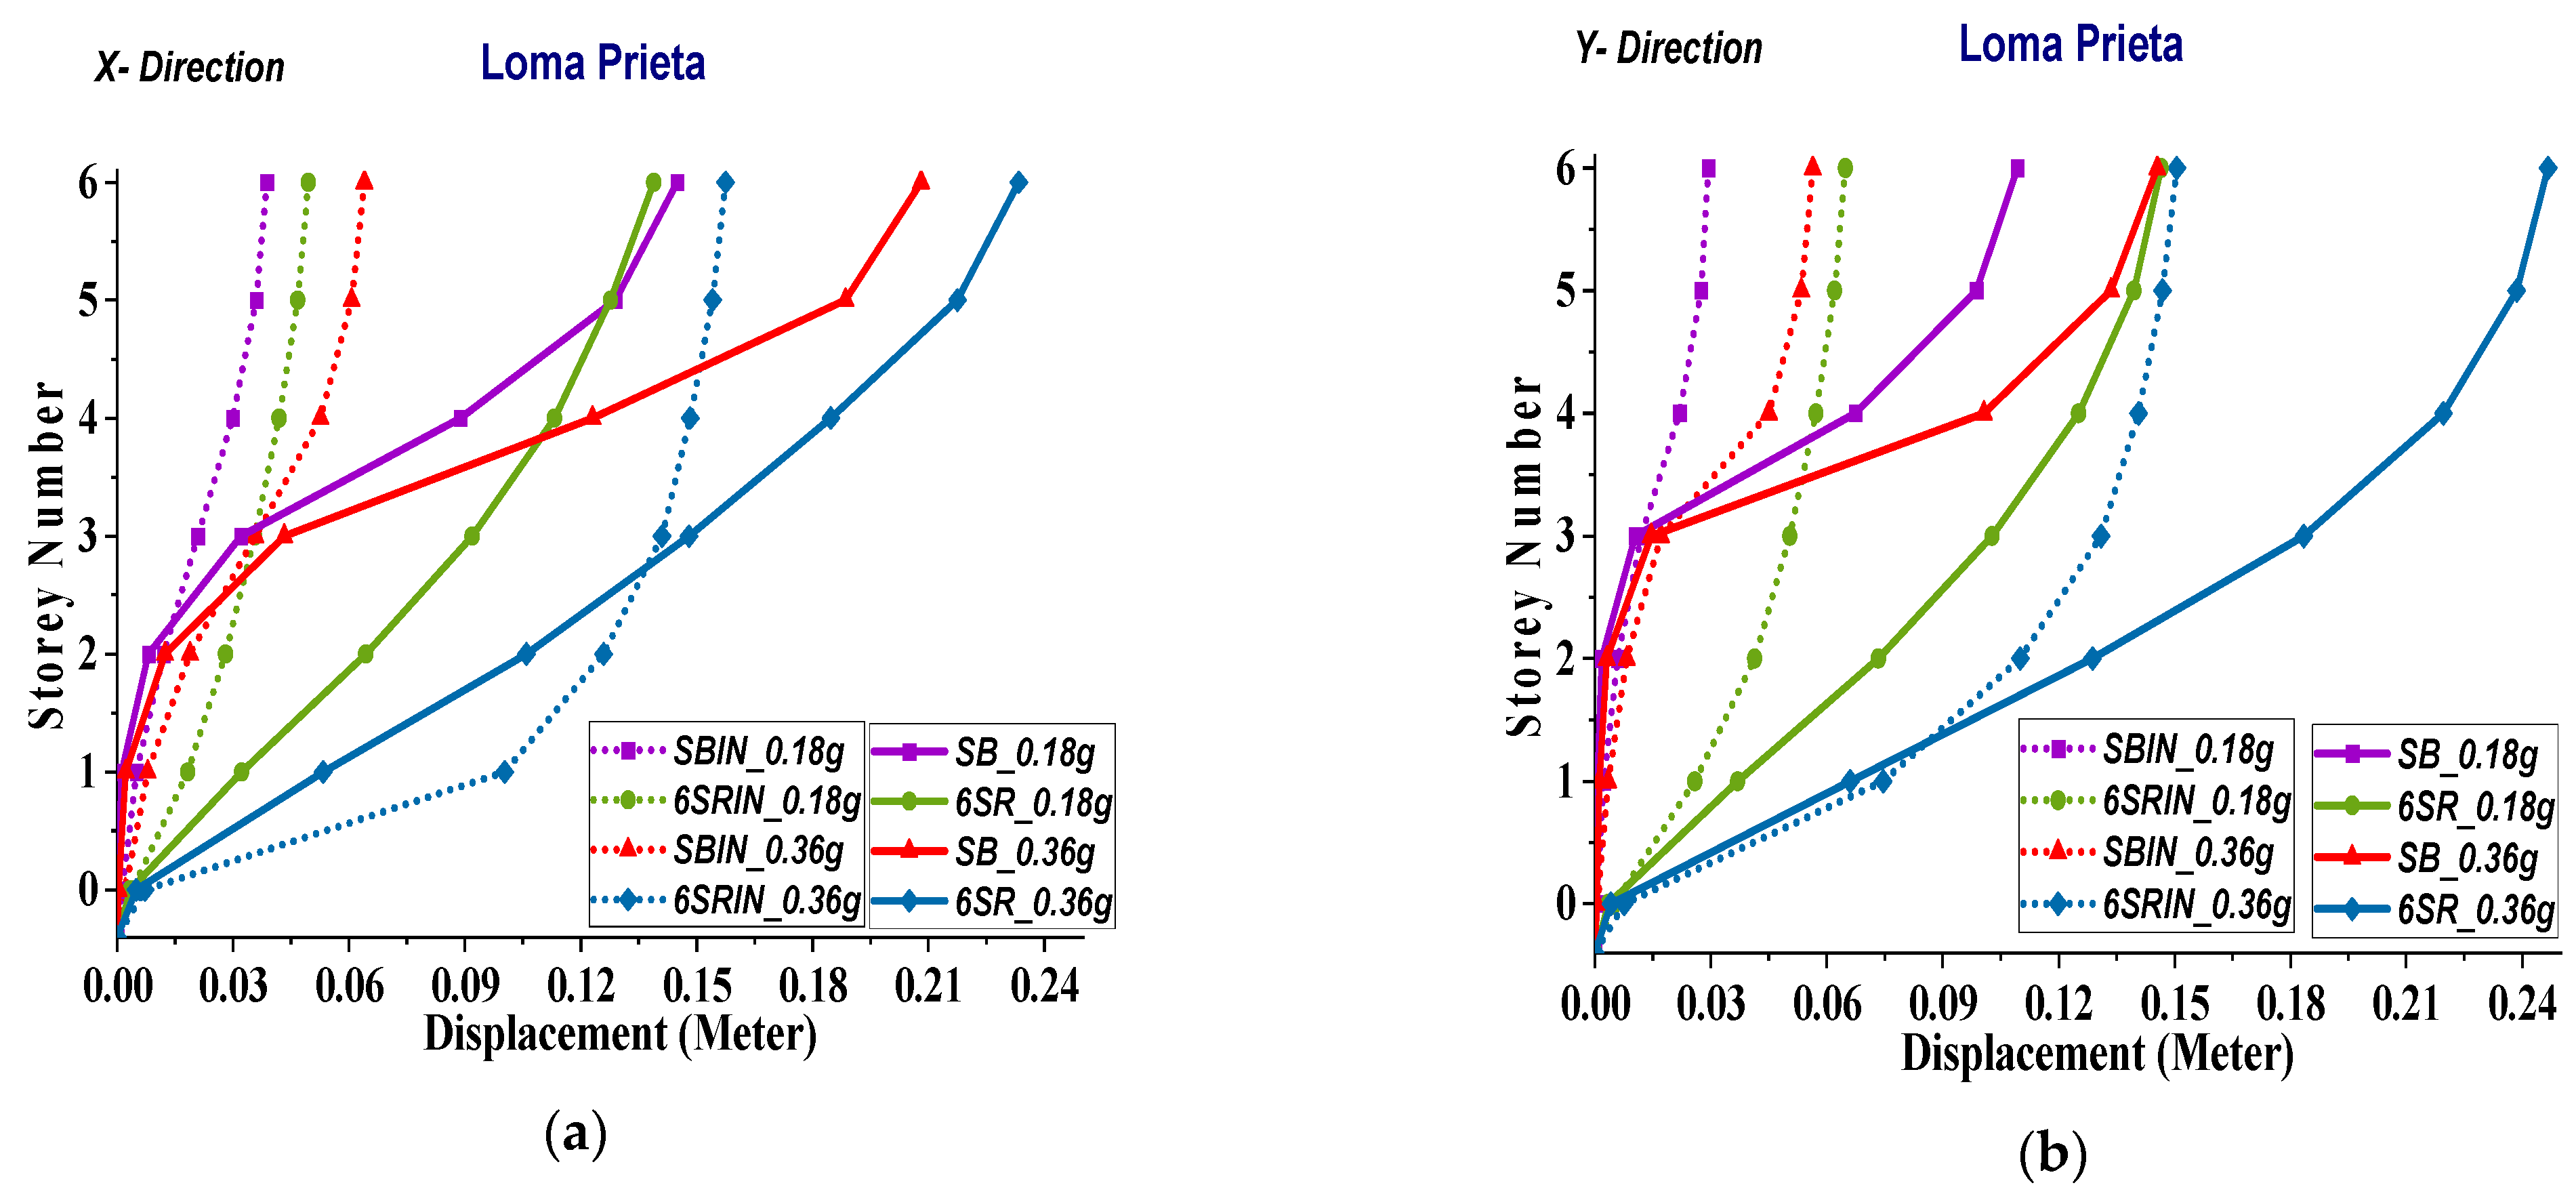
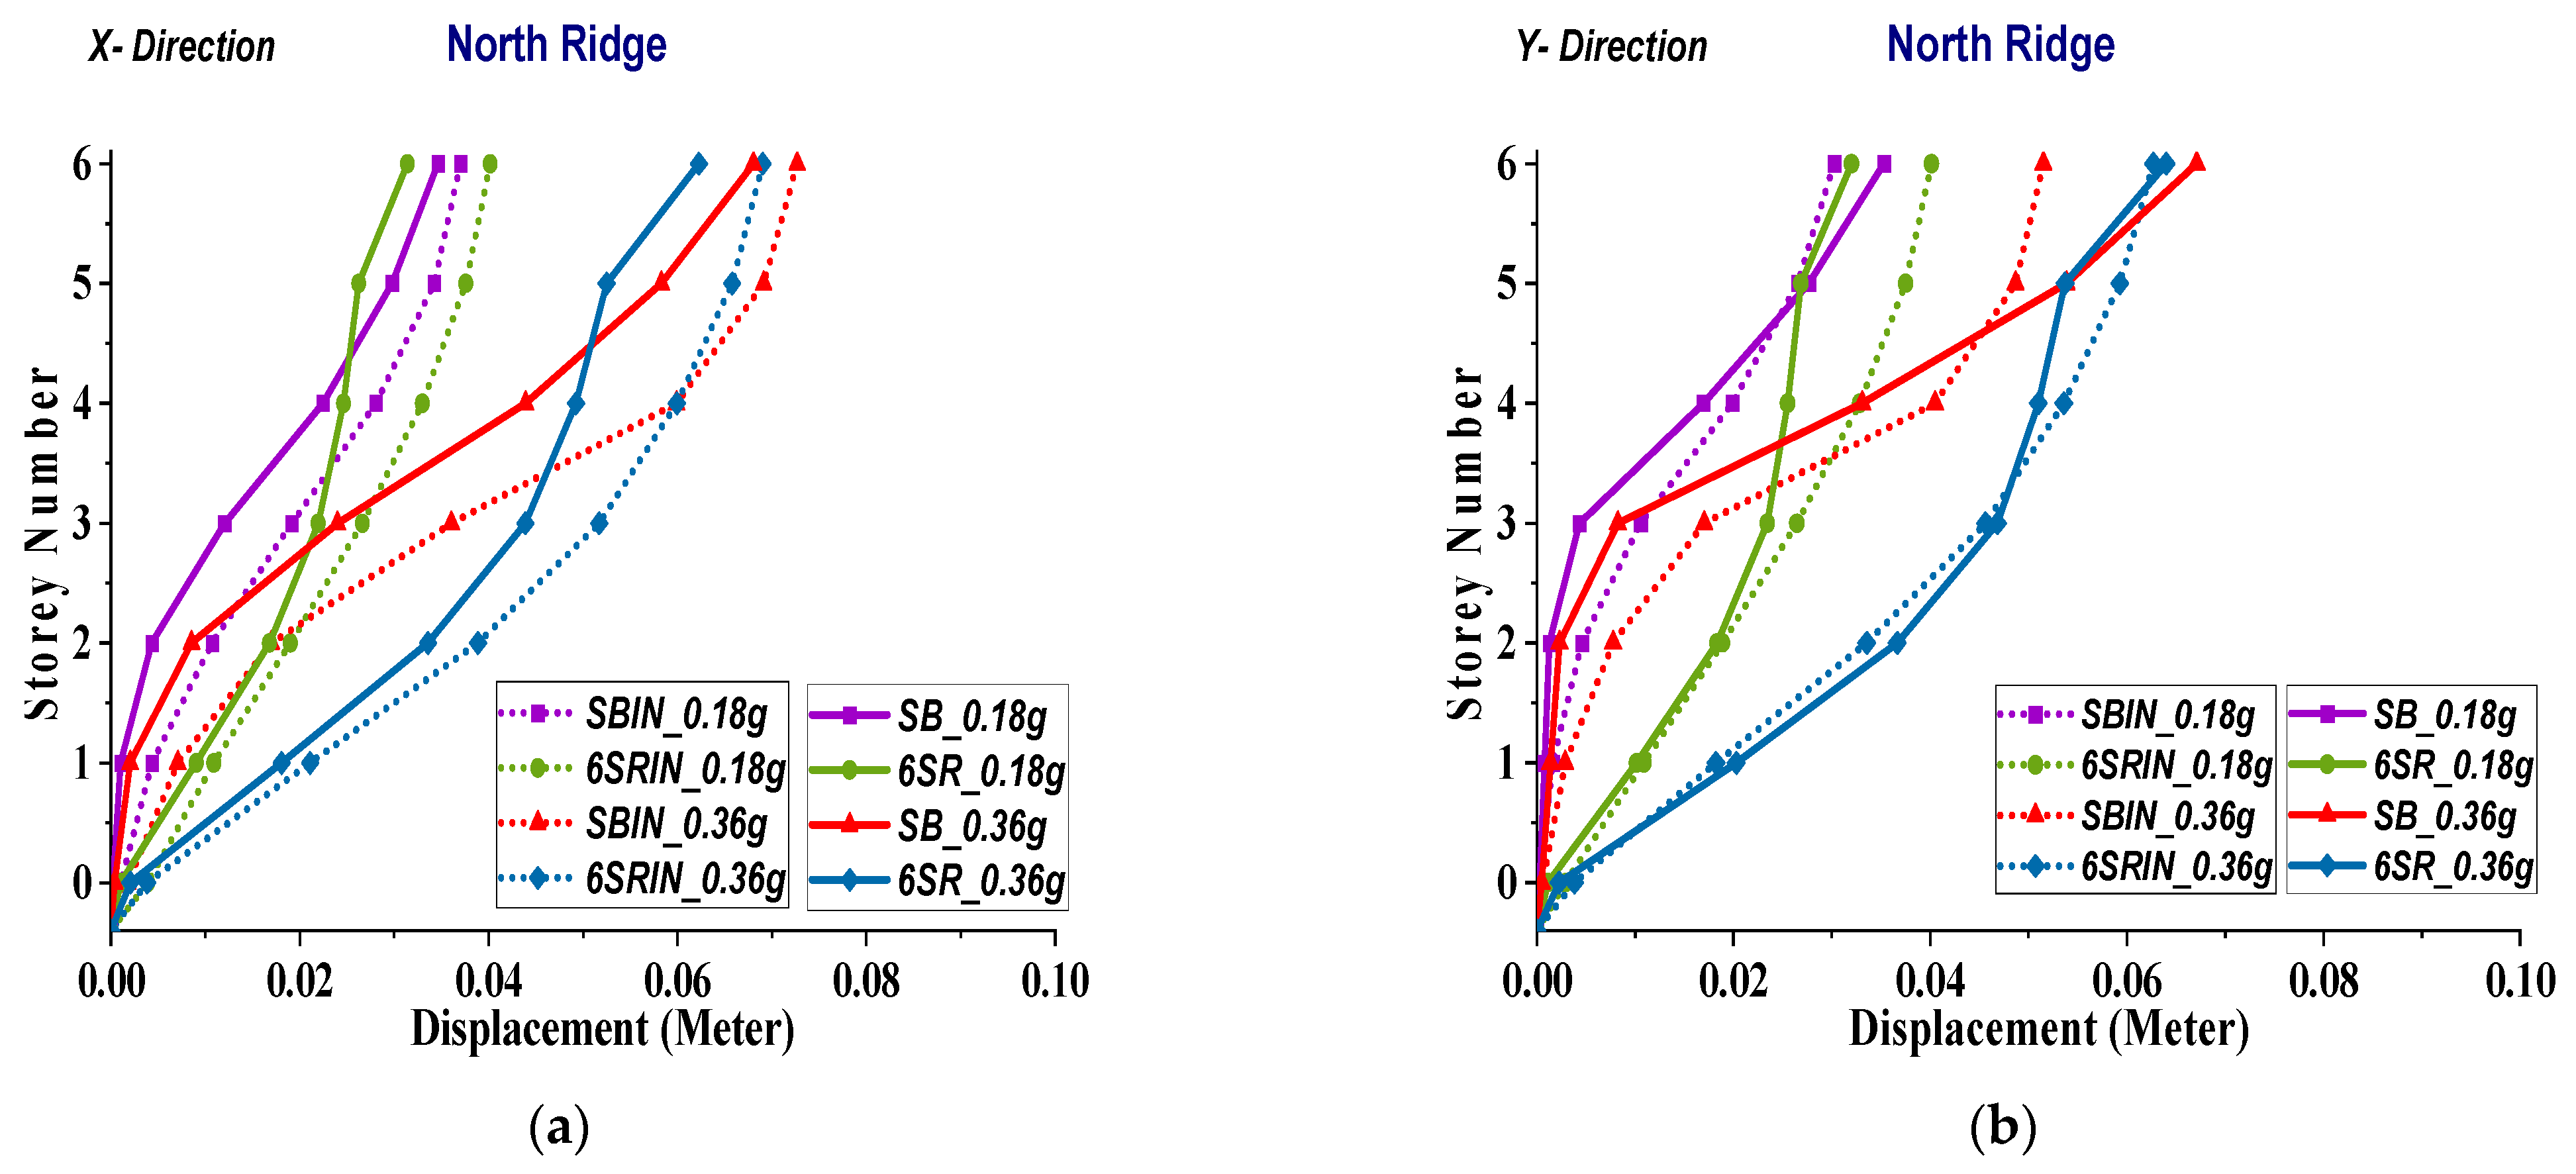
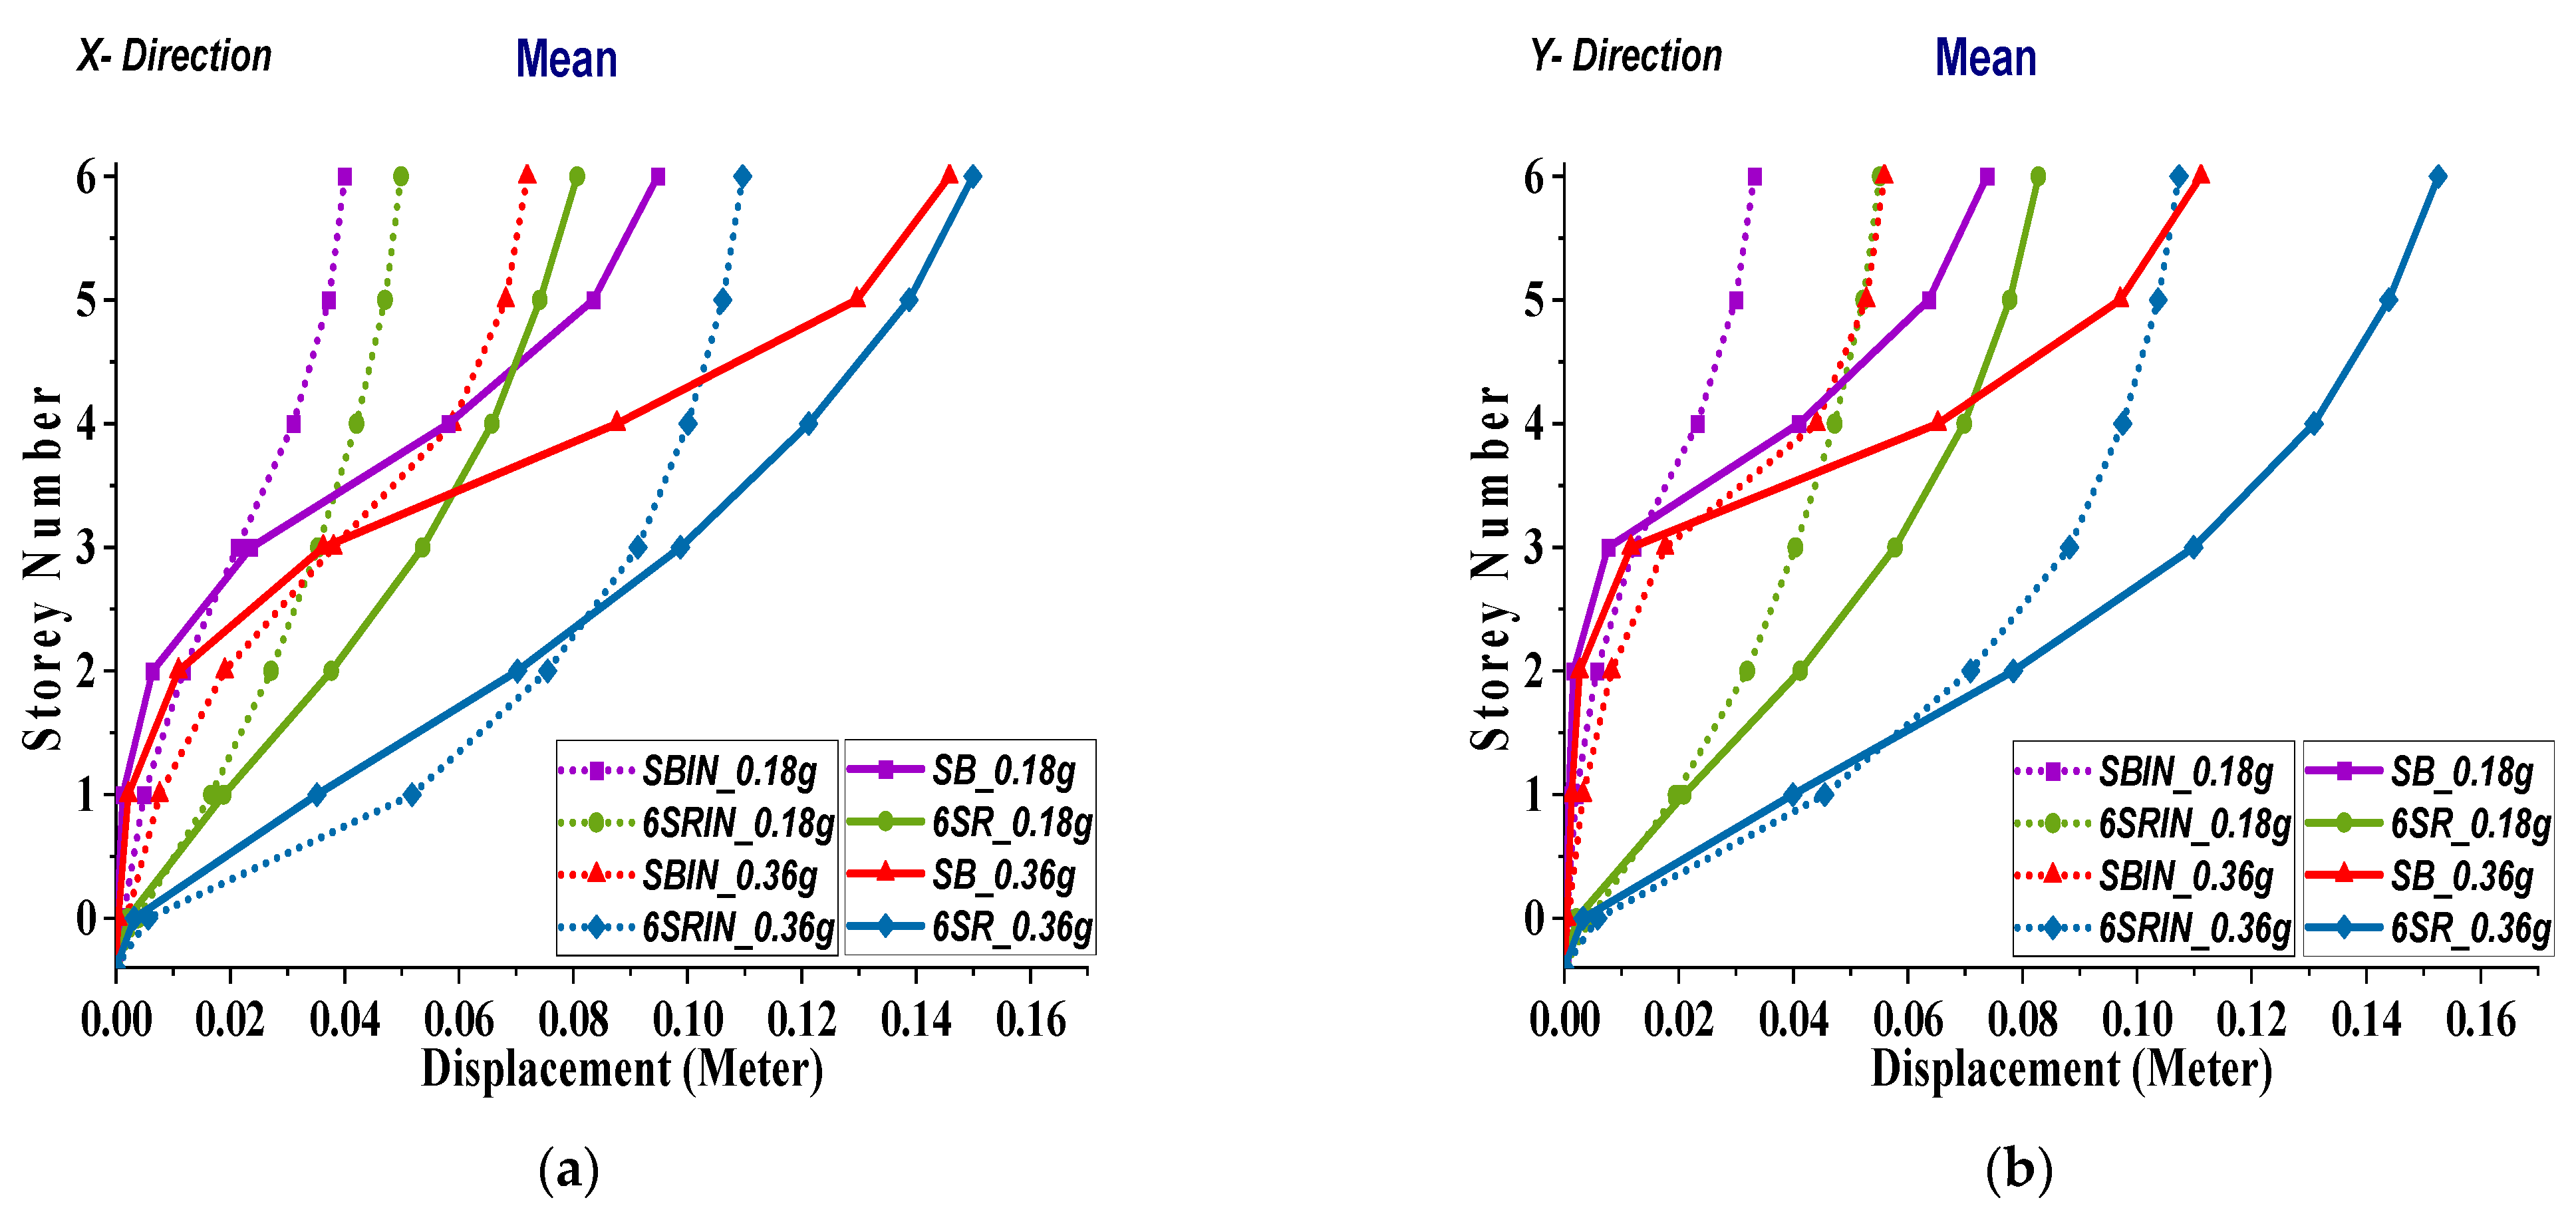
8.3.1. Storey Displacement
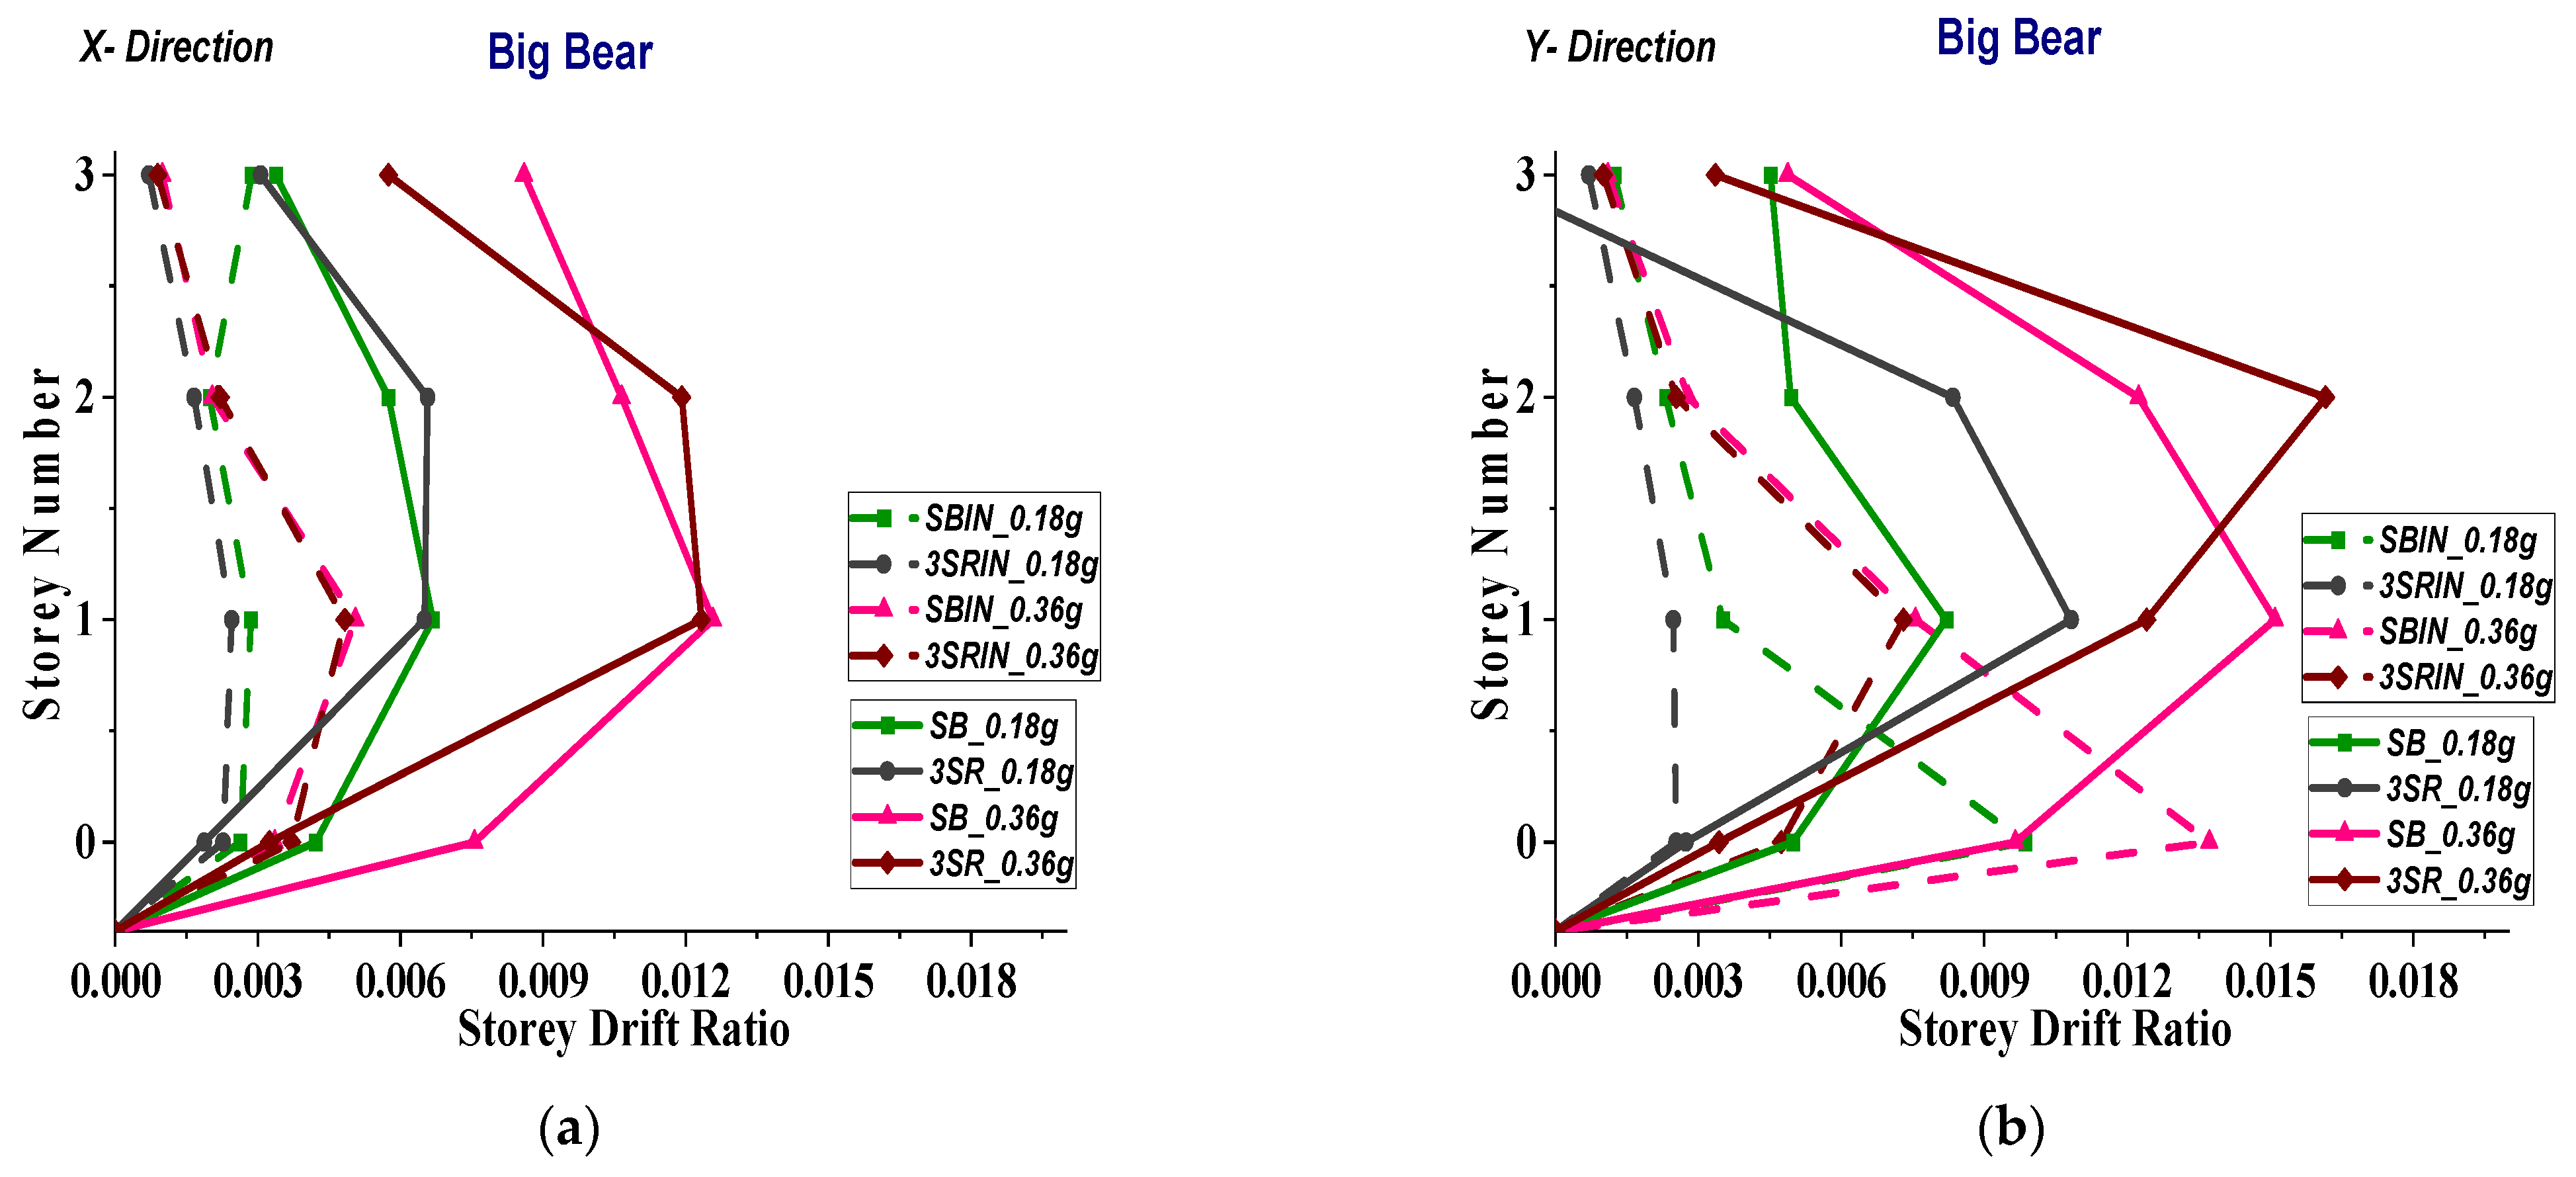
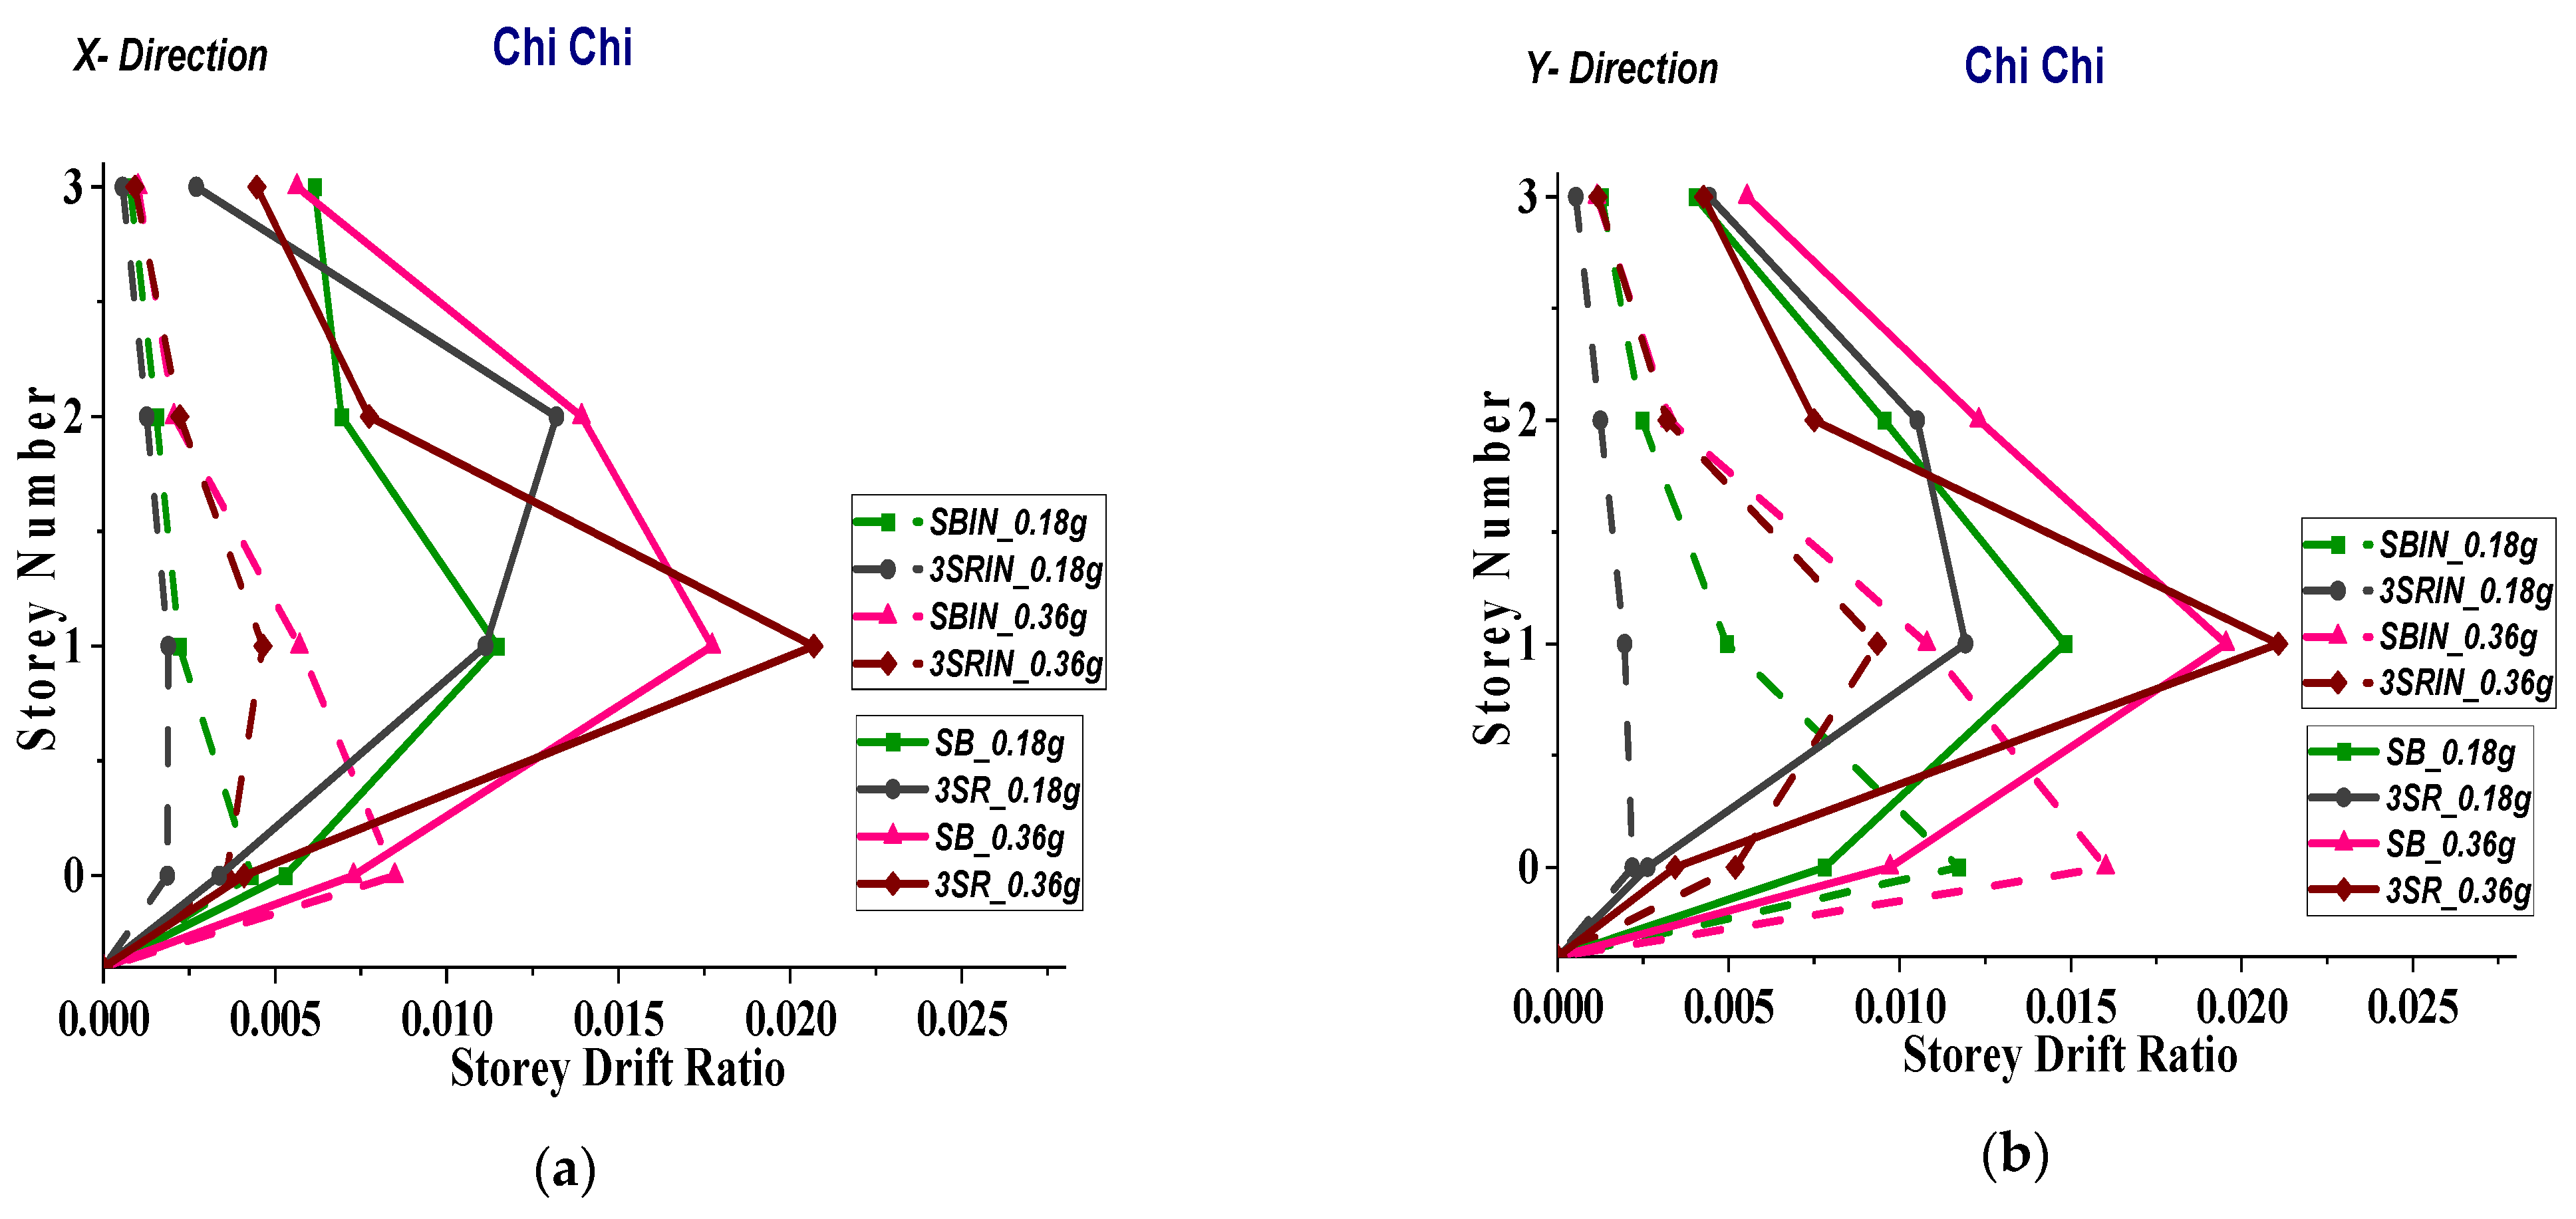
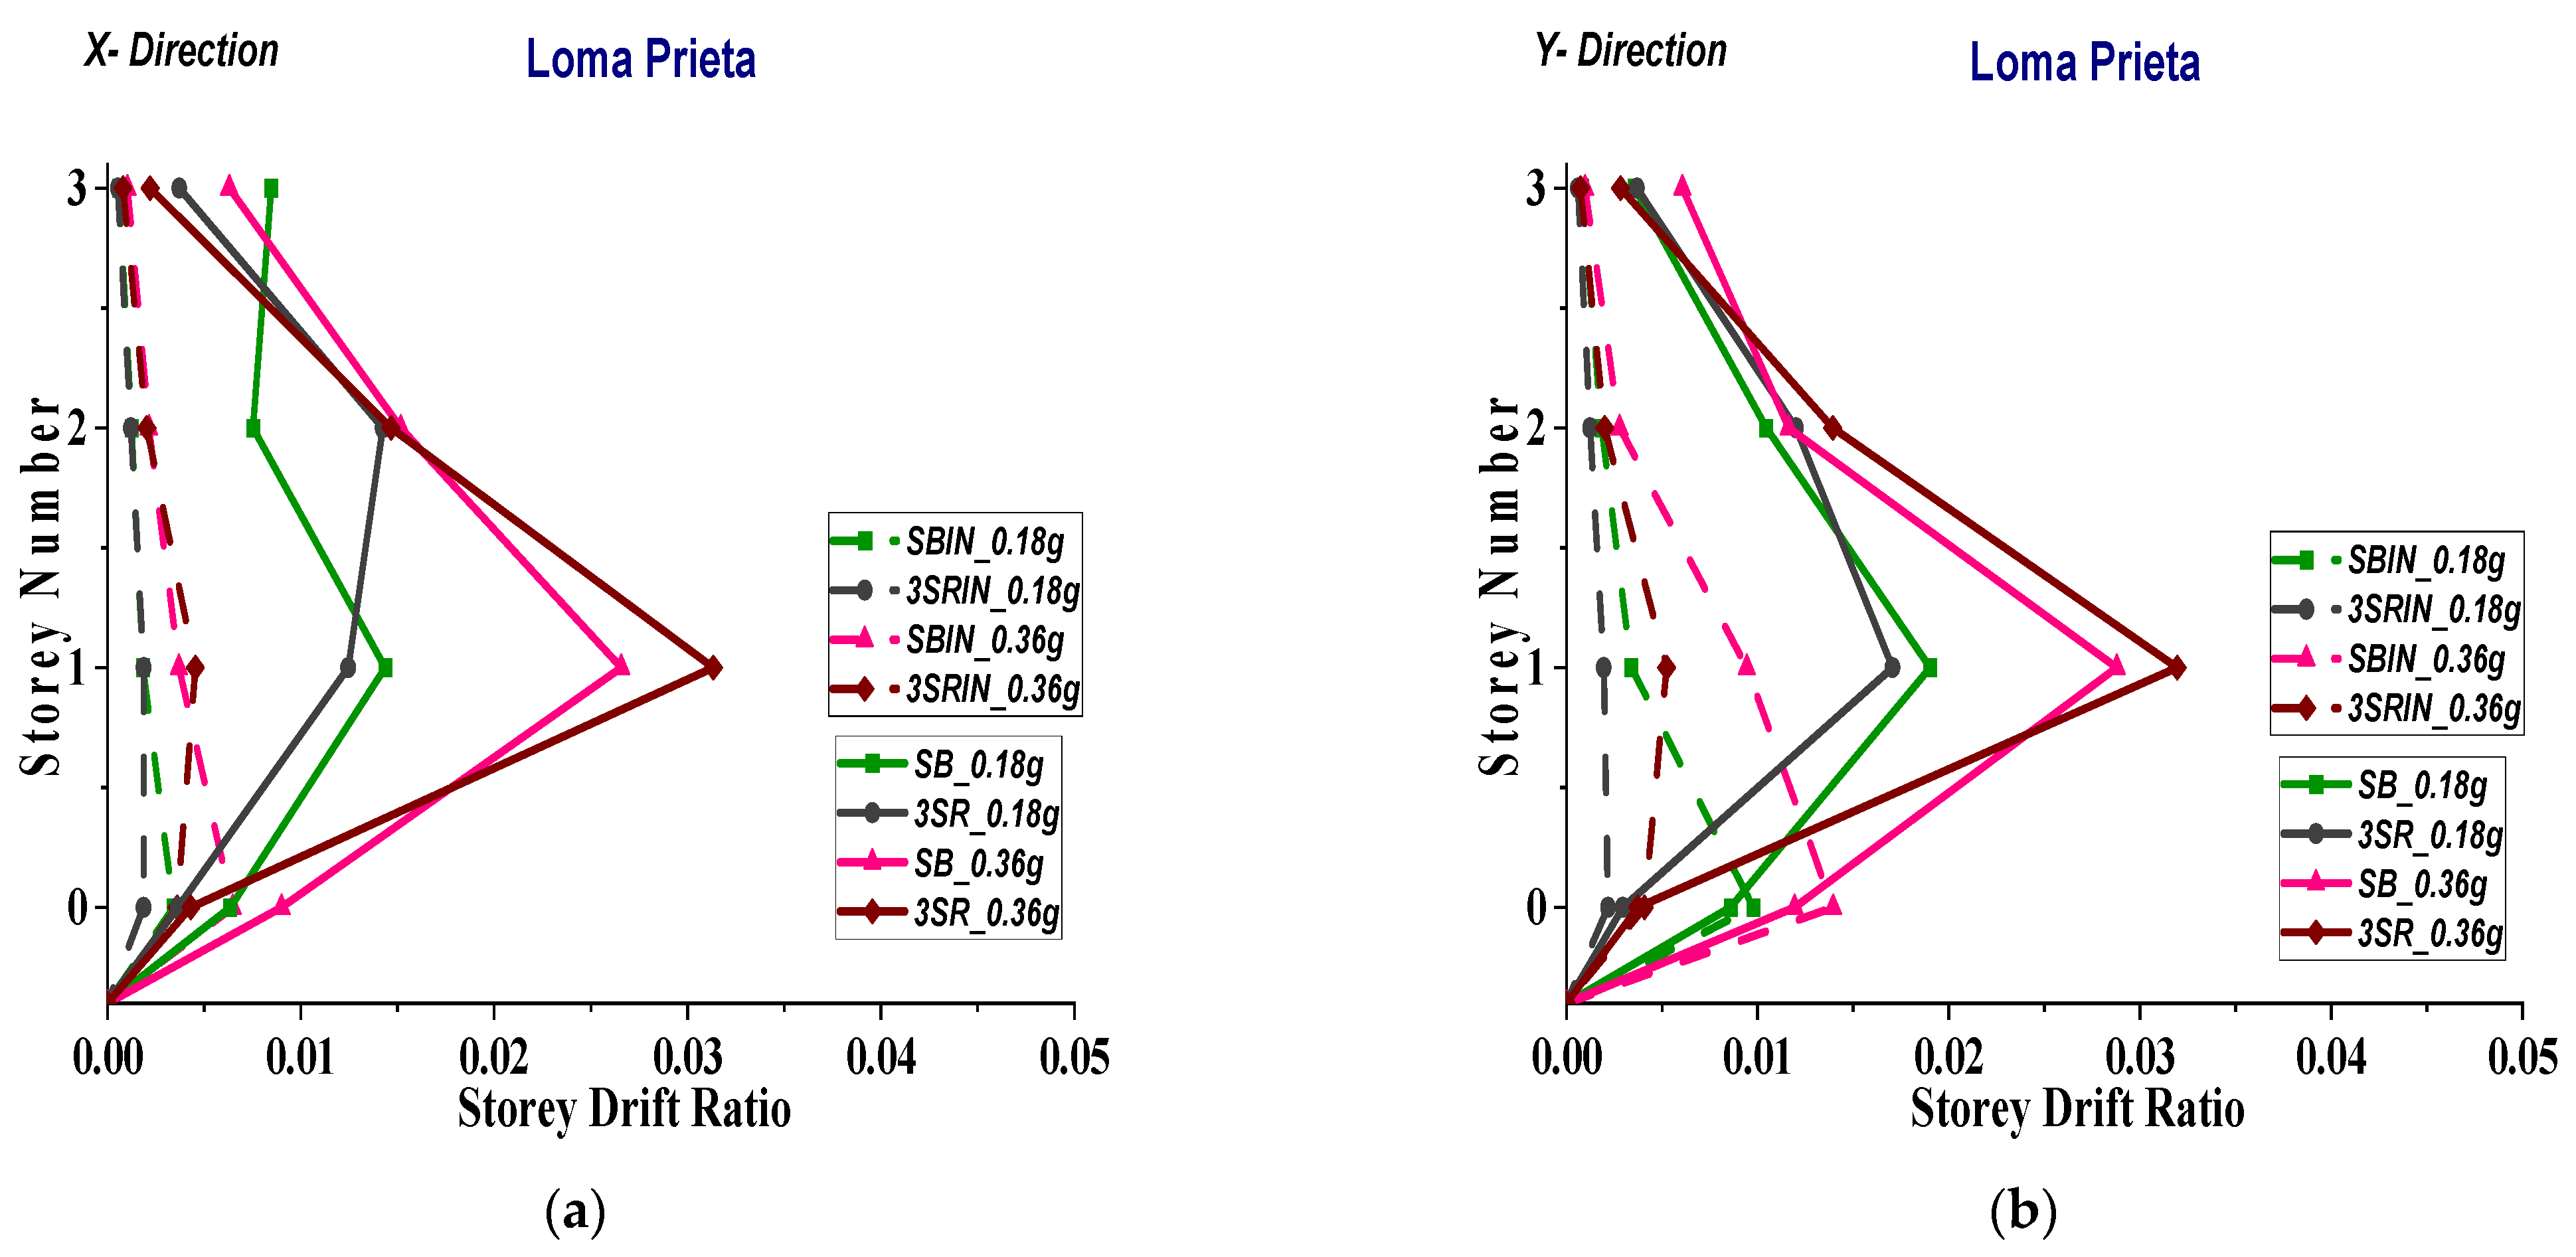
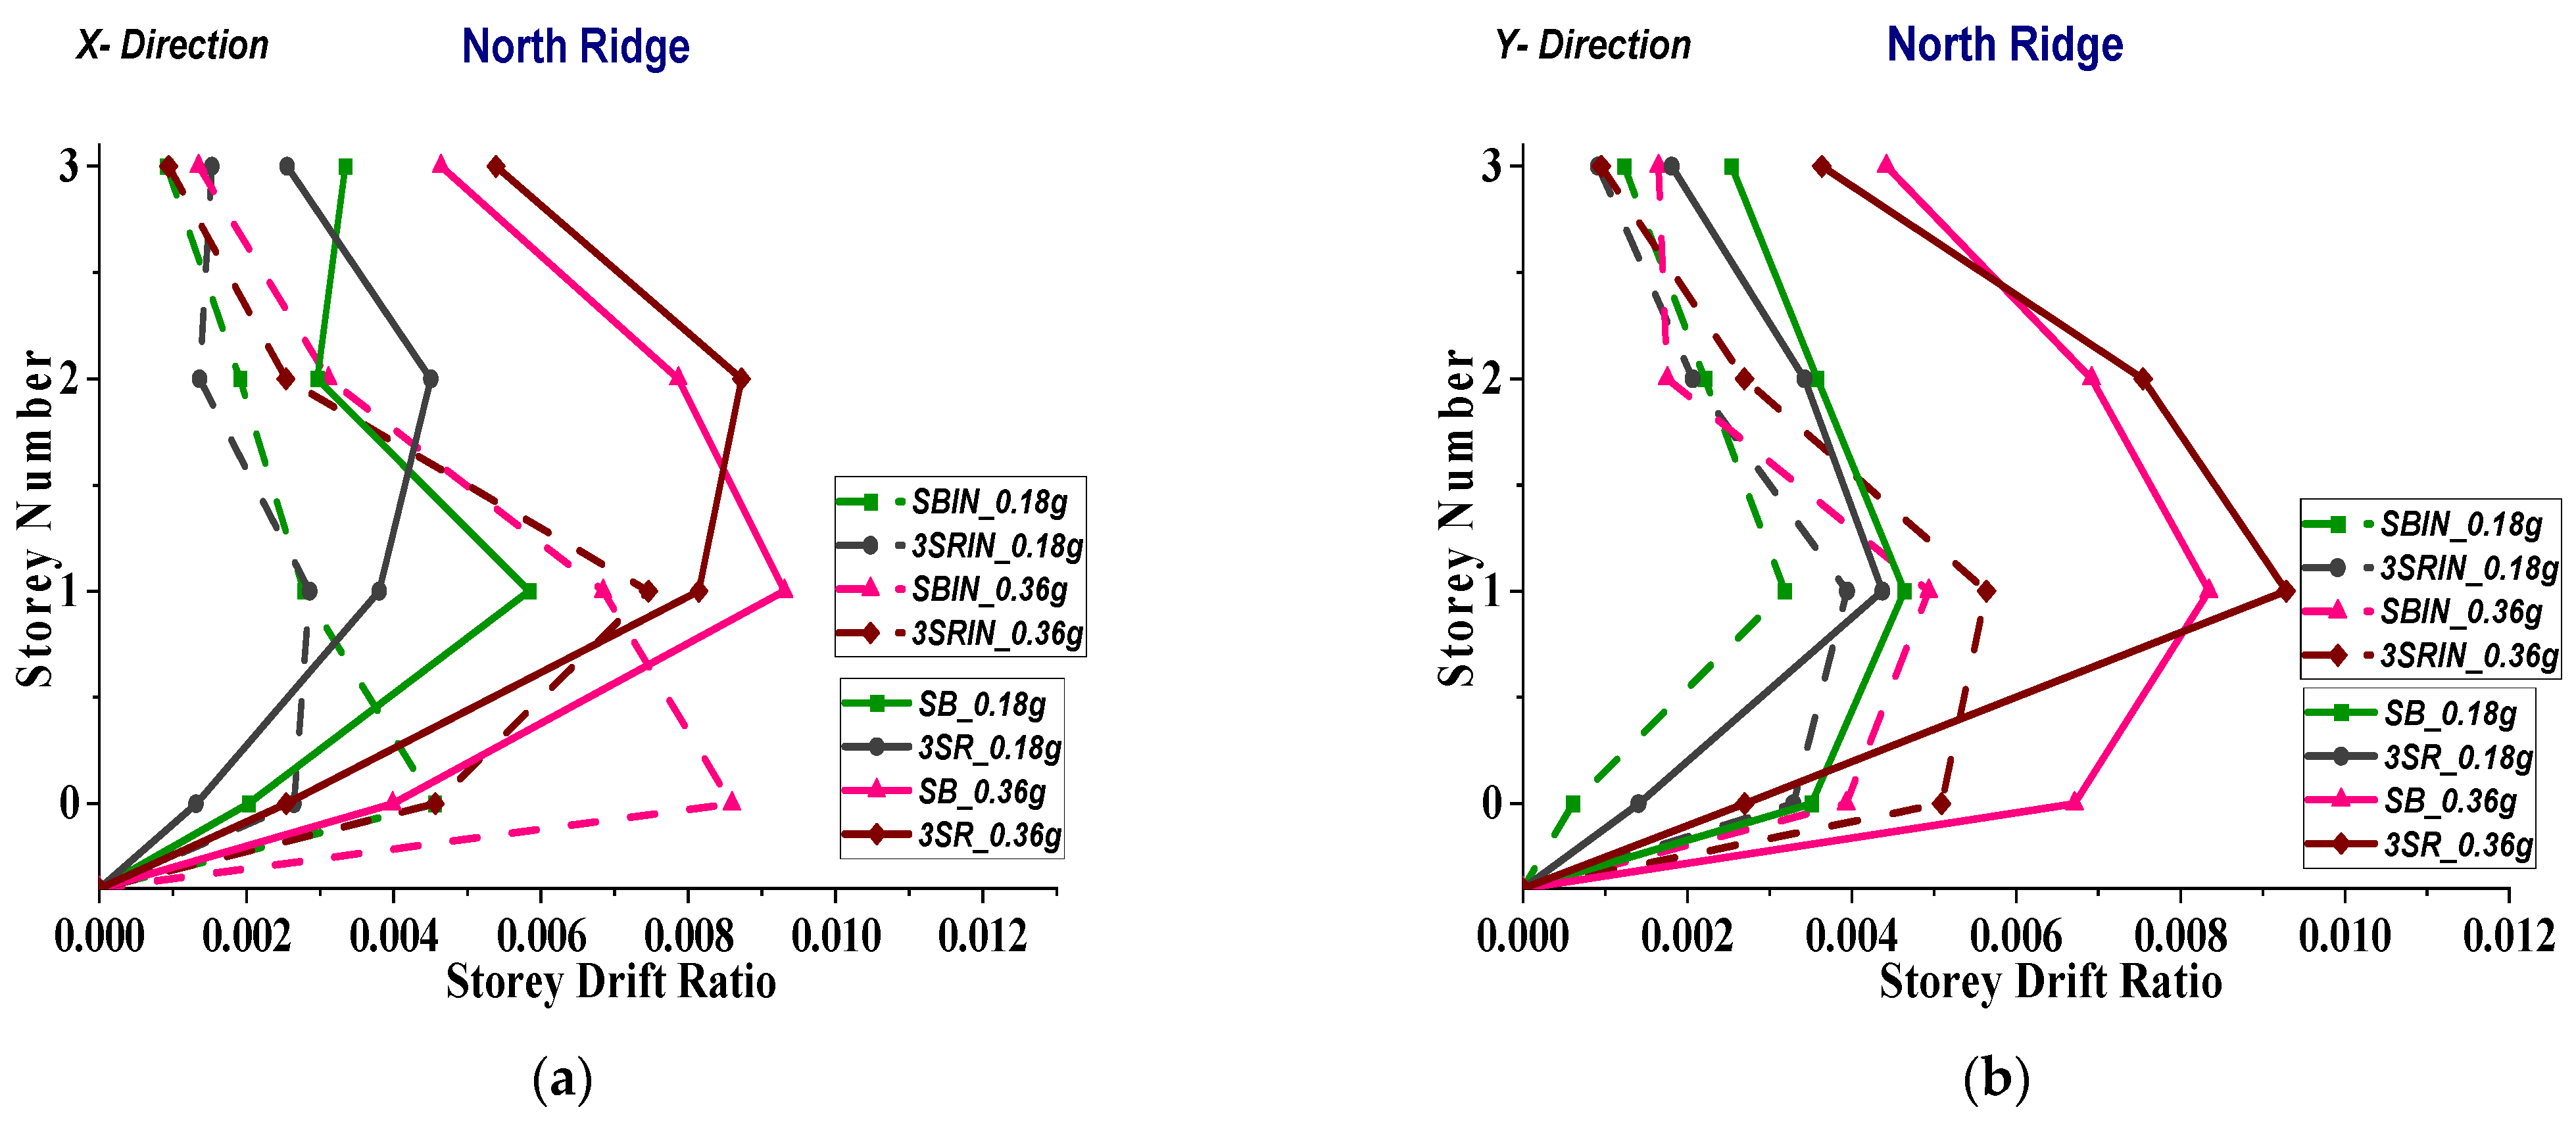
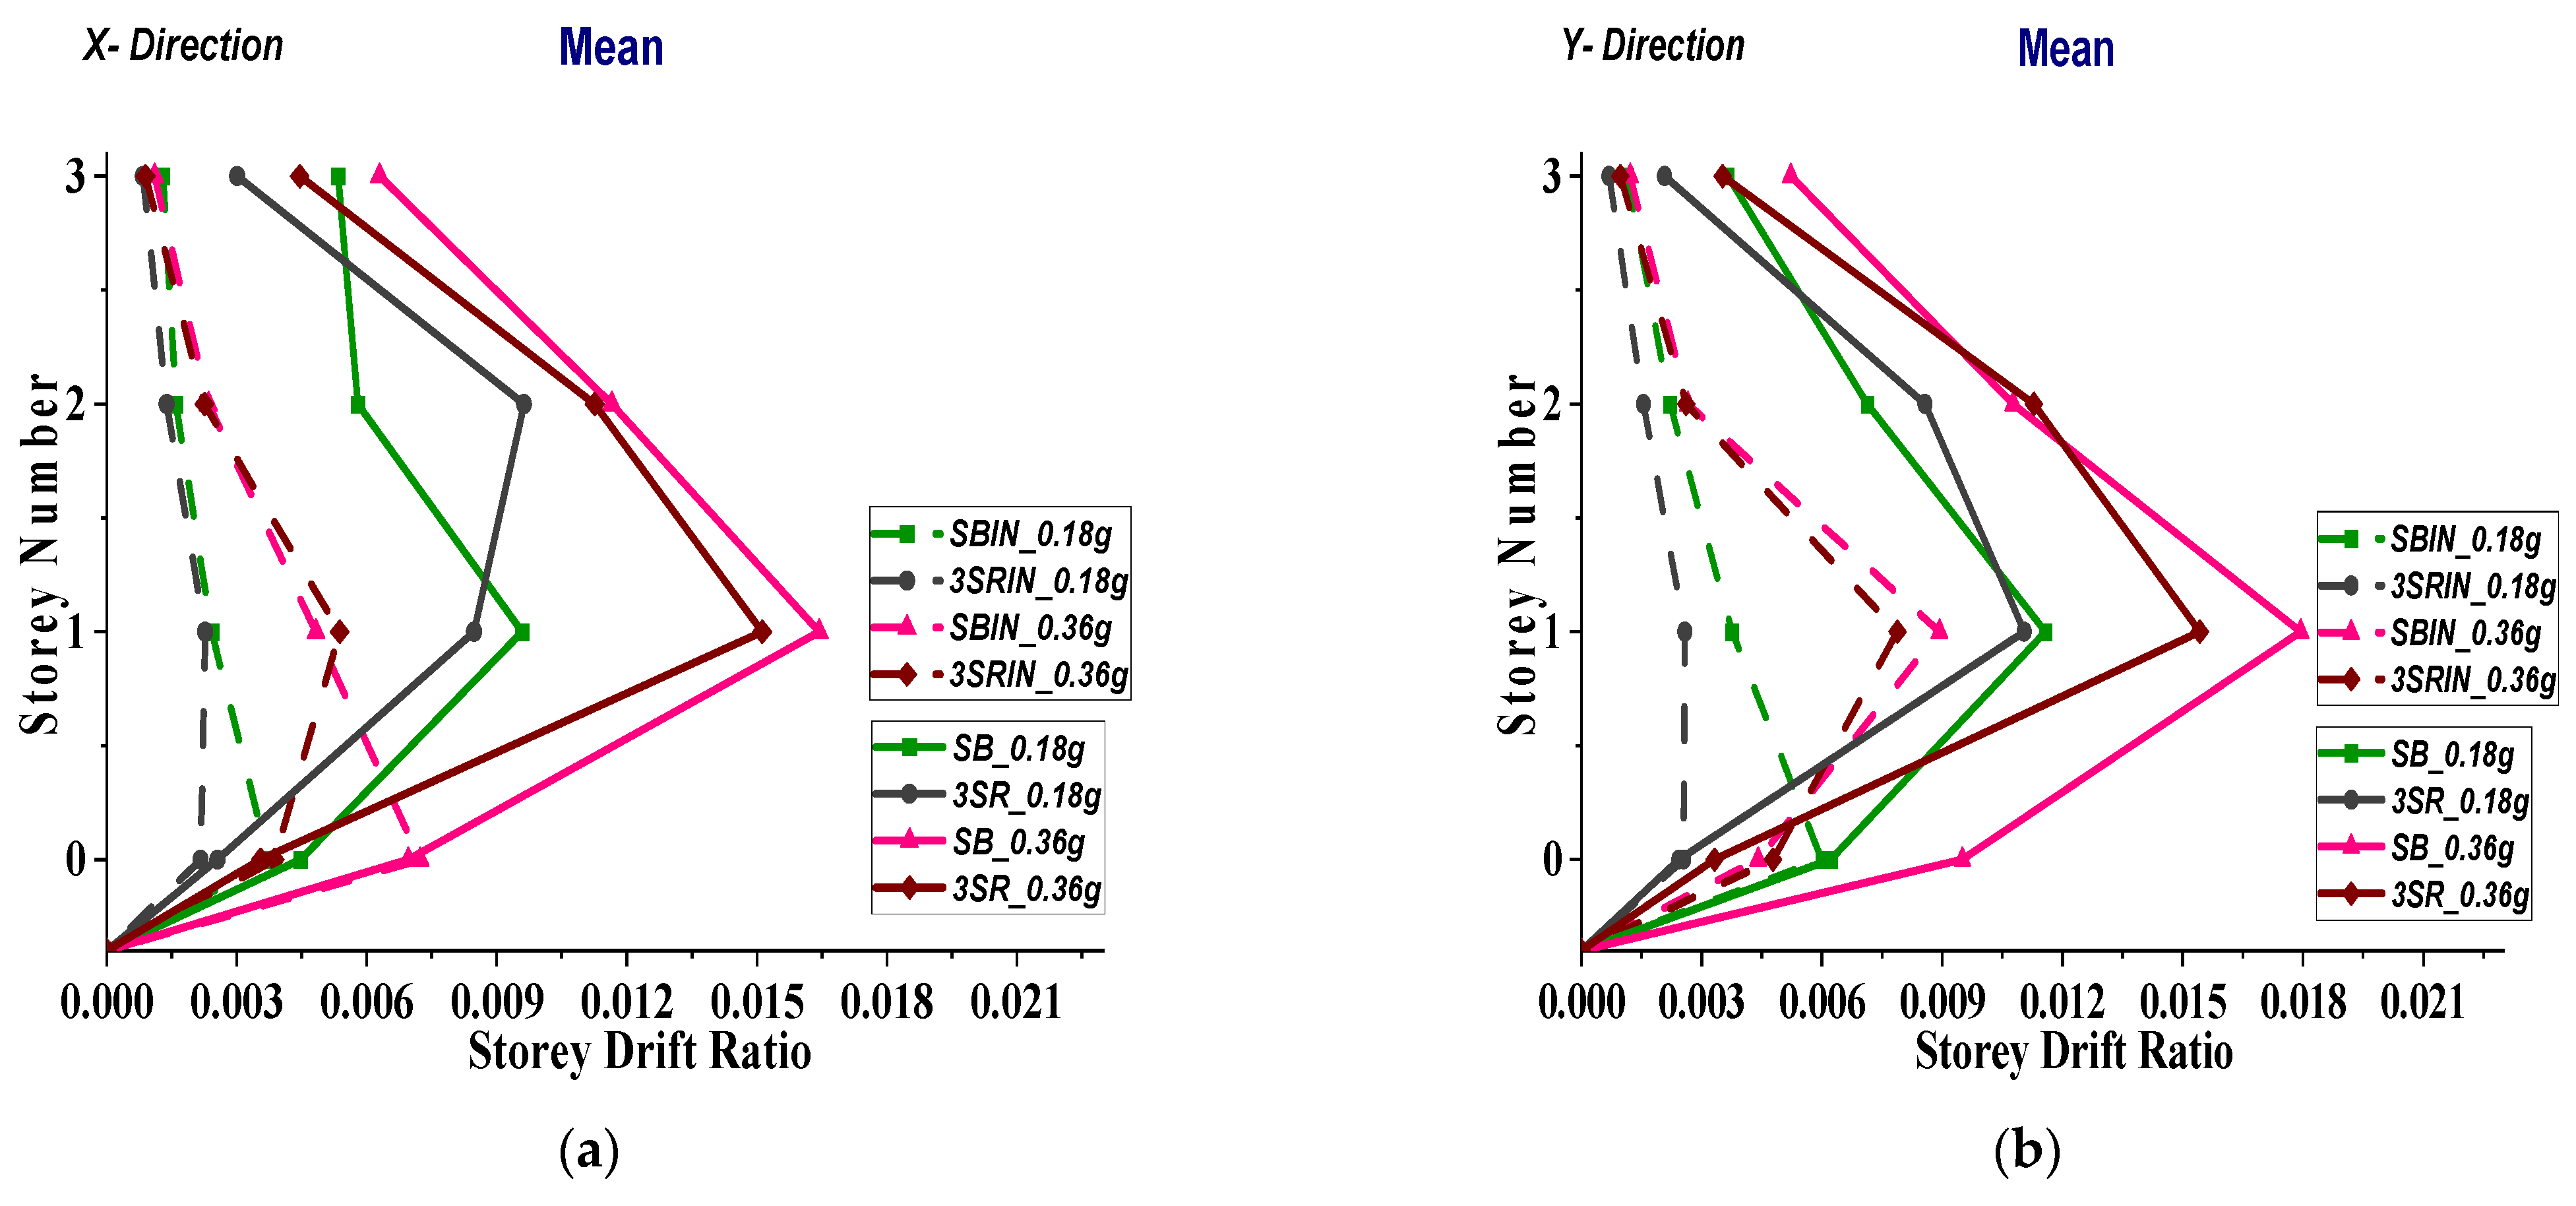
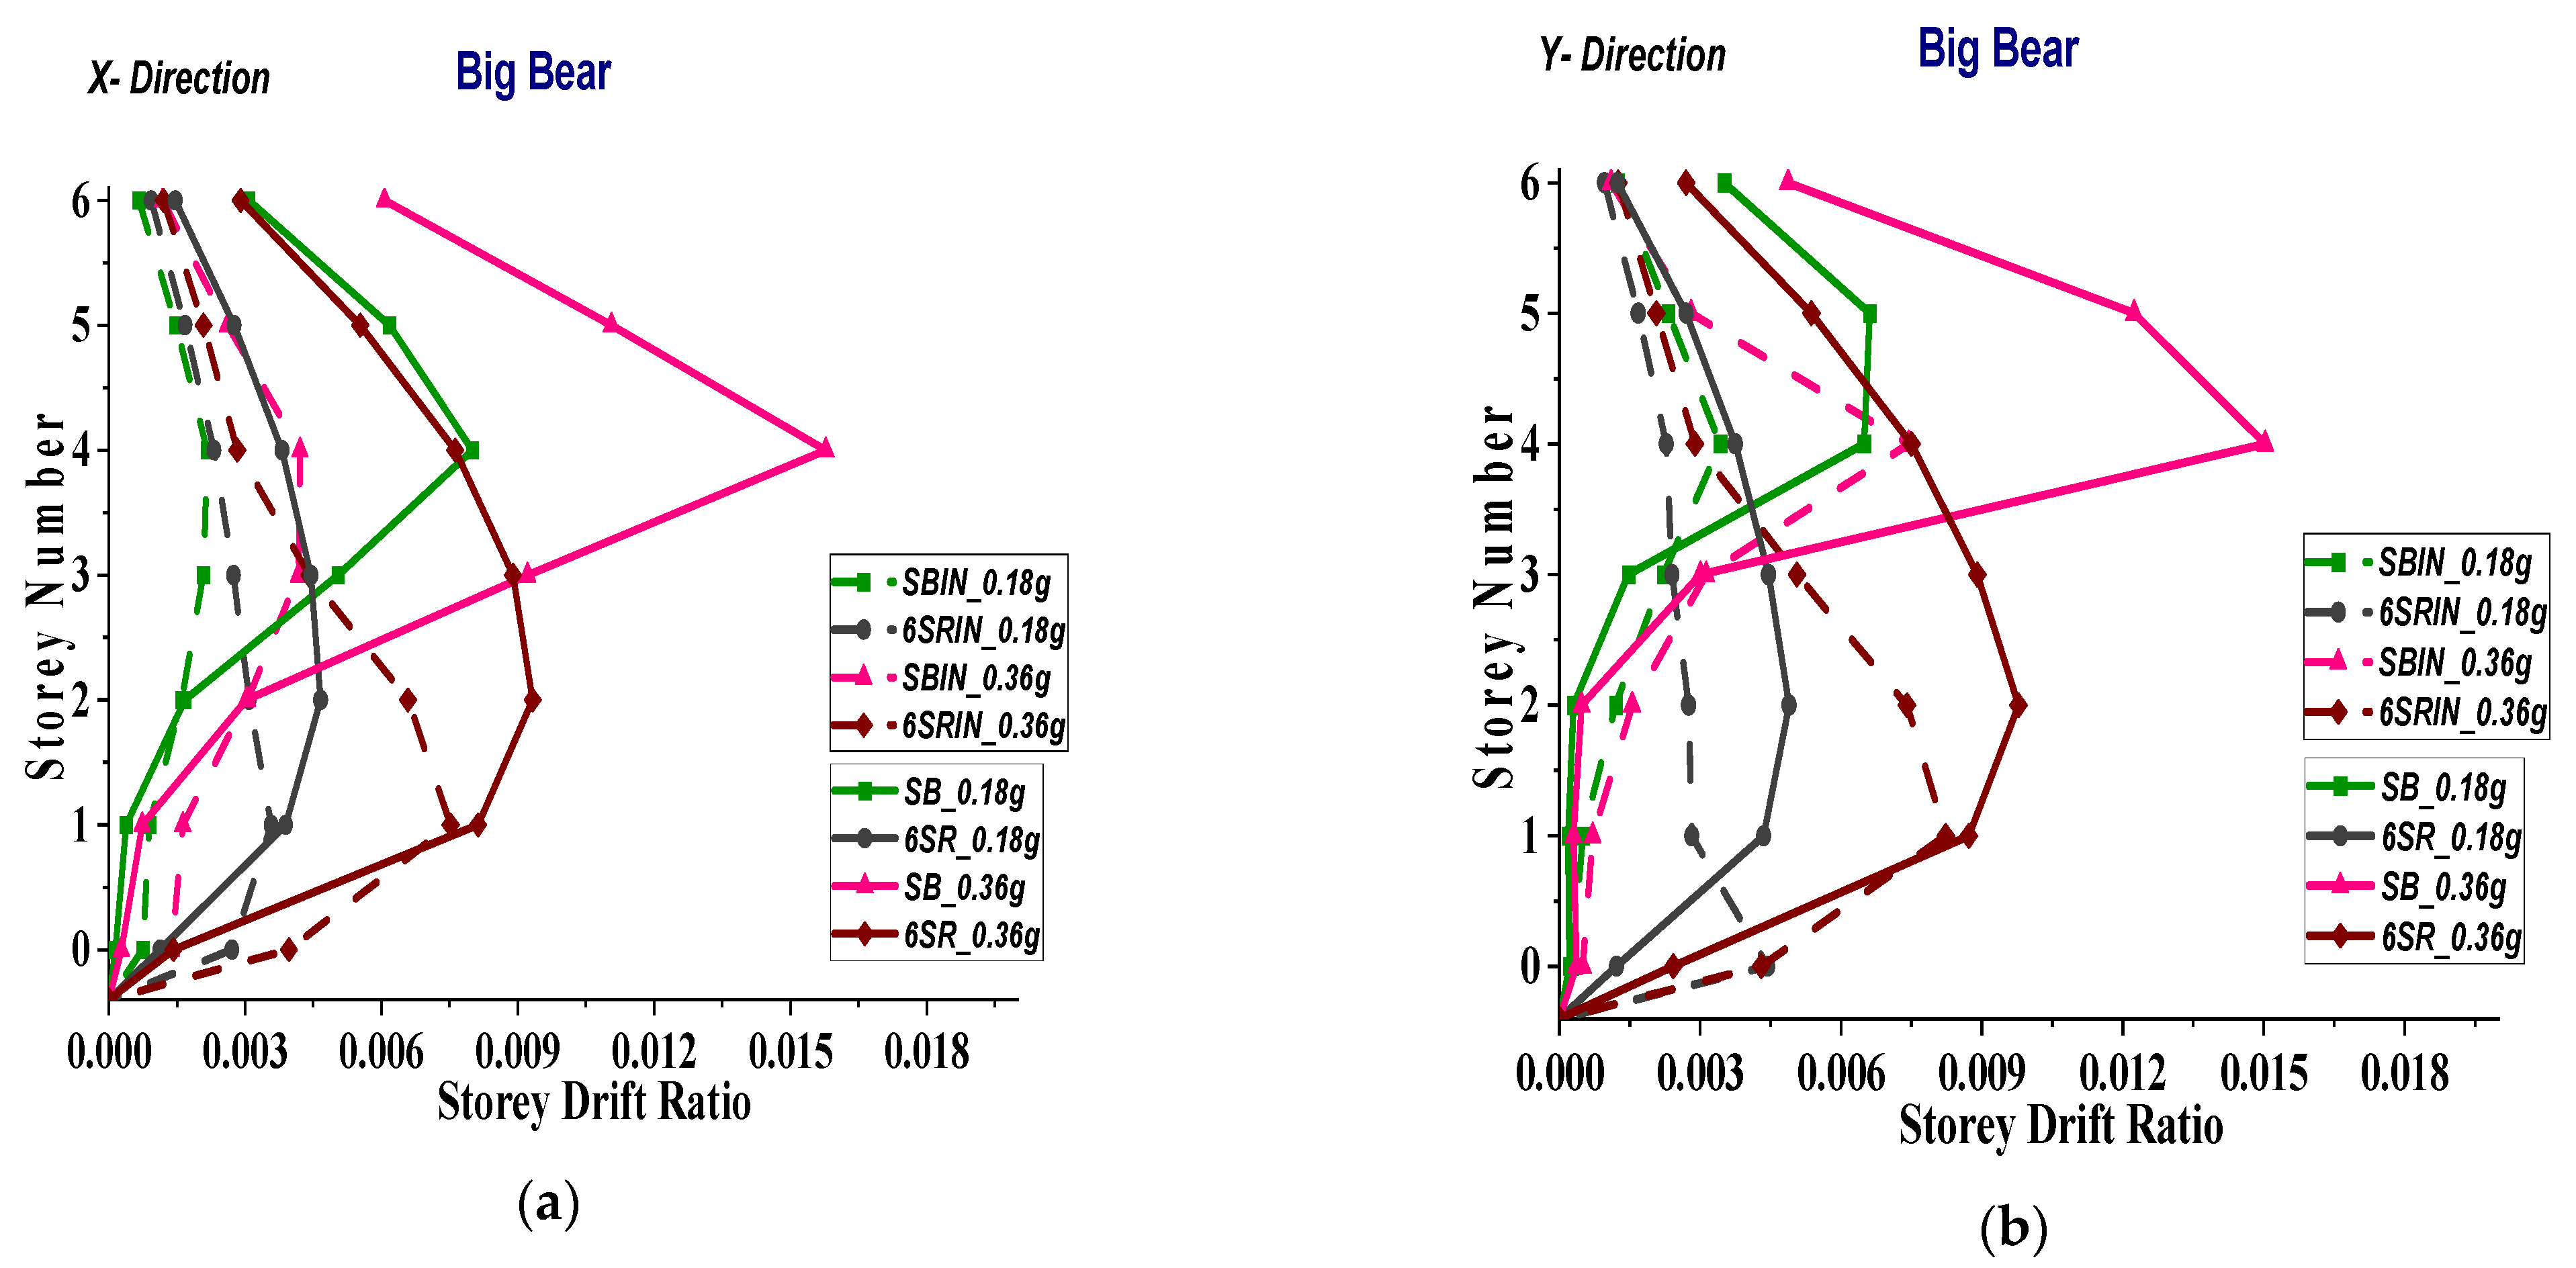
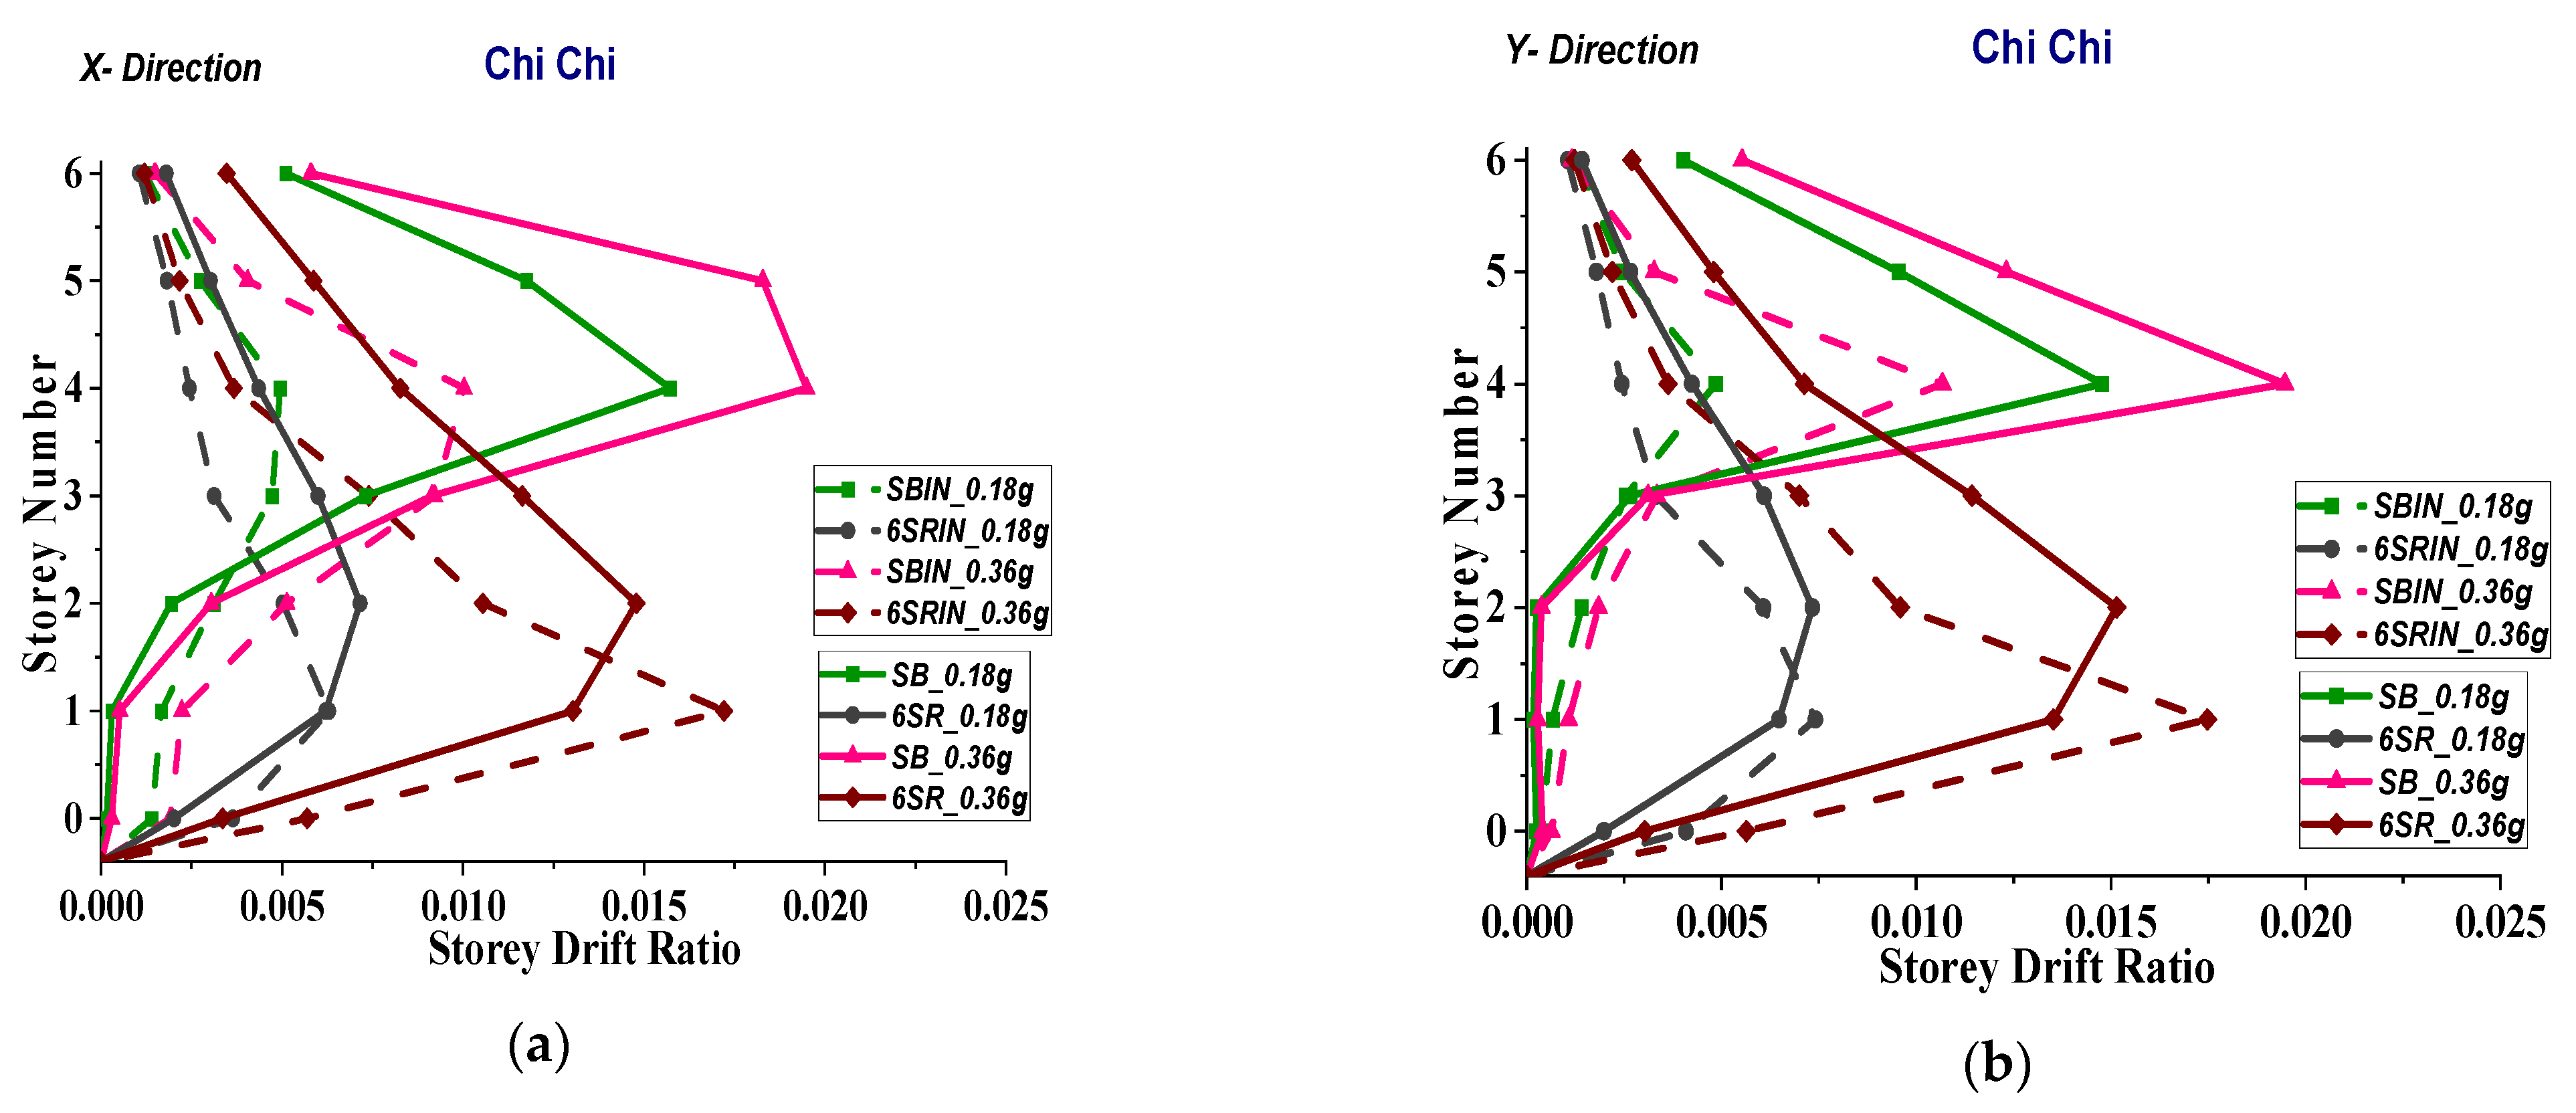
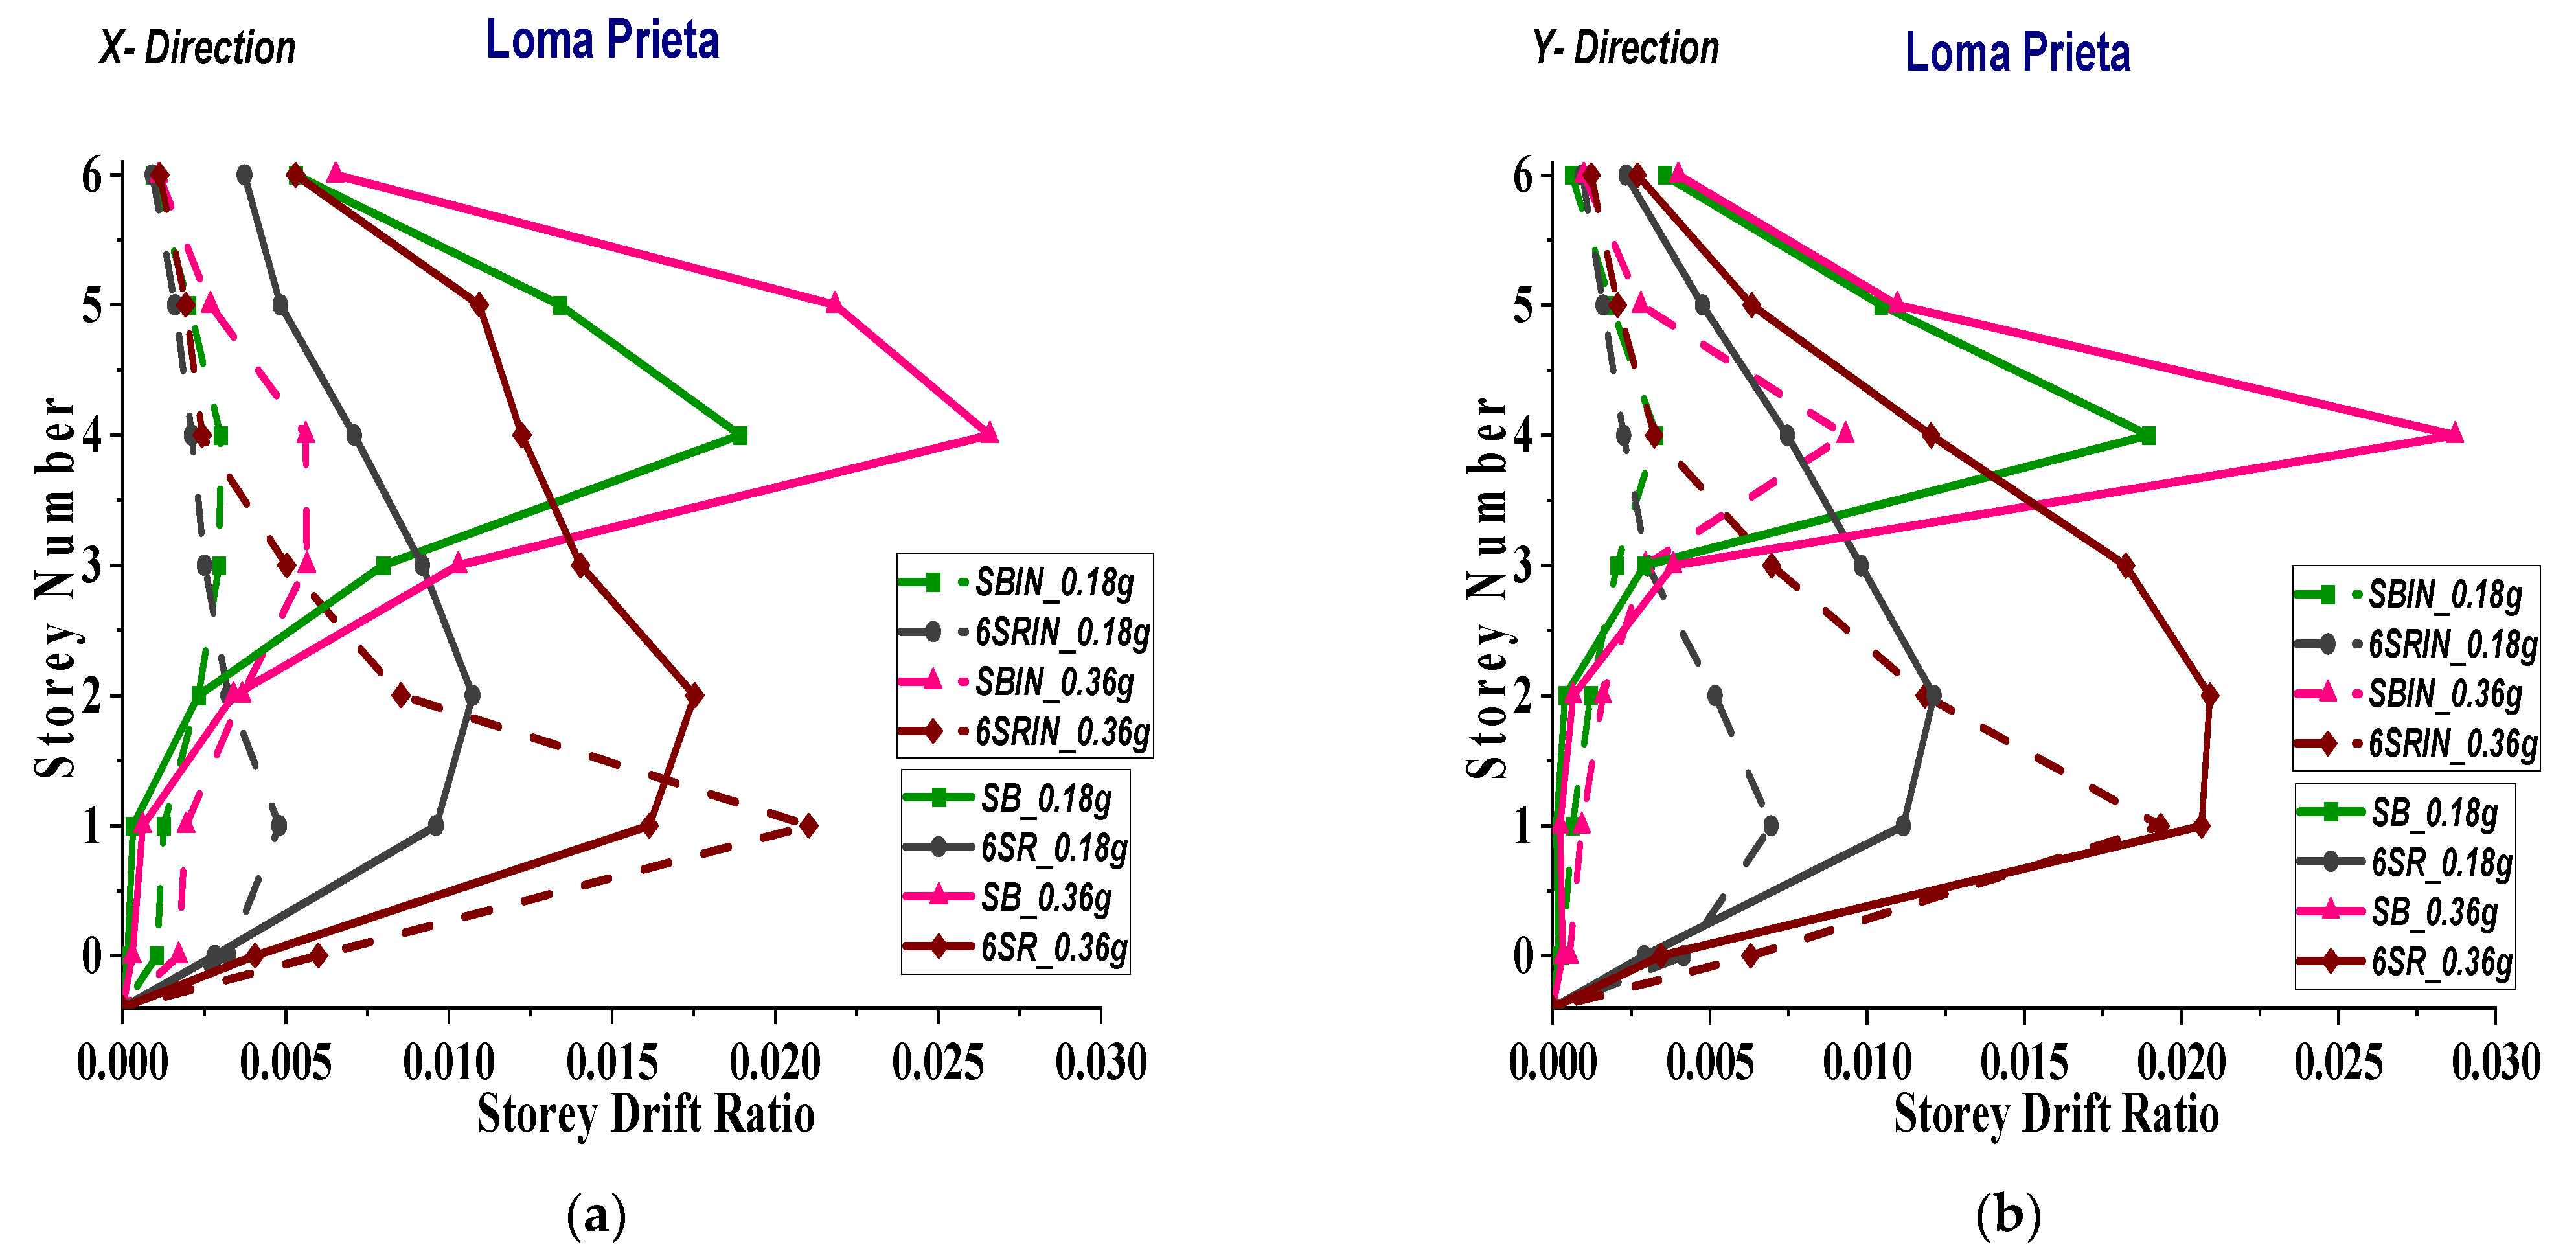
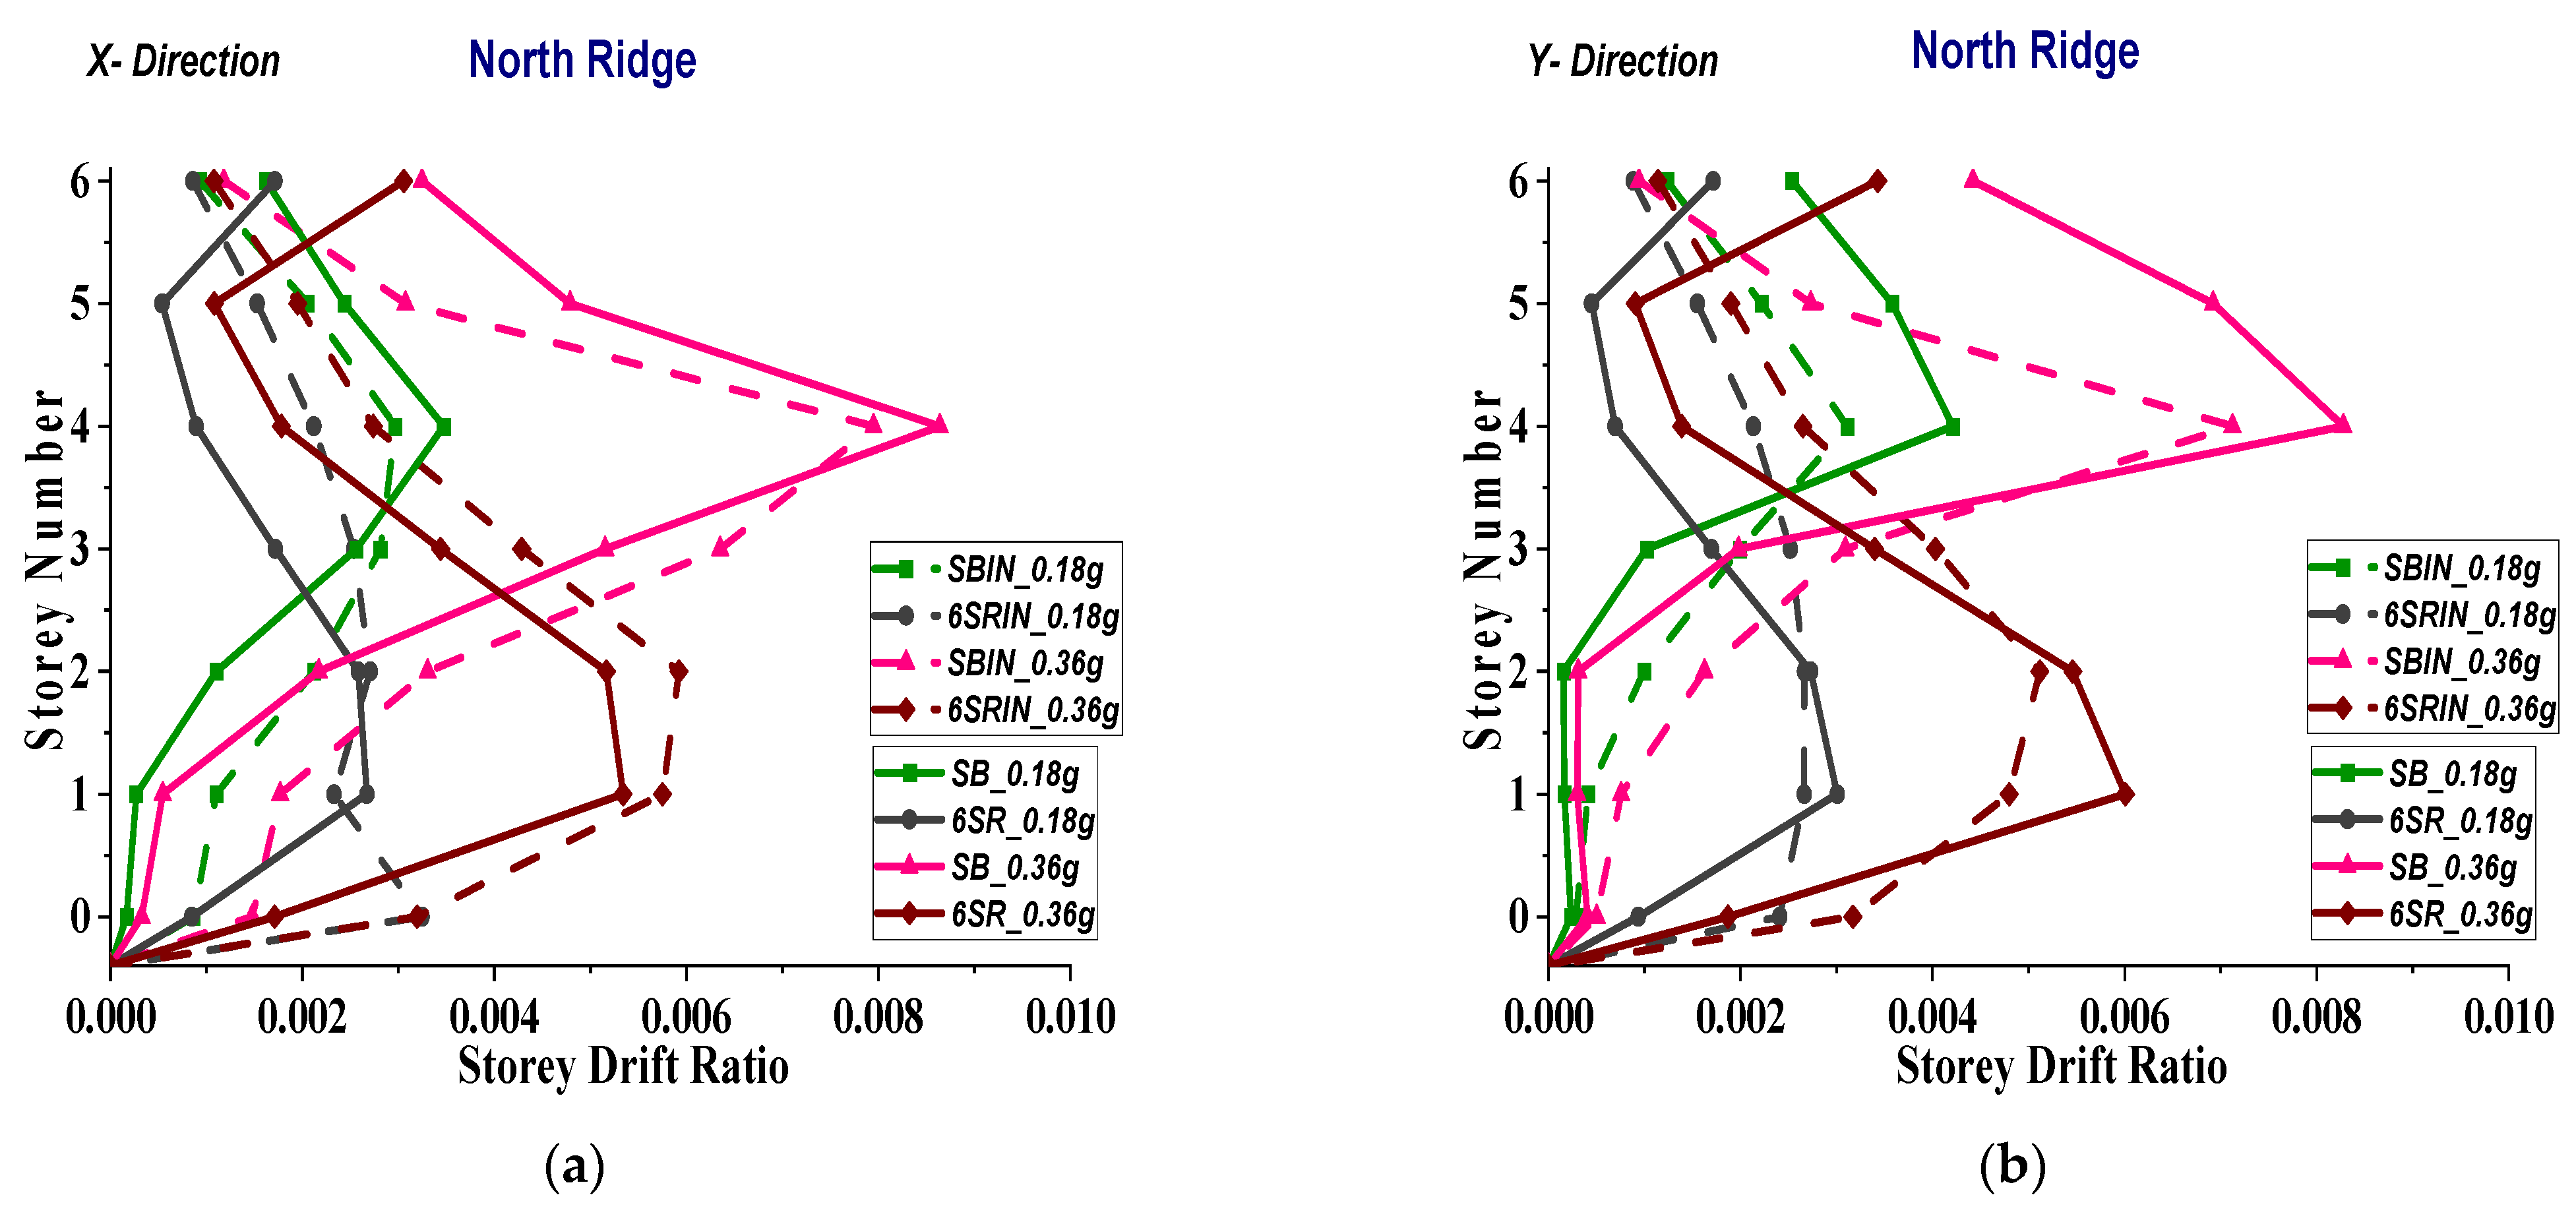
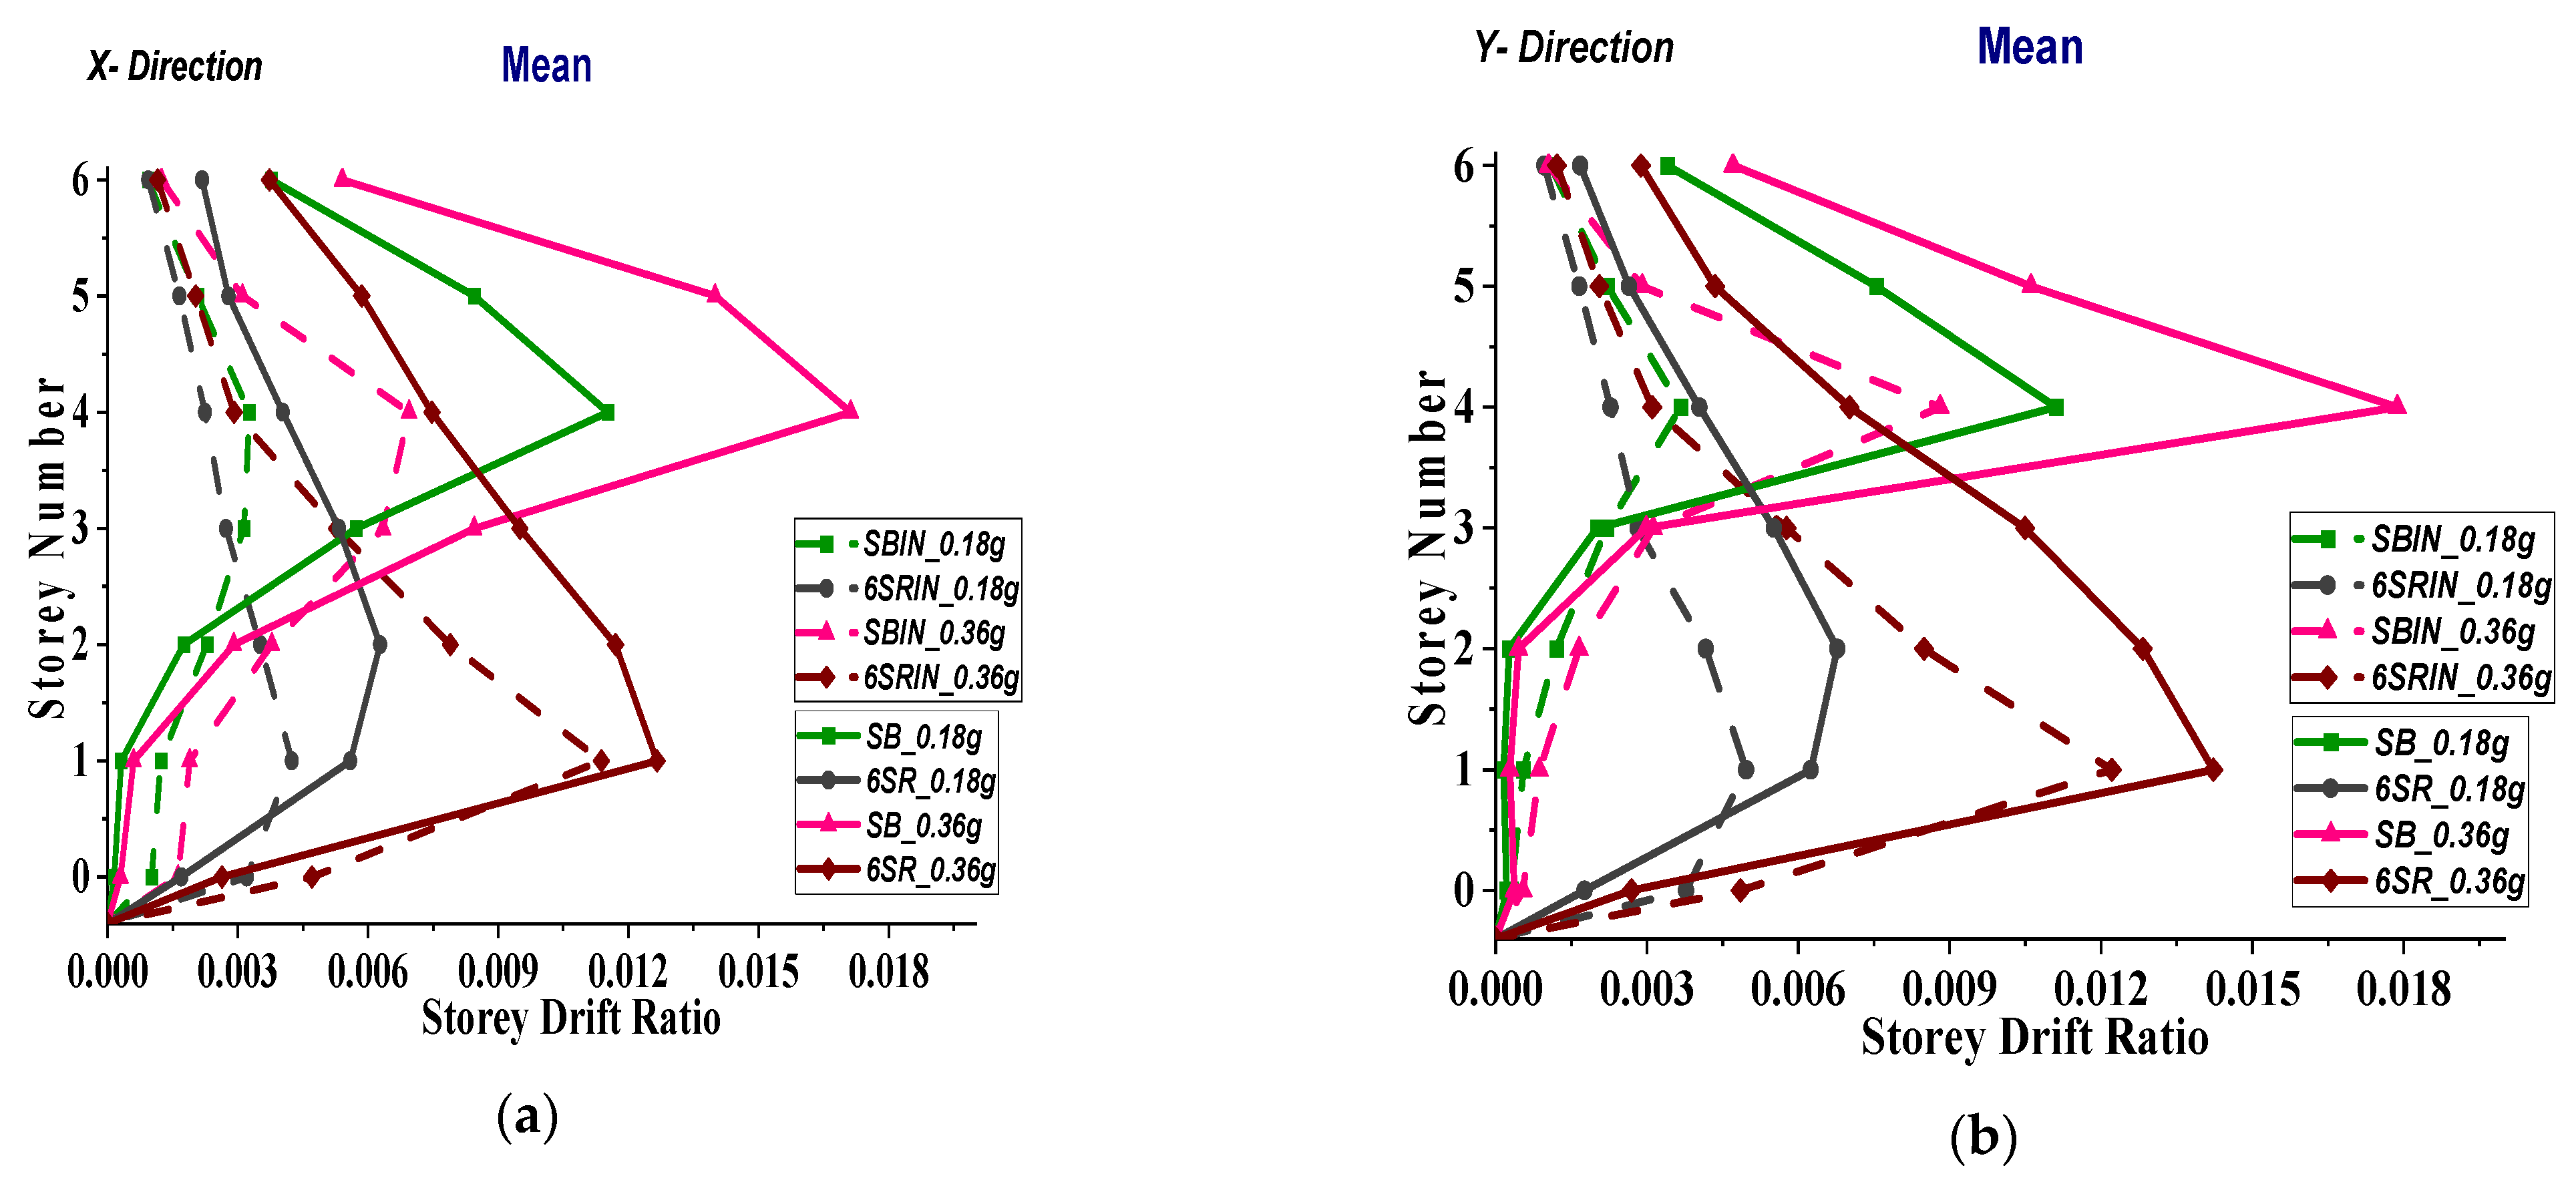
8.3.2. Inter-Storey Drift Ratio
9. Conclusions
- Capacity curves show that step-back buildings with infill are significantly stronger and stiffer compared to those without infill, a trend also seen in both three- and six-storey regular buildings.
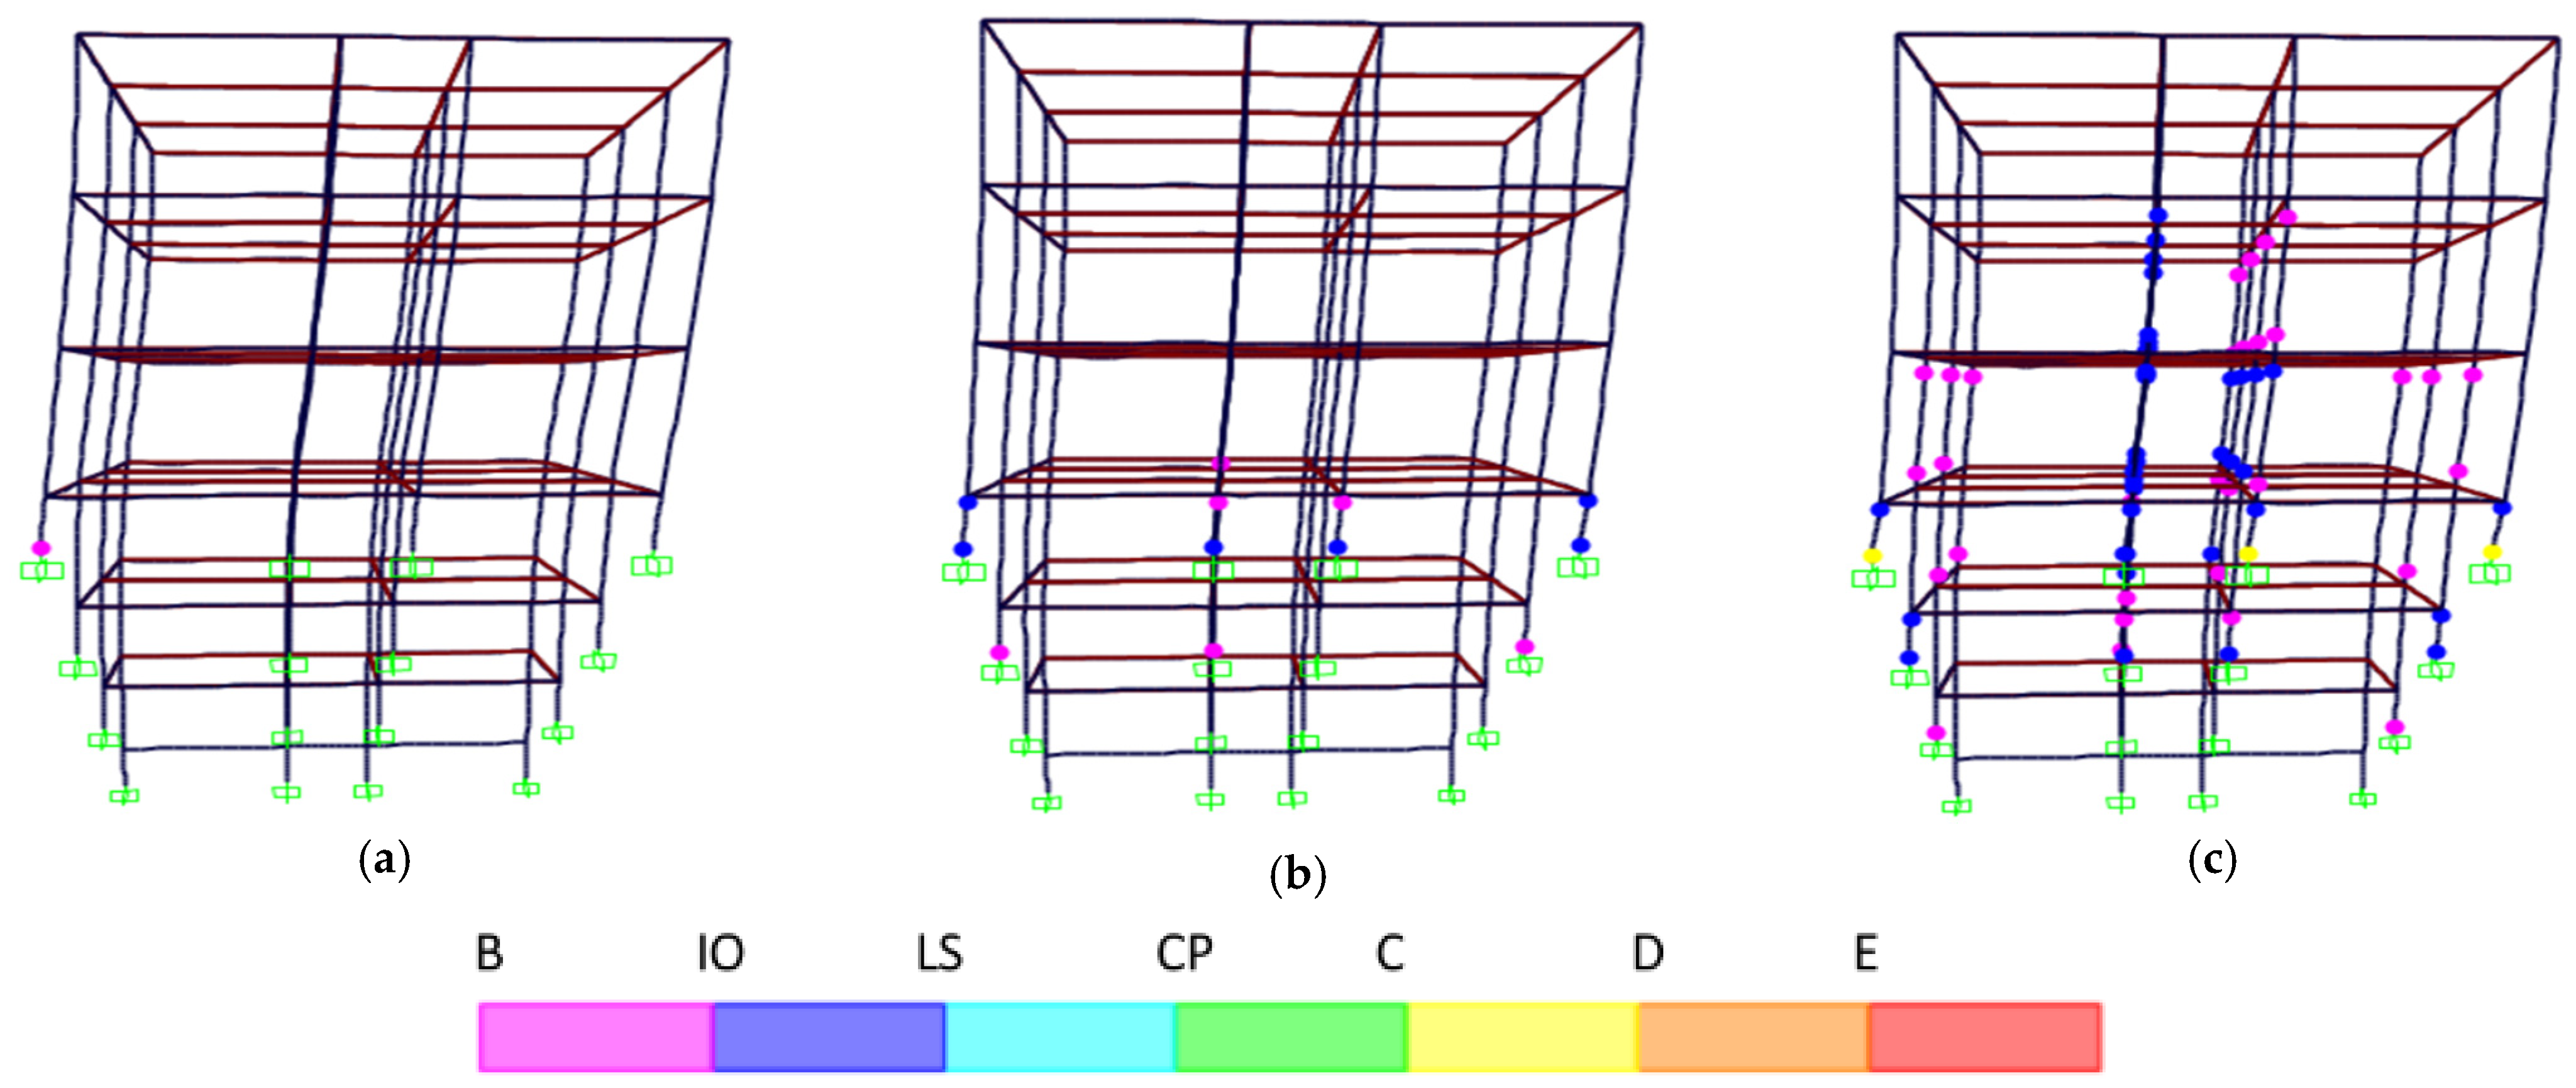
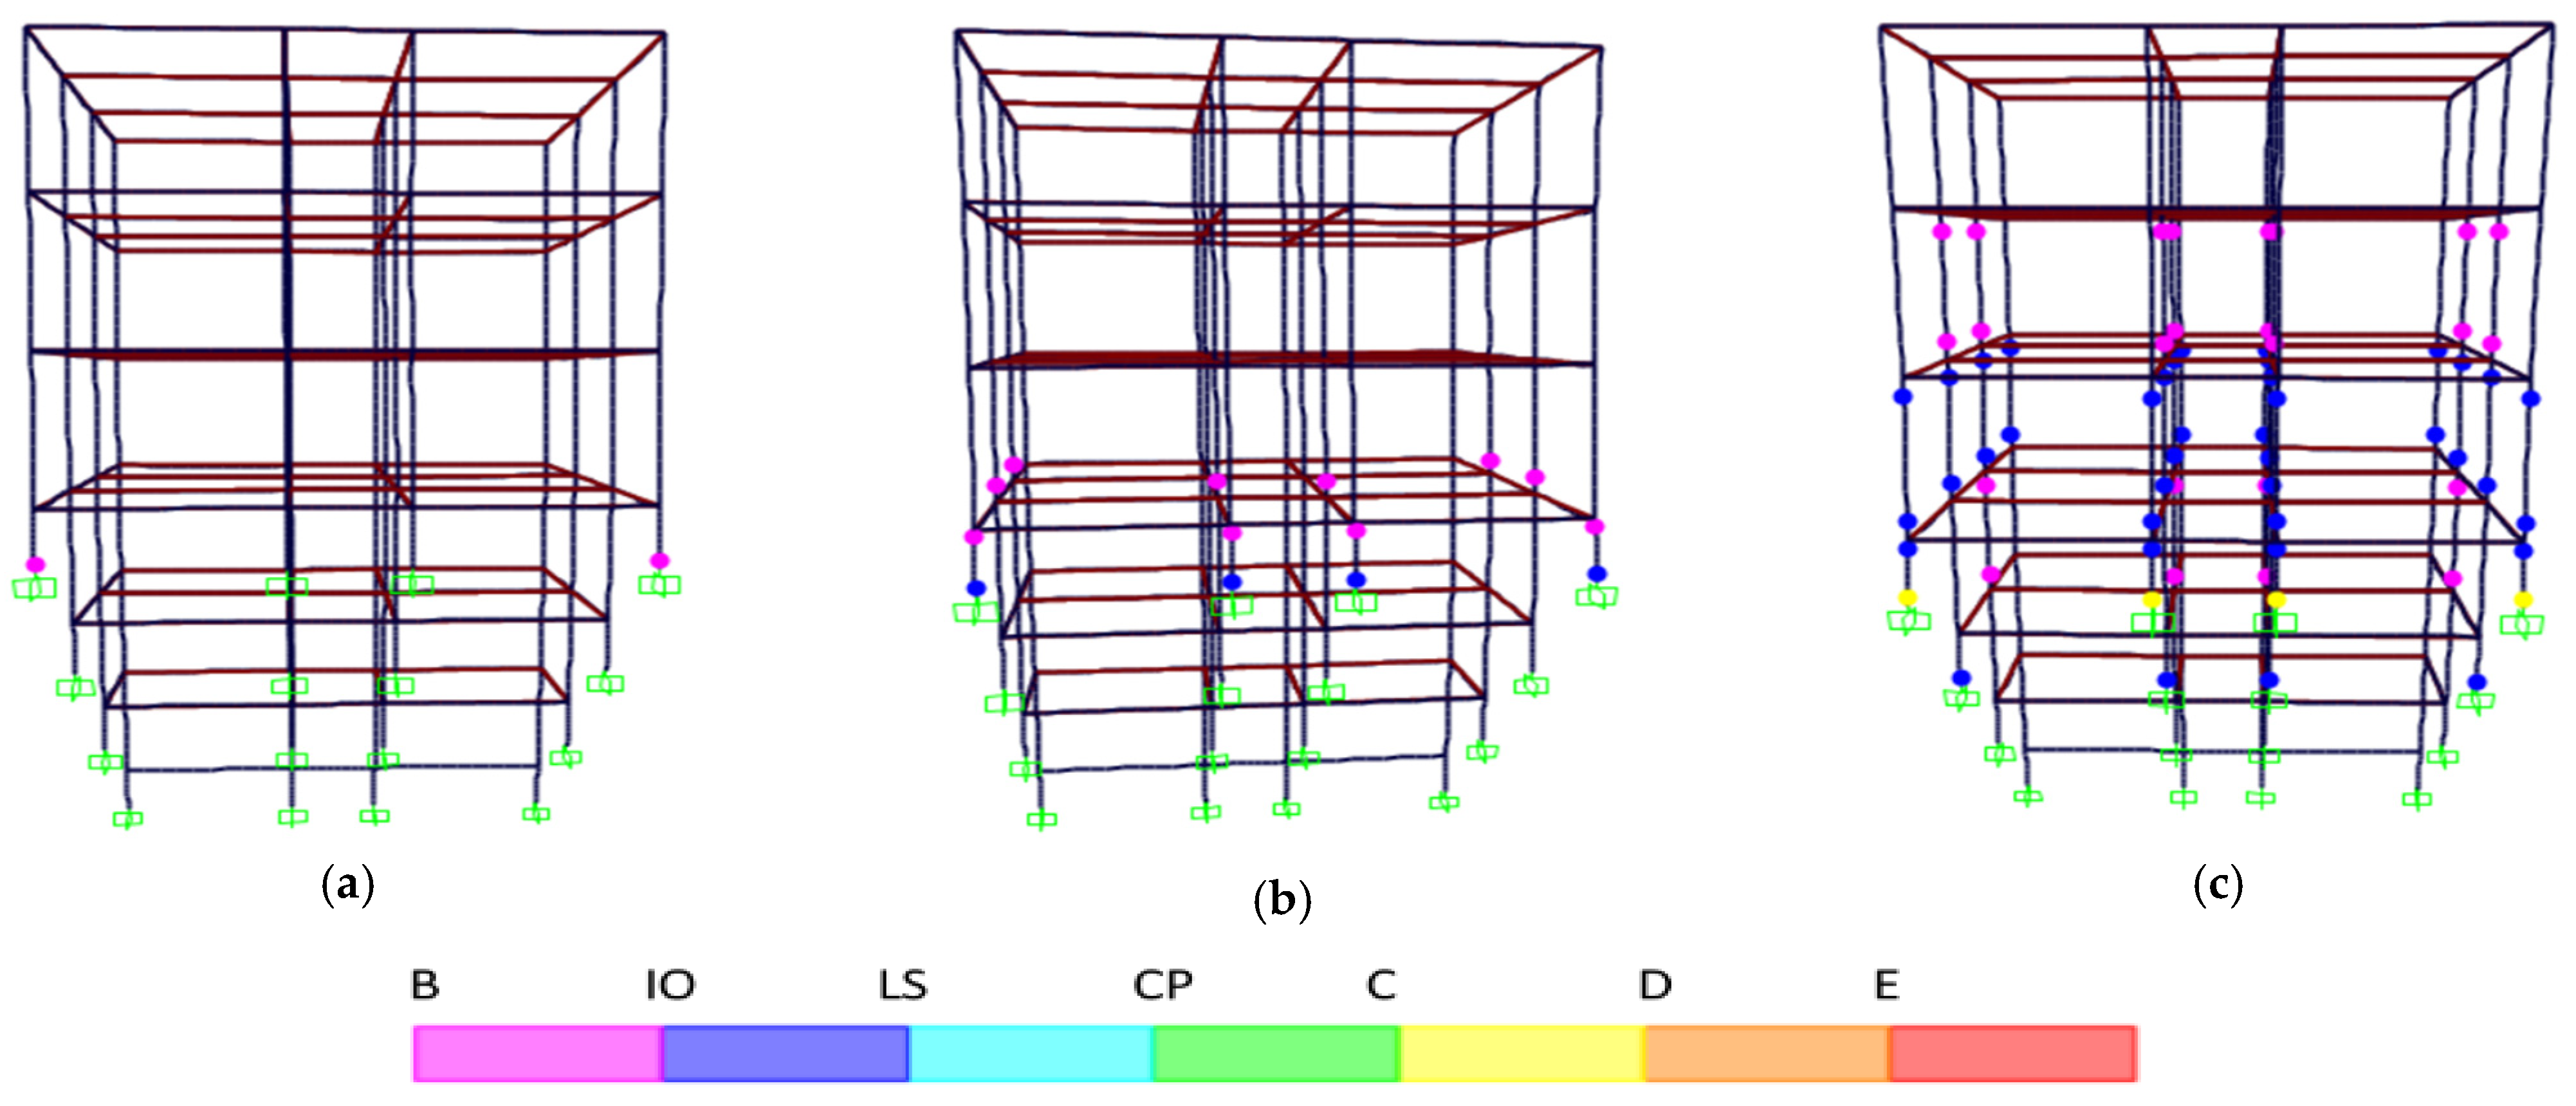
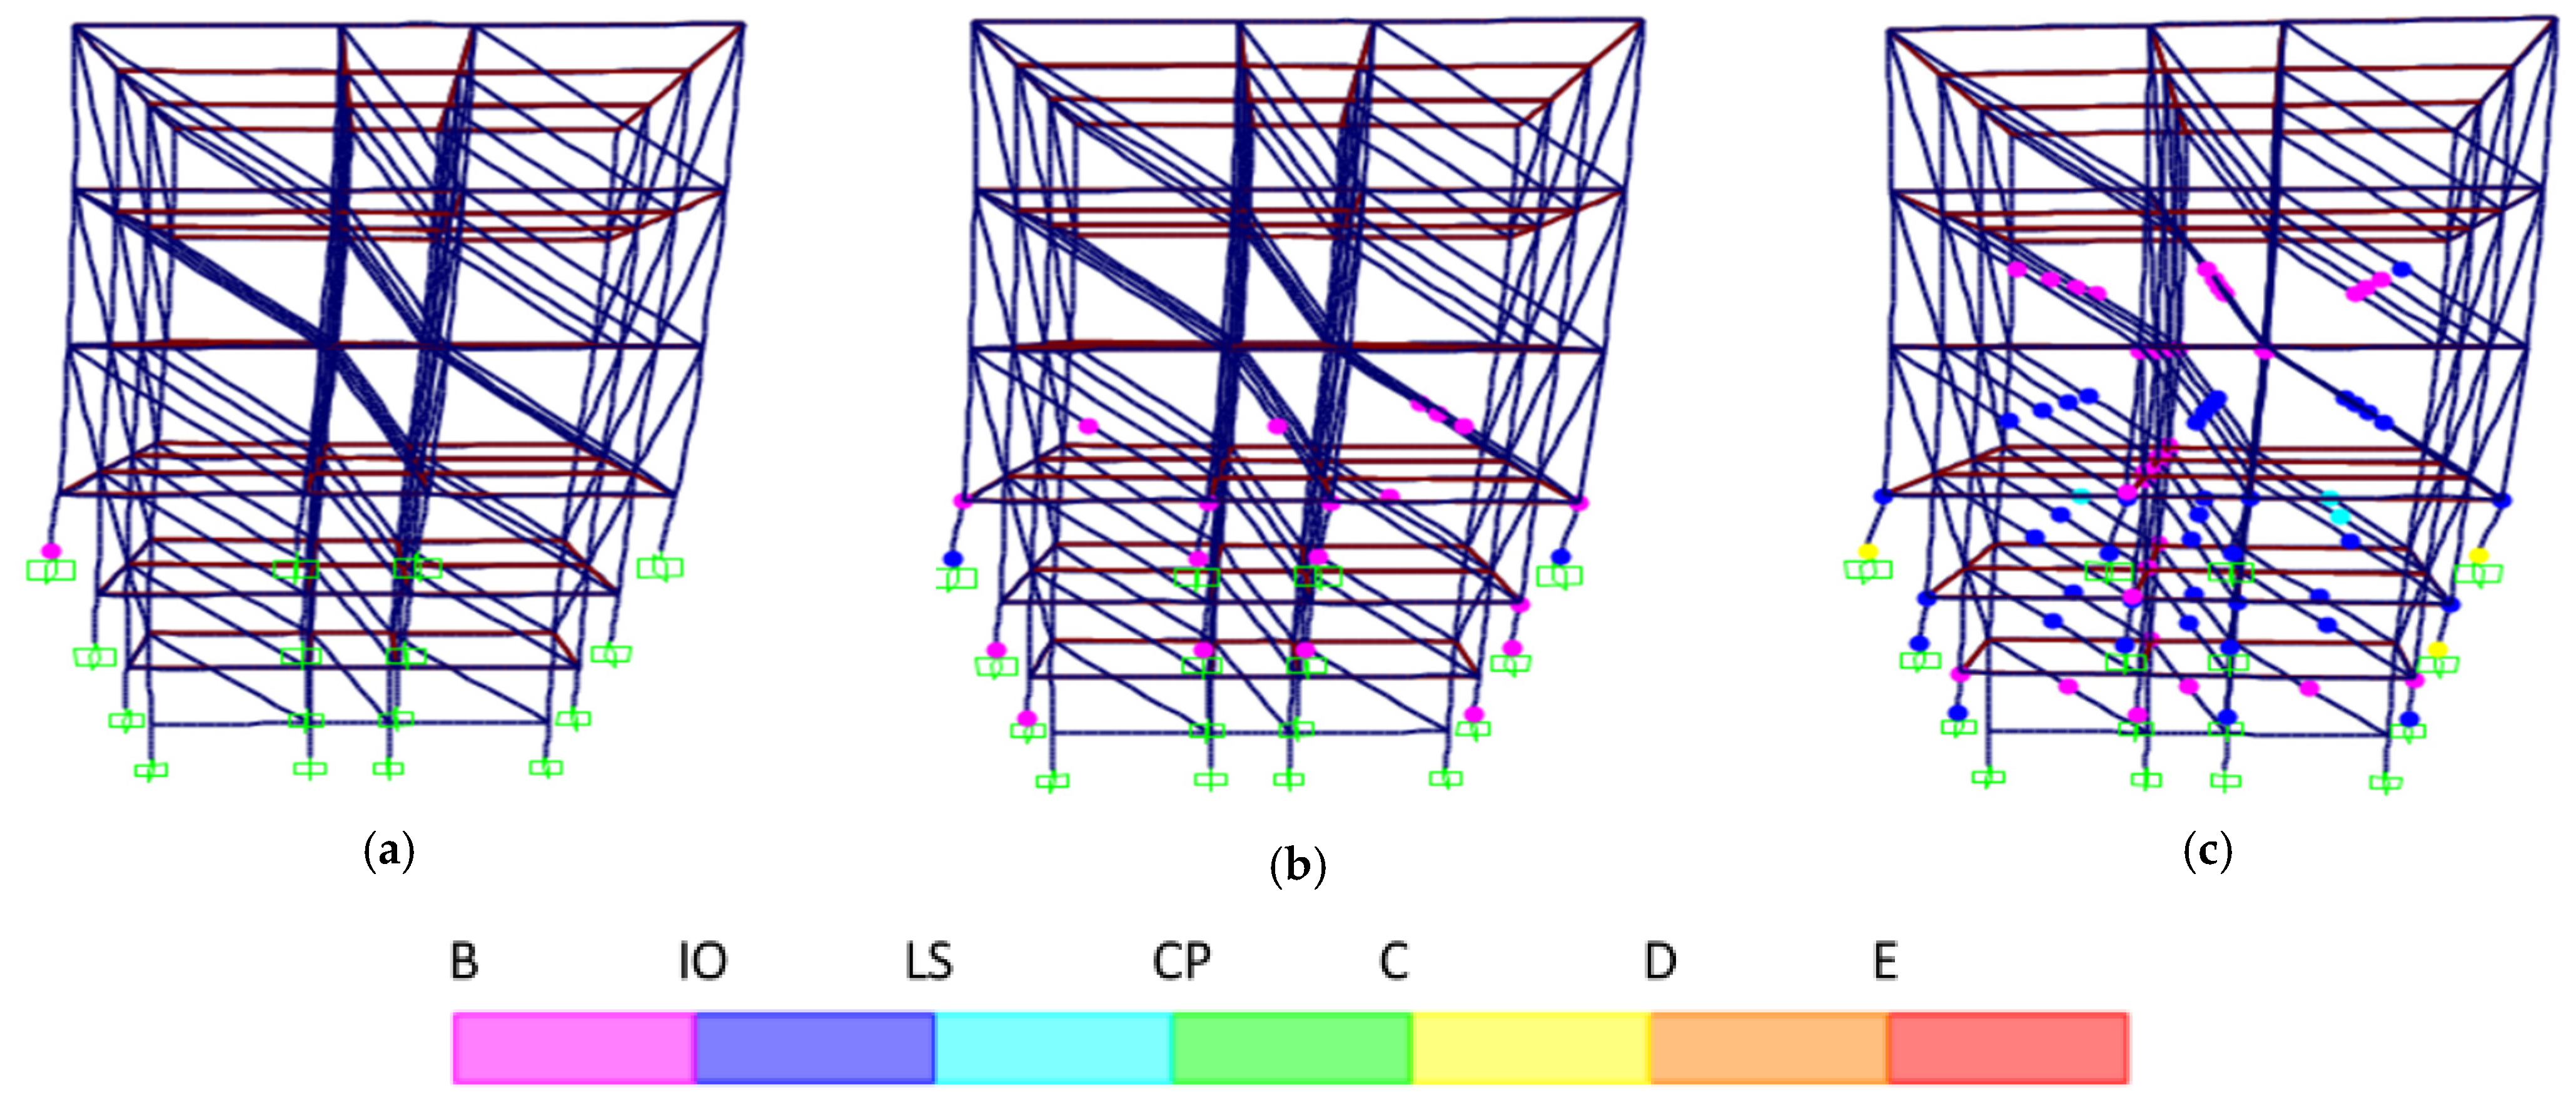
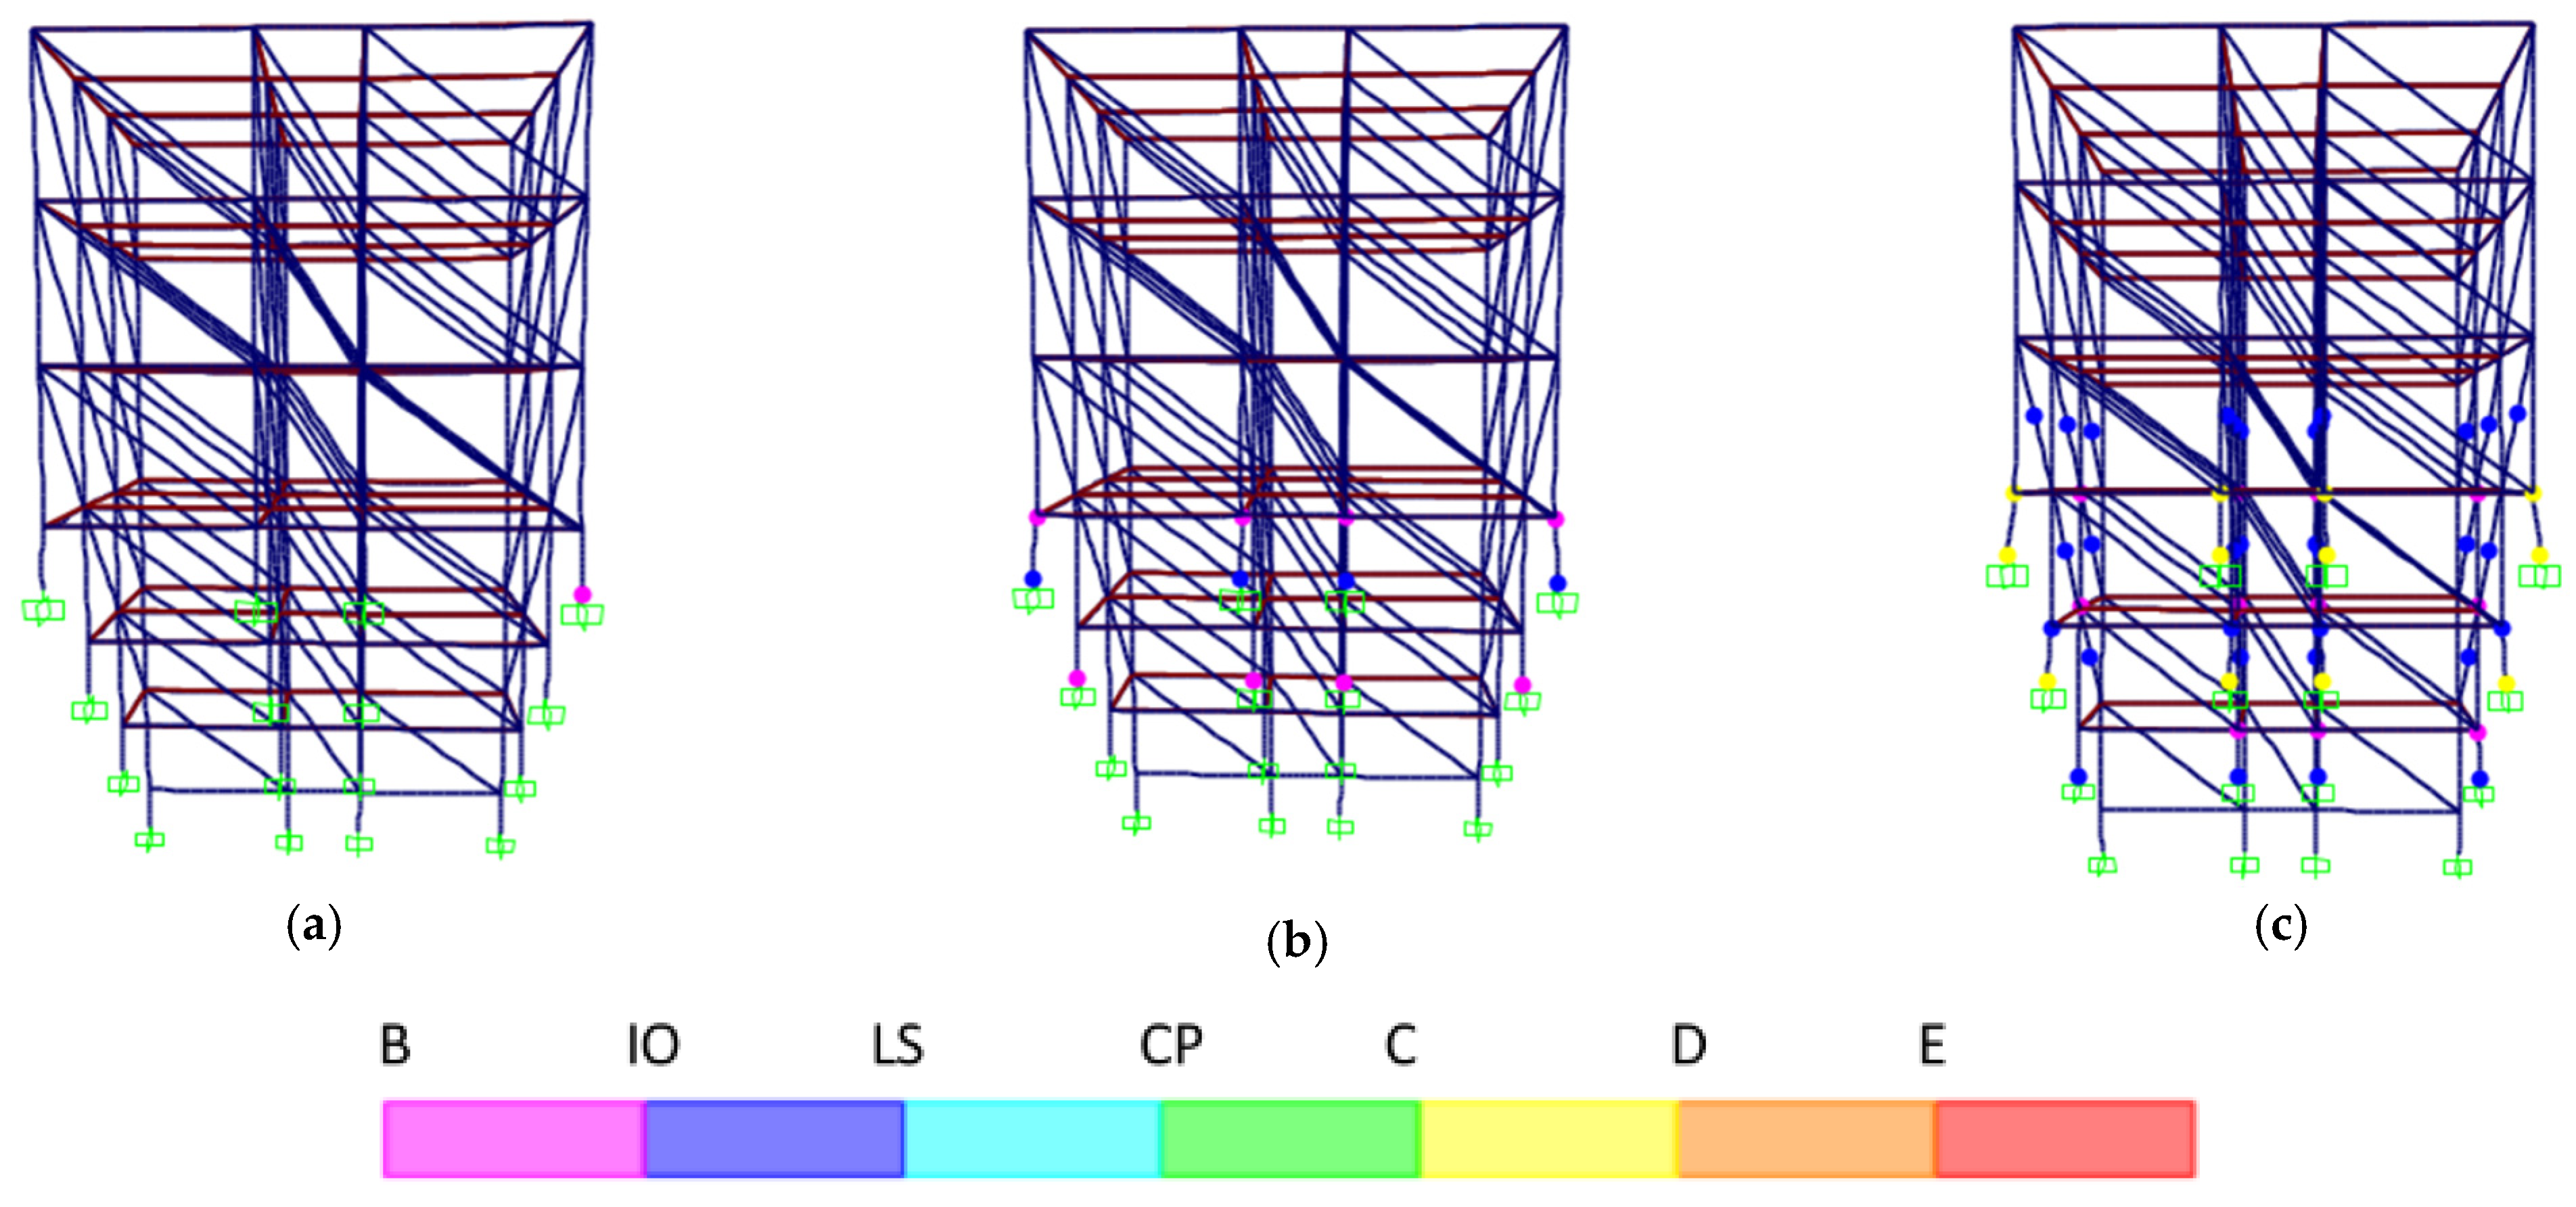
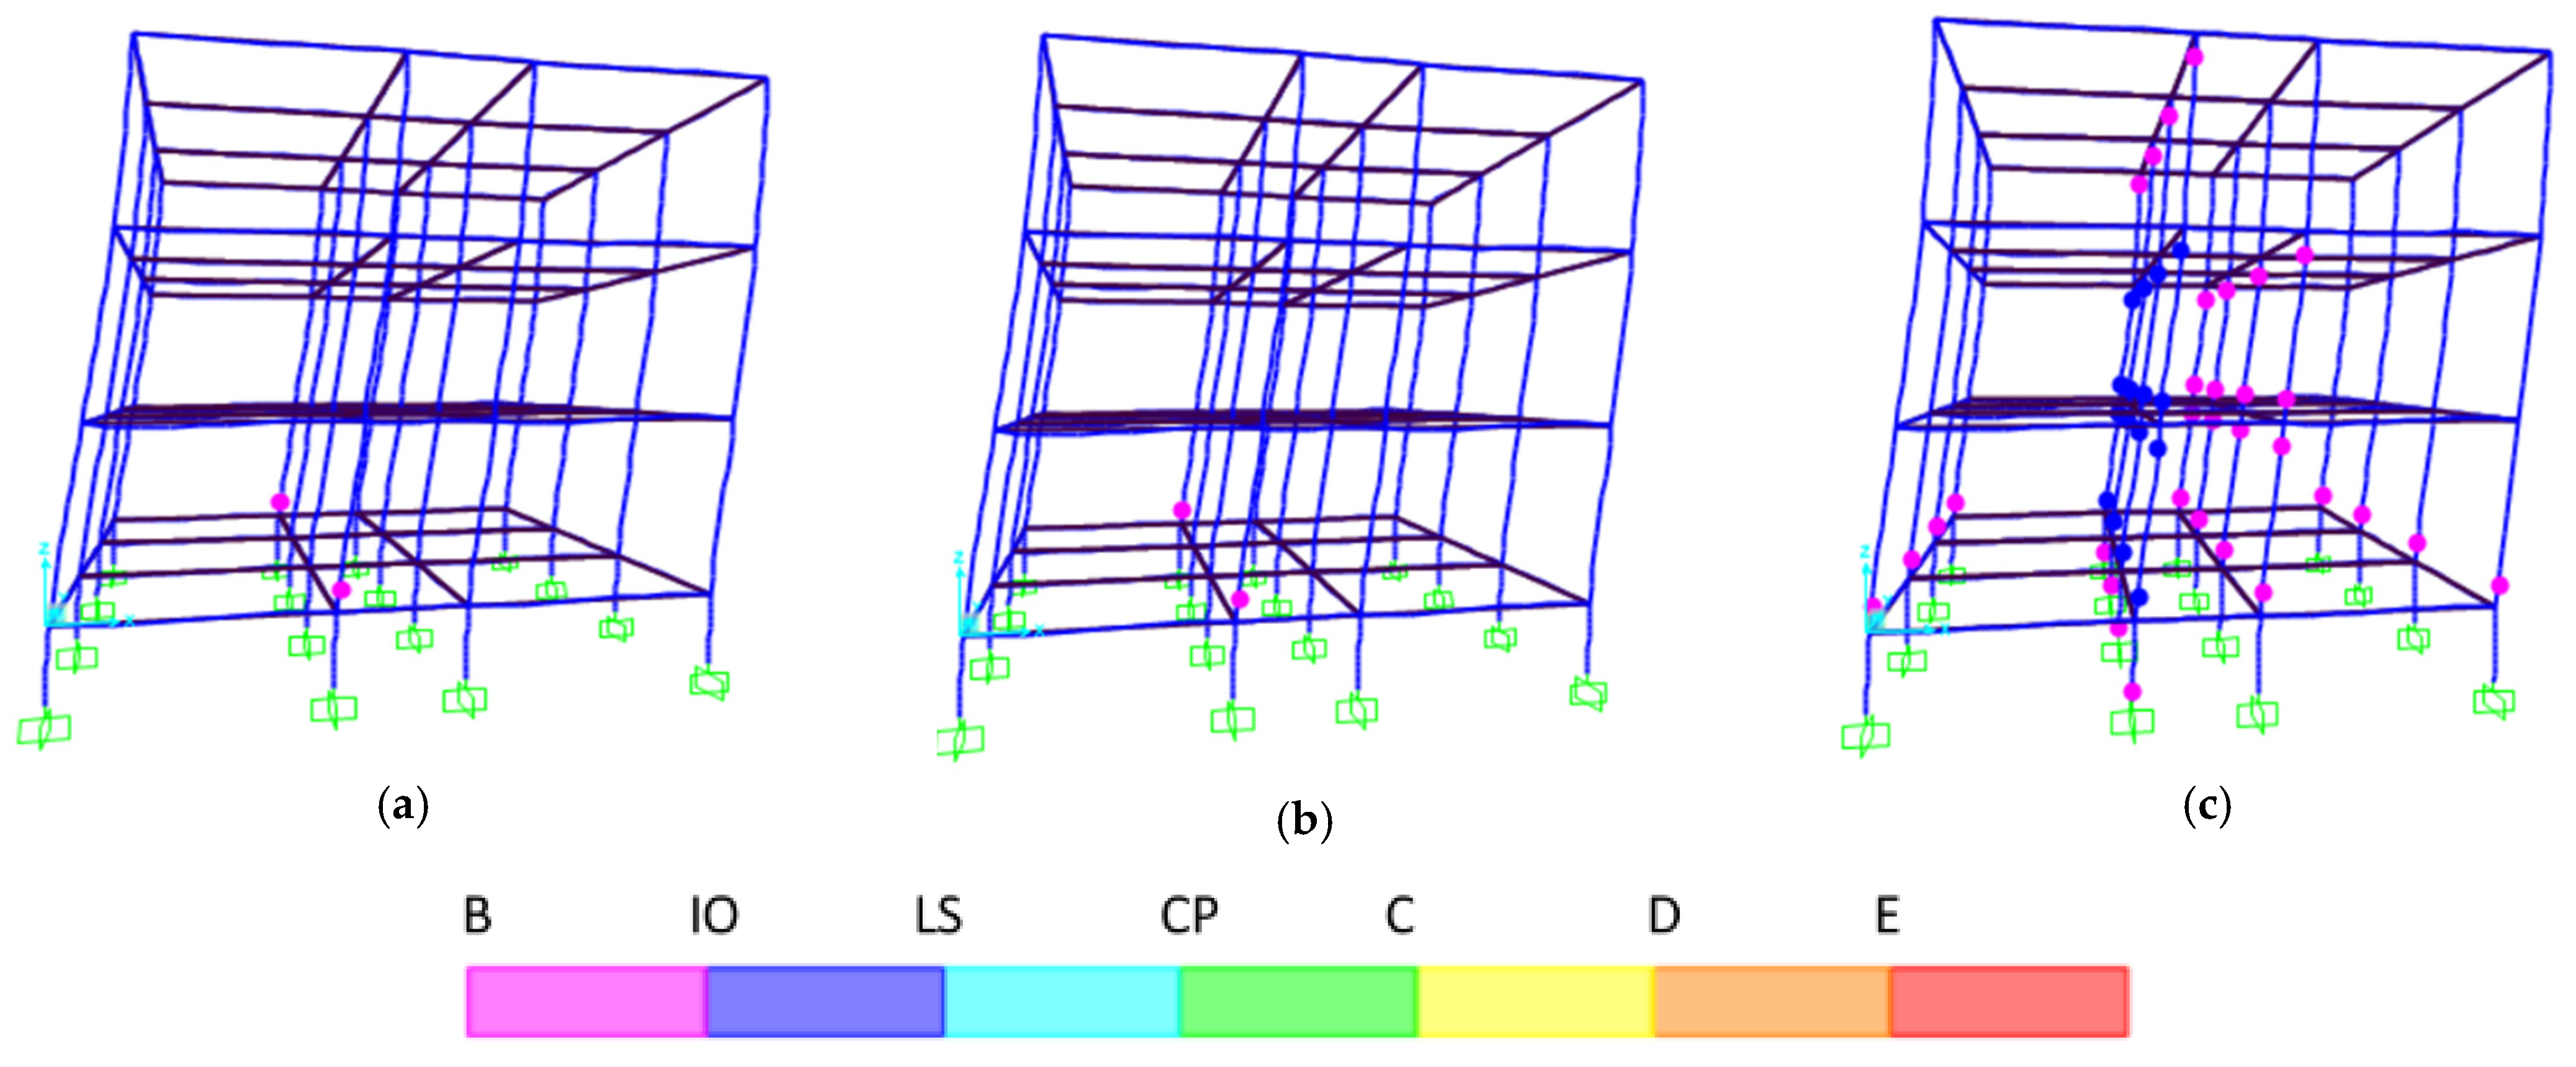
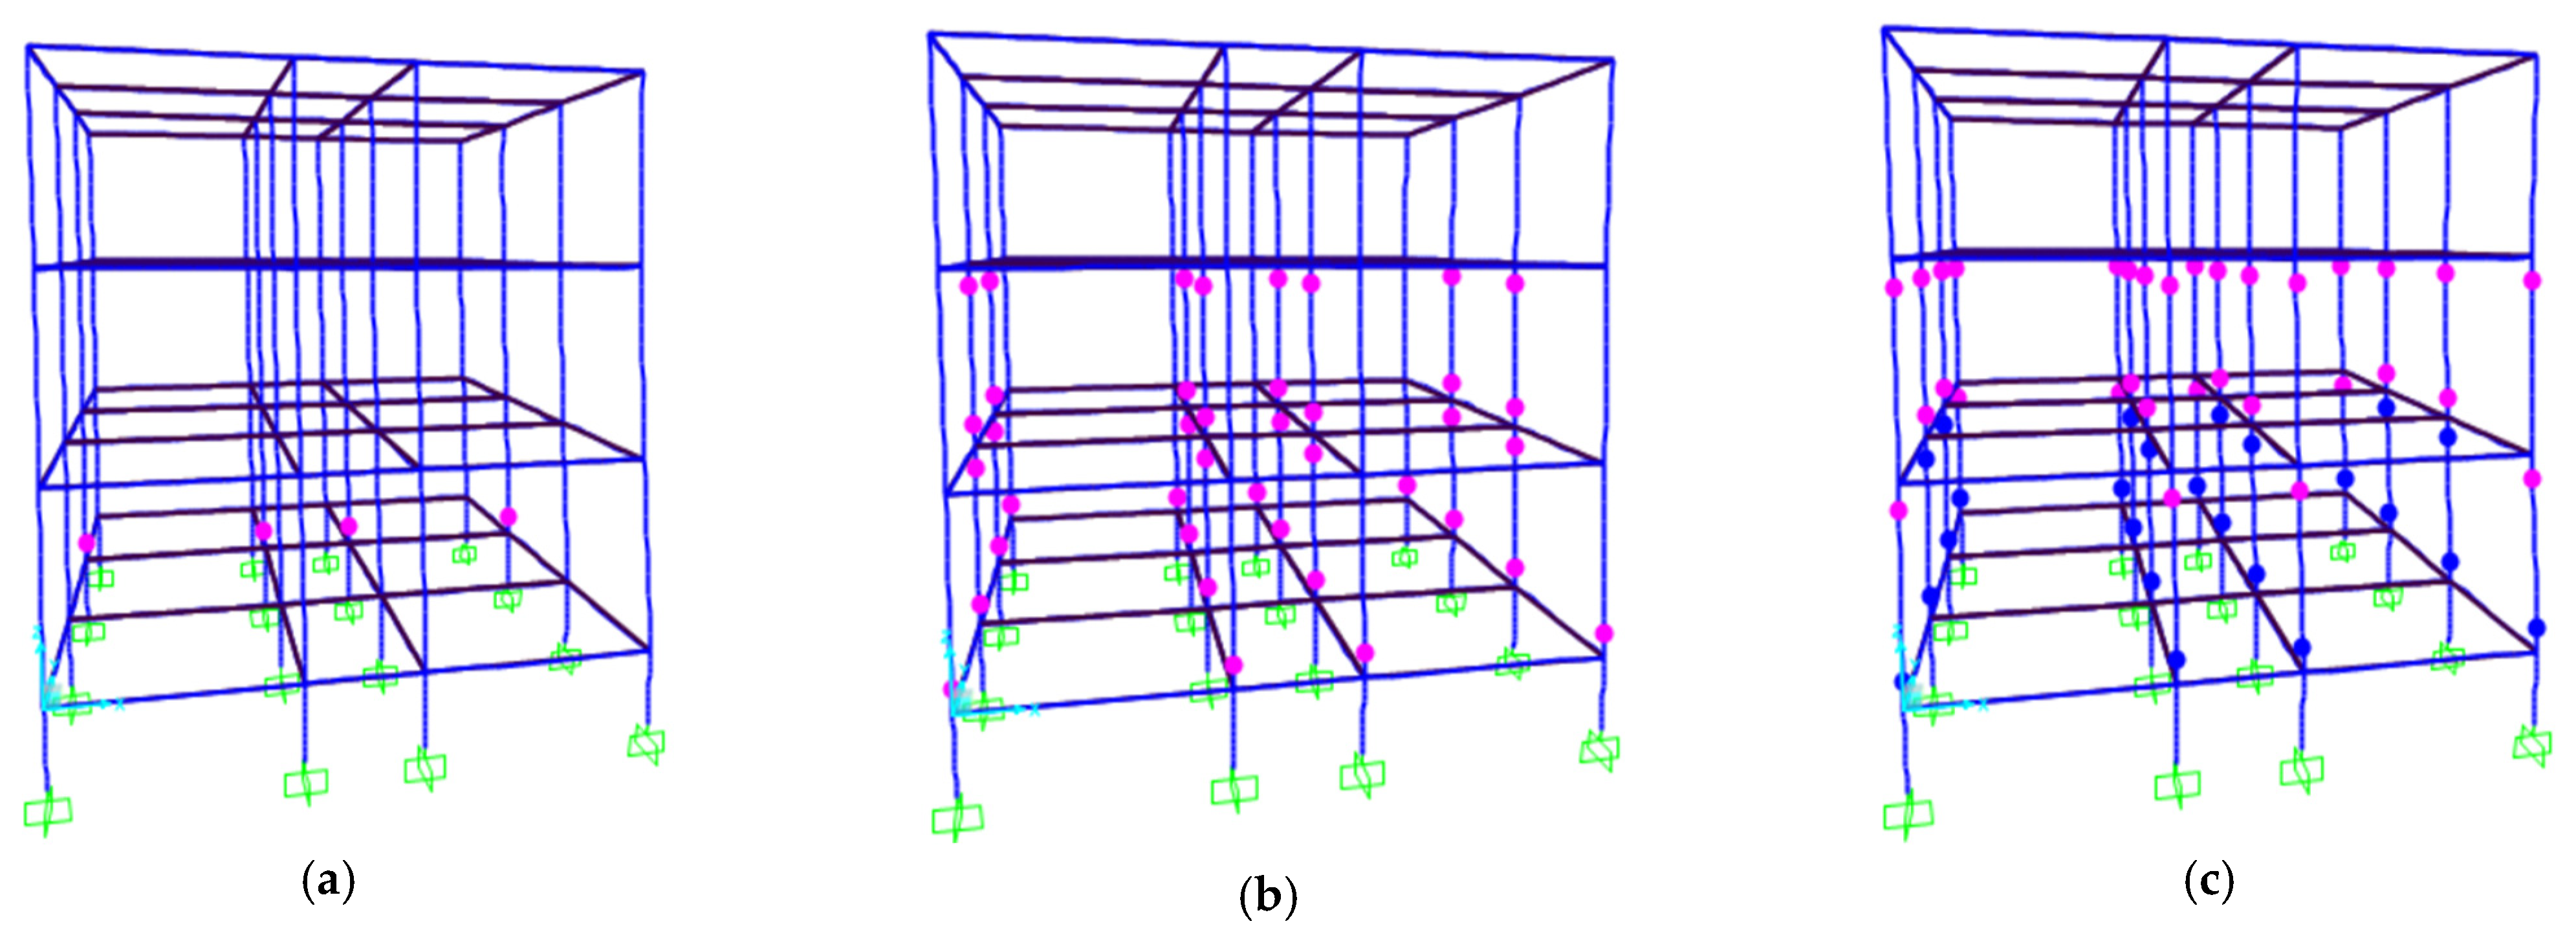
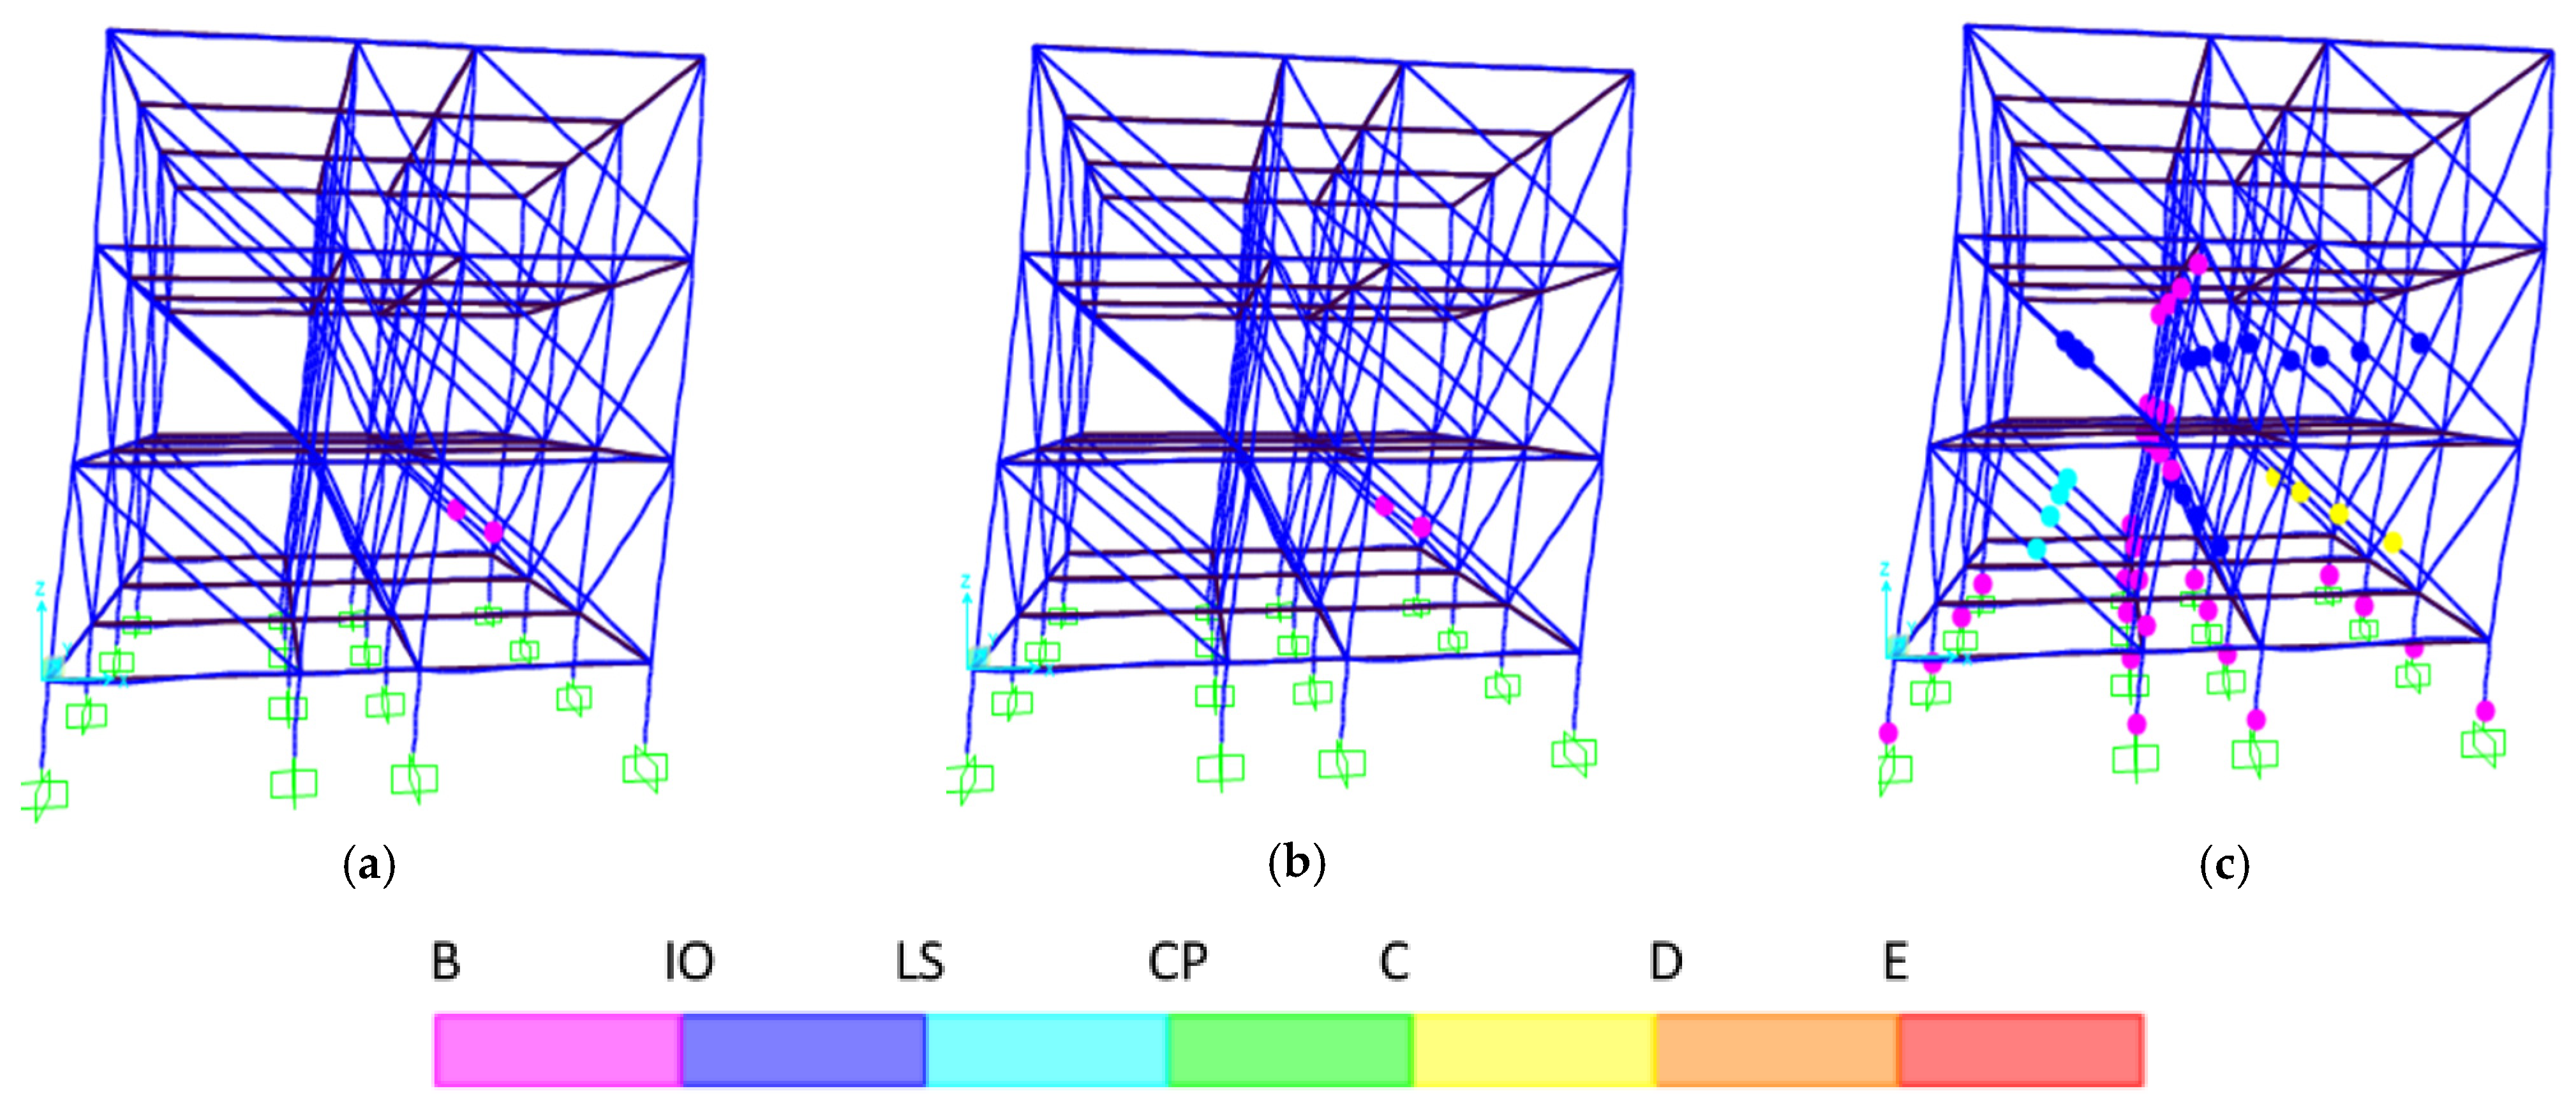
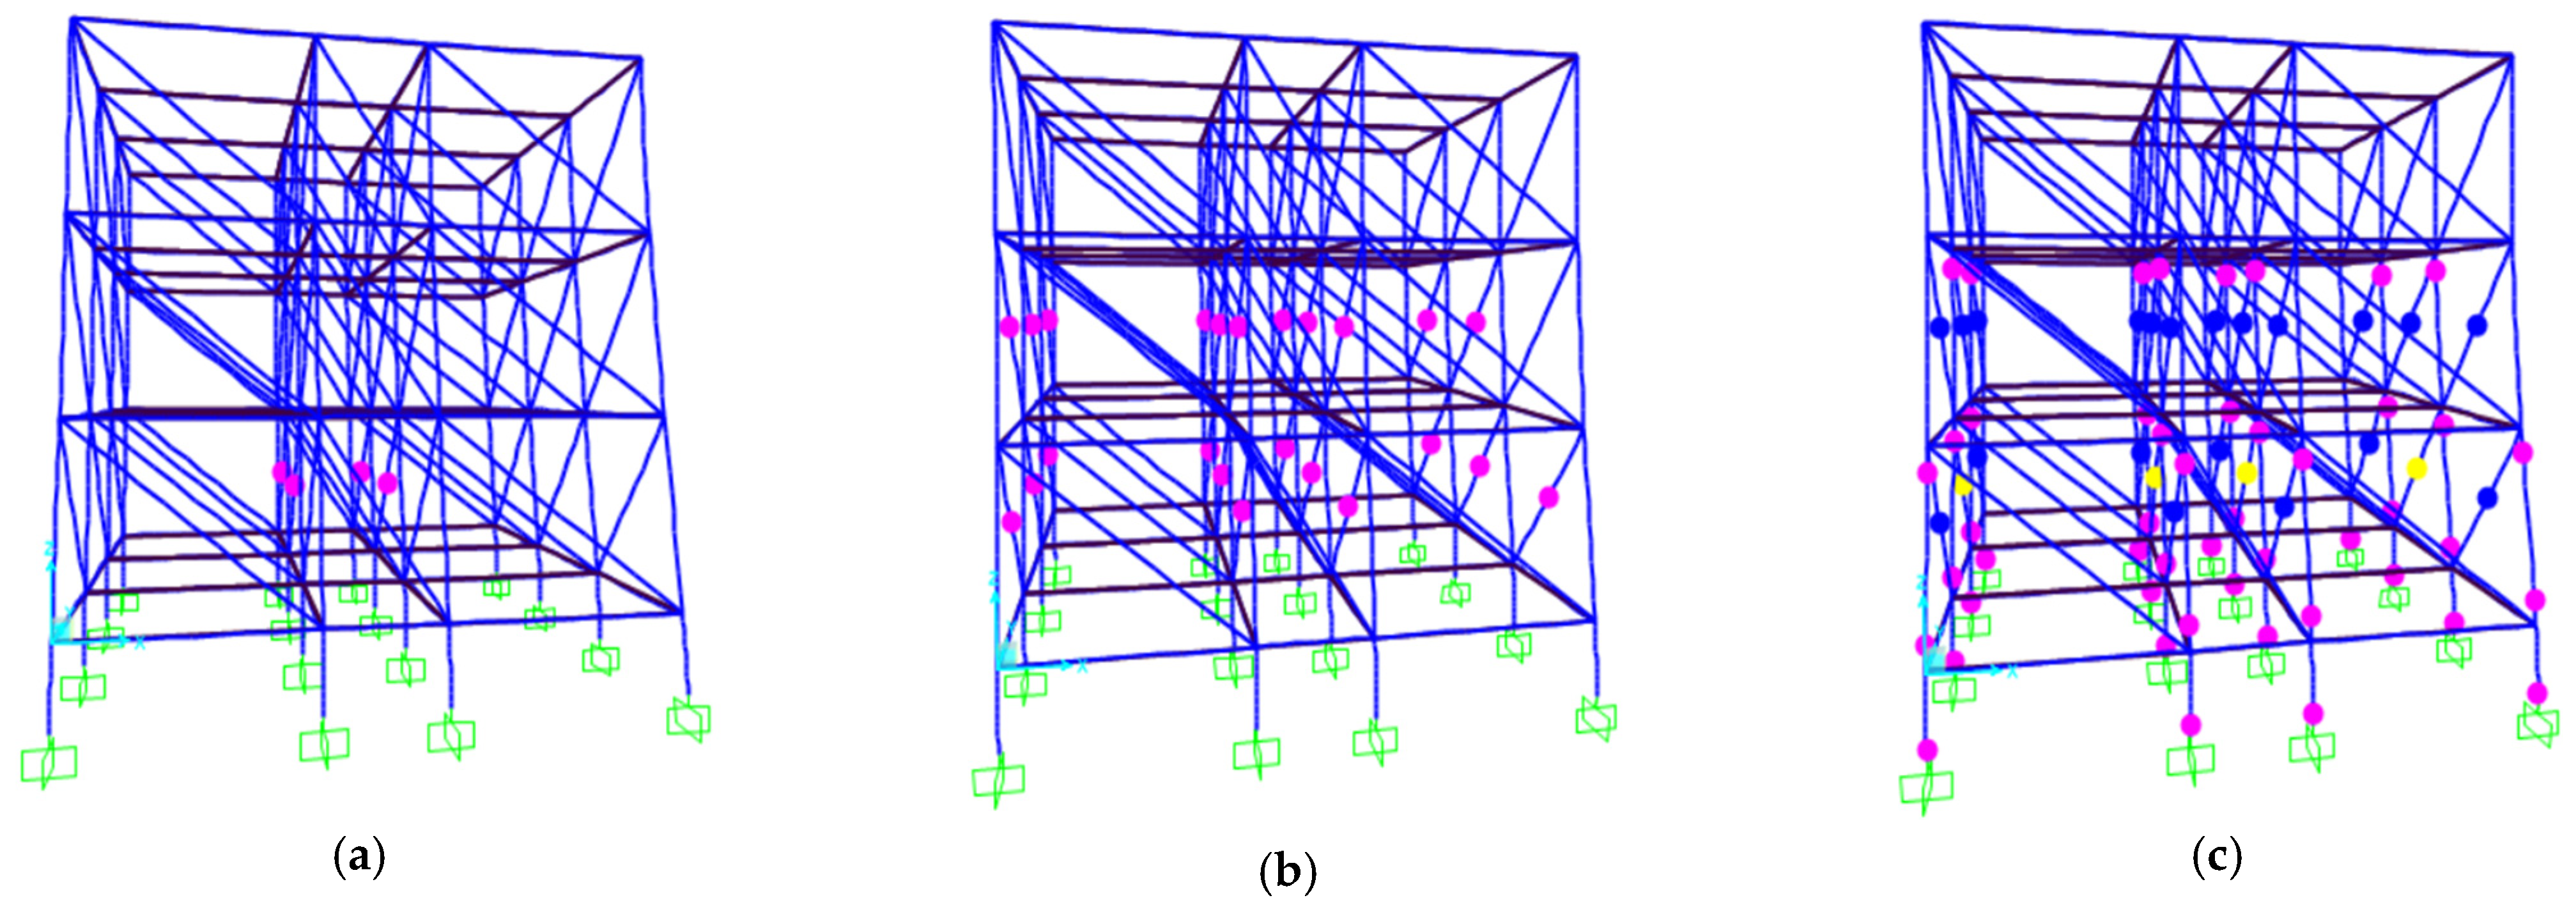
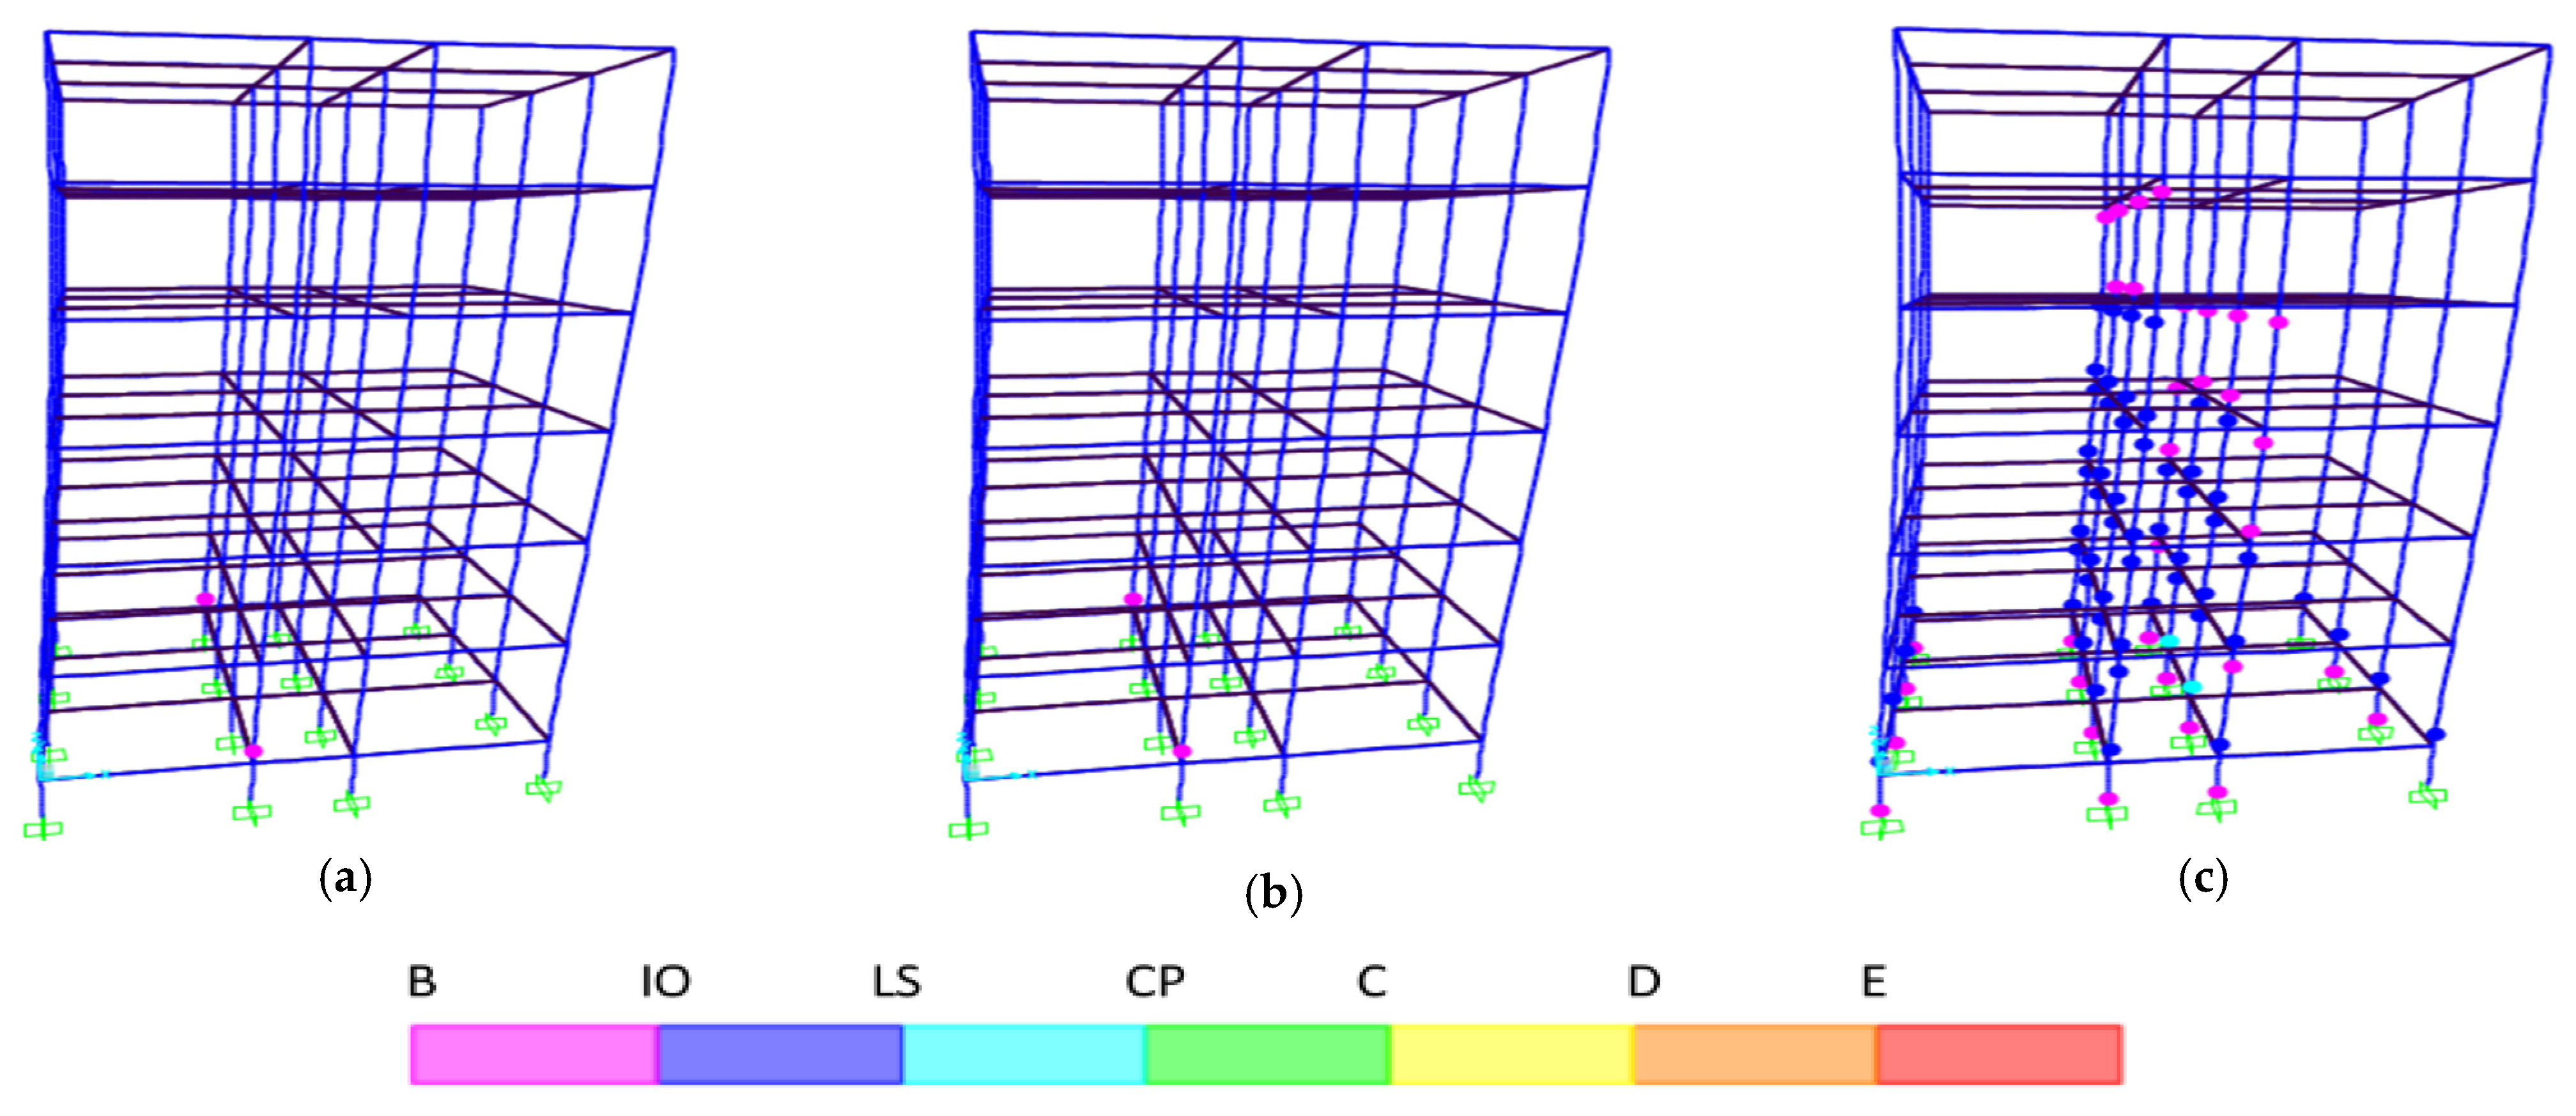
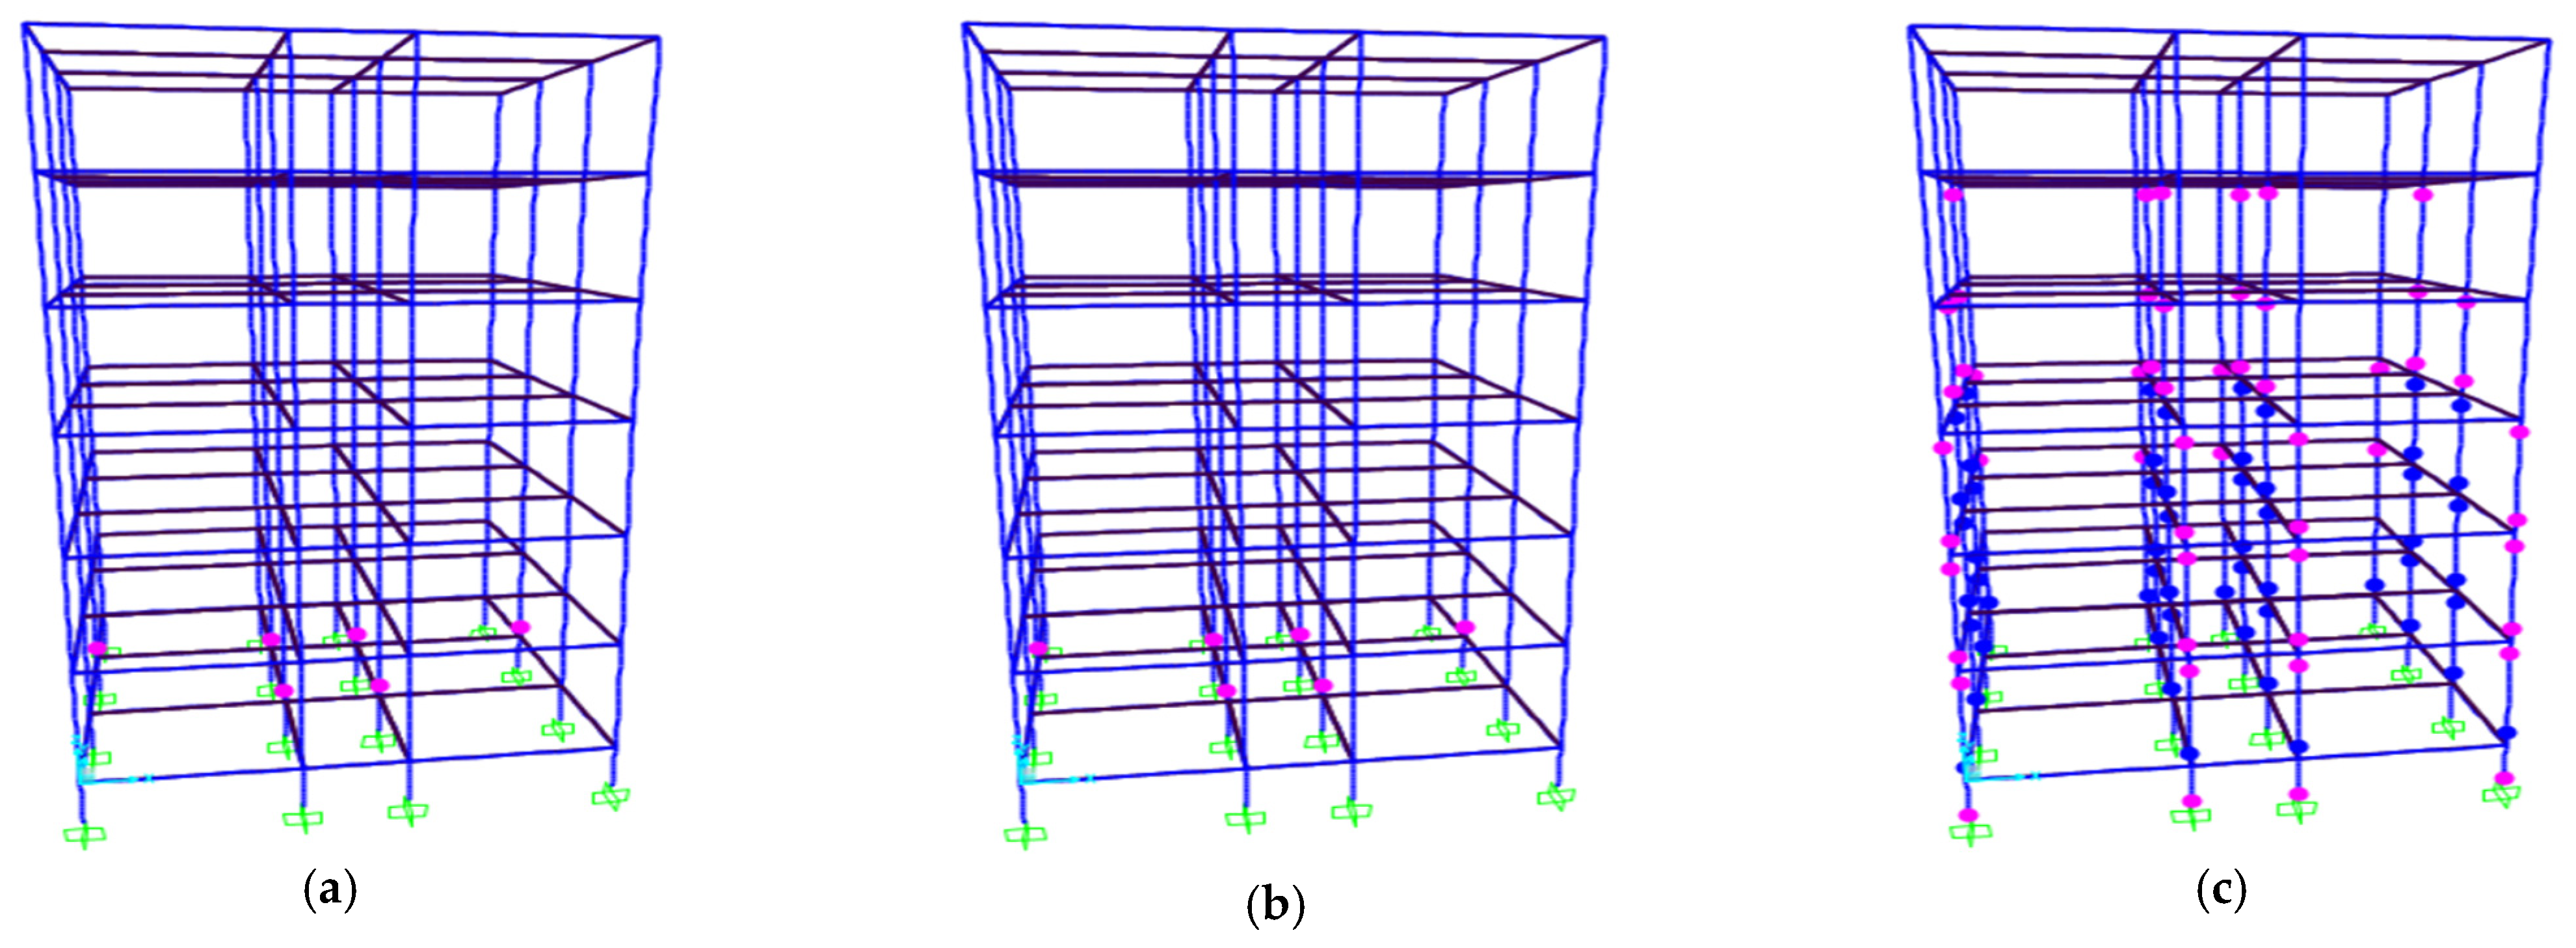
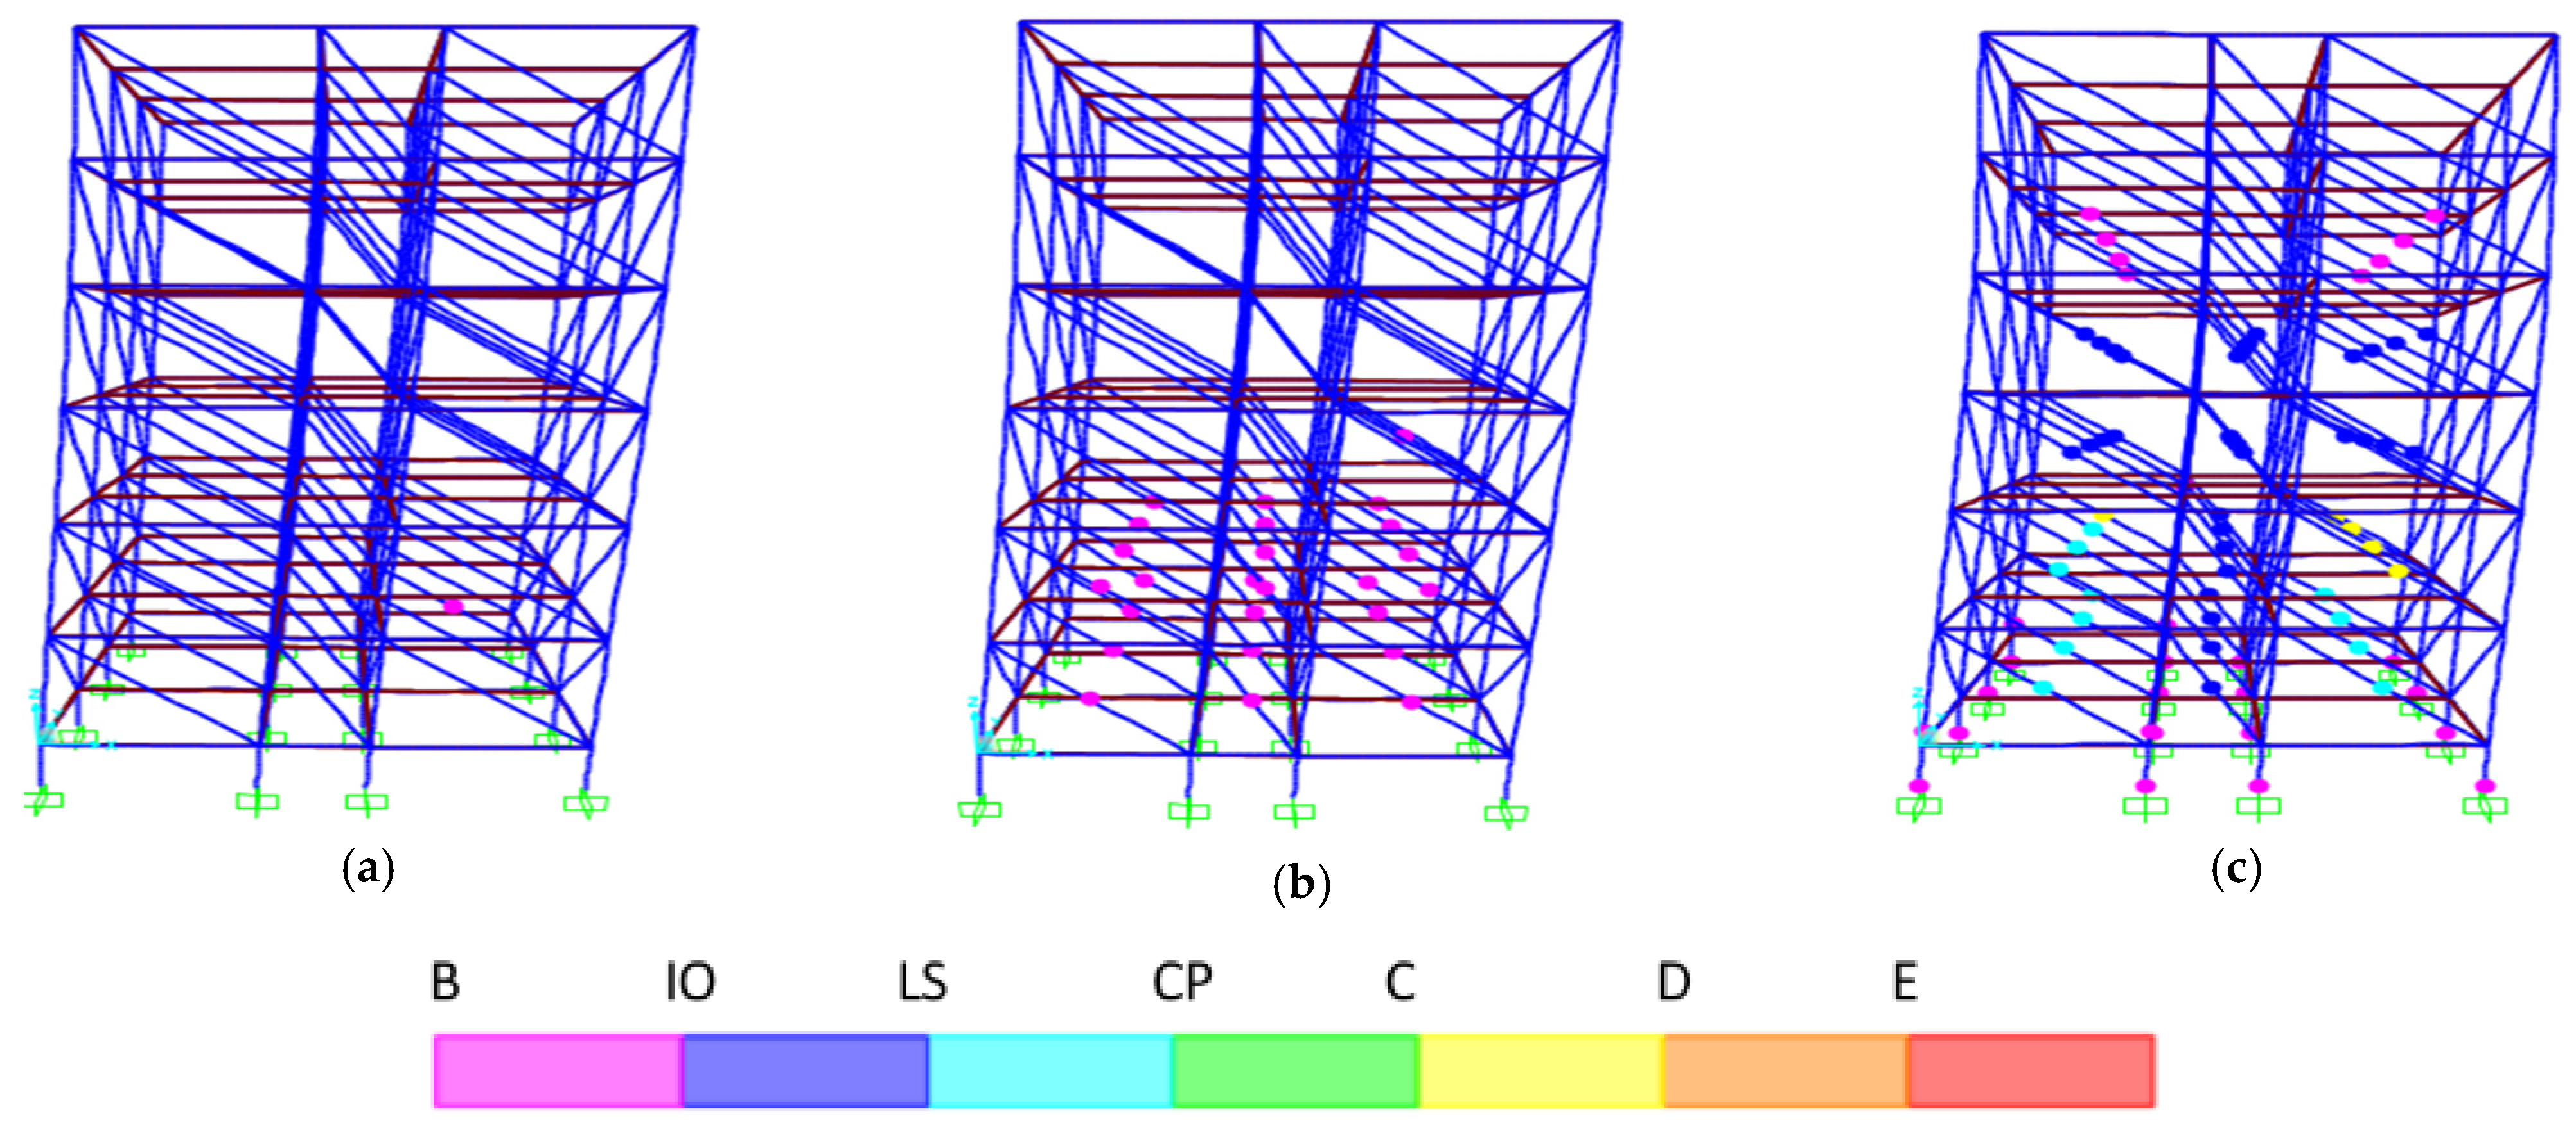
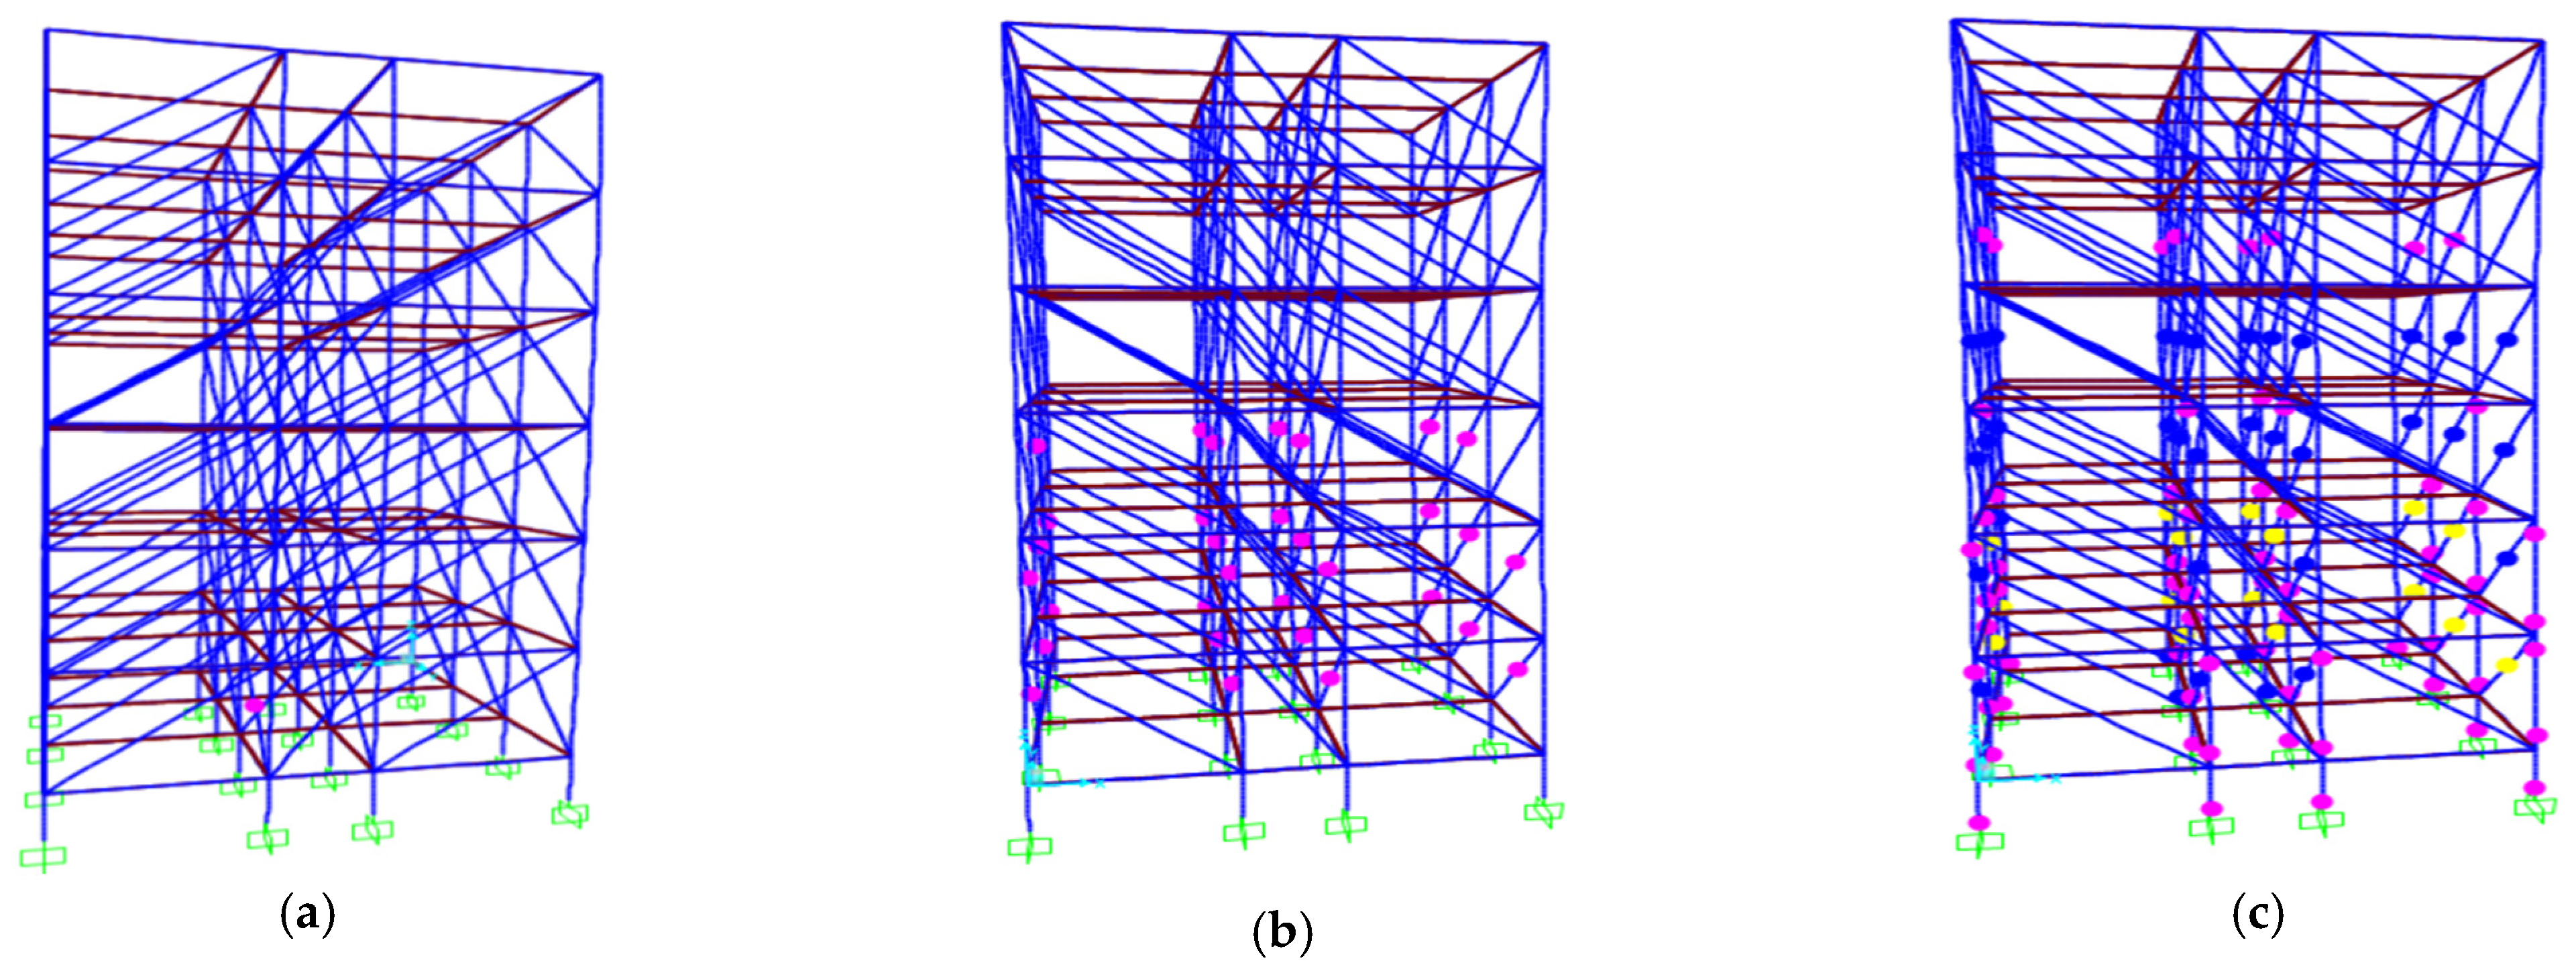
- At the DBE performance point, short columns in step-back buildings exhibit considerable damage, whereas intermediate columns in regular buildings show less damage. However, at the MCE performance point, severe damage is observed in both step-back building types, regardless of infill presence.
- The uphill side of step-back buildings experiences greater bending moments than three-storey regular buildings due to higher slopes and short columns. Step-back buildings without infill have higher bending moments compared to those with infill, as infill adds stiffness. However, the bending moments on the downhill side of step-back and six-storey regular buildings were less clear due to their configuration.
- Time history analysis reveals that the uphill displacement in step-back buildings is greater than in three-storey regular buildings, but less from the downhill side compared to six-storey regular buildings. Step-back buildings without infill show greater displacement than those with infill, highlighting the stiffness added by infill walls.
- Storey drift ratio analysis indicates that step-back buildings without infill have higher drift ratios than those with infill. The first storey on the uphill side and the fourth storey on the downhill side of step-back buildings are particularly vulnerable to seismic activity, suggesting severe damage on the uphill side.
- The results, while informative, are based on several assumptions and idealizations, such as neglecting foundation and soil–structure interaction effects. Further refined studies, incorporating non-linear dynamic analysis with real ground motion data and considering foundation modelling with soil–structure interaction, are necessary for more accurate assessments.
Author Contributions
Funding
Data Availability Statement
Conflicts of Interest
Abbreviations
| ASCE | American Society of Civil Engineering |
| ATC | Applied Technology Council |
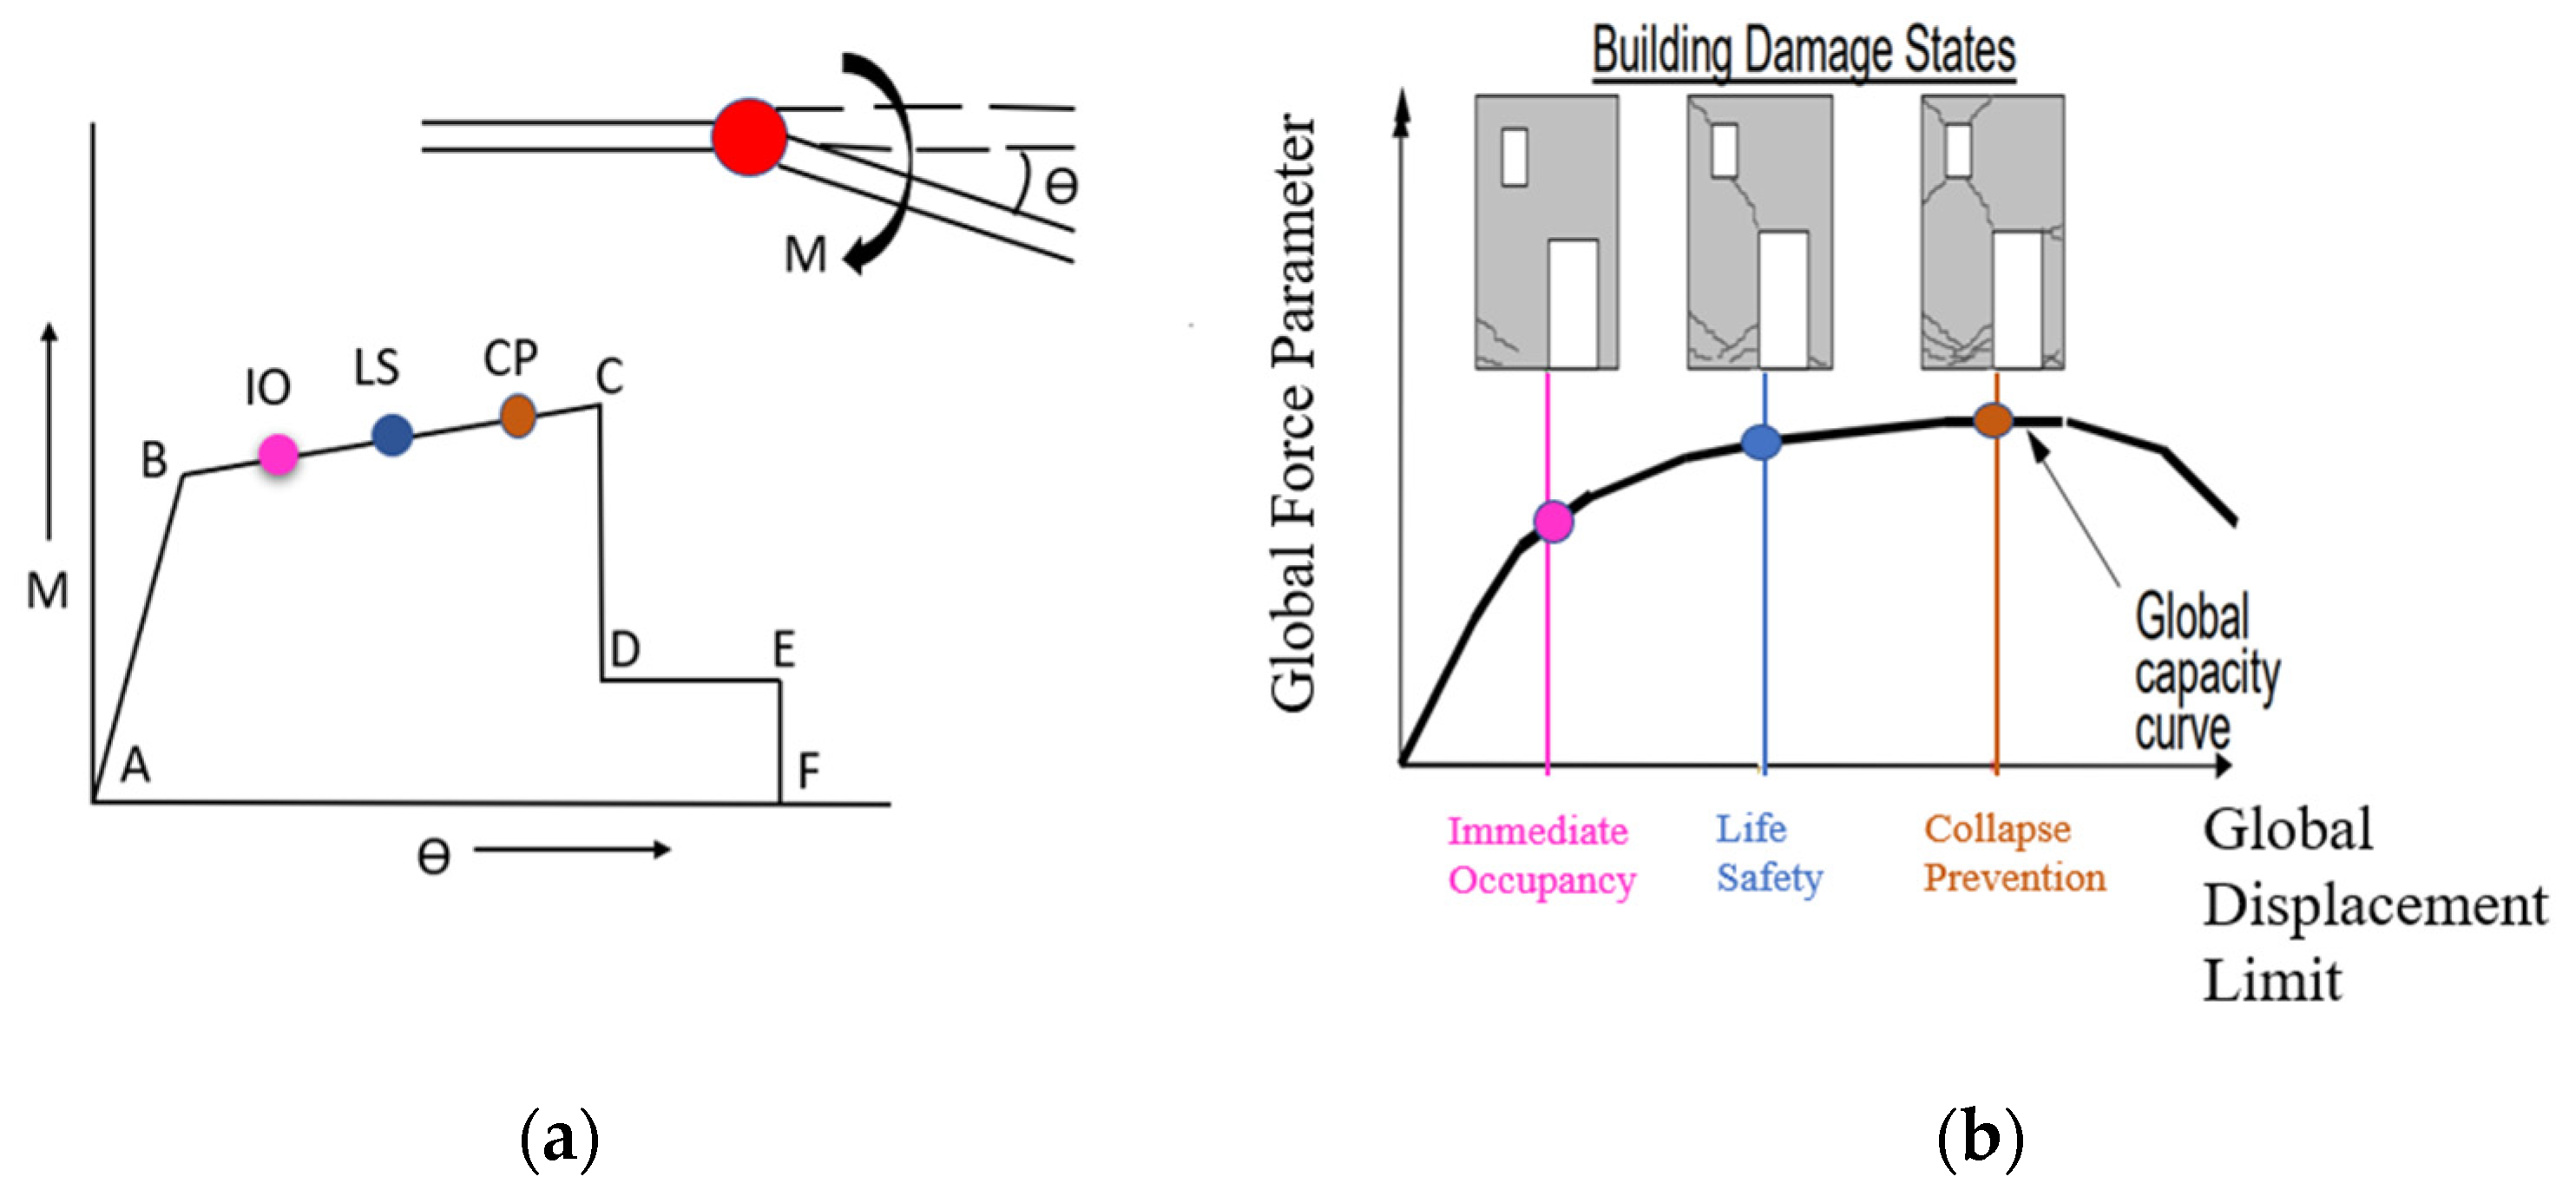
| CP | Collapse prevention |
| DBE | Design Basis Earthquake |
| FEMA | Federal Emergency Management Agency |
| IO | Immediate occupancy |
| IN | Infill |
| IC | Intermediate column |
| IS | Indian Standard |
| LS | Life safety |
| MCE | Maximum Considered Earthquake |
| Mw | Moment magnitude |
| NLTHA | Non-linear time history analysis |
| OC | Outer column |
| PGA | Peak ground acceleration |
| PP | Performance point |
| RC | Reinforced concrete |
| SAP | Structural analysis program |
| SB | Step-back building |
| SBIN | Step-back building with infill |
| SC | Short column |
| S.F. | Scale factor |
| URM | Un-reinforced masonry |
| 3D | Three-dimensional |
| 3SR | Three-storey regular building |
| 3SRIN | Three-storey regular building with infill |
| 6SR | Six-storey regular building |
| 6SRIN | Six-storey regular building with infill |
Notation
| Width of the diagonal strut | |
| Width | |
| Depth | |
| Diameter of the longitudinal reinforcement | |
| Modulus of elasticity of masonry prism | |
| Excepted modulus of elasticity of infill material | |
| Excepted modulus of elasticity of frame | |
| Compressive strength of brick | |
| Compressive strength of masonry prism | |
| Compressive strength of mortar | |
| Yield strength of longitudinal steel | |
| Column height between centre lines of beams | |
| Height of infill panel | |
| Moment of inertia of column | |
| L | Length |
| Length of infill panel | |
| Plastic hinge length | |
| Diagonal length of the infill panel | |
| Thickness of infill panel | |
| Coefficient to determine the equivalent width of the infill strut |
References
- Halder, L.; Chandra Dutta, S.; Sharma, R.P.; Bhattacharya, S. Lessons Learnt from Post-Earthquake Damage Study of Northeast India and Nepal during Last Ten Years: 2021 Assam Earthquake, 2020 Mizoram Earthquake, 2017 Ambasa Earthquake, 2016 Manipur Earthquake, 2015 Nepal Earthquake, and 2011 Sikkim Earthquake. Soil Dyn. Earthq. Eng. 2021, 151, 106990. [Google Scholar] [CrossRef]
- Surana, M.; Singh, Y.; Lang, D.H. Fragility Analysis of Hillside Buildings Designed for Modern Seismic Design Codes. Struct. Des. Tall Spec. Build. 2018, 27, e1500. [Google Scholar] [CrossRef]
- Surana, M.; Meslem, A.; Singh, Y.; Lang, D.H. Analytical Evaluation of Damage Probability Matrices for Hill-Side RC Buildings Using Different Seismic Intensity Measures. Eng. Struct. 2020, 207, 110254. [Google Scholar] [CrossRef]
- Singh, Y.; Yeluguri, V.R.; Lang, D.H. Seismic response of hill buildings subjected to bi-directional excitation. In Proceedings of the 10th US National Conference on Earthquake Engineering, Anchorage, Alaska, 21–25 July 2014. [Google Scholar]
- Dizhur, D.; Dhakal, R.P.; Bothara, J.; Ingham, J.M. Building Typologies and Failure Modes Observed in the 2015 Gorkha (Nepal) Earthquake. Bull. N. Z. Soc. Earthq. Eng. 2016, 49, 211–232. [Google Scholar] [CrossRef]
- Singh, Y.; Gade, P.; Lang, D.; Erduran, E. Seismic Behavior of Buildings Located on Slopes—An Analytical Study and Some Observations from Sikkim Earthquake of 18 September 2011. Available online: https://www.iitk.ac.in/nicee/wcee/article/WCEE2012_4201.pdf (accessed on 8 April 2020).
- Kumar, S. A simplified method for elastic seismic analysis of hill buildings. J. Earthq. Eng. 1998, 2, 241. [Google Scholar] [CrossRef]
- CSI. SAP2000 V. 8, 2002. Integrated Finite Element Analysis and Design of Structures Basic Analysis Reference Manual; Computers and Structures, Inc.: Berkeley, CA, USA, 2010. [Google Scholar]
- Birajdar, B.; Nalawade, S. Seismic Analysis of Buildings Resting on Sloping Ground. Available online: https://www.iitk.ac.in/nicee/wcee/article/13_1472.pdf (accessed on 1 January 2004).
- Available online: https://www.mapsofindia.com (accessed on 1 January 2022).
- Liu, L.; Li, Y.; Zheng, N.; Xie, Q. Seismic Response of Stepped Building Supported by Stepped Foundation on Hillside, Cunxiong Wu; 2017. Available online: https://www.wcee.nicee.org/wcee/article/16WCEE/WCEE2017-2150.pdf (accessed on 12 December 2023).
- Kumar, A. Impact of Building Regulations on Indian Hill Towns. HBRC J. 2016, 12, 316–326. [Google Scholar] [CrossRef]
- Surana, M.; Singh, Y.; Lang, D.H. Seismic Characterization and Vulnerability of Building Stock in Hilly Regions. Nat. Hazards Rev. 2018, 19, 04017024. [Google Scholar] [CrossRef]
- Raj, D.; Singh, Y.; Kaynia, A.M. Seismic Fragility Analysis of Coupled Building-Slope Systems. Earthq. Eng. Struct. Dyn. 2023, 53, 116–137. [Google Scholar] [CrossRef]
- Farghaly, A.A. Evaluation of seismic performance of buildings constructed on hillside slope of Doronka village-Egypt. Int. Sch. Res. Not. 2014, 2014, 1–13. [Google Scholar] [CrossRef]
- Welsh-Huggins, S.J. Seismic Vulnerability of Hillside Buildings in Northeast India. Ph.D. Thesis, University of Colorado at Boulder, Boulder, CO, USA, 2016. [Google Scholar]
- Surana, M.; Singh, Y.; Lang, D.H. Effect of Irregular Structural Configuration on Floor Acceleration Demand in Hill-Side Buildings. Earthq. Eng. Struct. Dyn. 2018, 47, 2032–2054. [Google Scholar] [CrossRef]
- Kumar, A. Review of Building Regulations for Safety against Hazards in Indian Hill Towns. J. Urban Manag. 2018, 7, 97–110. [Google Scholar] [CrossRef]
- Murty, C.V.R.; Raghukanth, S.T.G.; Menon, A.; Goswami, R.; Vijayanarayanan, A.R.; Gandhi, S.R.; Satyanarayana, K.N. The Mw 6.9 Sikkim-Nepal Border Earthquake of 18 September 2011. In EERI Newsletter, EERI Special Earthquake Report; Earthquake Engineering Research Institute: Oakland, CA, USA, 2012; pp. 1–14. [Google Scholar]
- IS-1893-2016 (Part-1); Criteria for Earthquake Resistant Design of Structure. Bureau of Indian Standards: New Delh, India, 2016.
- Gupta, S.; Chandra, P.G. A review on short column seismic Behavior and Their prevention on sloping ground. J. Civ. Eng. Environ. Technol. 2016, 3, 6. [Google Scholar]
- Murty, C.V.R. Why Are Short Columns More Damaged during Earthquakes? Indian Institute of Technology Kanpur: Kanpur, India, 2004. [Google Scholar]
- Işık, E.; Ulutaş, H.; Harirchian, E.; Avcil, F.; Aksoylu, C.; Arslan, M.H. Performance-Based Assessment of RC Building with Short Columns due to the Different Design Principles. Buildings 2023, 13, 750. [Google Scholar] [CrossRef]
- Jarapala, R.; Menon, A. Seismic Performance of Reinforced Concrete Buildings on Hill Slopes: A Review. J. Inst. Eng. (India) Ser. A 2023, 104, 721–745. [Google Scholar] [CrossRef]
- IS-13920-1993; Practice for Ductile Detailing of Reinforced Concrete Structures. Bureau of Indian Standards: New Delh, India, 1993.
- Mohammad, Z. Effect of Un-reinforced Masonry Infills on Seismic Performance of Hill Buildings. VW Appl. Sci. 2019, 1, 37–47. [Google Scholar] [CrossRef]
- Kaushik, H.B.; Durgesh, C.R.; Sudhir, K.J. Stress-strain characteristics of clay brick masonry under uniaxial comparison. J. Mater. Civ. Eng. 2007, 19, 728–739. [Google Scholar] [CrossRef]
- Usta, P.; Özge, O.; Özgür, B. Effect of masonry infill walls on the nonlinear response of reinforced concrete structure: October 30, 2020 İzmir earthquake case. Eng. Fail. Anal. 2023, 146, 107081. [Google Scholar] [CrossRef]
- Guettala, S.; Abdesselam, I.; Chebili, R.; Guettala, S. Assessment of the Effects of Infill Walls’ Layout in Plan and/or Elevation on the Seismic Performance of 3D Reinforced Concrete Structures. Asian J. Civ. Eng. 2023, 1–17. [Google Scholar] [CrossRef]
- Aggarwal, Y.; Saha, S.K. Seismic Performance Assessment of Reinforced Concrete Hilly Buildings with Open Story. Structures 2021, 34, 224–238. [Google Scholar] [CrossRef]
- Balun, B. The Influence of Ground Motion Duration on the Energy Based Assessment of Buildings with Infill Walls. Structures 2023, 49, 765–778. [Google Scholar] [CrossRef]
- IS-456:2000; Plain and Reinforced Concrete-Code of Practice Bureau of Indian Standards. Bureau of Indian Standards: New Delhi, India, 2000.
- Seismic Rehabilitation of Existing Buildings; American Society of Civil Engineers: Reston, VA, USA, 2007. [CrossRef]
- IS-1077:1992; Common Burnt Clay Building Bricks Specifications, BIS. Bureau of Indian Standards: New Delhi, India, 1992.
- Mander, J.B.; Michael, J.N.P.; Park, R. Theoretical stress-strain model for confined concrete. J. Struct. Eng. 1988, 114, 1804–1826. [Google Scholar] [CrossRef]
- FEMA-356; American Society of Civil Engineers. Seismic Evaluation of Existing Buildings; American Society of Civil Engineers: Reston, VA, USA, 2003. [Google Scholar] [CrossRef]
- Choudhury, T.; Kaushik, H.B. Seismic Fragility of Open Ground Storey RC Frames with Wall Openings for Vulnerability Assessment. Eng. Struct. 2018, 155, 345–357. [Google Scholar] [CrossRef]
- Seismic Evaluation and Retrofit of Concrete Buildings (ATC-40); ATC (Applied Technology Council): Redwood, CA, USA, 1996.
- Ghosh, B.; Pappin, J.; Arup, M.; Kong, H.; Arup, K. Dubai. Seismic Hazard Assessment in India. Available online: https://www.iitk.ac.in/nicee/wcee/article/WCEE2012_2107.pdf (accessed on 1 January 2017).
- Morales-González, M.; Vidot-Vega, A.L. Seismic Response of Reinforced Concrete Frames at Different Damage Levels. Int. J. Adv. Struct. Eng. 2017, 9, 63–77. [Google Scholar] [CrossRef]
- Skolnik, D.A.; Wallace, J.W. Critical Assessment of Interstory Drift Measurements. J. Struct. Eng. 2010, 136, 1574–1584. [Google Scholar] [CrossRef]


| Category | Latitude | Region |
|---|---|---|
| I | N | Southern region of India (Kerala, Tamil Nadu, etc.) |
| II | Maharashtra | |
| III | Eastern part of India | |
| IV | Northern part |
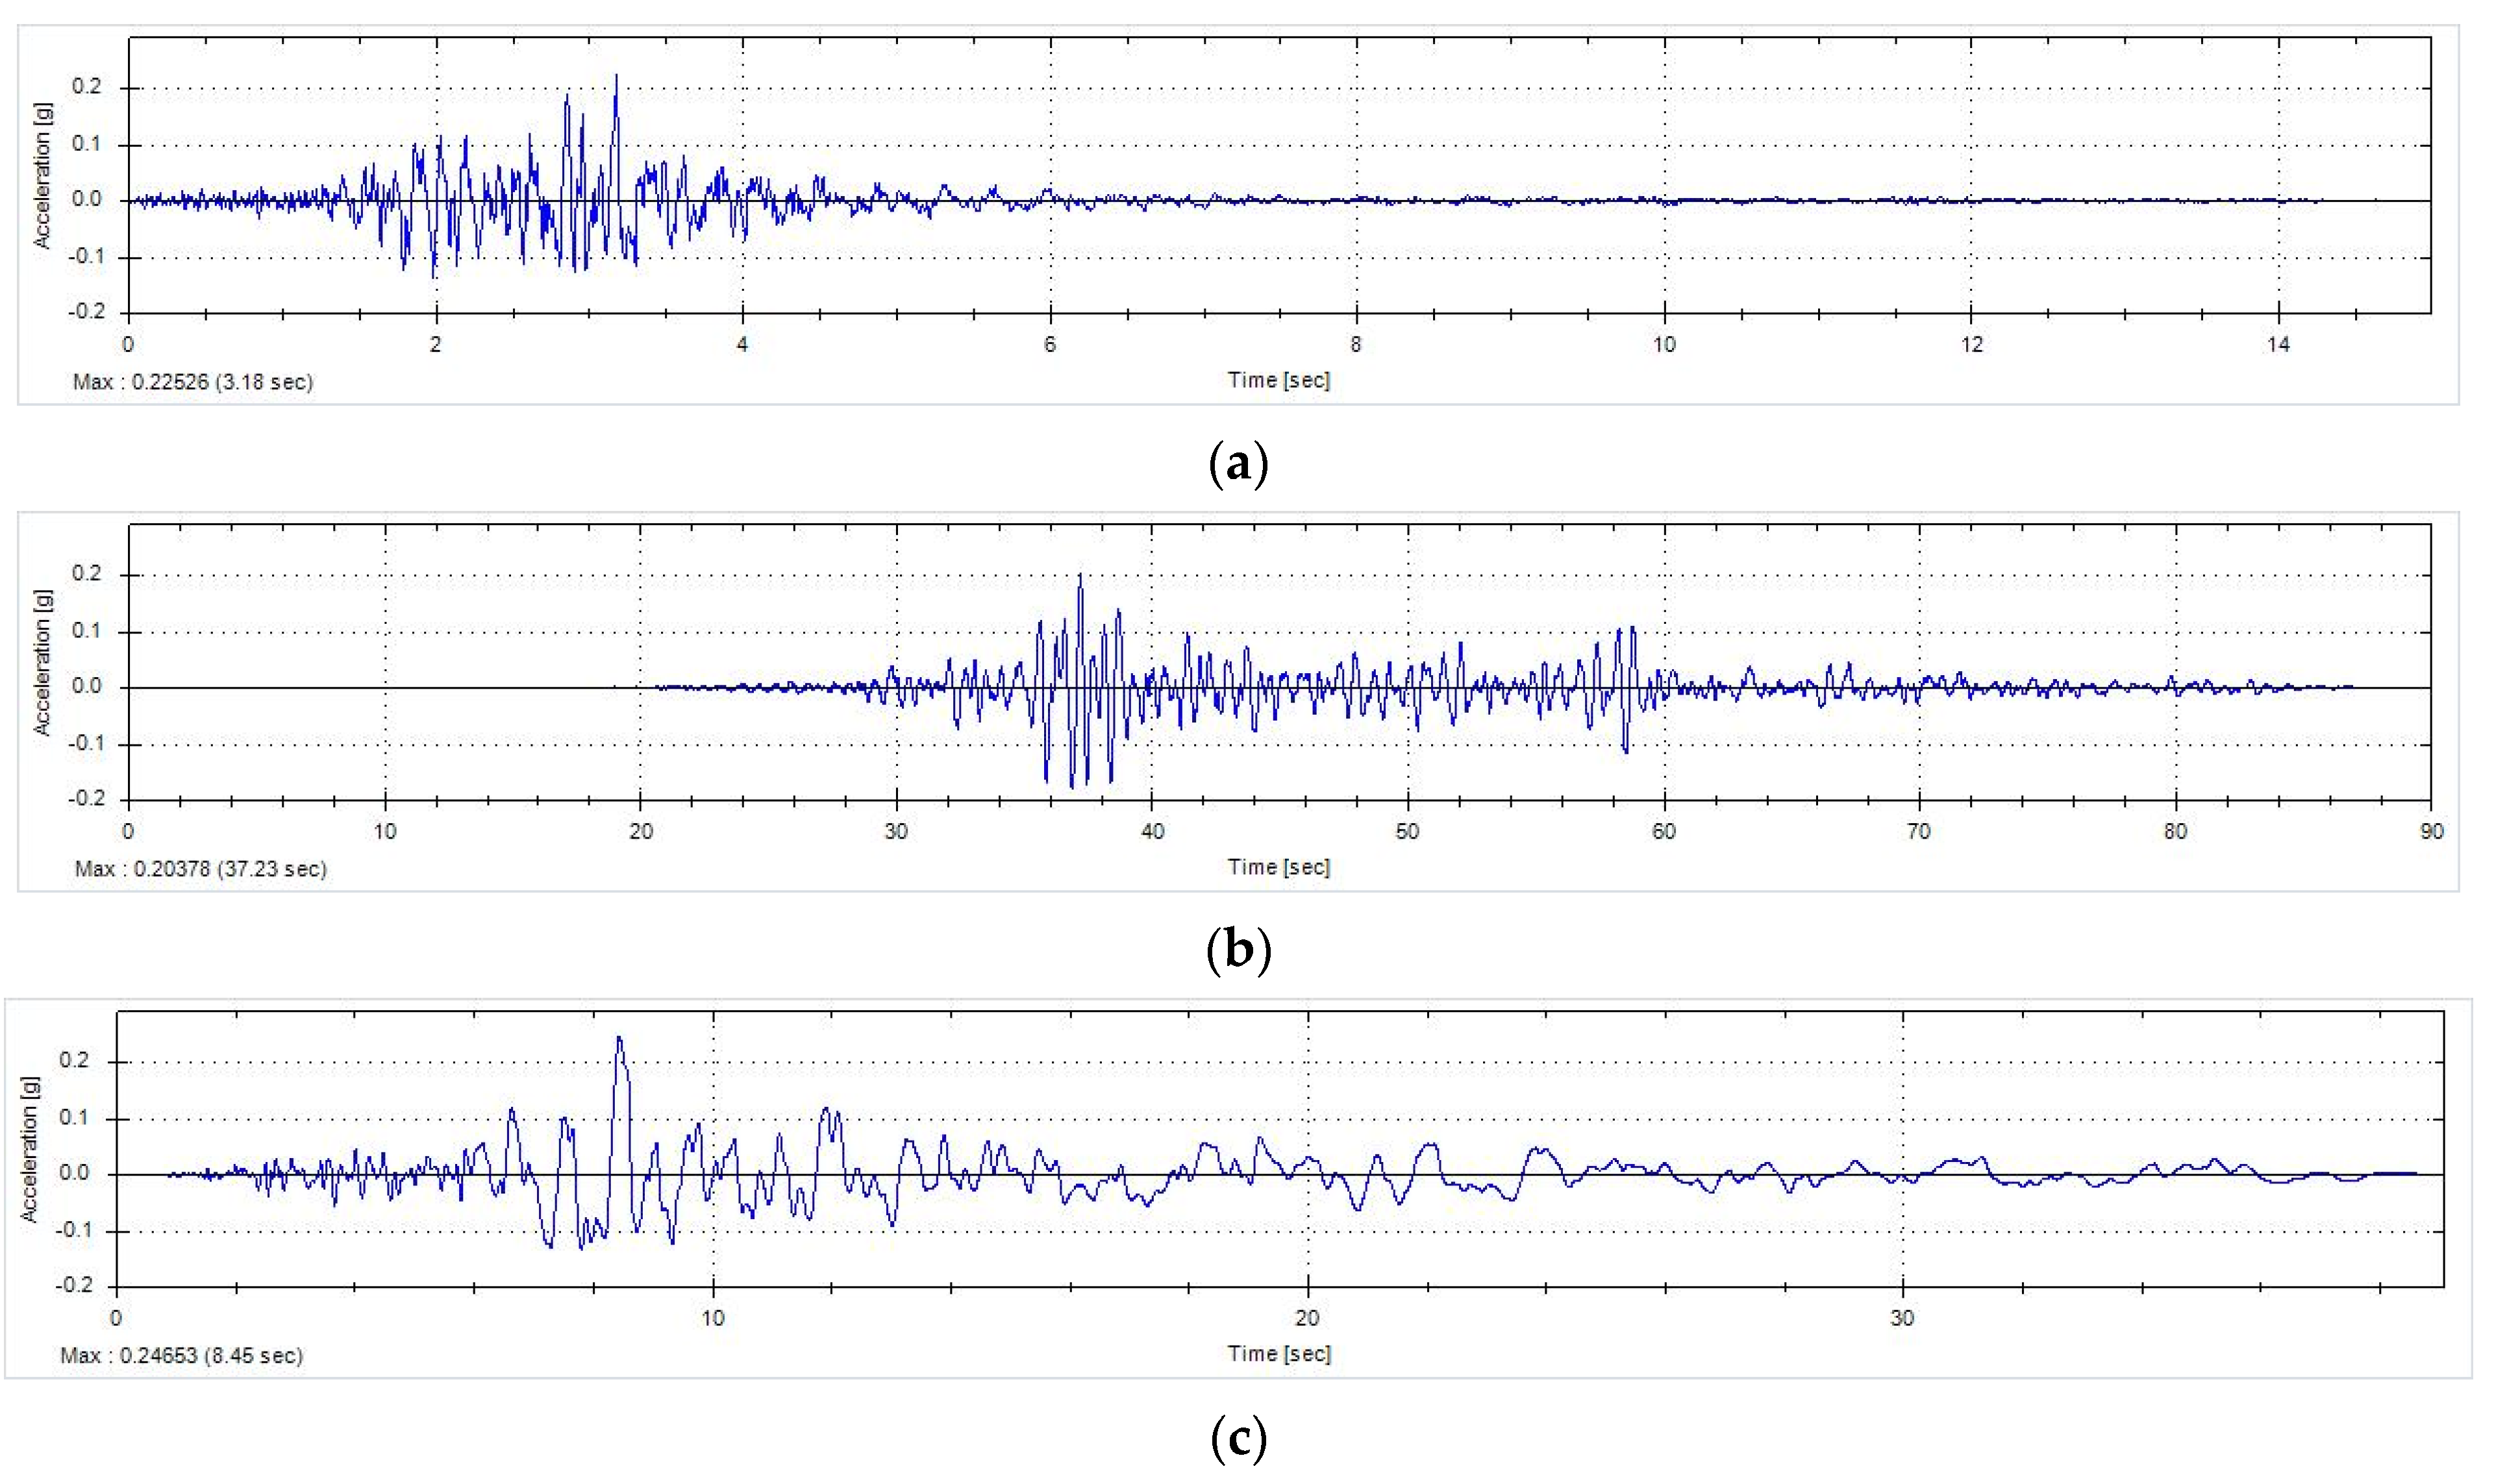
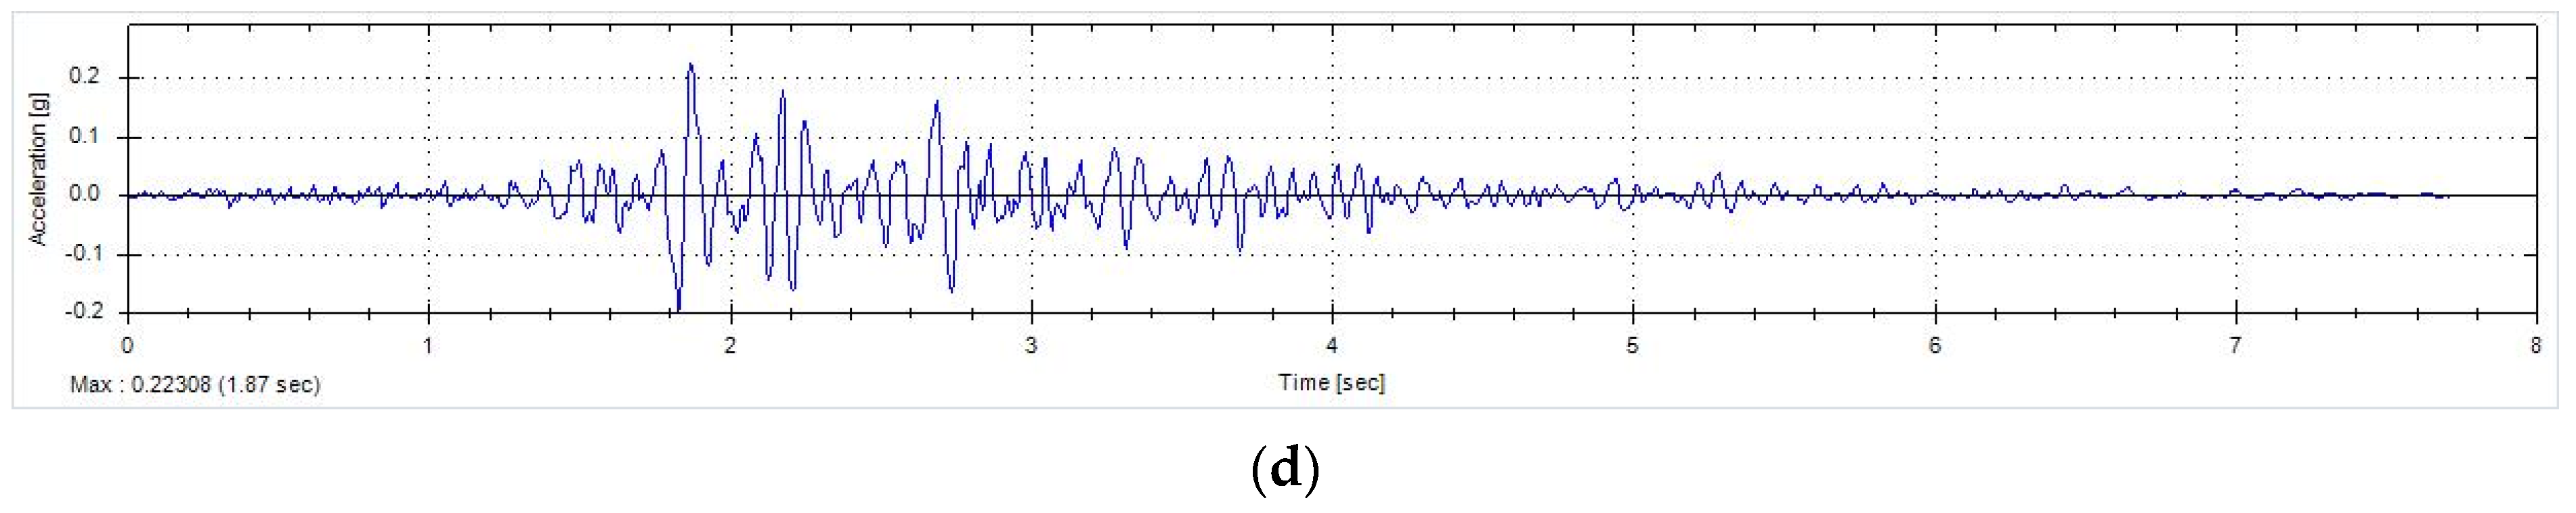
| S.No. | Earthquake | Date | Magnitude in Richter Scale (Mw) | PGA | S.F. (0.18 g) | S.F. (0.36 g) |
|---|---|---|---|---|---|---|
| 1 | Big Bear | 28 June 1992 | 6.5 | 0.223 | 7.918 | 15.836 |
| 2 | Chi-Chi | 20 September 1999 | 7.7 | 0.202 | 8.702 | 17.405 |
| 3 | Loma Prieta | 18 October 1989 | 6.9 | 0.246 | 7.163 | 14.326 |
| 4 | North Ridge | 17 January 1994 | 6.7 | 0.223 | 7.918 | 15.836 |
| (a) | |||||||||||
| Hinge States | |||||||||||
| Step | Displacement (m) | Base Force (kN) | A to B | B to IO | IO to LS | LS to CP | CP to C | C to D | D to E | ˃E | Total Hinges |
| 0 | 3.37 × 10⁻⁶ | 0 | 428 | 0 | 0 | 0 | 0 | 0 | 0 | 0 | 428 |
| 1 | 0.016508 | 274.949 | 427 | 1 | 0 | 0 | 0 | 0 | 0 | 0 | 428 |
| 2 | 0.058643 (Performance point of DBE) | 887.488 | 416 | 6 | 5 | 1 | 0 | 0 | 0 | 0 | 428 |
| 3 | 0.100257 | 1252.256 | 378 | 28 | 20 | 2 | 0 | 0 | 0 | 0 | 428 |
| 4 | 0.129842 (Performance point of MCE) | 1400.401 | 351 | 31 | 39 | 4 | 0 | 3 | 0 | 0 | 428 |
| 5 | 0.156239 | 1462.477 | 331 | 34 | 50 | 5 | 0 | 8 | 0 | 0 | 428 |
| 6 | 0.19024 | 1502.974 | 325 | 23 | 59 | 8 | 0 | 13 | 0 | 0 | 428 |
| 7 | 0.197378 | 1507.177 | 323 | 21 | 54 | 10 | 0 | 20 | 0 | 0 | 428 |
| 8 | 0.198634 | 1507.298 | 320 | 21 | 53 | 13 | 0 | 21 | 0 | 0 | 428 |
| 9 | 0.199333 | 1507.296 | 316 | 21 | 52 | 17 | 0 | 22 | 0 | 0 | 428 |
| 10 | 0.200246 | 1507.517 | 313 | 21 | 50 | 19 | 1 | 24 | 0 | 0 | 428 |
| (b) | |||||||||||
| Hinge States | |||||||||||
| Step | Displacement (m) | Base Force (kN) | A to B | B to IO | IO to LS | LS to CP | CP to C | C to D | D to E | ˃E | Total Hinges |
| 0 | 0.001531 | 0 | 428 | 0 | 0 | 0 | 0 | 0 | 0 | 0 | 428 |
| 1 | 0.024014 | 337.8 | 426 | 2 | 0 | 0 | 0 | 0 | 0 | 0 | 428 |
| 2 | 0.065258 (Performance point of DBE) | 802.381 | 413 | 10 | 4 | 1 | 0 | 0 | 0 | 0 | 428 |
| 3 | 0.101836 | 1030.954 | 374 | 36 | 16 | 2 | 0 | 0 | 0 | 0 | 428 |
| 4 | 0.123451 (Performance point of MCE) | 1095.505 | 361 | 32 | 28 | 3 | 0 | 4 | 0 | 0 | 428 |
| 5 | 0.14109 | 1111.587 | 355 | 24 | 40 | 5 | 0 | 4 | 0 | 0 | 428 |
| 6 | 0.162517 | 1137.976 | 349 | 28 | 40 | 7 | 0 | 4 | 0 | 0 | 428 |
| 7 | 0.178234 | 1148.085 | 345 | 24 | 42 | 11 | 0 | 6 | 0 | 0 | 428 |
| 8 | 0.179581 | 1150.331 | 345 | 24 | 40 | 11 | 0 | 8 | 0 | 0 | 428 |
| 9 | 0.179585 | 1147.076 | 343 | 24 | 40 | 13 | 0 | 8 | 0 | 0 | 428 |
| 10 | 0.180562 | 1150.155 | 340 | 24 | 38 | 15 | 1 | 10 | 0 | 0 | 428 |
| (a) | |||||||||||
| Hinge States | |||||||||||
| Step | Displacement (m) | Base Force (kN) | A to B | B to IO | IO to LS | LS to CP | CP to C | C to D | D to E | ˃E | Total Hinges |
| 0 | −0.00051 | 0 | 530 | 0 | 0 | 0 | 0 | 0 | 0 | 0 | 530 |
| 1 | 0.007504 | 481.395 | 529 | 1 | 0 | 0 | 0 | 0 | 0 | 0 | 530 |
| 2 | 0.023899 (Performance point of DBE) | 1308.51 | 509 | 19 | 2 | 0 | 0 | 0 | 0 | 0 | 530 |
| 3 | 0.043738 | 1683.536 | 480 | 15 | 34 | 1 | 0 | 0 | 0 | 0 | 530 |
| 4 | 0.051811 | 1778.421 | 466 | 23 | 39 | 2 | 0 | 0 | 0 | 0 | 530 |
| 5 | 0.052207 | 1780.829 | 466 | 23 | 38 | 2 | 0 | 1 | 0 | 0 | 530 |
| 6 | 0.064809 (Performance point of MCE) | 1901.52 | 451 | 33 | 40 | 3 | 0 | 3 | 0 | 0 | 530 |
| 7 | 0.070087 | 1938.692 | 444 | 36 | 41 | 3 | 0 | 6 | 0 | 0 | 530 |
| 8 | 0.07514 | 1967.581 | 441 | 38 | 38 | 5 | 0 | 8 | 0 | 0 | 530 |
| 9 | 0.075977 | 1970.606 | 441 | 38 | 38 | 5 | 0 | 8 | 0 | 0 | 530 |
| 10 | 0.075977 | 1970.61 | 441 | 38 | 38 | 4 | 0 | 9 | 0 | 0 | 530 |
| (b) | |||||||||||
| Hinge States | |||||||||||
| Step | Displacement (m) | Base Force (kN) | A to B | B to IO | IO to LS | LS to CP | CP to C | C to D | D to E | ˃E | Total Hinges |
| 0 | 0.001113 | 0 | 530 | 0 | 0 | 0 | 0 | 0 | 0 | 0 | 530 |
| 1 | 0.008974 | 393.359 | 529 | 1 | 0 | 0 | 0 | 0 | 0 | 0 | 530 |
| 2 | 0.021334 (Performance point of DBE) | 838.81 | 518 | 8 | 4 | 0 | 0 | 0 | 0 | 0 | 530 |
| 3 | 0.039607 | 1173.391 | 494 | 24 | 12 | 0 | 0 | 0 | 0 | 0 | 530 |
| 4 | 0.046294 | 1237.276 | 486 | 25 | 18 | 1 | 0 | 0 | 0 | 0 | 530 |
| 5 | 0.056676 | 1207.96 | 486 | 16 | 25 | 2 | 0 | 1 | 0 | 0 | 530 |
| 6 | 0.06901 | 1348.26 | 480 | 16 | 26 | 2 | 0 | 6 | 0 | 0 | 530 |
| 7 | 0.072464 | 1354.072 | 479 | 8 | 30 | 3 | 0 | 10 | 0 | 0 | 530 |
| 8 | 0.084239 | 1397.814 | 471 | 11 | 32 | 4 | 0 | 12 | 0 | 0 | 530 |
| 9 | 0.089828 (Performance point of MCE) | 1404.564 | 454 | 12 | 30 | 20 | 0 | 14 | 0 | 0 | 530 |
| 10 | 0.094566 | 1404.501 | 451 | 10 | 32 | 22 | 0 | 15 | 0 | 0 | 530 |
| (a) | |||||||||||
| Hinge States | |||||||||||
| Step | Displacement (m) | Base Force (kN) | A to B | B to IO | IO to LS | LS to CP | CP to C | C to D | D to E | ˃E | Total Hinges |
| 0 | 3.29 × 10⁻⁶ | 0 | 320 | 0 | 0 | 0 | 0 | 0 | 0 | 0 | 320 |
| 1 | 0.040803 | 500.151 | 320 | 0 | 0 | 0 | 0 | 0 | 0 | 0 | 320 |
| 2 | 0.056657 (Performance point of DBE) | 694.491 | 318 | 2 | 0 | 0 | 0 | 0 | 0 | 0 | 320 |
| 3 | 0.092746 | 998.665 | 286 | 18 | 16 | 0 | 0 | 0 | 0 | 0 | 320 |
| 4 | 0.100759 (Performance point of MCE) | 1036.97 | 272 | 32 | 16 | 0 | 0 | 0 | 0 | 0 | 320 |
| 5 | 0.150091 | 1149.05 | 258 | 14 | 48 | 0 | 0 | 0 | 0 | 0 | 320 |
| 6 | 0.164534 | 1176.15 | 244 | 28 | 48 | 0 | 0 | 0 | 0 | 0 | 320 |
| 7 | 0.186342 | 1193.17 | 242 | 22 | 48 | 0 | 0 | 8 | 0 | 0 | 320 |
| 8 | 0.188357 | 1194.2 | 242 | 22 | 46 | 0 | 0 | 10 | 0 | 0 | 320 |
| 9 | 0.193378 | 1195.16 | 242 | 22 | 42 | 0 | 0 | 14 | 0 | 0 | 320 |
| 10 | 0.213778 | 1183.07 | 242 | 22 | 32 | 0 | 0 | 24 | 0 | 0 | 320 |
| (b) | |||||||||||
| Hinge States | |||||||||||
| Step | Displacement (m) | Base Force (kN) | A to B | B to IO | IO to LS | LS to CP | CP to C | C to D | D to E | ˃E | Total Hinges |
| 0 | 7.69 × 10⁻⁷ | 0 | 320 | 0 | 0 | 0 | 0 | 0 | 0 | 0 | 320 |
| 1 | 0.040801 | 381.97 | 320 | 0 | 0 | 0 | 0 | 0 | 0 | 0 | 320 |
| 2 | 0.05749 | 538.22 | 316 | 4 | 0 | 0 | 0 | 0 | 0 | 0 | 320 |
| 3 | 0.065447 | 593.82 | 288 | 32 | 0 | 0 | 0 | 0 | 0 | 0 | 320 |
| 4 | 0.069831 (Performance point of DBE) | 612.19 | 280 | 40 | 0 | 0 | 0 | 0 | 0 | 0 | 320 |
| 5 | 0.084261 | 650.68 | 270 | 34 | 16 | 0 | 0 | 0 | 0 | 0 | 320 |
| 6 | 0.091297 (Performance point of MCE) | 658.12 | 264 | 32 | 24 | 0 | 0 | 0 | 0 | 0 | 320 |
| 7 | 0.132097 | 680.98 | 264 | 14 | 42 | 0 | 0 | 0 | 0 | 0 | 320 |
| 8 | 0.145848 | 691.13 | 264 | 8 | 34 | 0 | 0 | 14 | 0 | 0 | 320 |
| 9 | 0.149734 | 692.75 | 264 | 8 | 28 | 0 | 0 | 20 | 0 | 0 | 320 |
| 10 | 0.15458 | 693.61 | 264 | 8 | 26 | 0 | 0 | 22 | 0 | 0 | 320 |
| (a) | |||||||||||
| Hinge States | |||||||||||
| Step | Displacement (m) | Base Force (kN) | A to B | B to IO | IO to LS | LS to CP | CP to C | C to D | D to E | ˃E | Total Hinges |
| 0 | −0.00043 | 0 | 392 | 0 | 0 | 0 | 0 | 0 | 0 | 0 | 392 |
| 1 | 0.020552 (Performance point of DBE) | 1088.78 | 390 | 2 | 0 | 0 | 0 | 0 | 0 | 0 | 392 |
| 2 | 0.027718 | 1300.22 | 368 | 21 | 3 | 0 | 0 | 0 | 0 | 0 | 392 |
| 3 | 0.062047 (Performance point of MCE) | 1845.2 | 337 | 31 | 16 | 4 | 0 | 4 | 0 | 0 | 392 |
| 4 | 0.066487 | 1881.17 | 324 | 44 | 16 | 0 | 0 | 8 | 0 | 0 | 392 |
| 5 | 0.068366 | 1891.19 | 320 | 48 | 16 | 0 | 0 | 8 | 0 | 0 | 392 |
| 6 | 0.077247 | 1922.23 | 318 | 42 | 12 | 8 | 0 | 12 | 0 | 0 | 392 |
| 7 | 0.080617 | 1927.64 | 312 | 48 | 12 | 8 | 0 | 12 | 0 | 0 | 392 |
| 8 | 0.084141 | 1925.69 | 308 | 46 | 18 | 8 | 0 | 12 | 0 | 0 | 392 |
| 9 | 0.085712 | 1910.66 | 308 | 40 | 24 | 8 | 0 | 12 | 0 | 0 | 392 |
| 10 | 0.085981 | 1909.41 | 308 | 38 | 26 | 8 | 0 | 12 | 0 | 0 | 392 |
| (b) | |||||||||||
| Hinge States | |||||||||||
| Step | Displacement (m) | Base Force (kN) | A to B | B to IO | IO to LS | LS to CP | CP to C | C to D | D to E | ˃E | Total Hinges |
| 0 | −0.0005 | 0 | 392 | 0 | 0 | 0 | 0 | 0 | 0 | 0 | 392 |
| 1 | 0.019838 | 964.4 | 388 | 4 | 0 | 0 | 0 | 0 | 0 | 0 | 392 |
| 2 | 0.027304 (Performance point of DBE) | 1157.2 | 369 | 23 | 0 | 0 | 0 | 0 | 0 | 0 | 392 |
| 3 | 0.057731 | 1601.9 | 328 | 40 | 24 | 0 | 0 | 0 | 0 | 0 | 392 |
| 4 | 0.063953 | 1653.3 | 326 | 48 | 18 | 0 | 0 | 0 | 0 | 0 | 392 |
| 5 | 0.064059 (Performance point of MCE) | 1653.7 | 323 | 48 | 17 | 0 | 0 | 4 | 0 | 0 | 392 |
| 6 | 0.064076 | 1653.9 | 324 | 48 | 16 | 0 | 0 | 4 | 0 | 0 | 392 |
| 7 | 0.064846 | 1656.5 | 314 | 48 | 14 | 0 | 0 | 6 | 0 | 0 | 392 |
| 8 | 0.065964 | 1658.5 | 320 | 48 | 12 | 0 | 0 | 10 | 0 | 0 | 392 |
| 9 | 0.06999 | 1656.1 | 320 | 52 | 12 | 0 | 0 | 14 | 0 | 0 | 392 |
| 10 | 0.06999 | 1656.1 | 312 | 52 | 12 | 0 | 0 | 16 | 0 | 0 | 392 |
| (a) | |||||||||||
| Hinge States | |||||||||||
| Step | Displacement (m) | Base Force (kN) | A to B | B to IO | IO to LS | LS to CP | CP to C | C to D | D to E | ˃E | Total Hinges |
| 0 | 3.59 × 10⁻⁶ | 0 | 560 | 0 | 0 | 0 | 0 | 0 | 0 | 0 | 560 |
| 1 | 0.076804 | 470.729 | 560 | 0 | 0 | 0 | 0 | 0 | 0 | 0 | 560 |
| 2 | 0.122233 (Performance point of DBE) | 749.18 | 558 | 2 | 0 | 0 | 0 | 0 | 0 | 0 | 560 |
| 3 | 0.195619 | 1054.878 | 494 | 40 | 26 | 0 | 0 | 0 | 0 | 0 | 560 |
| 4 | 0.246328 (Performance point of MCE) | 1168.052 | 470 | 32 | 56 | 2 | 0 | 0 | 0 | 0 | 560 |
| 5 | 0.248913 | 1170.758 | 468 | 34 | 56 | 2 | 0 | 0 | 0 | 0 | 560 |
| 6 | 0.280812 | 1227.523 | 462 | 32 | 58 | 4 | 0 | 4 | 0 | 0 | 560 |
| 7 | 0.28179 | 1227.964 | 462 | 32 | 56 | 4 | 0 | 6 | 0 | 0 | 560 |
| 8 | 0.311089 | 1265.052 | 443 | 44 | 56 | 5 | 0 | 12 | 0 | 0 | 560 |
| 9 | 0.321085 | 1267.062 | 438 | 46 | 58 | 6 | 0 | 12 | 0 | 0 | 560 |
| 10 | 0.351806 | 1268.056 | 423 | 46 | 58 | 6 | 12 | 14 | 0 | 0 | 560 |
| (b) | |||||||||||
| Hinge States | |||||||||||
| Step | Displacement (m) | Base Force (kN) | A to B | B to IO | IO to LS | LS to CP | CP to C | C to D | D to E | ˃E | Total Hinges |
| 0 | 1.71 × 10⁻⁶ | 0 | 560 | 0 | 0 | 0 | 0 | 0 | 0 | 0 | 560 |
| 1 | 0.076802 | 450.902 | 560 | 0 | 0 | 0 | 0 | 0 | 0 | 0 | 560 |
| 2 | 0.13044 (Performance point of DBE) | 765.818 | 554 | 6 | 0 | 0 | 0 | 0 | 0 | 0 | 560 |
| 3 | 0.157411 | 866.985 | 496 | 64 | 0 | 0 | 0 | 0 | 0 | 0 | 560 |
| 4 | 0.224145 (Performance point of MCE) | 978.573 | 450 | 54 | 56 | 0 | 0 | 0 | 0 | 0 | 560 |
| 5 | 0.244898 | 997.111 | 432 | 58 | 64 | 0 | 0 | 6 | 0 | 0 | 560 |
| 6 | 0.255741 | 1002.232 | 430 | 56 | 62 | 0 | 0 | 12 | 0 | 0 | 560 |
| 7 | 0.25958 | 1003.365 | 430 | 54 | 64 | 0 | 0 | 12 | 0 | 0 | 560 |
| 8 | 0.26229 | 1004.669 | 430 | 52 | 64 | 0 | 0 | 14 | 0 | 0 | 560 |
| 9 | 0.264263 | 1005.151 | 430 | 52 | 62 | 0 | 0 | 16 | 0 | 0 | 560 |
| 10 | 0.269726 | 1005.653 | 430 | 52 | 58 | 0 | 0 | 20 | 0 | 0 | 560 |
| (a) | |||||||||||
| Hinge States | |||||||||||
| Step | Displacement (m) | Base Force (kN) | A to B | B to IO | IO to LS | LS to CP | CP to C | C to D | D to E | ˃E | Total Hinges |
| 0 | −0.00169 | 0 | 704 | 0 | 0 | 0 | 0 | 0 | 0 | 0 | 704 |
| 1 | 0.038483 | 1038.003 | 703 | 1 | 0 | 0 | 0 | 0 | 0 | 0 | 704 |
| 2 | 0.043069 (Performance point of DBE) | 1130.294 | 679 | 25 | 0 | 0 | 0 | 0 | 0 | 0 | 704 |
| 3 | 0.116699 (Performance point of MCE) | 1780.111 | 627 | 29 | 32 | 11 | 0 | 5 | 0 | 0 | 704 |
| 4 | 0.134013 | 1854.465 | 606 | 46 | 28 | 7 | 0 | 17 | 0 | 0 | 704 |
| 5 | 0.134326 | 1855.281 | 606 | 46 | 28 | 7 | 0 | 17 | 0 | 0 | 704 |
| 6 | 0.134407 | 1855.689 | 606 | 46 | 28 | 6 | 0 | 18 | 0 | 0 | 704 |
| 7 | 0.135023 | 1857.411 | 606 | 46 | 28 | 6 | 0 | 18 | 0 | 0 | 704 |
| 8 | 0.135038 | 1857.485 | 606 | 46 | 28 | 5 | 0 | 19 | 0 | 0 | 704 |
| 9 | 0.136646 | 1861.996 | 605 | 47 | 28 | 5 | 0 | 19 | 0 | 0 | 704 |
| 10 | 0.136695 | 1862.236 | 605 | 47 | 28 | 4 | 0 | 20 | 0 | 0 | 704 |
| (b) | |||||||||||
| Hinge States | |||||||||||
| Step | Displacement (m) | Base Force (kN) | A to B | B to IO | IO to LS | LS to CP | CP to C | C to D | D to E | ˃E | Total Hinges |
| 0 | −0.00193 | 0 | 704 | 0 | 0 | 0 | 0 | 0 | 0 | 0 | 704 |
| 1 | 0.036772 | 912.182 | 703 | 1 | 0 | 0 | 0 | 0 | 0 | 0 | 704 |
| 2 | 0.043345 (Performance point of DBE) | 1020.269 | 673 | 31 | 0 | 0 | 0 | 0 | 0 | 0 | 704 |
| 3 | 0.127187 | 1657.198 | 601 | 68 | 35 | 0 | 0 | 0 | 0 | 0 | 704 |
| 4 | 0.129456 | 1659.744 | 584 | 71 | 37 | 0 | 0 | 12 | 0 | 0 | 704 |
| 5 | 0.130397 (Performance point of MCE) | 1655.252 | 578 | 73 | 37 | 2 | 0 | 14 | 0 | 0 | 704 |
| 6 | 0.130452 | 1655.357 | 560 | 73 | 39 | 2 | 0 | 16 | 0 | 0 | 704 |
| 7 | 0.131011 | 1655.734 | 553 | 73 | 39 | 3 | 0 | 22 | 0 | 0 | 704 |
| 8 | 0.131696 | 1655.612 | 547 | 73 | 41 | 3 | 0 | 23 | 0 | 0 | 704 |
| 9 | 0.13335 | 1654.003 | 540 | 75 | 41 | 5 | 0 | 26 | 0 | 0 | 704 |
| 10 | 0.134342 | 1652.219 | 555 | 527 | 43 | 7 | 0 | 28 | 0 | 0 | 704 |
| Building Configuration | First Hinge | Performance Point of DBE | Performance Point of MCE | |||||||||
|---|---|---|---|---|---|---|---|---|---|---|---|---|
| SC | OC | IC | IN | SC | OC | IC | IN | SC | OC | IC | IN | |
| SB–X | √ | √ | √ | √ | √ | |||||||
| SB–Y | √ | √ | √ | √ | √ | √ | √ | |||||
| SBIN–X | √ | √ | √ | √ | √ | √ | ||||||
| SBIN–Y | √ | √ | √ | √ | ||||||||
| 3SR–X | √ | √ | √ | √ | √ | |||||||
| 3SR–Y | √ | √ | √ | √ | √ | |||||||
| 3SRIN–X | √ | √ | √ | √ | √ | |||||||
| 3SRIN–Y | √ | √ | √ | √ | √ | √ | ||||||
| 6SR–X | √ | √ | √ | √ | √ | |||||||
| 6SR–Y | √ | √ | √ | √ | √ | |||||||
| 6SRIN–X | √ | √ | √ | √ | ||||||||
| 6SRIN–Y | √ | √ | √ | √ | √ | √ | ||||||
| (a) | ||||
| X (0.18 g) | Y (0.18 g) | X (0.36 g) | Y (0.36 g) | |
| Big Bear | SB 3.59% greater than 3SR | SB 5.45% greater than 3SR | SB is 4.6% greater than 3SR | SB is 8.34% greater than 3SR |
| Chi-Chi | SB 5.97% greater than 3SR | SB 11.43% greater than 3SR | SB 14.09% greater than 3SR | SB 17.12% greater than 3SR |
| Loma Prieta | SB 3.17% greater than 3SR | SB 6.94% greater than 3SR | SB 3.28% greater than 3SR | SB 2.08% greater than 3SR |
| North Ridge | SB 12.12% greater than 3SR | SB 13.51% greater than 3SR | SB 5.8% greater than 3SR | SB 8.16% greater than 3SR |
| Mean of above-ground motions | SB 1.68% greater than 3SR | SB 8.8% greater than 3SR | SB 5.14% greater than 3SR | SB 8.43% greater than 3SR |
| (b) | ||||
| X (0.18 g) | Y (0.18 g) | X (0.36 g) | Y (0.36 g) | |
| Big Bear | SB 51.58% greater than SBIN | SB 44% greater than SBIN | SB 75.38% greater than SBIN | SB 53.08% greater than SBIN |
| Chi-Chi | SB 76.55% greater than SBIN | SB 57.57% greater than SBIN | SB 69.73% greater than SBIN | SB 47.6% greater than SBIN |
| Loma Prieta | SB 84.66% greater than SBIN | SB 72.67% greater than SBIN | SB 81.65% greater than SBIN | SB 63.34% greater than SBIN |
| North Ridge | SB 42.64% greater than SBIN | SB 14.33% greater than SBIN | SB 37% greater than SBIN | SB 24.37% greater than SBIN |
| Mean of above-ground motions | SB 70% greater than SBIN | SB 55% greater than SBIN | SB 83% greater than SBIN | SB 51% greater than SBIN |
| (c) | ||||
| X (0.18g) | Y (0.18g) | X (0.36g) | Y (0.36g) | |
| Big Bear | SB 12% greater than 6SR | 6SR 14.74% greater than SB | SB 6.59% greater than 6SR | 6SR 18% greater than SB |
| Chi-Chi | SB 30.41% greater than 6SR | SB 7.86% greater than 6SR | 6SR 3.42% greater than SB | 6SR 26.26% greater than SB |
| Loma Prieta | SB 4.14% greater than 6SR | 6SR 25.32% greater than SB | 6SR 10.83% greater than SB | 6SR 40.98% greater than SB |
| North Ridge | SB 9.32% greater than 6SR | Step-back 9.32% greater than 6SR | SB 8.48% greater than 6SR | SB 4.63% greater than 6SR |
| Mean of above-ground motions | SB 15% greater than 6SR | 6SR 11% greater than SB | 6SR 3% greater than SB | 6SR 27% greater than SB |
| (d) | ||||
| X (0.18 g) | Y (0.18 g) | X (0.36 g) | Y (0.36 g) | |
| Big Bear | SB 62.39% greater than SBIN | SB 40.98% greater than SBIN | SB 62.13% greater than SBIN | SB 53.04% greater than SBIN |
| Chi-Chi | SB 55.01% greater than SBIN | SB 57.56% greater than SBIN | SB 41.63% greater than SBIN | SB 47.57% greater than SBIN |
| Loma Prieta | SB 74.44% greater than SBIN | SB 73.21% greater than SBIN | SB 69.23% greater than SBIN | SB 61.27% greater than SBIN |
| North Ridge | SBIN 6.48% greater than SB | SB 14.33% greater than SBIN | SBIN 6.39% greater than SB | SB 23.23% greater than SBIN |
| Mean of above-ground motions | SB 58% greater than SBIN | SB 55% greater than SBIN | SB 51% greater than SBIN | SB 50% greater than SBIN |
| (a) | ||||
| X (0.18 g) | Y (0.18 g) | X (0.36 g) | Y (0.36 g) | |
| Big Bear | SB 2.58% greater than 3SR | 3SR 24.25% greater than SB | SB 2.28% greater than 3SR | SB 17.84% greater than 3SR |
| Chi-Chi | SB 3.01% greater than 3SR | SB 19.63% greater than 3SR | 3SR 12.33% greater than SB | 3SR 24% greater than SB |
| Loma Prieta | SB 13.25% greater than 3SR | SB 10.32% greater than 3SR | 3SR 14.22% greater than SB | 3SR 8.86% greater than SB |
| North Ridge | SB 34.92% greater than 3SR | 3SR 3% greater than SB | SB 12.46% greater than 3SR | 3SR 1.73% greater than SB |
| Mean | SB 15.11% greater than 3SR | SB 4.57% greater than 3SR | SB 9.29% greater than 3SR | SB 3.61% greater than 3SR |
| (b) | ||||
| X (0.18 g) | Y (0.18 g) | X (0.36 g) | Y (0.36 g) | |
| Big Bear | SB 57.22% greater than SBIN | SB 57.22% greater than SBIN | SB 74.9% greater than SBIN | SB 49.97% greater than SBIN |
| Chi-Chi | SB 80.73% greater than SBIN | SB 66.72% greater than SBIN | SB 67.80% greater than SBIN | SB 11.97% greater than SBIN |
| Loma Prieta | SB 87.22% greater than SBIN | SB 82.12% greater than SBIN | SB 86.08% greater than SBIN | SB 67.22% greater than SBIN |
| North Ridge | SB 52.4% greater than SBIN | SB 24.88% greater than SBIN | SB 70.65% greater than SBIN | SB 4.89% greater than SBIN |
| Mean | SB 74.75% greater than SBIN | SB 33% greater than SBIN | SB 70.65% greater than SBIN | SB 50.23% greater than SBIN |
| (c) | ||||
| X (0.18 g) | Y (0.18 g) | X (0.36 g) | Y (0.36 g) | |
| Big Bear | SB 52.35% greater than 6SR | SB 42.22% greater than 6SR | SB 51.7% greater than 6SR | SB 50.13% greater than 6SR |
| Chi-Chi | SB 72.30% greater than 6SR | SB 71.29% greater than 6SR | SB 57.59% greater than 6SR | SB 63.36% greater than 6SR |
| Loma Prieta | SB 62.51% greater than 6SR | SB 60.63% greater than 6SR | SB 53.97% greater than 6SR | SB 57.90% greater than 6SR |
| North Ridge | SB 74.28% greater than 6SR | SB 83.53% greater than 6SR | SB 73.14% greater than 6SR | SB 83.25% greater than 6SR |
| Mean | SB 79.17% greater than 6SR | SB 63.66% greater than 6SR | SB 56.33% greater than 6SR | SB 60.76% greater than 6SR |
| (d) | ||||
| X (0.18 g) | Y (0.18 g) | X (0.36 g) | Y (0.36 g) | |
| Big Bear | SB 72.96% greater than SBIN | SB 47.16% greater than SBIN | SB 73.32% greater than SBIN | SB 50.48% greater than SBIN |
| Chi-Chi | SB 68.04% greater than SBIN | SB 67.18% greater than SBIN | SB 48.54% greater than SBIN | SB 45.17% greater than SBIN |
| Loma Prieta | SB 84.14% greater than SBIN | SB 82.56% greater than SBIN | SB 78.89% greater than SBIN | SB 67.56% greater than SBIN |
| North Ridge | SB 14.49% greater than SBIN | SB 26.12% greater than SBIN | SB 16.47% greater than SBIN | SB 15.5% greater than SBIN |
| Mean | SB 71.64% greater than SBIN | SB 30.28% greater than SBIN | SB 59.41% greater than SBIN | SB 50.69% greater than SBIN |
Disclaimer/Publisher’s Note: The statements, opinions and data contained in all publications are solely those of the individual author(s) and contributor(s) and not of MDPI and/or the editor(s). MDPI and/or the editor(s) disclaim responsibility for any injury to people or property resulting from any ideas, methods, instructions or products referred to in the content. |
© 2023 by the authors. Licensee MDPI, Basel, Switzerland. This article is an open access article distributed under the terms and conditions of the Creative Commons Attribution (CC BY) license (https://creativecommons.org/licenses/by/4.0/).
Share and Cite
Rc, B.; Rani, V.; Suleiman, M.F.; Biradar, B.B.; Vyas, R.; Ahmad, A.; Shirkol, A.I. Seismic Performance Evaluation and Comparative Study of Reinforced Concrete Building on a Sloped Terrain with Regular Building by Considering the Effect of URM Infill Walls. Buildings 2024, 14, 33. https://doi.org/10.3390/buildings14010033
Rc B, Rani V, Suleiman MF, Biradar BB, Vyas R, Ahmad A, Shirkol AI. Seismic Performance Evaluation and Comparative Study of Reinforced Concrete Building on a Sloped Terrain with Regular Building by Considering the Effect of URM Infill Walls. Buildings. 2024; 14(1):33. https://doi.org/10.3390/buildings14010033
Chicago/Turabian StyleRc, Bush, Varsha Rani, Mohamed F. Suleiman, Bapugouda B. Biradar, Rohit Vyas, Afaq Ahmad, and Anoop I. Shirkol. 2024. "Seismic Performance Evaluation and Comparative Study of Reinforced Concrete Building on a Sloped Terrain with Regular Building by Considering the Effect of URM Infill Walls" Buildings 14, no. 1: 33. https://doi.org/10.3390/buildings14010033