Article

Exploration and Characterization of Dynamic Properties for Cultural Heritage Conservation: A Case Study for Historical Stone Masonry Buildings in Zanzibar

1
Graduate School of Engineering and Science, University of the Ryukyus, 1 Sembaru, Nakagami Gun, Nishihara Cho 903-0213, Okinawa Prefecture, Japan
2
Department of Architectural and Building Engineering, Faculty of Engineering, University of the Ryukyus, 1 Sembaru, Nakagami Gun, Nishihara Cho 903-0213, Okinawa Prefecture, Japan
*
Author to whom correspondence should be addressed.
Buildings 2024, 14(4), 981; https://doi.org/10.3390/buildings14040981
Submission received: 3 March 2024 / Revised: 20 March 2024 / Accepted: 27 March 2024 / Published: 2 April 2024

Abstract

:
Ancient civilizations have imprinted their legacy on Zanzibar Stone Town through the construction of revered stone masonry buildings, which are experiencing rapid deterioration due to severe ambient environmental impacts. In response to these challenges, this study presents a comprehensive field exploration through the ambient vibration test (AVT) and numerical prediction of historical stone masonry buildings in Zanzibar Stone Town to analyze the dynamic characteristics. The ambient vibration test (AVT) reveals structural dynamic properties in terms of peak resonance frequencies (fr(avg)), mode shape, and damping ratio, in conjunction with the development of correlation with the geometric parameters of the building. The results reveal fr(avg) ranges between 2.8 and 5.3 Hz for investigated structures, non-uniform deformed mode shapes, and damping ratio ranges between 1.35% and 4.45% at various orientation axes of the understudy buildings. However, the relationship between natural frequencies indicates a higher association with the geometrical parameters of the building, yielding a correlation coefficient (R2) between 0.85 and 0.99. Moreover, the numerical prediction via eigenvalue analysis (EVA) yields a considerable association with the investigated data, quantified by root mean square error (RMSE), mean absolute error (MAE) ranged between 0.29 and 0.3, with Nash–Sutcliffe efficiency (NSE) and R2 between 0.81 and 0.99, respectively. Furthermore, conservation work guidelines were also developed to assist the structural engineer and conservationist in adopting targeted conservation strategies for the efficient preservation of the historical integrity in Stone Town.

1. Introduction

Ancient construction holds immense significance pertaining to cultural, historical, and archeological importance, standing as a testament to the ingenuity of past civilizations and craftmanship at the global level. These classical landmarks imbued with cultural heritage, historical legacy, and architectural marvels yield tangible links to the collective identity of historical epochs. The ancient constructional artifacts are considered invaluable assets that contribute to tourism and foster a deep understanding of construction methodologies practiced throughout antiquity. However, over the temporal continuum, the dynamic ambient conditions and detrimental climatic patterns manifest persistent structural deterioration, damages, and even collapse, resulting in the loss of the ancient artifact’s original identity and historical values. These dynamic factors involve the unstoppable aging of construction materials, the impact of wear and tear, and evolving land use patterns that impart a dilapidated effect on the ancient structures. Therefore, the comprehensive dynamic characteristics of the structure become crucial for targeted preservation, informed restoration efforts, and enhanced disaster resilience to ensure the longevity of these historical edifices.
Despite technological advancements for the conservation of ancient archeological artifacts, the lack of physical examination persists in terms of lethargic investigations, periodic monitoring, and non-availability of structural health guidelines. This obstacle hampers the timely identification and mitigation of structural vulnerabilities, particularly evident in the case of historical stone construction. The Stone Town is situated on the western side of the Zanzibar archipelago and celebrated for its rich historical legacy rooted in Indian Ocean maritime trading activity over many centuries; however, it is subject to debate due to structural degradation over time. With unique architectural features, the locale has become the epicenter for tourist attraction and was declared a UNESCO World Heritage site in the year 2000 [1,2,3]. Traditionally, these structures are made of stone masonry blocks bonded with lime mortar and begin showing signs of decay owing to moisture and water ingress, freeze–thaw cycles, saline intrusion, extreme temperatures, and wind erosion, respectively. This necessitates a comprehensive ambient dynamic assessment to address the expedient and irreversible degradation of site structural components, mitigating the ongoing loss of traditional architecture.
In the past, the historical stone building in Stone Town experienced major disasters in the form of tropical cyclones, the Indian Ocean Tsunami in 2004, and extreme flooding in 2005, respectively, which inflicted multiple structural damages on the buildings. However, over the last 20 years, the United States Geological Survey (USGS) recorded several earthquakes within a 200 km circle radius centered around Stone Town [4,5,6]. Likewise, on 15 January 2005, a magnitude 5.0 tremor occurred 18 km north of Stone Town, inflicting damage on major buildings in terms of various crack openings and propagation, leading to material loss and even structural failures. For instance, the Friday Mosque at Forodhani collapsed due to a seismic event with an estimated magnitude between Mw 3 and Mw 5 [7,8]. These seismic events further exacerbated the fragility of traditional masonry structures, causing vulnerable joints and connections, which, in turn, led to accelerated deterioration, particularly under the influence of dynamic ambient conditions such as high traffic flow wind and other dynamic impacts. According to the Stone Town Conservation Office assessment, 50% of total houses have a fair condition, 30% have deteriorated, and 20% are in poor condition due to structural deformation and poor-quality intervention. In light of this, predicting dynamic responses based on ambient factors becomes crucial. This prediction can assist in the development of strategies for structural modification planning and optimization design with minimal intervention. Synthesizing the dynamic response influenced by ambient factors yields enhanced understanding and an effective plan for modifications to preserve archeological structure while minimizing the need for extensive interventions.
The operational modal analysis (OMA) becomes critical for the degrading historical structure to explore the dynamic characteristics, including the natural frequencies, damping ratio, and mode shapes, without the application of external forces. In this context, the identification of natural frequencies of the structure corresponds to the rate of alternation in stiffness, reflecting the vibrational properties, resonance, and motion characteristics at the intricate level of the structure [9,10,11,12,13,14,15]. For implementing new strategies, ambient vibration testing (AVT), a non-intrusive method that employs a non-destructive approach, relying on natural excitation sources, induces dynamic responses in the structure. It better captures the ambient conditions with considerable accuracy and precision, yielding the crucial modal parameters, such as natural frequencies, damping ratio, and mode shapes, from the recorded acceleration data.
The impact of environmental factors on modal properties is widely recognized. The research studies have shown that external conditions, such as temperature and noise, can result in significant discrepancies, with temperature having the most pronounced influence, as reported in several case studies [16,17]. In a study conducted by Luo et al. [18,19], the effects of temperature changes on the dynamic properties of bridge structures were investigated, with a focus on how these changes can affect the precision of vibration-based damage identification techniques.
Limited studies have been conducted on the deployment of AVT to evaluate structural behavior changes considering historic stone buildings [20,21,22,23]. For instance, a historic three-story unreinforced masonry house in Algiers (Algeria) was investigated through AVT and forced vibration testing to identify and analyze the seismic parameters. The resonant frequencies were explored via the forced vibration test to establish structural health assessment. Nevertheless, due to external influences, significant alterations in the traditional framework led to challenging measures to maintain, as the incorporation of substituted components and adjustments aggravated the established traditional hierarchy. However, there is a need for the development of comprehensive guidelines for informed conservation work [24].
To bridge the gap in terms of establishing the relationships between experimental investigations with simulation outcomes, a few studies were found in the literature to assess the dynamic response of traditional masonry structures. For instance, Gentile and Saisi (2007) deployed finite element analysis (FEA) to assess the ambient dynamic response of a 74 m tall bell tower built in the 16th century [20,25,26,27,28,29,30]. By integrating material properties in conjunction with geometry, slenderness ratio, and establishing boundary conditions to solve the equations of motion, the model was simulated under ambient environmental conditions. The results yielded asynchronous results compared to site-investigated data, particularly for areas of the tower with relatively low structural stiffness ratios bearing substantial damage. However, a significant gap persists in the literature in terms of validation and efficiency quantification in terms of key performance indices (KPIs). A similar investigation was carried out using ambient vibration experiments associated with FEA to investigate the dynamic parameters of brick masonry inverted bell-shaped temples in Chiangmai, Thailand. The excitation frequency computed using FEA demonstrates a robust correlation with natural frequency ranges assessed through experimental investigation. However, both findings revealed that the structure’s stiffness influences the fundamental frequency [31]. It is too pertinent to mention that no study has been conducted on parametric relationship development considering the dynamic characteristics of unexplored sites, i.e., Stone Town is currently undergoing rapid structural degradation.
The elevated frequency of past seismic events in the unexplored structural dynamic of Stone Town further aggravated the degradation rate at a rapid pace. This underscores the pertinent need to investigate the dynamic characteristics that could identify the seismic endurance potential and assess the associated rate of structural deformation. The natural frequencies, damping factors, and mode shape are indicators for vibrational characteristics that proportionally vary with the structural stiffness, rendering an instrumental correlation for seismic resilience and assisting in framing an effective strategy for risk mitigation guidelines for Stone Town’s archeological sites [32,33,34,35,36].
Considering the aforementioned discussion, the study investigated the dynamic characteristics of the vulnerable historical buildings of Zanzibar Stone Town through AVT, which include the exploration and identification of natural frequency, mode shapes, and damping ratio, respectively. Furthermore, this study encapsulates the development of the numerical model using FEM to compare the parameters with field data for further the quantification of accuracy in terms of KPIs. Moreover, structural health monitoring guidelines were established for future conservation and retrofitting works.

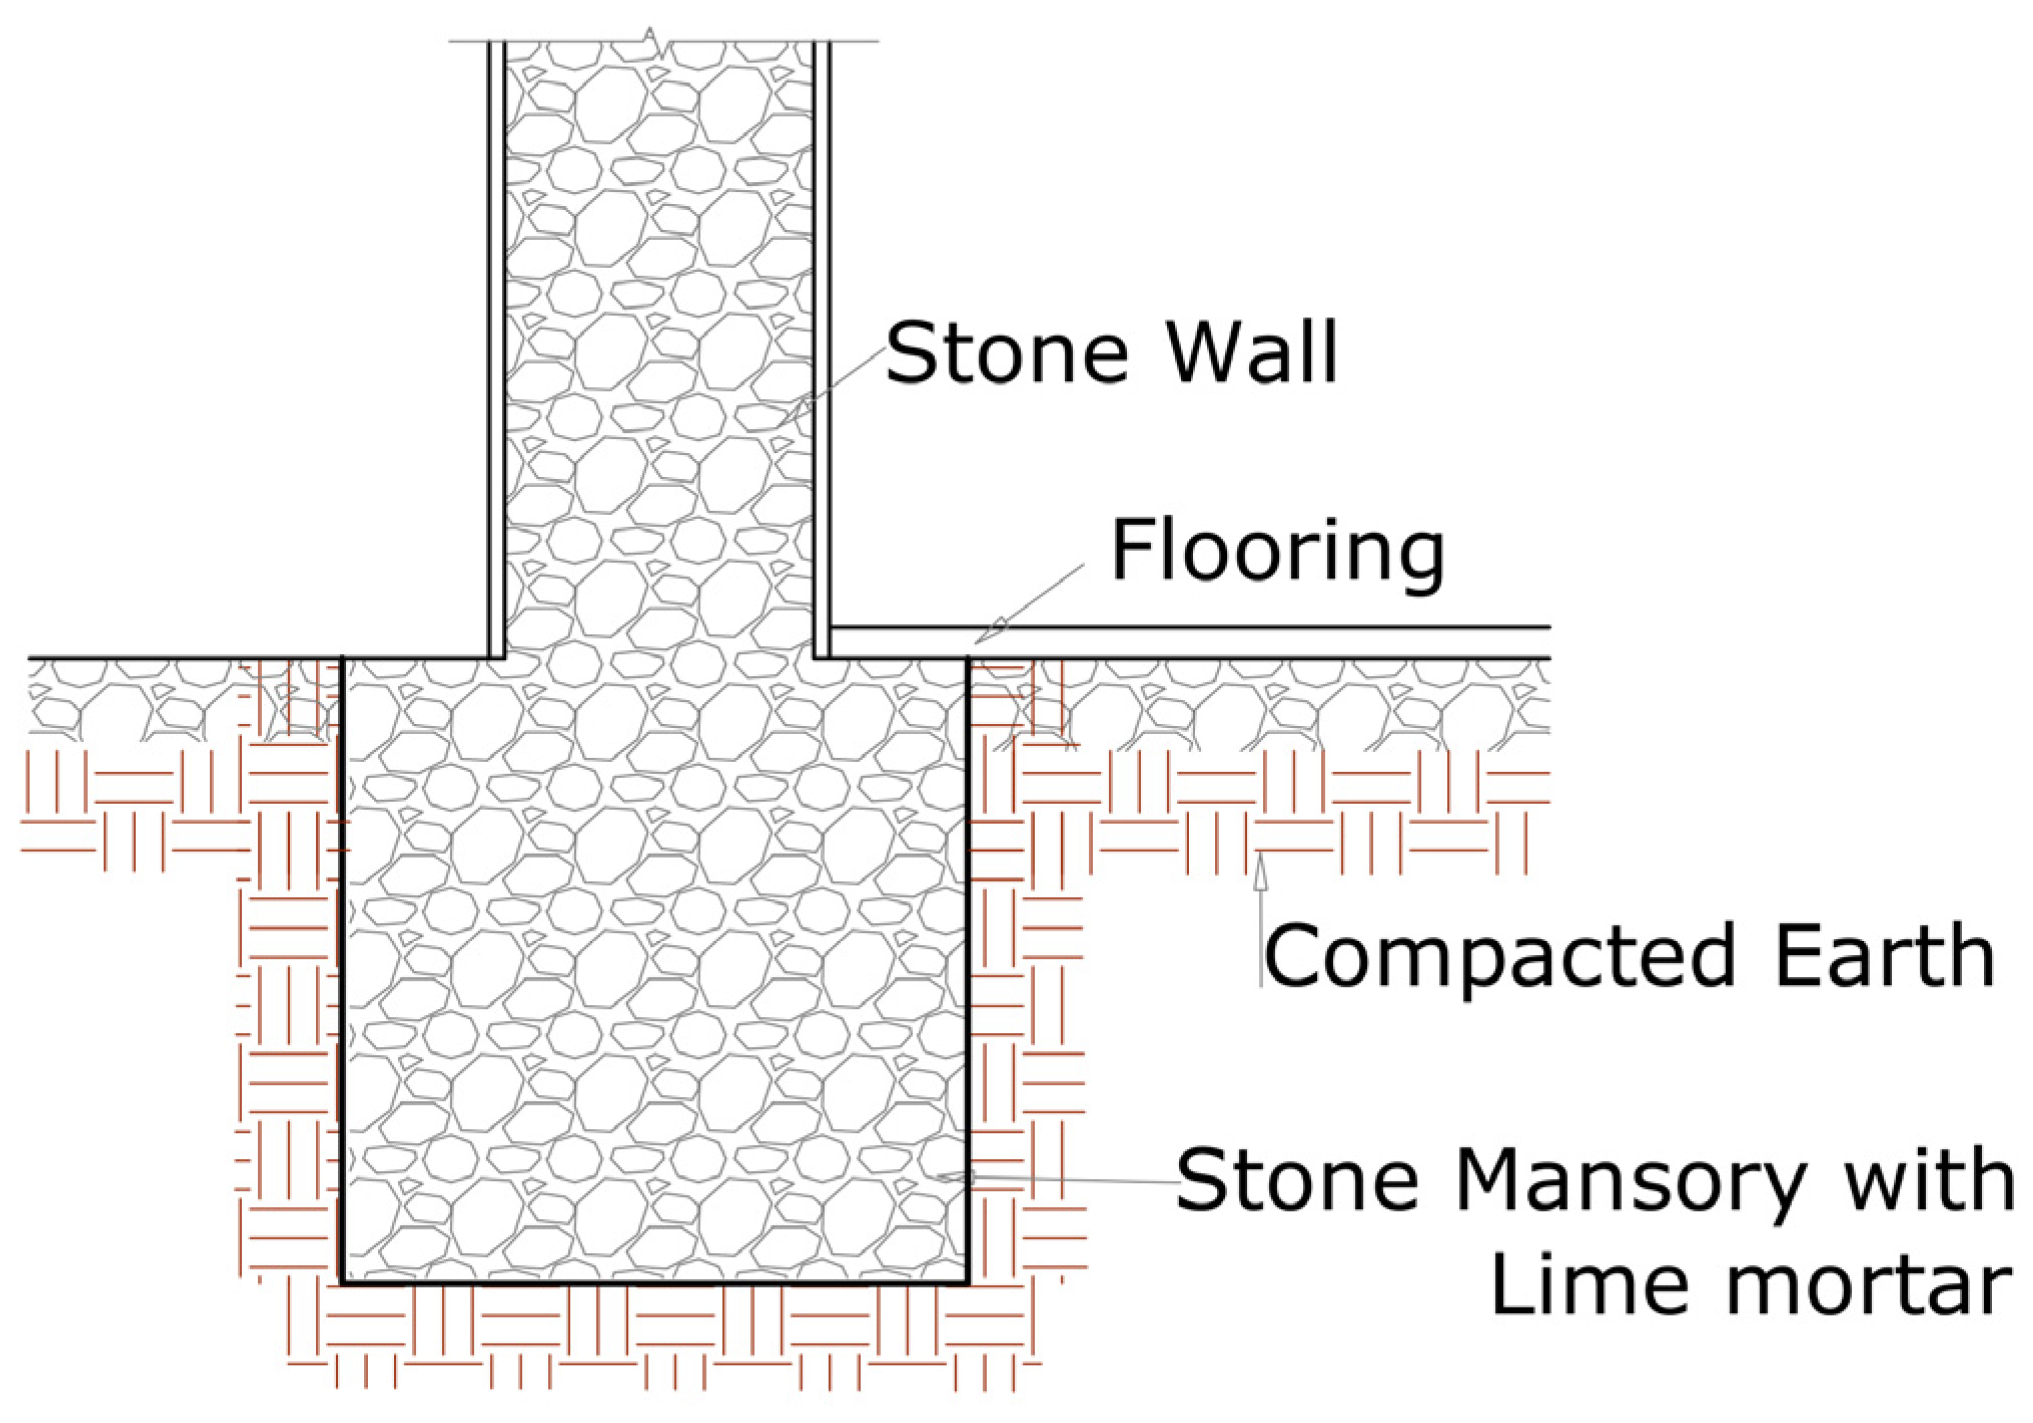
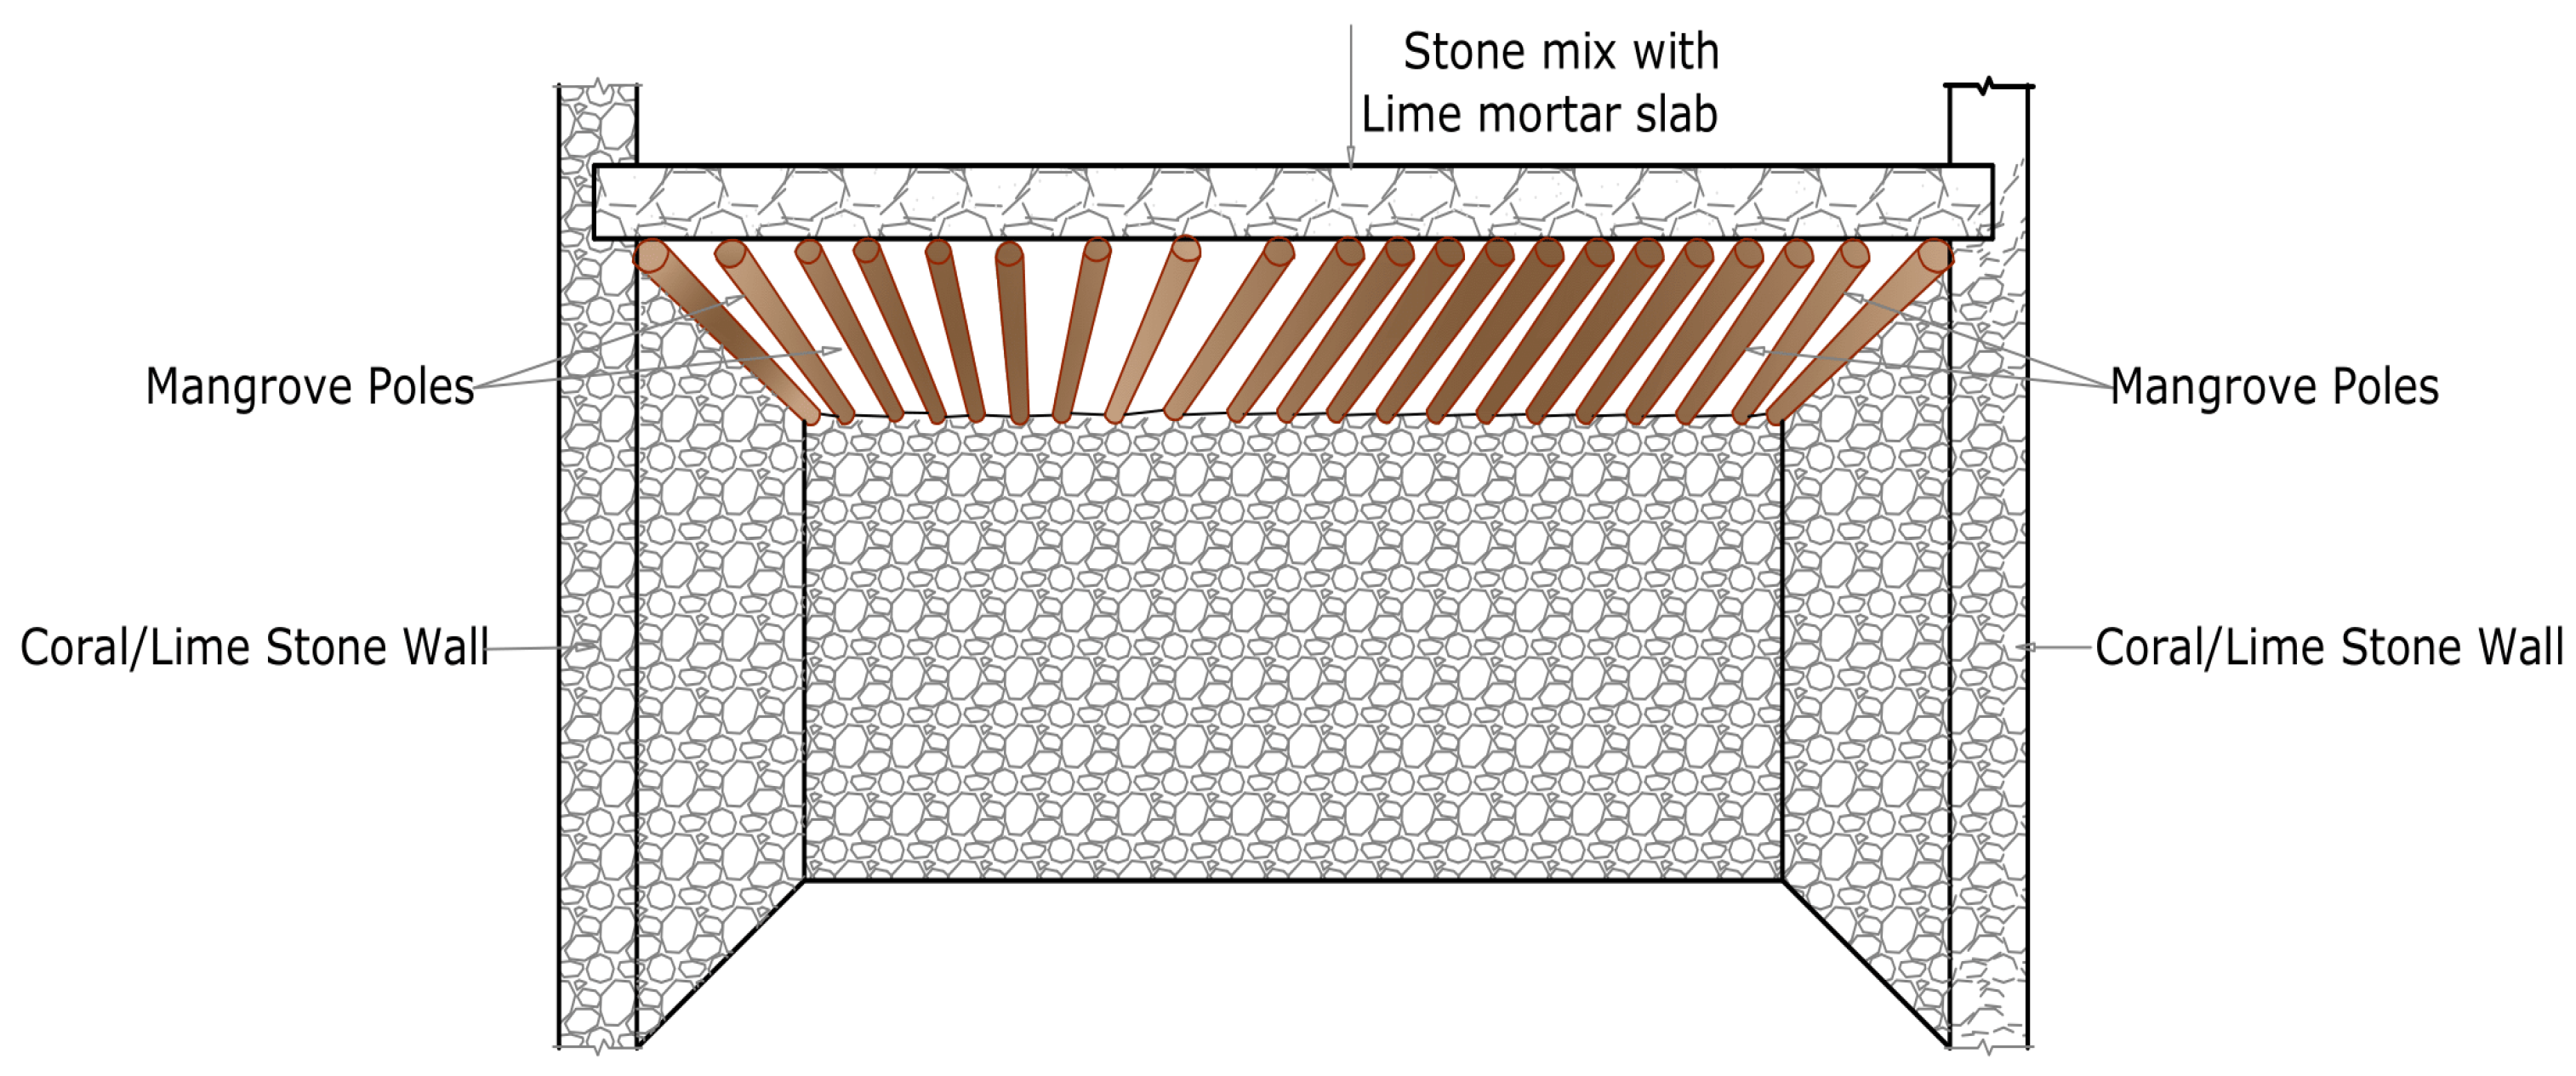
2. Structural Description of the Site

The construction material, layout patterns, foundation emplacement depths, joints and connections, and wall thickness exhibit consistent design across Stone Town. The buildings are a maximum of three stories high with floor heights ranging between 4 m and 6.5 m. The rubble masonry structural components are constituted of irregular shapes of stones, composed of corals and limestones, bounded with lime mortar joints, as illustrated in Figure 1. The continuous footing exhibits rectangular geometry typically laid at shallow layers, constructed with a matrix of comparatively large-sized lime stones and mortar positioned at a depth of approximately 0.5 m with lateral dimensions ranging between 0.65 to 1.50 m below the existing ground level (E.G.L), as delineated in Figure 2. The footing extends to the ground level with continuous geometrical dimensions set as a base for massive load-bearing walls measuring 0.50 to 1.00 m thickness at the outer and inner stone wall peripheries, indicating a moderate slenderness ratio (λ) ranging between 5 and 10. These lateral dimensions of the wall serve the structural purpose of capacitating a seamless transmission of superstructure load to the ground, rendering a higher degree of thermal insulation from extreme temperatures during adverse climatic impacts. The adjusted variation in wall thickness is noticeable at higher floor levels, which were purposefully engineered for efficient load bearing and transmission smooth transmission-generated stresses, accounting for varying load intensities across the different floor levels. The floor slabs are conventionally laid out with lime concrete and anchored by mangrove poles positioned at intervals of 0.30 to 0.40 m. These mangrove poles serve a dual purpose, functioning both as reinforcement for the slab’s soffit and providing support to maintain the upright position of the walls, as illustrated in Figure 3. The original design building included a flat slab roof that was later replaced with a pitched roof covered in corrugated iron sheets. These modifications were necessitated by the adverse effects of excessive water leakage, resulting in material deterioration, structural damage, and fungal growth [37].
The mechanical properties of stone and mortar were investigated by Makunza (2017), who reveals that the compressive strength of the utilized masonry stones and mortar varied between 8.5 and 10 N/mm2 and 0.65 and 0.95 N/mm2, with the density ranging between 1 and 1.2 kg/mm3 and 1.5 and 1.95 kg/mm3, respectively [4].

3. Description of the Residential Building

This study entails the exploration of the structural dynamic characteristics of four carefully selected stone masonry buildings in Zanzibar’s Stone Town based on the visually observed lower and higher degradation rates of these structures. The general description of the building plans, conservation state and geometrical details, and pictorials of all four buildings are illustrated in Table 1. Moreover, the details of the building selected as case studies are summarized below.

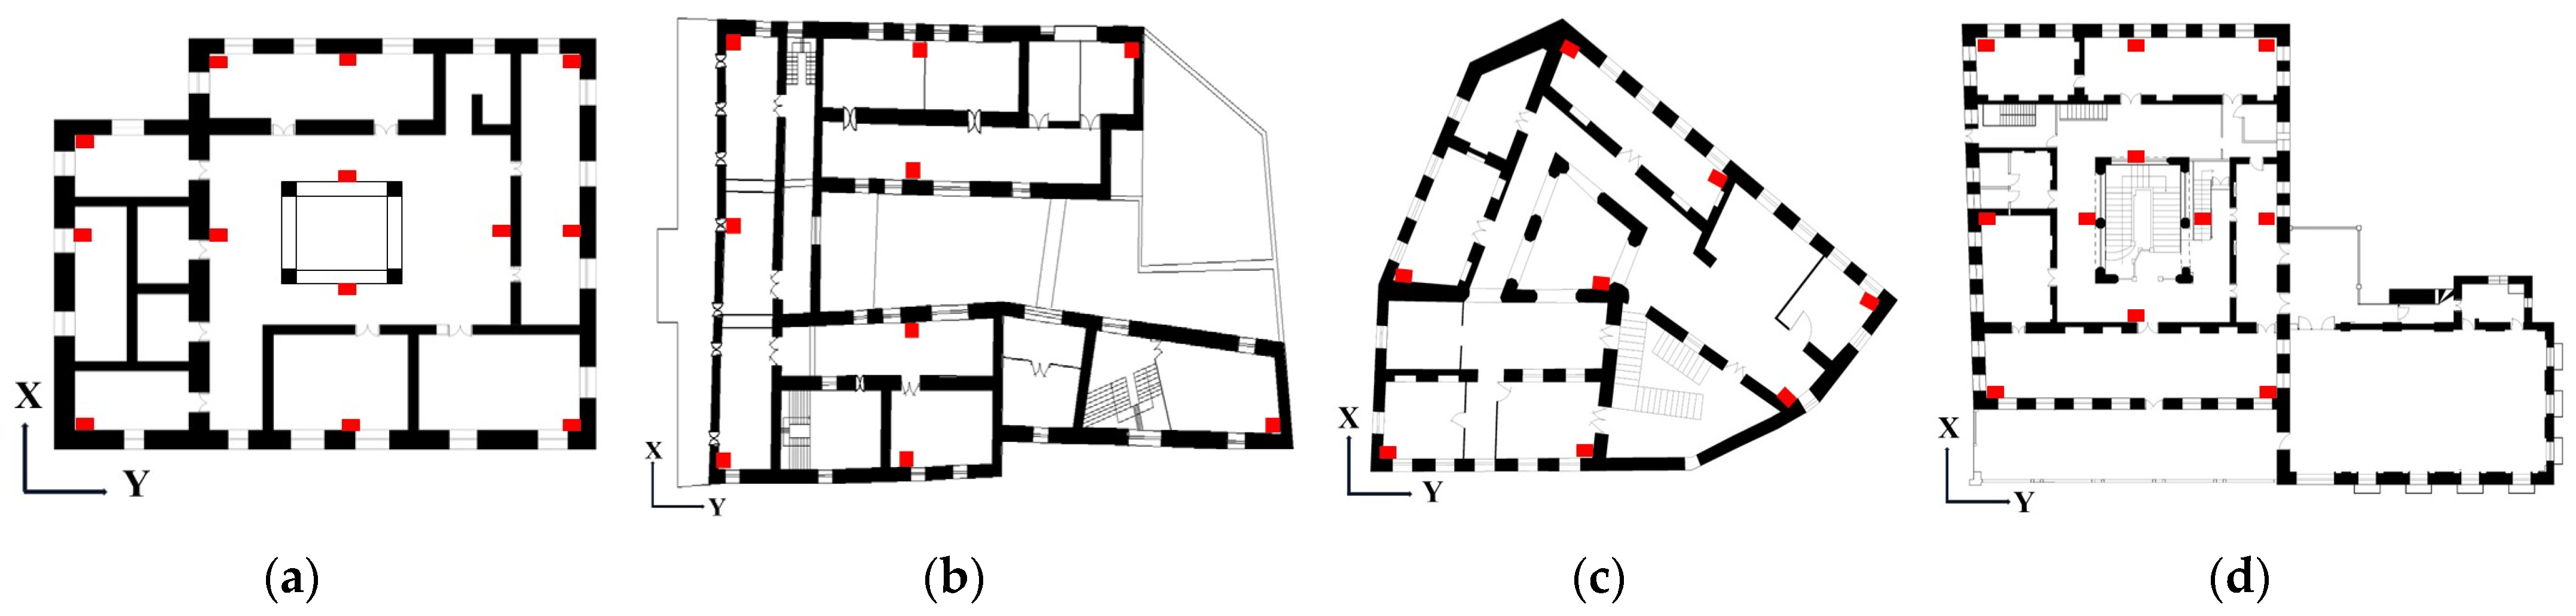
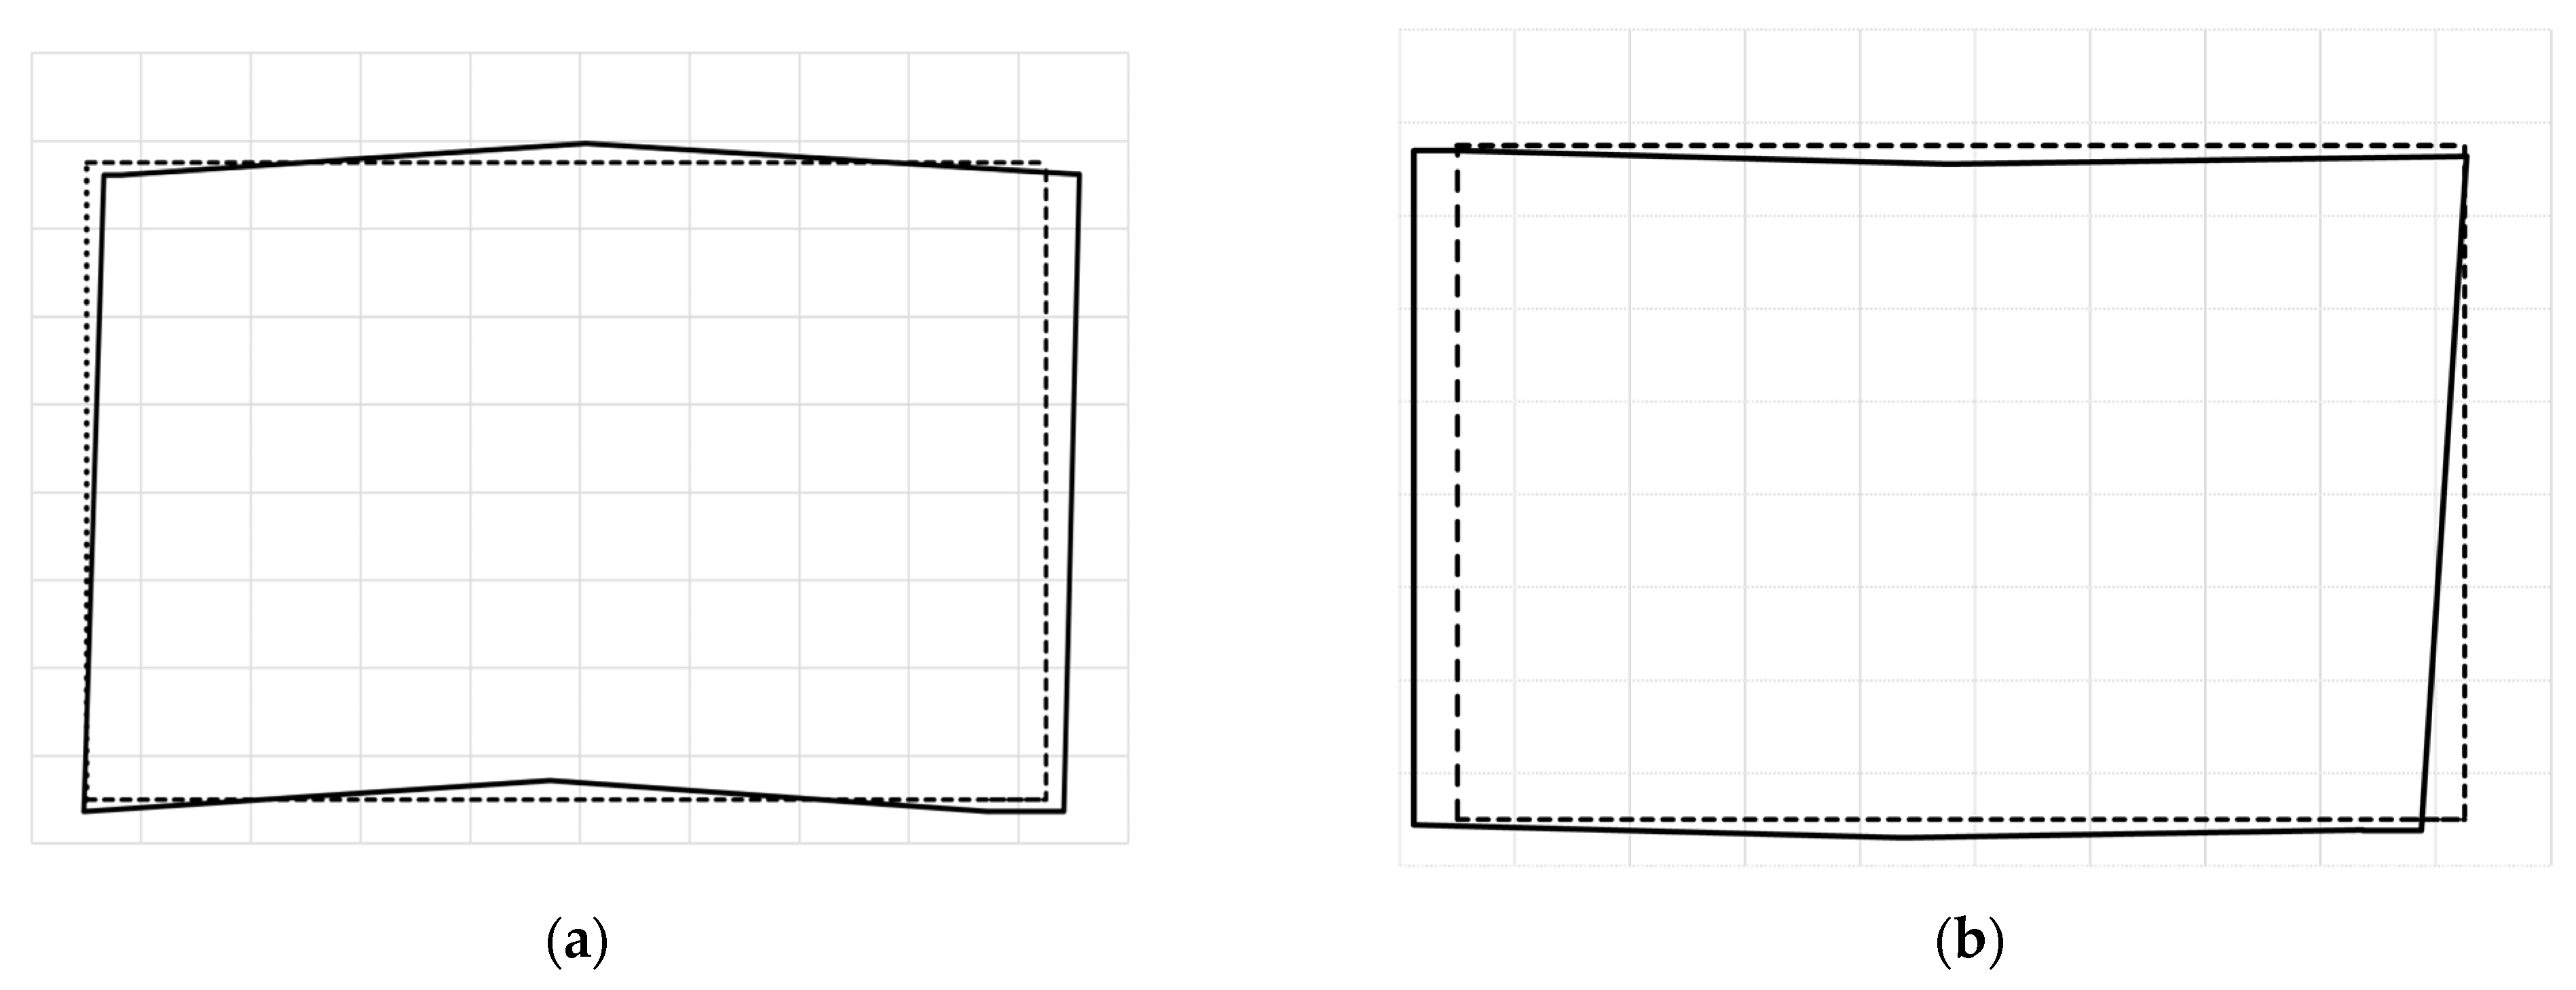
3.1. Old Customs Building

The Old Customs house was built in 1865 as the home fort of a newly married couple, a daughter of the 1st Sultan of Zanzibar. In the 19th century, balconies with four iron pillars supporting two verandas were added, as well as the transition from a flat roof into a pitched roof covered with an iron sheet. The house was built in the Arabian style with an open courtyard. The first floor is used for offices, and the second and third floors are for academic purposes. It is 34.68 m long, 25.30 m wide, and with a height of approximately 14.80 m, and the wall’s thickness ranges from 0.5 to 1.0 m.

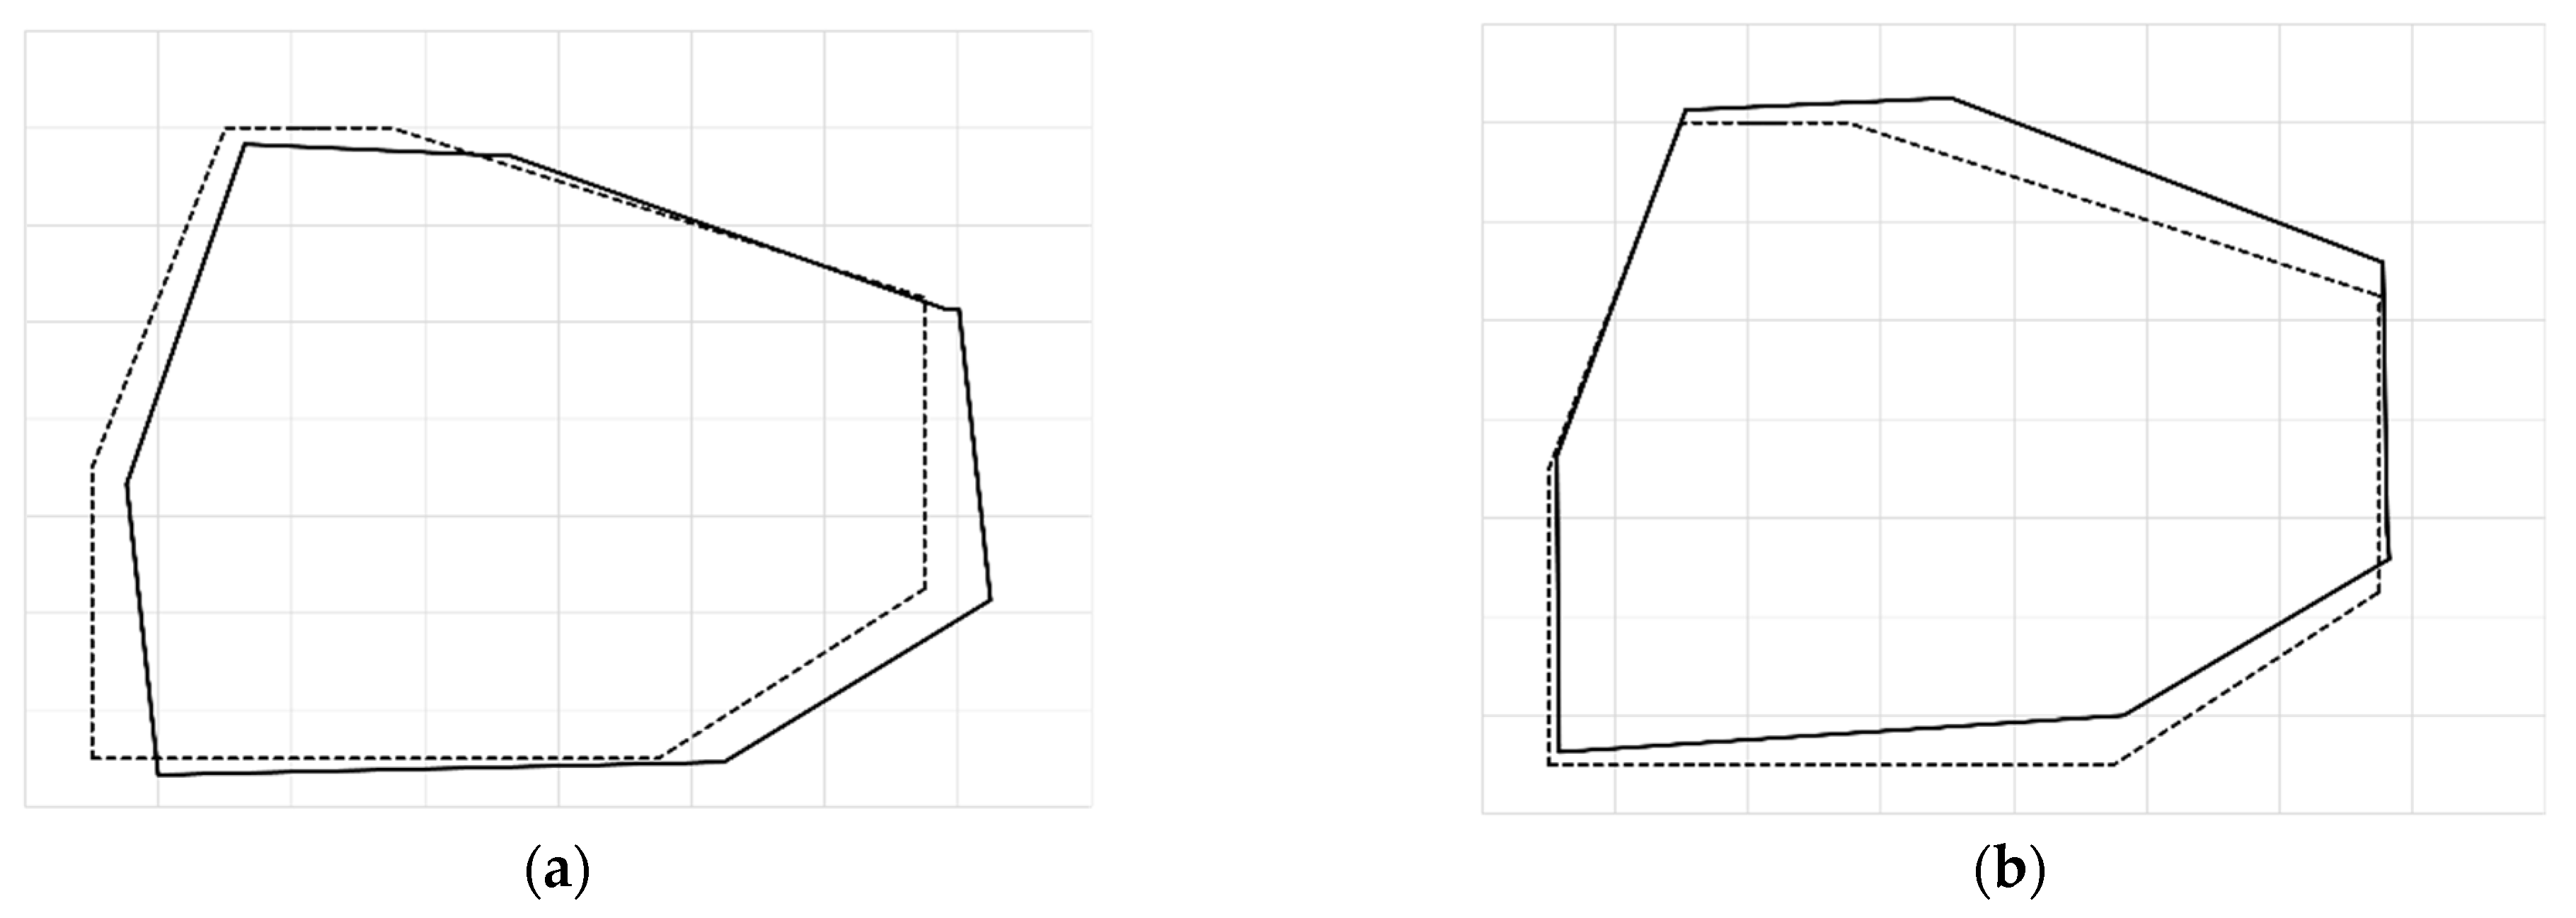
3.2. Old Dispensary Building

The Old Dispensary was built by wealthy Ismaili businessman Tharia Toppan in 1887. It was in honor of Queen Victoria’s Golden Jubilee. Later in the 1990s, the Aga Khan Trust was renovated and used as a cultural center. The design was based on the Indian architecture type, and it was a symbol of cultural diversity that influenced the contribution to the development of Zanzibar in the 19th century. The façade is embellished with large carved doors and multistoried wooden balconies. It is a 35.20 m long, 28.85 m wide, and 15.20 m high limestone structure. The load-bearing walls have thicknesses ranging from 0.50 to 0.75 m.

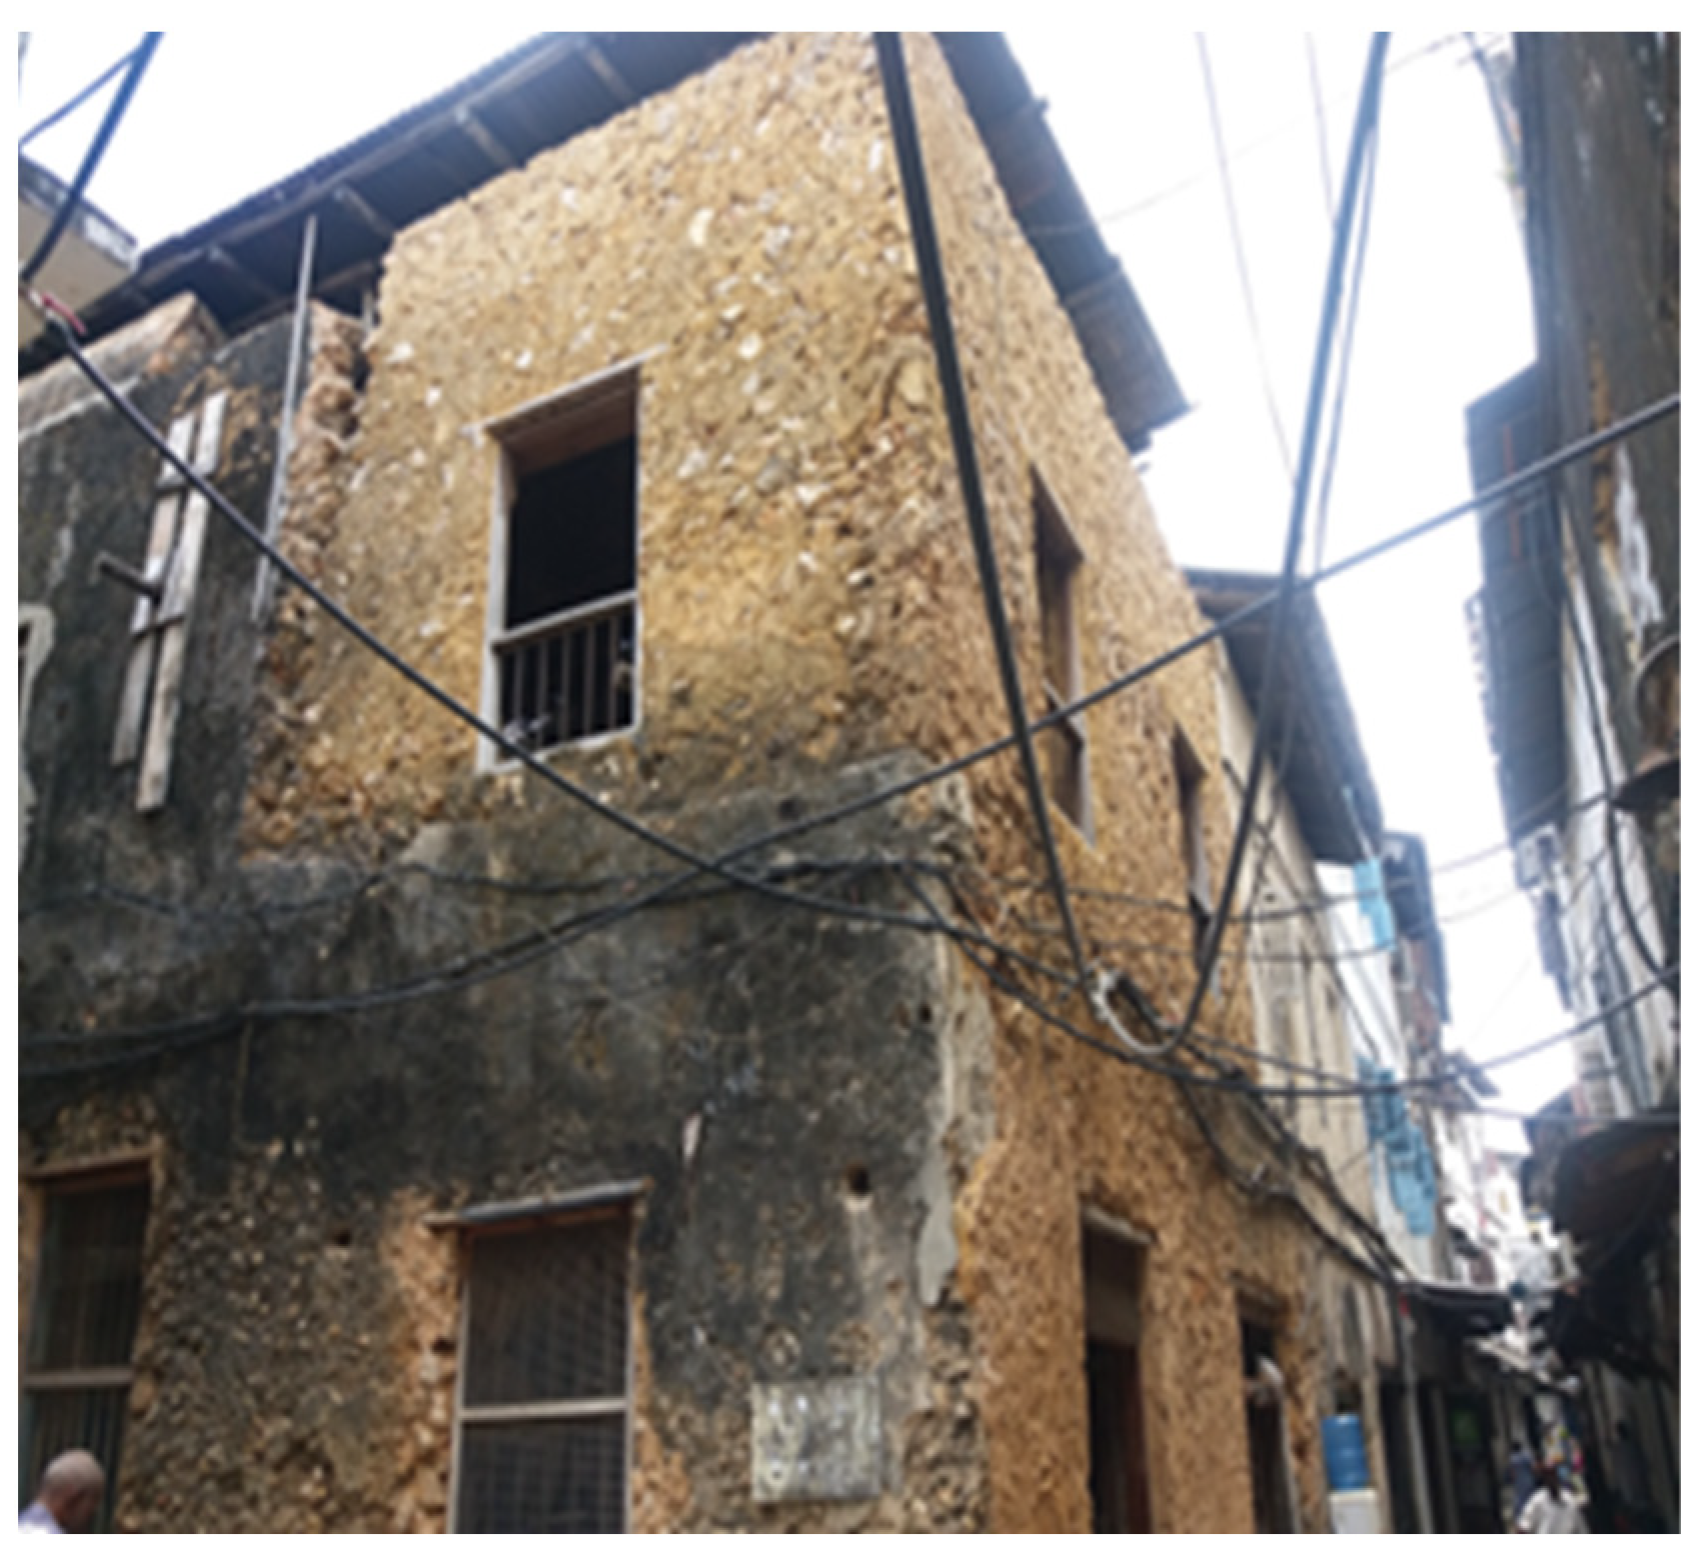
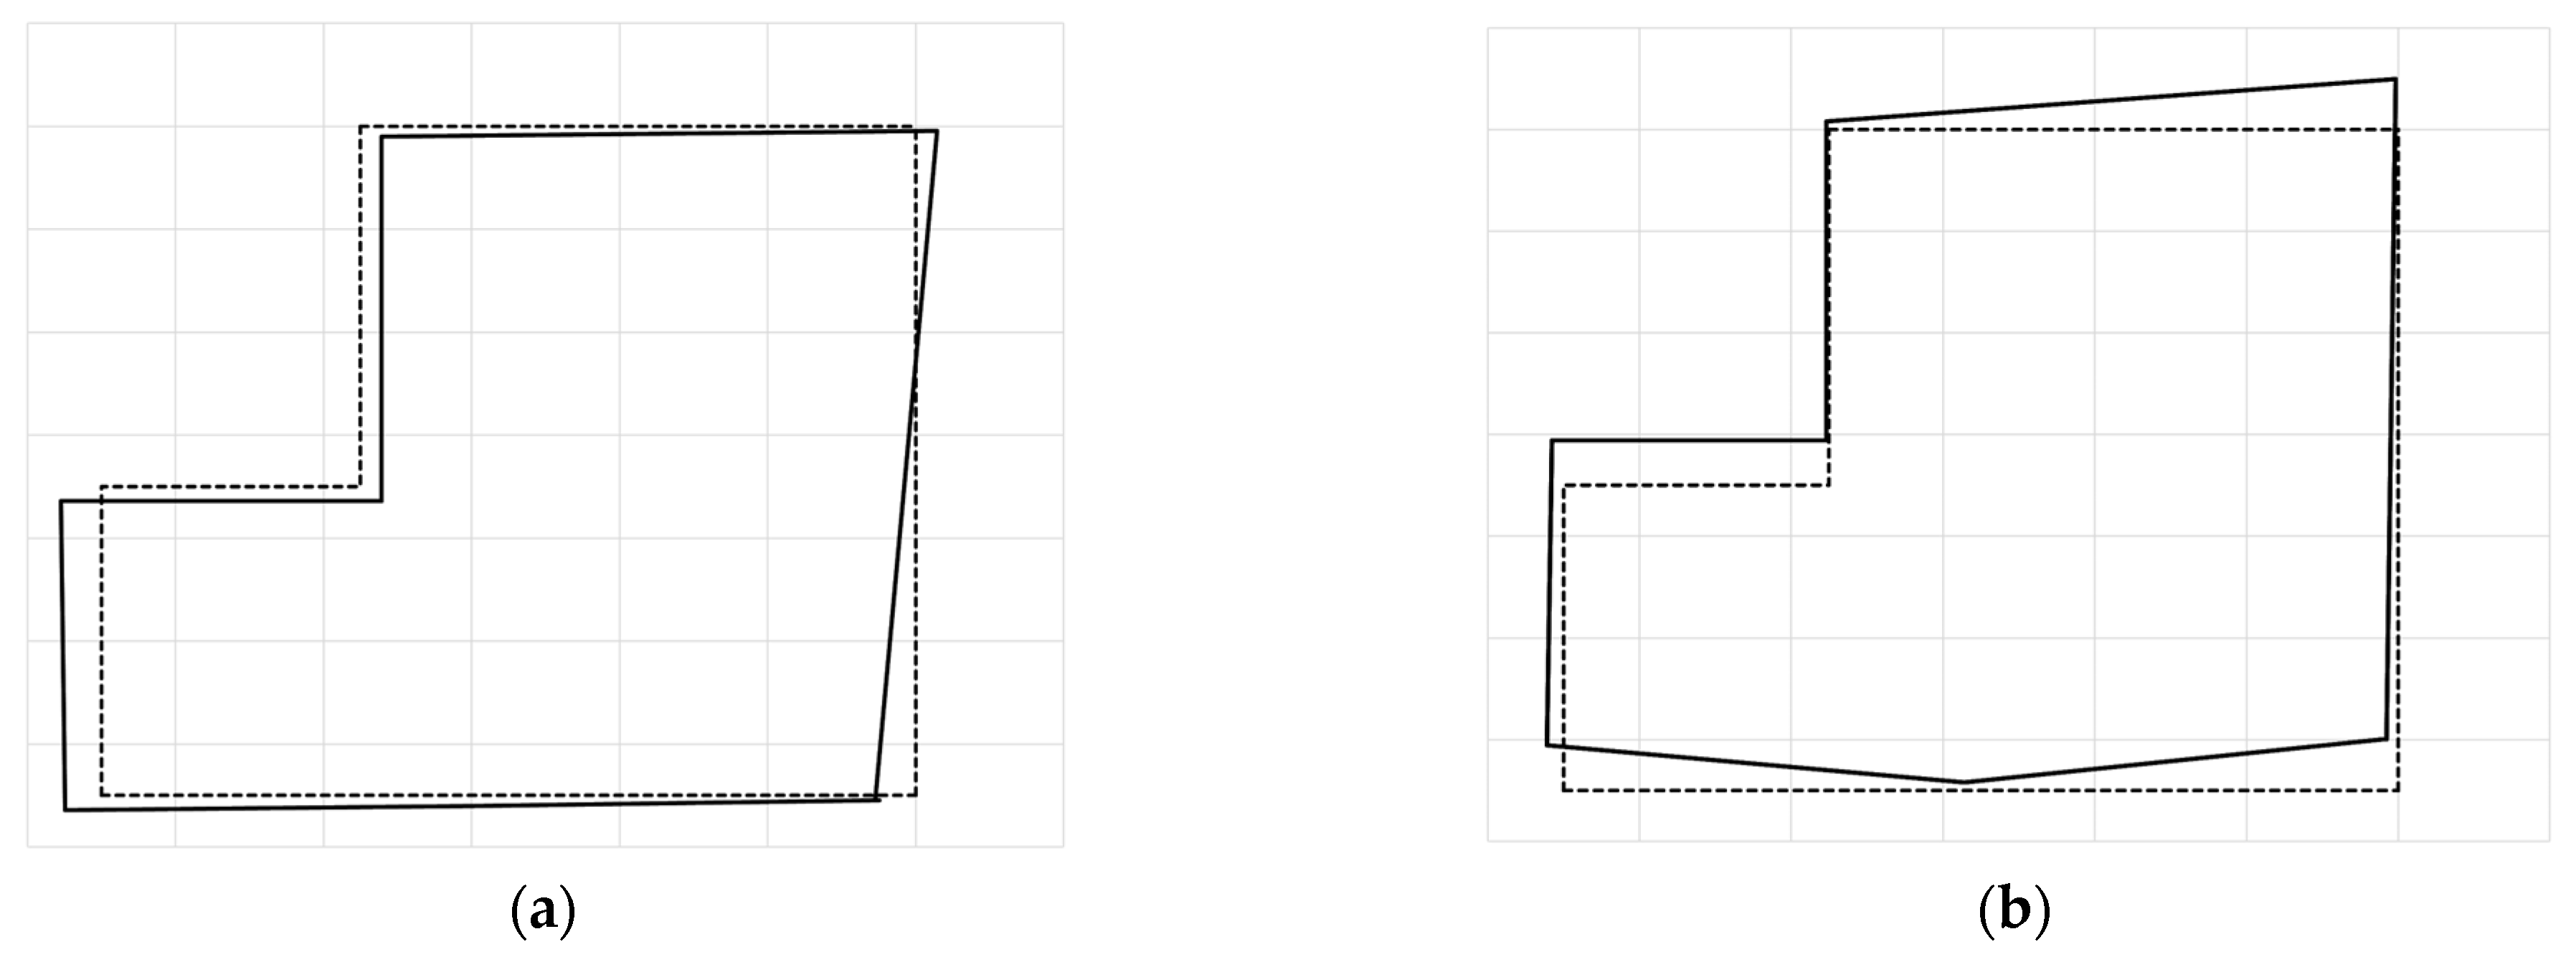
3.3. Tippu Tip Building

The Tippu Tip building was the residence of the famous slave trader (Tippu Tip) during Arab rule in Zanzibar Stone Town. It has specific historical significance and is an outstanding example of 19th-century Swahili architecture composed of different architectural features with Arab, Indian, and European influences. The usage changed from single-family residences to multifamily apartment houses during its lifetime, and it is 29.75 m long and 25.35 m wide. The building height is 13.60 m, with the load-bearing walls ranging in thickness from 0.35 to 0.75 m.

3.4. Palace Museum Building
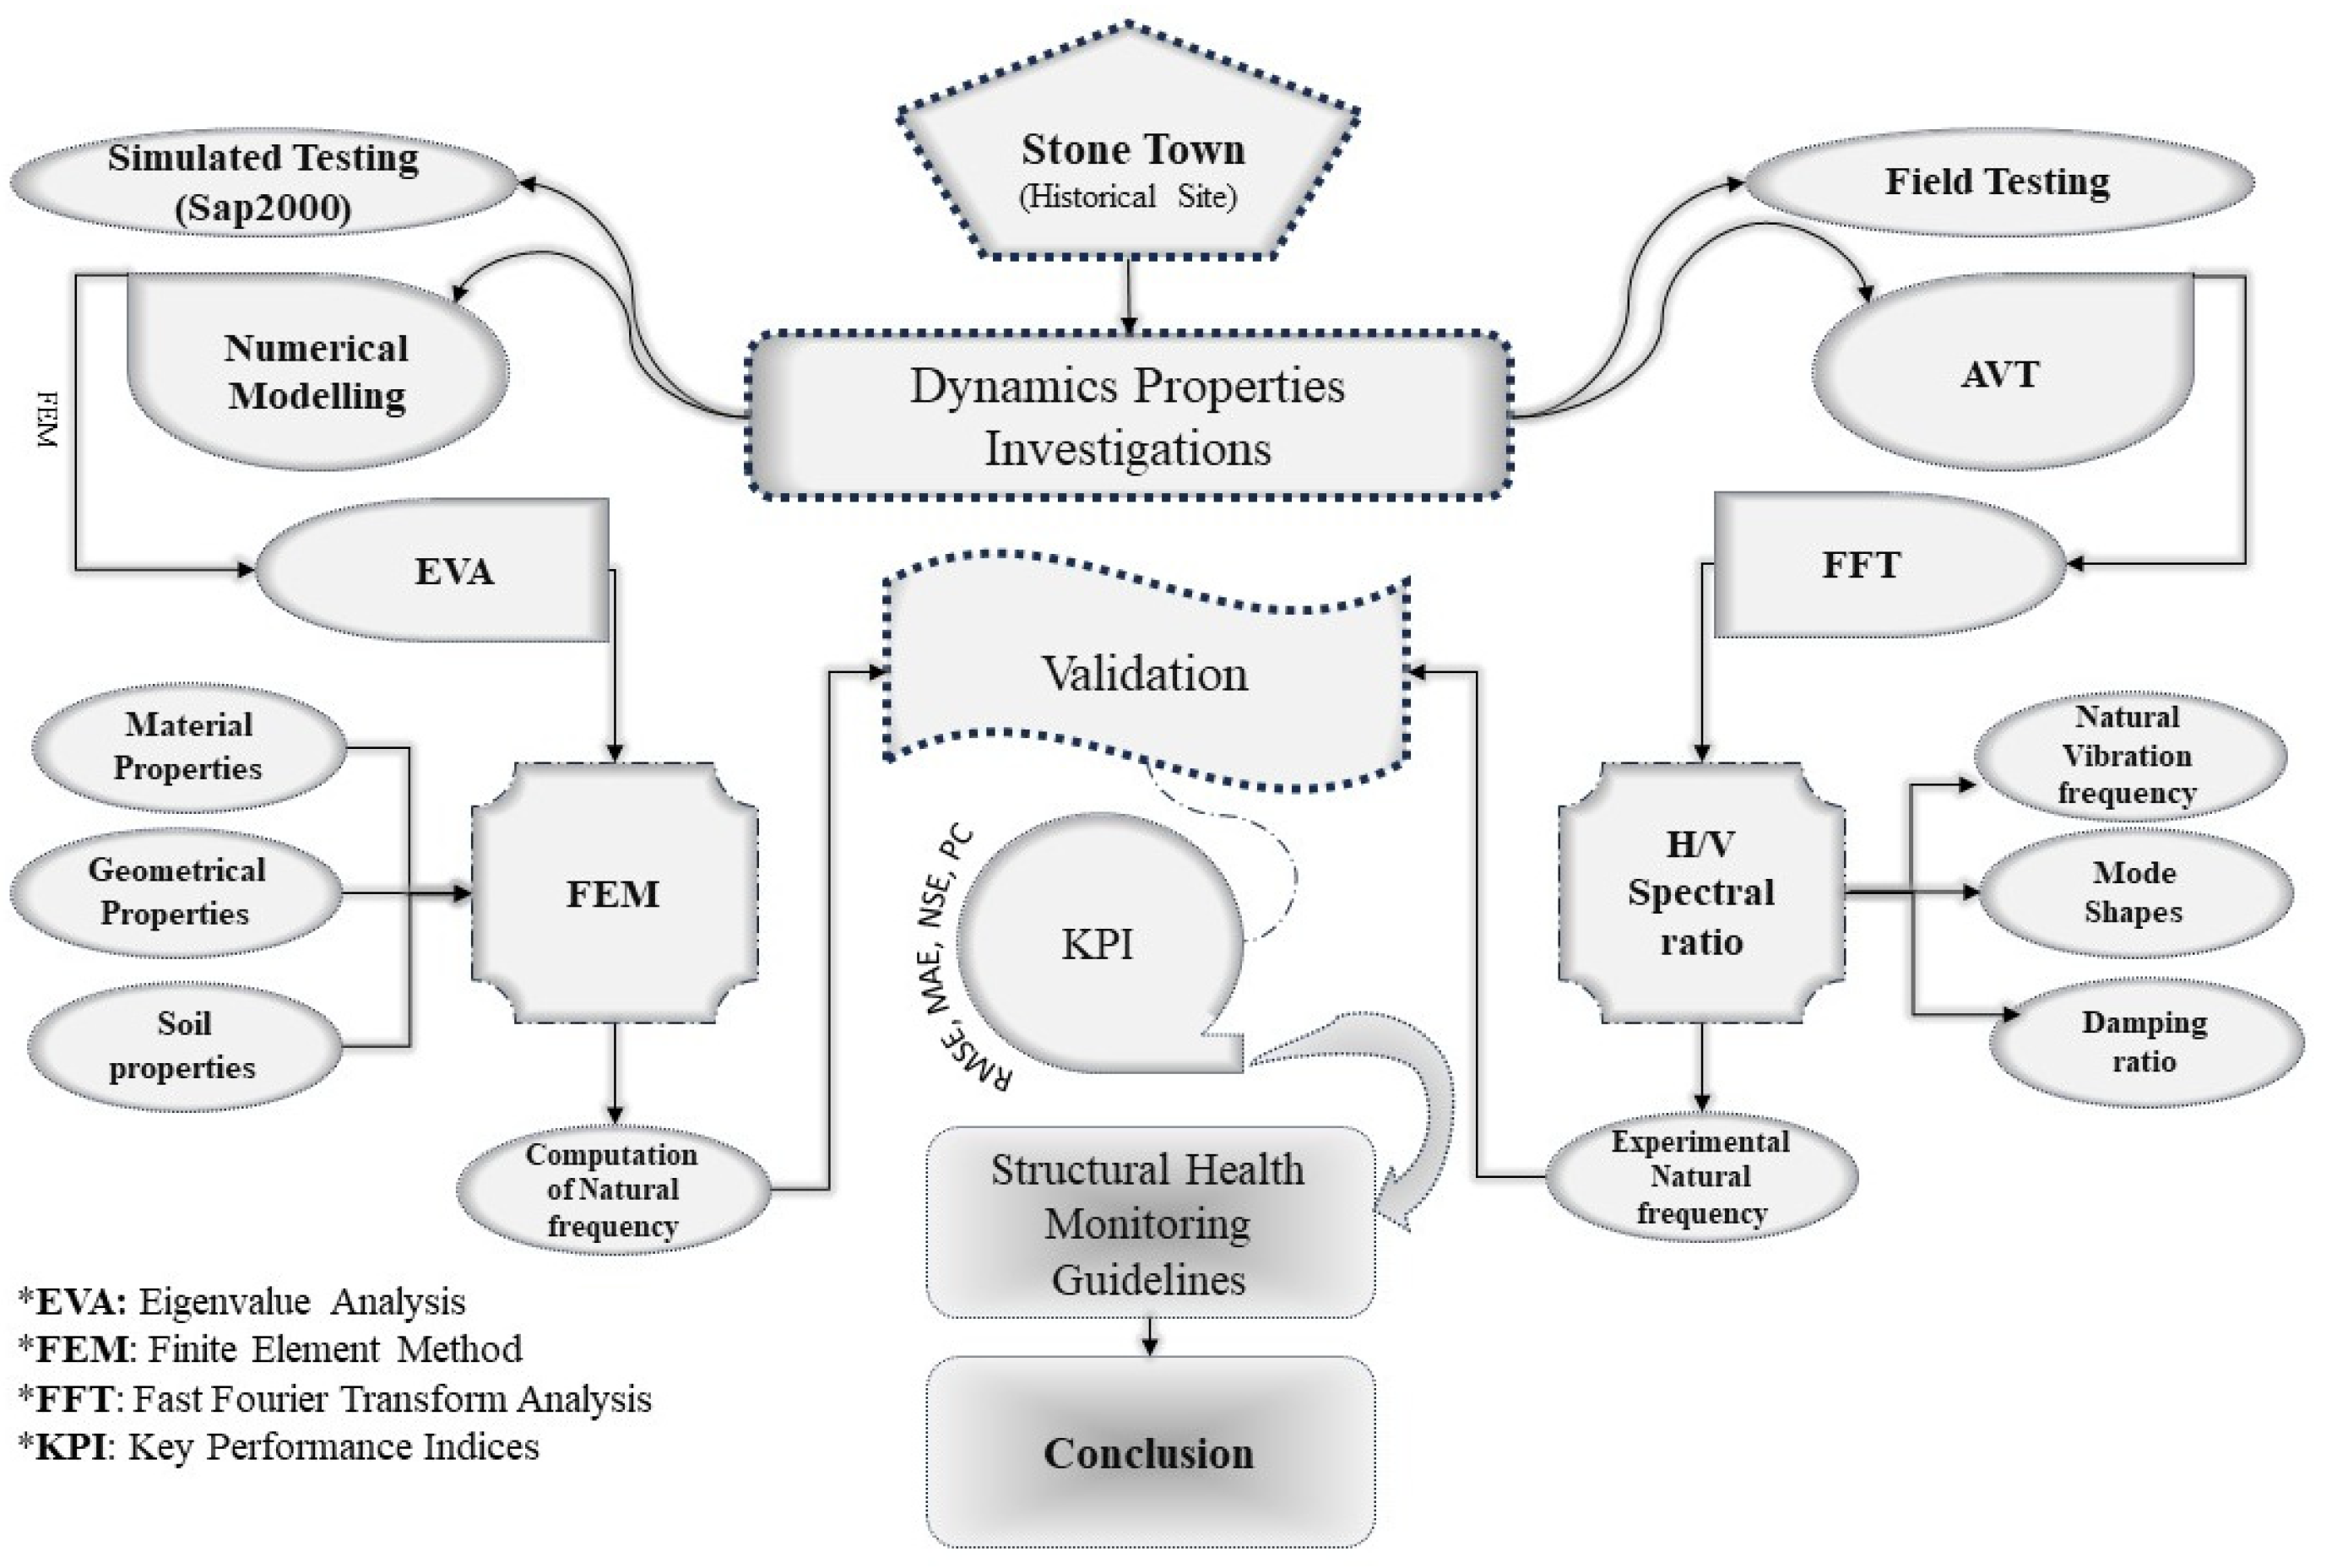
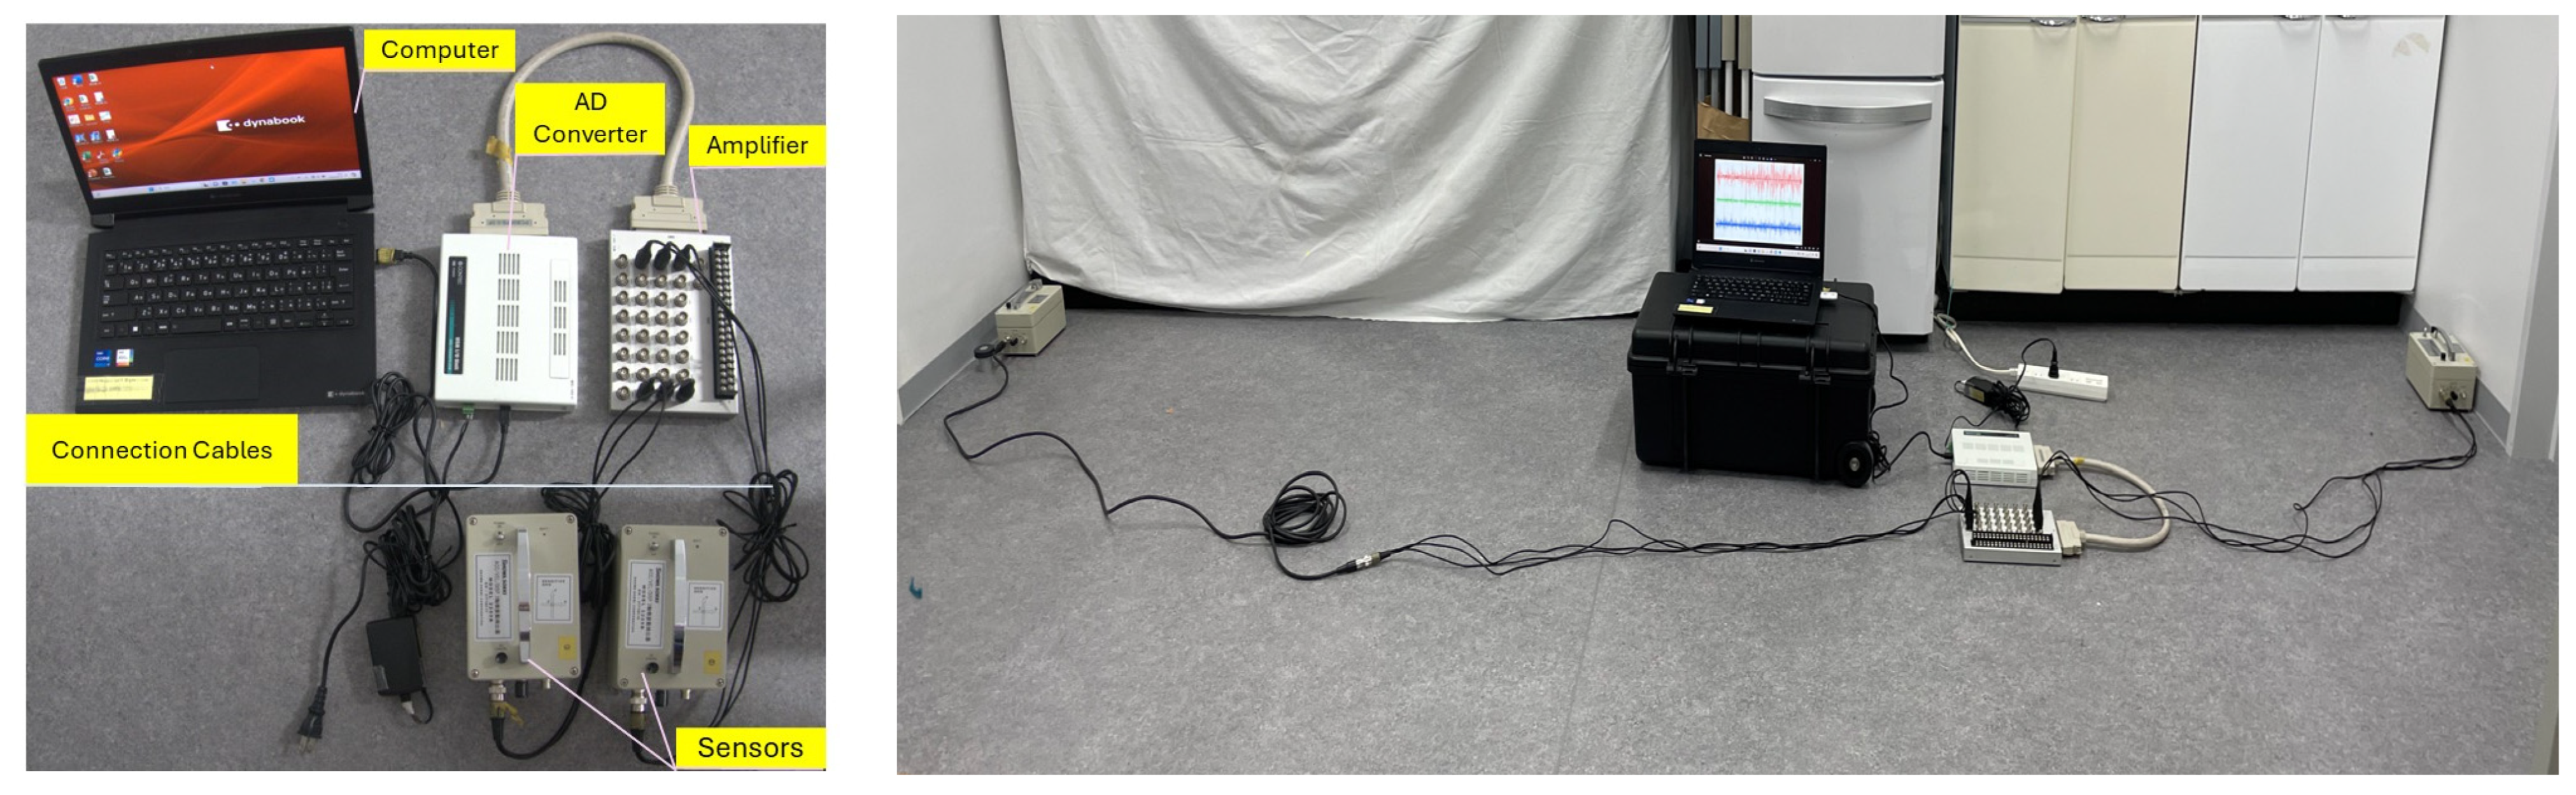
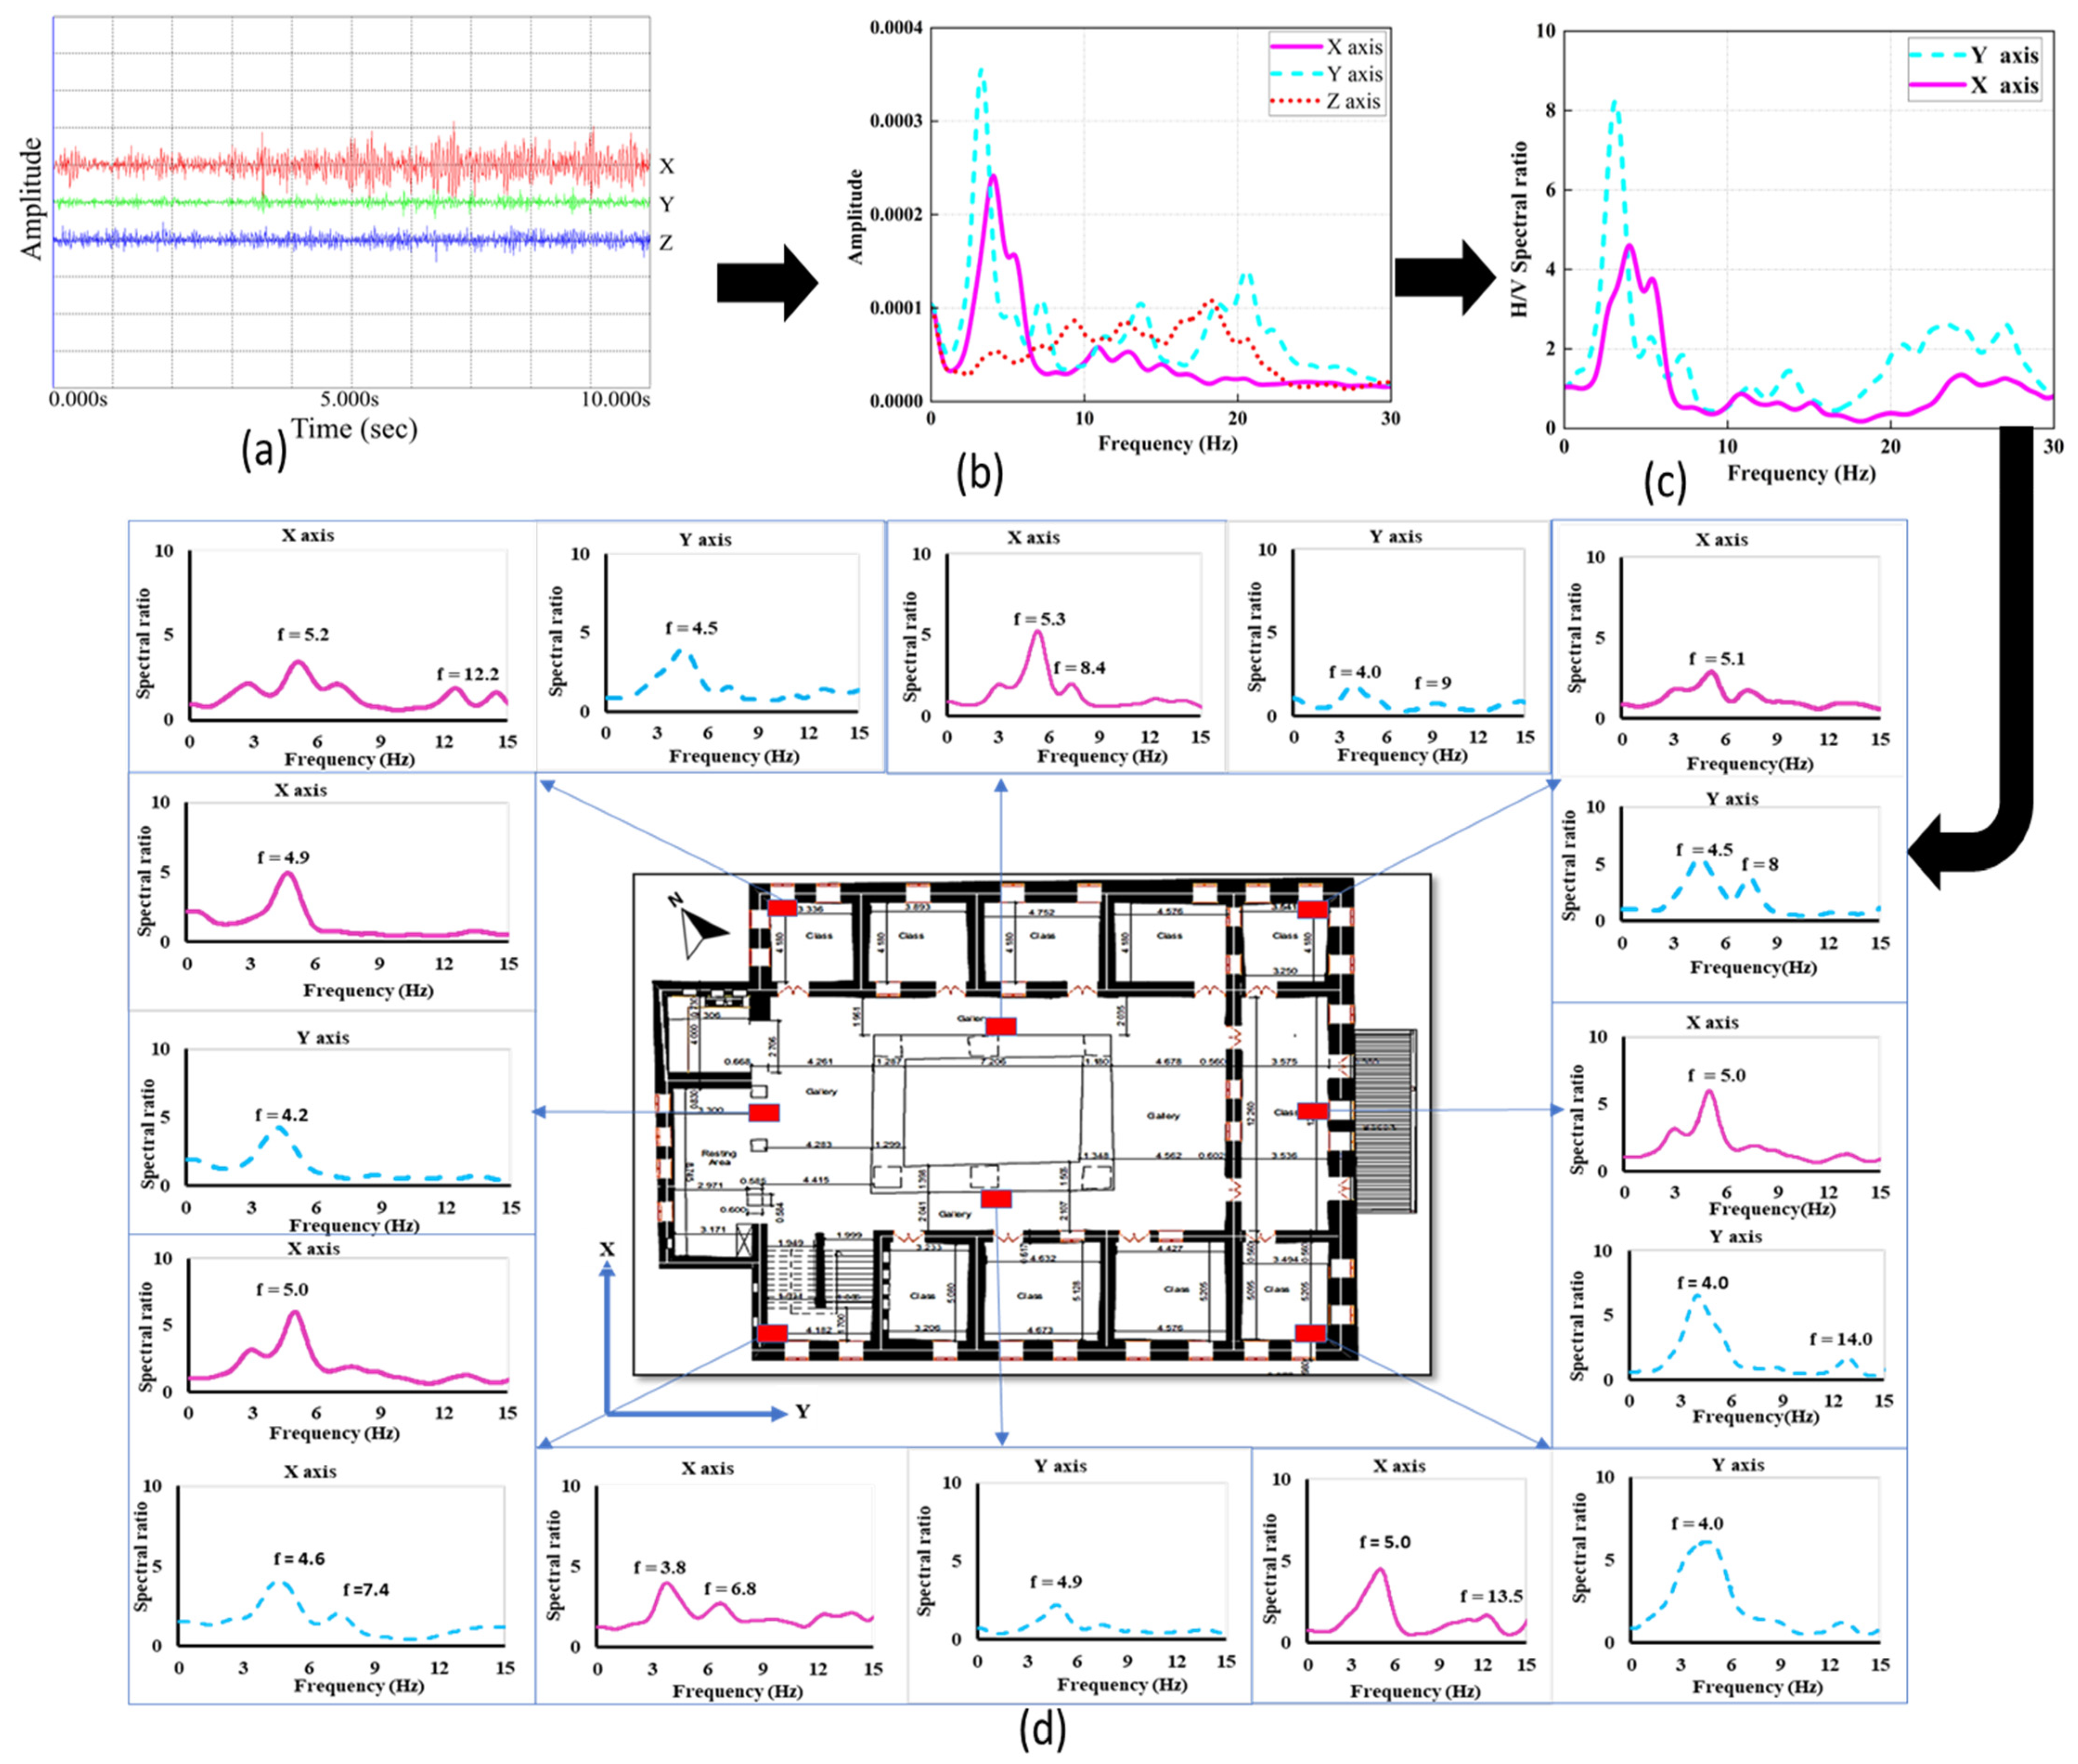
The palace was built as the Sultan’s palace in Zanzibar in the 1830s. The palace was partially destroyed in the shortest war in history in 1896, then was rebuilt on a more modest scale and used as a palace until the 1964 revolution. Since then, the palace has been used as a museum, attracting many visitors due to its historical significance and unique Arab architectural features. The style of architecture strongly influenced the Arabian Peninsula. This house is located alongside the other three houses, and a bridge connects all houses. It is a limestone structure that is 40.00 m long, 31.30 m wide, and 14.30 m in height. The wall thickness ranges from 0.5 to 0.9 m.

4. Methodology

As depicted in Figure 4, the methodology involves extensive field investigation in all 4 buildings at various floor levels. The AVT was deployed at 41 selected locations, and the database was subsequently gathered to analyze and explore the structural dynamic characteristics. The selection of spatial points for the equipment deployment was determined given the compromised structural areas experiencing higher dilapidations. The choice was aligned with the examination of the overall structural dynamics of the entire building, taking into account the ambient conditions. Considering that, the AVT equipment was deployed at the outer periphery and inner wall distributions at various floor levels of the structure. A series of ambient vibration testing (AVT) measurements were conducted on four historical buildings using Triaxial micro-vibration detector equipment (MODEL-2205B) manufactured by Showa Sokki (Tokyo, Japan). These accelerometers have a nominal sensitivity of 5V/10 mm/s, a specified frequency range of 1 to 100 Hz, and an accuracy range of ±3%. The equipment consists of two sensors, a cable connector, and a data logger, as shown in Figure 5. The tests were conducted using a 6-channel data acquisition system with two sensors per setup and reference points located at the center of the building. Each sensor was connected to a 3-channel input, allowing for separate data recording along three orthogonal directions (X, Y, and Z). The data recorded for each sensor included acceleration, velocity, and displacement, with velocity being the primary parameter used for these tests.
Two conductor cables connected the accelerometer to a computer workstation equipped with a data acquisition board for A/D and D/A conversion of the transducer signals, as well as for the storage of digital data. The periodic measurements were recorded at a 100 Hz sampling rate, with each recording lasting for 15 min at each point. Each observation point was taken multiple times to ensure data accuracy. Due to the limited number of sensors available, measurements were not taken simultaneously on each floor. The ambient response measurements and data acquisition took place on various days spanning from 18 December 2020 to 15 January 2020. Setting up the instruments typically requires approximately 30 min. The data collection was carried out continuously for a full day (10 h) for each of the buildings. The number of recorded points per floor varied depending on the complexity and accessibility of the structure. It was assumed that the buildings were subjected to excitations from wind, traffic, and human activities.
The sensors were fixed at critical structure zones, and the signals were recorded in cartesian orientations, i.e., in all three structural dimensions entailing the X, Y, and Z axes. The X-axis was considered the transverse direction of the walls, the Y-axis in the longitudinal direction of the walls, and the Z-axis in the vertical position. A schematic diagram delineating the layout plan of the equipment deployment is illustrated with the red rectangular shape (Figure 6). The recorded data were pre-processed to remove the noise and artifacts that involve the elimination of mean value, filtering the high-frequency noise to ensure that the data are in a suitable and representable format.
Subsequently, the horizontal and vertical components were computed using the Fast Fourier transform (FFT) to convert them from the time domain signal to frequency domain, which subsequently led to the extraction of amplitude for horizontal (H) and vertical (V) components at the frequency bin, i.e., H/V spectral ratio. The data were interpreted in terms of resonance and amplification frequencies and their respective relationship with structural parameters, crucial for seismic hazard assessment and guidelines. Meanwhile, the numerical modeling was carried out using eigenvalue analysis (EVA) under the finite element method (FEM) using Sap2000 v24.2.0 software [38]. Considering the integration of geometrical, material, and soil properties, the dynamic characteristics were evaluated. The validation was carried out with the experimental database for the development of correlations and quantified in terms of KPIs that involve the computation of root mean square error (RMSE), mean absolute error (MAE), Nash–Sutcliffe efficiency (NSE), and correlation coefficient (R2). Conclusively, the structural health monitoring guidelines were furnished to establish a benchmark for future conservation work for the degrading buildings.

5. Results and Discussion

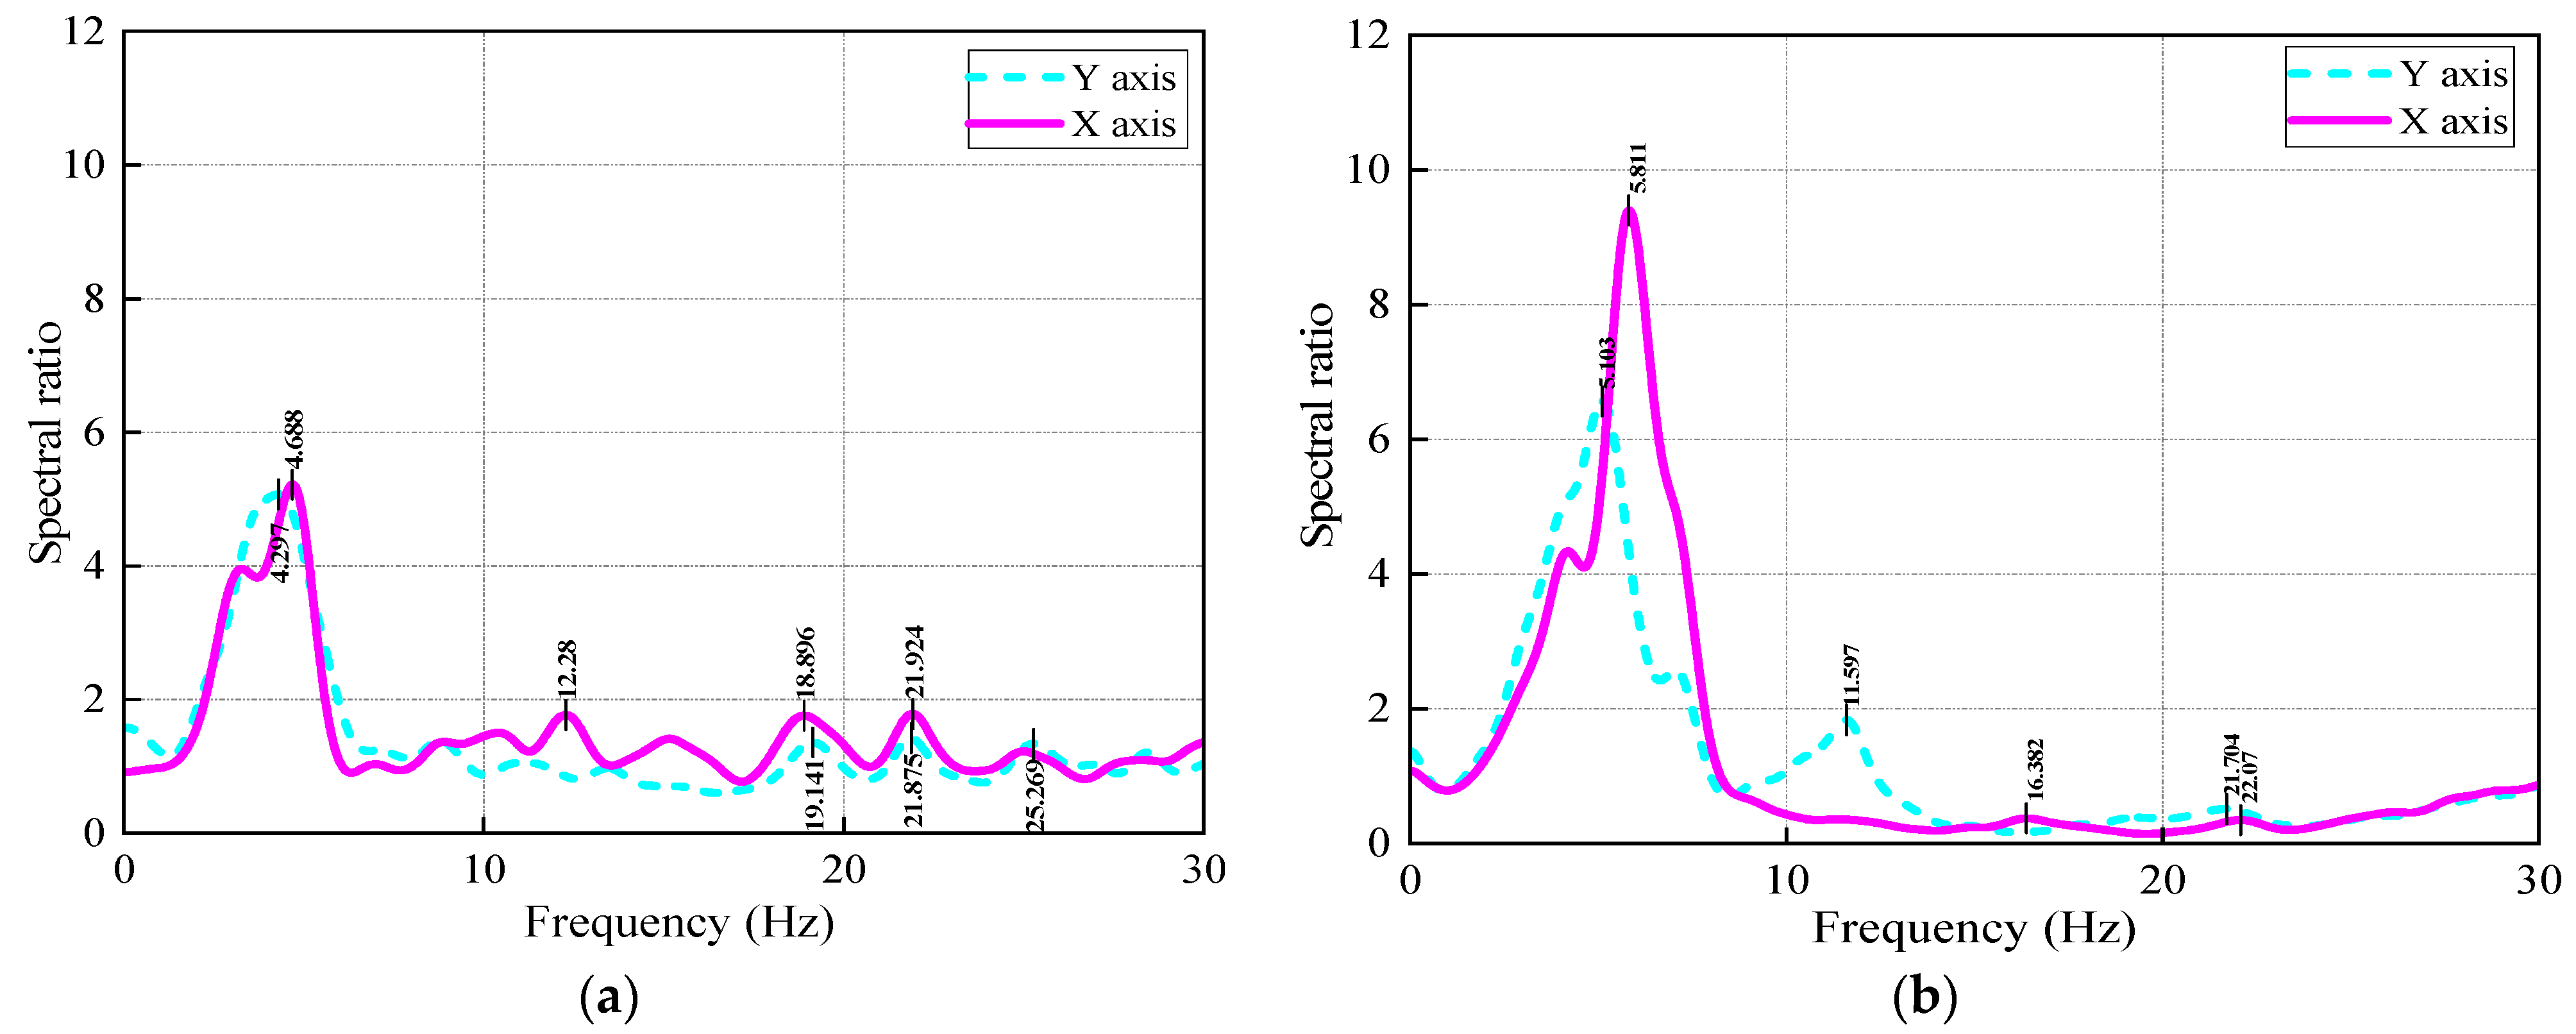
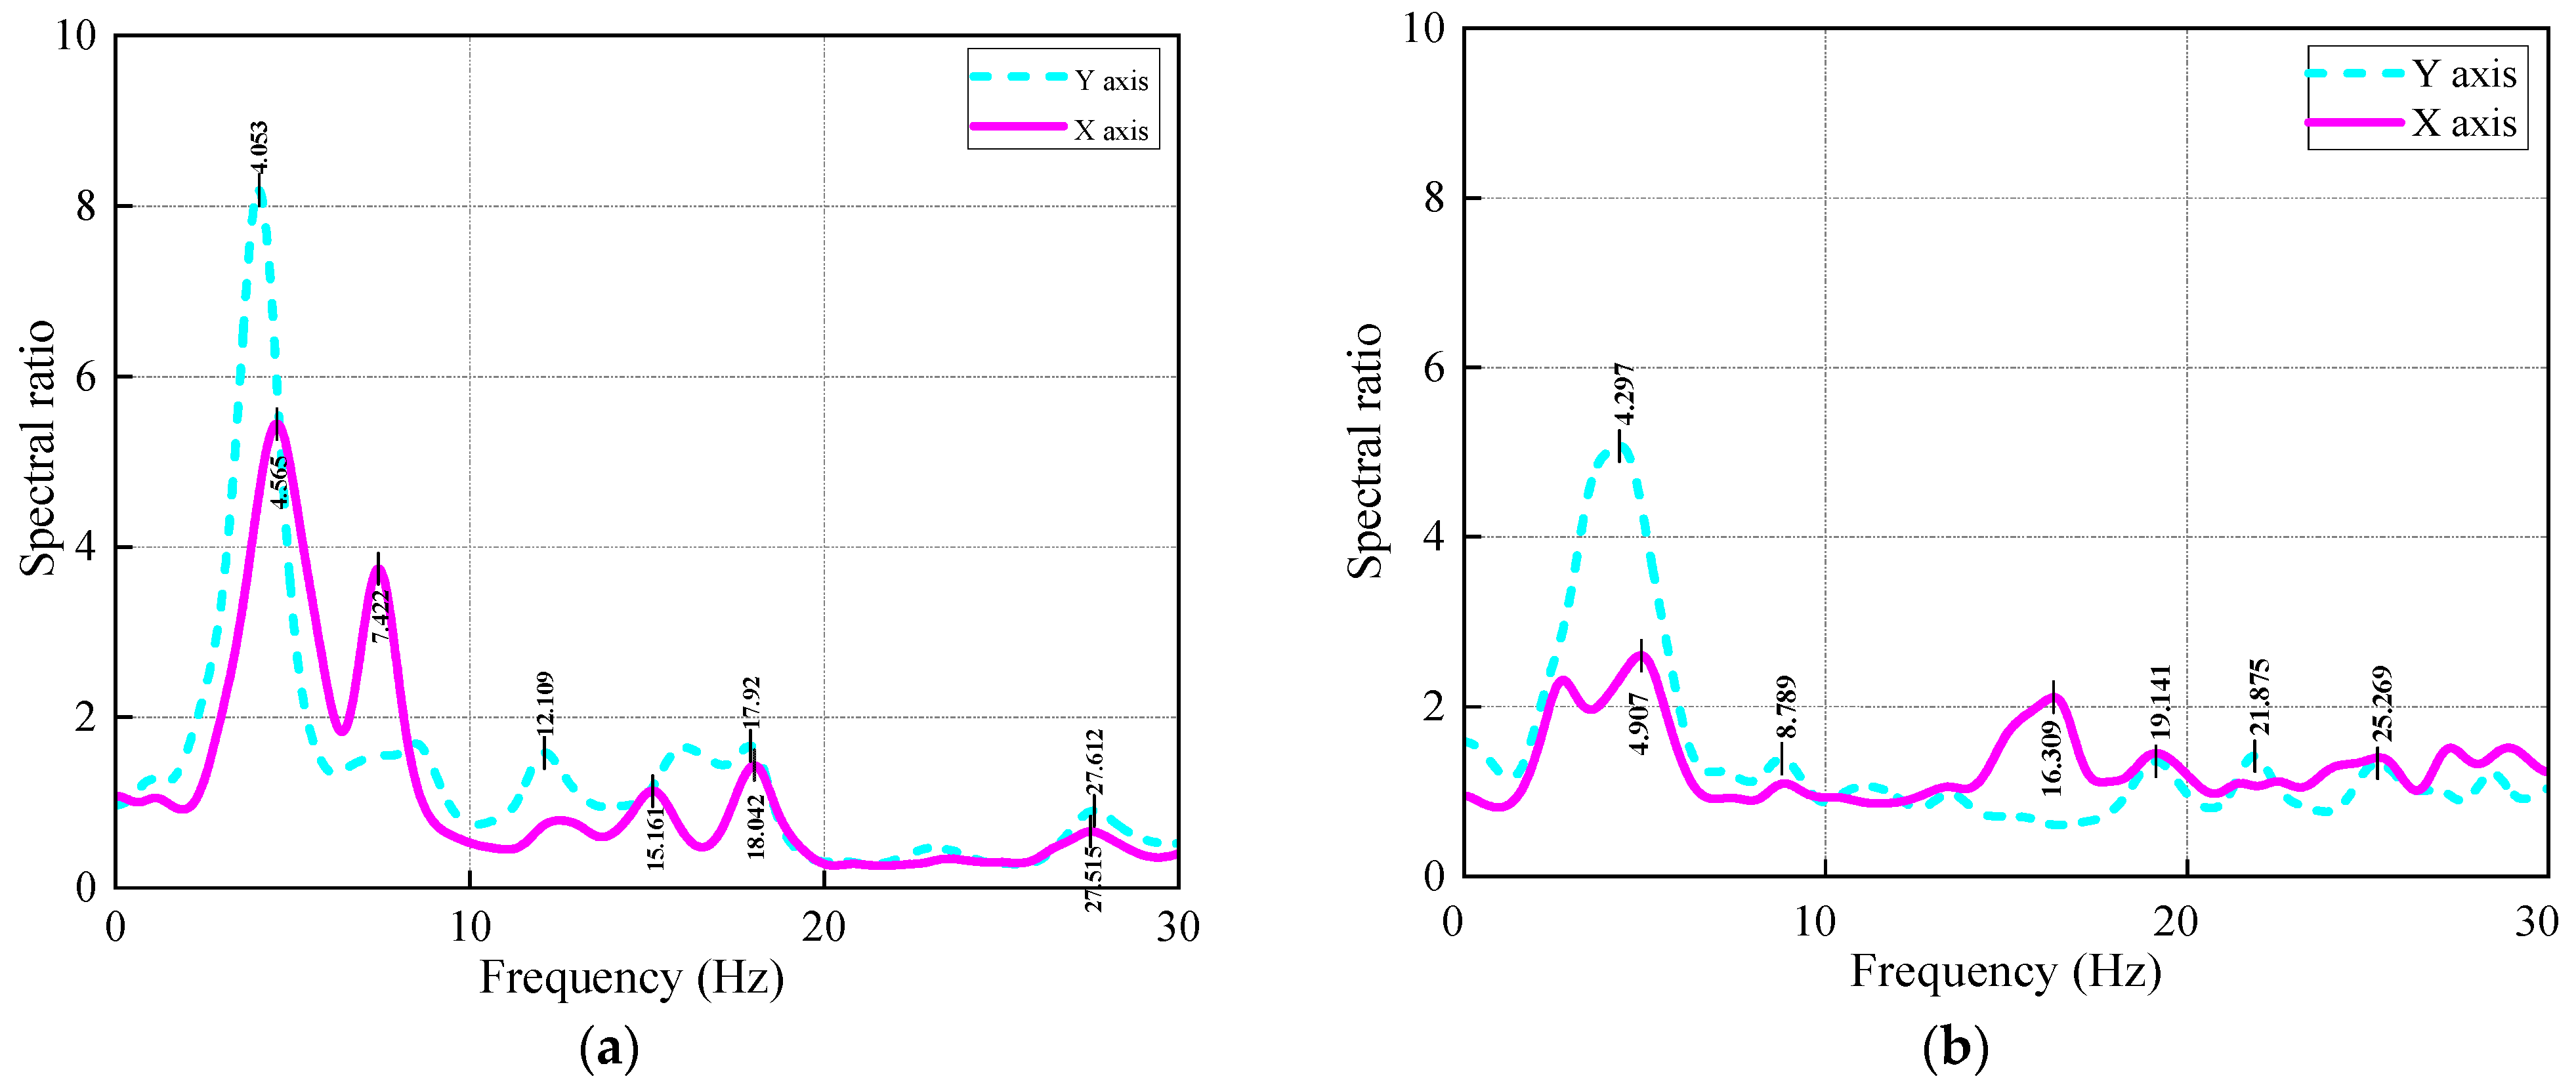
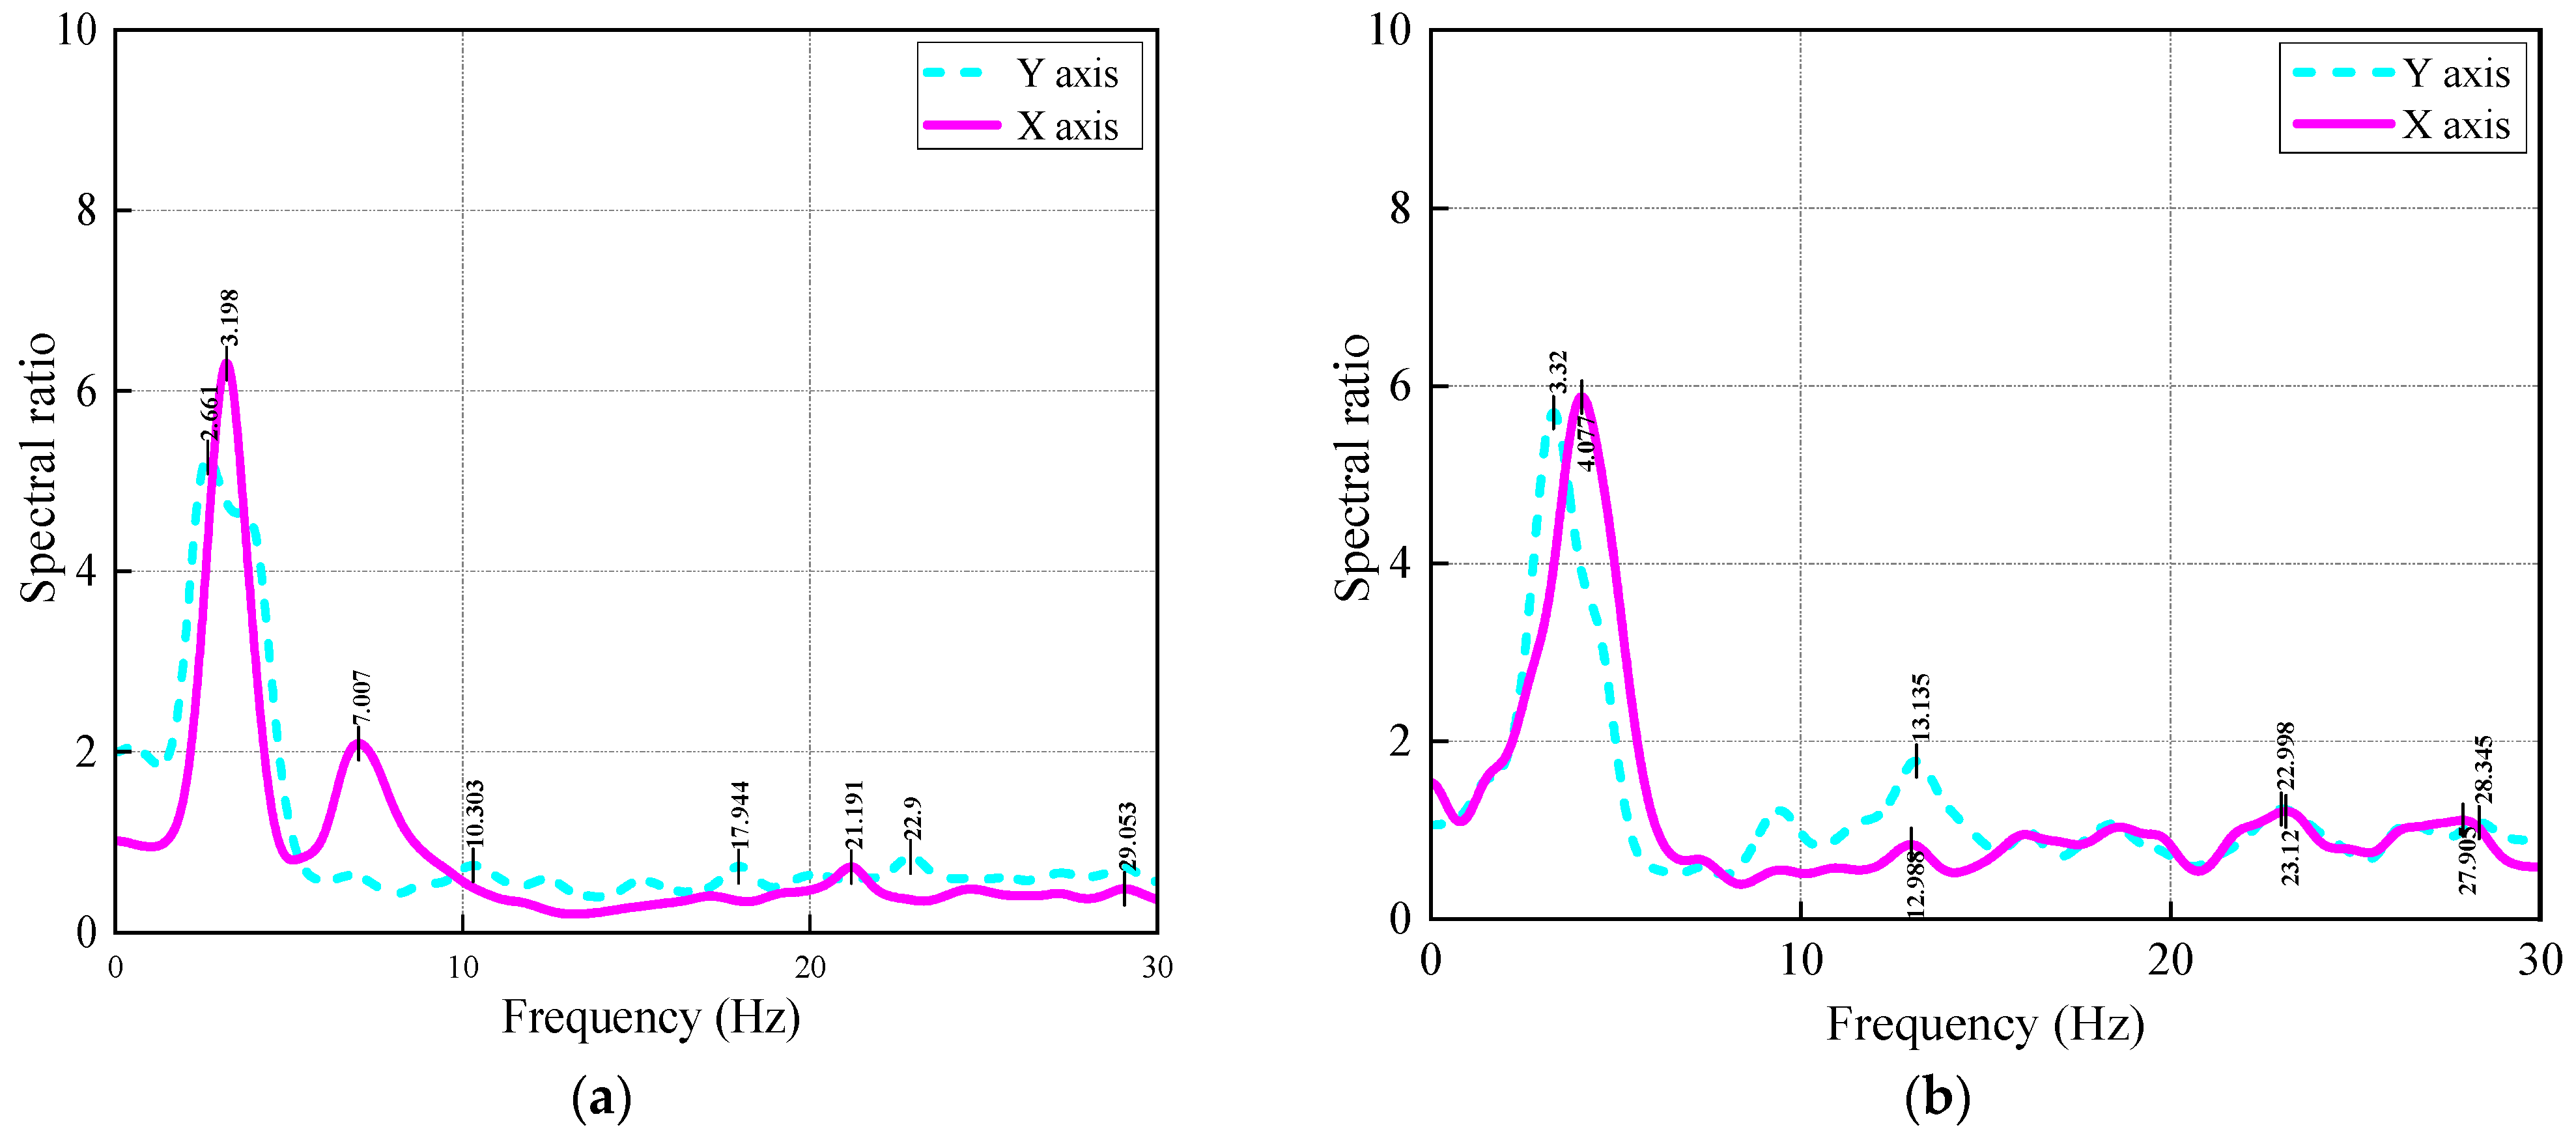
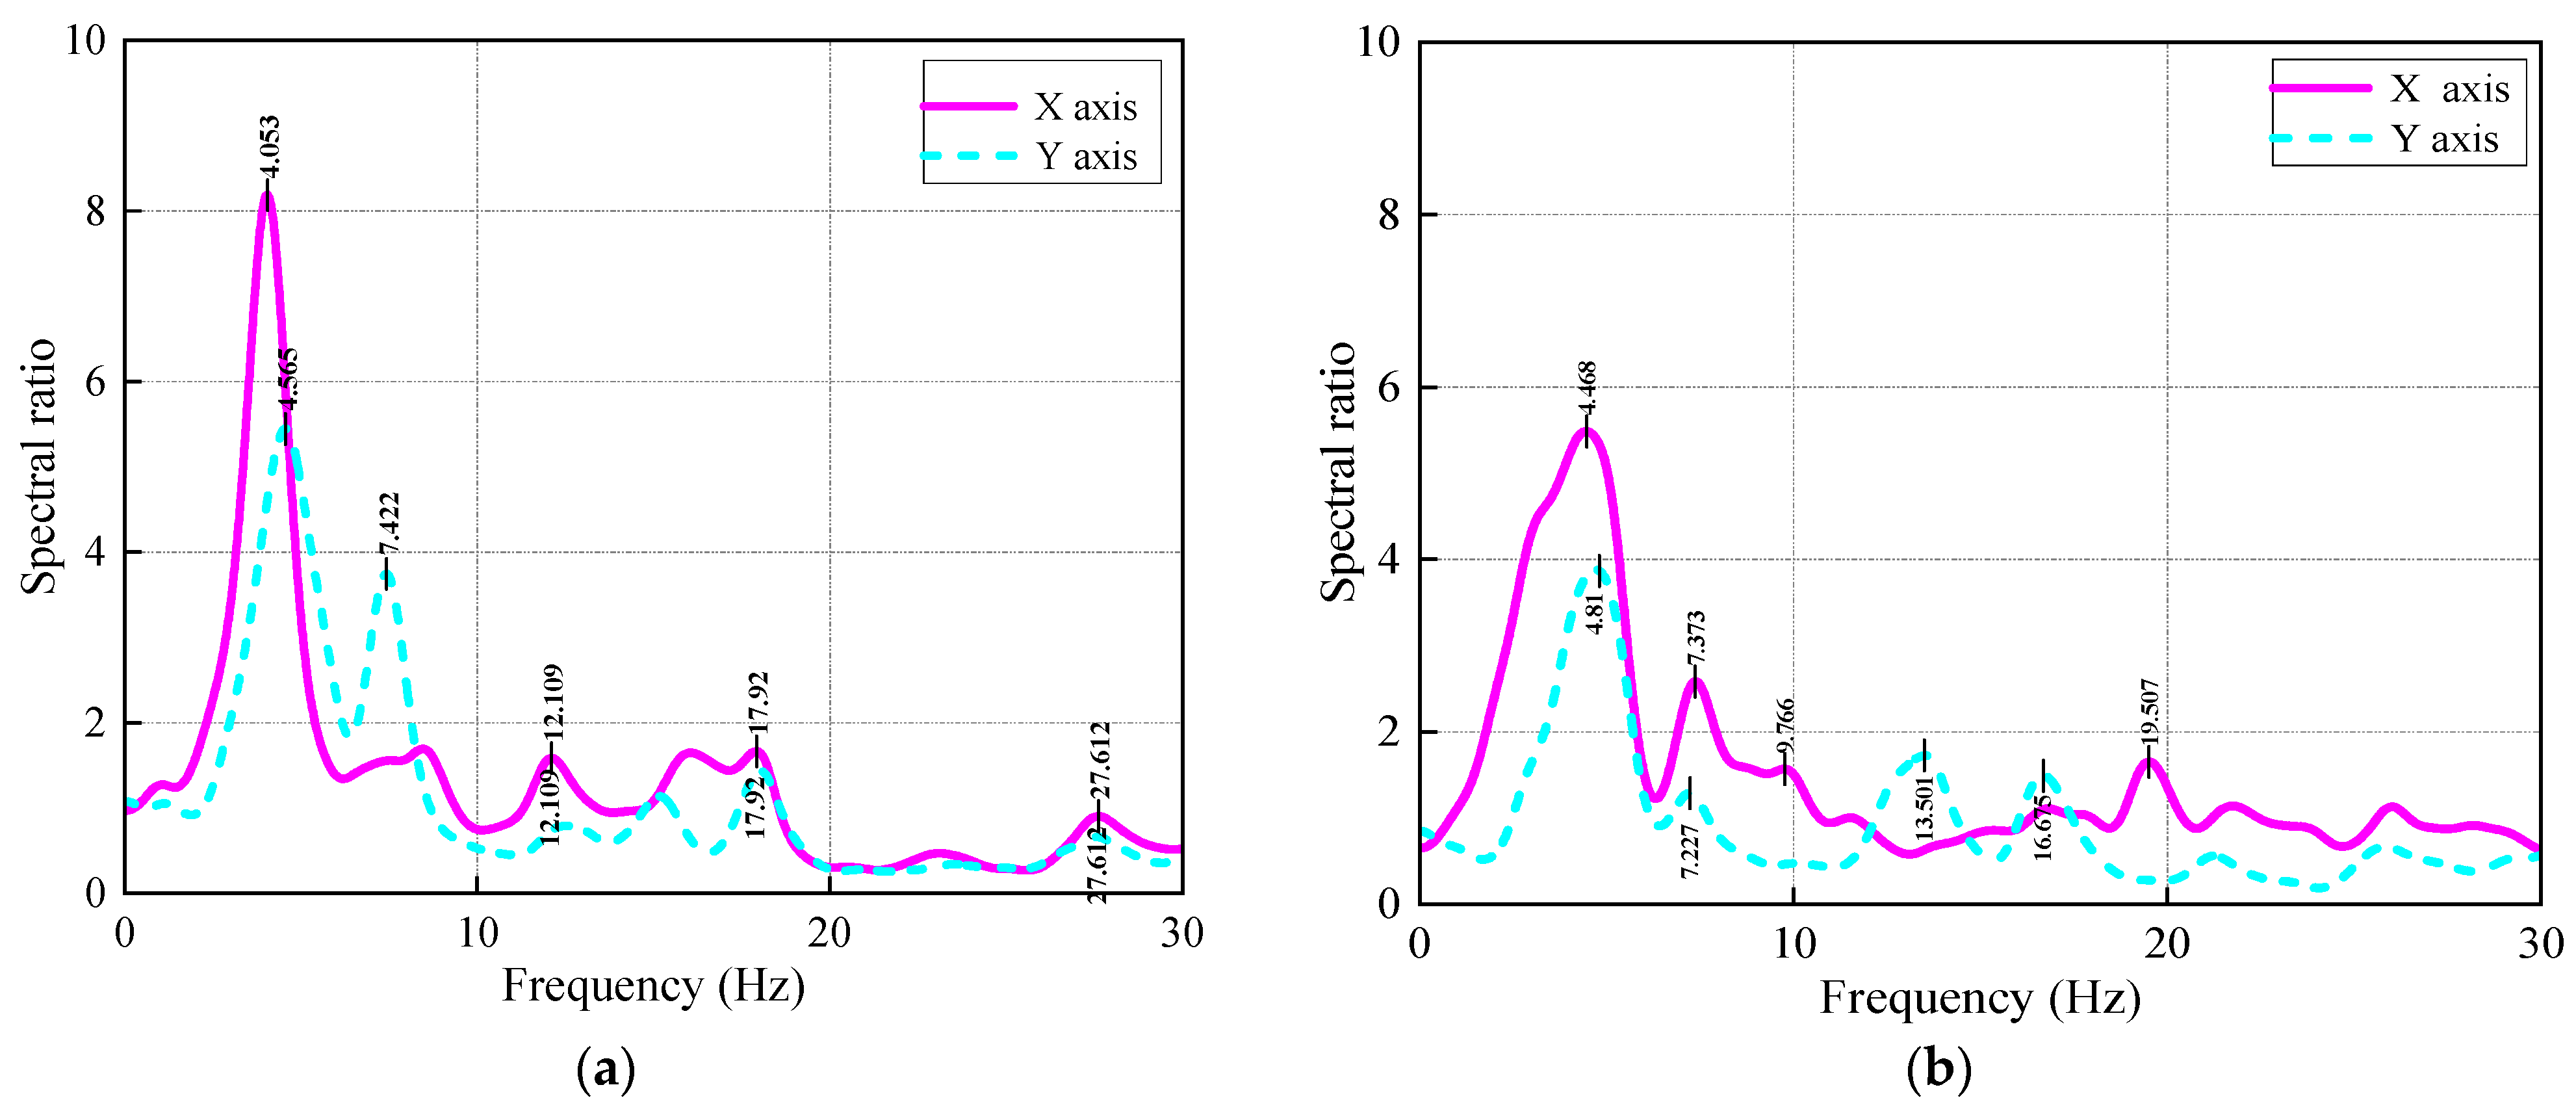
5.1. Exploration of Ambient Natural Frequencies
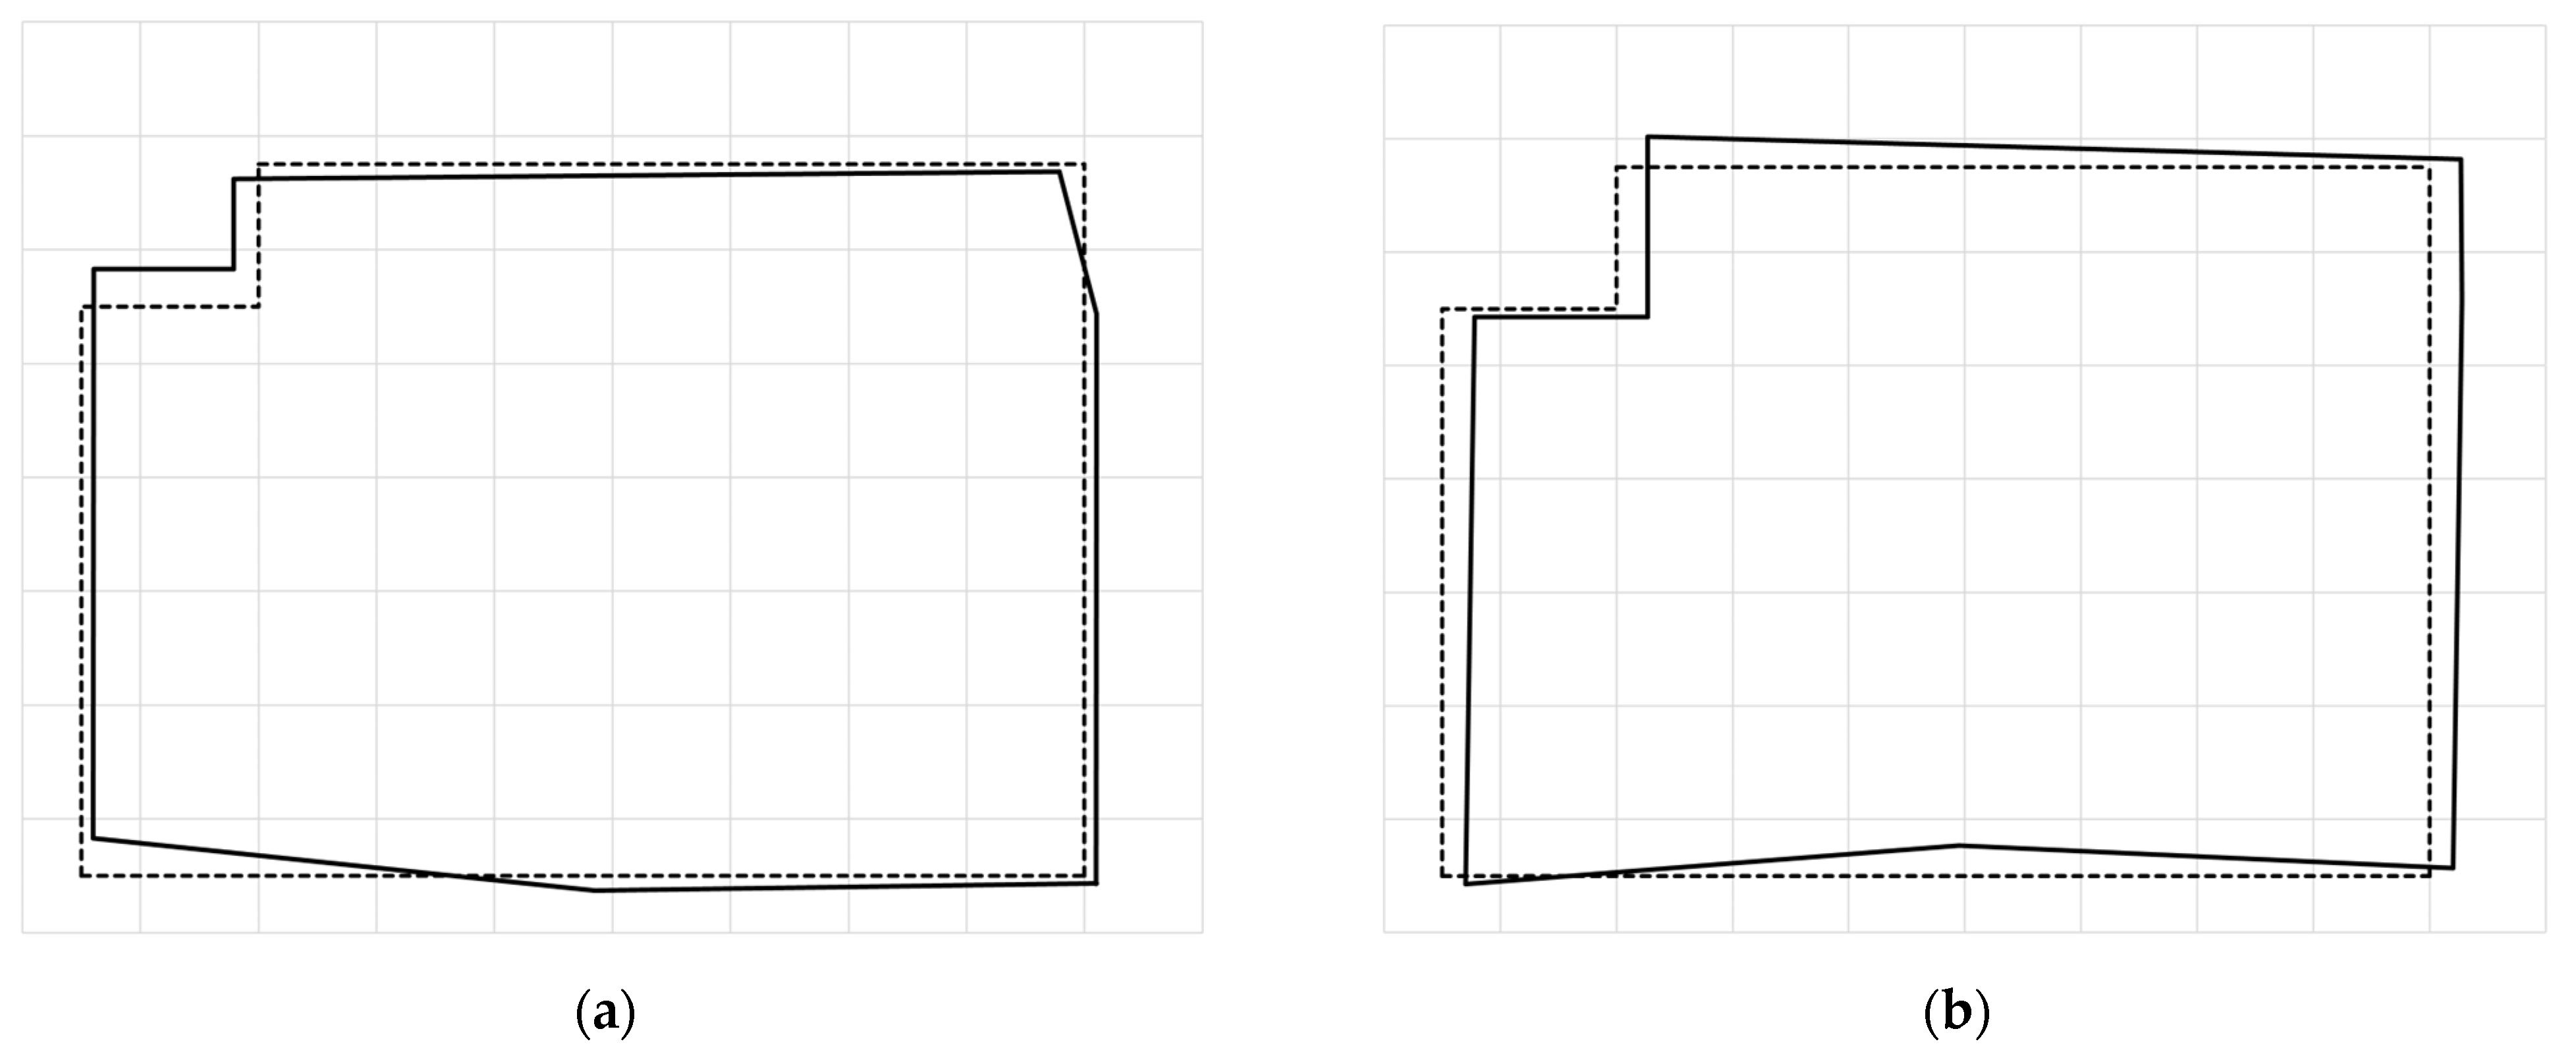
The measurements were taken on 18 December 2020 at 09:15 and ended on 15 January 2020 at 18:00. The temperature range during the measurement period was approximately 26 to 30 °C, during mild temperatures and light winds. The experiment was carried out at 2 h intervals to examine temporal variations in the modal parameters. Despite this, the recorded signals exhibited only a minor fluctuation of approximately ±2% in the first mode frequency, indicating the consistent performance of the building throughout the testing period. Therefore, the results presented here are based on the readings from the initial setup. These minor discrepancies observed in Stone Town buildings, characterized by heavyweight construction with stone walls measuring 0.5 to 1 m thick, serve as substantial barriers against varying climate conditions. Additionally, factors such as the masons’ construction skills, types of stones used, stones’ configuration, and thickness of lime mortar applied contribute to this effect.
The AVT reveals the natural frequencies for all three orientation axes from the periodic time series measurements, demonstrating the consistent amplitude patterns at successive time intervals along the Y- and Z-axis of the building (Figure 7a). At the same time, the X-axis is characterized by a shorter dimension of the structure and experiences a higher degree of amplitude. The FFT is computed independently for each of the three axes (X, Y, and Z). The vertical vibration effect was eliminated via the H/V spectral ratio derived by dividing the amplitude of the horizontal axis by the corresponding vertical axis data considering the synchronized specific frequency ranges (Figure 7b,c) [39,40]. The H/V spectral ratio reveals the distinct resonating frequency peaks at different floor levels, directions, and at the location of AVT deployment, as delineated in Figure 7d. Meanwhile, the average peak resonance frequencies were computed for each floor of the building, extending to the exploration of all four historical buildings of Stone Town.
The H/V spectral ratio of the Old Customs building reveals the distinct resonating frequencies at various floor levels. On the second floor, the average peak resonating frequency (fr(avg)) ranged from 4.9 to 4.2 Hz, while the third floor exhibited between 5.3 and 4.7 Hz on the X- and Y-axis (indicated by solid magenta line and cyan dashed line) of the building, indicating the structure may respond differently to ambient waves propagating in different directions, characterized by unsymmetrical plans, anisotropy, lower in-plan wall area ratio, and higher stiffness of the utilized construction material. In contrast to the X-axis fr(avg) depicting the sharp peaks, the Y-direction implies a less pronounced fr(avg) with a more distributed range, as illustrated in Figure 8a,b.
On the other hand, compared to the structural shorter dimension (X-axis), the fr(avg) recorded at the longer dimension, i.e., the Y-axis, yields lower peaks, owing to which the cracks and material deterioration are much more significant. Likewise, the fr(avg) for the Old Dispensary building was identified in the X and Y directions as 4.2 Hz and 3.9 Hz for the second floor and 4.6 Hz and 4.3 Hz for the third floor, demonstrating the increasing frequency trend at higher floor levels in conjunction with the decremental variation in the in-plan wall area ratios with the higher rigidity of the structure (Figure 9a, b). Meanwhile, for the Tippu Tip building, the fr(avg) was explored on the second and third floors, revealing a range of 3.2 and 2.8 Hz and 4.0 and 3.4 Hz along the X- and Y-axis orientations, yielding the least resonance frequencies among all four structures due to the poor existing condition of the building, which causes lower stiffness and trivial rigidity, making it highly prone to structural damage in case of any seismic events (Figure 10a,b). Therefore, keeping in view of infused ambient vibrations, the fr(avg) is found to be in extremely vulnerable ranges and necessitating immediate steps for initiation of structural conservations. Similarly, for the Palace Museum building, the fr(avg) on the second floor was identified as 4.1 and 4.3 Hz, while the third floor exhibits the range of 4.4 and 4.8 Hz in the Y- and X-axis, respectively (Figure 11a,b). The overall results of the Ambient Vibration Test (AVT) provide significant information that can be used to estimate the degradation process of the structure in the future.

5.2. Mode Shape

To capture the specific patterns of the structural motion that undergoes vibration at fr(avg), the modes shapes were developed for all four investigated historical buildings, revealing how different parts of the structure move relative to each other. The mode shape reveals the non-uniform structural deformations attributed to the anisotropic distribution of the wall and floor thicknesses, signaling heterogeneity in mass and stiffness, as indicated by the black solid line. Moreover, the displacement along the X- and Y-axis could lead to the relative motion between the floors, which may create a higher degree of distress in the building, especially during intense seismic or wind events. Both mode shapes (first and second) of the Old Customs building indicate a significant non-uniform deformation, as indicated by a solid line along both axes against the existing layout (dashed line) of the structure, as indicated in Figure 12a,b. Under any seismic event, if these deflections occur simultaneously, it may result in twisting motion under the torsion mode that may subsequently lead to structural failures. Contrarily, the mode shapes (first and second) for the Old Dispensary building depict the more pronounced deformation along the X- and Y-axis, as highlighted by a solid line against the dashed line (Figure 13a,b). Moreover, the prevalent orientations of the solid line highlight the unsymmetrical distribution of the stresses, signaling the vulnerability of torsional twist.
On the other hand, the mode shape of the Tippu Tip building in the 1st mode shows the sharp peaks of a deformed line against a dashed line along the X-axis and Y-axis, respectively, indicating the significant variation in mass and stiffness distribution characterized by changing wall thickness. On the other hand, the overlapping alignment was observed on the second mode, highlighting the deformations more significantly along the Y-axis (Figure 14a,b). Likewise, the mode shapes of the Palace Museum building were explored in the first and second modes, indicating uniform deformation patterns with a considerable displacement in the existing structure (Figure 15a,b). In the first mode, the magnitude of deformation amplified along the X-axis, while significant displacement was observed along the Y-axis in the second mode. In case of any seismic event, the non-uniform distribution patterns along the X- and Y-axis for both floors may result in a heterogeneous distribution of external force that may further damage the degrading structural integrity. The overall dynamic response of the structure is substantially impacted by the deformed patterns of the mode shapes. This intensifies the depreciation effect of the building, particularly as these patterns vary across different floor levels [41].

5.3. Damping Ratio

The damping ratio in historical structures holds crucial importance as it offers insights into the energy dissipation characteristics, yielding discernible patterns and trends along different orientation axes. The damping ratios typically reflect the amount of energy dissipated following oscillations. The half-power bandwidth method was applied in this study to assess damping in a system based on experimental response curves. This method relies on the frequency–response curve and entails identifying the maximum amplitude associated with the natural frequency of the system. Utilizing the half-power bandwidth method, structural damping parameters can be calculated via the frequency response function (FRF) [42,43,44,45,46].
The range of damping ratios in the first three modes of vibration along the X- and Y-axis are presented in Table 2. Significantly, the pattern of elevated natural frequencies with higher modes was observed. The Tippu Tip building displays the lowest damping ratio, ranging from 1.35 to 2.21%, indicating a higher level of structural vulnerability as it can deform more easily under the dynamic load. On the other hand, the Old Customs building exhibits the highest damping ratio, ranging from 2.16 to 4.45%, implying comparable stiffness and mass distributions. The observed differences in the responses along both directions indicate the presence of anisotropic characteristics, which could be attributed to an asymmetrical design or uneven mass distribution. Comprehending these characteristics is crucial for structural health monitoring and guaranteeing that seismic design considerations adequately reduce resonance risks during earthquakes [47,48,49].

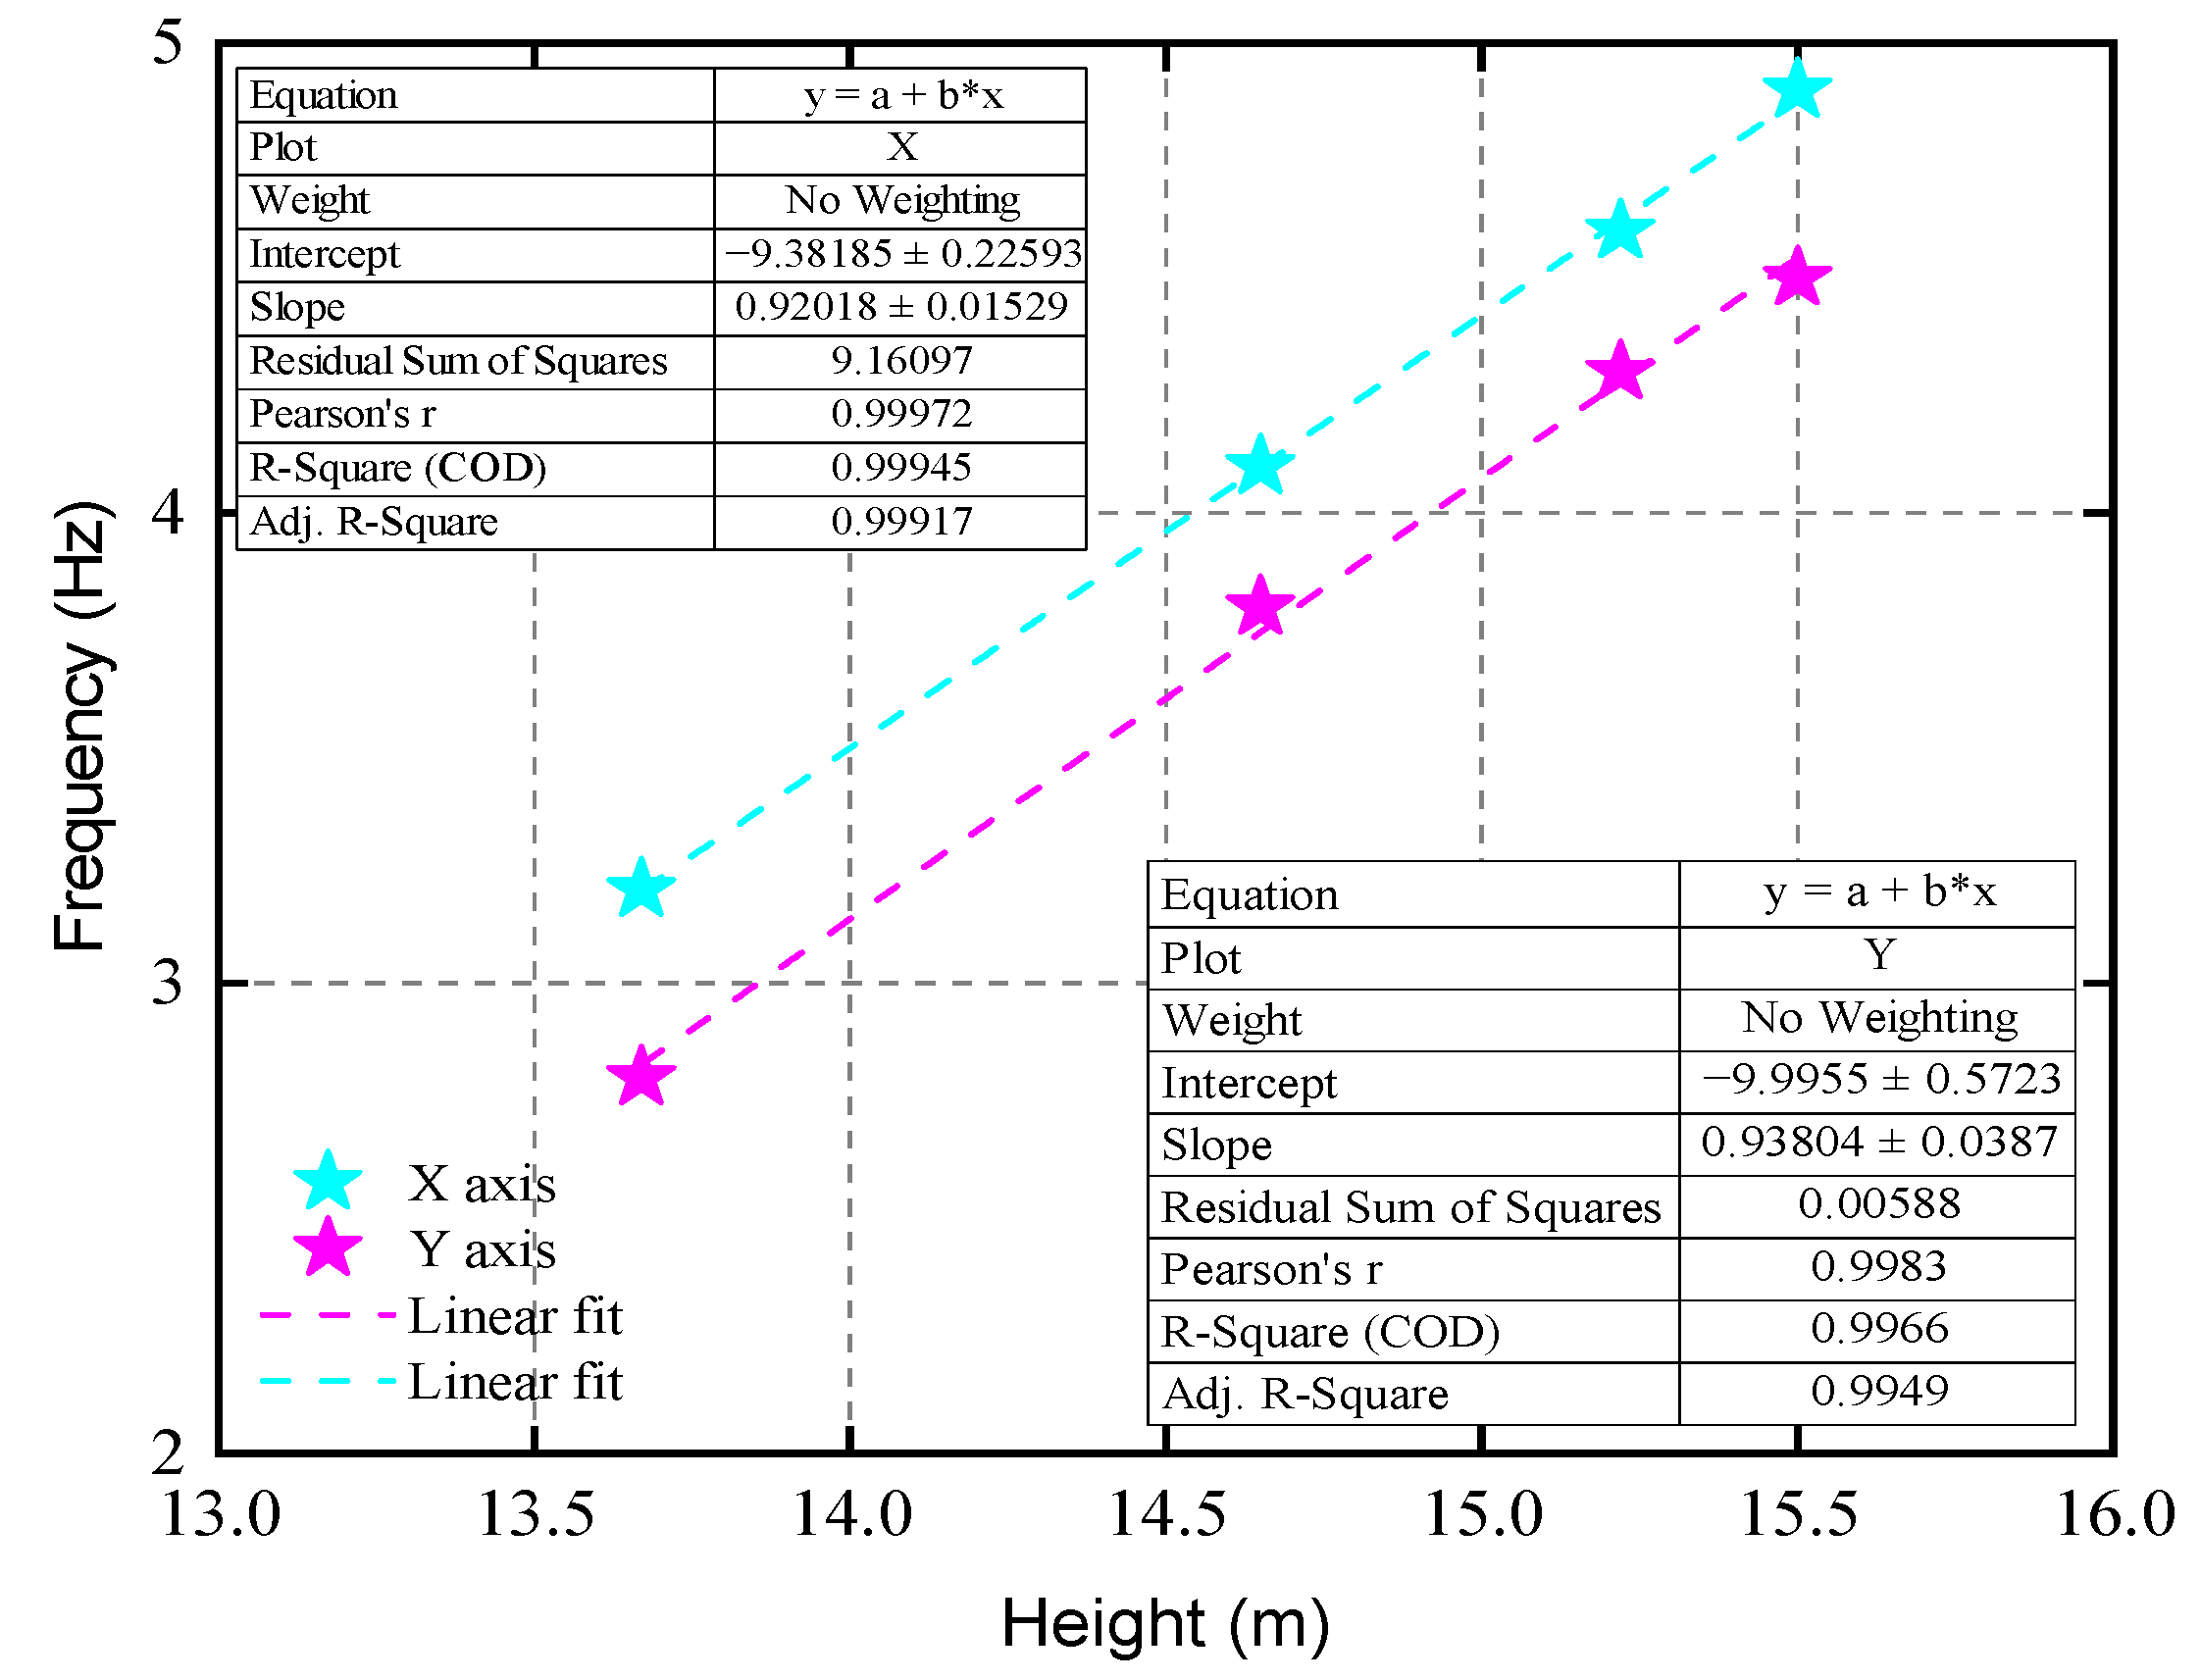
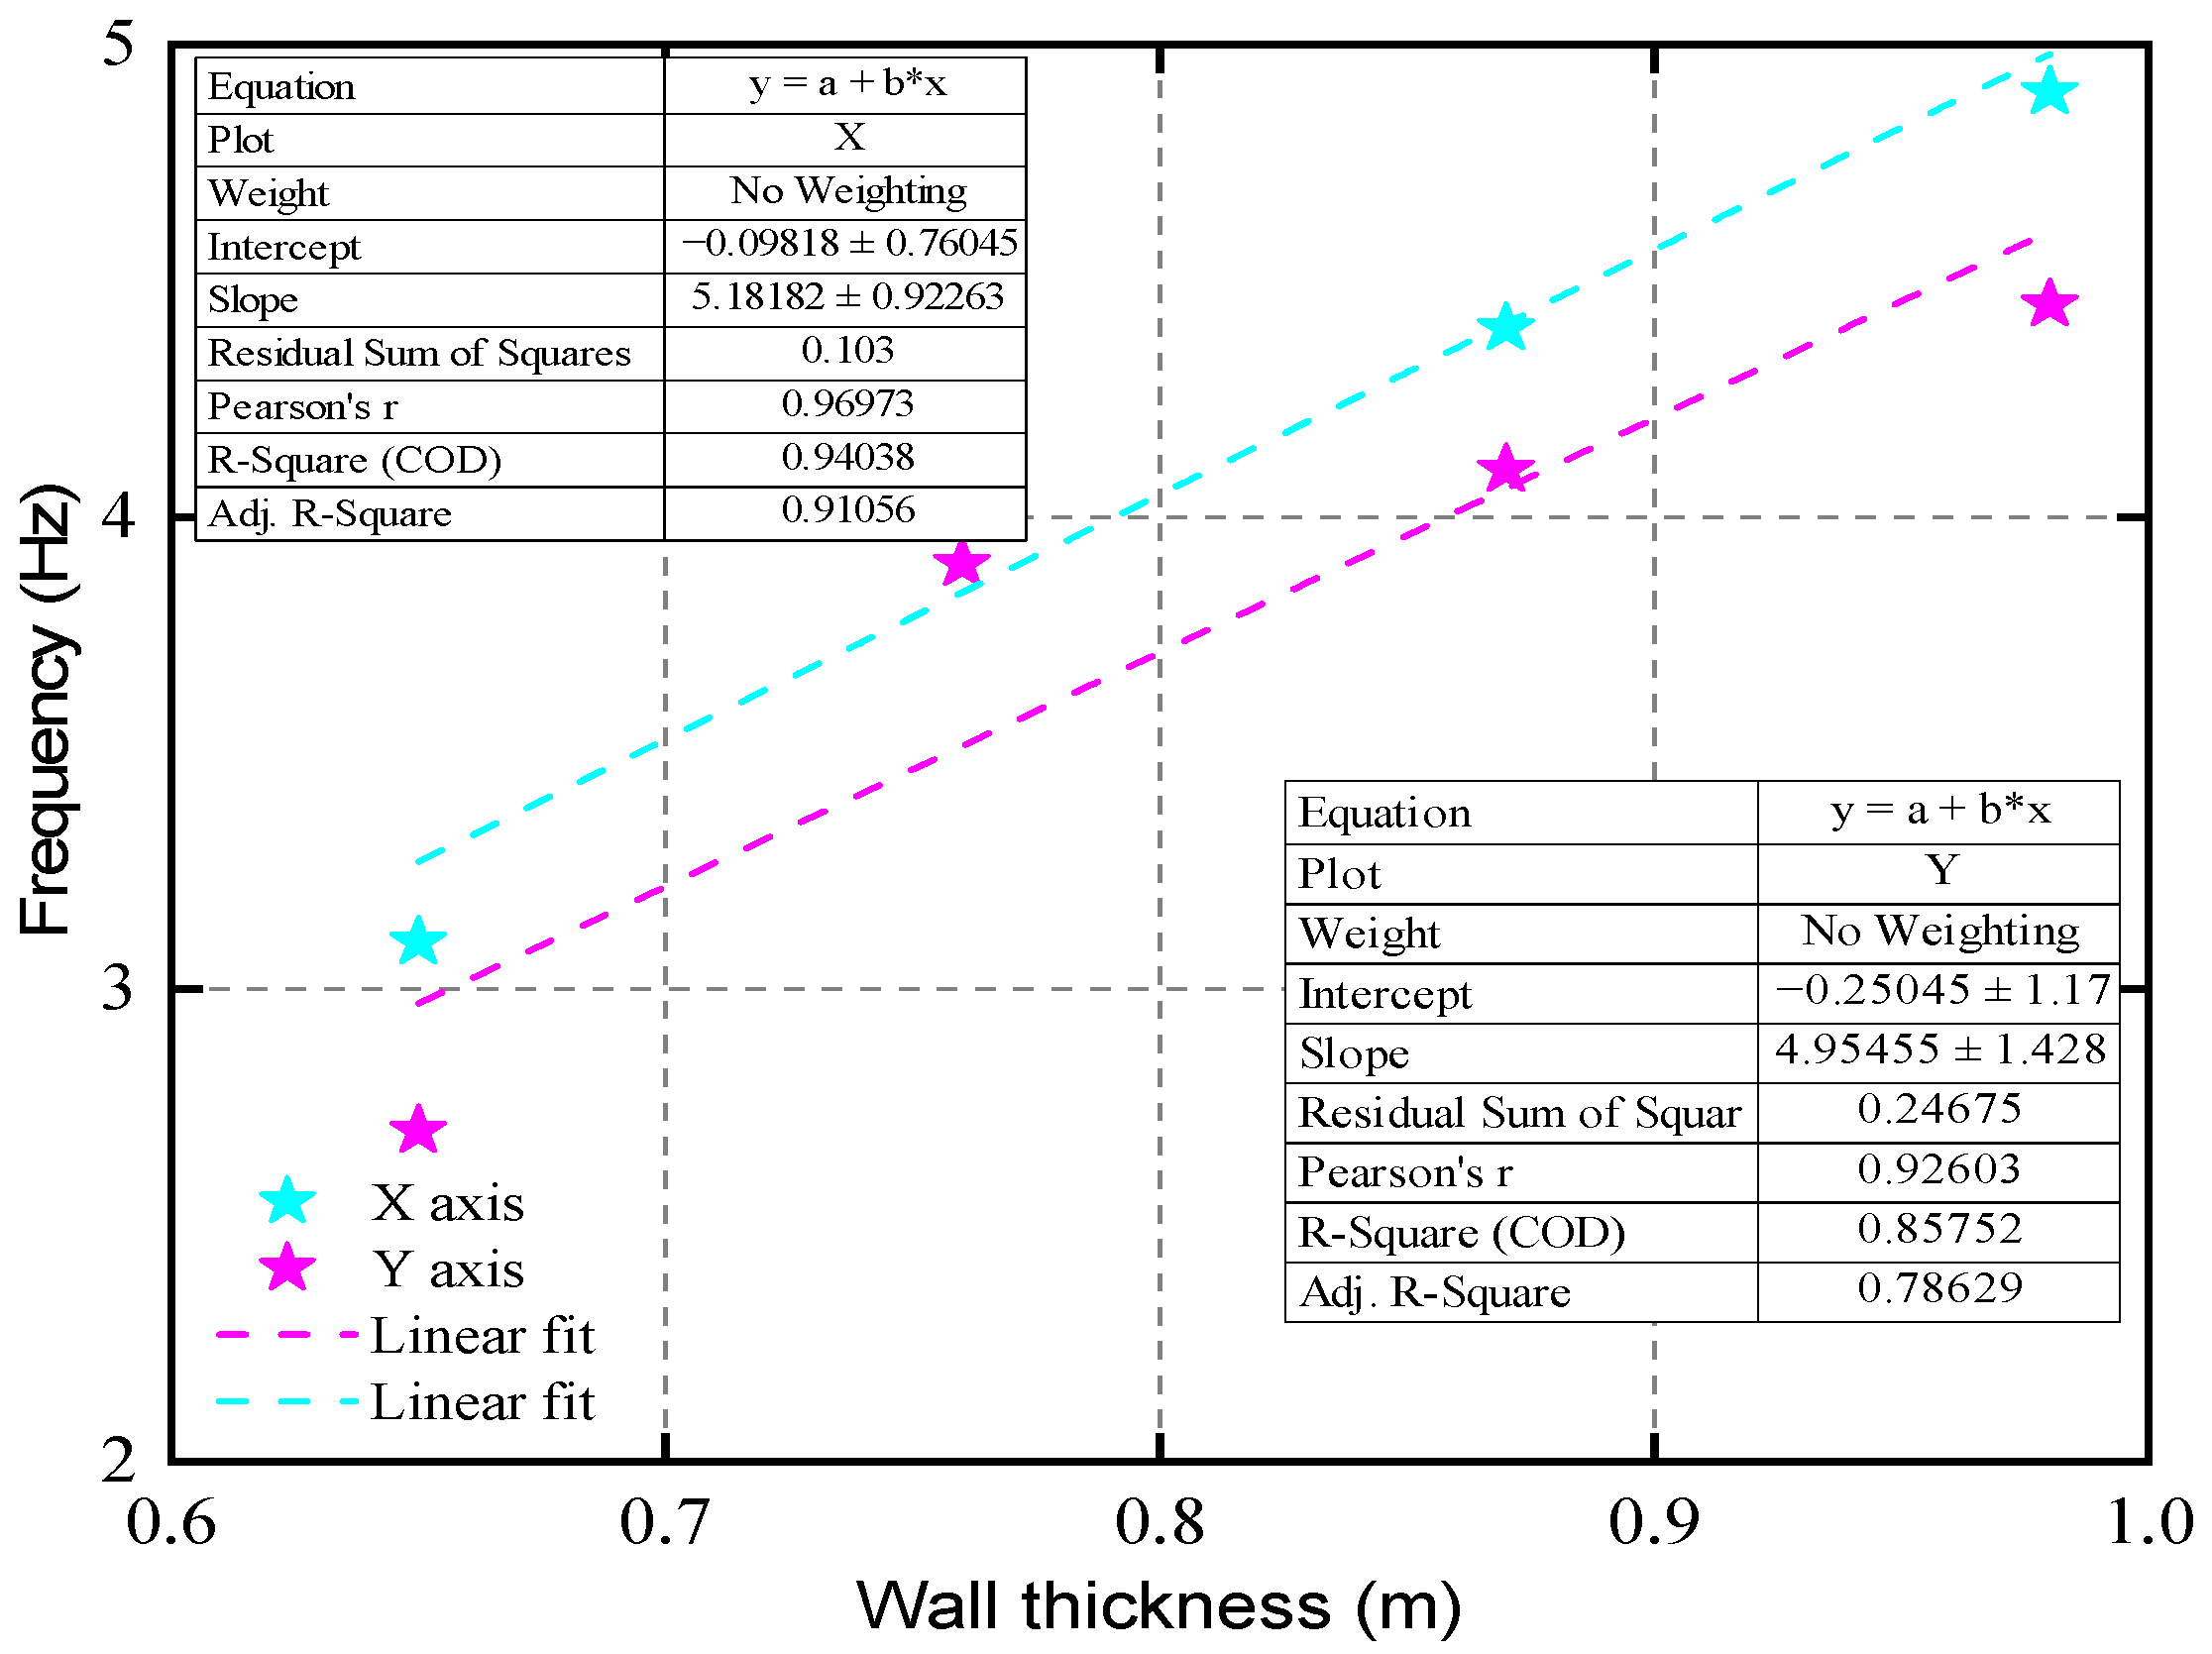
5.4. Correlation of Natural Frequency with Structural Parameters

The empirical correlations were formulated to evaluate and establish the relationship between the natural frequency and the geometrical parameters, including the structural height and wall thickness, respectively (Table 3). The regression analysis performed on all four historical structures reveals distinct patterns and trends in correlation coefficients. The results reveal a positive correlation between geometric properties and natural frequency, which may be peculiar to the construction style or materials used in these historical structures. The natural frequency varies directly proportionally to the height of the structure and exhibits a steep slope with parallel alignment for the X- and Y-axis, respectively, having R2 ranging as 0.99 (Figure 16). On the other hand, in contrast to the X-direction, the natural frequency relationship with wall thickness is stronger in the Y-direction, as indicated by the steeper slope of the regression line with R2 ranging between 0.85 and 0.94 (Figure 17). This could be due to directional variations in construction or possibly the result of different load-bearing roles of walls in the X and Y orientations. Both sets of geometrical parameters exhibit a direct relation with geometrical parameters and could be used for prompt pre-estimation and pre-evaluation of the natural frequencies for traditional masonry structures [50].

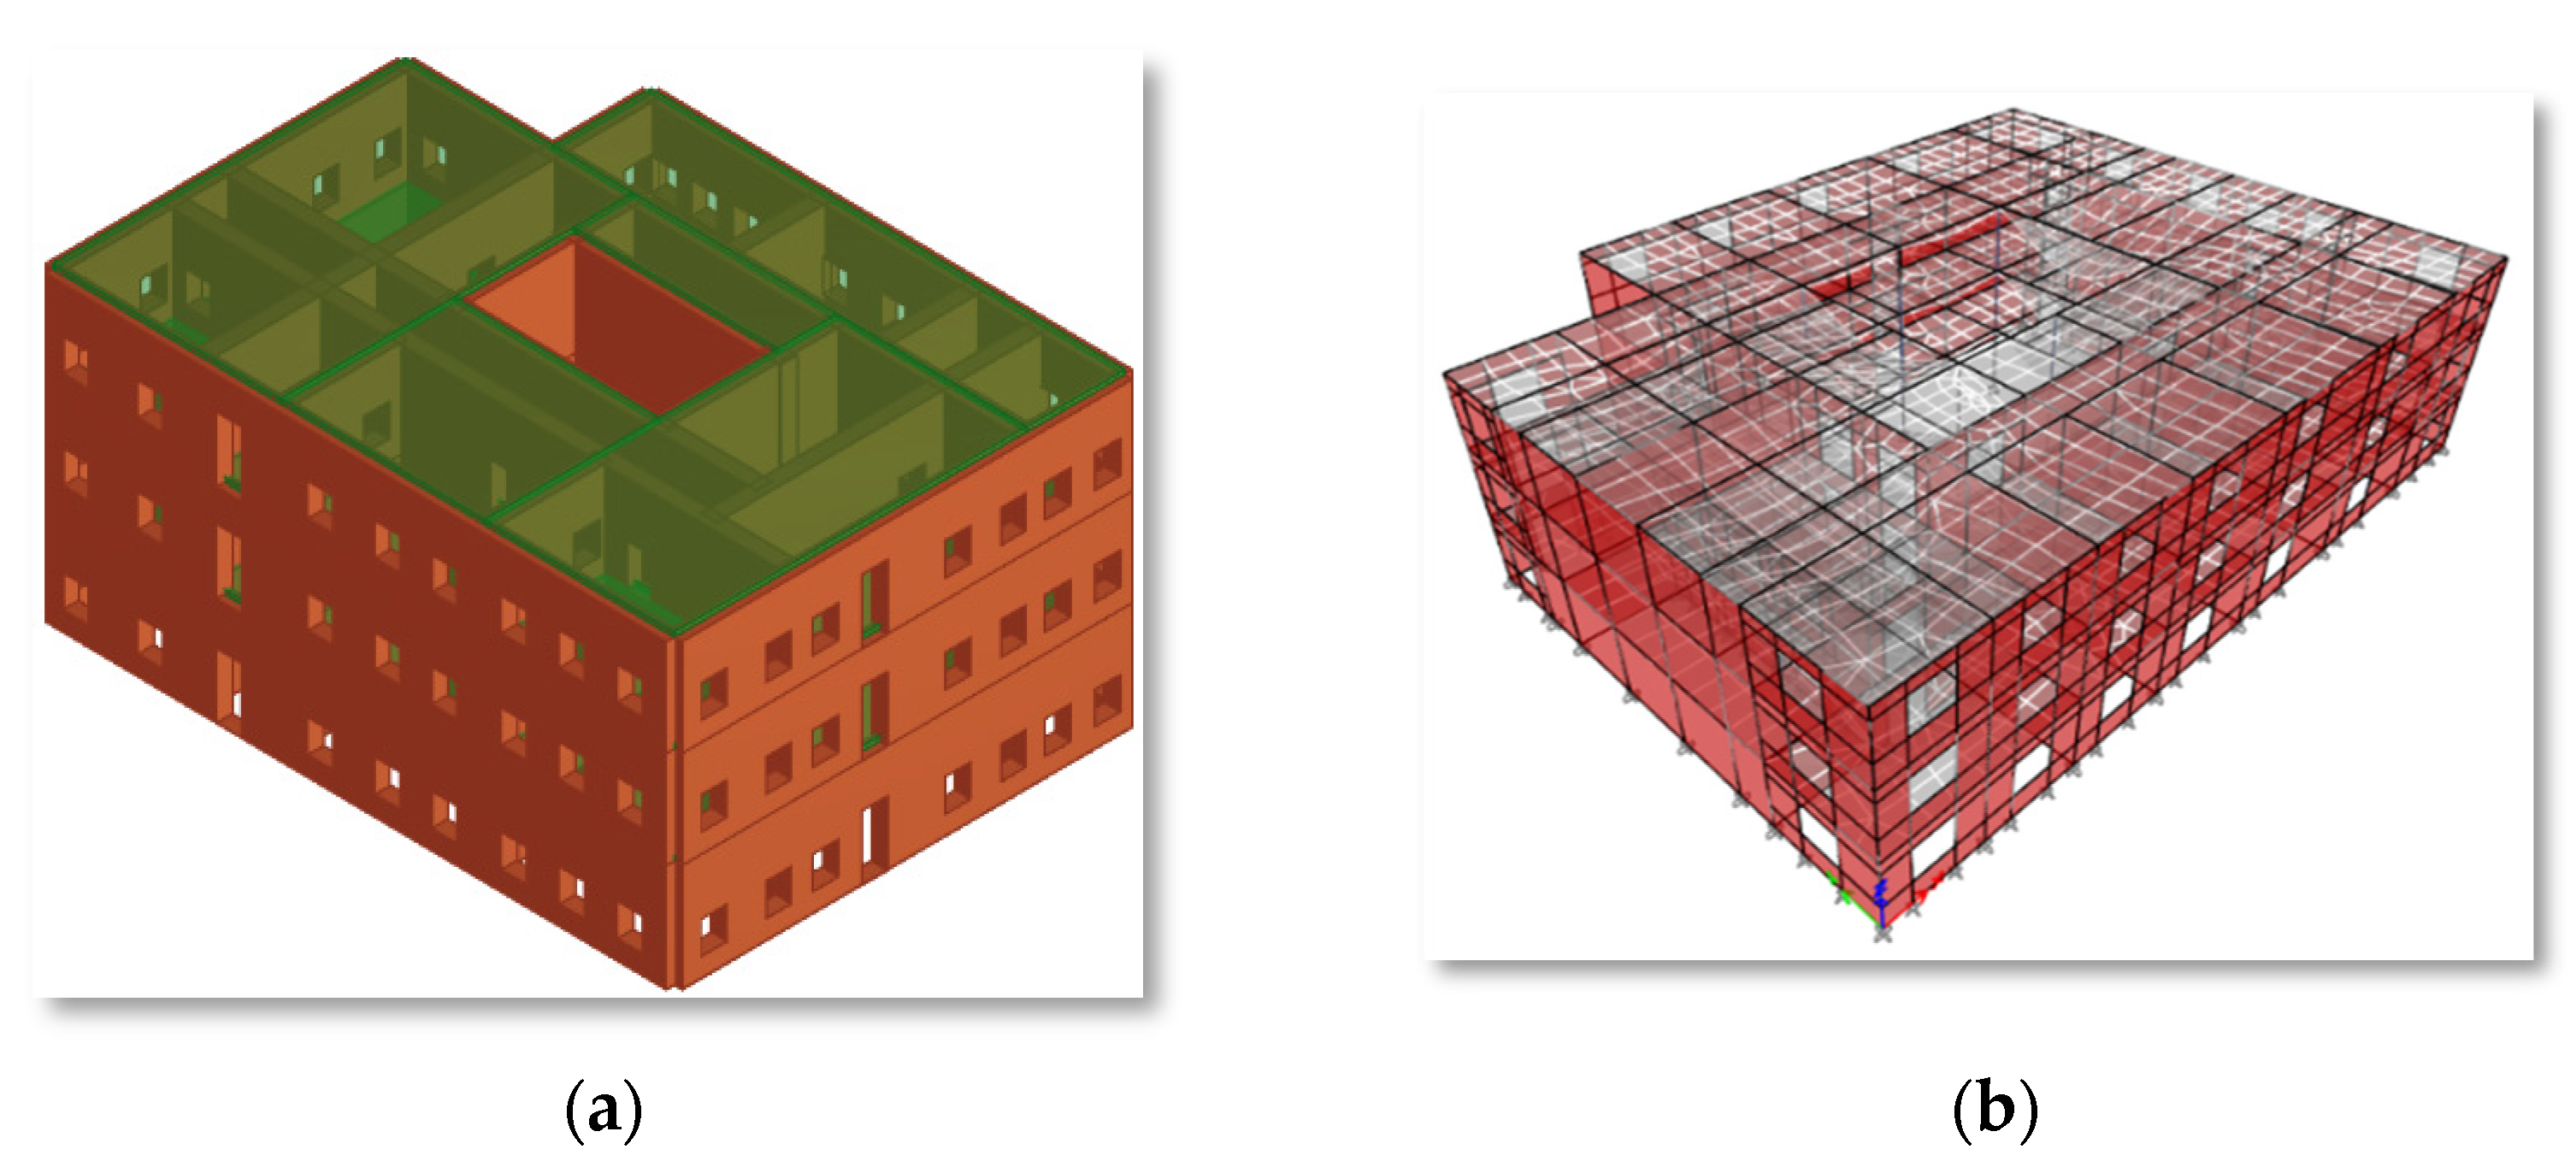
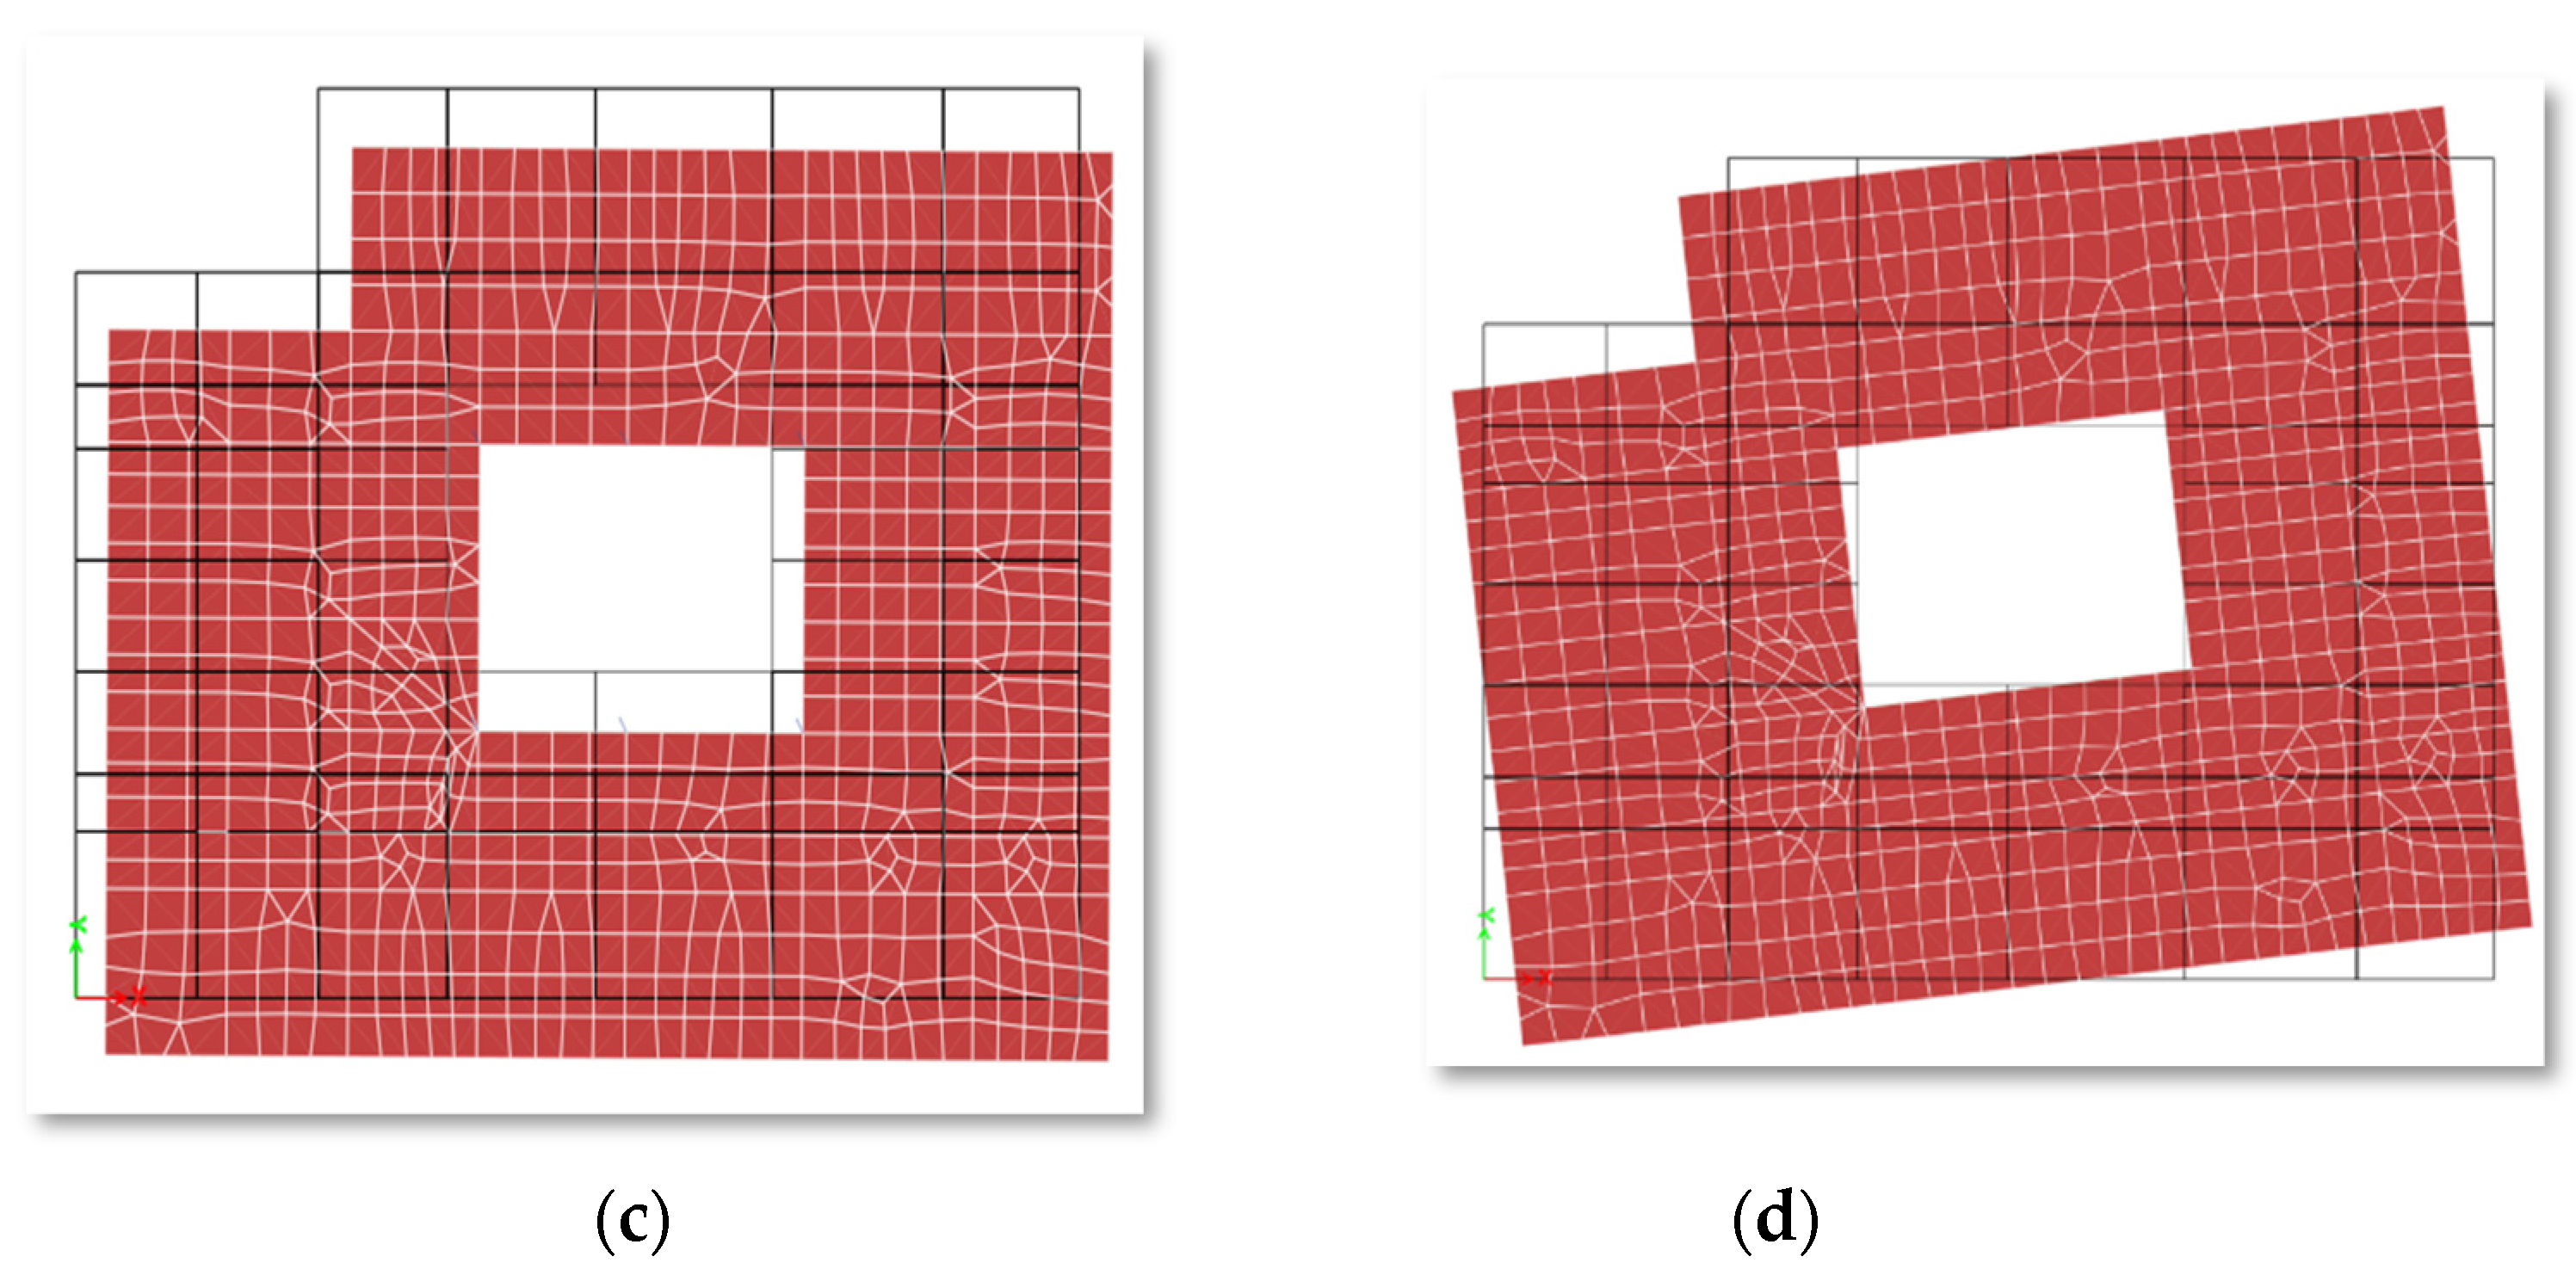
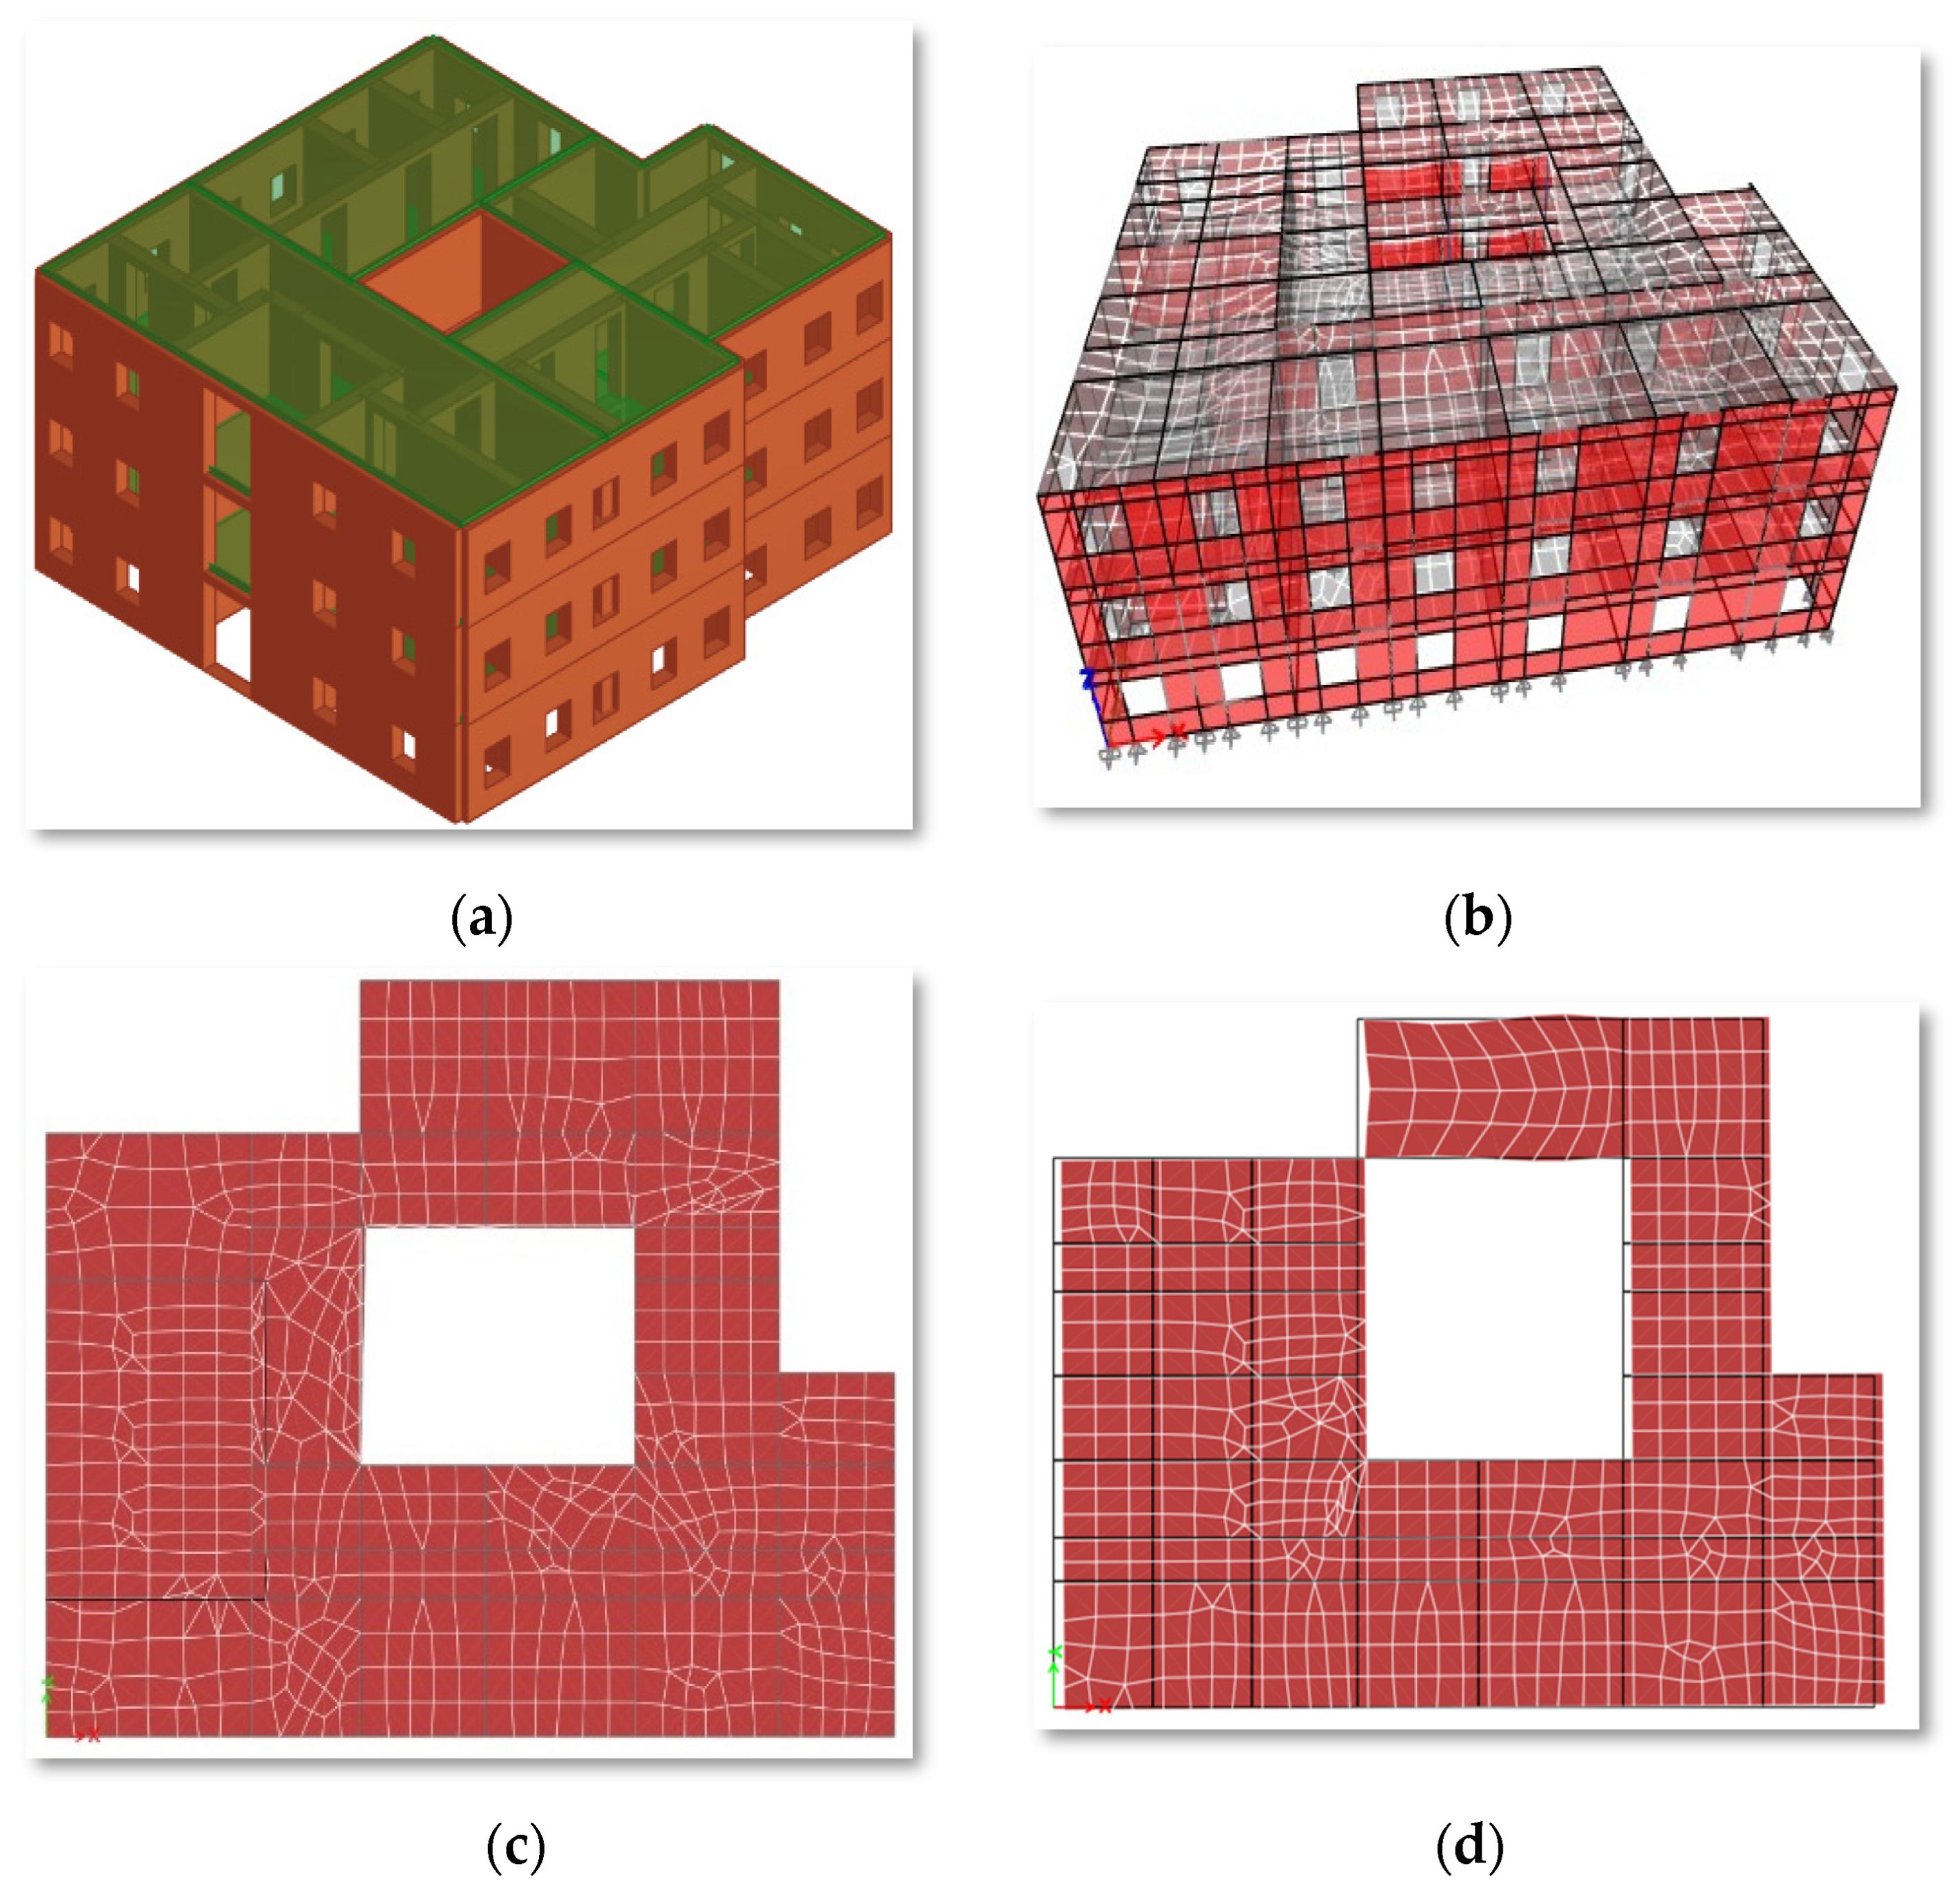
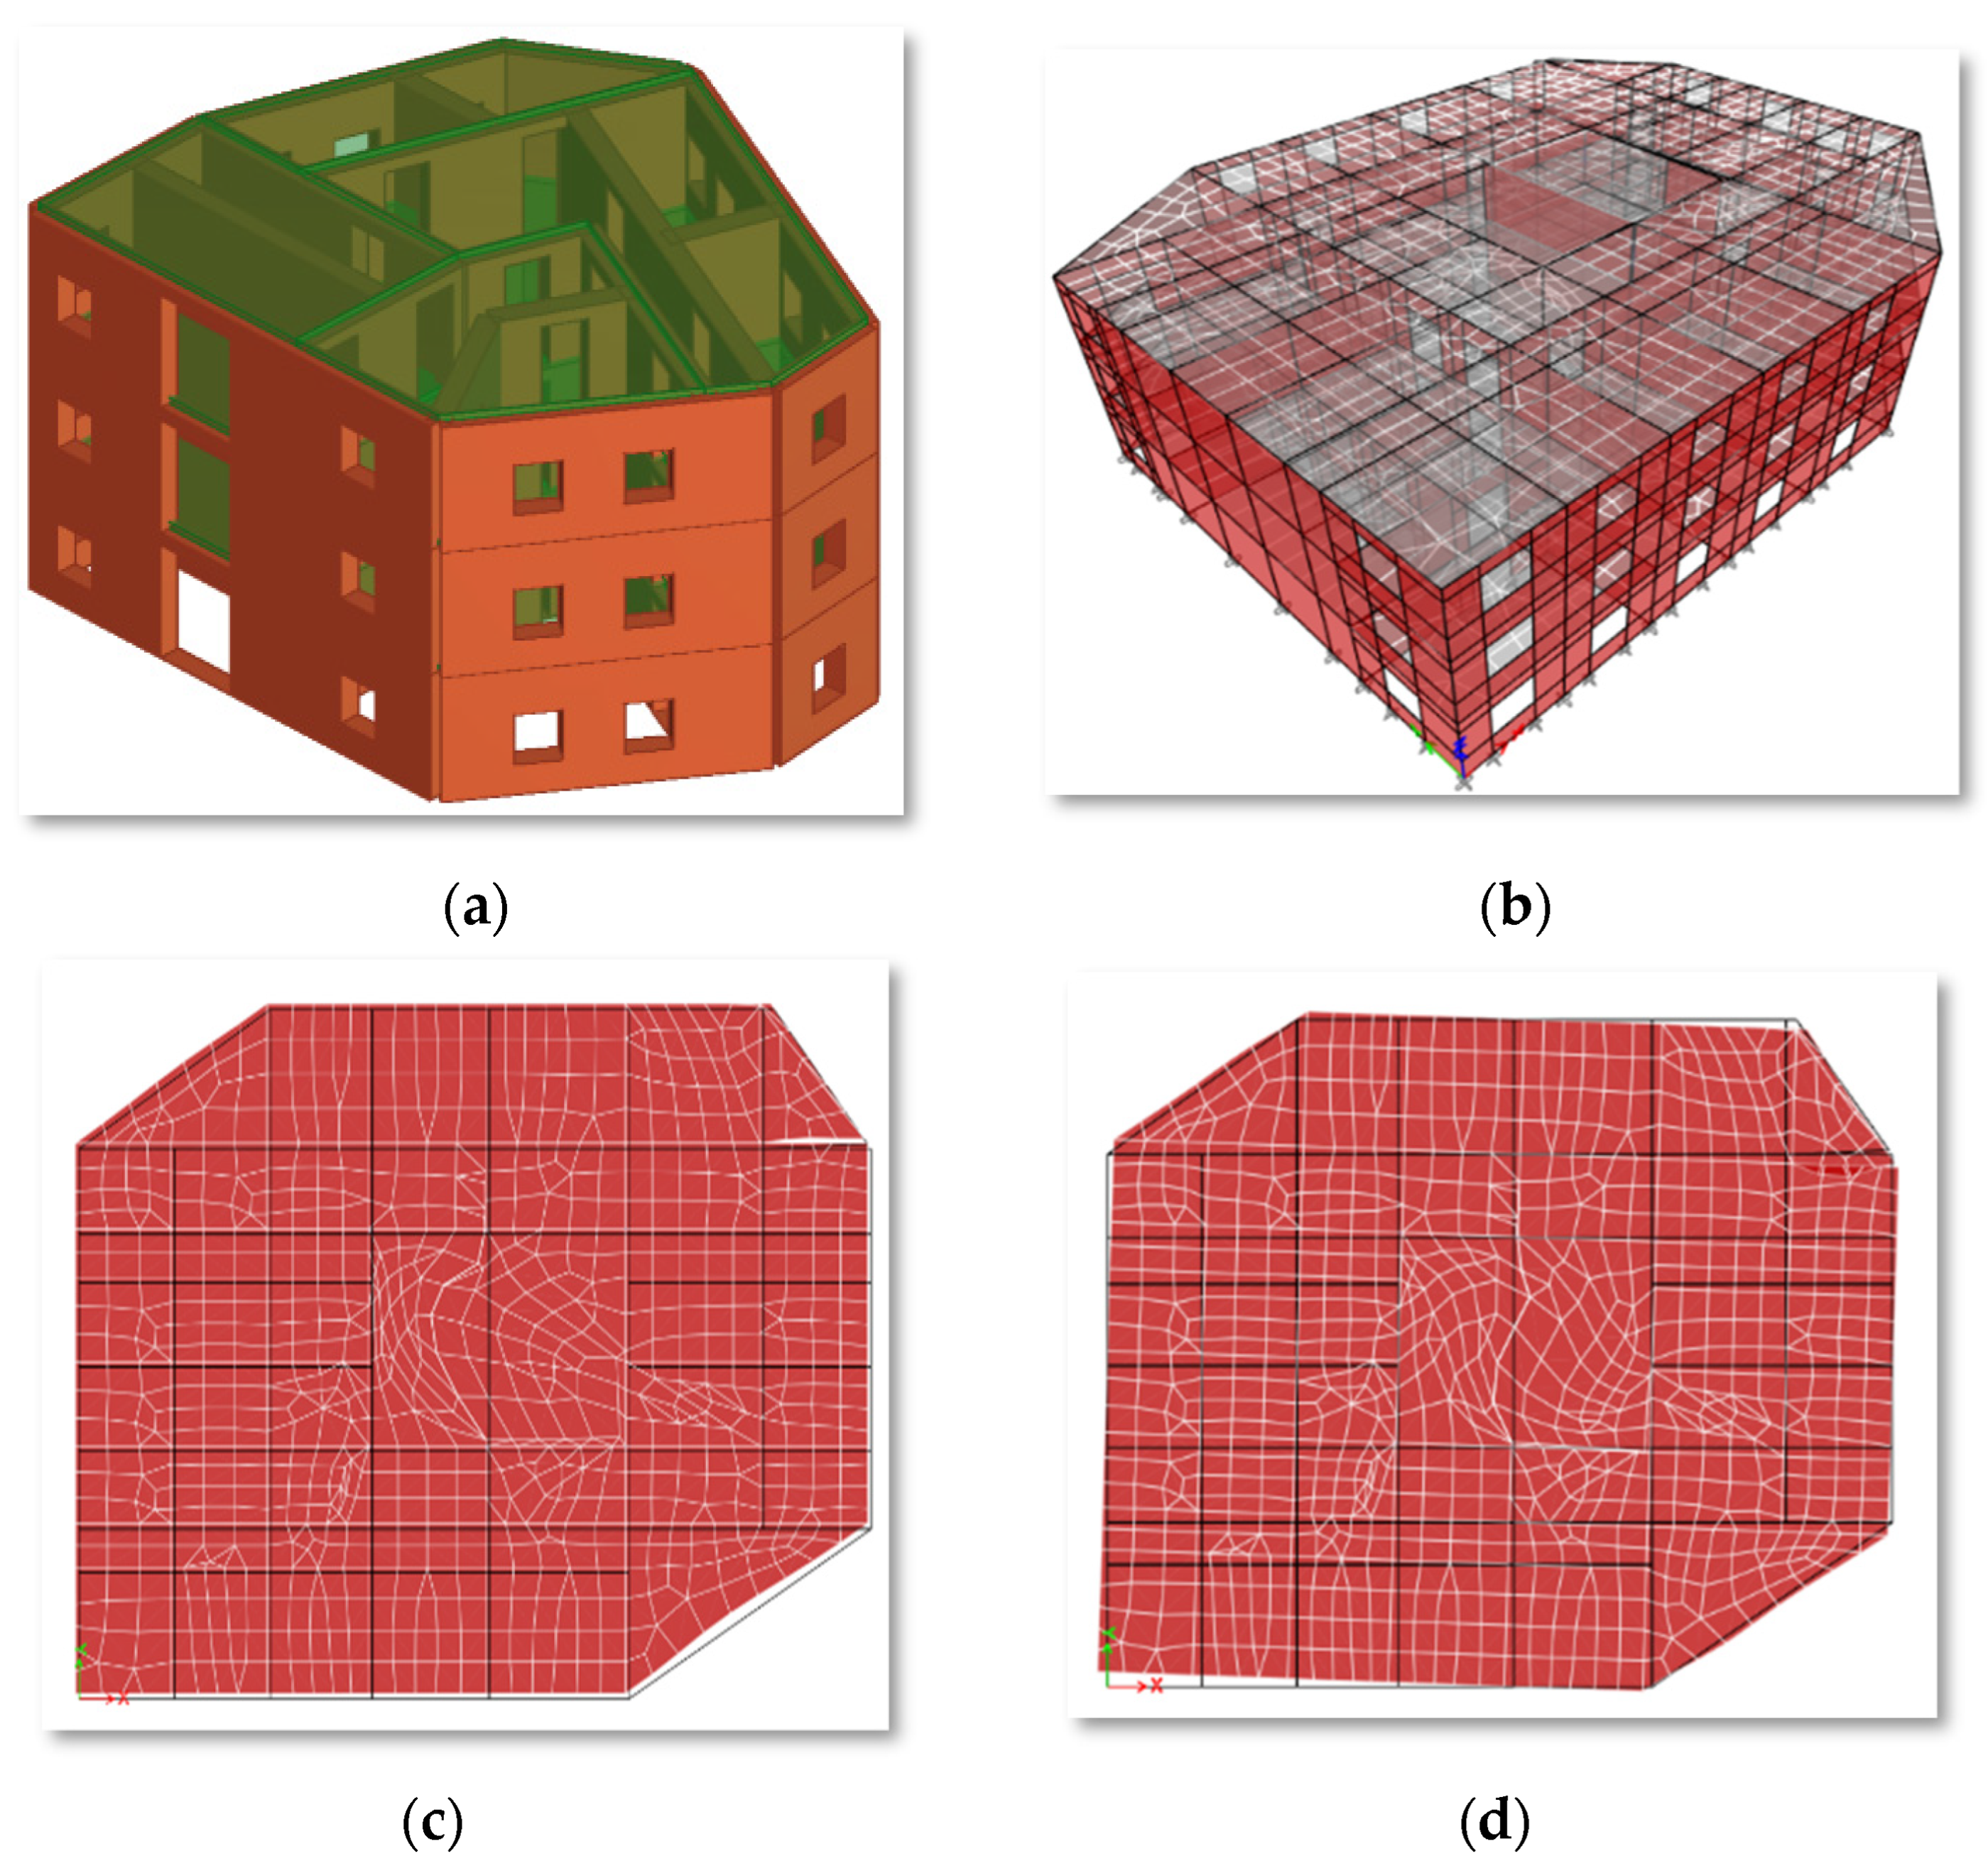
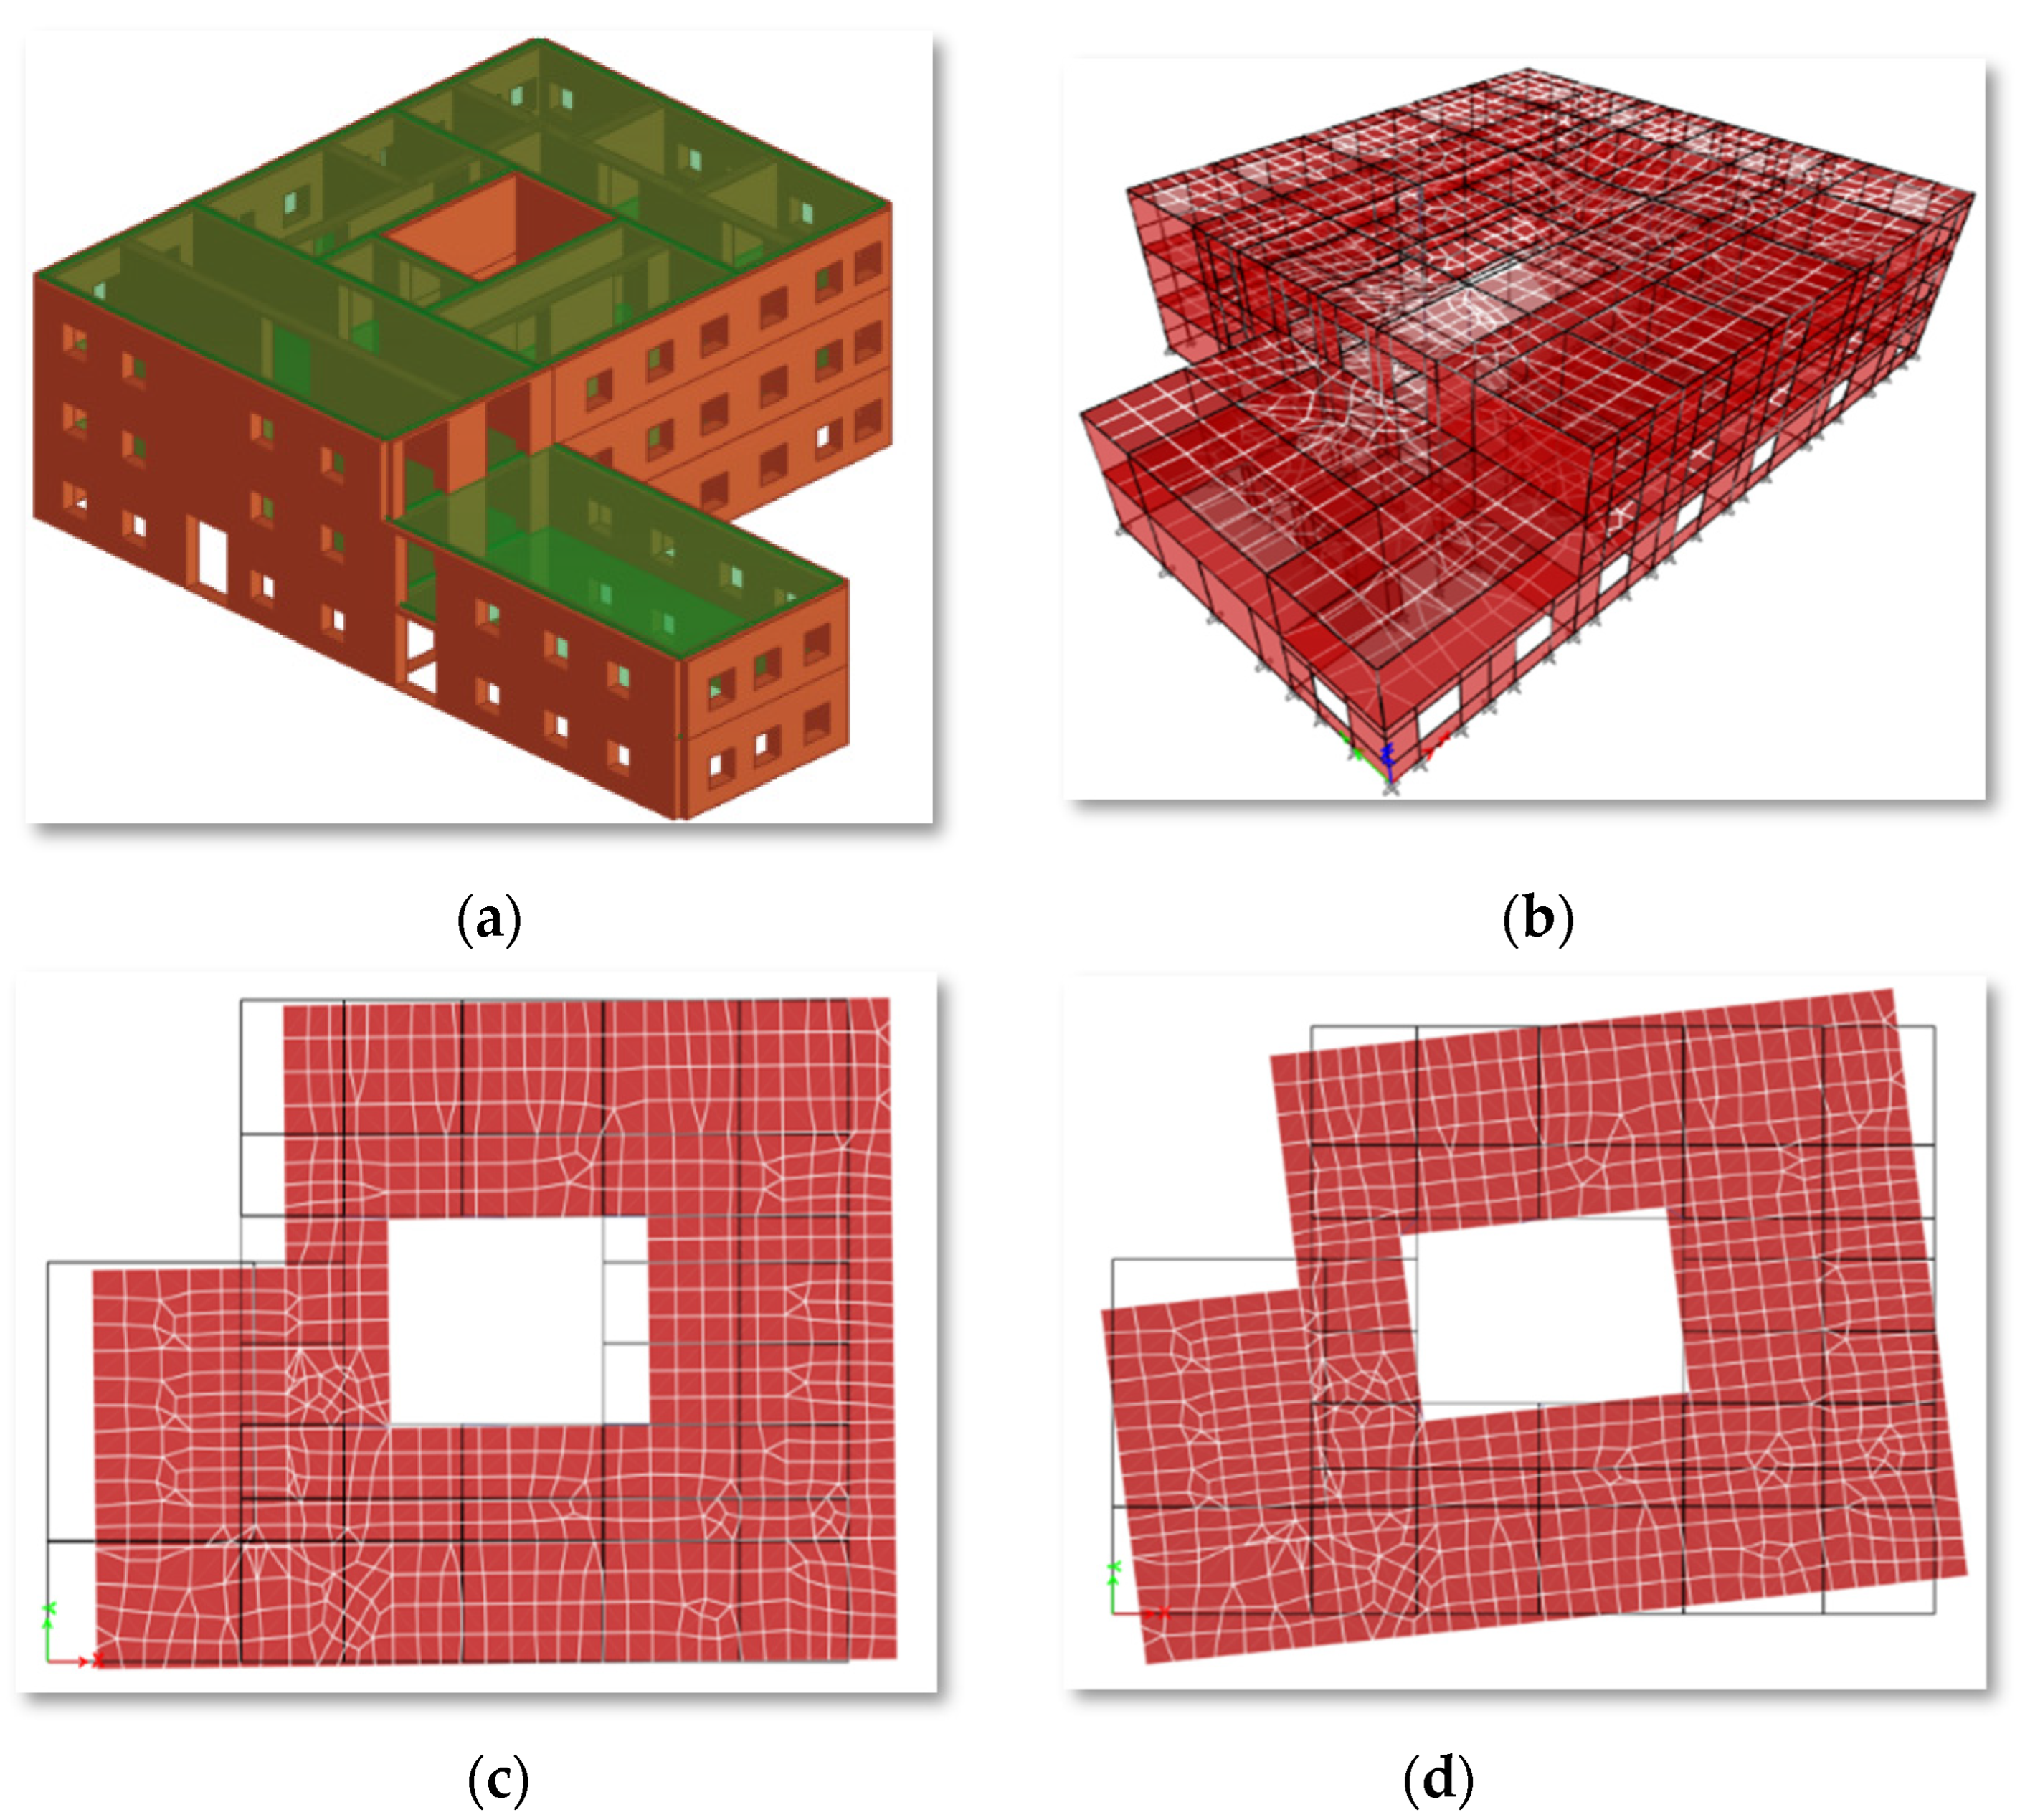
6. Numerical Modal Analyses

The modal analysis was executed through EVA to extract the dynamic properties of four historical buildings. The structural representation of the investigated historical buildings was achieved using the Sap2000 software, employing the finite element method [51]. The construction material was investigated in terms of elastic modulus (E), Poisson ratio (ν), unconfined compression strength (UCS), and density for the masonry block stone, as well as mortar, which was subsequently integrated into the EVA modeling (Table 4). The boundary conditions were established, considering the environmental condition of buildings, with the assumptions including: (1) all floors were considered a rigid element; (2) walls were considered a load-bearing component to develop the 3D model.
The natural frequencies and percentages of the participation of masses for these 10 modes for each building are delineated in Table 5. The structural natural frequency and corresponding modal participation factors along the X- and Y-axis (Mx and My) indicate the magnitude of the structural mass contribution across the various mode levels. The Old Customs building exhibits a wide range of natural frequencies (f) ranging from 4.1 to 11.9 Hz, reflecting heterogeneous structural mass distributions, while My accounts for 94.32% in mode-1, evincing the susceptibility of the principal response likely to occur along the Y-axis. Meanwhile, natural frequencies of the Old Dispensary building under various mode levels fall in the range of 3.8 to 5.9 Hz highlighting the significant participation of mode-2 in the Y-direction (My), accounting for 51.18% mass contribution.
On the other hand, the frequency range of the Tippu Tip building ranges between 2.4 and 4.9 Hz with a max 82.52% of My in mode 1, indicating vulnerability to strong lateral deformations. Likewise, the building of the Palace Museum exhibits frequencies ranging from 3.8 to 8.3 Hz, and mode-1 demonstrates significant involvement in the Y-direction, accounting for 84.74% of the total structural mass. Conclusively, the first mode tends to have higher Mx and My at the corresponding frequency ranges between 3.8 and 4.1, indicating that the primary mode of vibration is significant for each structure’s dynamic behavior. In addition, the primary modes are critical for the seismic and dynamic analysis of the buildings due to their high Mx and My. The developed building model and the corresponding dynamics of mesh triangulation in pre and post-simulation of dynamic forces for each building are delineated in Figure 18, Figure 19, Figure 20 and Figure 21. The Figure highlighted in red indicates that the mode shape of the max vibrations, characterized by a converged triangulation network at various locations, signals the maximum stress concentrations, which is crucial for understanding the overall dynamic behavior of the structure.

6.1. Validation of Results

The average natural frequency predicted via numerical modeling yields a considerable association with the actual field data derived from the AVT method. The numerical results show a consistent pattern of lower natural frequencies compared to those obtained from AVTs, with the percentage differences ranging from 5.8% to 8.6% in the X-direction and 7.1% to 11.1% in the Y-direction, as shown in Table 6. The difference is attributed to the inclusion of non-structural elements during the development of the building model, which leads to the underestimation of the natural frequencies. This variation is crucial as it underscores the inherent discrepancies that can arise between experimental measurements and theoretical predictions.
In addition, the prediction results were quantified using KPIs that include the determination of RMSE, MAE, NSE, and R2, respectively. As displayed in Table 7, the RMSE and MAE in the X and Y orientation axes of the building ranged between 0.29 and 0.3, with NSE and R2 ranging between 0.81 and 0.99, respectively. The KPI indicates that the numerically predicted data yield closer results with an experimentally investigated database, indicating a higher degree of calibration and reliable prediction to assess the dynamic characteristics of the historical building. The accurate exploration of natural frequency data is vital for seismic risk assessment, retrofit planning, and understanding the structural behavior of these buildings and assists the structural engineers and conservationists in preserving the historical value of Stone Town while ensuring modern safety standards.

6.2. Conservation Work Guidelines

In the context of the derived natural frequencies, mode shapes, and damping characteristics from AVTs and numerical models, the comprehensive conservation guidelines for historical structures should emphasize the perpetuation of structural integrity and historical authenticity. Due consideration should be given to fr(avg) to analyze the ambient vibration effectively and accordingly incorporate it into the structural conservation plan to address the anisotropy, asymmetry, and potential weakness due to the lower in-plan wall area ratio. The explored lower frequency peaks highlight the material deterioration and the crack presence, especially in the longer dimension of the structure, and assist in prioritizing the potential areas for material reinforcement and repair. Furthermore, conservation strategies must take into account the non-uniform deformation and anisotropic distribution of mass and stiffness, as indicated by the mode shapes. This consideration is essential to ensure that any conservation intervention does not inadvertently alter these distributions, thereby preventing the introduction of new vulnerabilities. In addition, the eccentric spatial location of max amplitude is critical, indicating the potential torsional behavior during seismic events, requiring reinforcements to mitigate the risk of structural failure. In addition, the retrofitting strategies should incorporate reversible techniques and supplemental damping systems to mitigate the observed low inherent damping ratios. Moreover, the conservation protocols must prioritize the retention of the original mass and stiffness distribution, and any alterations or extensions should undergo rigorous dynamic analysis to ensure compatibility with the structure’s inherent vibrational behavior. Furthermore, capacity building among conservation professionals regarding the implications of dynamic behavior on heritage structures, coupled with community engagement on the significance of these characteristics, will reinforce the overall conservation strategy, thereby safeguarding both the physical and cultural value of these structures.

7. Conclusions

This paper investigates the dynamic characteristics of unexplored historical masonry structures in Zanzibar Stone Town through comprehensive field investigation using AVT and subsequent numerical simulation via FEM, respectively. The fr(avg) for the investigated historical structures was found to be in the range of 2.8 to 5.3 Hz, revealing the peak frequency range for the Tippu Tip building lies in the range of 3.2 to 2.8 Hz, and identified to be extremely vulnerable to collapse in case of any intense dynamic events. Overall, the frequency trend patterns were seen to be lowered along the shorter dimension (Y-axis) of the building in comparison to the longer dimension (X-axis). Meanwhile, the mode shape reveals that the non-uniform deformations signal the risk of structural failure under intense seismic or wind events. The damping ratio was explored, and The Tippu Tip building displays the lowest damping ratio among other buildings, ranging between 1.35 and 2.21%, necessitating the immediate conservation requirement. The empirical relationships between natural frequencies were established with geometrical parameters, including the structural height and wall thickness, revealing a considerable association with R2 ranging between 0.85 and 0.99.
The natural frequencies were predicted using the numerical modeling functioned on EVA using the Sap2000 software, yielding a considerable association with the field investigated data, having percentage differences ranging from 5.8% to 8.6% in the X-direction and 7.1% to 11.1% in the Y-direction, respectively. The accuracy of both results was quantified in terms of KPI yields; the RMSE and MAE ranged between 0.29 and 0.3 while NSE and R2 were between 0.85 and 0.99, resulting in a higher degree of calibration and reliable prediction to assess the dynamic characteristics of historical structure under the ambient vibrations. The appraisal of natural frequencies under the ambient vibration, the derived modes of shape, the determination of damping ratios, and the subsequent numerical validation assist structural engineers and conservationists in creating effective preservation strategies to ensure the on-field application of planned conservation works with minimal intervention.

Author Contributions

Conceptualization, B.S.A. and J.J.C.; methodology, B.S.A., S.O. and K.N.; software, B.S.A. and K.N.; validation, B.S.A. and J.J.C.; formal analysis, B.S.A., J.J.C. and K.N.; investigation, B.S.A. and J.J.C.; resources, B.S.A.; data curation, B.S.A. and J.J.C.; writing—original draft preparation, B.S.A.; writing—review and editing, B.S.A. and J.J.C.; visualization, B.S.A., J.J.C. and S.O.; supervision, J.J.C.; project administration, B.S.A.; funding acquisition, J.J.C. All authors have read and agreed to the published version of the manuscript.

Funding

This research received no external funding.

Data Availability Statement

The data presented in this study were obtained by the authors with the collaboration of the Stone Town Conservation and Development Authority (STCDA), United Republic of Tanzania, and are available from authors upon request, subject to approval by STCDA.

Acknowledgments

The authors extend their gratitude to the Stone Town Conservation and Development Authority (STCDA) for granting permission to conduct the field survey. Additionally, we would like to express our sincere appreciation to the Zanzibar Stone Town Heritage Society (ZSTHS) for their guidance throughout this work. We are also thankful to the University of the Ryukyus Foundation for providing economic assistance to carry out the field survey at Stone Town. Their generous contributions have made it possible to conduct this study and have significantly contributed to its successful completion.

Conflicts of Interest

The authors declare no conflicts of interest.

References

  1. Sheriff, A. (Ed.) The History & Conservation of Zanzibar Stone Town; Eastern Africa Studies; J. Currey: London, UK; Ohio University Press: Athens, OH, USA, 1995; ISBN 978-0-8214-1119-3. [Google Scholar]
  2. Chami, M. Impact of Cultural Heritage Site Attributes to the Tourist Satisfaction in Zanzibar Stone Town, UNESCO World Heritage Site, Tanzania. Afr. J. Hosp. Tour. Leis. 2018, 7, 1–13. [Google Scholar]
  3. Centre, U.W.H. Stone Town of Zanzibar. Available online: https://whc.unesco.org/en/list/173/ (accessed on 18 February 2024).
  4. Makunza, J.K. Restoration of Historic Buildings in Zanzibar. Tanzan. J. Eng. Technol. 2018, 36, 12–22. [Google Scholar] [CrossRef]
  5. Jasiński, A. Colors of Stone Town in Zanzibar: From White to Black and Back Again. Cities 2021, 117, 103309. [Google Scholar] [CrossRef]
  6. Longair, S.; Said, F.; Wynne-Jones, S. Colonialism, Heritage and Conservation: Zanzibari Perceptions of the Collapse of the House of Wonders. J. East. Afr. Stud. 2024, 17, 1–21. [Google Scholar] [CrossRef]
  7. Hendriksen, G.; Ishikagi, K.; Moriniere, L.; Egan, C.; Mochizuki, J.; Hochrainer-Stigler, S.; Mechler, R.; Williges, K. Public Investment Planning and Financing Strategy for Disaster Risk Reduction: Review of Zanzibar; UNISDR: Geneva, Switzerland, 2015. [Google Scholar]
  8. Stockley, G.M. The Geology of the Zanzibar Protectorate and Its Relation to the East African Mainland. Geol. Mag. 1942, 79, 233–240. [Google Scholar] [CrossRef]
  9. Sunara, M.; Banović, I.; Buzov, A.; Grgić, N. Modal and Structural Identification of Historic Bell Tower in Čuntić, Croatia Using Ambient Vibration Testing. Appl. Sci. 2023, 13, 11494. [Google Scholar] [CrossRef]
  10. Shabani, A.; Feyzabadi, M.; Kioumarsi, M. Model Updating of a Masonry Tower Based on Operational Modal Analysis: The Role of Soil-Structure Interaction. Case Stud. Constr. Mater. 2022, 16, e00957. [Google Scholar] [CrossRef]
  11. Ozcelik, O.; Misir, I.S.; Yucel, U.; Durmazgezer, E.; Yucel, G.; Amaddeo, C. Model Updating of Masonry Courtyard Walls of the Historical Isabey Mosque Using Ambient Vibration Measurements. J. Civ. Struct. Health Monit. 2022, 12, 1157–1172. [Google Scholar] [CrossRef]
  12. Magalhães, F.; Cunha, Á. Explaining Operational Modal Analysis with Data from an Arch Bridge. Mech. Syst. Signal Process. 2011, 25, 1431–1450. [Google Scholar] [CrossRef]
  13. Ni, Y.; Lu, X.; Lu, W. Operational Modal Analysis of a High-Rise Multi-Function Building with Dampers by a Bayesian Approach. Mech. Syst. Signal Process. 2017, 86, 286–307. [Google Scholar] [CrossRef]
  14. Yuan, K.; Zhu, W.D. Estimation of Modal Parameters of a Beam under Random Excitation Using a Novel 3D Continuously Scanning Laser Doppler Vibrometer System and an Extended Demodulation Method. Mech. Syst. Signal Process. 2021, 155, 107606. [Google Scholar] [CrossRef]
  15. Yuan, K.; Zhu, W.D. Identification of Modal Parameters of a Model Turbine Blade with a Curved Surface under Random Excitation with a Three-Dimensional Continuously Scanning Laser Doppler Vibrometer System. Measurement 2023, 214, 112759. [Google Scholar] [CrossRef]
  16. Brown, G.; Pretlove, A.J.; Ellick, J.; Hogg, V.; Choo, B.S. Changes in The Dynamic Characteristics of a Masonry Arch Bridge Subjected to Monotonic Loading to Failure. In Proceedings of the First International Conference on Arch Bridges, Bolton, UK, 3–6 September 1995; Thomas Telford: London, UK, 1995; pp. 375–383. [Google Scholar]
  17. Deng, Z.; Huang, M.; Wan, N.; Zhang, J. The Current Development of Structural Health Monitoring for Bridges: A Review. Buildings 2023, 13, 1360. [Google Scholar] [CrossRef]
  18. Luo, J.; Huang, M.; Lei, Y. Temperature Effect on Vibration Properties and Vibration-Based Damage Identification of Bridge Structures: A Literature Review. Buildings 2022, 12, 1209. [Google Scholar] [CrossRef]
  19. Luo, J.; Huang, M.; Xiang, C.; Lei, Y. Bayesian Damage Identification Based on Autoregressive Model and MH-PSO Hybrid MCMC Sampling Method. J. Civ. Struct. Health Monit. 2022, 12, 361–390. [Google Scholar] [CrossRef]
  20. Hernández-Montes, E.; Jalón, M.L.; Rodríguez-Romero, R.; Chiachío, J.; Compán-Cardiel, V.; Gil-Martín, L.M. Bayesian Structural Parameter Identification from Ambient Vibration in Cultural Heritage Buildings: The Case of the San Jerónimo Monastery in Granada, Spain. Eng. Struct. 2023, 284, 115924. [Google Scholar] [CrossRef]
  21. Bernardo, V.M.S.; Campos Costa, A.P.D.N.; Candeias, P.J.D.O.X.; Da Costa, A.G.; Marques, A.I.M.; Carvalho, A.R. Ambient Vibration Testing and Seismic Fragility Analysis of Masonry Building Aggregates. Bull. Earthq. Eng. 2022, 20, 5047–5071. [Google Scholar] [CrossRef]
  22. Bayraktar, A.; Çalik, İ.; Türker, T. A Simplified Fundamental Frequency Formulation Based on In-Situ Tests for Masonry Stone Minarets. Exp. Tech. 2022, 46, 225–238. [Google Scholar] [CrossRef]
  23. Bakkar, A.R.; Elyamani, A.; El-Attar, A.G.; Bompa, D.V.; Elghazouli, A.Y.; Mourad, S.A. Dynamic Characterisation of a Heritage Structure with Limited Accessibility Using Ambient Vibrations. Buildings 2023, 13, 192. [Google Scholar] [CrossRef]
  24. Taleb, R.; Bouriche, F.; Remas, A.; Boukri, M.; Kehila, F. Use of Ambient and Forced Vibration Tests to Evaluate Seismic Properties of an Unreinforced Masonry Building Rehabilitated by Dampers. In Proceedings of the Fifteenth World Conference on Earthquake Engineering, Lisbon, Portugal, 24–28 September 2012. [Google Scholar]
  25. Ruiz-Jaramillo, J.; Montiel-Vega, L.; García-Pulido, L.J.; Muñoz-González, C.; Blanca-Hoyos, Á. Ambient Vibration as a Basis for Determining the Structural Behaviour of Watchtowers against Horizontal Loads in Southeast Spain. Appl. Sci. 2020, 10, 6114. [Google Scholar] [CrossRef]
  26. Gentile, C.; Saisi, A. Ambient Vibration Testing of Historic Masonry Towers for Structural Identification and Damage Assessment. Constr. Build. Mater. 2007, 21, 1311–1321. [Google Scholar] [CrossRef]
  27. Lu, J.; Zhang, C.; Wang, Z.; Han, X. Dynamic Performance and Seismic Damage Analysis of an Ancient Masonry Pagoda. J. Asian Archit. Build. Eng. 2022, 21, 2009–2026. [Google Scholar] [CrossRef]
  28. Trešnjo, F.; Humo, M.; Casarin, F.; Ademović, N. Experimental Investigations and Seismic Assessment of a Historical Stone Minaret in Mostar. Buildings 2023, 13, 536. [Google Scholar] [CrossRef]
  29. Borlenghi, P.; Saisi, A.; Gentile, C. ND Testing and Establishing Models of a Multi-Span Masonry Arch Bridge. J. Civ. Struct. Health Monit. 2023, 13, 1595–1611. [Google Scholar] [CrossRef]
  30. Saisi, A.; Gentile, C. Investigation Strategy for Structural Assessment of Historic Towers. Infrastructures 2020, 5, 106. [Google Scholar] [CrossRef]
  31. Akhlaq, H.; Butt, F.; Alwetaishi, M.; Riaz, M.; Benjeddou, O.; Hussein, E.E. Structural Identification of a 90 m High Minaret of a Landmark Structure under Ambient Vibrations. Buildings 2022, 12, 252. [Google Scholar] [CrossRef]
  32. Hansapinyo, C.; Poovarodom, N. Ambient Vibration Tests and Finite Element Analysis for Dynamic Properties of Brick Masonry Inverted Bell-Shaped Chedi. APCBEE Procedia 2014, 9, 212–216. [Google Scholar] [CrossRef]
  33. Brownjohn, J.M.W.; Magalhaes, F.; Caetano, E.; Cunha, A. Ambient Vibration Re-Testing and Operational Modal Analysis of the Humber Bridge. Eng. Struct. 2010, 32, 2003–2018. [Google Scholar] [CrossRef]
  34. Saidin, S.S.; Kudus, S.A.; Jamadin, A.; Anuar, M.A.; Amin, N.M.; Ya, A.B.Z.; Sugiura, K. Vibration-Based Approach for Structural Health Monitoring of Ultra-High-Performance Concrete Bridge. Case Stud. Constr. Mater. 2023, 18, e01752. [Google Scholar] [CrossRef]
  35. De Silva, C.W. Vibration Damping, Control, and Design; CRC Press: Boca Raton, FL, USA, 2007. [Google Scholar]
  36. Chopra, A.K. Dynamics of Structures: Theory and Applications to Earthquake Engineering; Prentice Hall: Hoboken, NJ, USA, 2012; ISBN 978-0-13-285803-8. [Google Scholar]
  37. Khalfan, K.; Besha, R.; Tesha, D. Electromagnetic Shielding Effectiveness of Historic Buildings: The Heritage Stone Town of Zanzibar. J. Civ. Eng. Archit. 2018, 12, 880–889. [Google Scholar] [CrossRef]
  38. SAP2000 | Structural Analysis And Design. Available online: https://www.csiamerica.com/products/sap2000 (accessed on 17 February 2024).
  39. Nakamura, Y.; Gurler, E.D.; Saita, J.; Rovelli, A.; Donati, S. Vulnerability Investigation of Roman Colosseum Using Microtremor. In Proceedings of the 12th WCEE, Auckland, New Zealand, 30 January–4 February 2000; pp. 1–8. [Google Scholar]
  40. Konno, K.; Ohmachi, T. Ground-Motion Characteristics Estimated from Spectral Ratio between Horizontal and Vertical Components of Microtremor. Bull. Seismol. Soc. Am. 1998, 88, 228–241. [Google Scholar] [CrossRef]
  41. Niii, A.; Hayashi, Y.; Morii, T.; Ida, S.; Suzuki, Y. Vibrational Characteristics of Machiya in Kyoto Based on Ambient Vibration Tests. J. Struct. Constr. Eng. (Transactions AIJ) 2007, 72, 43–50. [Google Scholar] [CrossRef] [PubMed]
  42. Cao, M.; Sha, G.; Gao, Y.; Ostachowicz, W. Structural Damage Identification Using Damping: A Compendium of Uses and Features. Smart Mater. Struct. 2017, 26, 043001. [Google Scholar] [CrossRef]
  43. Gutenbrunner, G.; Savov, K.; Wenzel, H. Sensitivity Studies on Damping Estimation. In Proceedings of the Conference: Second International Conference on Experimental Vibration Analysis for Civil Engineering Structures (EVACES), Porto, Portugal, 24–26 October 2007. [Google Scholar]
  44. Olmos, B.A.; Roesset, J.M. Evaluation of the Half-power Bandwidth Method to Estimate Damping in Systems without Real Modes. Earthq. Eng. Struct. Dyn. 2010, 39, 1671–1686. [Google Scholar] [CrossRef]
  45. Papagiannopoulos, G.A.; Hatzigeorgiou, G.D. On the Use of the Half-Power Bandwidth Method to Estimate Damping in Building Structures. Soil Dyn. Earthq. Eng. 2011, 31, 1075–1079. [Google Scholar] [CrossRef]
  46. Sun, P.; Wang, D. Comparison of Damping Parameters Based on the Half-Power Bandwidth Methods of Viscous and Hysteretic Damping Models. J. Vib. Control 2023, 29, 968–979. [Google Scholar] [CrossRef]
  47. Panteliou, S.D.; Chondros, T.G.; Argyrakis, V.C.; Dimarogonas, A.D. Damping Factor as an Indicator of Crack Severity. J. Sound Vib. 2001, 241, 235–245. [Google Scholar] [CrossRef]
  48. Razak, H.A.; Choi, F.C. The Effect of Corrosion on the Natural Frequency and Modal Damping of Reinforced Concrete Beams. Eng. Struct. 2001, 23, 1126–1133. [Google Scholar] [CrossRef]
  49. Bovsunovsky, A.P. Efficiency of Crack Detection Based on Damping Characteristics. Eng. Fract. Mech. 2019, 214, 464–473. [Google Scholar] [CrossRef]
  50. Romeo, N.; Khan, M. Ambient Vibrations of Unreinforced Masonry Buildings in Dhaka City; Department of Civil Engineering (CE), Bangladesh University of Engineering and Technology(BUET): Dhaka, Bangladesh, 2015. [Google Scholar]
  51. Foti, D.; Diaferio, M.; Giannoccaro, N.I.; Mongelli, M. Ambient Vibration Testing, Dynamic Identification and Model Updating of a Historic Tower. NDTE Int. 2012, 47, 88–95. [Google Scholar] [CrossRef]
Figure 1. Example of a stone masonry wall.
Buildings 14 00981 g001
Figure 2. Foundation detail.
Buildings 14 00981 g002
Figure 3. Typical stone masonry wall and floor system.
Buildings 14 00981 g003
Figure 4. The methodological flow chart of the study.
Buildings 14 00981 g004
Figure 5. Pictorial illustration of AVT setup and deployment at various locations.
Buildings 14 00981 g005
Figure 6. Schematic diagram of the layout plan for equipment deployment (a) Old Customs; (b) Old Dispensary; (c) Tippu Tip; (d) Palace Museum building.
Buildings 14 00981 g006
Figure 7. AVT results of the 2nd floor Old Customs building; (a) Time history data, (b) Fourier spectrum, (c) spectral ratio in X- and Y-axis, (d) Trend in spectral ratio at various location.
Buildings 14 00981 g007
Figure 8. Natural frequencies of Old Customs building; (a) 2nd floor, (b) 3rd floor.
Buildings 14 00981 g008
Figure 9. Natural frequencies of the Old Dispensary building; (a) 2nd floor, (b) 3rd floor.
Buildings 14 00981 g009
Figure 10. Natural frequencies of the Tippu Tip building; (a) 2nd floor, (b) 3rd floor.
Buildings 14 00981 g010
Figure 11. Natural frequencies of the Palace Museum Building; (a) 2nd floor, (b) 3rd floor.
Buildings 14 00981 g011
Figure 12. Mode shapes of Old Customs building; (a) 1st Mode, (b) 2nd Mode.
Buildings 14 00981 g012
Figure 13. Mode shapes of Old Dispensary building; (a) 1st Mode, (b) 2nd Mode.
Buildings 14 00981 g013
Figure 14. Mode shapes of Tippu Tip building; (a) 1st Mode, (b) 2nd Mode.
Buildings 14 00981 g014
Figure 15. Mode shapes of Palace Museum building; (a) 1st Mode, (b) 2nd Mode.
Buildings 14 00981 g015
Figure 16. Natural frequencies vs. house height.
Buildings 14 00981 g016
Figure 17. Natural frequencies vs. wall thickness.
Buildings 14 00981 g017
Figure 18. Modal analysis results for the Old Customs building; (a) 3D view, (b) 3D view after simulation, (c) identified 1st Mode (d) identified 2nd Mode.
Buildings 14 00981 g018aBuildings 14 00981 g018b
Figure 19. Modal analysis results for the Old Dispensary building; (a) 3D view, (b) 3D view after simulation, (c) identified 1st Mode (d) identified 2nd Mode.
Buildings 14 00981 g019
Figure 20. Modal analysis results for the Tippu Tip building; (a) 3D view, (b) 3D view after simulation, (c) identified 1st Mode (d) identified 2nd Mode.
Buildings 14 00981 g020
Figure 21. Modal analysis results for the Old Palace Museum building; (a) 3D view, (b) 3D view after simulation, (c) identified 1st Mode (d) identified 2nd Mode.
Buildings 14 00981 g021
Table 1. General description of the selected historical buildings and their characteristics.
Building NamePlansGeneral ViewBuilding Details
Old Customs Buildings 14 00981 i001Buildings 14 00981 i002Plan area: 877.05 m2
House height: 14.80 m
Wall thickness: 0.75 m
Floor-type: Rigid
Floor layout: Regular
Conservation state: Good condition
Old DispensaryBuildings 14 00981 i003Buildings 14 00981 i004Plan area: 928.97 m2
House height: 15.20 m
Wall thickness: 0.60 m
Floor-type: Rigid and flexible
Floor layout: Irregular
Conservation state: Good condition
Tippu TipBuildings 14 00981 i005Buildings 14 00981 i006Plan area: 754.17 m2
House height: 13.60 m
Wall thickness: 0.55 m
Floor-type: Rigid and flexible
Floor layout: Irregular
Conservation state: Poor condition
Palace MuseumBuildings 14 00981 i007Buildings 14 00981 i008Plan area: 1252.0 m2
House height:14.30 m
Wall thickness: 0.70 m
Floor-type: Rigid and flexible
Floor layout: Regular
Conservation state: Deteriorate condition
Notes:
Good condition: The house appears structurally good and shows evidence of regular maintenance.
Deteriorating condition: The house assigned does not have severe structural defects but does show unmistakable signs of deterioration and no evidence of recent repair.
Poor condition: The houses’ structural and architectural elements are in an advanced state of deterioration and may have serious structural problems.
Sources of data: Stone Town Conservation and Development Authority.
Table 2. Identified damping ratio.
Building NameModeDamping Ratio %Damping Ratio %
Old Customs1st2.882.16
2nd2.532.18
3rd4.454.00
Old Dispensary1st2.742.36
2nd1.261.53
3rd1.841.74
Tippu Tip1st1.501.45
2nd2.141.35
3rd2.211.65
Palace Museum1st2.262.06
2nd1.522.31
3rd2.892.56
Table 3. Comparison of ambient natural frequencies and geometric parameters of the buildings.
Building NameRecording
Locations
Maximum Height at Top Floor from
P.L. (m)
Wall
Thickness (m)
Length of Wall (m)
per Floor
Average Frequency (Hz)
XYXY
Old Customs3rd floor14.800.75150.43142.405.34.7
2nd floor195.53178.064.94.2
Old Dispensary3rd floor15.200.6113.6699.234.64.3
2nd floor156.34122.494.23.9
Tippu tip3rd floor13.600.5563.5250.284.03.4
2nd floor98.9873.943.22.8
Palace Museum3rd floor14.300.7130.8991.594.44.8
2nd floor160.5689.534.14.3
Table 4. Material properties.
MaterialDensity
(kg/m3)
UCS
(MPa)
E
(MPa)
(ν)
Stone129710.0237570.15
Mortar7930.7122450.05
Table 5. Results of the modal analysis.
ModeOld Customs Old Dispensary Tippu Tip Palace Museum
f
[Hz]
Mx
[%]
My
[%]
f
[Hz]
Mx
[%]
My
[%]
f
[Hz]
Mx
[%]
My
[%]
f
[Hz]
Mx
[%]
My
[%]
14.10.0794.323.837.5030.902.40.3382.523.90.0184.74
24.331.800.033.933.3151.182.680.680.554.747.020.24
34.862.850.224.213.143.674.40.020.684.935.040.57
44.90.010.034.55.885.072.90.0112.425.00.001.34
55.50.034.575.05.905.623.714.400.005.64.071.41
66.83.280.005.10.000.784.20.000.035.20.718.09
77.80.150.015.11.320.194.40.020.095.40.580.22
89.50.020.035.40.000.004.60.001.835.83.930.12
910.90.000.135.60.190.004.60.090.067.42.650.25
1011.90.010.035.90.340.174.90.020.018.30.210.97
Table 6. Comparison between experimental and numerical models.
Building NameFrequency (Hz)
X-DirectionY-Direction
AVTsNumericalDifference %AVTsNumericalDifference %
Old Customs5.14.85.84.54.18.8
Old Dispensary4.64.16.84.13.87.3
Tippu Tip3.22.96.42.82.411.1
Palace Museum4.44.28.64.23.97.1
Table 7. KPI of the prediction results.
SrOrientation (Axis)RMSEMAENSER2
1X0.300.290.810.99
2Y 0.300.300.820.99
Disclaimer/Publisher’s Note: The statements, opinions and data contained in all publications are solely those of the individual author(s) and contributor(s) and not of MDPI and/or the editor(s). MDPI and/or the editor(s) disclaim responsibility for any injury to people or property resulting from any ideas, methods, instructions or products referred to in the content.

