Article

Long-Term Bearing Capacity of Concrete Pile Composite Foundation under Composite Salt Erosion

1
School of Highway, Chang’an University, Xi’an 710064, China
2
CCCC Second Highway Consultants Co., Ltd., Wuhan 430056, China
*
Author to whom correspondence should be addressed.
Buildings 2024, 14(1), 289; https://doi.org/10.3390/buildings14010289
Submission received: 6 December 2023 / Revised: 5 January 2024 / Accepted: 15 January 2024 / Published: 21 January 2024
(This article belongs to the Special Issue Foundation Treatment and Building Structural Performance Enhancement)

Abstract

:
In order to study the long-term bearing capacity of concrete pile composite foundation in the Salt Lake area, based on the Tehran Isfahan high-speed railway project in Iran, the full (semi) immersion drying test and rapid freeze-thaw test was carried out, and the specimens were scanned by electron microscope. Numerical calculations were used to study the effects of different pile strengths and design parameters on the long-term bearing capacity of the composite foundation. The main conclusions were as follows: The concrete specimens in the adsorption zone deteriorated earlier and faster. In the rapid freeze-thaw tests, the strength attenuation of high-strength (C40, C50) specimens was smaller than that of low-strength specimens (C20). Within 20 years after construction, the additional settlement of low-strength (C20) piles was 12.21 mm, while high-strength concrete was less affected by deterioration. With pile spacing ranging from 1.8 m to 4.5 m, the maximum increase in additional settlement under the C20 condition was about 20 mm. The pile-soil stress ratio under the three conditions increased by 2.42, 6.59, and 8.63. As the pile length and diameter increased, the peak stress of the pile body moved towards the pile end, and the changes in the pile-soil stress ratio under the three conditions were similar.

1. Introduction

A variety of ions in saline soil environments have corrosive effects on concrete structures. Concrete structures will face steel corrosion caused by chloride salt, chemical corrosion caused by sulfate and magnesium salt, carbonation of the protective concrete layer, and fatigue damage caused by long-term freeze-thaw cycles in some saline soil areas. This leads to the deterioration of concrete structures in saline soil areas more easily than that in the general environment, which changes the mechanical properties of the structure, and even causes the phenomenon of insufficient bearing capacity and excessive deformation, bringing hidden dangers to various projects in saline soil area.
The environmental corrosion process of concrete is very complex and slow, and the corrosion degree and corrosion mechanism of concrete structures are different in different corrosion environments [1,2,3,4]. There are different mechanisms of sulfate attack on concrete and concrete cracking in four environments: soluble cations, magnesium ions, low temperature, humid or carbonized environment, and the dry-wet cycle [5]. Different sulfate concentrations will lead to different corrosion mechanisms of sulfate on concrete [6,7]. Saturated sodium sulfate solutions produce sodium sulfate decahydrate crystals at 20 °C, and the corrosion of concrete always occurs in the dry state during the dry-wet cycle [8]. Chloride ions can inhibit the corrosion of sulfate ions on concrete by delaying the formation of ettringite, and the higher the concentration of chloride ions, the more significant the delay effect is. At the initial stage of erosion, sulfate ions inhibit the diffusion of chloride ions; the corrosion resistance coefficient and permeability of concrete first increases and then decrease, and at the later stage of erosion, the inhibition decreases. The generated compound products and crystals degrade the internal structure of the concrete [9,10,11,12]. Sulfate attack on concrete is usually more serious when above the ground surface. The sulfate solution semi-immersion test can more effectively simulate the sulfate attack on concrete [13,14,15,16,17].
At present, many scholars have carried out a series of research on the performance deterioration of concrete in saline soil areas after erosion and have achieved fruitful research results. The strength value of the specimen changed little at the initial stage of the freeze-thaw cycle and accelerated to decline at the later stage. In the first few months after the concrete was exposed to the acid environment, the pH value decreased rapidly, but the corrosion of the concrete was small. Then, the pH value continued to decrease, and a quality loss of the concrete began to occur [18]. Reinforced concrete with a lower strength grade is more affected by corrosion [19]. The neural network model and some other computer models are used to predict the corrosion process of concrete. The program is trained by using the indoor corrosion test data or the data collected on-site, and the results match well with the field corrosion situation [20,21]. The reliability life of the strength degradation index was the shortest among various degradation indexes [22]. In the erosion test, the unconfined compressive strength of cement-stabilized sand gravel first increased and then decreased with the increase of sulfate content [23]. The mass change rate of high-toughness concrete after a sulfate attack is greater than that of ordinary concrete and, with the increase of sulfate solution concentration, the damage of high-toughness concrete is more serious [24]. The deterioration of the bearing performance of cast-in-place piles depends on the change in pile length and pile diameter. Increasing the pile diameter can effectively improve the resistance to the loss of bearing capacity caused by sulfate corrosion. At the same time, chloride salt strengthens the sulfate corrosion process of cast-in-place concrete under the action of the dry-wet cycle, making the loss of concrete strength more serious [25,26]. Under the action of salt erosion and the dry-wet cycle, the mass loss of concrete first decreases and then increases. Sulfate increases the relative dynamic elastic modulus and compressive strength first and then decreases them, while chloride salt gradually decreases the relative dynamic elastic modulus of concrete specimens. Consequently, sulfate causes more damage to concrete [27,28,29,30,31].
When the foundation treatment is carried out in saline soil areas, the pile is under the comprehensive effect of long-term immersion, the dry-wet cycle, and the freeze-thaw cycle, plus the erosion effect of salt on concrete, which makes the bearing performance of composite foundations change during the operation period [32]. In the corrosive soil environment, whether it is a cast-in-place pile or a prefabricated pile, during the construction and operation, the concrete of the pile body may crack due to improper construction or erosion, thus reducing the service performance of the pile [33,34,35]. Some auxiliary means include the addition of admixtures or mineral admixtures, and the use of polymers, which have been used in mass concrete structures and have achieved good sulfate resistance or the effect of overcoming concrete cracks [36,37,38,39]. Siamphukdee et al. established a displacement function to describe cracked concrete, using the Critical Corrosion Penetration Depth to describe the degree of corrosion. They believed that this parameter is related to the properties of concrete materials [40]. In foundation treatment engineering, smaller pile groups are often used. Compared with pile foundations, the corrosion of concrete piles in the process of foundation treatment deserves more attention. However, there are few studies on the long-term bearing performance change of composite foundations caused by the deterioration of concrete in saline soil areas. In order to study the long-term bearing performance of plain concrete pile composite foundations area after the pile strength deteriorated due to erosion in the Salt Lake, taking the Soltan Salt Lake section of the Tehran Isfahan high-speed railway in Iran as the research object, full- and semi-immersion drying tests and rapid freeze-thaw tests of concrete were carried out, and the specimens were scanned by electron microscope. The acceleration coefficient corresponding to the indoor test and operation life was calculated, and the strength prediction model was established on this basis. Then a numerical model was established to study the long-term bearing capacity of pile concrete with different strengths and the influence of pile spacing, pile length, and pile diameter on the long-term bearing capacity of plain concrete pile composite foundations. The calculation results can provide a reference for other related projects.

2. Project Overview

The Tehran Isfahan high-speed railway in Iran starts from the capital, Tehran, passes through Qom and Mehme, and finally ends in Isfahan, with a total length of 406 km. The length of the Qom-Isfahan section is approximately 245 km, with a design speed of 250 km/h, designed according to the ballasted track. The Tehran-Qom section is approximately 161 km long, with most of it designed for ballastless tracks at a speed of 300 km/h. The high-speed railway passes through various geomorphic units such as alluvial plain areas, salt lake plain areas, sedimentary rock low mountains, and shallow hills. The research section is part of the Tehran to Qom section, passing through the Soltan Salt Lake, designed with a fill subgrade.
The Soltan Salt Lake is a dry salt lake without surface water and with an annual rainfall of 100–200 mm, making it difficult to form a stable water flow on the ground. The groundwater level in the Salt Lake area is relatively shallow, and the special types of rock and soil distributed in the area include poorly graded sand, salinized soft soil, and salinized clay. The foundation soil and groundwater along the high-speed railway contain corrosive ions such as chloride ions, sulfate ions, and magnesium ions to varying degrees. The composite foundation of plain concrete piles and rafts has the advantages of fast construction speed, easy quality control, and simple structural stress. It is suitable for treating deep and soft soil and can also improve the liquefaction performance of sandy soil, making it one of the preferred reinforcement plans for designers.

3. Soaking Drying Accelerated Deterioration Test of Pile Concrete

3.1. Preparation of Test Materials

3.1.1. Erosion Solution Configuration

Several soil samples were taken from the foundation soil on-site, and then the liquid to be measured was prepared according to the soil samples. The maximum values of various erosion ions were measured by chemical titration. The concentration of sulfate ions was recorded at 9432 mg/L, the concentration of magnesium ions was measured at 4800 mg/L, and the concentration of chloride ions was found to be 93,187 mg/L. The erosion solution was prepared using anhydrous sodium sulfate crystals (with a purity exceeding 99.0%), hexahydrate magnesium chloride crystals (with a purity exceeding 99.5%), and sodium chloride crystals (with a purity exceeding 99.5%). During the course of the experiment, the erosion solution was replaced every 7 days to prevent changes in the concentration of erosive ions due to chemical reactions.

3.1.2. Concrete Specimen Fabrication

The composite foundation of the salt lake area utilizes prestressed concrete piles, and the concrete materials for the piles are as shown in Table 1. In order to ensure that the mix design of the concrete used in the laboratory tests remains consistent with the on-site conditions, after several trial tests, the mix designs for the C20, C40, and C50 pile concrete with different strength grades were determined, as indicated in Table 2. Mineral powder and silica fume were added to the concrete as admixtures to enhance its resistance to erosion, and an air-entraining agent was also added to improve its frost resistance.
The immersion-drying test was used to determine the compressive strength of concrete cubes with non-standard specimens measuring 100 mm × 100 mm × 100 mm. The conversion coefficient between the compressive strength of the cube specimens and the standard value was 0.95. The standard specifies that the rapid freeze-thaw test uses the relative dynamic modulus of elasticity to describe concrete frost resistance. The specimen dimensions for this test were 100 mm × 100 mm × 400 mm, but the axial compressive strength measured from these dimensions required a conversion to the compressive strength of cube specimens using empirical formulas. For the sake of result analysis, this experiment uniformly employed concrete cube specimens measuring 100 mm × 100 mm × 100 mm. The experimental process is shown in Figure 1.

3.2. Pile Concrete Immersion Drying Test Plan

3.2.1. Test Conditions

According to the different environments in which the pile concrete is buried at different depths, the erosion conditions are divided into three types: immersion zone, adsorption zone, and freeze-thaw zone, as shown in Figure 2. Among them, the soaking zone is located below the groundwater level, and the erosion of pile concrete is mainly caused by the physical and chemical effects of corrosive ions in the groundwater. The adsorption zone is located above the groundwater level and within the capillary action range, and erosion is mainly caused by the physical and chemical effects of corrosive ions in the capillary water. The freeze-thaw zone is located below the surface, within the freezing line, and mainly causes freeze-thaw damage.

3.2.2. Test Plan

Low-strength concrete is often used in the design of plain concrete pile composite foundations. Considering the special geological environment of the Salt Lake area, concrete specimens with strength grades of C20, C40, and C50 were used to simulate the immersion zone, adsorption zone, and freeze-thaw zone. During the test, corresponding blank control group tests were set for different conditions. The test pieces in the control group were mixed and cured with tap water. The test conditions are shown in Table 3.
For simulating the immersion zone of pile concrete, the full immersion-drying test with the erosion solution was employed. Concrete specimens were mixed with the erosion solution during preparation and cured for 28 days. They were then immersed in the erosion solution for 16 h at 23 °C, followed by drying for 8 h at 60 °C. One cycle consisted of 24 h of immersion and drying, and a total of 120 cycles were conducted, with the test lasting for 120 days.
For simulating the partially immersed zone of pile concrete, the half-immersion-drying test with the erosion solution was used. Concrete specimens were mixed with the erosion solution during preparation and cured for 28 days. The lower half of the specimens was immersed in the erosion solution for 16 h at 23 °C, followed by drying for 8 h at 60 °C. One cycle consisted of 24 h, and a total of 120 cycles were conducted.
When studying the strength characteristics of pile concrete in the freeze-thaw zone, concrete specimens were prepared using tap water and cured for 56 days in the erosion solution. Fast freeze-thaw tests were then conducted for 120 cycles.

3.2.3. Selection of Experimental Degradation Indicators

In the design of a plain concrete pile valve composite foundation, the standard value of a concrete cube’s compressive strength is often used as the control standard. Therefore, in this experiment, the deterioration law of concrete mechanical properties was described by the compressive strength of concrete. As shown in Equation (1), the standard value of the compressive strength of each cube specimen was measured using a universal testing machine.
f c c = F A
where: fcc is the compressive strength of the concrete cube specimen (MPa), F is the load at failure of the test piece (N), and A is the bearing area of the test piece (mm2).
At the same time, during the whole erosion test process of concrete specimens, the hydration of cement materials, the formation of erosion products, and the damage caused by the expansion of internal forces were all accompanied by quality changes. Although the quality change cannot directly reflect the mechanical properties of concrete, it can make a qualitative analysis of its mechanical properties to a certain extent. Therefore, in this test, the mass loss rate of concrete specimens was taken as an indirect indicator of the change in the mechanical properties of concrete specimens. The calculation of the mass loss rate is as follows (2).
W n = G n G 0 G 0 × 100 %
where: W n is the mass loss rate, G n is the mass of the specimen after n cycles (kg), and G 0 is the initial mass of the test piece (kg).

3.3. Analysis of Test Results

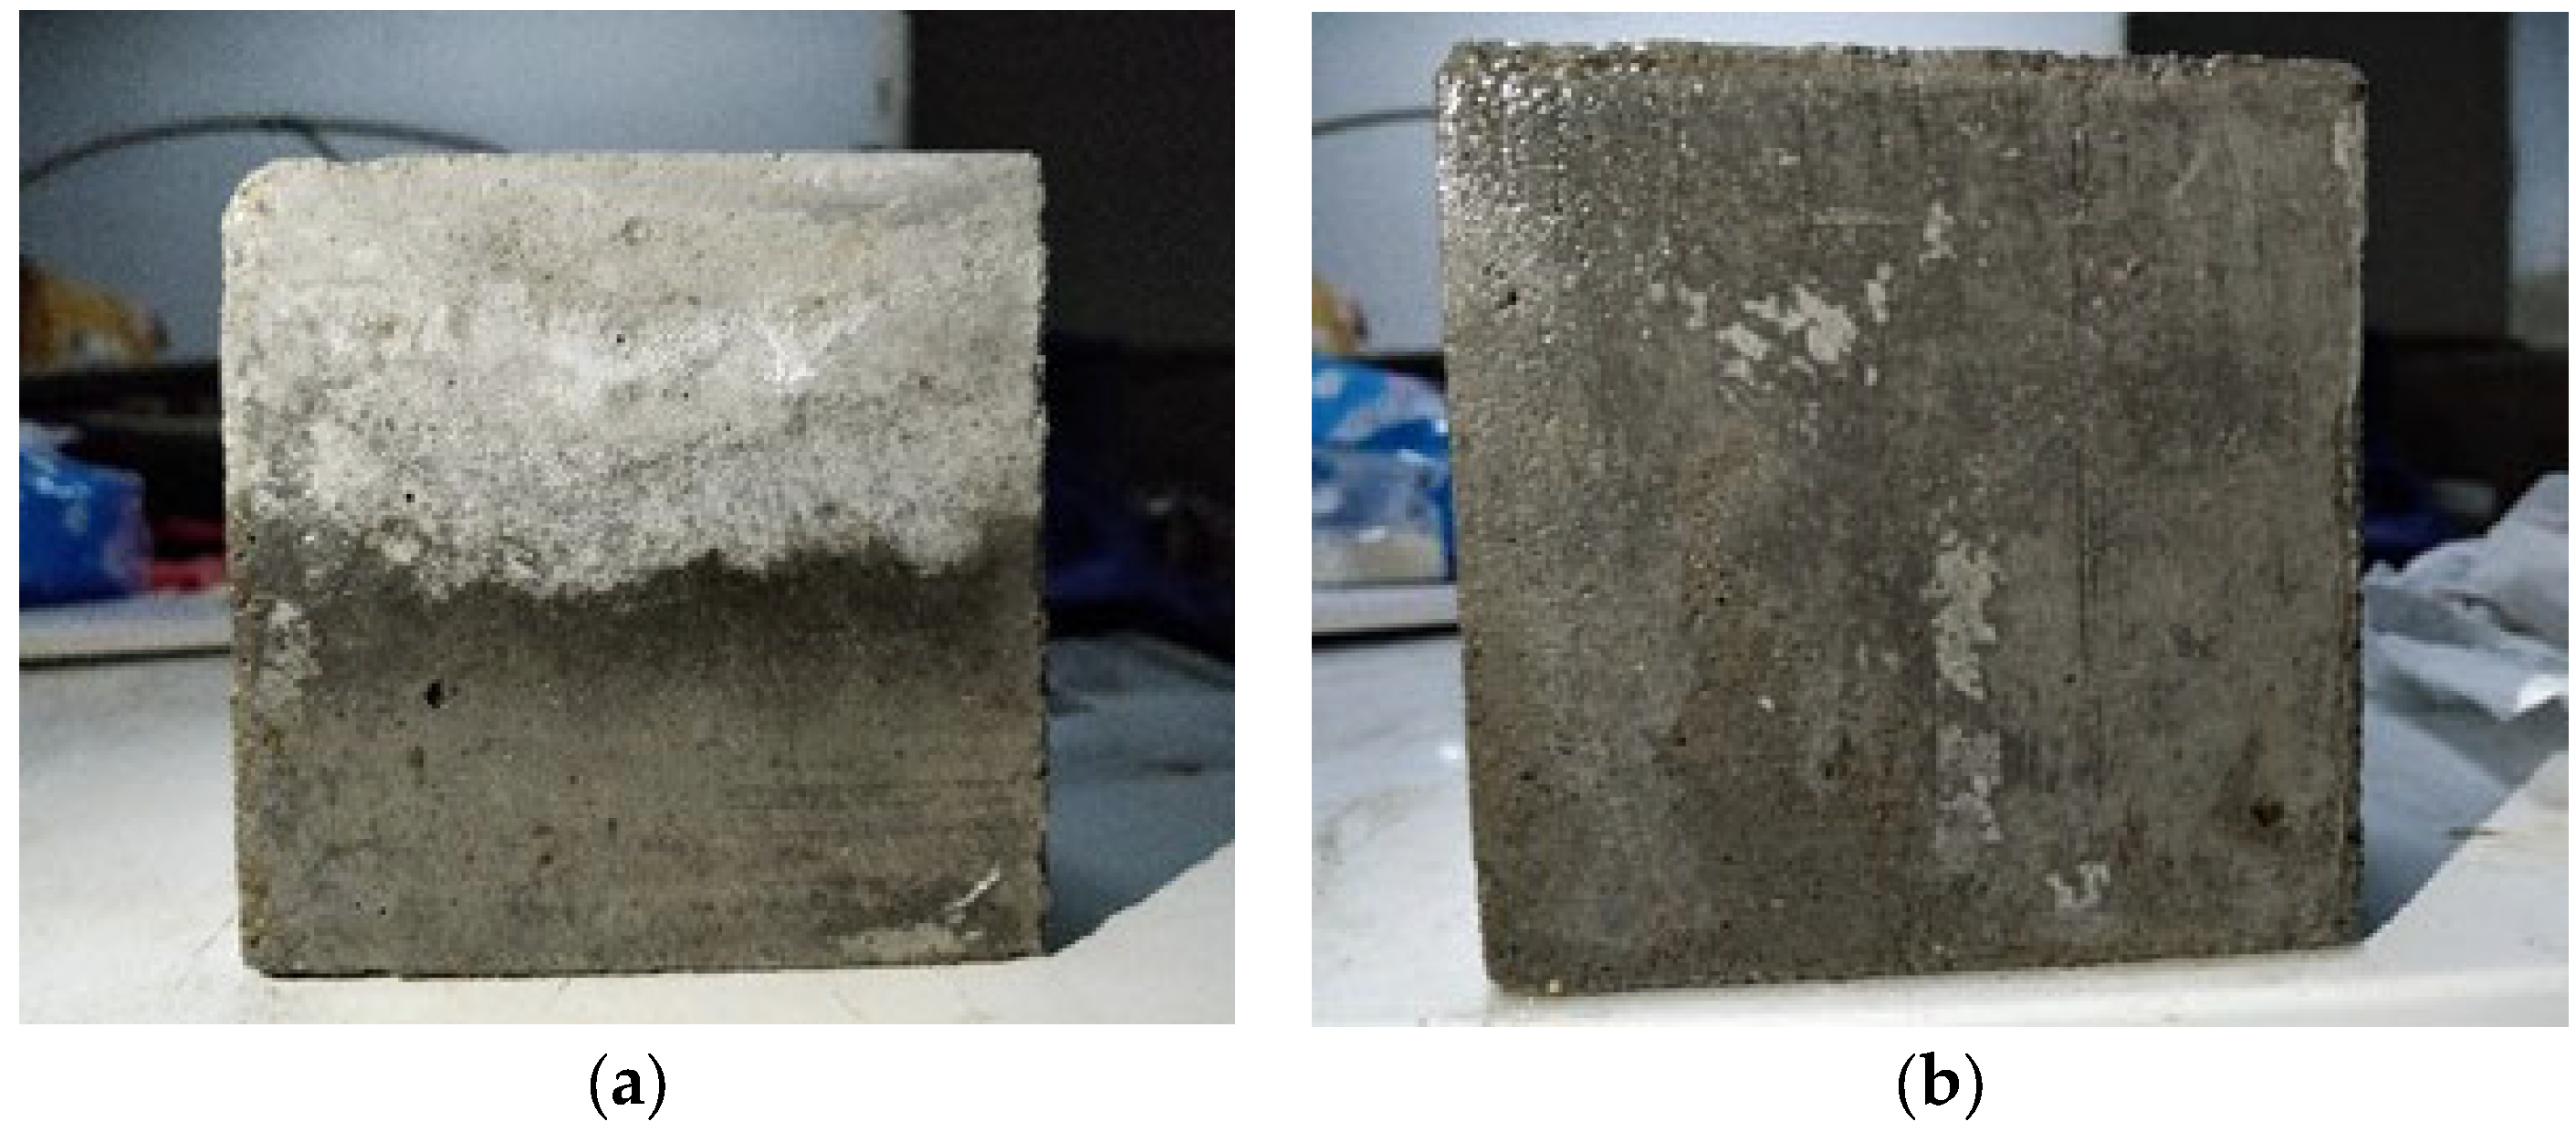
3.3.1. Analysis of Performance Deterioration of Pile Concrete in Immersion Zone

The full immersion drying test was used to study the service performance of plain concrete piles in the soaking area. The concrete specimens were tested every 20 cycles, and the compressive strength and quality of the specimens were recorded. The strength and mass loss rate of concrete specimens in the full immersion drying test and their changes with time are shown in Figure 3 and Figure 4.
The change in the mass loss rate of concrete specimens in the control group was relatively synchronous with the strength development, showing two stages: the stage of quality increase and the stage of quality stability. The strength of concrete specimens in the full immersion drying test of erosion solution showed the strength rising stage and the deterioration stage, and the strength rising stage included the continuous hydration stage and the strengthening stage. The change in the mass loss rate was not synchronized with the strength development.
For high-strength (C40 and C50) concrete specimens, the strength of the specimens was basically the same as that of the control group within 0 to 40 cycles and 0 to 60 cycles, and the internal of the specimens was still dominated by the secondary hydration reaction. Before 80 cycles, the strength of the specimen was still increasing and was higher than that of the control group at the same time. At this time, it was in the strengthening stage; the solid volume in the concrete specimen increased, and some microvoids were filled by the products of the reaction between corrosive ions and concrete. After 80 to 120 cycles, due to the gradual accumulation of products, the internal expansion pressure of the specimen gradually increased, which destroyed the concrete structure and reduced the strength of the specimen. This stage was the deterioration stage. The quality development of high-strength concrete specimens did not show three stages, indicating that although the corrosive products affected the strength of specimens, they did not affect the integrity of concrete specimens.
Low-strength (C20) concrete specimens were eroded in the curing stage, and their strength was lower than that of the control group during the whole process of the immersion drying test. The strength development also showed three stages: continuous hydration (0–40 cycles), strengthening (40–80 cycles), and deterioration (80–120 cycles). However, the strength increase was less in the continuous hydration stage and strengthening stage. The change in the quality loss rate showed two stages: a continuous growth stage and a decline stage. The structure of the test piece was affected by the corrosive products, and micro-cracks were formed inside the test piece under the expansion pressure, which made it easier for the erosion liquid to migrate to the inside of the concrete test piece, resulting in corrosion damage and subsequently a reduction in the quality of the test piece.

3.3.2. Analysis of Performance Deterioration of Pile Concrete in Adsorption Zone

The service performance of plain concrete piles in the adsorption zone was studied by a semi-immersion drying test. The concrete specimens were tested every 20 cycles, and the compressive strength and quality of the specimens were recorded. The strength and mass loss rate of the concrete specimens in the semi-immersion drying test changed with time, as shown in Figure 5 and Figure 6 respectively. Figure 7 shows the appearance comparison of the test piece in the test soaking area and the test piece in the adsorption area.
It can be observed from Figure 5a that the strength development of the semi-soaked and dried concrete specimens in the erosion solution showed a similar pattern to that of the concrete specimens in the soaking area. This was evident in the strength-increasing stage and the deterioration stage, with the strength-increasing stage encompassing the continuous hydration stage and the strengthening stage. Figure 5a–c compares the relationship between the strength and erosion age of concrete specimens with the same grade in the full-immersion drying test and the semi-immersion drying test. The strength development trend of the concrete specimens in the full-immersion drying test and the semi-immersion drying test was relatively consistent, but the concrete specimens in the semi-immersion drying test entered the deterioration stage earlier and deteriorated faster. From Figure 5a–c, it was evident that in the full-immersion drying test, C20, C40, and C50 concrete specimens entered the deterioration stage after the 80th cycle, whereas in the semi-immersion test, the strength began to deteriorate after the 60th cycle. From the strength deterioration degree of 80 to 120 cycles, the strength of C20, C40, and C50 concrete specimens in the full-immersion drying test decreased by 3.27 MPa, 2.69 MPa, and 1.58 MPa, respectively, while the strength of the three grades of concrete specimens in the semi-immersion drying test decreased by 3.53 MPa, 3.59 MPa, and 3.52 MPa, respectively.
According to Figure 6, the quality of high-strength concrete specimens (C40 and C50) in the full-immersion drying test and the semi-immersion drying test continuously increased and did not decrease. However, the low-strength concrete specimen (C20) experienced a quality decline stage, indicating that the erosion products had caused damage to the concrete structure at this time. The quality change of concrete specimens in the semi-immersion drying test was higher than that in the full-immersion drying test, which also indicated that more erosion products were produced and accumulated in concrete specimens in the semi-immersion drying test.

3.3.3. Analysis of Performance Deterioration of Pile Concrete in Freeze-Thaw Zone

The deterioration performance of concrete in the freeze-thaw area was studied through the rapid freeze-thaw cycle test. After 56 days of curing, the concrete specimens were subjected to 120 cycles of a rapid freeze-thaw test. The compressive strength of the specimens was tested, and the mass loss rate was calculated every 20 cycles. The test results are shown in Figure 8.
It is evident from Figure 8a that the strength loss of high-strength concrete specimens (C40 and C50) was minimal at the initial stage of a rapid freeze-thaw (0–40 cycles), and the strength started to decline significantly after 40 cycles. After 56 days of specimen curing, the hydration reaction of the concrete was essentially complete. At the same time, the activity of the cement and admixture was low due to the low temperature, therefore there was no secondary hydration stage. In the process of the freeze-thaw cycles, although the formation of corrosive products could make the concrete specimens more dense, the fatigue load caused by the freeze-thaw had a greater impact on the strength of the concrete specimens; therefore, there was no strengthening stage. With the progression of the freeze-thaw process, the strength loss of concrete specimens gradually increased.
The low-strength concrete specimen (C20) exhibited a trend of strength attenuation in the early stages of the freeze-thaw. With an increase in the number of freeze-thaw cycles, the strength loss intensified. As seen in Figure 8b, the development of mass loss in the rapid freeze-thaw test did not correspond to the strength loss. From 0 to 60 cycles, the mass of the test piece increased, indicating that there was still an accumulation of corrosive products during the freeze-thaw cycle test. After 60 cycles, the mass of the test piece began to decrease, and the fatigue load generated by the freeze-thaw and the accumulation of corrosive products began to damage the structure of the concrete test piece.

3.3.4. SEM Microanalysis

The microstructure of the hydration products of cement concrete is mainly composed of colloidal substances, as well as a certain amount of layered calcium hydroxide and scattered needle and columnar ettringite. The main phase composition is hydrated calcium silicate Calcium Silicate Hydrate (C-S-H), ettringite Aft, and calcium hydroxide. However, there are differences in the microstructure of the hydration phase, which is also the reason for the differences in concrete performance.
The SEM image of the C20 concrete specimen without corrosion and after corrosion (after the semi-immersion drying test), enlarged by 1500 times, is shown in Figure 9. It can be seen from the structure of the reference concrete sample in Figure 9a,b, at 1500 times before and after corrosion, that there was not much difference, and the sample structure was slightly loose after corrosion. From the SEM diagram of the reference concrete in Figure 9a, it can be seen that a small amount of fibrous C-S-H and the hexagonal hydration product CH were intertwined, and there were cracks inside the structure. It can be clearly seen from Figure 9b that the corrosion reduced the C-S-H gel film formed inside the sample, and the cracks inside the structure were connected. It was much looser than the benchmark sample, with large cavities, and the generated crystals and gels were no longer tightly connected.
According to Figure 10, the structure of the C40 concrete was more compact, and the hydration products of cement paste and the “secondary hydration” products of mineral admixtures overlapped to form a dense network structure, which filled the large defects in the concrete; the calcium hydroxide crystals with an obvious size were basically not seen. This was because the “secondary hydration” converts the calcium hydroxide crystals with a lower strength into calcium silicate cement with a higher strength. In addition, due to the addition of mineral powder and silica fume to concrete, the content of calcium hydroxide at the interface was reduced, and the orientation of calcium hydroxide was limited. Therefore, the properties of the transition layer were improved, and a series of properties of concrete were significantly improved.
According to Figure 11, the hexagonal plate-shaped calcium hydroxide could no longer be seen in the C50 concrete specimen, and a large number of flocculent hydrates were distributed. When the sample was magnified at high magnification, it could be seen that the sample was dense after corrosion and was still connected as a whole. The above structural characteristics of corrosion-resistant concrete make the microstructure of corrosion-resistant concrete more perfect and homogeneous, therefore it has better durability.

4. Numerical Simulation of Service Performance of Plain Concrete Pile Composite Foundation

4.1. Model Establishment

In order to study the bearing capacity of composite foundations after the pile concrete had been eroded for different years, a half-width subgrade model was established in FLAC 3D. The filling load and traffic load were transformed into a uniform load and applied to the top surface of the cushion. The mechanical deformation characteristics of the composite foundation of C20, C40, and C50 concrete piles in 5, 10, and 20 years of operation were calculated, respectively, and the effects of pile spacing, pile length, and pile diameter on the long-term bearing capacity of composite foundations were studied. The model is shown in Figure 12. Three rows of piles were selected for calculation, with a cushion thickness of 0.5 m, a calculation width of 26 m, a calculation depth of 21 m, pile diameters of 0.5 m, 0.6 m, 0.7 m, and 0.8 m, a pile spacing of 1.8 m, 2.5 m, 3.5 m, and 4.5 m, and pile lengths of 8 m, 10 m, 12 m, and 14 m.
The pile concrete in the soaking area was taken below the groundwater level, i.e., the buried depth was less than 12 m. The pile concrete in the adsorption area was within the capillary action range above the groundwater level, i.e., 2.5 m above the groundwater level. The influence of ambient temperature was obvious within 0.8 m of the ground surface, and 0.8 m below the ground surface was taken as the freeze-thaw action range. The erosion damage to the pile concrete in other parts was relatively small, which was calculated according to the pile concrete strength in the freeze-thaw zone. The parameters of each soil layer are shown in Table 4.
Considering the deterioration process of concrete under the action of sulfate, magnesium salt, and other corrosive salts, the Arrhenius velocity equation was applied to obtain the acceleration coefficient of temperature on concrete corrosion during the full-(semi) immersion drying test, which was 11.2. According to Miner’s linear damage accumulation rule, combined with the statistics of temperature change on-site, the acceleration coefficient of the fast freeze-thaw test was calculated as 10, and then the test cycle in Section 3.3 was converted to the corresponding site time. Using the probability prediction model between the compressive strength and elastic modulus of concrete determined by [41], and combined with the compressive strength prediction model of each part of the concrete determined in Section 3.3, the elastic modulus of each grade plain concrete pile in 5, 10, and 20 years of operation was calculated, as shown in Table 5.
E C = 4.77 f c 0.5
where: Ec is the elastic modulus of concrete (GPA), and fc is the standard value of concrete cube compressive strength (MPA).

4.2. Analysis of Bearing Capacity of Composite Foundation

4.2.1. Change of Bearing Capacity of Composite Foundation after Deterioration of Piles with Different Strength

Figure 13 and Figure 14 show the additional settlement and pile stress changes due to the deterioration of pile concrete within 20 years after construction. When C20 concrete was selected for the concrete pile of Composite Foundation (hereinafter referred to as C20 or C20 condition, the same is true for C40 and C50), the loss of pile strength gradually increased with time, and the additional settlement caused by the pile deterioration (hereinafter referred to as additional settlement) also gradually accumulated. The settlement of the embankment bottom increased by 5.51 mm, 8.56 mm, and 12.21 mm in 5, 10, and 20 years after construction, respectively. In 20 years after construction, the additional settlement of the composite foundation under C40 and C50 conditions was 9.13 mm and 8.42 mm respectively. The pile stress under C20 conditions was obviously less than C40 and C50. With the continuous deterioration of pile concrete, the stress also decreased, but the overall distribution law of stress hardly changed.
Figure 15 shows the change of the pile-soil stress ratio in three conditions within 20 years after construction, in which the pile-soil stress ratio in the C20 condition decreased from 7.88 to 7.25, while the pile-soil stress ratio in the C40 and C50 conditions remained at a relatively stable value, the pile-soil stress ratio in the C40 condition decreased by 0.22, and the pile-soil stress ratio in the C50 condition only decreased by 0.07.
Figure 16a–c shows the shear strain increment contour slices under C20, C40, and C50 conditions, respectively, where i to iv are the calculation results of 0, 5, 10, and 20 years after construction. By comparing the contour maps of different years, it can be seen that the load was transferred to the salinized clay layer through the composite foundation; therefore, there was a large shear strain increment in the salinized clay layer. At 0 years after construction, the composite foundation under the three conditions had good integrity. With the increase in service life, the strength of concrete piles decreased after erosion, and the strength reduction under C20 conditions was the fastest. Within 20 years after construction, a sliding surface from the road base to the deep foundation was gradually formed. However, in C40 and C50 conditions with high concrete pile strength, the composite foundation still had good integrity within 20 years after construction.
It can be seen that for the C20 condition, after concrete deterioration, the bearing capacity of the composite foundation decreased faster, the additional settlement was larger, and the pile-soil stress ratio decayed faster. For the C40 and C50 concrete with higher strength, the additional settlement caused by pile deterioration within 20 years after construction was within 10 mm. Further, the pile stress was relatively stable and the variation range of the pile-soil stress ratio was small, which could better maintain the bearing performance of the composite foundation.

4.2.2. Influence of Pile Spacing on Long-Term Bearing Capacity of Composite Foundation

During the calculation, the pile length was taken as 12 m, and the pile spacing was taken as 1.8 m, 2.5 m, 3.5 m, and 4.5 m, in turn. The additional settlement of the composite foundation due to the deterioration of the pile was calculated under the conditions of C20, C40, and C50, as shown in Figure 17. The relationship between the pile stress distribution, the pile-soil stress ratio, and the pile spacing 20 years after construction is shown in Figure 18 and Figure 19.
With the increase of pile spacing, the additional settlement of the C20 condition gradually increased. With the pile spacing increased from 1.8 m to 4.5 m, the settlement increased from 12.21 mm to 31.47 mm, by nearly 20 mm. The additional settlement of C40 and C50 conditions increased from 9.13 mm and 8.42 mm to 20.82 mm and 17.20 mm, respectively. The distribution law of pile stress did not change significantly with the pile spacing. With the increase of pile spacing, the peak value of the pile stress was gradually obvious. The peak value of the stress for three kinds of pile strength was at the buried depth of 8 m. In terms of stress amplitude, the stress amplitude of C20 was the smallest, and the stress amplitude and values of C40 and C50 were relatively close. From the development of the pile-soil stress ratio, with the increase of pile spacing, the pile-soil stress ratio of the C20 condition increased slightly, from 7.26 to 9.68. The pile-soil stress ratio under C40 and C50 conditions increased significantly from 8.01 and 8.32 to 14.58 and 16.96, respectively.
Figure 20a–c, respectively, shows the shear strain increment contour slices under C20, C40, and C50 working conditions 20 years after construction with different pile spacing, in which i to iv are the calculation results of pile spacing of 1.8 m, 2.5 m, 3.5 m, and 4.5 m, in turn. The larger the pile spacing of the composite foundation under the C20 condition, the worse the integrity of the composite foundation. C40 and C50 conditions still had good integrity when the pile spacing was 2.5 m. When the pile spacing was greater than 3.5 m, the local shear strain increment in the composite foundation increased, and the integrity of the composite foundation became worse.
It can be seen that due to the deterioration of the concrete during operation, C20 concrete (low strength) was used as the concrete pile of the composite foundation, and the long-term bearing performance of the composite foundation was greatly affected by the pile spacing. The larger the pile spacing was, the greater the additional settlement of the composite foundation was due to pile deterioration. When C40 and C50 concrete (high strength) was used, the maximum additional settlement of the composite foundation was between 16 mm and 22 mm, and the pile stress and pile-soil stress ratio were obviously affected by the pile spacing.

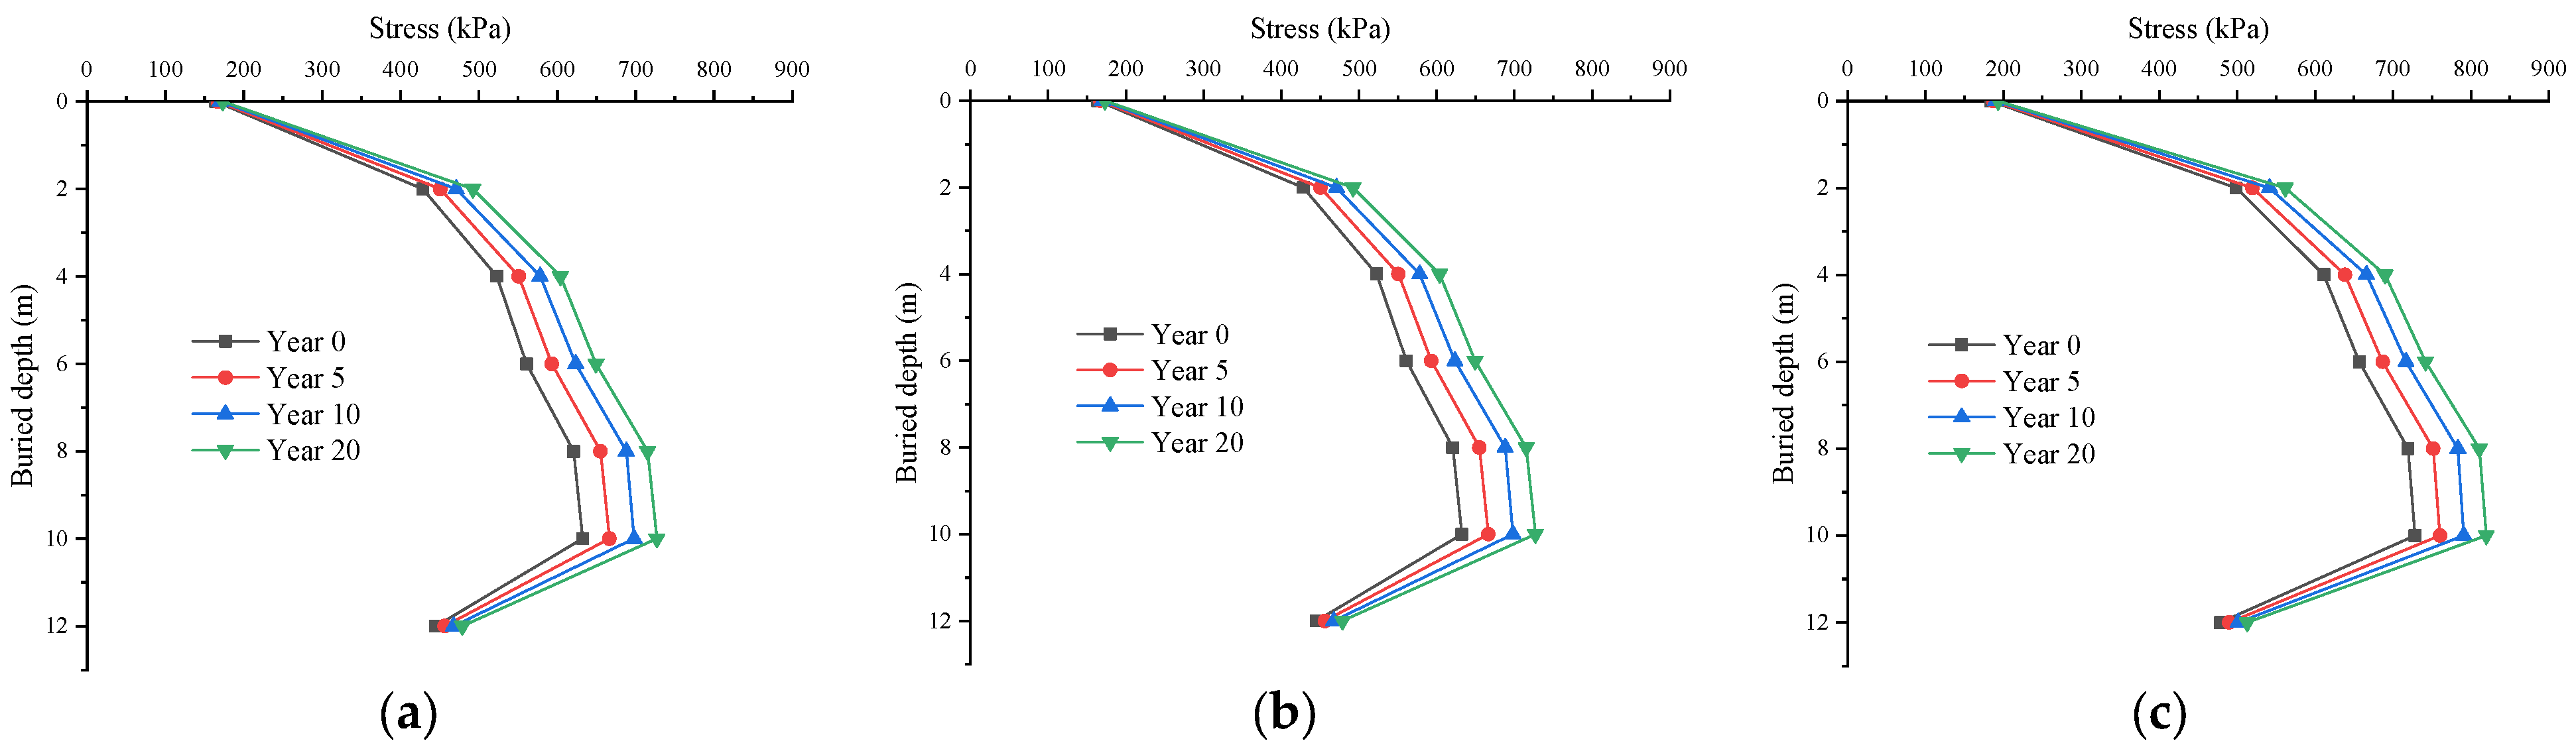
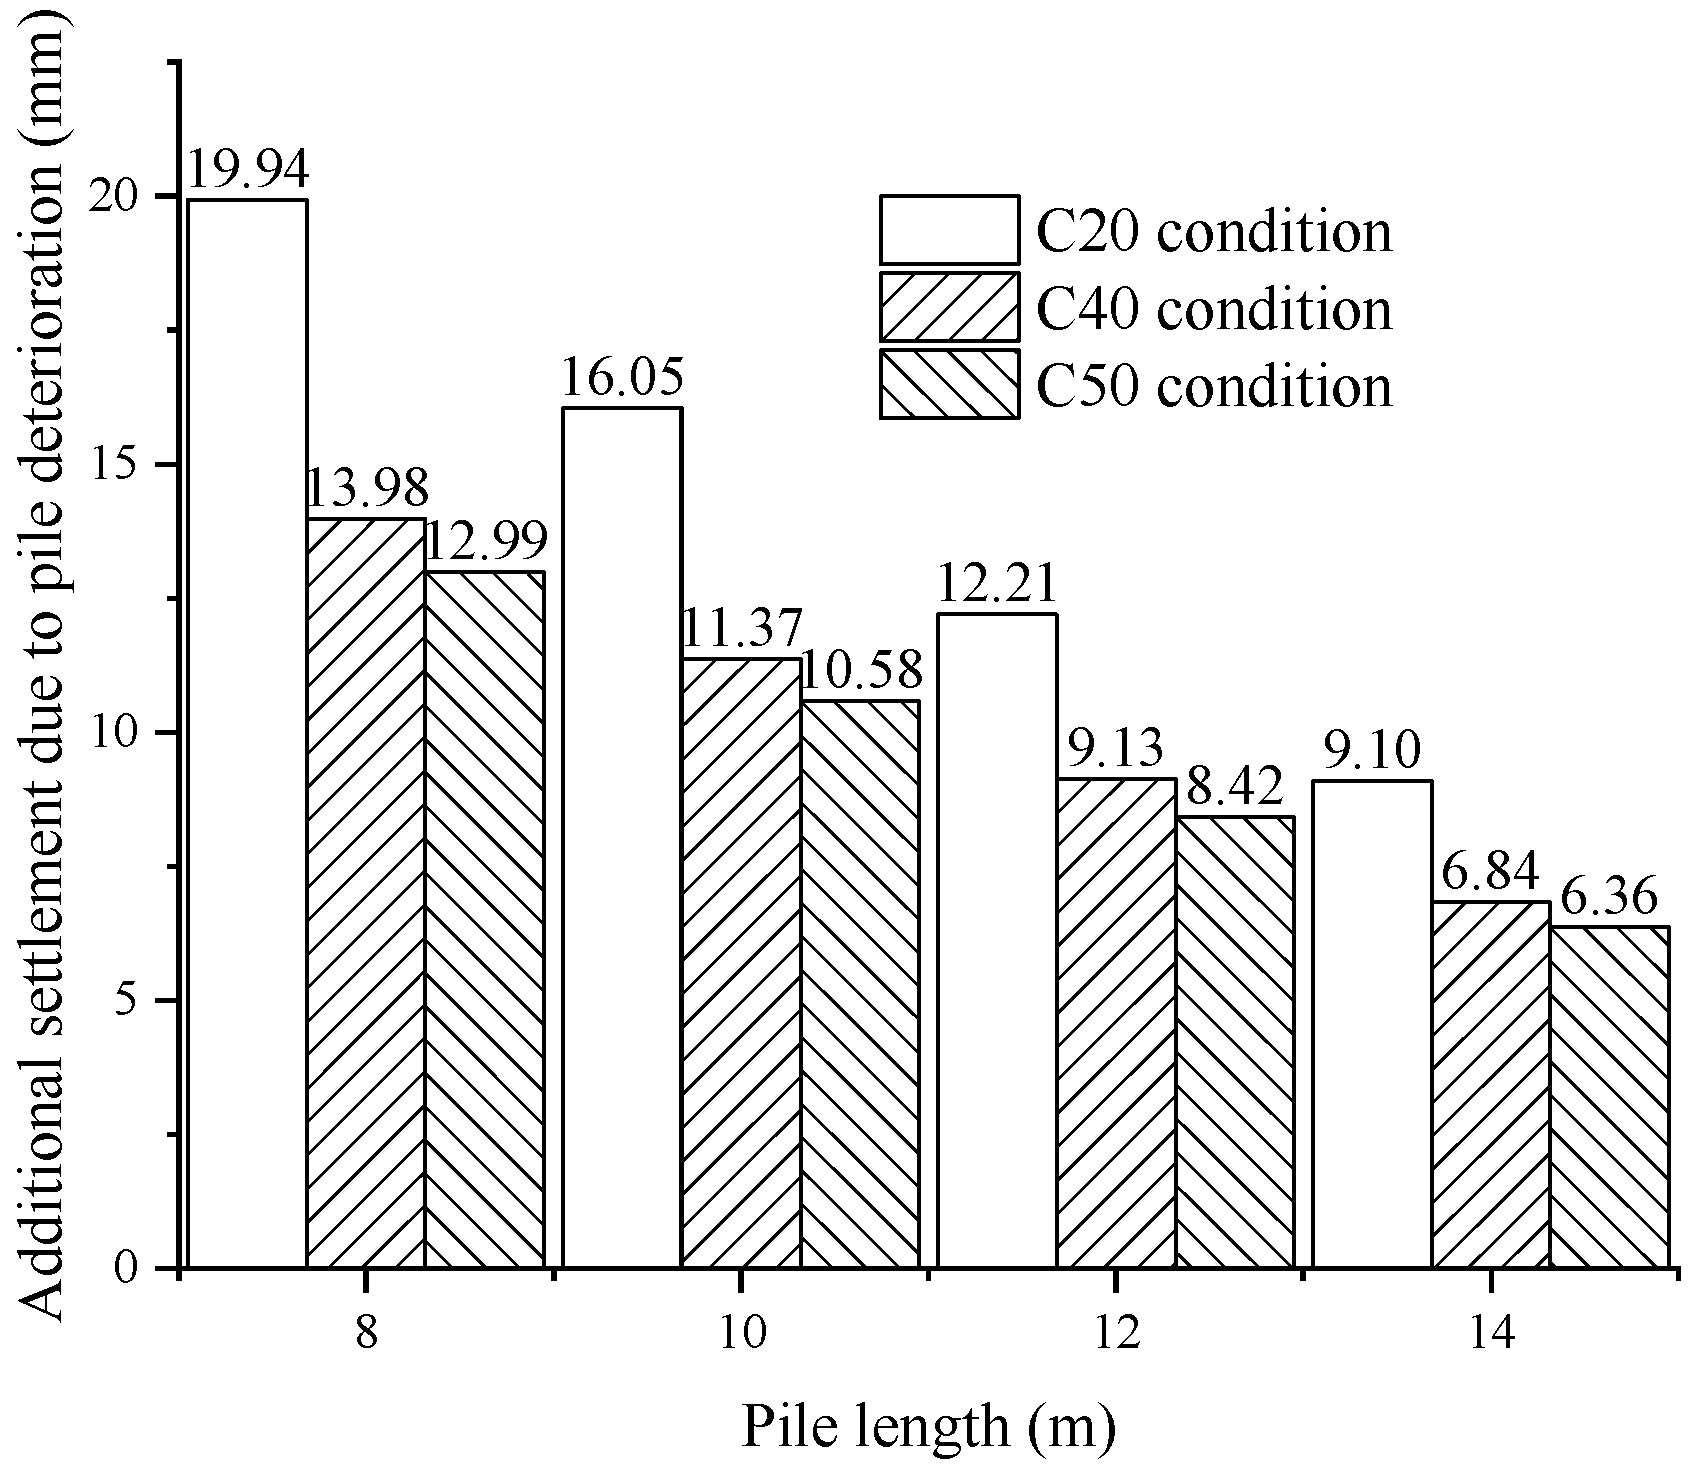
4.2.3. Influence of Pile Length on Long-Term Bearing Capacity of Composite Foundation

In the calculation, the pile diameter was taken as 0.5 m, the pile spacing was 1.8 m, and the pile length was taken as 8 m, 10 m, 12 m, and 14 m, in turn. When the pile concrete strength was C20, C40, and C50, the relationship between the embankment bottom settlement, pile stress, pile-soil stress ratio, and settlement was obtained, as shown in Figure 21, Figure 22 and Figure 23.
Increasing the pile length can significantly reduce the additional settlement caused by the deterioration of pile concrete. The pile length was increased from 8 m to 14 m, and the additional settlement under the C20 condition was reduced from 19.94 mm to 9.10 mm. The additional settlement under C40 and C50 conditions decreased from 13.98 mm and 12.99 mm to 6.84 mm and 6.36 mm, respectively. It can be seen that if low-strength concrete (C20) was used for the composite foundation, increasing the pile length could maintain the long-term bearing capacity of the composite foundation after the deterioration of pile concrete to a certain extent, and can control the additional settlement caused by the deterioration of composite ground pile.
Figure 24a–c, respectively, shows the shear strain increment contour slices under C20, C40, and C50 working conditions 20 years after construction with different pile spacing, in which i to iv correspond to the calculation results of pile lengths of 8 m, 10 m, 12 m, and 14 m in turn. When the concrete pile did not reach the clay layer (the pile length was 8 m), the shear strain increment was concentrated under the composite foundation. When the pile length reached the clay layer (the pile length was greater than 10 m), the integrity of the composite foundation under the three conditions was enhanced, and the C40 and C50 conditions were better than the C20 conditions.
For the four pile lengths, the pile stress distribution for each strength of concrete was relatively consistent, and with the increase of pile length, the peak value of pile stress gradually moved towards the pile end. When the pile length was 8 m, the peak stress of the pile body was in the section of 4 m to 7 m. When the pile length was 10 m, the peak value was between 6.5 m and 8.5 m. When the pile length was 12 m, the peak value of pile stress was between 8 m and 10 m. When the pile length was 14 m, the pile stress reached a peak near 12 m. It can be seen from Figure 16 that with the increase in pile length, the growth trend of the pile-soil stress ratio under C20, C40, and C50 conditions was relatively consistent, and the stress ratio increased by 5.19, 5.47, and 5.57, respectively.

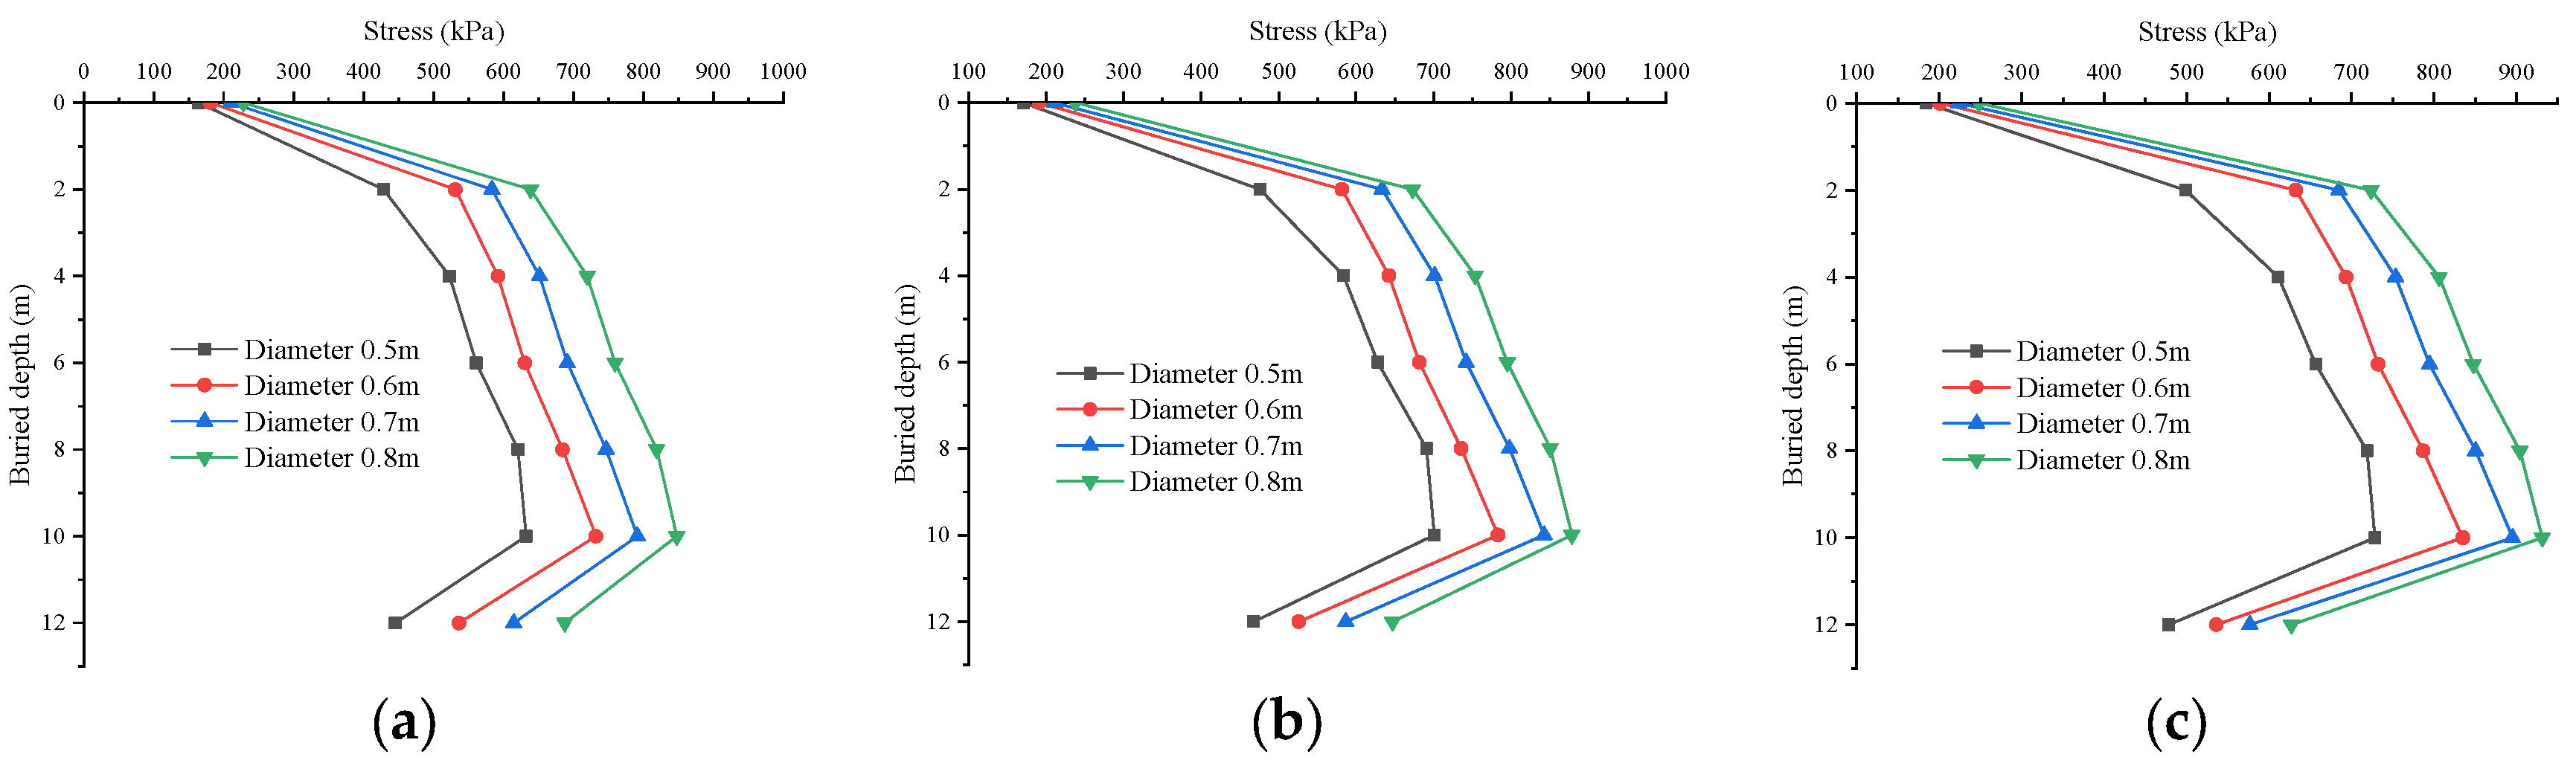
4.2.4. Influence of Pile Diameter on Long-Term Bearing Capacity of Composite Foundation

When calculating, the pile spacing was 1.8 m, the pile length was taken as 12 m, and the pile diameter was taken as 0.5 m, 0.6 m, 0.7 m, and 0.8 m, in turn. When the pile concrete strength was C20, C40, and C50, the relationship between embankment bottom settlement, the pile stress, the pile-soil stress ratio, and the settlement was obtained, as shown in Figure 25, Figure 26 and Figure 27.
Increasing the pile diameter can reduce the additional settlement. The pile diameter increased from 0.5 m to 0.8 m, and the complex additional settlement under the C20 condition decreased from 12.21 mm to 8.11 mm. The additional settlement of C40 and C50 conditions decreased from 9.13 mm and 8.42 mm to 5.89 mm and 5.51 mm, respectively. From the stress distribution of the pile shaft, when the pile diameter was 0.5 m, the stress peak of the three strength piles was between 8 m and 12 m. When the pile diameter was 0.6 m larger, the bearing capacity of the pile was enhanced, and the peak stress of the pile shaft was about 10 m. The peak stress of the pile shaft moved in the direction of the pile end. The pile-soil stress ratio of the three conditions also increased with the increase in pile diameter and showed an approximately linear relationship with the pile diameter, increased by 3.53, 3.24, and 3.41, respectively.

5. Discussion

In the (semi) immersion drying test, when the accumulation of solid phase transformation exceeds the critical value that the concrete structure can withstand, the expansion force generated by the accumulation process destroys the concrete structure, resulting in the deterioration of the concrete. In the soaking stage, in the interior of the concrete specimen for the semi-immersion test, due to the adsorption of capillary water, the corrosive ions migrate to the nonsoaked area of the specimen with free water. During the semi-immersion process, the test piece is not fully immersed in the liquid, and there is a part in contact with the air, so the evaporation phenomenon with water will occur, which also leads to a higher concentration of corrosive ions in the test piece of the semi-immersion test. These high concentrations of aggressive ions will accelerate the formation of gypsum, sulphoaluminate, and other chemical solid phase conversions. Of course, this process is also accompanied by crystallization. In the concrete specimens of the full-immersion test, the migration of corrosive ions only depends on the diffusion of ions caused by a concentration difference; therefore, the concentration of corrosive ions in concrete specimens in the full-immersion test is always in a relatively low state. This also results in a limited amount of chemical solid phase conversion in the concrete specimens of the full-immersion test. At the same time, because the specimens are all immersed in liquid, the concrete specimens in the full-immersion test will not have a crystallization effect in the immersion stage.
In the drying stage of the (semi) immersion drying test, because the drying temperature is only 60 °C, the fully soaked concrete specimens cannot be completely dried, and, compared with the semi-soaked concrete specimens, the drying degree is greater. Therefore, there is a stronger crystallization effect in the nonsoaked area of the semi-soaked concrete specimen. When entering the soaking stage again, part of the crystal in the fully immersed concrete specimen will dissolve; however, for semi-immersed concrete, due to the limited solvent penetrating into the concrete, the crystals in the non-immersed area cannot be completely dissolved. Therefore, the semi-immersed concrete specimen has a more obvious process of crystal accumulation. For example, more mirabilite crystals accumulate in the nonsoaked area, and the volume expansion rate is as high as 311%, which will make the semi-soaked concrete specimens suffer more serious damage.
To sum up, the strength of concrete specimens in the semi-immersion drying test will enter the deterioration stage earlier, and its year-on-year deterioration rate is also greater. The semi-immersion drying test is used to simulate the deterioration of the pile concrete in the adsorption area, that is, the pile concrete in the adsorption area has the strongest deterioration caused by erosion. After transforming the compressive strength obtained from the test into the elastic modulus and inputting it into the numerical calculation model, the numerical calculation results under different conditions were obtained. Whether the low-strength concrete pile (C20 working condition) or the high-strength concrete pile (C40 and C50 working condition) is used, the change of pile spacing has the greatest impact on the pile stress, but the high-strength concrete pile can obviously maintain the performance of controlling settlement for a longer time. When using low-strength concrete, the performance deterioration of the composite foundation caused by concrete erosion can also be resisted by increasing the pile length and pile diameter.

6. Conclusions

In this paper, the indoor concrete deterioration test was carried out and a numerical calculation was carried out on this basis. The change of the bearing capacity of the concrete pile composite foundation after being eroded by saline soil during long-term operation, and the influence of pile spacing, pile length, and pile diameter on the long-term bearing capacity of the composite foundation were studied. This provides a basis and reference for the construction of high-speed railways on similar foundations. The main conclusions are as follows:
(1)
The strength development of concrete specimens in the soaking zone and the adsorption zone showed the continuous hydration stage, the strengthening stage, and the deterioration stage, but the specimens in the adsorption zone entered the deterioration stage earlier than those in the soaking zone. The strength loss of the C40 and C50 specimens was small at the initial stage of a rapid freeze-thaw, and the strength began to decline significantly after 40 cycles. The strength of the C20 specimens began to decline at the initial stage of the freeze-thaw tests.
(2)
Within 20 years after construction, the maximum additional settlement of the C20 concrete pile was 12.21 mm. The pile-soil stress ratio decreased by 0.63 in 20 years. If C40 and C50 concrete piles were used, the additional settlement increased by 9.13 mm and 8.42 mm, respectively, within 20 years after construction, and the pile-soil stress ratio decreased by 0.22 and 0.07, respectively.
(3)
Twenty years after construction, with the increase of pile spacing from 1.8 m to 4.5 m, the additional settlement of the C20 concrete pile composite foundation increased from 12.21 mm to 31.47 mm, close to 20 mm. The additional settlement of C40 and C50 concrete composite foundations increased from 9.13 mm and 8.42 mm to 20.82 mm and 17.20 mm, respectively. The pile spacing had a significant impact on the stress distribution of the piles. The change in the pile-soil stress ratio was approximately linear with the pile spacing. With the increase of pile spacing, the pile-soil stress ratio under the C20 condition increased by 2.42, and that under the C40 and C50 conditions increased by 6.59 and 8.63, respectively.
(4)
With the increase in pile length and pile diameter, the peak value of pile stress moved to the pile end, and the pile-soil stress ratio was proportional to the pile length and pile diameter. As the pile length and diameter increased, the peak stress of the pile body moved towards the pile end, and the changes in the pile soil-stress ratio under the three conditions were similar.

Author Contributions

Conceptualization, D.W. and X.Y.; methodology, D.W.; software, D.W.; validation, S.Z., C.C. and Y.Z.; formal analysis, D.W., X.Y., and C.C.; investigation, C.C.; resources, X.Y. and S.Z.; data curation, S.Z. and Y.Z.; writing—original draft preparation, D.W. and X.Y.; writing—review and editing, D.W.; visualization, C.C.; supervision, X.Y.; project administration, X.Y.; funding acquisition, Y.Z. All authors have read and agreed to the published version of the manuscript.

Funding

The work described herein is supported by the National Natural Science Fund of China (Grant NO. 42101126).

Data Availability Statement

The data used to support the findings of this study are available from the corresponding author upon request. The data are not publicly available due to privacy.

Conflicts of Interest

Chi Chen was employed by the company CCCC Second Highway Consultants Co., Ltd. The remaining authors declare that the research was conducted in the absence of any commercial or financial relationships that could be construed as a potential conflict of interest.

References

  1. Wu, L.; Jiang, C.; Wang, W.; Gao, X.; Xia, Y. Chloride Transport Characteristics of Concrete Exposed to Coastal Dredger Fill Silty Soil Environment. Buildings 2023, 13, 2398. [Google Scholar]
  2. Muthulingam, S.; Rao, B.N. Non-uniform time-to-corrosion initiation in steel reinforced concrete under chloride environment. Corros. Sci. 2014, 82, 304–315. [Google Scholar] [CrossRef]
  3. Naidu Gopu, G.; Joseph, S.A. Corrosion Behavior of Fiber-Reinforced Concrete—A Review. Fibers 2022, 10, 38. [Google Scholar] [CrossRef]
  4. Bulu, P. Corrosion behavior of steel reinforcement in concrete exposed to composite chloride–sulfate environment. Constr. Build. Mater. 2014, 72, 398–410. [Google Scholar]
  5. Yu, B.; Zhou, H.; Xia, J.; Liu, X.; Xie, C.; Zhang, K. Study on the Sulfate Erosion Behavior of Cement-based Materials with Different Water-to-binder Ratios Containing Stone Powder in a Low-Temperature Saline Soil Area. KSCE J. Civ. Eng. 2023, 27, 4020–4031. [Google Scholar] [CrossRef]
  6. Guo, J.-J.; Wang, K.; Guo, T.; Yang, Z.-Y.; Zhang, P. Effect of Dry–Wet Ratio on Properties of Concrete Under Sulfate Attack. Materials 2019, 12, 2755. [Google Scholar]
  7. Tixier, R.; Mobasher, B. Modeling of Damage in Cement-Based Materials Subjected to External Sulfate Attack. I: Formulation. J. Mater. Civ. Eng. 2003, 15, 305–313. [Google Scholar]
  8. Robert, J.F. Salt damage in porous materials: How high supersaturations are generated. J. Cryst. Growth 2002, 242, 435–454. [Google Scholar]
  9. Jin, Z.; Sun, W.; Zhang, Y.; Lai, J. Effect of Chloride on Damage of Concrete Attacked by Sulfate. J. Wuhan Univ. Technol. 2006, 3, 43–46. [Google Scholar]
  10. Liang, Y.N.; Huang, J.Y.; Lin, X.J.; Ji, T. The effect of chloride on concrete under sulfate attack. J. Fuzhou Univ. Nat. Sci. Ed. 2011, 39, 947–951. [Google Scholar]
  11. Chen, X.; Tang, M.; Ma, K. Underground concrete structure exposure to sulfate and chloride invading environment. J. Cent. South Univ. Sci. Technol. 2012, 43, 2803–2812. [Google Scholar]
  12. Zhang, F.; Wei, F.; Wu, X.; Hu, Z.; Li, X.; Gao, L. Study on Concrete Deterioration and Chloride Ion Diffusion Mechanism by Different Aqueous NaCl-MgSO4 Concentrations. Buildings 2022, 12, 1843. [Google Scholar]
  13. Ma, K.; Long, G.; Xie, Y. Corrosion products of cementious materials under sulfate partial soaking attack. Concrete 2013, 287, 33–35+39. [Google Scholar]
  14. Suleiman, A.R.; Soliman, A.M.; Nehdi, M.L. Effect of surface treatment on durability of concrete exposed to physical sulfate attack. Constr. Build. Mater. 2014, 73, 674–681. [Google Scholar] [CrossRef]
  15. Bassuoni, M.T.; Rahman, M.M. Response of concrete to accelerated physical salt attack exposure. Cem. Concr. Res. 2015, 79, 395–408. [Google Scholar]
  16. Li, B.; Fang, Q.; Fang, P. Durability of high-volume mineral admixture concrete half immersed in sodium sulfate solution. J. Harbin Eng. Univ. 2020, 41, 892–898. [Google Scholar]
  17. Liu, D.; Chen, H.; Tang, Y.T.; Gong, C.; Jian, Y.; Cao, K. Analysis and Prediction of Sulfate Erosion Damage of Concrete in Service Tunnel Based on ARIMA Model. Materials 2021, 14, 5904. [Google Scholar] [CrossRef] [PubMed]
  18. Wells, T.; Melchers, R.E. An observation-based model for corrosion of concrete sewers under aggressive conditions. Cem. Concr. Res. 2014, 61–62, 1–10. [Google Scholar]
  19. Tittarelli, F.; Carsana, M.; Bellezze, T. Corrosion behavior of reinforced no-fines concrete. Corros. Sci. 2013, 70, 119–126. [Google Scholar]
  20. Jiang, G.; Keller, J.; Bond, P.L.; Yuan, Z. Predicting concrete corrosion of sewers using artificial neural network. Water Res. 2016, 92, 52–60. [Google Scholar]
  21. Poursaee, A. Application of agent-based paradigm to model corrosion of steel in concrete environment. Corros. Eng. Sci. Technol. 2018, 53, 259–364. [Google Scholar] [CrossRef]
  22. Lu, C.; Qiao, H.; Wei, Z.; Li, K.; Fu, Y. Accelerated Damage and Deterioration Mechanism of Concrete in Saline Soil Area and Reliability Analysis Based on Wiener Progress. J. China Univ. Min. Technol. 2021, 50, 265–272+288. [Google Scholar]
  23. Wen, X.; Weng, X.; Zhang, J.; Zhang, J. Characteristics of Sulfate Corrosion Resistance of Pavement Base and Precaution Measures. J. Highw. Transp. Res. Dev. 2015, 32, 36–40. [Google Scholar]
  24. Kou, J.; Li, L.; Shi, J. Experimental Study on Durability and Mechanical Properties of High Ductile Concrete under Long-Term Sulfate Attack. KSCE J. Civ. Eng. 2022, 26, 1793–1802. [Google Scholar] [CrossRef]
  25. Li, P.; Zhao, G.; Li, L.; Shao, W.; Yao, M. Bored piles’ vertical bearing strength evolution in sulfate saline soil. J. Harbin Inst. Technol. 2017, 49, 84–89. [Google Scholar]
  26. Zhao, G.; Li, P.; Fan, H.; Li, L.; Cui, J. Influence of Chloride-sulfate Attack on Degradation and Sulfate Diffusion of Cast-in-Situ Concrete Structures Subjected to Wet-dry Cycles. J. Tongji Univ. Nat. Sci. 2018, 46, 1637–1645+1744. [Google Scholar]
  27. Ouyang, W.Y.; Chen, J.K.; Jiang, M.Q. Evolution of surface hardness of concrete under sulfate attack. Constr. Build. Mater. 2014, 53, 419–424. [Google Scholar] [CrossRef]
  28. Chen, Z.F.; Liu, G.F.; Peng, G.J.; Li, S.C. Mechanical Properties and Microstructure Characteristics of Manufactured-Sand Concrete Under Coupled Effect of Salt Erosion and Freeze-Thaw Cycles. Sci. Adv. Mater. 2018, 11, 555–562. [Google Scholar]
  29. Chen, S.; Ren, J.; Li, Y.; Ren, X.; Song, Y.; Sun, J. Macroscopic and Mesoscopic Deterioration Behaviors of Concretes under the Coupling Effect of Chlorine Salt Erosion and Freezing–Thawing Cycle. Materials 2021, 14, 6471. [Google Scholar]
  30. Chen, S.; Ren, J.; Ren, X.; Li, Y. Deterioration laws of concrete durability under the coupling action of salt erosion and drying-wetting cycles. Front. Mater. 2022, 9, 1003945. [Google Scholar] [CrossRef]
  31. Yang, D.; Yan, C.; Liu, S.; Jia, Z.; Wang, C. Prediction of Concrete Compressive Strength in Saline Soil Environments. Materials 2022, 15, 4663. [Google Scholar] [CrossRef] [PubMed]
  32. Zheng, S.; Qi, L.; He, R.; Wu, J.; Wang, Z. Erosion damage and expansion evolution of interfacial transition zone in concrete under dry-wet cycles and sulfate erosion. Constr. Build. Mater. 2021, 307, 124954. [Google Scholar] [CrossRef]
  33. Bastidas-Arteaga, E.; Sánchez-Silva, M.; Chateauneuf, A.; Silva, M.R. A Chateauneuf, MR Silva. Coupled reliability model of biodeterioration, chloride ingress and cracking for reinforced concrete structures. Struct. Saf. 2008, 30, 110–129. [Google Scholar]
  34. Kozubal, J.; Wyjadłowski, M.; Steshenko, D. Probabilistic analysis of a concrete column in an aggressive soil environment. PLoS ONE 2019, 14, e0212902. [Google Scholar] [CrossRef] [PubMed]
  35. Momeni, E.; Nazir, R.; Armaghani, D.J.; Maizir, H. Prediction of pile bearing capacity using a hybrid genetic algorithm-based ANN. Measurement 2014, 57, 122–131. [Google Scholar] [CrossRef]
  36. Baydjanov, D.O.; Abdrakhmanova, K.A.; Kropachev, P.A.; Rakhimova, G.M. Modified concrete for producing pile foundations. Mag. Civ. Eng. 2019, 86, 3–10. [Google Scholar]
  37. Kolovos, K.G.; Asteris, P.G.; Cotsovos, D.M.; Badogiannis, E.; Tsivilis, S. Mechanical properties of soilcrete mixtures modified with metakaolin. Constr. Build. Mater. 2013, 47, 1026–1036. [Google Scholar] [CrossRef]
  38. Sarir, P.; Shen, S.L.; Arulrajah, A.; Horpibulsuk, S. Concrete wedge and coarse sand coating shear connection system in GFRP concrete composite deck. Constr. Build. Mater. 2016, 114, 650–655. [Google Scholar] [CrossRef]
  39. Yan, F.; Lin, Z.; Yang, M. Bond mechanism and bond strength of GFRP bars to concrete: A review. Compos. Part B Eng. 2016, 98, 56–69. [Google Scholar]
  40. Siamphukdee, K.; Zou, R.; Collins, F.; Shayan, A. Modeling Steel-Concrete Bond Strength Depletion during Corrosion. ACI Mater. J. 2018, 115, 267–277. [Google Scholar]
  41. Yu, B.; Tao, B.; Liu, Y.; Liu, S. Probabilistic prediction model of elastic modulus based on compressive strength of concrete. Concrete 2017, 10, 7–11. [Google Scholar]
Figure 1. Testing process.
Buildings 14 00289 g001
Figure 2. Division of erosion conditions for concrete piles.
Buildings 14 00289 g002
Figure 3. Strength time curve of pile concrete specimens in the full-immersion drying test: (a) C20 concrete specimens, (b) C40 concrete specimens, and (c) C50 concrete specimens.
Buildings 14 00289 g003
Figure 4. Change curve of the mass loss rate of concrete specimens in the full-immersion drying test: (a) C20 concrete specimens, (b) C40 concrete specimens, and (c) C50 concrete specimens.
Buildings 14 00289 g004
Figure 5. Strength comparison between the full-immersion drying test and semi-immersion drying test: (a) C20 concrete specimens, (b) C40 concrete specimens, and (c) C50 concrete specimens.
Buildings 14 00289 g005
Figure 6. Variation of mass loss rate of specimens with erosion age in the full immersion drying test and semi-immersion drying test: (a) C20 concrete specimens, (b) C40 concrete specimens, and (c) C50 concrete specimens.
Buildings 14 00289 g006
Figure 7. Appearance of concrete specimens in the semi-immersion drying test and full-immersion drying test: (a) salt crystals precipitated from semi-immersion drying test pieces, and (b) no salt crystals precipitated from the test piece after full-immersion drying.
Buildings 14 00289 g007
Figure 8. Fast freeze-thaw test results: (a) strength development law, and (b) mass loss rate development law.
Buildings 14 00289 g008
Figure 9. SEM photos of C20 concrete specimen before and after erosion: (a) reference concrete sample, and (b) concrete specimen after semi-immersion drying test.
Buildings 14 00289 g009
Figure 10. SEM photos of C40 concrete specimen before and after erosion: (a) reference concrete sample, and (b) concrete specimen after semi-immersion drying test.
Buildings 14 00289 g010
Figure 11. SEM photos of C50 concrete specimen before and after erosion: (a) reference concrete sample, and (b) concrete specimen after semi-immersion drying test.
Buildings 14 00289 g011
Figure 12. Numerical calculation model.
Buildings 14 00289 g012
Figure 13. The additional settlement caused by pile deterioration of different strengths within 20 years after construction.
Buildings 14 00289 g013
Figure 14. Changes in pile stress caused by deterioration of piles with different strengths within 20 years: (a) C20, (b) C40, and (c) C50.
Buildings 14 00289 g014
Figure 15. Changes in pile-soil stress ratio caused by deterioration of piles with different strengths within 20 years after construction.
Buildings 14 00289 g015
Figure 16. Contour slice of post-construction 20-shear strain increments under different conditions: (a) C20, (b) C40, and (c) C50. (i to iv are the calculation results of 0, 5, 10, and 20 years after construction).
Buildings 14 00289 g016
Figure 17. Maximum settlement of composite foundation caused by pile spacing 20 years after construction.
Buildings 14 00289 g017
Figure 18. The influence of pile spacing on pile stress after 20 years of construction: (a) C20, (b) C40, and (c) C50.
Buildings 14 00289 g018
Figure 19. Changes in pile-soil stress ratio caused by pile spacing after 20 years of construction.
Buildings 14 00289 g019
Figure 20. Shear strain increment contour slice with different pile spacing after 20 years of construction: (a) C20, (b) C40, and (c) C50. ( i to iv are the calculation results of pile spacing of 1.8 m, 2.5 m, 3.5 m, and 4.5 m, in turn).
Buildings 14 00289 g020
Figure 21. The influence of pile length on composite foundation settlement after 20 years of construction.
Buildings 14 00289 g021
Figure 22. The influence of pile length on pile stress after 20 years of construction: (a) 8 m, (b) 10 m, (c) 12 m, and (d) 14 m.
Buildings 14 00289 g022
Figure 23. Changes in pile-soil stress ratio caused by pile length after 20 years of construction.
Buildings 14 00289 g023
Figure 24. Contour slice of shear strain increment for different pile lengths after 20 years of construction: (a) C20, (b) C40, and (c) C50. (i to iv correspond to the calculation results of pile lengths of 8 m, 10 m, 12 m, and 14 m in turn).
Buildings 14 00289 g024
Figure 25. The influence of pile diameter on composite foundation settlement after 20 years of construction.
Buildings 14 00289 g025
Figure 26. The influence of pile diameter on pile stress after 20 years of construction: (a) C20, (b) C40, and (c) C50.
Buildings 14 00289 g026
Figure 27. Changes in pile-soil stress ratio caused by pile diameter after 20 years of construction.
Buildings 14 00289 g027
Table 1. Material composition of concrete.
NameProducerNotes
CementIran Delijan42.5 strength grade
Mineral powderIran Sepahan40% dosage
Silica fumeIran Azna40% dosage
SandIran Razani/
Crushed/pebbleIran ZanbourakApparent density 2680 g/cm3
Water reducerPersian White0.6% dosage
Air-entraining agentsPersian White0.01% dosage
Mixing water/drinking water
Table 2. Amount of concrete materials per cubic meter (kg).
ConditionCementMineral PowderSilica FumeSandCrushed/PebbleWater ReducerAir-Entraining AgentsMixing WaterTotal Rubber Material
C20170128228599241.580.0262165320
C40223168298129682.520.0420160420
C50251189337469892.840.0473142473
Table 3. Test grouping of the plain concrete pile in the salt lake area.
Strength GradeMixing WaterCorrosion ModeSimulation Partition
C20Erosion solutionFull immersion drying cycleSoaking zone
C20Erosion solutionSemi-soaking drying cycleAdsorption zone
C20Erosion waterRapid freeze-thaw testFreeze-thaw zone
C40Erosion solutionFull immersion drying cycleSoaking zone
C40Erosion solutionSemi-soaking drying cycleAdsorption zone
C40Purified waterRapid freeze-thaw testFreeze-thaw zone
C50Erosion solutionFull immersion drying cycleSoaking zone
C50Erosion solutionSemi-soaking drying cycleAdsorption zone
C50Purified waterRapid freeze-thaw testFreeze-thaw zone
Table 4. Soil parameter.
Soil Layer TypeThickness (m)Severe γ (kn/m3)Cohesion c (kPa)Internal Friction Angle φ (°)Compression Modulus Es (MPA)Poisson Ratio μ
Salinized poorly graded sand7.7419826190.3
Salinized soft soil1161415.530.36
Salinized clay-173217120.31
Table 5. Elastic modulus of pile concrete (GPa).
Concrete GradeErosion Condition5 Years After Construction10 Years After Construction20 Years After Construction
C20Soaking zone25.74823.96520.761
Adsorption zone24.56522.15518.022
Freeze-thaw zone25.86624.07520.856
Other25.86624.07520.856
C40Soaking zone36.19734.17530.462
Adsorption zone35.24632.83828.505
Freeze-thaw zone35.56533.89030.772
Other35.56533.89030.772
C50Soaking zone39.31437.53834.221
Adsorption zone39.21636.76632.317
Freeze-thaw zone38.26137.06834.785
Other38.26137.06834.785
Disclaimer/Publisher’s Note: The statements, opinions and data contained in all publications are solely those of the individual author(s) and contributor(s) and not of MDPI and/or the editor(s). MDPI and/or the editor(s) disclaim responsibility for any injury to people or property resulting from any ideas, methods, instructions or products referred to in the content.

