

Influence of Different Construction Methods on Lateral Displacement of Diaphragm Walls in Large-Scale Unsupported Deep Excavation

Abstract
:1. Introduction
Literature Review
- Peripheral Top-Down and Central Bottom-Up Method
- Impact of Zoned Excavation
- Lateral Deformation of Retaining Walls Due to Deep Excavation
- Application of Numerical Analysis in Deep Excavation Engineering
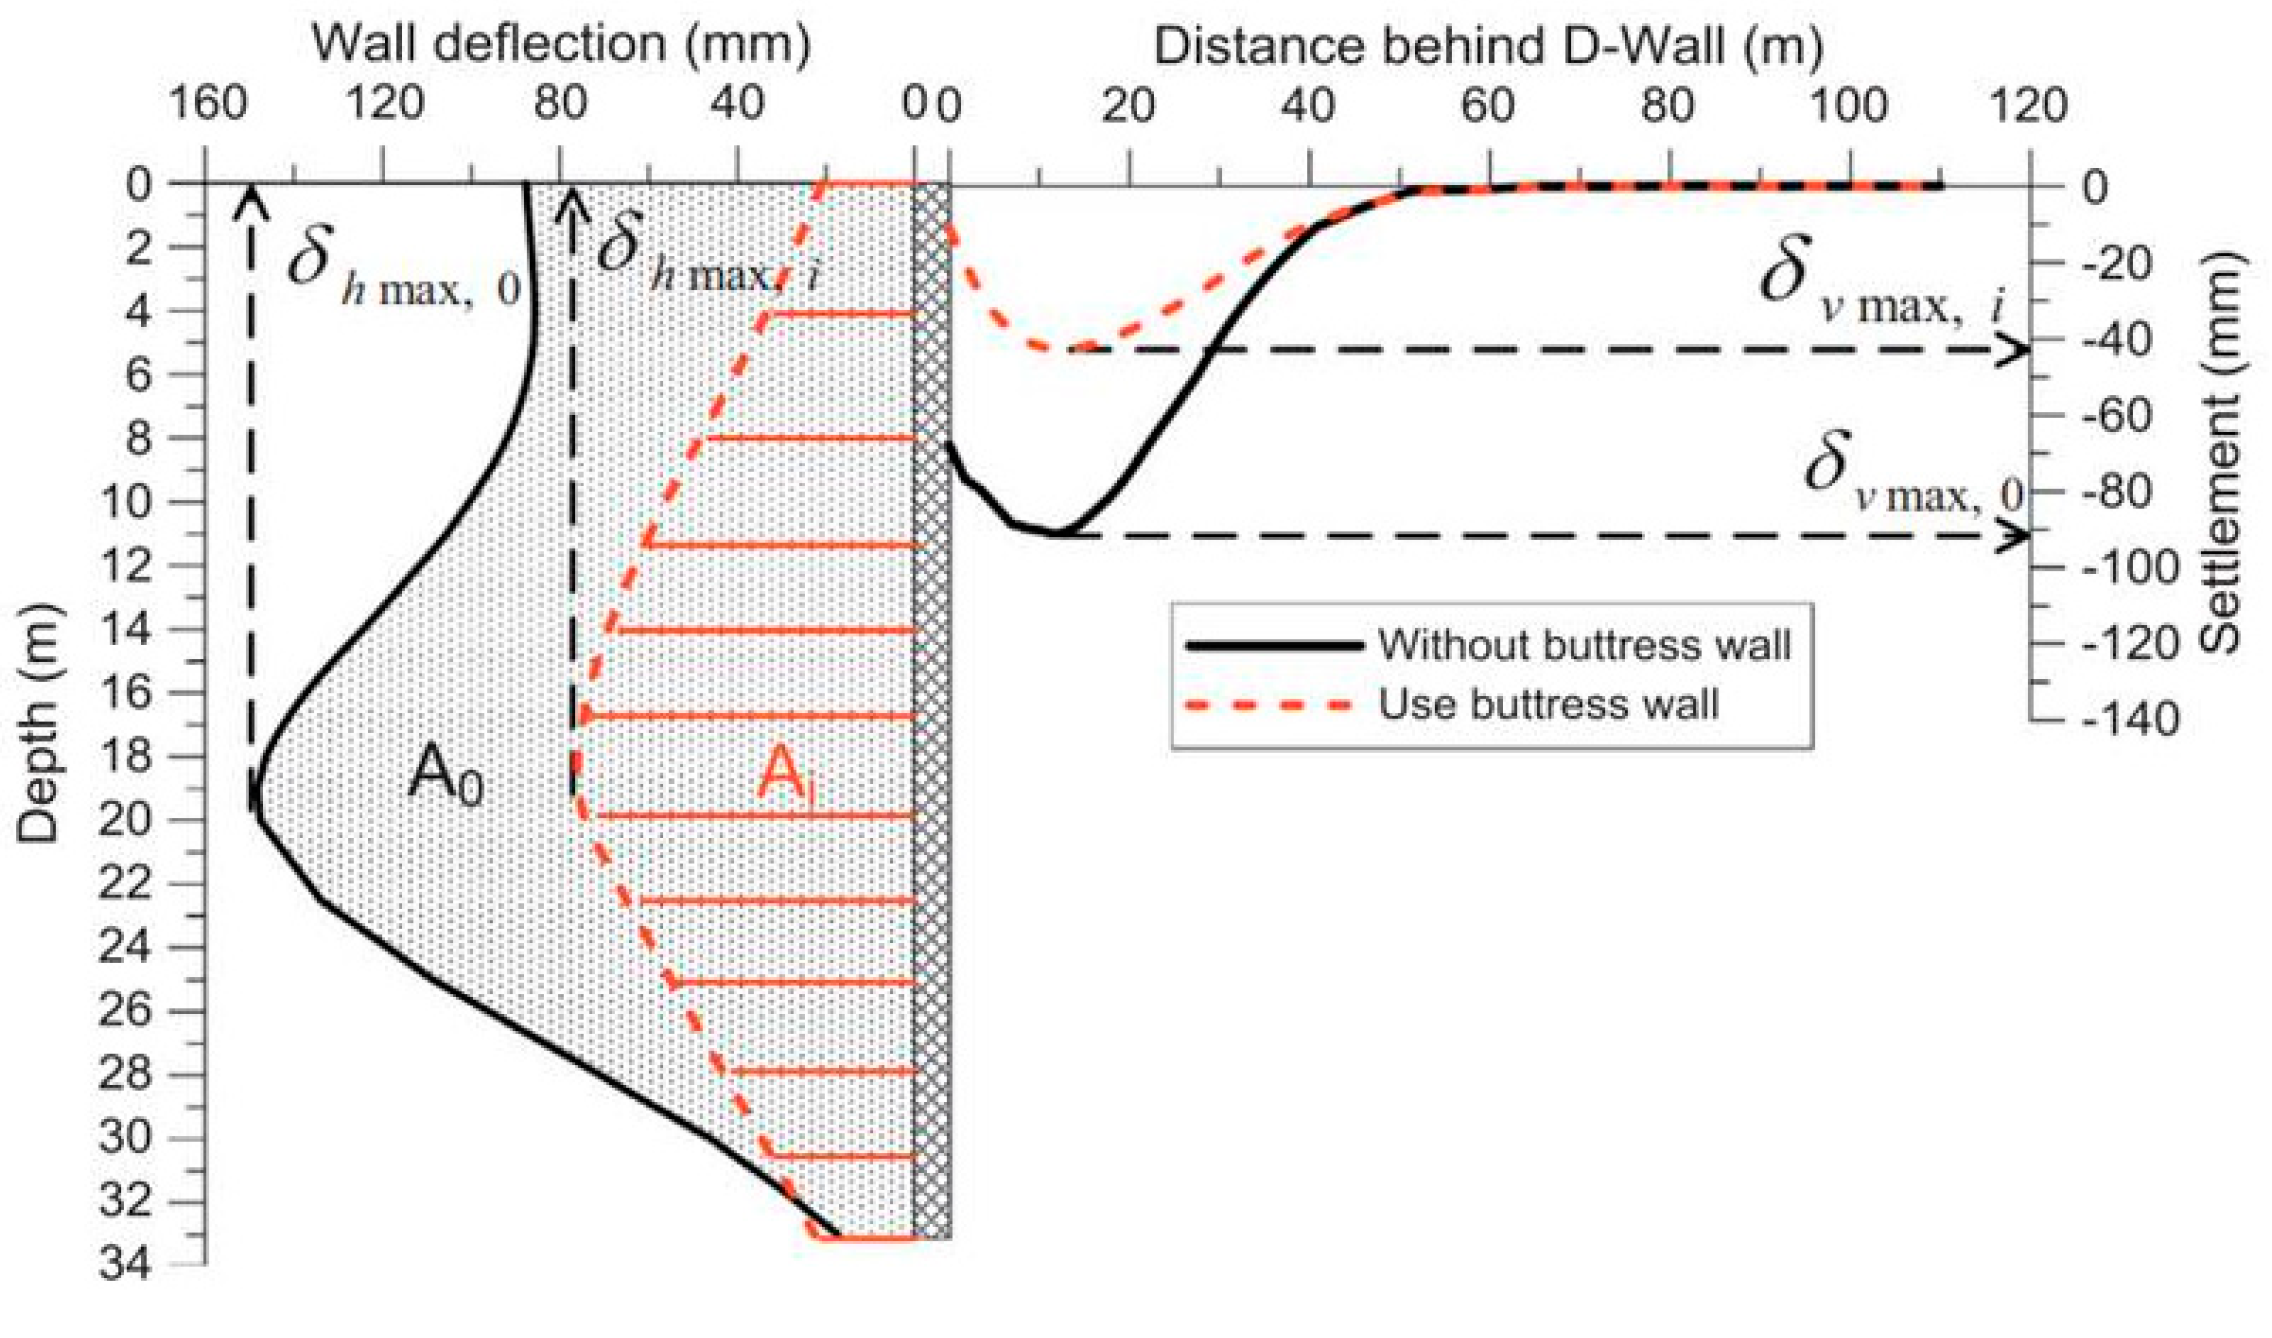
- δhm-0 = the maximum lateral wall deflection without buttress walls;
- δhm-i = the maximum lateral wall deflection with buttress walls;
- δvm-0 = the maximum ground surface settlement without buttress walls;
- δvm-i = the maximum ground surface settlement with buttress walls;
- A0 = the plane area of lateral wall deflection without buttress walls;
- Ai = the plane area of lateral wall deflection with buttress walls.
- Utilization of Corners
- Large-Scale Deep Excavation
2. Materials and Methods
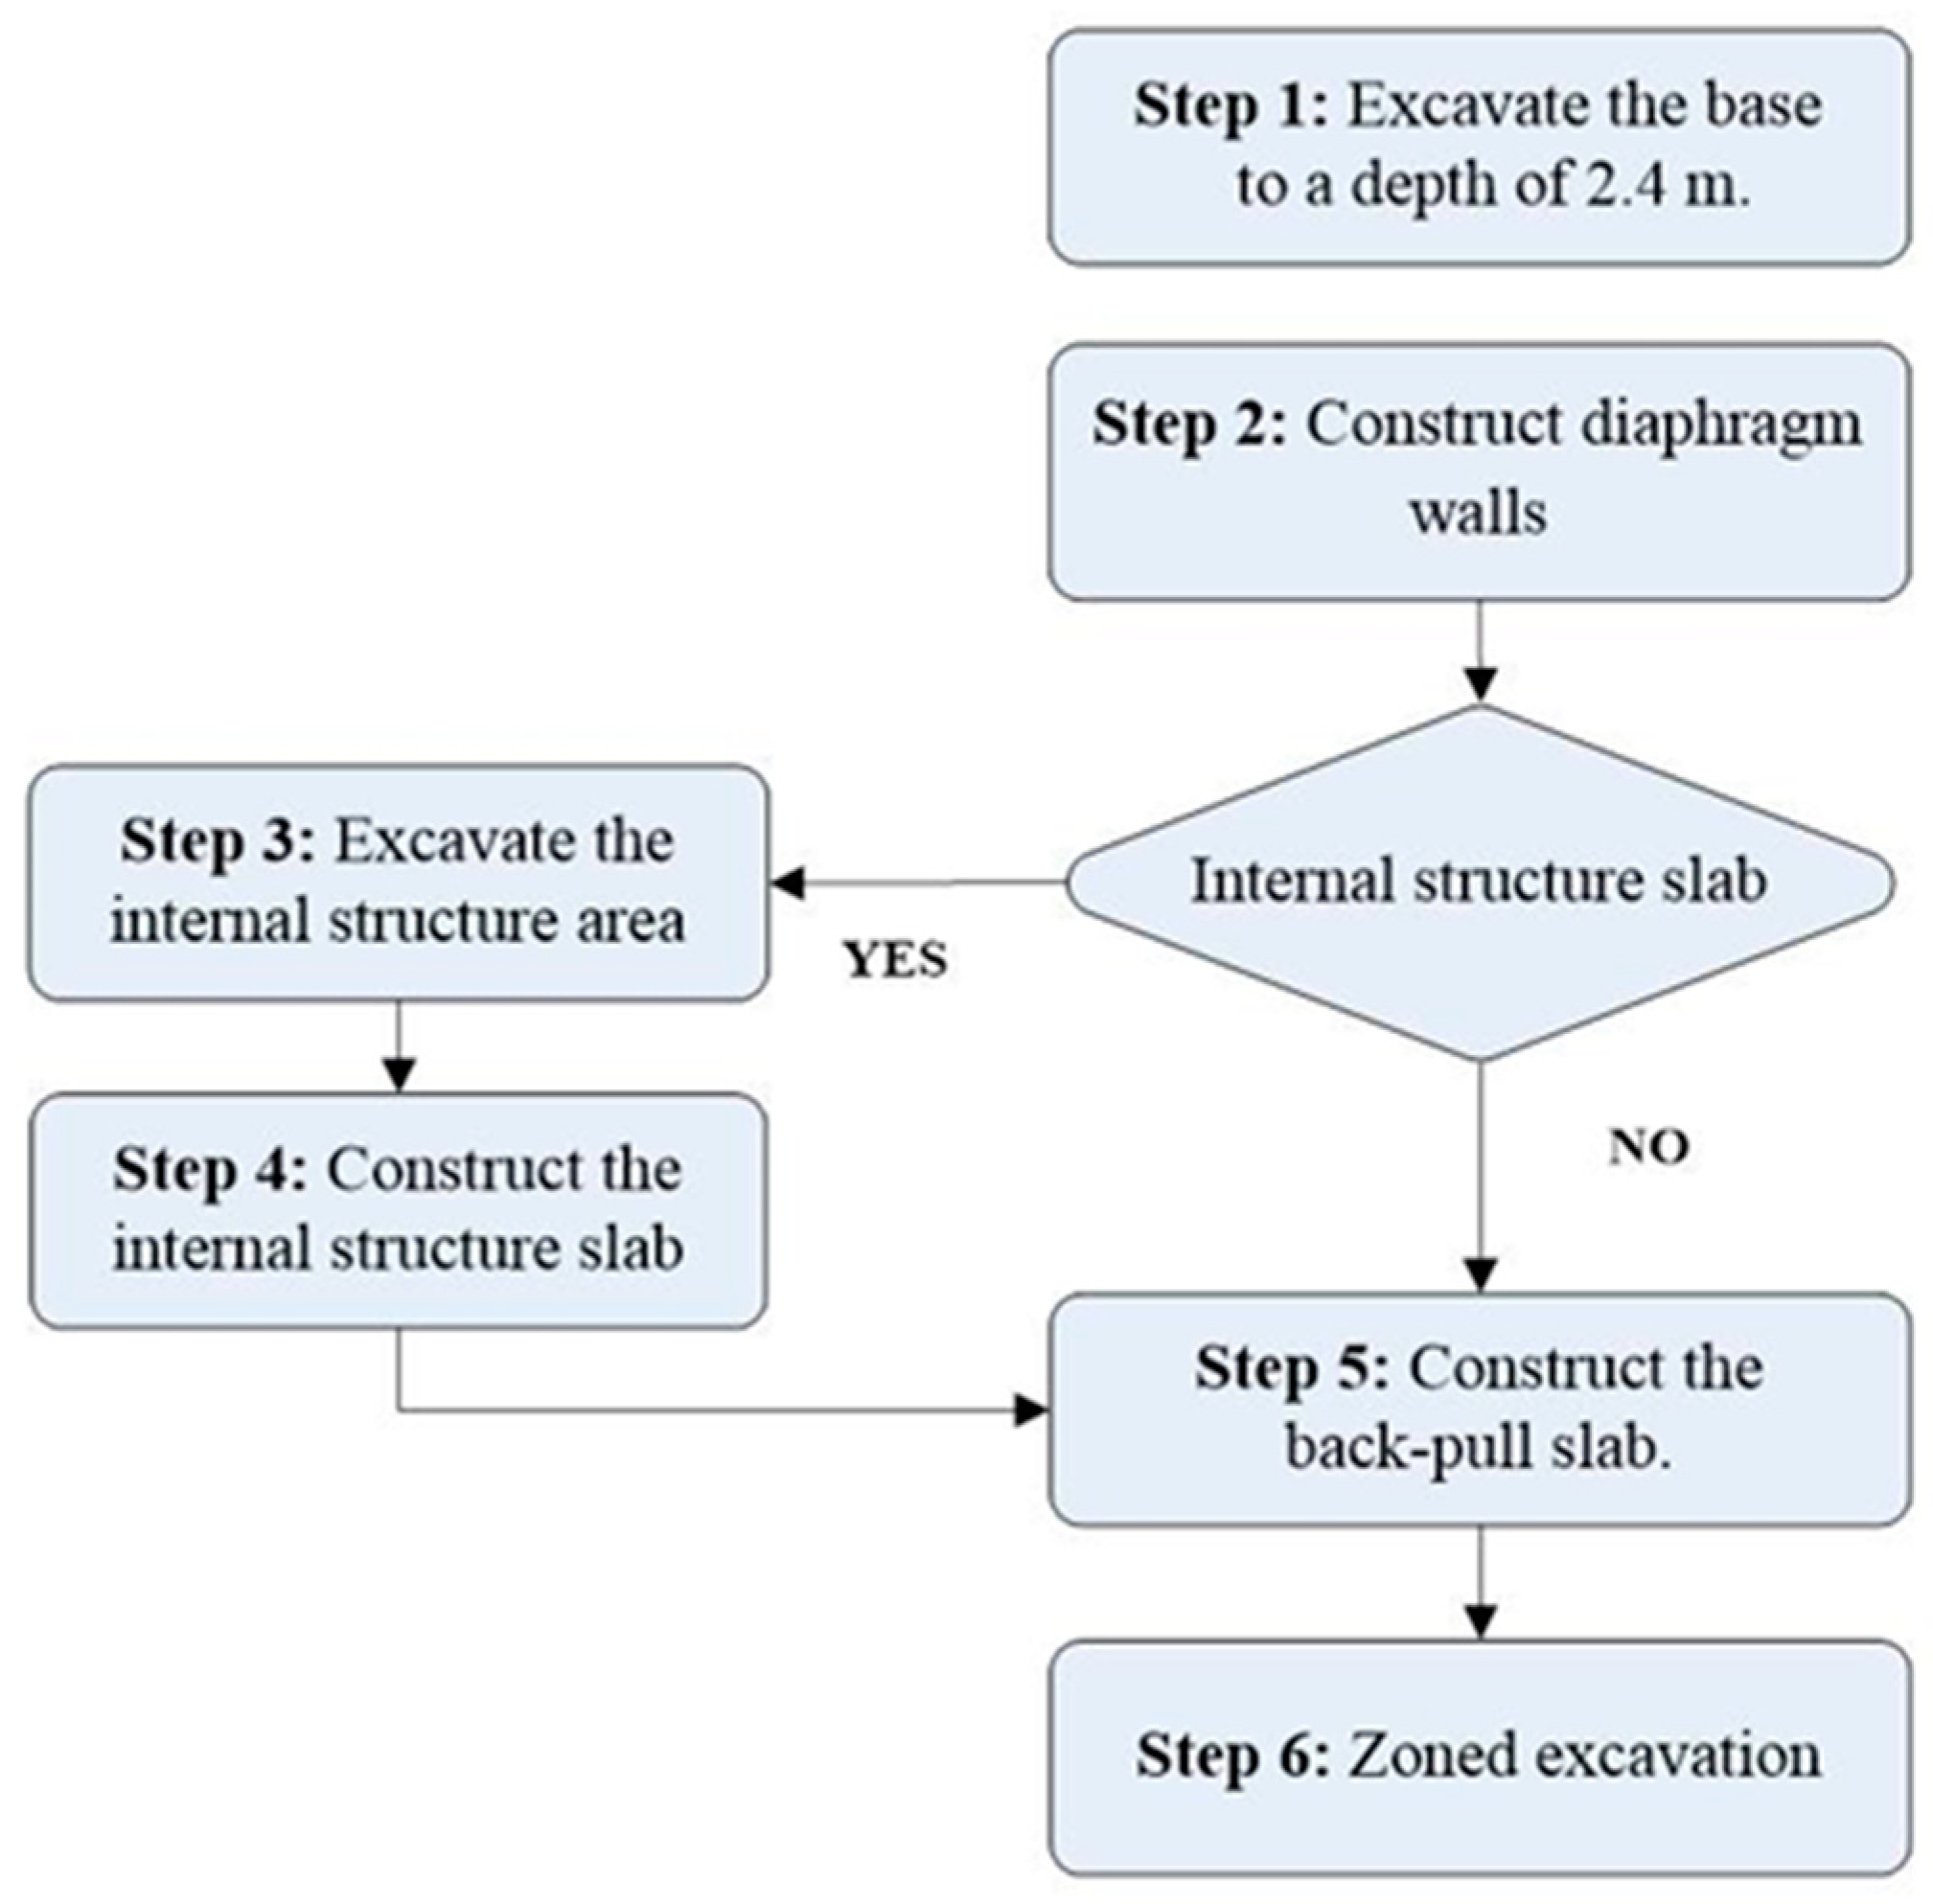
2.1. Research Methodology and Steps
2.2. Case Introduction
- (1)
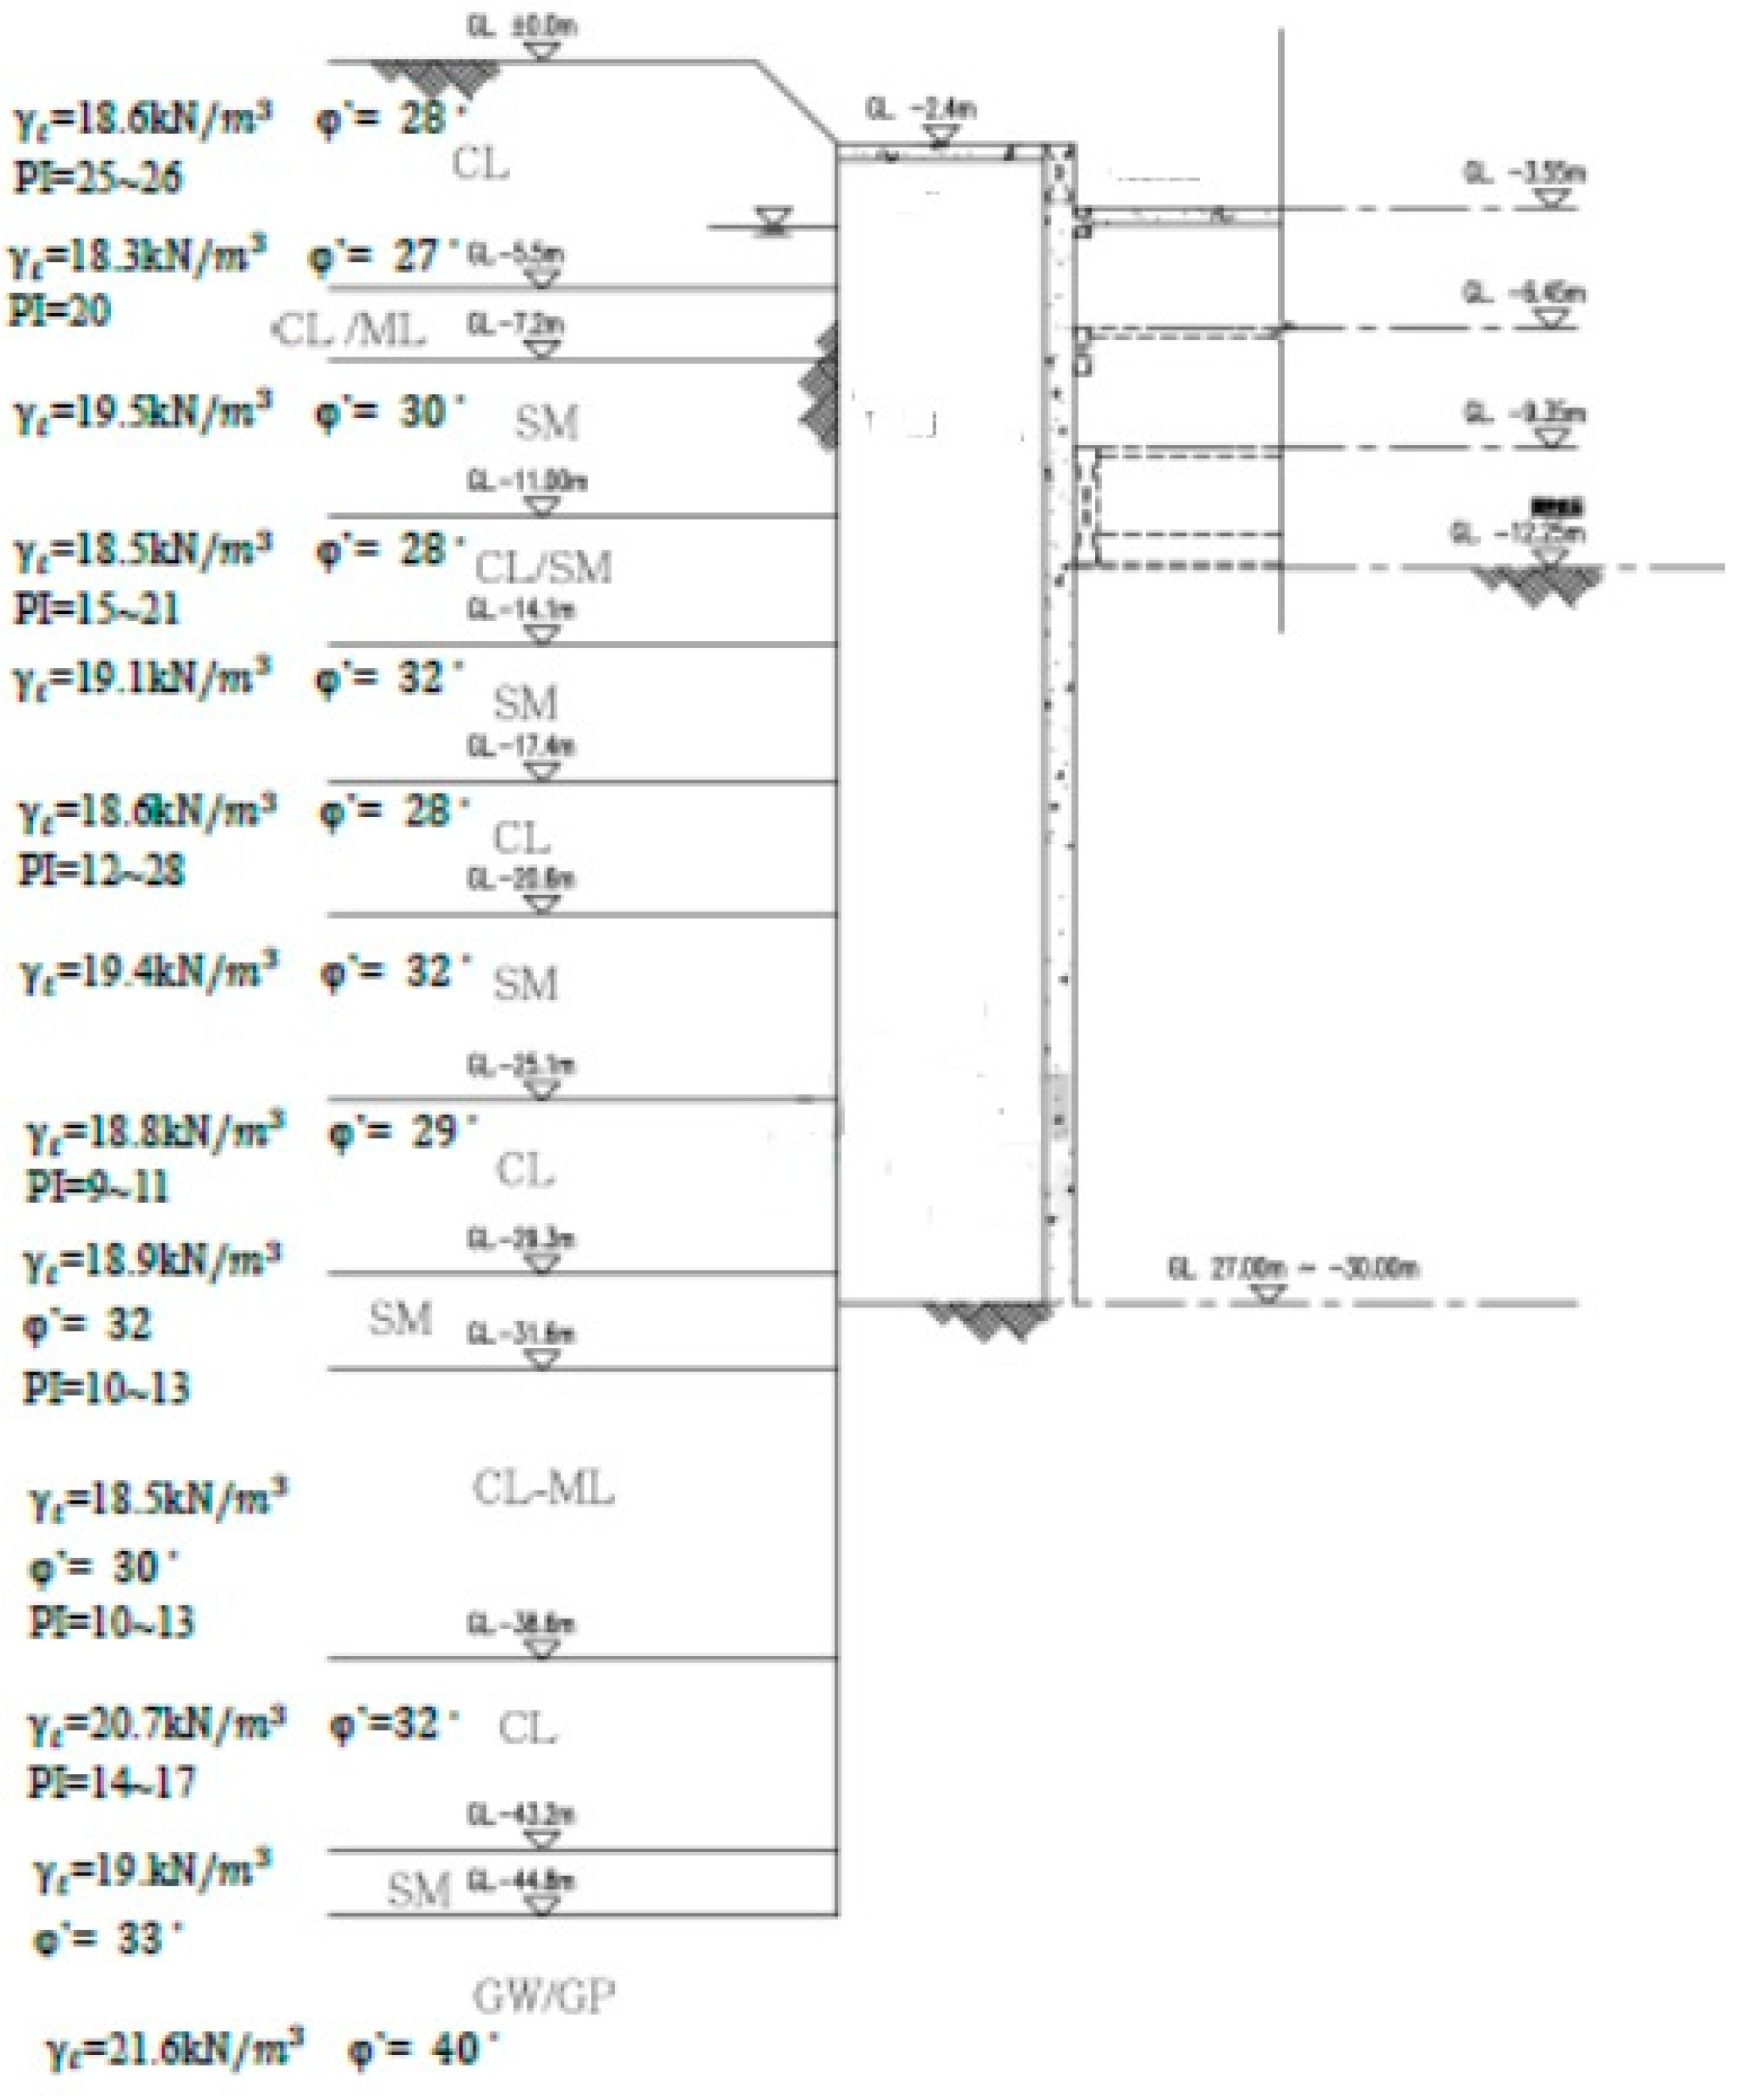
- Soil Layer Overview
- (2)
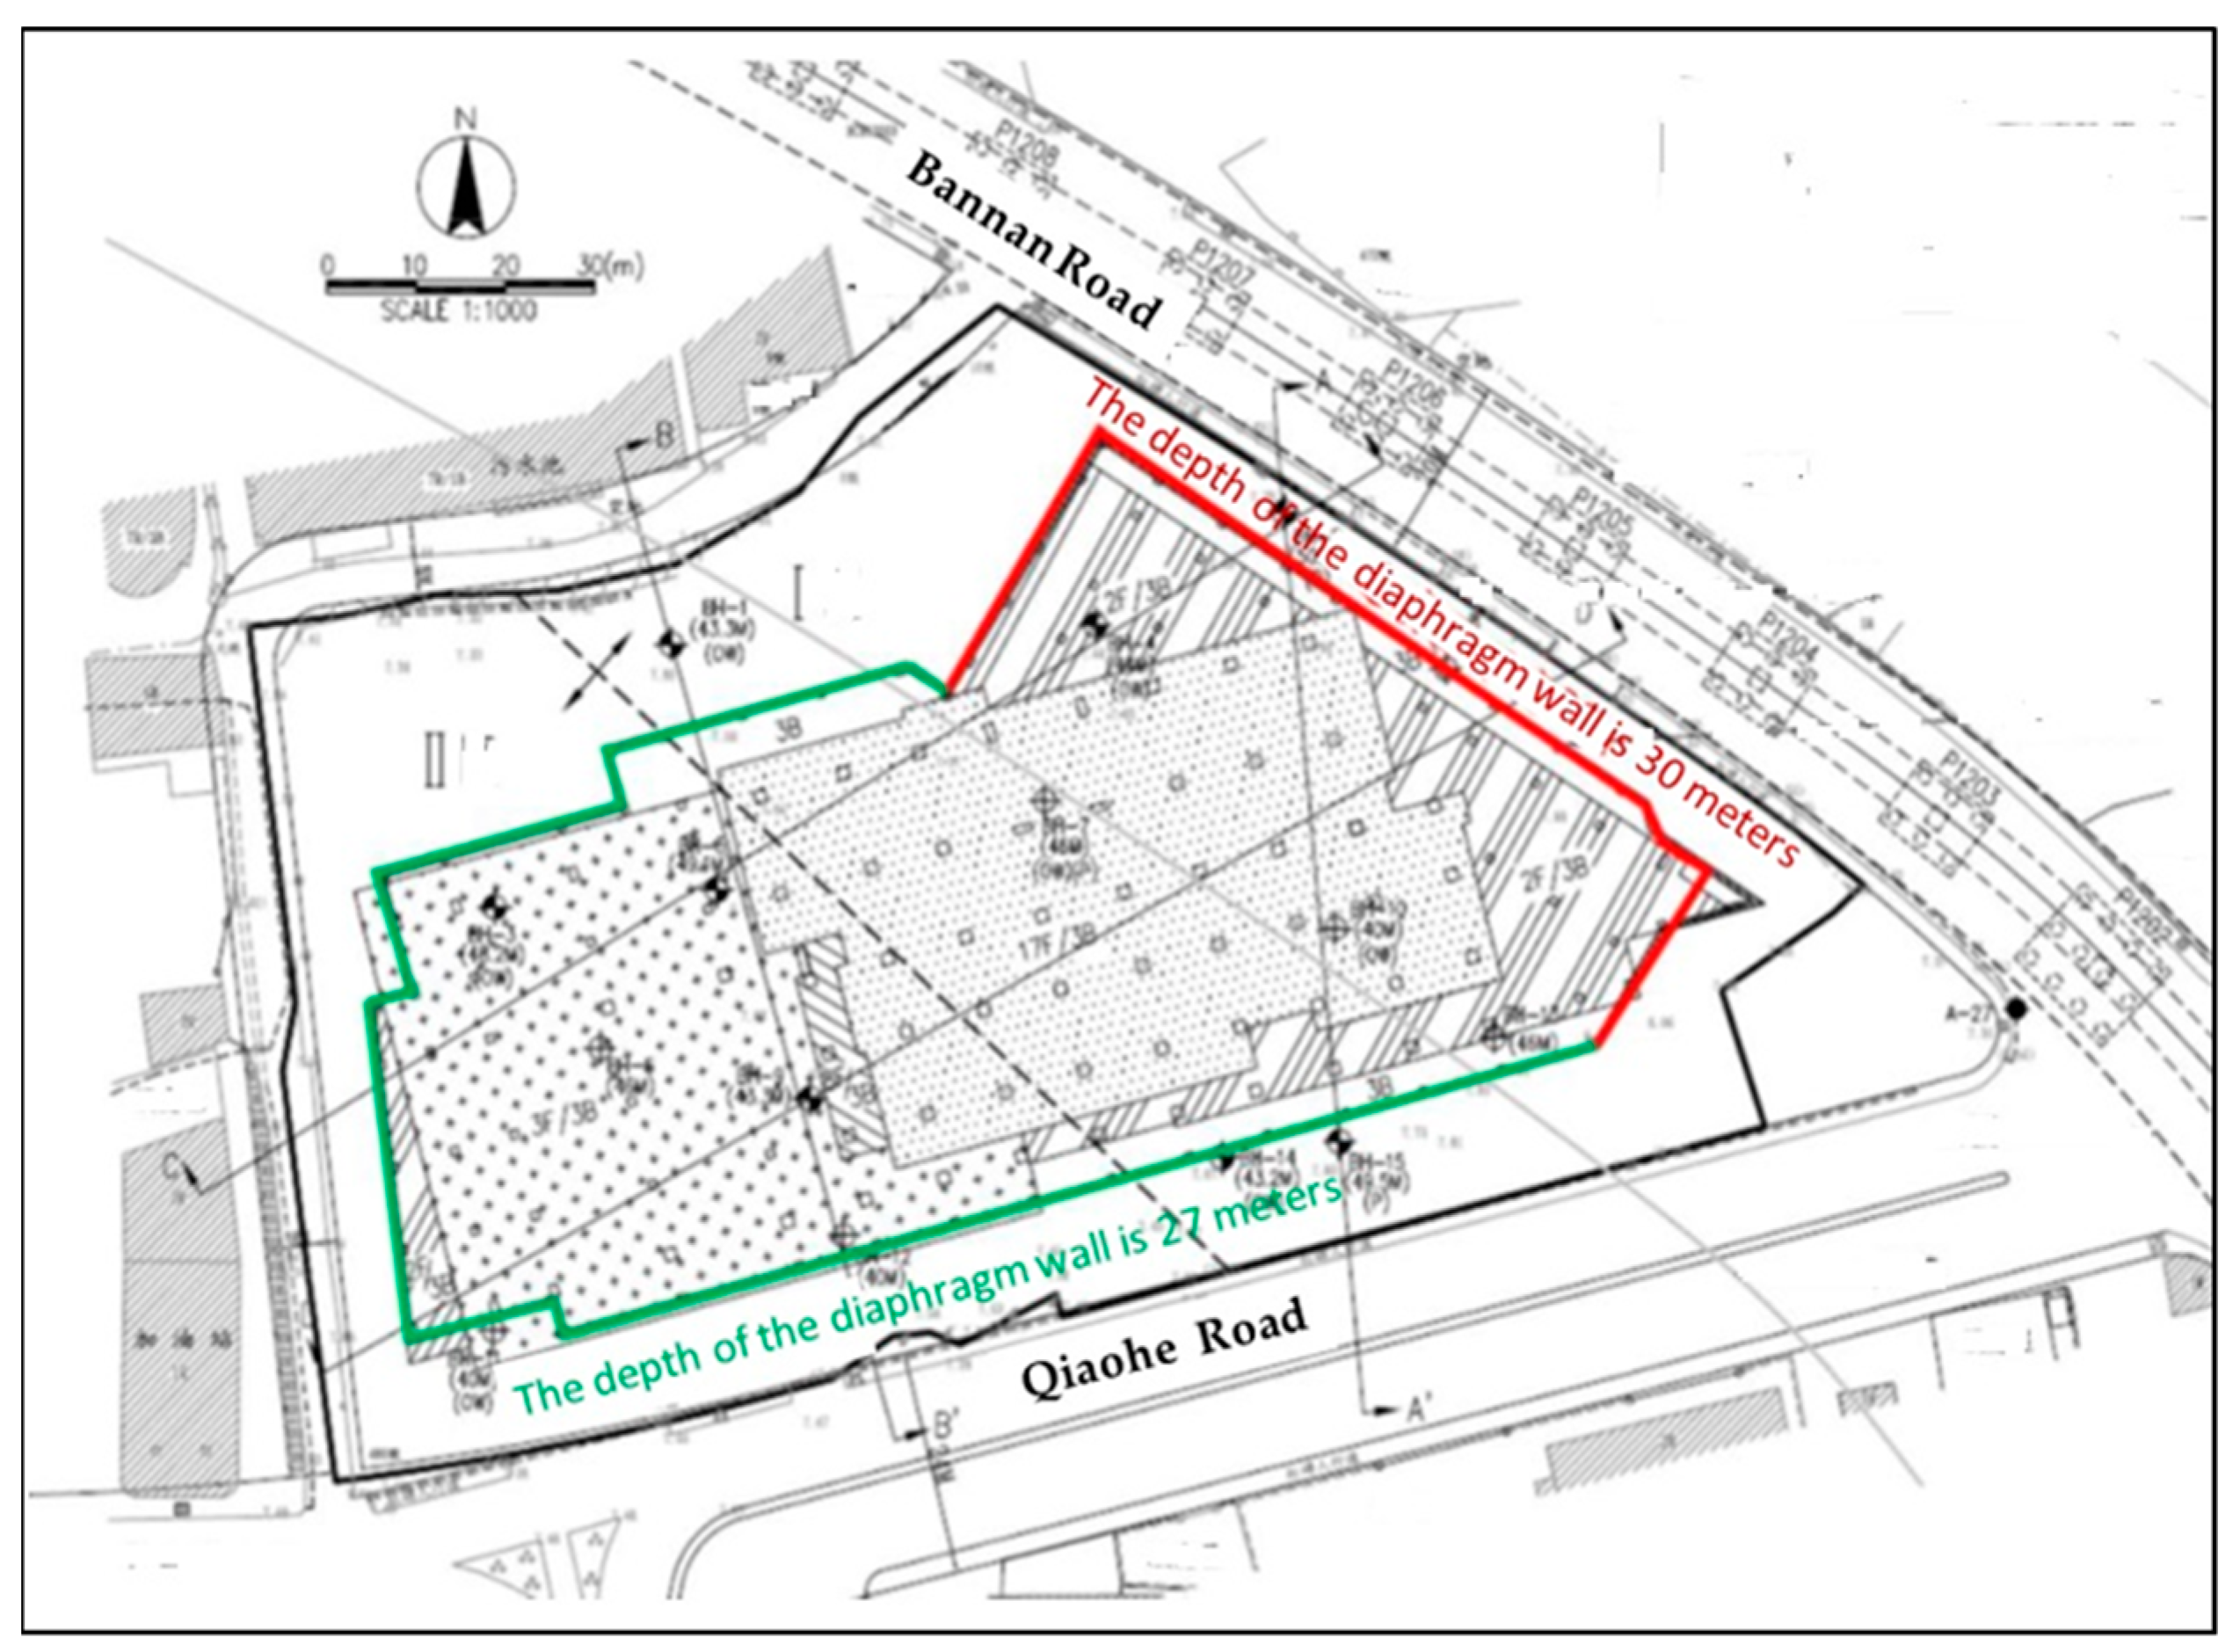
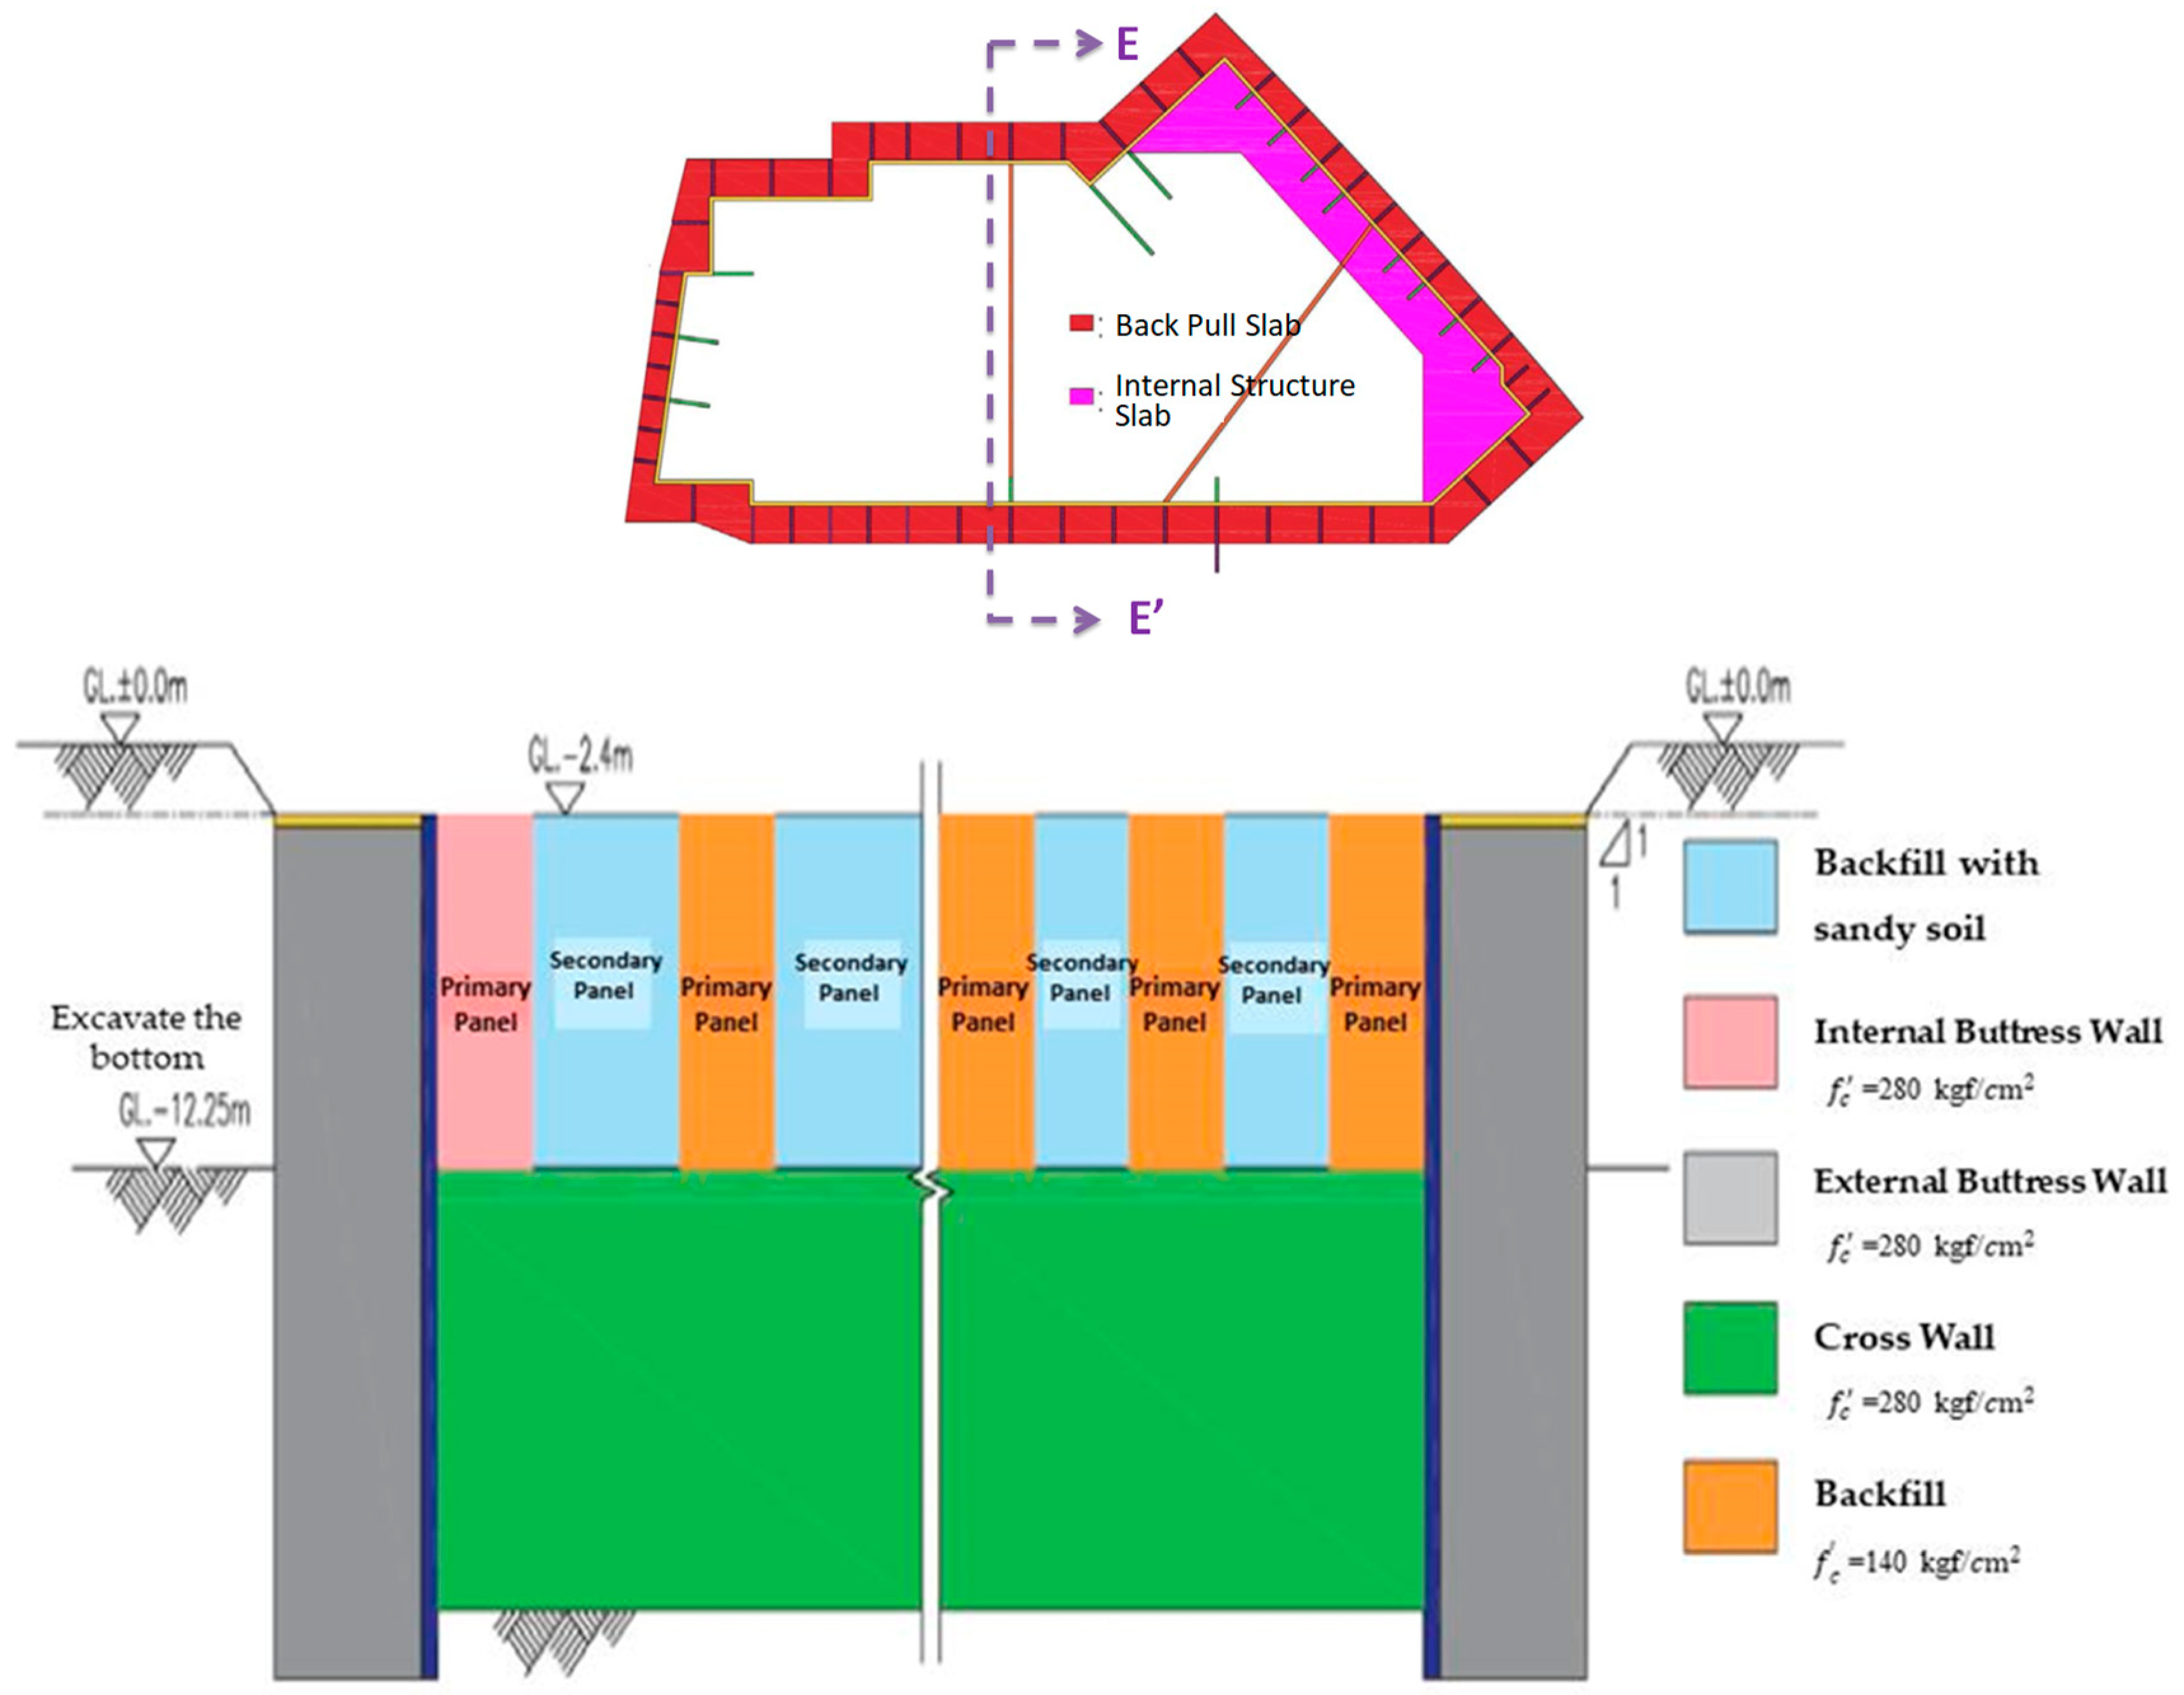
- Diaphragm Wall Installation
- (3)
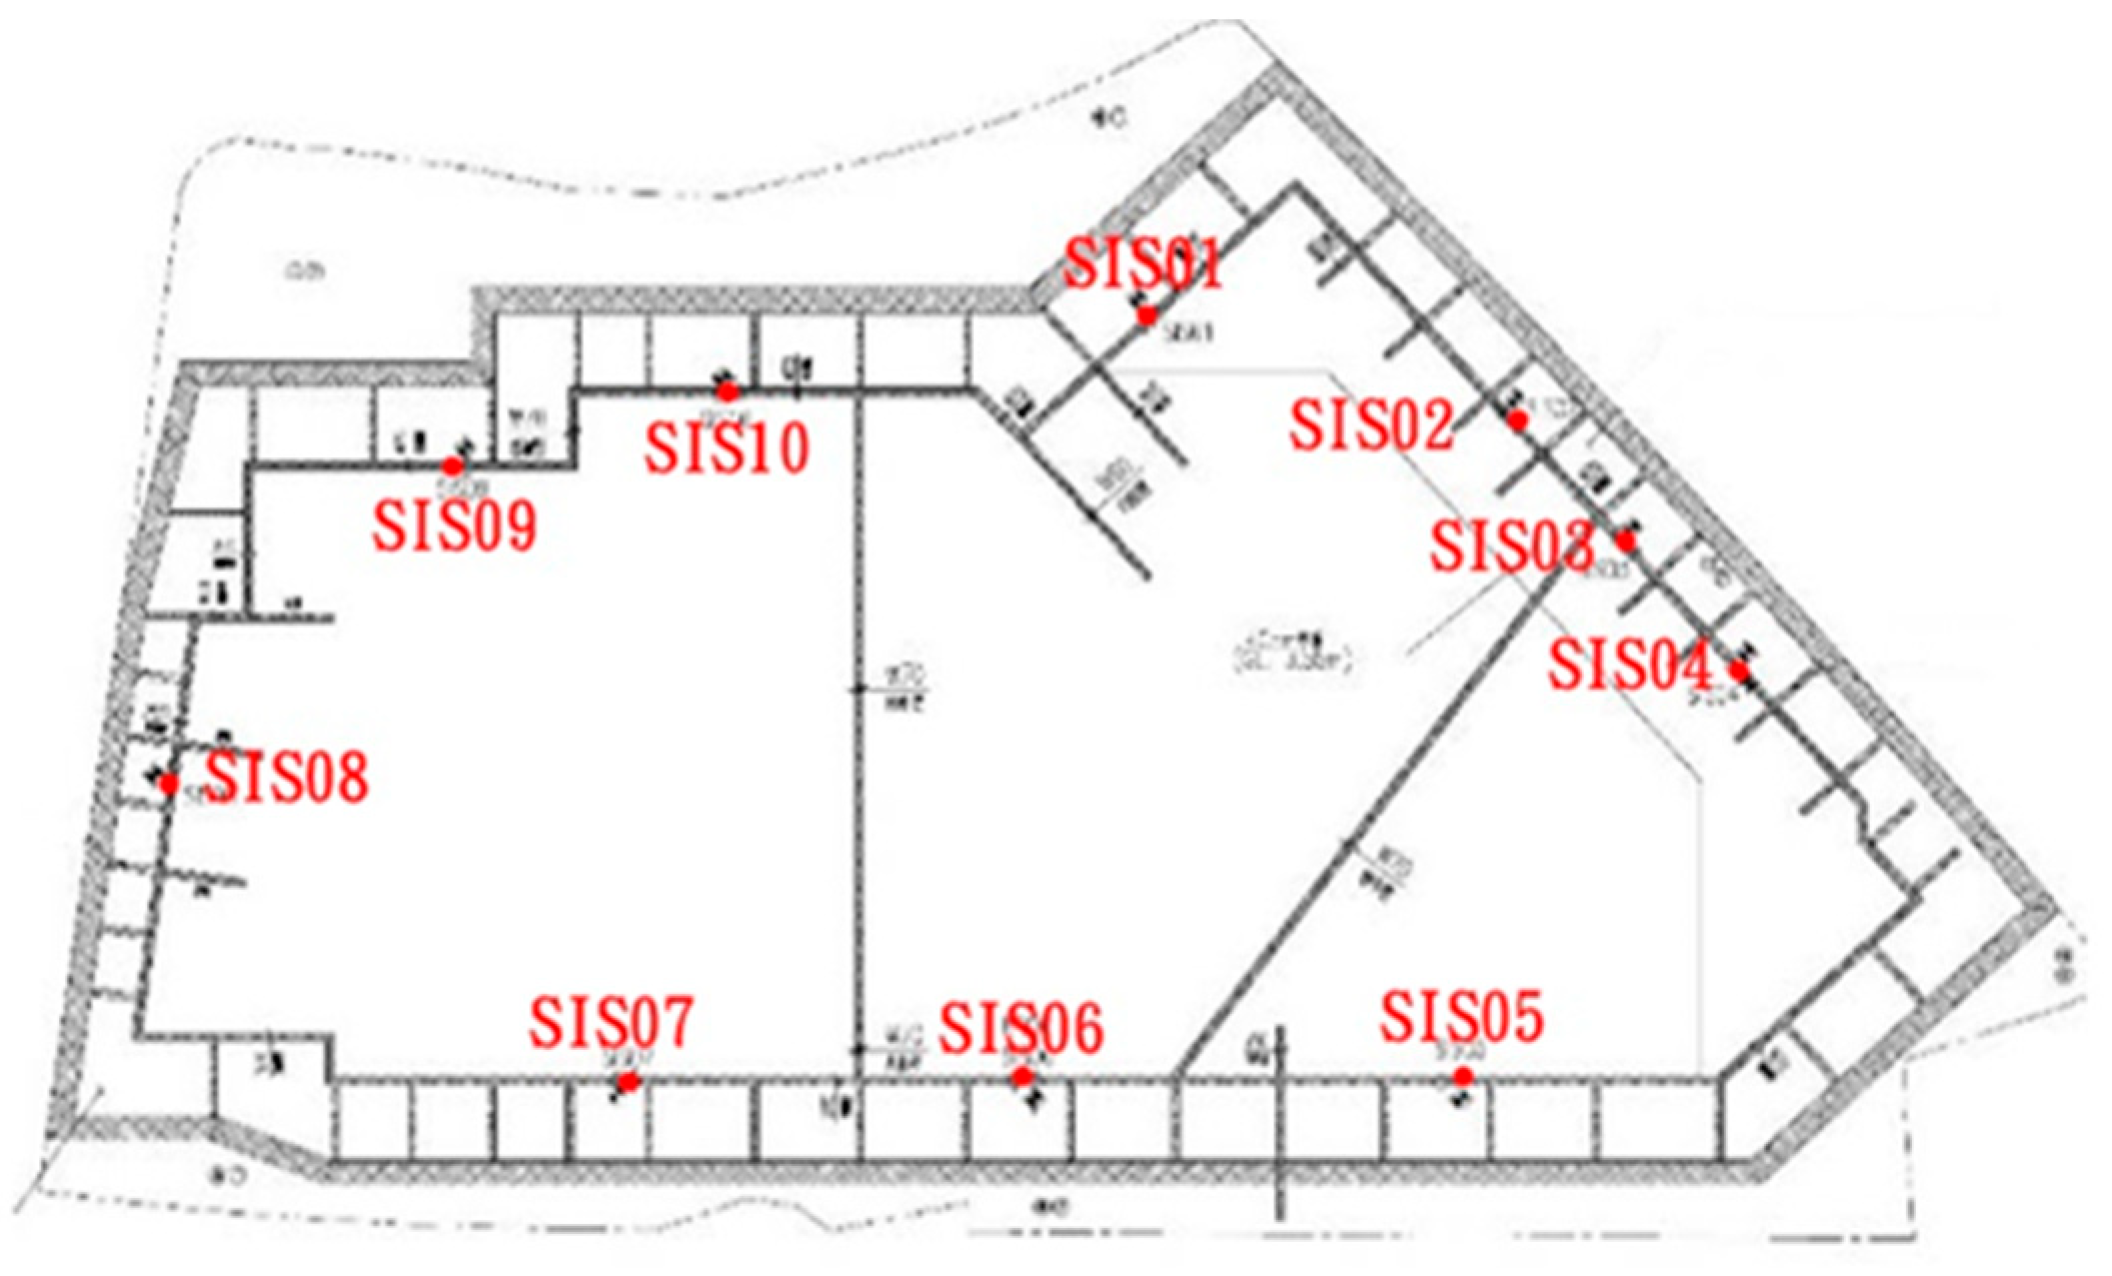
- Monitoring System
2.3. Numerical Simulation
- (1)
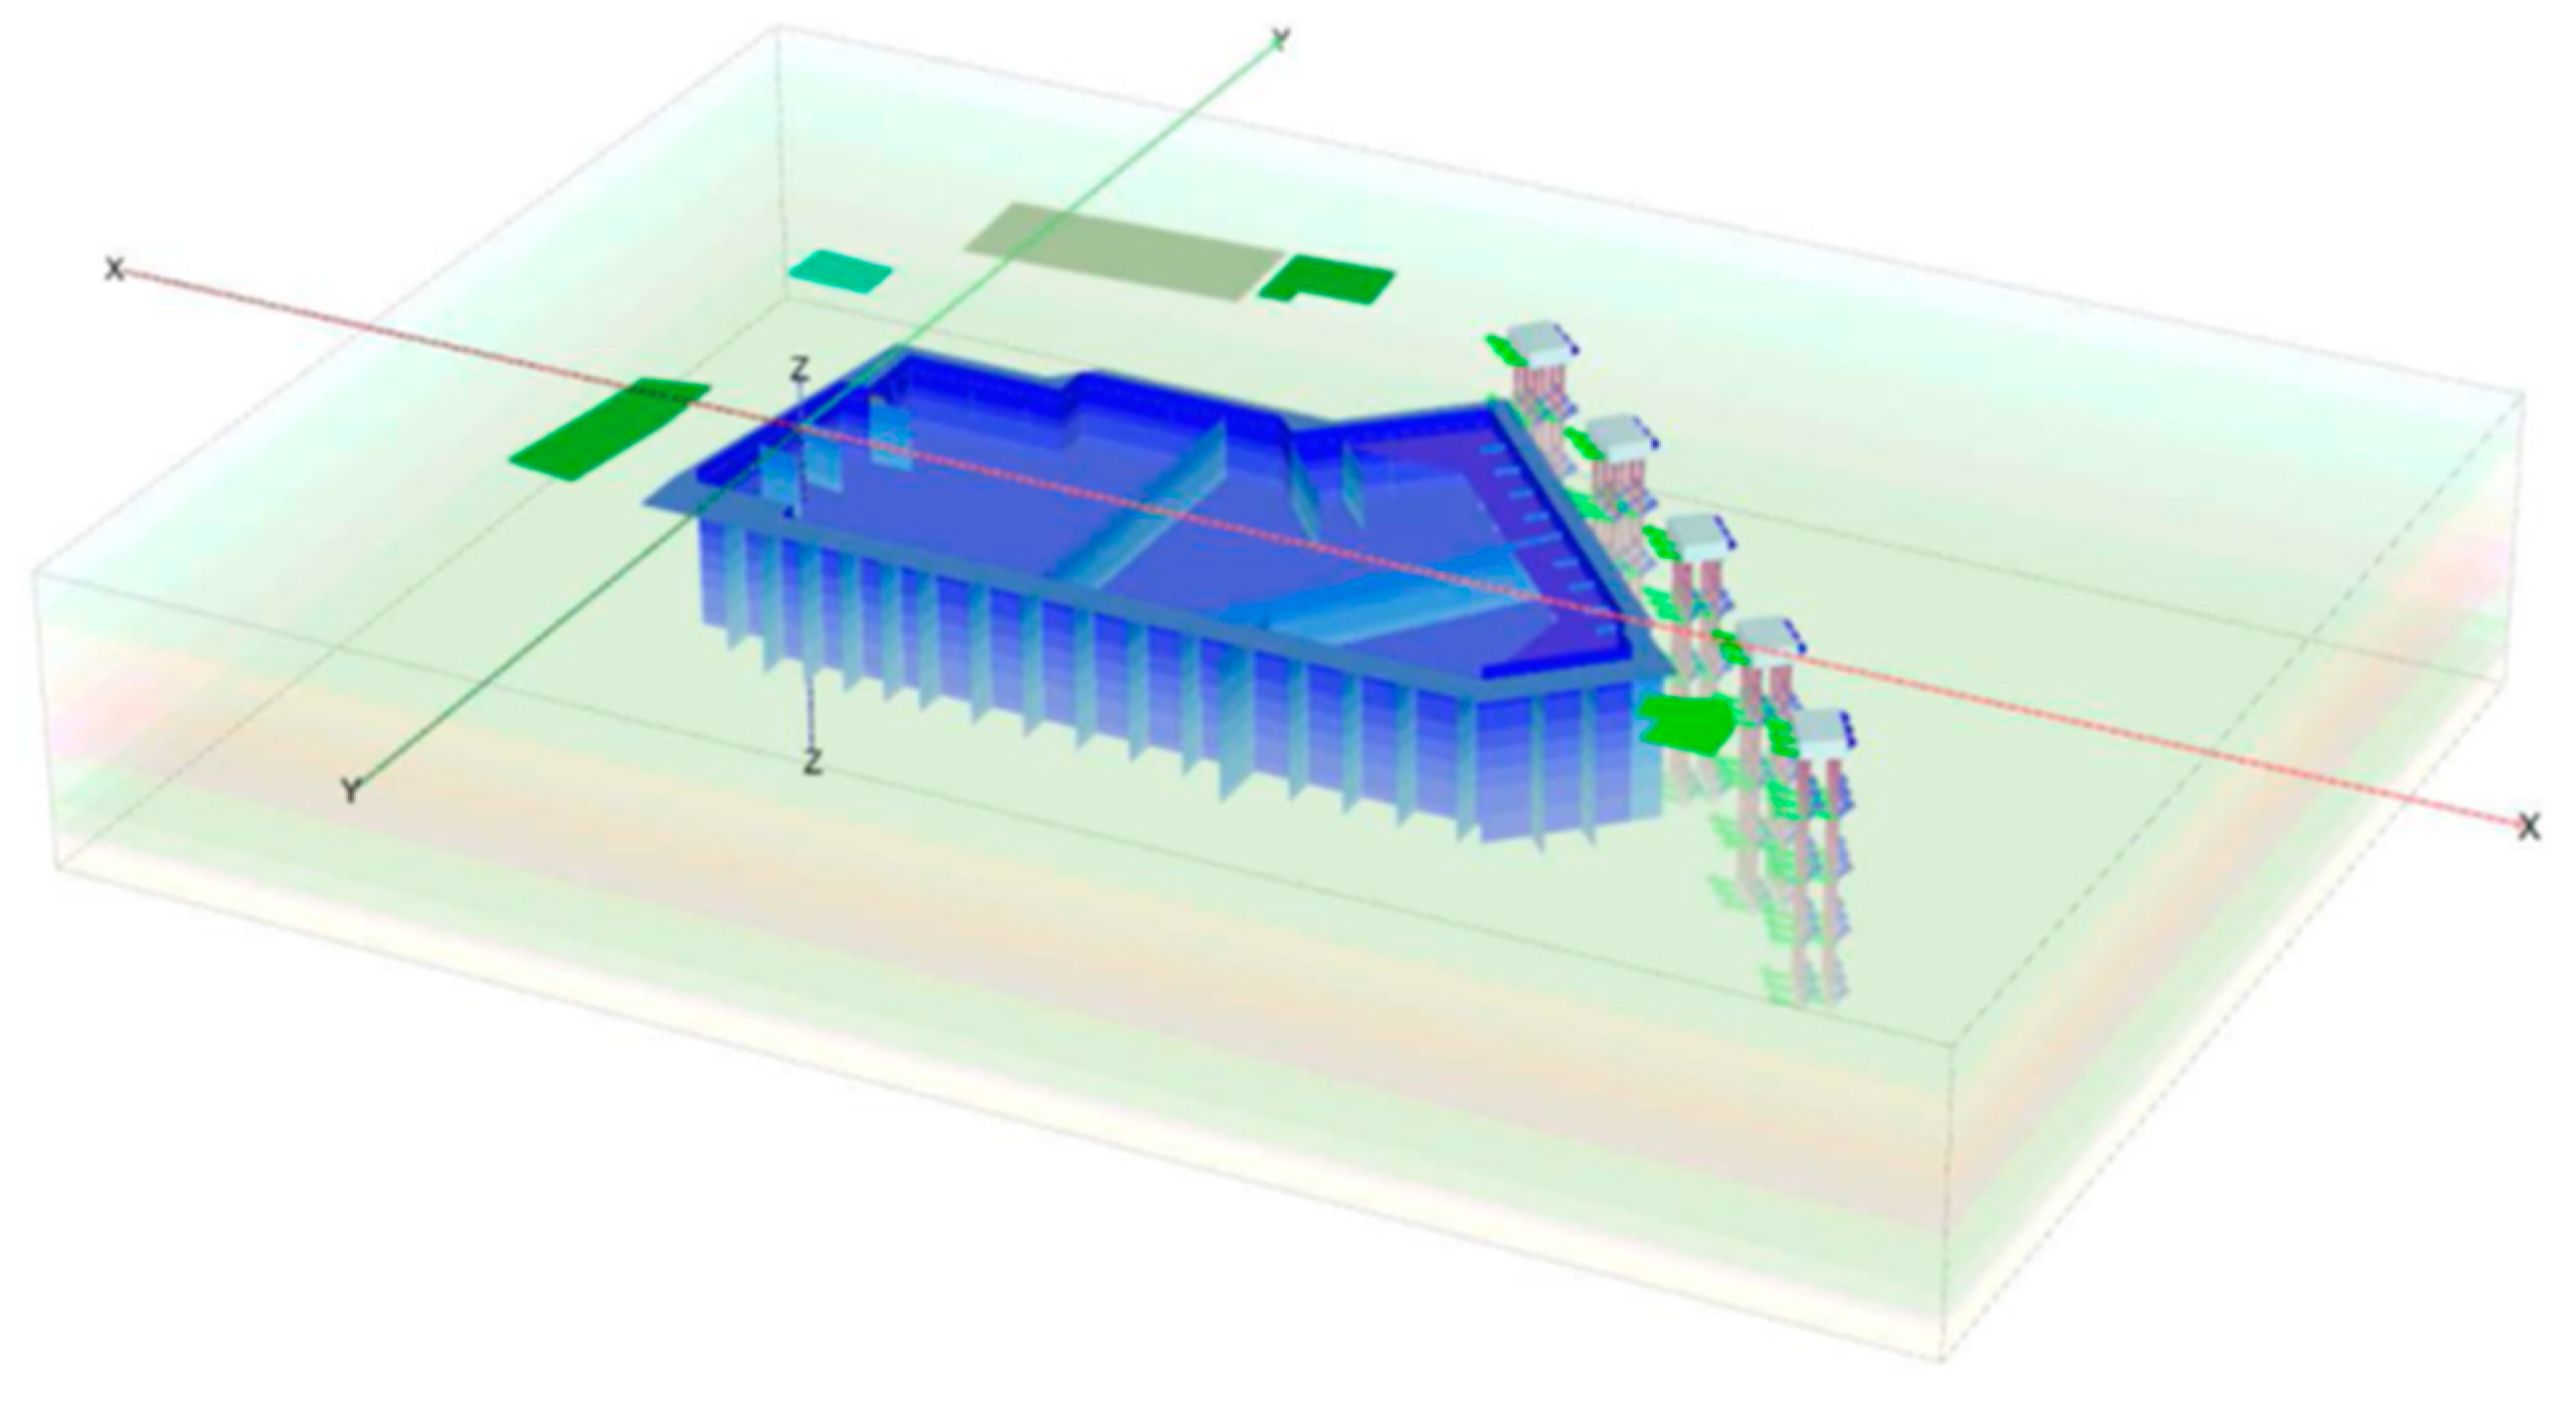
- Defining the Overall Model Boundary Profile: The initial step involves calculating the dimensions of the construction site based on the area and excavation depth. For this model, the boundary extends 3 to 5 times the excavation depth from the diaphragm wall. Due to adjacent building loads, a fivefold extension is used in this case. Drilling reports inform the thickness and groundwater level of each soil layer, with additional consideration for irregular layers. The soil body’s boundaries are defined with roller supports, allowing only vertical movement and hinge supports to limit both vertical and horizontal displacements. The bottom boundary is set at either a hard layer or a non-influential depth, using hinged nodes, while the side boundaries employ roller supports.
- (2)
- Defining Soil Parameters: Soil parameters for each layer are determined from drilling reports, indoor experiments, and empirical formulas. These parameters are then applied to the already drawn model, defining each soil layer’s characteristics.
- (3)
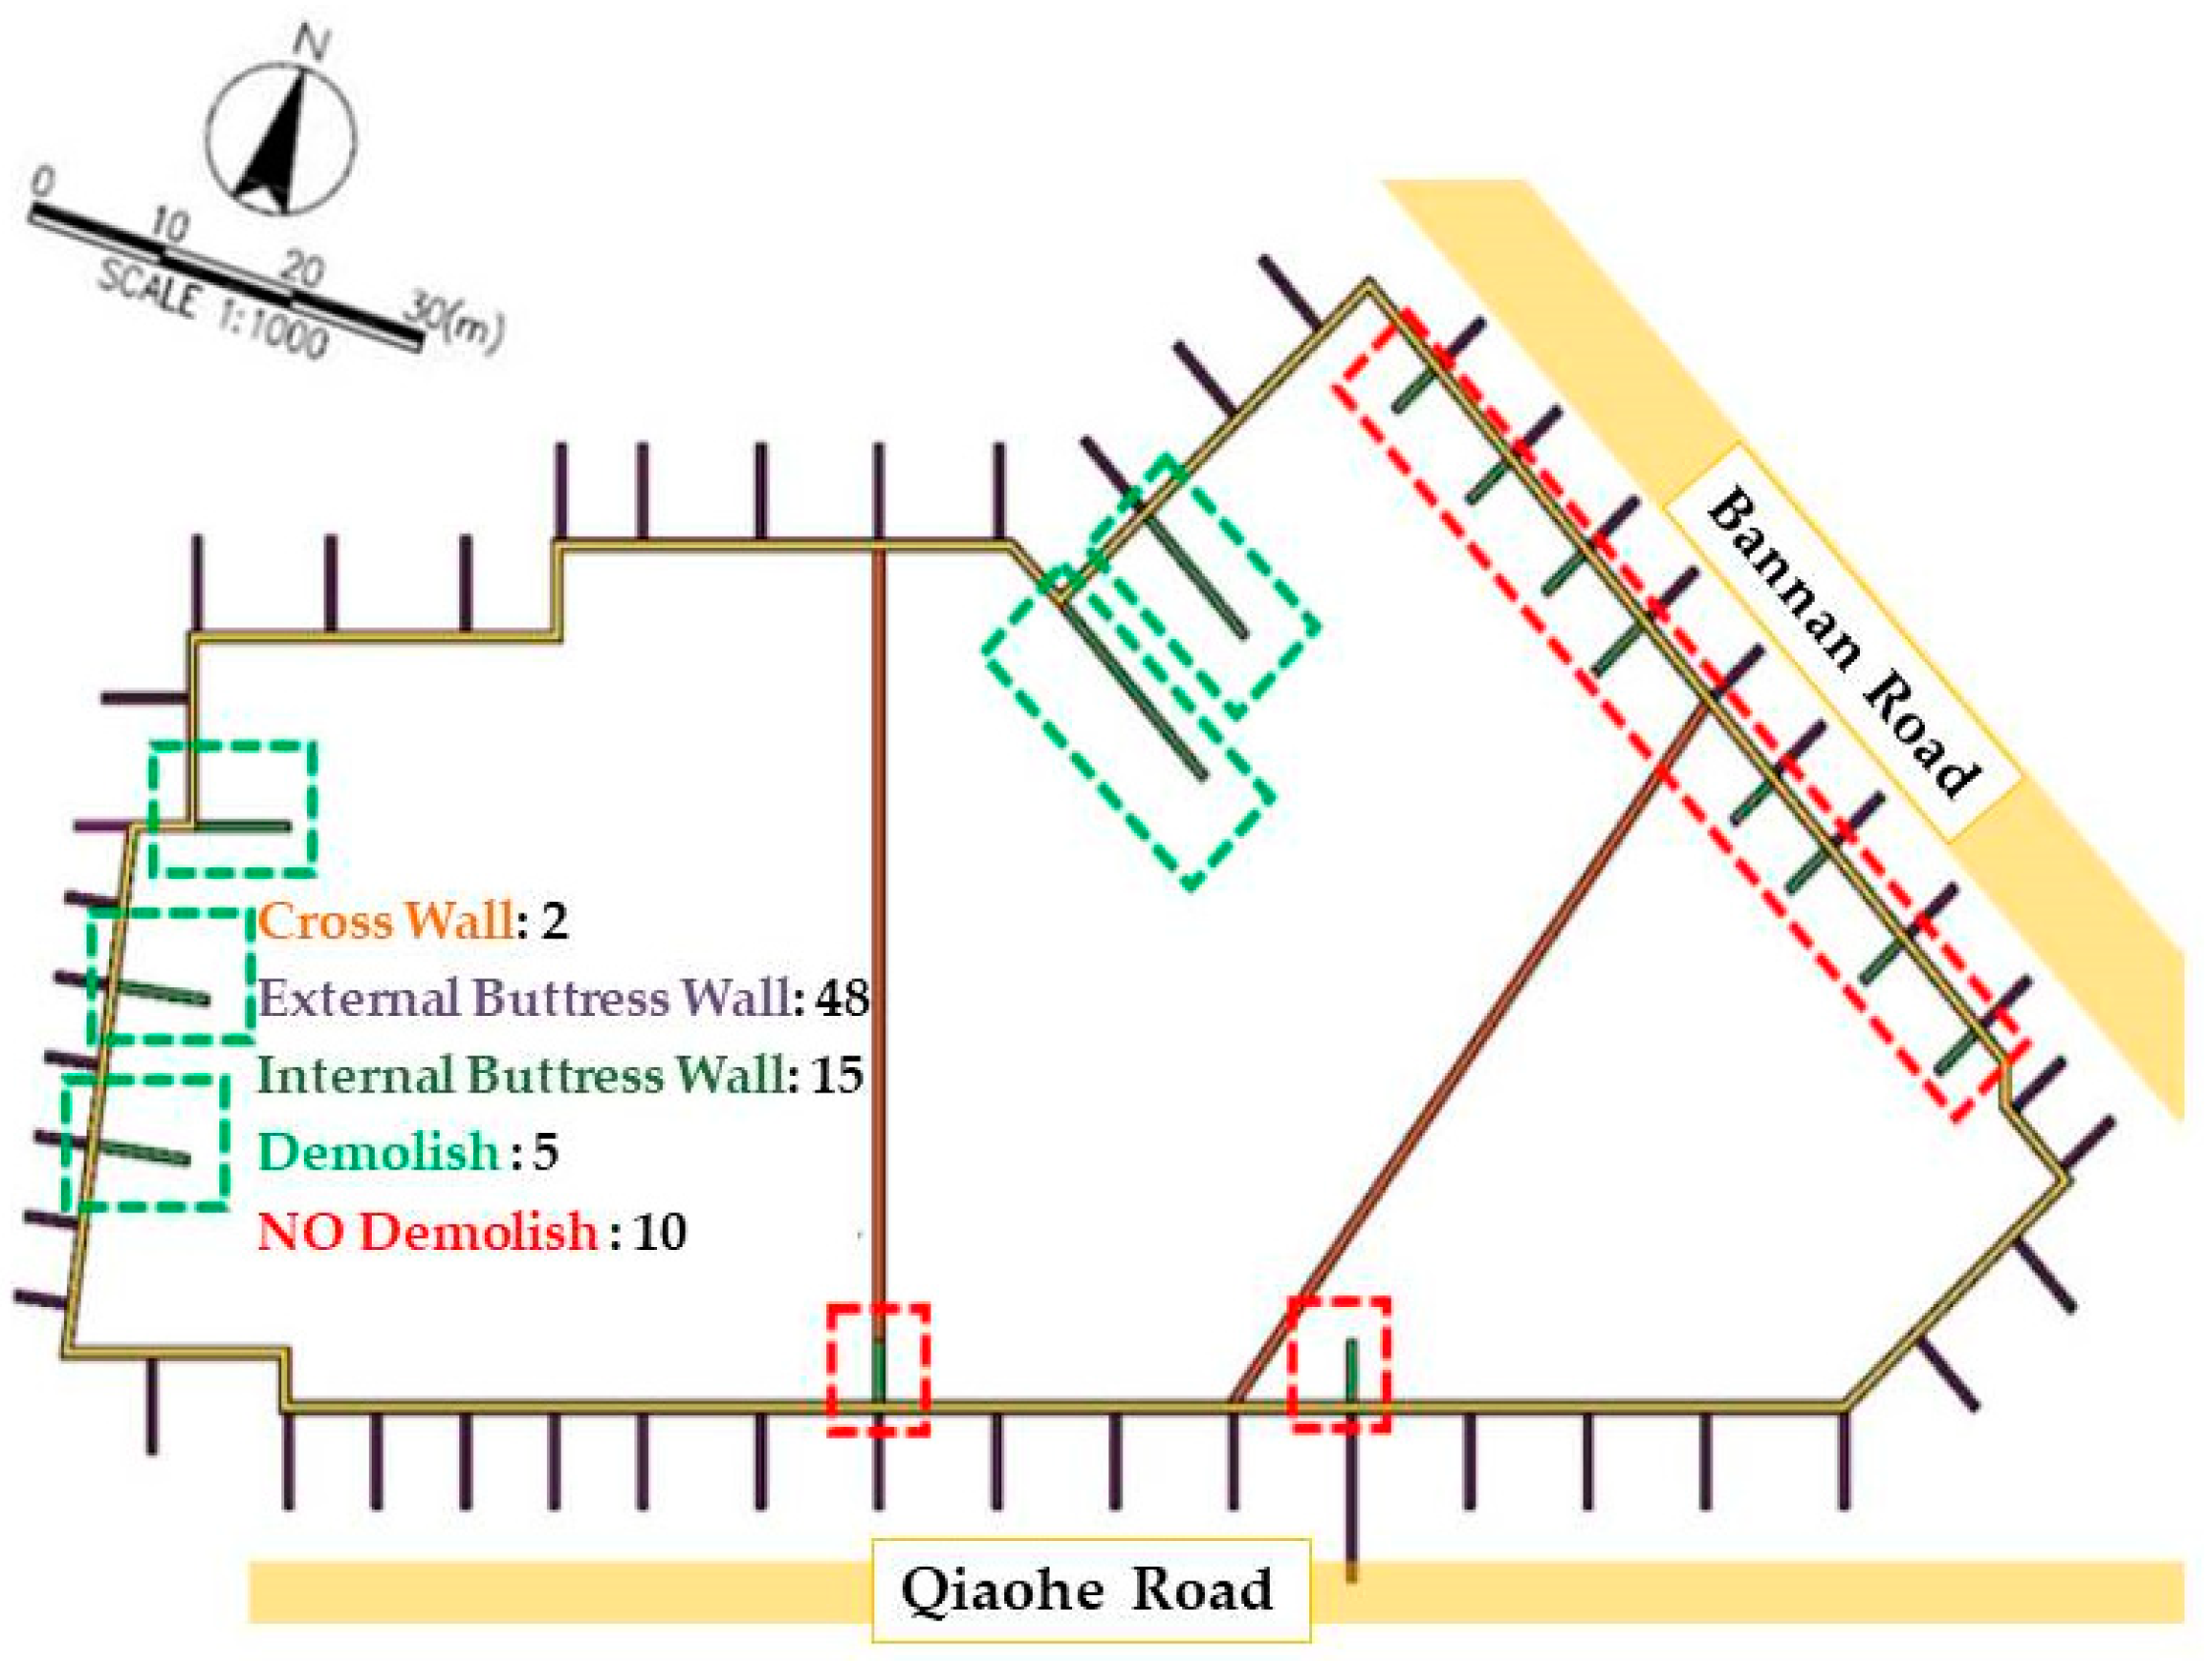
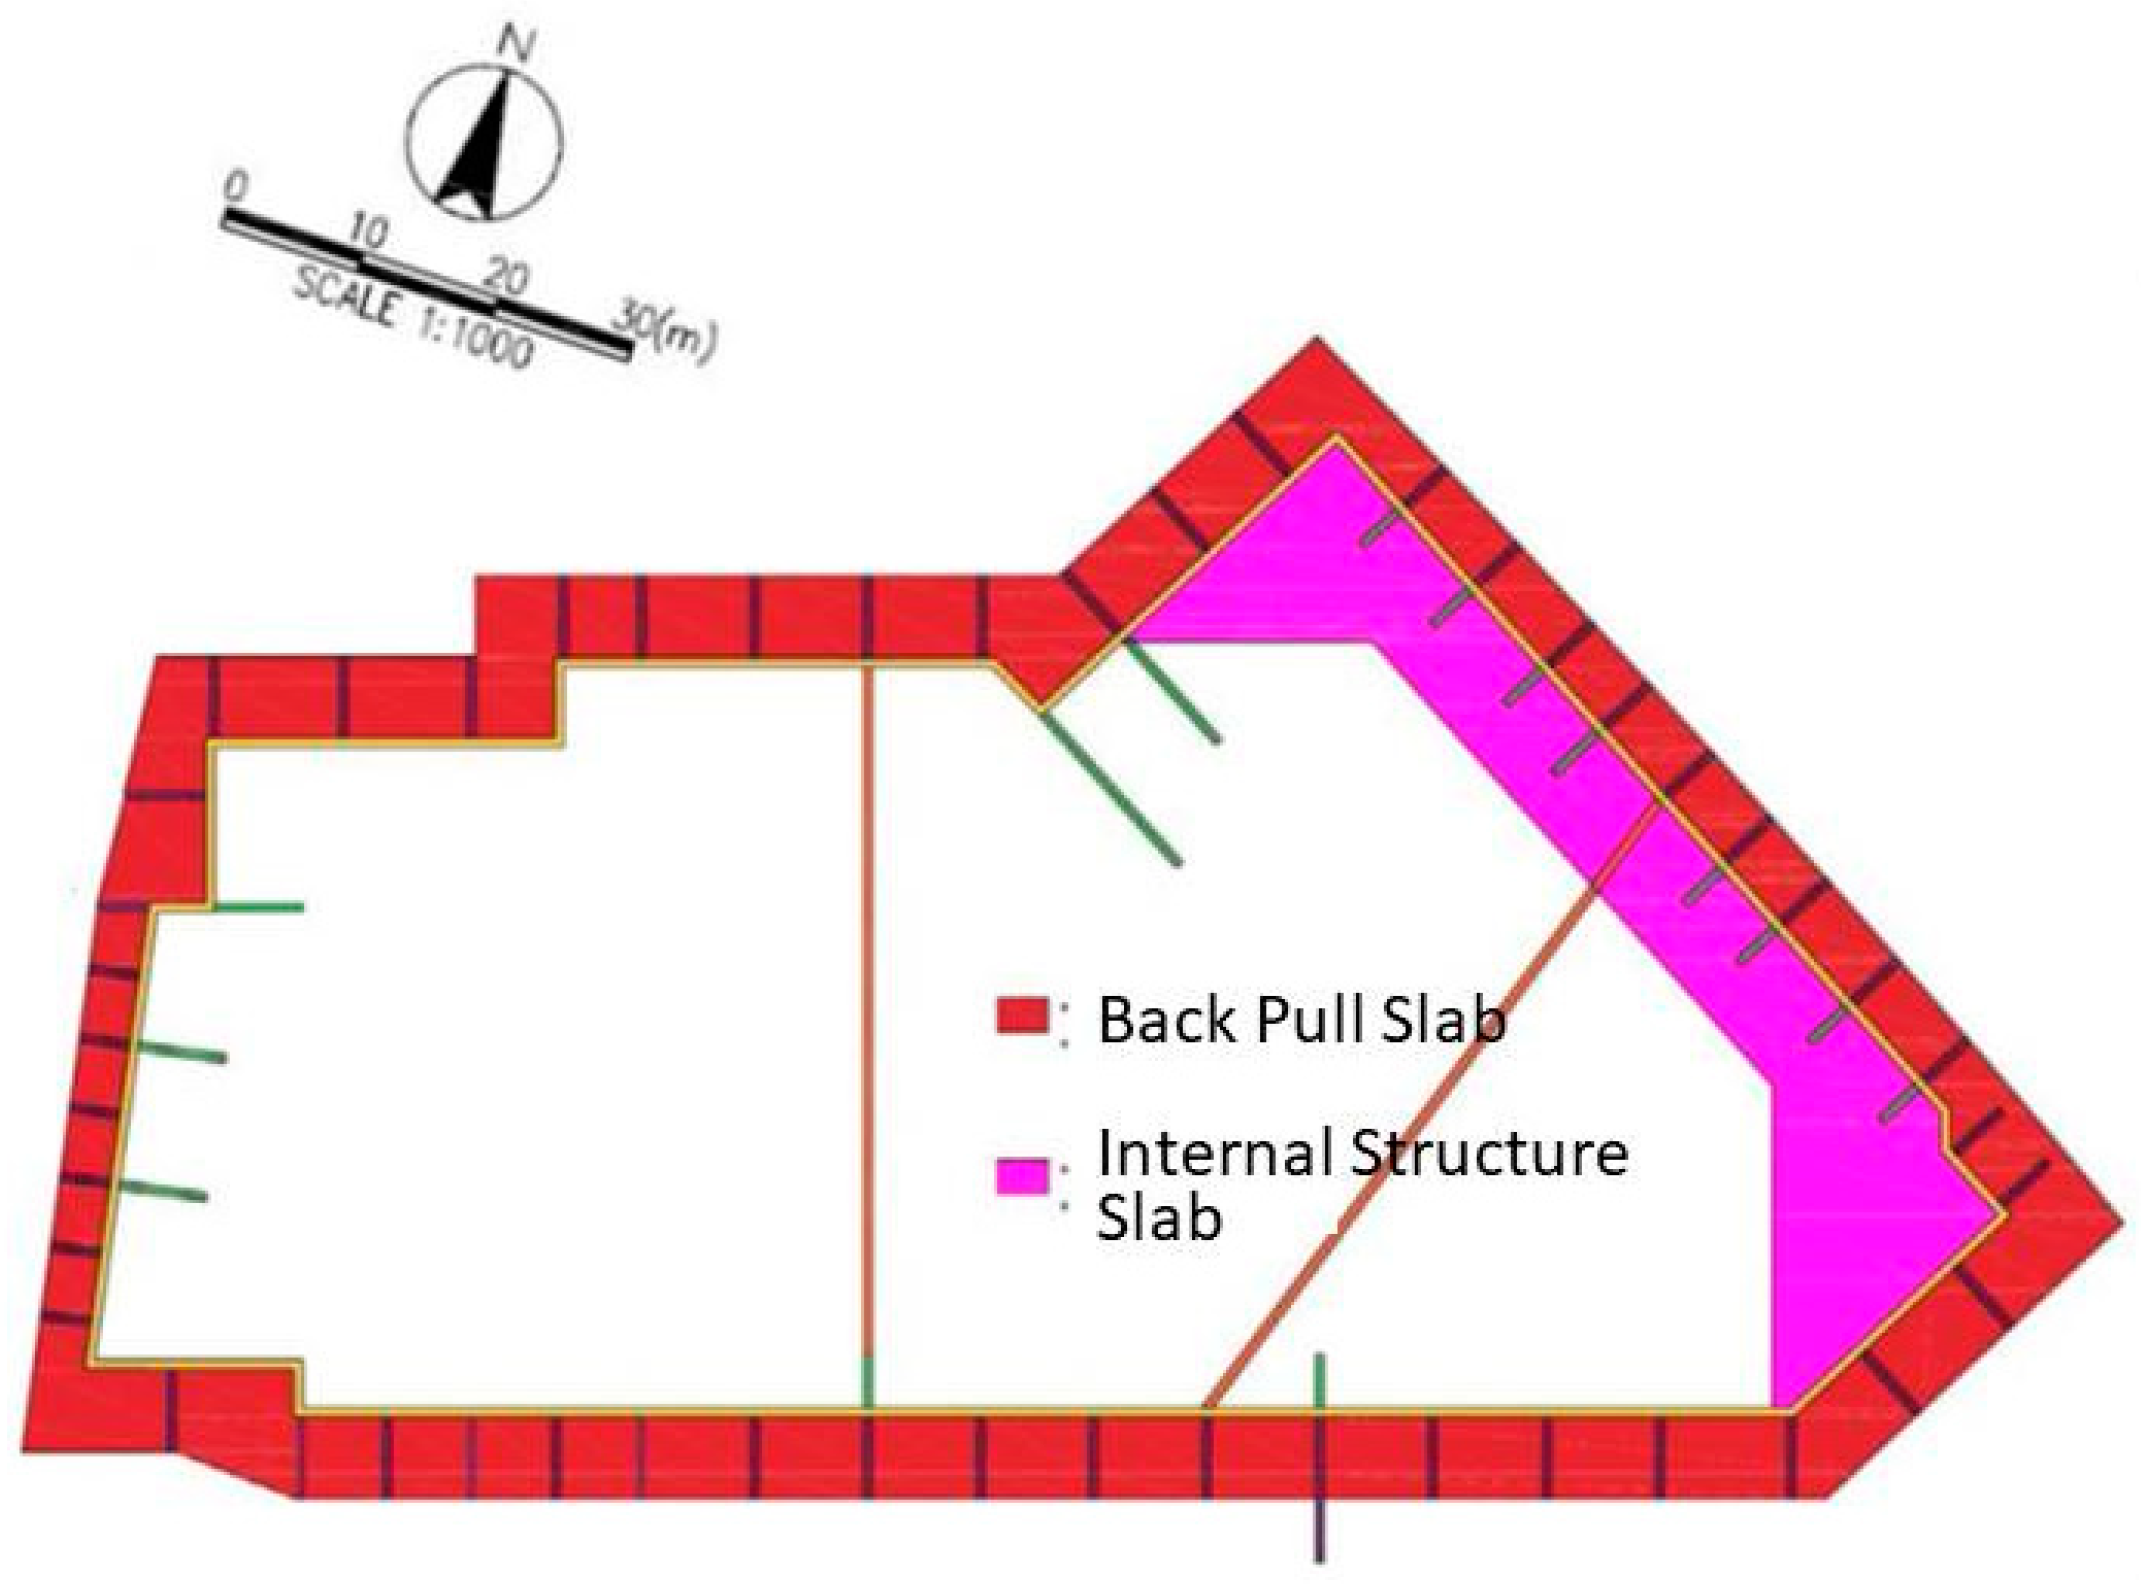
- Simulation of Deep Excavation Site: The structures involved in deep excavation engineering—including diaphragm walls, cross walls, internal and external buttress walls, structural slabs, back-pull slabs, and foundation slabs—are simulated using plate elements. Geometric shapes are drawn and defined as plate elements, followed by applying material parameters to each structure.
- (4)
- Simulation of Neighboring Building Loads: Due to the absence of detailed construction data for neighboring buildings, the simulation uses plate and rigid body elements, with assumptions based on relevant literature and common engineering practices.
- (5)
- Setting Construction Steps and Water Levels: The construction process is set according to the actual steps taken on site. Water levels are adjusted around the excavation face to facilitate dry conditions for construction and ensure quality.
- (6)
- Defining Grid and Grid Density: Once the previous steps are complete, the grid is generated, with densification around the excavation face to enhance the accuracy of the analysis. This study opts for a medium grid density.
- (7)
- Starting the Calculation: With all parameters and configurations set, the final step is to initiate the calculation process in PLAXIS, leading to the analysis of the simulation results.
- (1)
- Model Setup
- (2)
- Selection of Soil Parameters
- A.
- Young’s Modulus (E)
- B.
- Poisson’s Ratio (ν)
- C.
- Wet Soil Unit Weight (γt), Effective Cohesion (c′), and Effective Friction Angle (ψ′)
- D.
- Interface Element Strength
- (3)
- Structural Parameters
- (4)
- Road and Nearby Structural Load Parameter Settings
- (5)
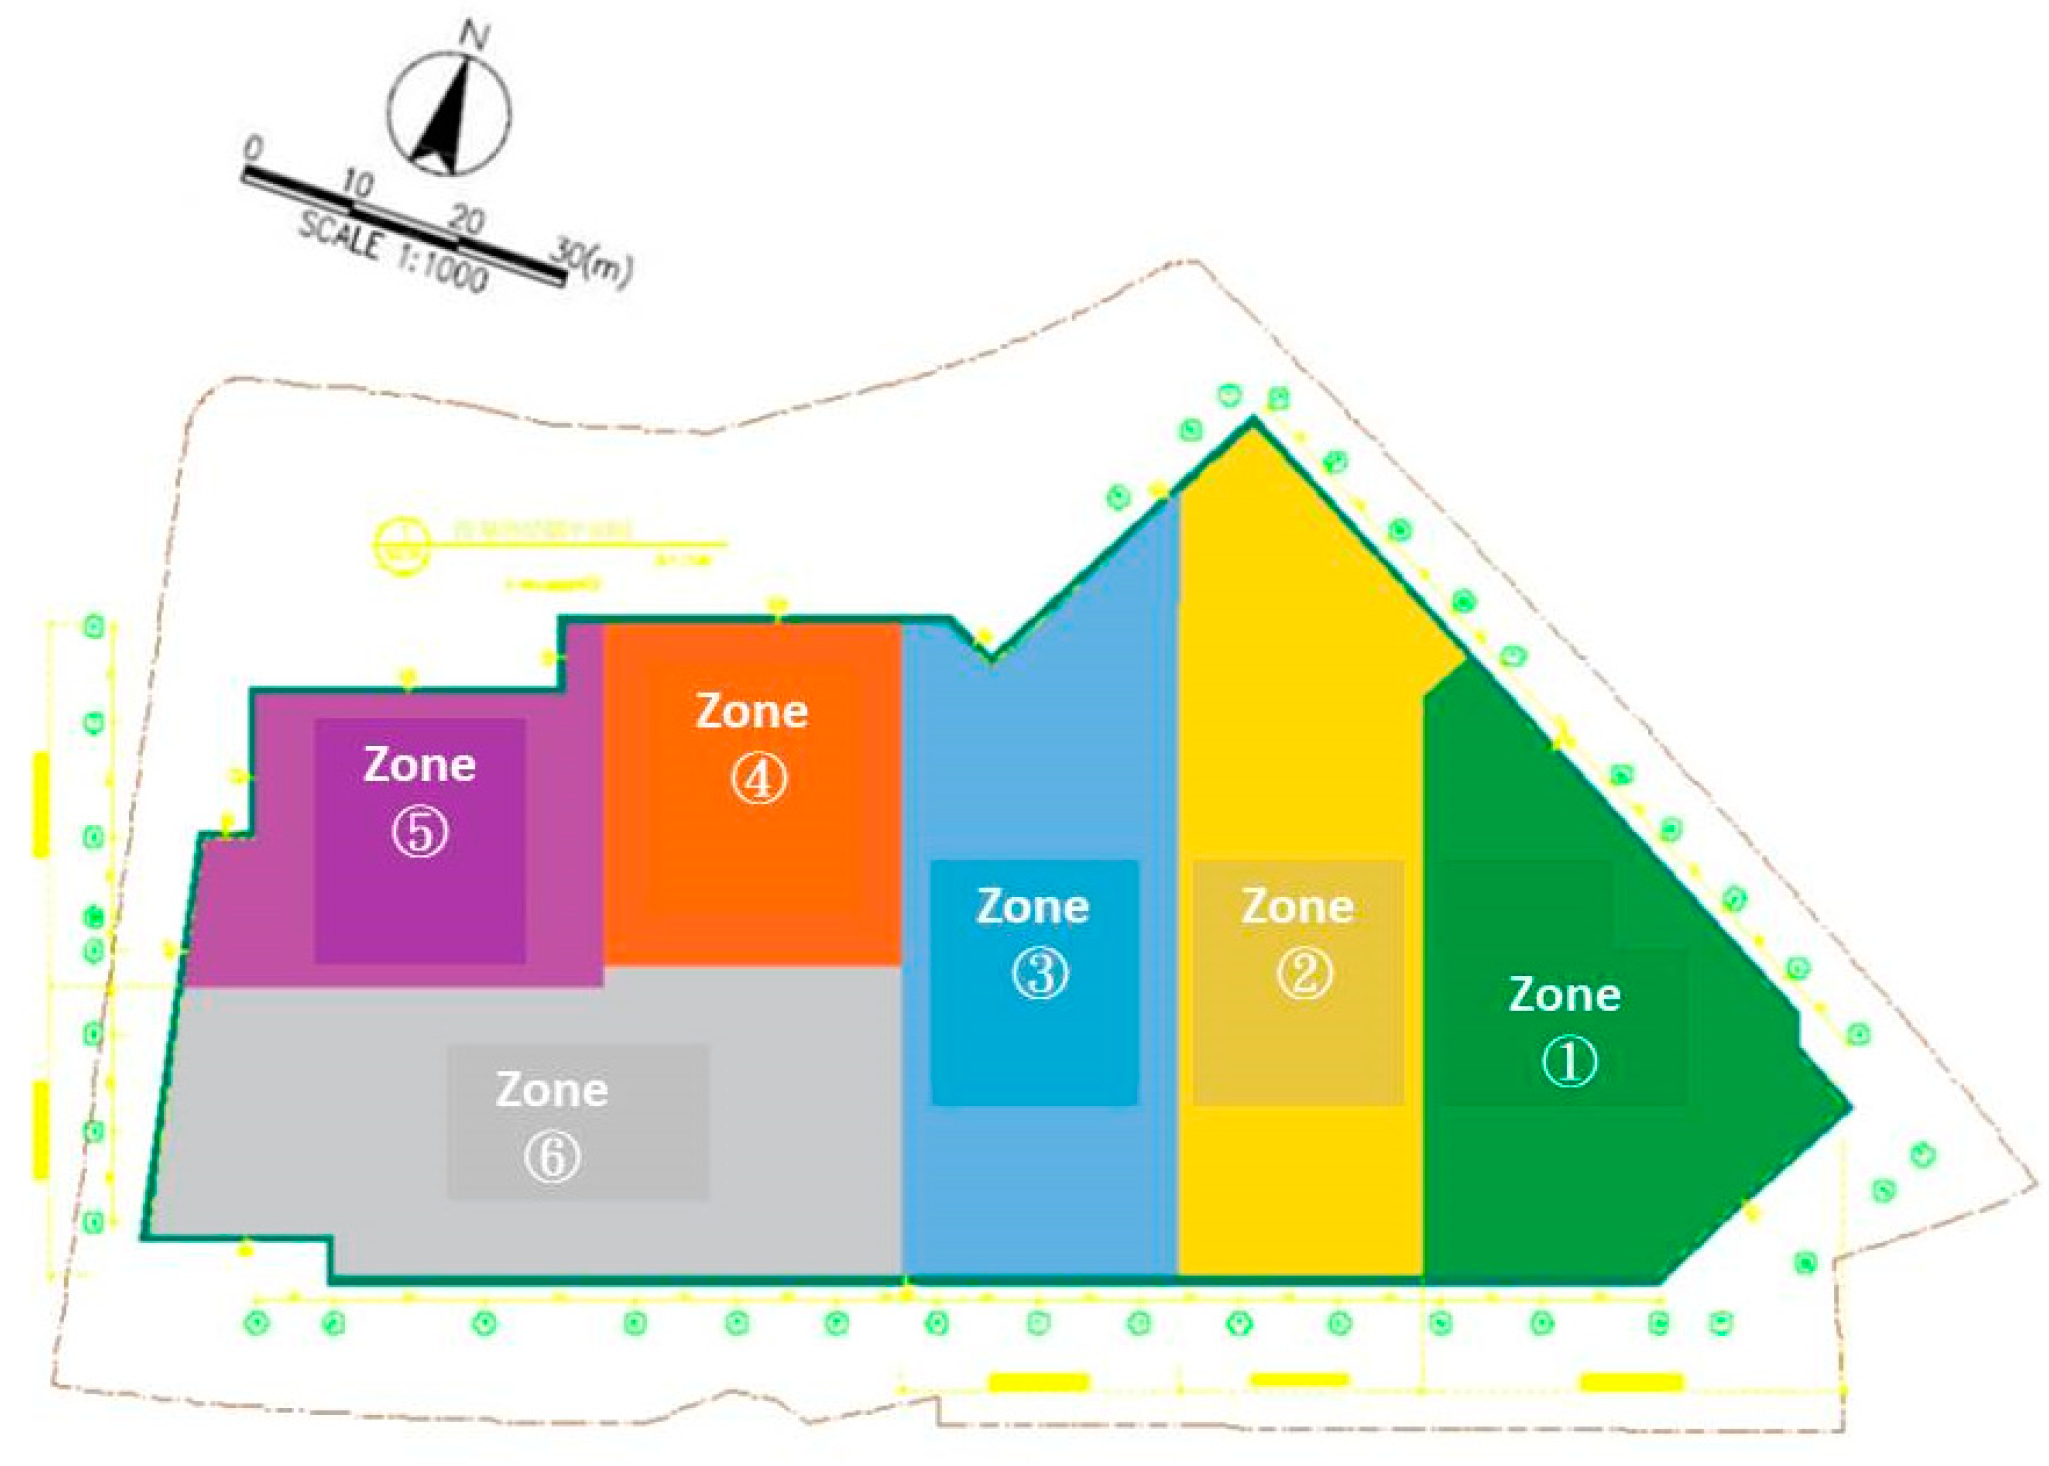
- Zoned Excavation
2.4. Construction Steps
- (1)
- Load neighboring buildings and roads, and calculate initial stress.
- (2)
- Excavate the entire site to (GL −2.4 m).
- (3)
- Install diaphragm walls, cross walls, internal buttress walls, and external buttress walls, and reset displacements to zero.
- (4)
- Construct external structural slab (GL −2.4 m), backfill certain areas.
- (5)
- Excavate areas with internal structural slabs to (GL −5.5 m), and lower the groundwater level to (GL −5.5 m).
- (6)
- Install internal structural slabs (GL −3.55 m).
- (7)
- Excavate the first zone to (GL −12.25 m), and lower the groundwater level to (GL −12.25 m).
- (8)
- Excavate the second zone to (GL −12.25 m), and install foundation slab for the first zone (GL −12.25 m).
- (9)
- Excavate the third zone to (GL −12.25 m), and install foundation slab for the second zone (GL −12.25 m).
- (10)
- Excavate the fourth zone to (GL −12.25 m), and install foundation slab for the third zone (GL −12.25 m).
- (11)
- Excavate the fifth zone to (GL −12.25 m), and install foundation slab for the fourth zone (GL −12.25 m).
- (12)
- Excavate the sixth zone to (GL −12.25 m), and install foundation slab for the fifth zone (GL −12.25 m).
- (13)
- Install foundation slab for the sixth zone (GL −12.25 m). Undrain (B) parameters.
2.5. Analysis Results and Case Verification
2.6. Limitations and Impacts of the Plaxis 3D Model
- Element Number: PLAXIS has a maximum limit on elements, which could restrict modeling in complex or large-scale projects, and more elements lead to increased computation time and resource usage.
- Material Properties: The software may not always accurately model the properties of heterogeneous soils or complex materials, and handling non-linear materials can present challenges.
- Boundary Conditions: Although PLAXIS offers various options for boundary conditions, it might fall short in specialized or extreme cases, and replicating real-world conditions accurately can be difficult.
- Loading Conditions: Simulating certain dynamic or cyclic loads, as well as extreme load scenarios, might exceed PLAXIS’s capabilities.
- Analysis Types: The software has limitations in long-term consolidation and creep analysis, as well as simulating certain environmental effects.
- Software and Hardware Interaction: The performance of PLAXIS is hardware-dependent, and there may be constraints in parallel processing efficiency for large or complex models.
3. Case Study
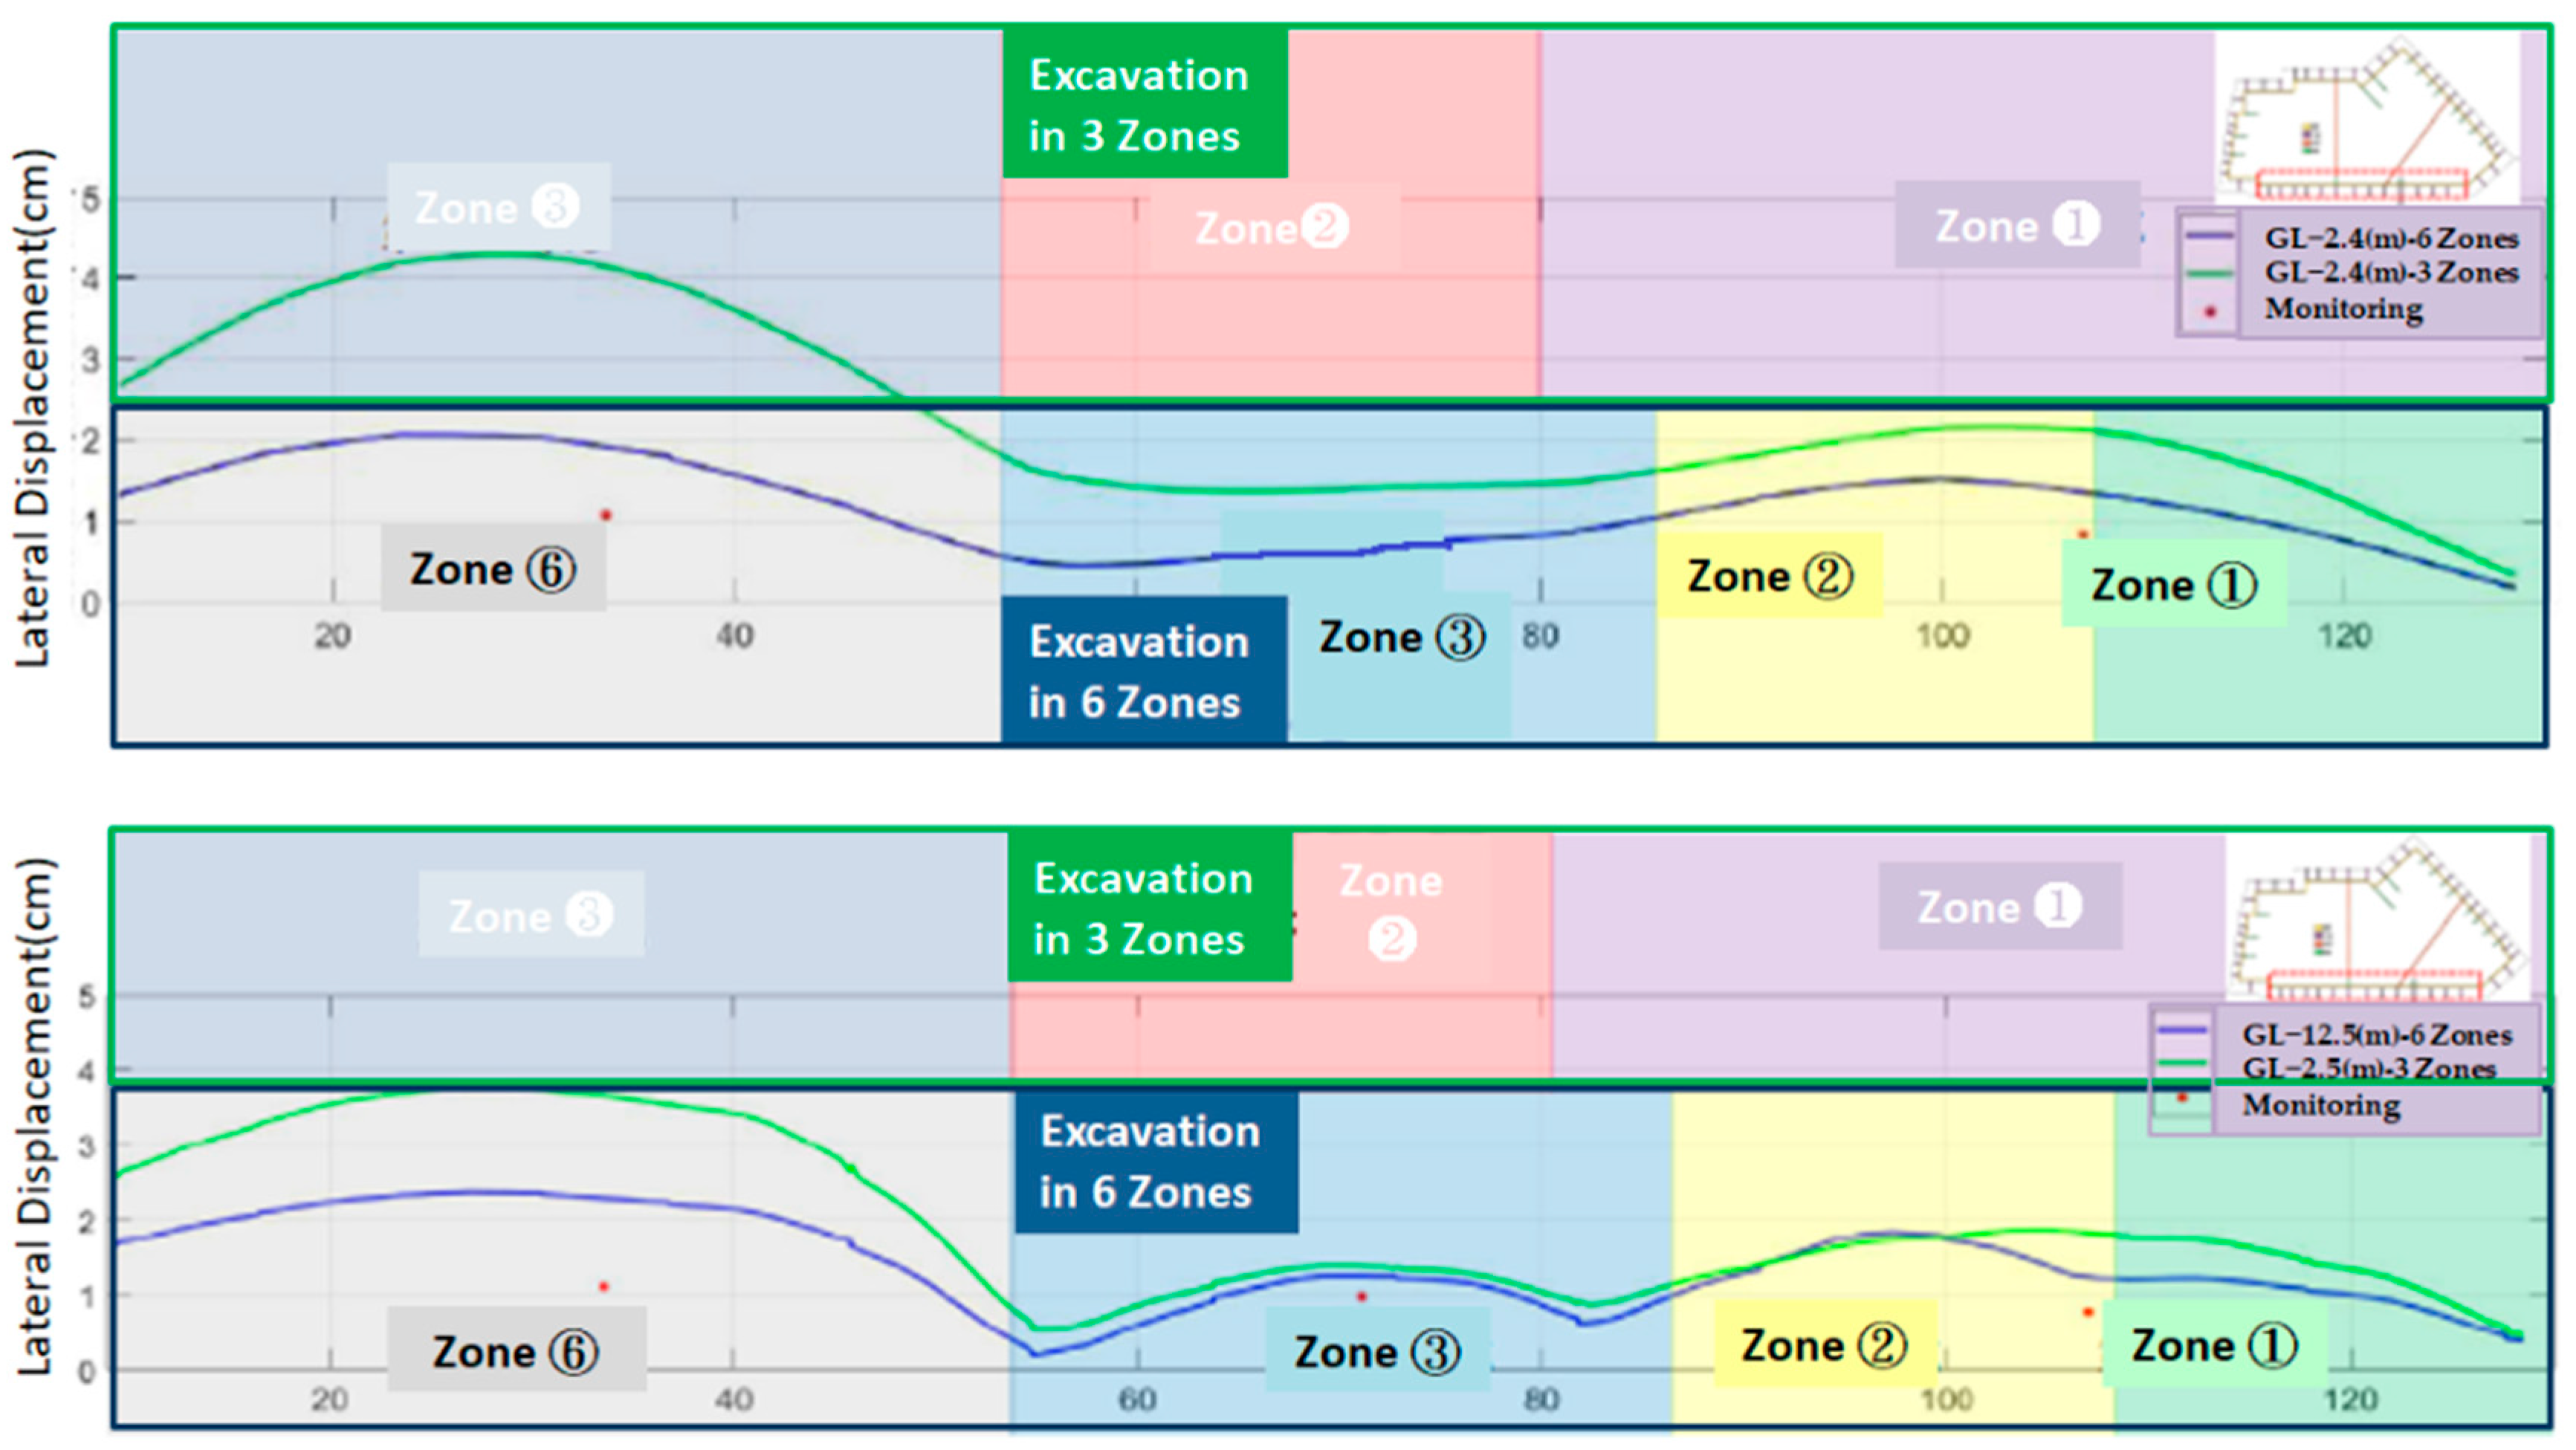
3.1. Impact of Excavation
- (1)
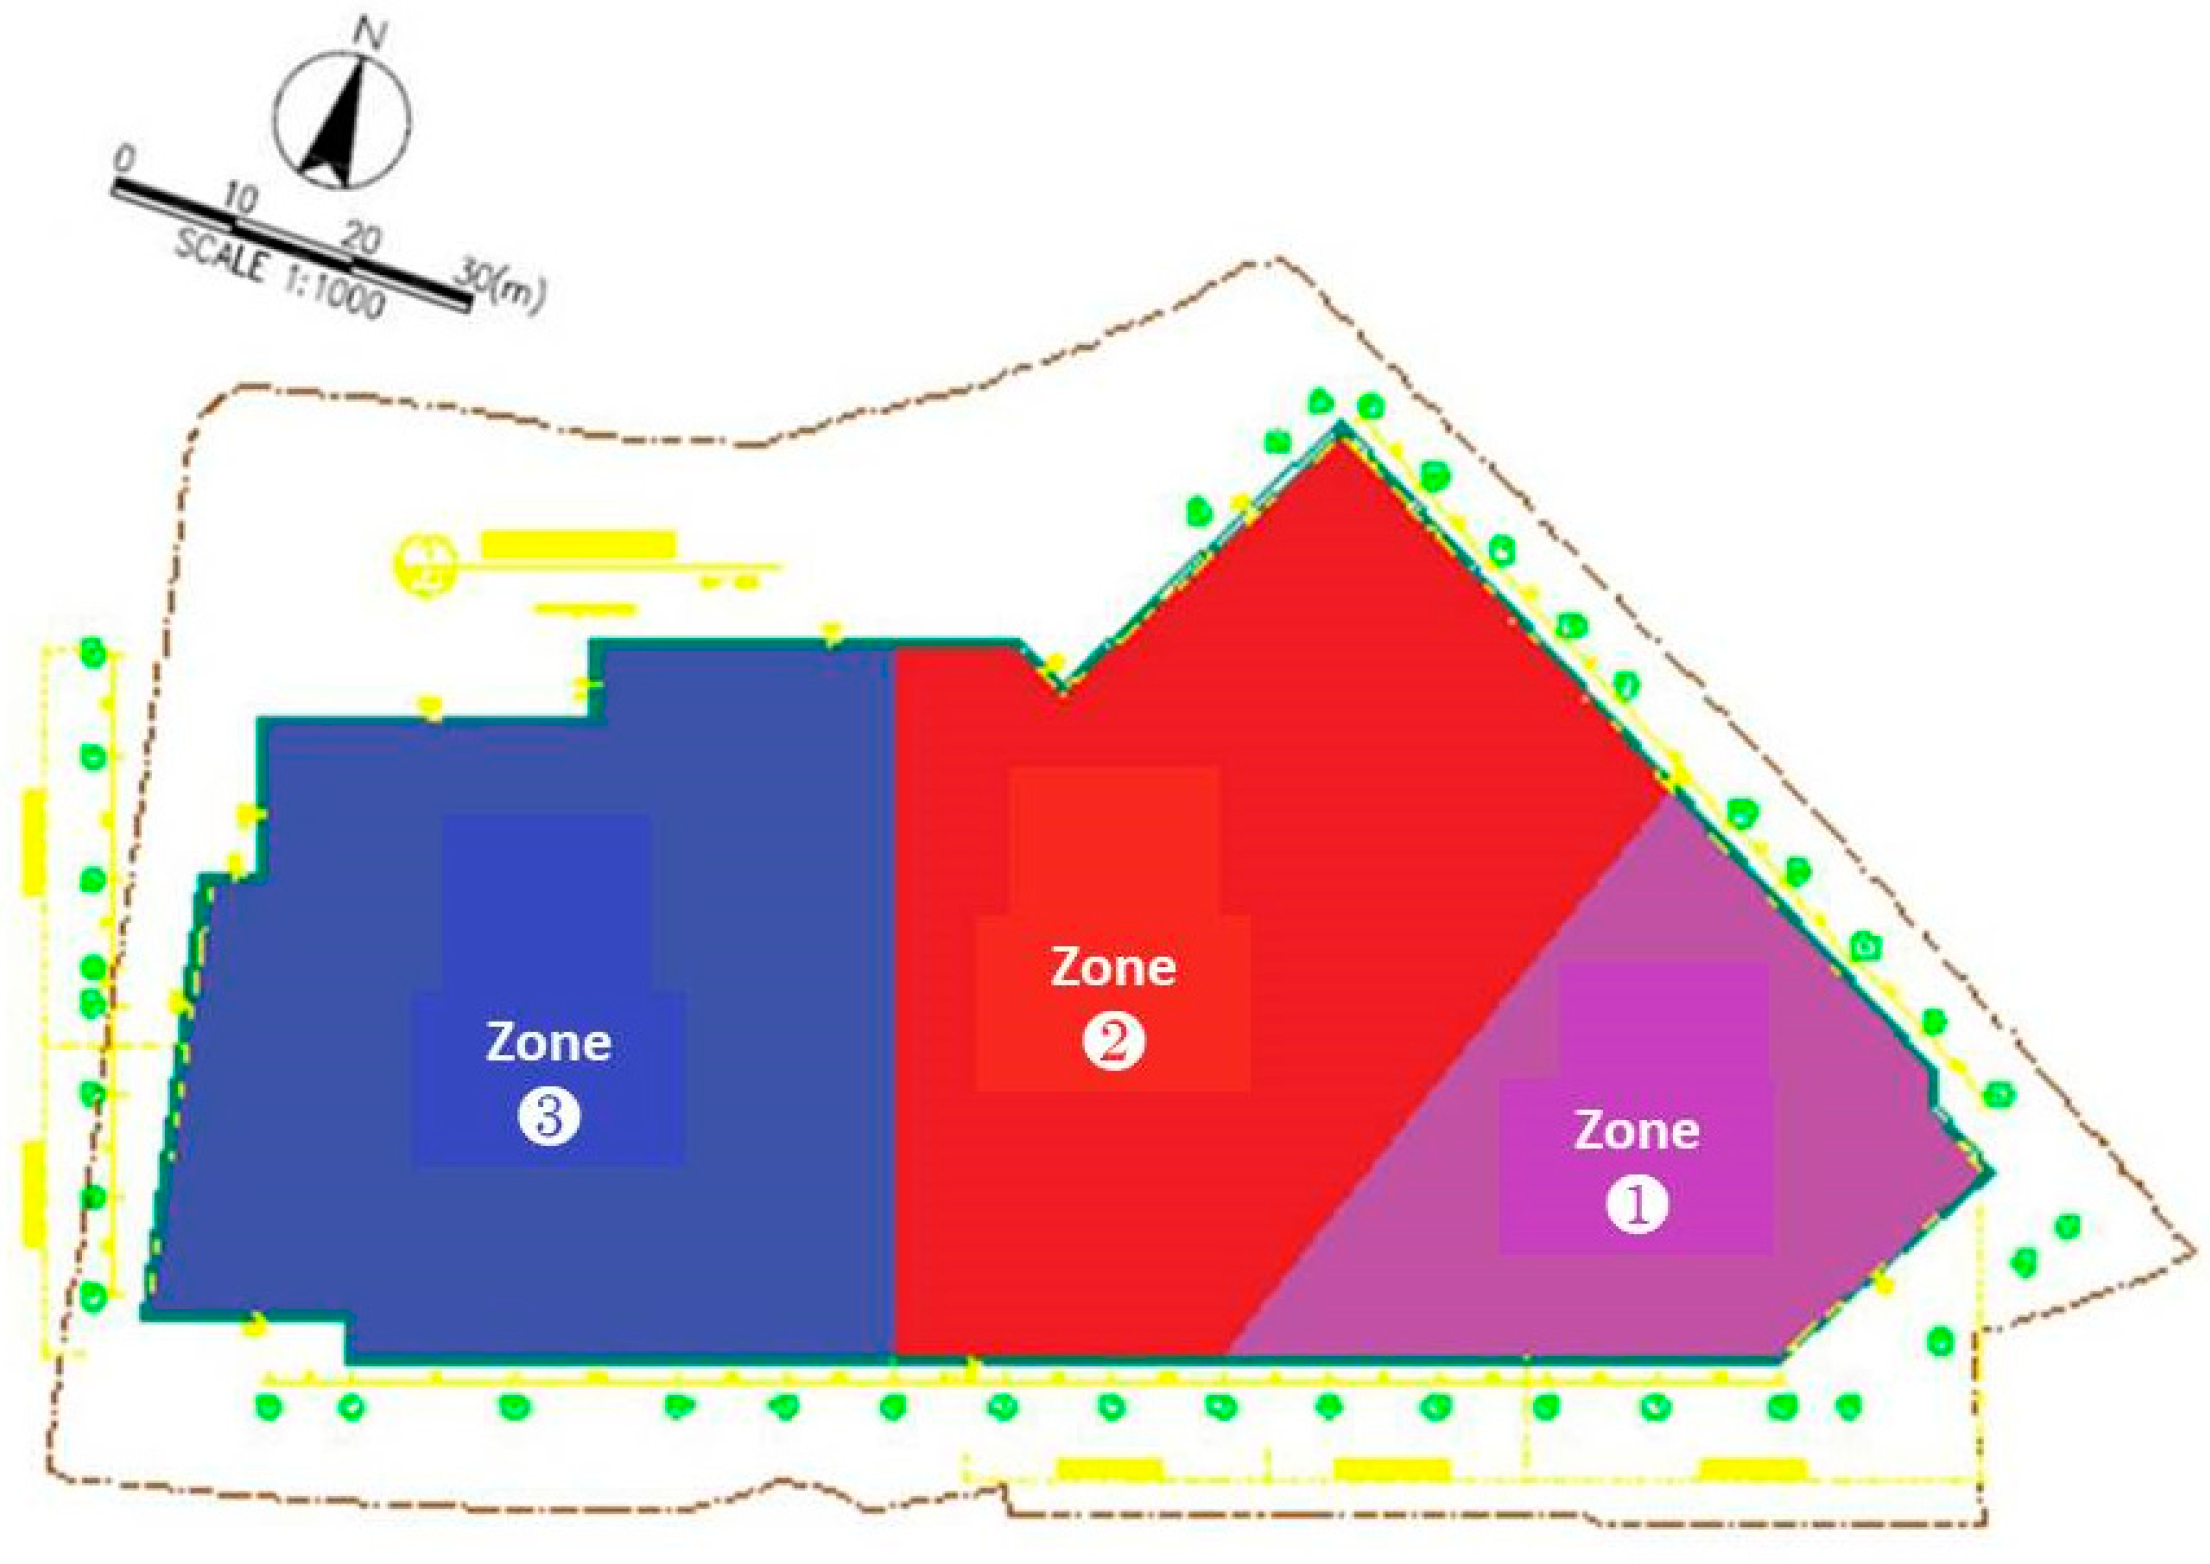
- Impact of Zoned Excavation
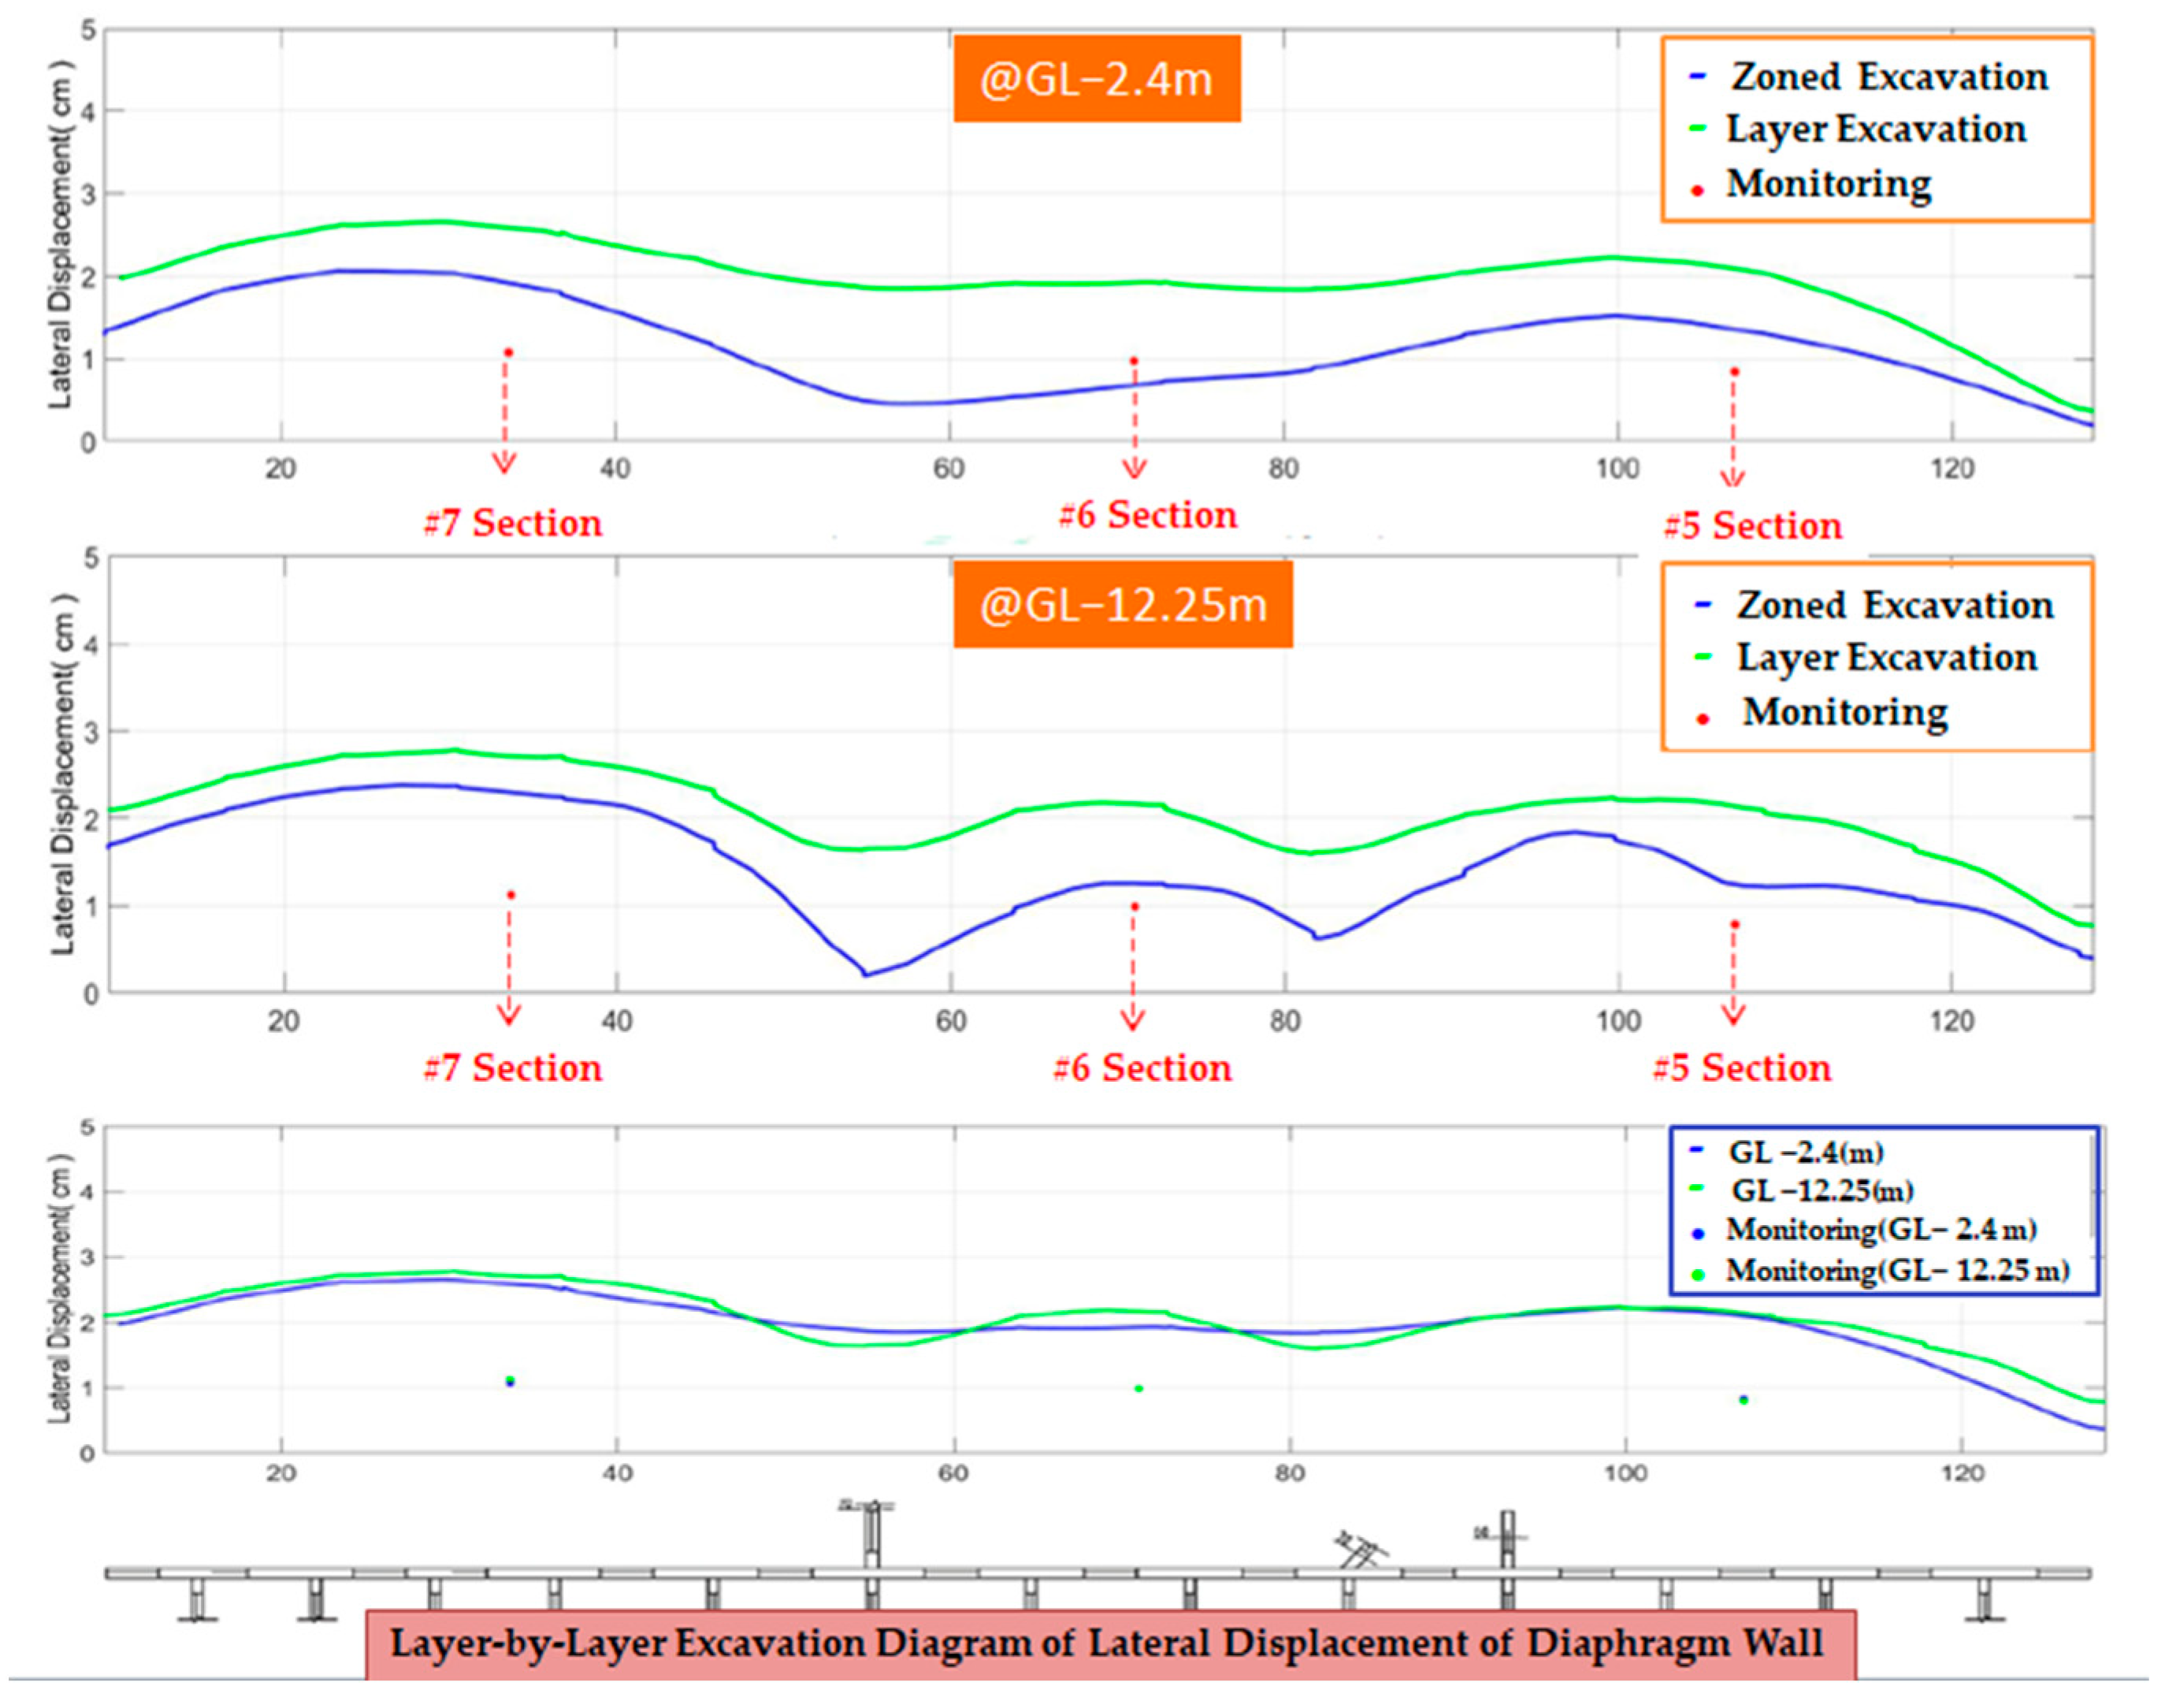
- (2)
- The impact of excavation by layers:
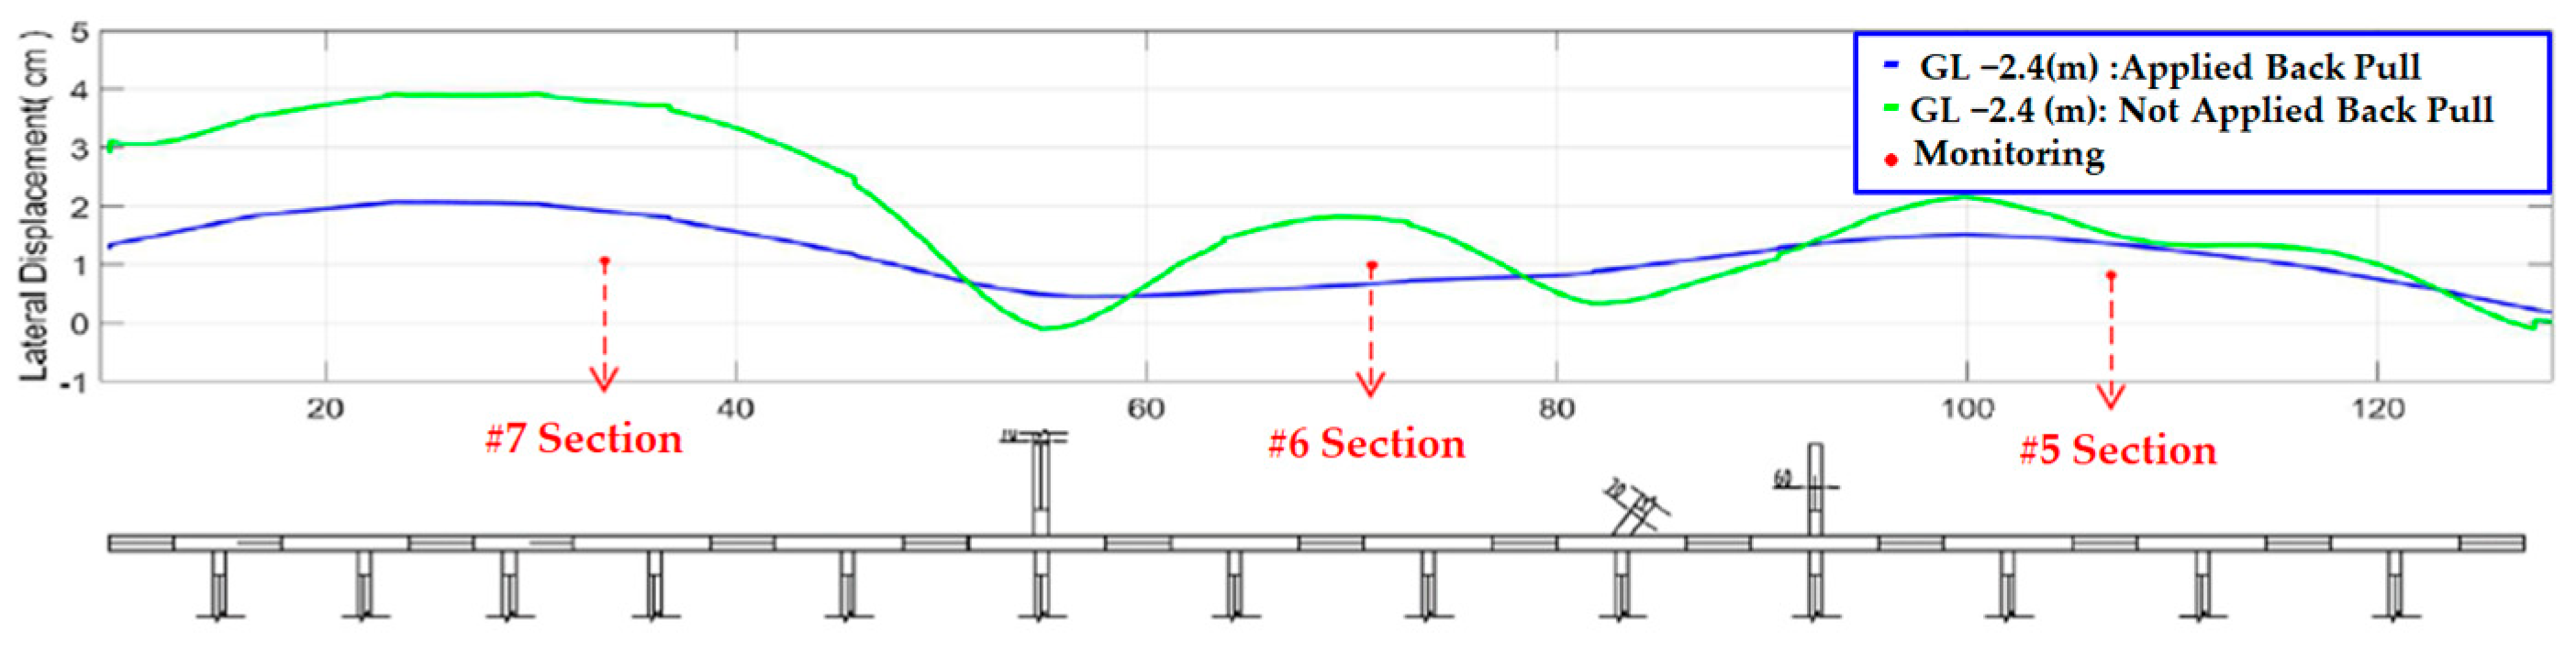
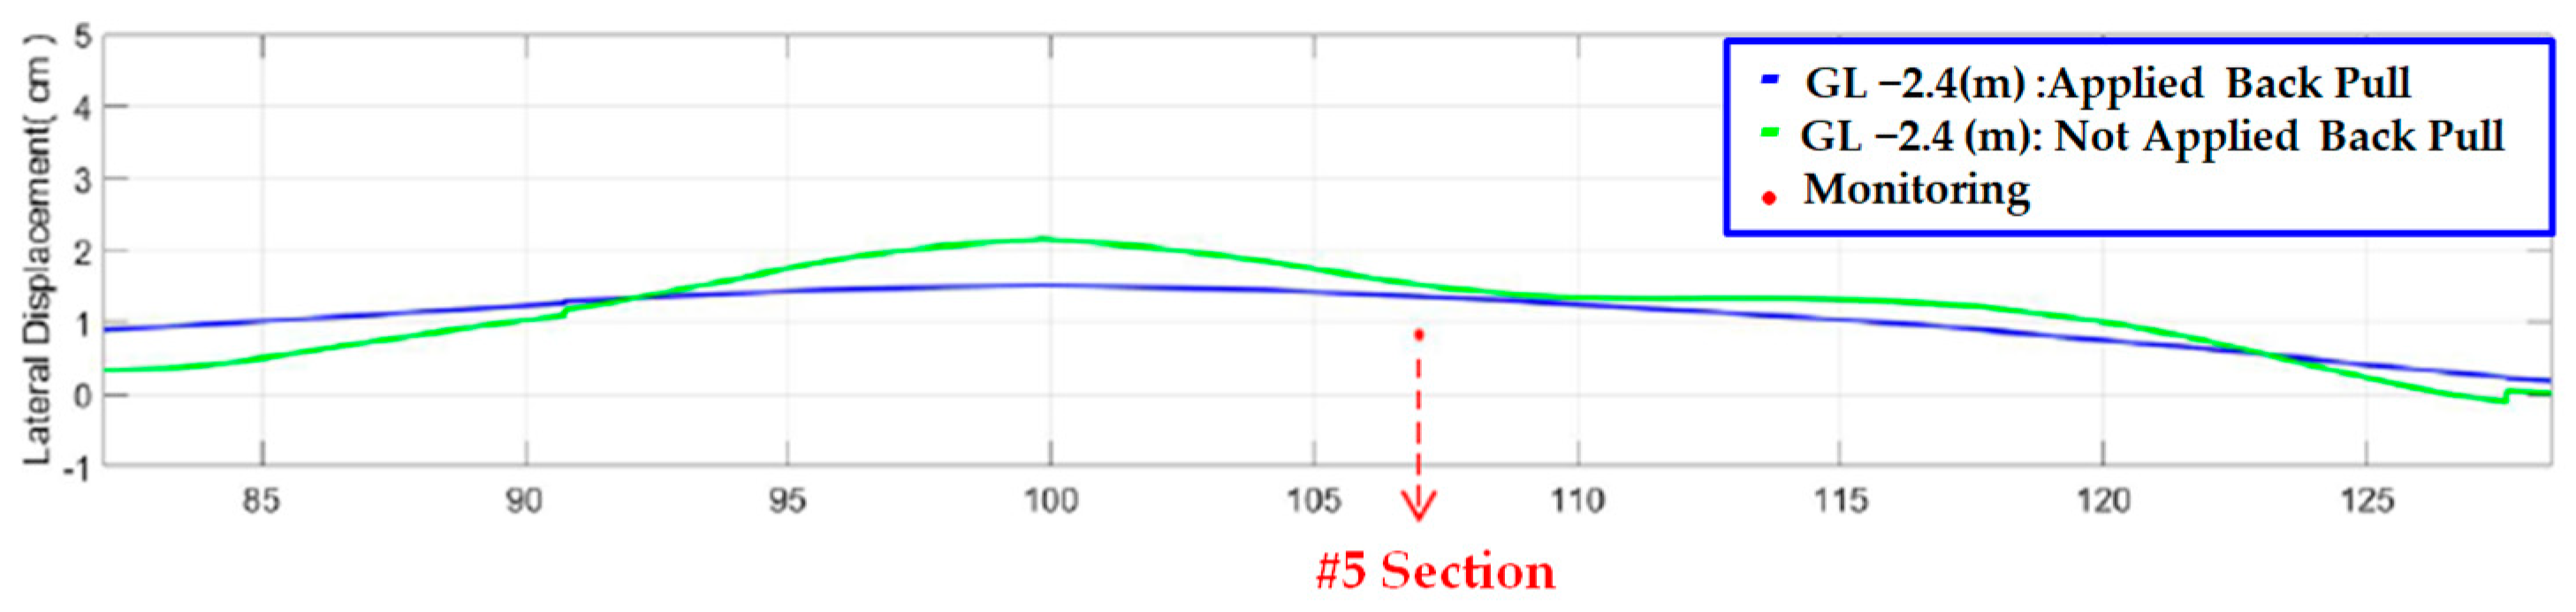
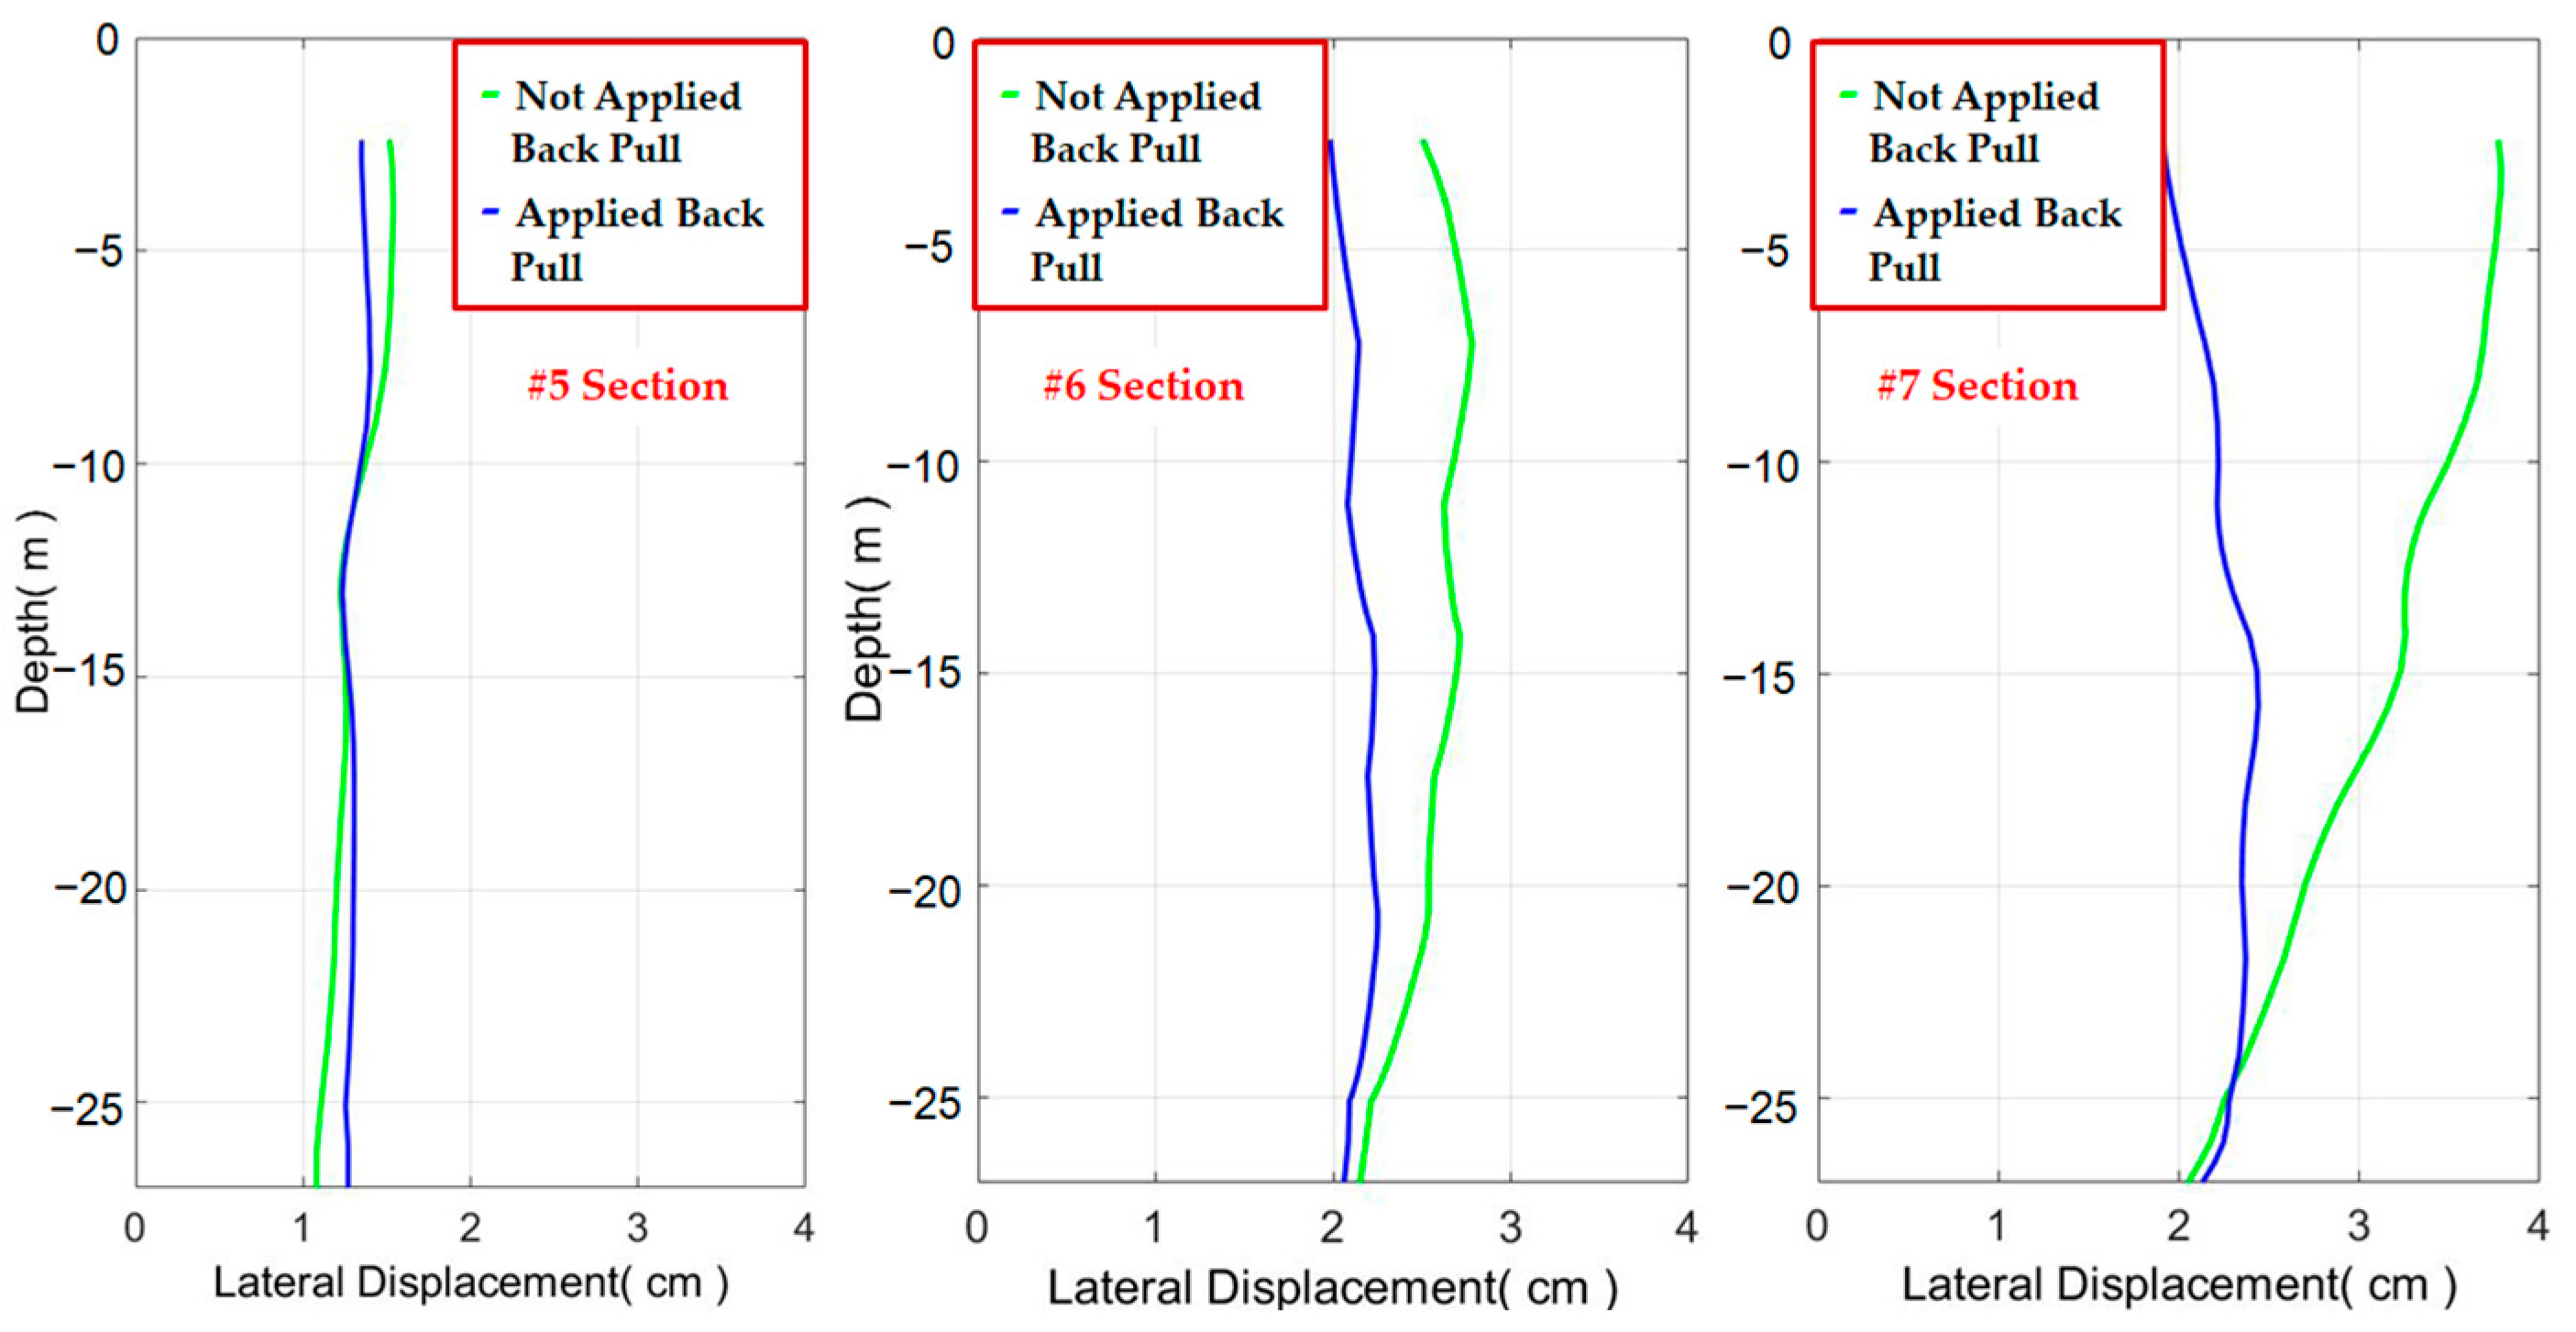
3.2. Effectiveness of Back-Pull Slabs
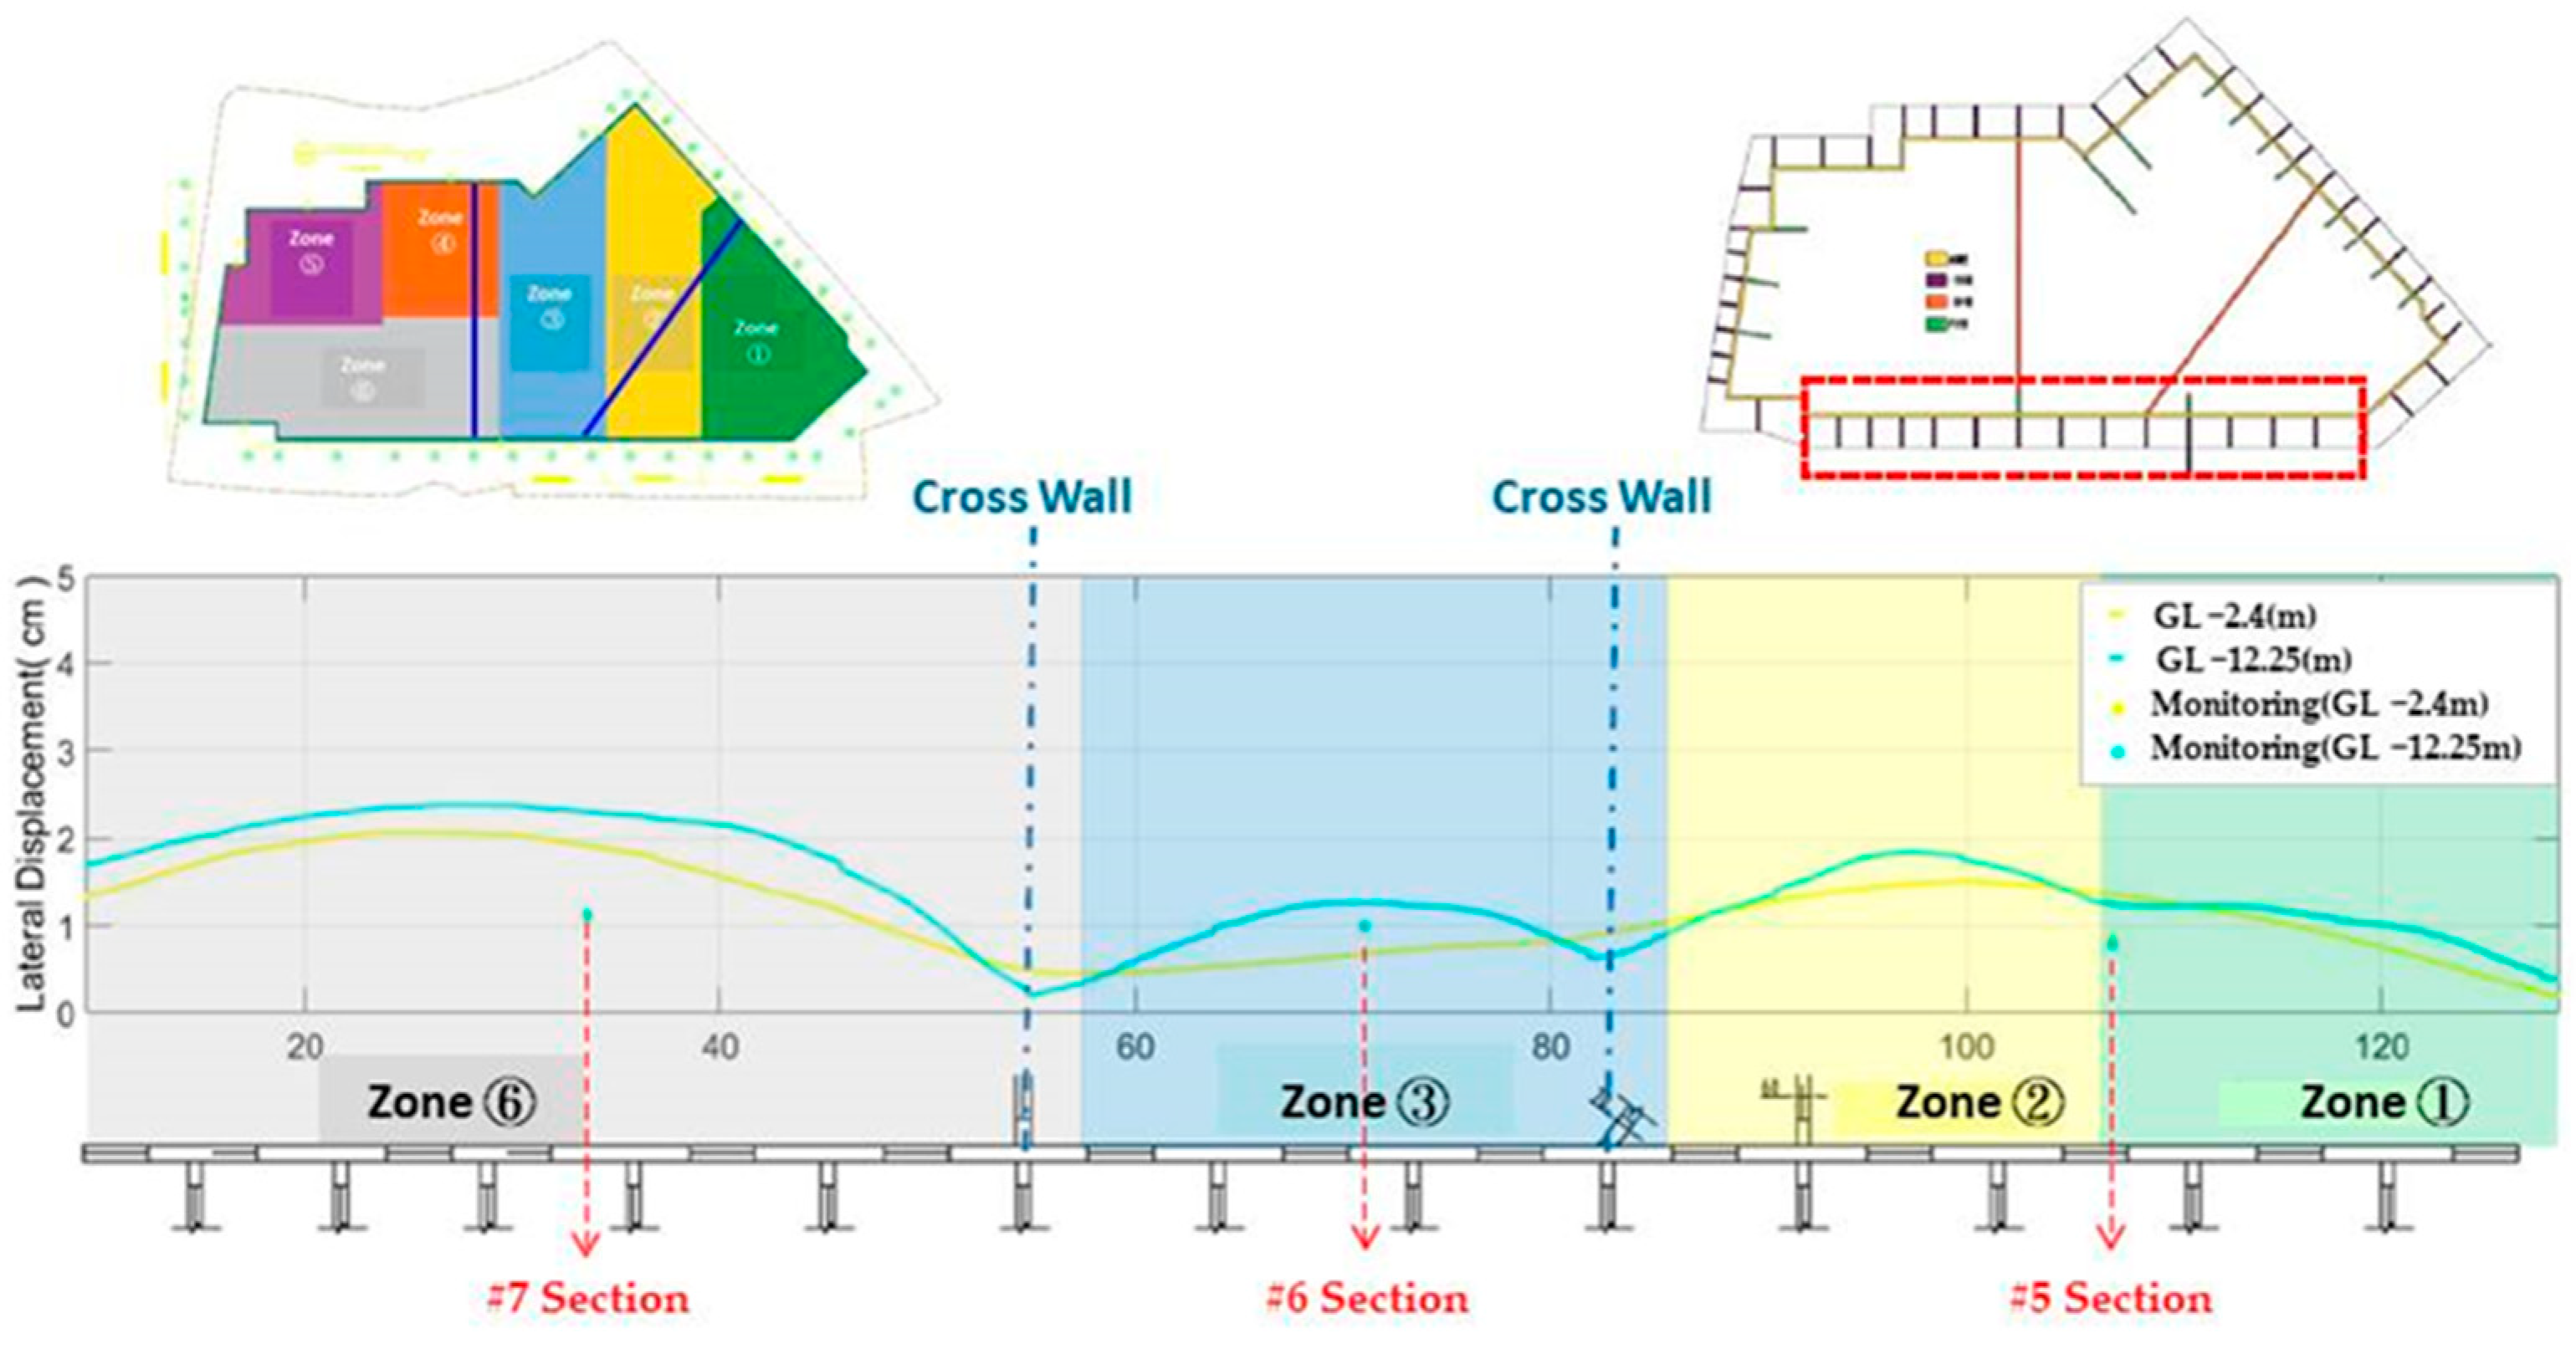
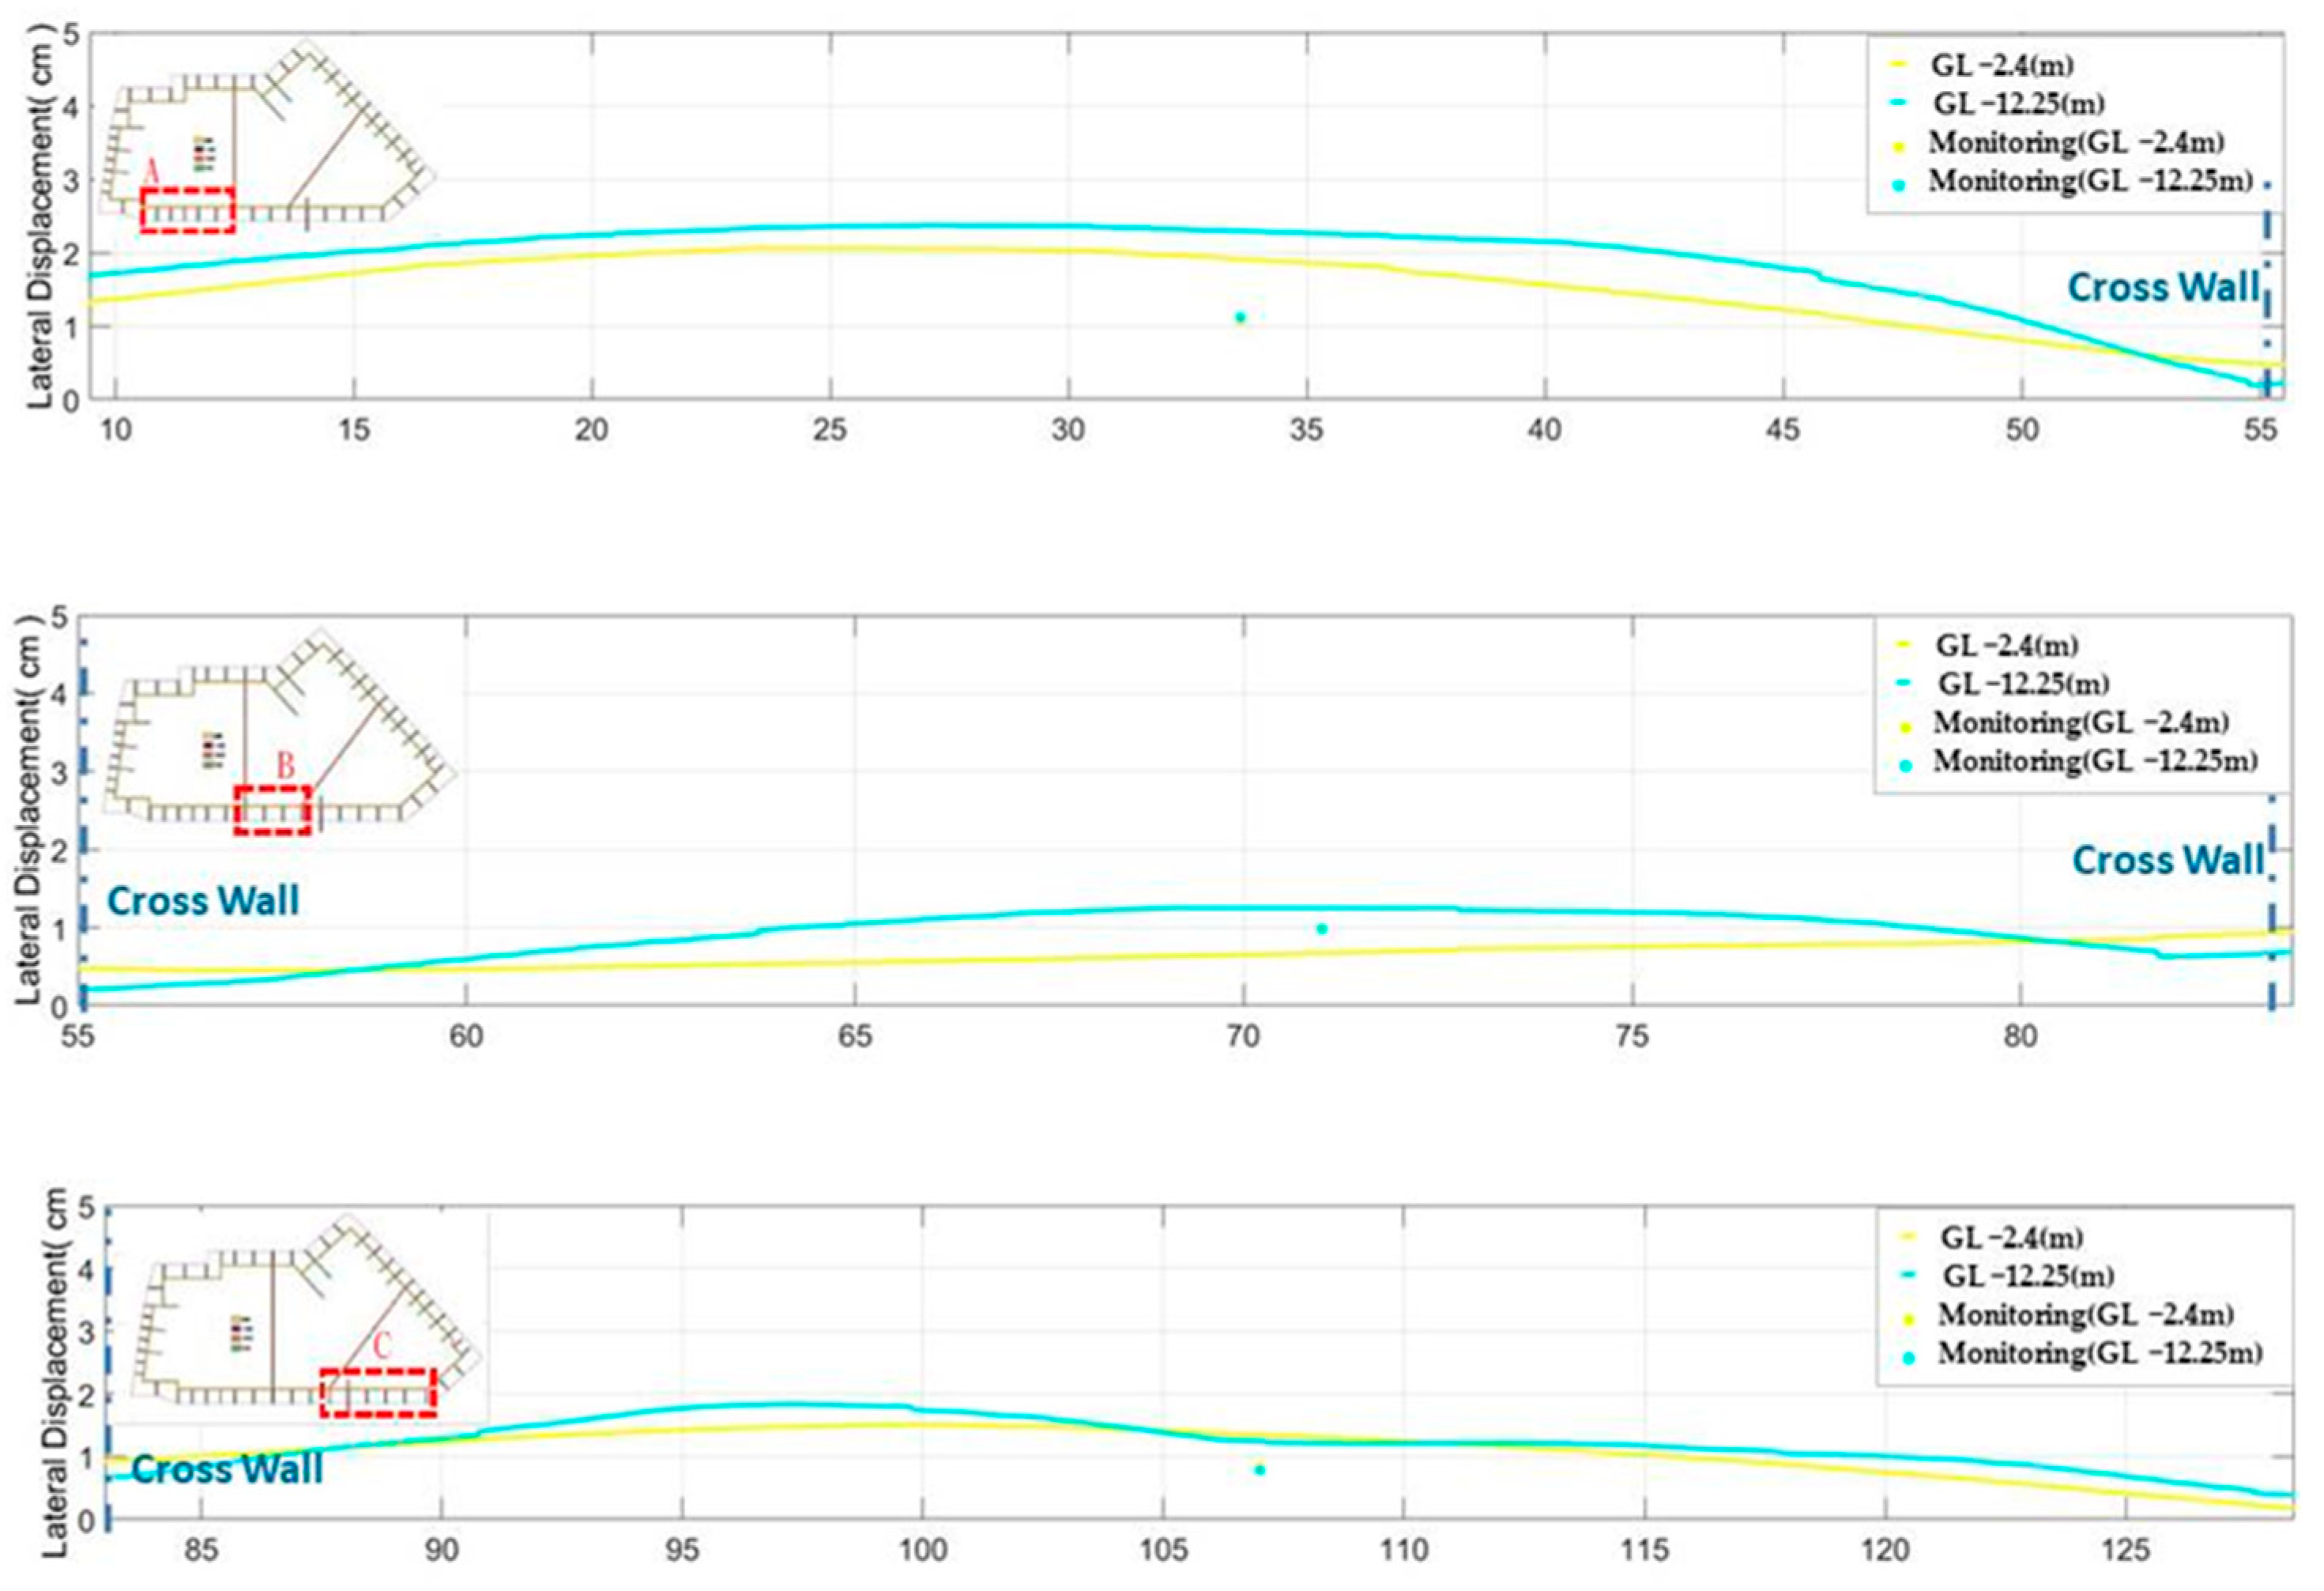
3.3. The Effectiveness of Cross Wall Construction
4. Conclusions
4.1. Summary
- 1.
- Impact of Excavation Methods on Lateral Displacement of Diaphragm Walls in Large Unsupported Deep Excavations:
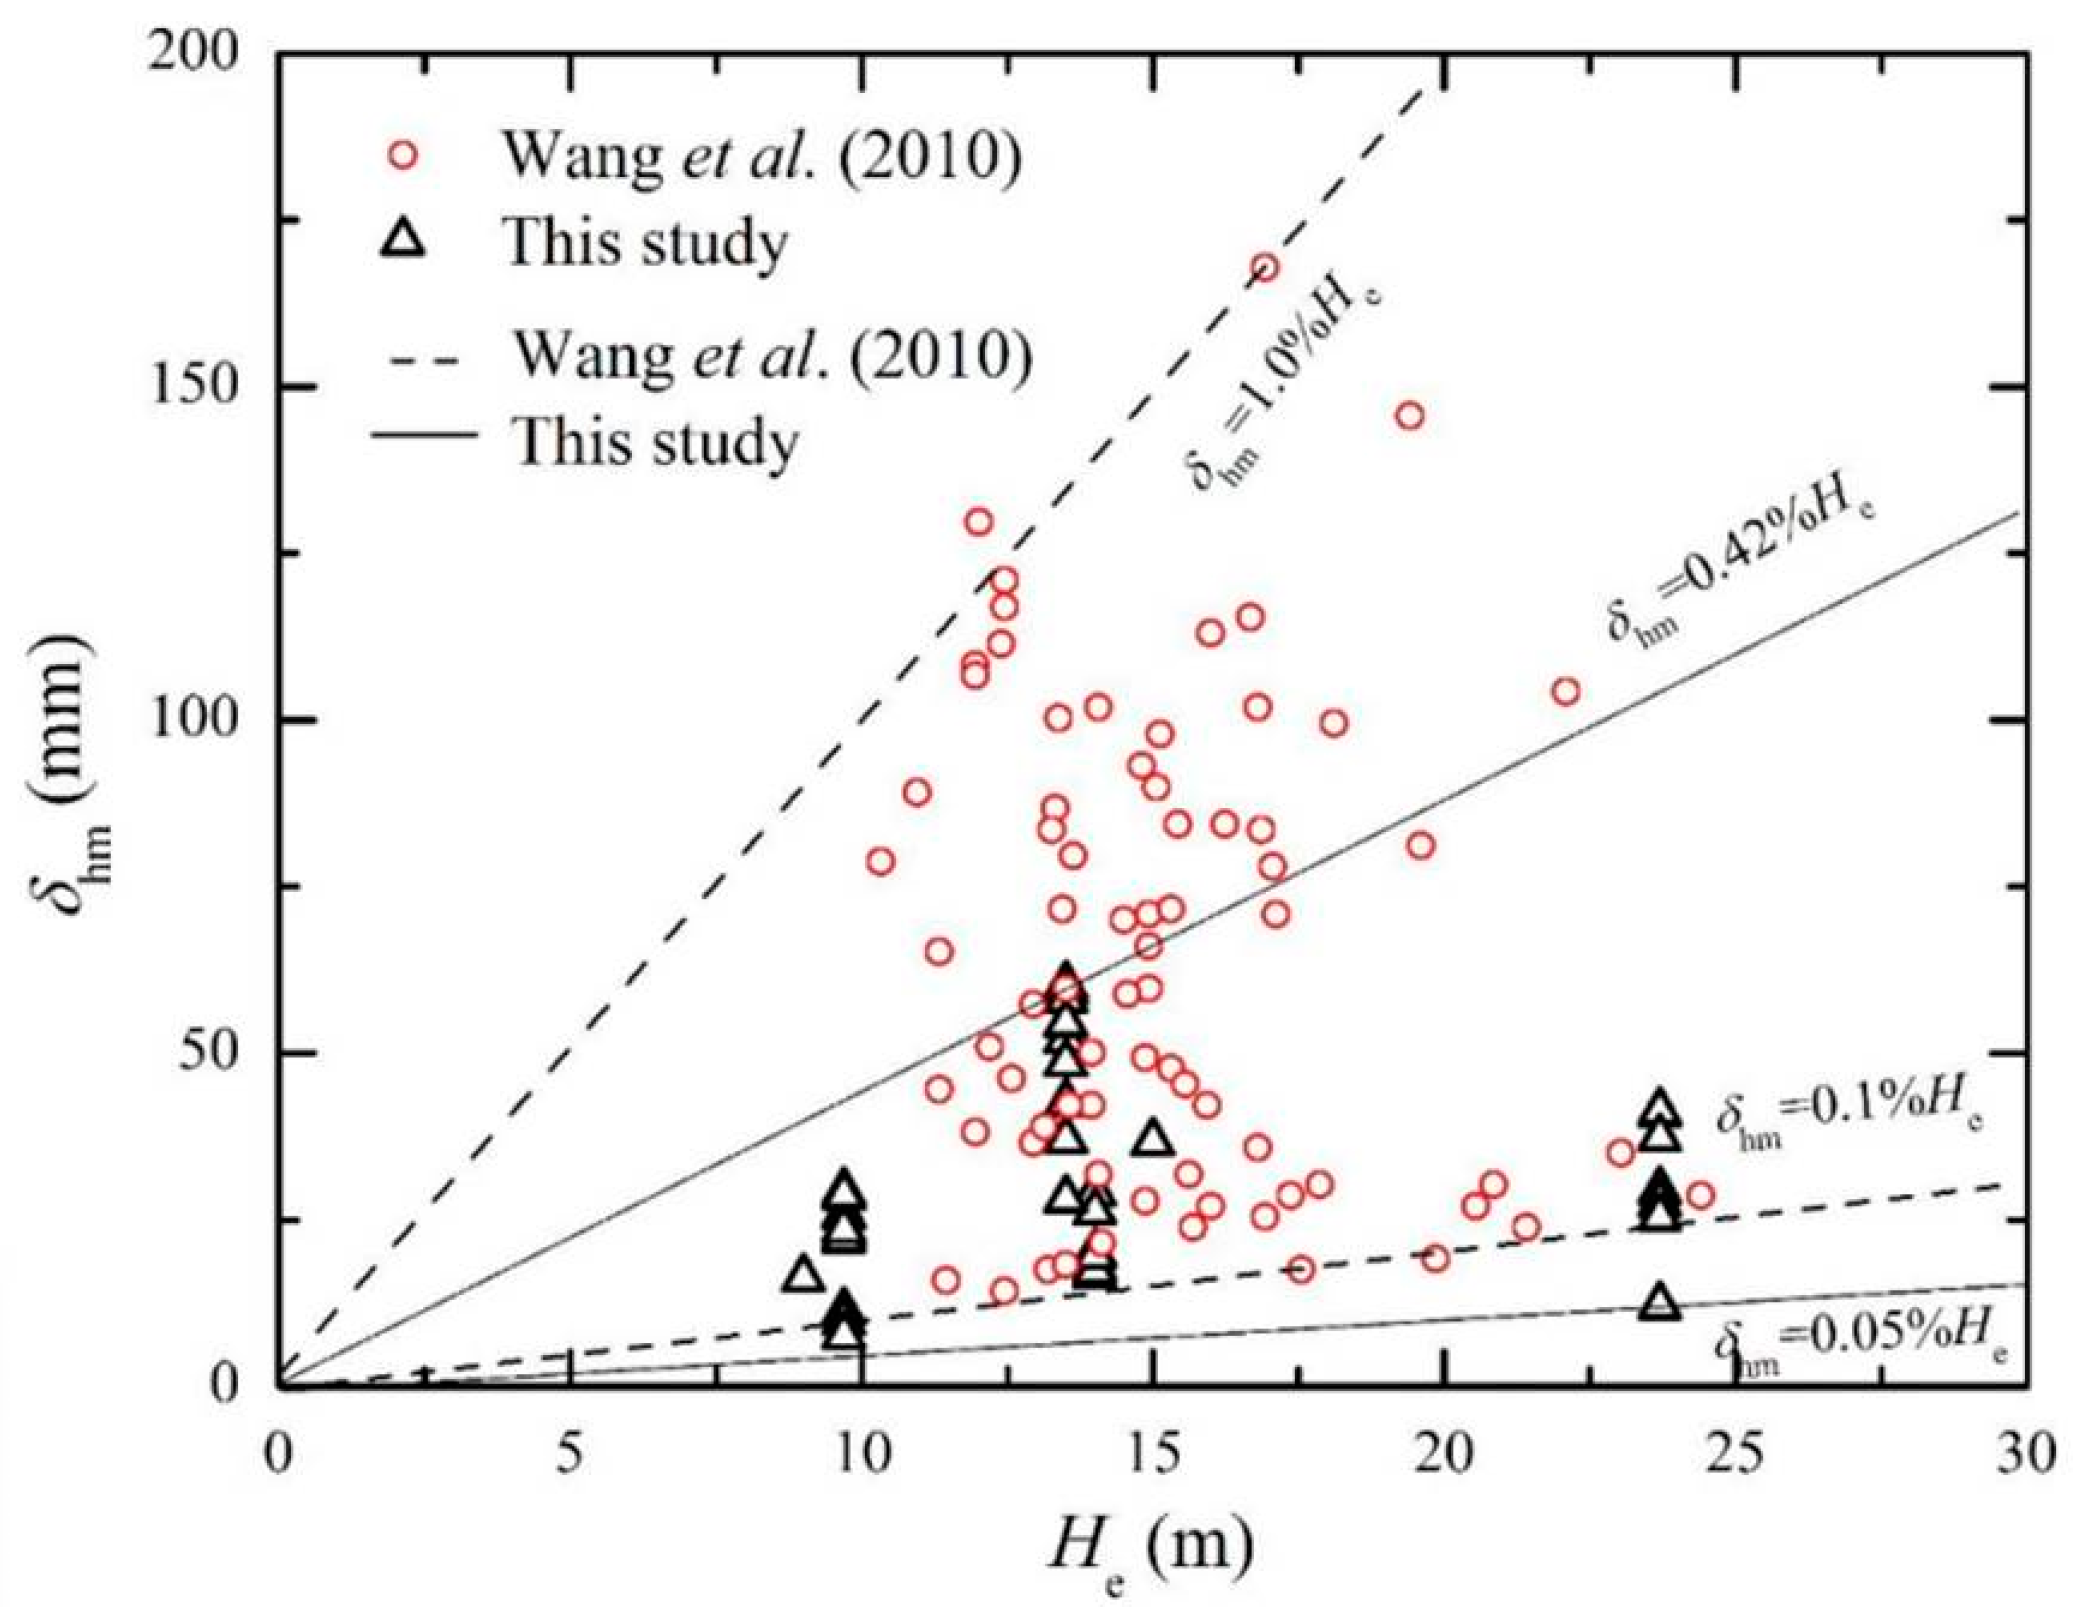
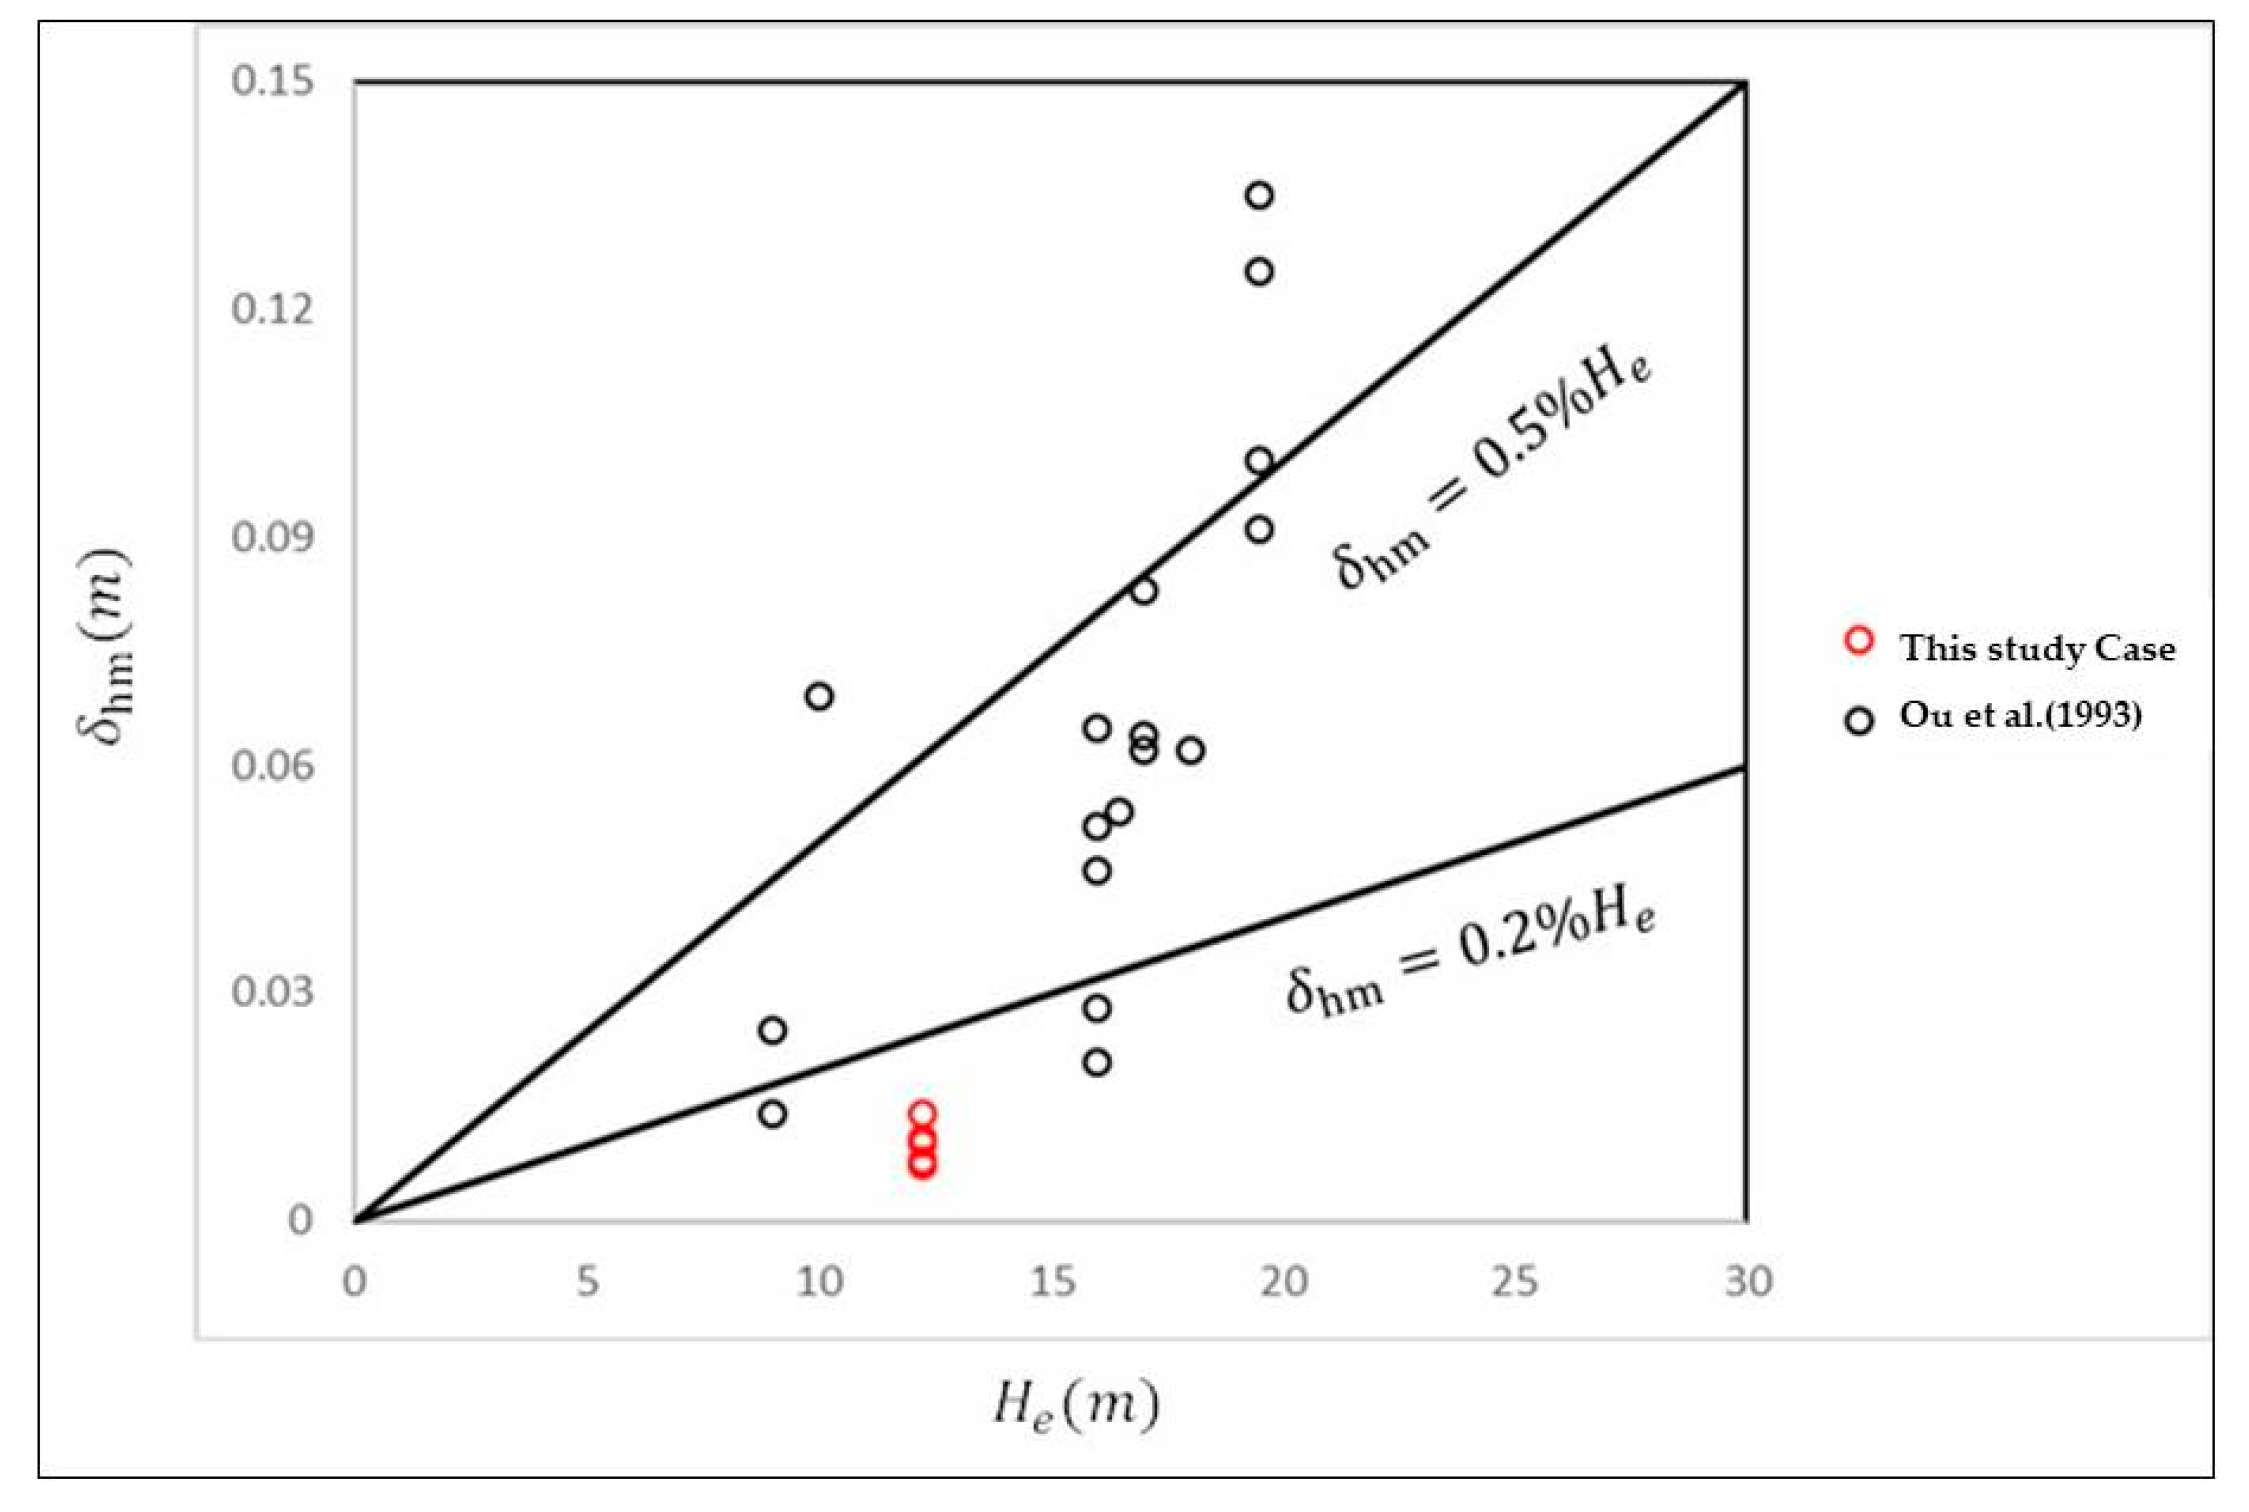
- Sectional excavation significantly reduces wall deformation. Designing smaller excavation areas in accordance with on-site construction can markedly lower lateral deformation.
- Layer-by-layer excavation in this method shows less significant reduction in lateral wall deformation.
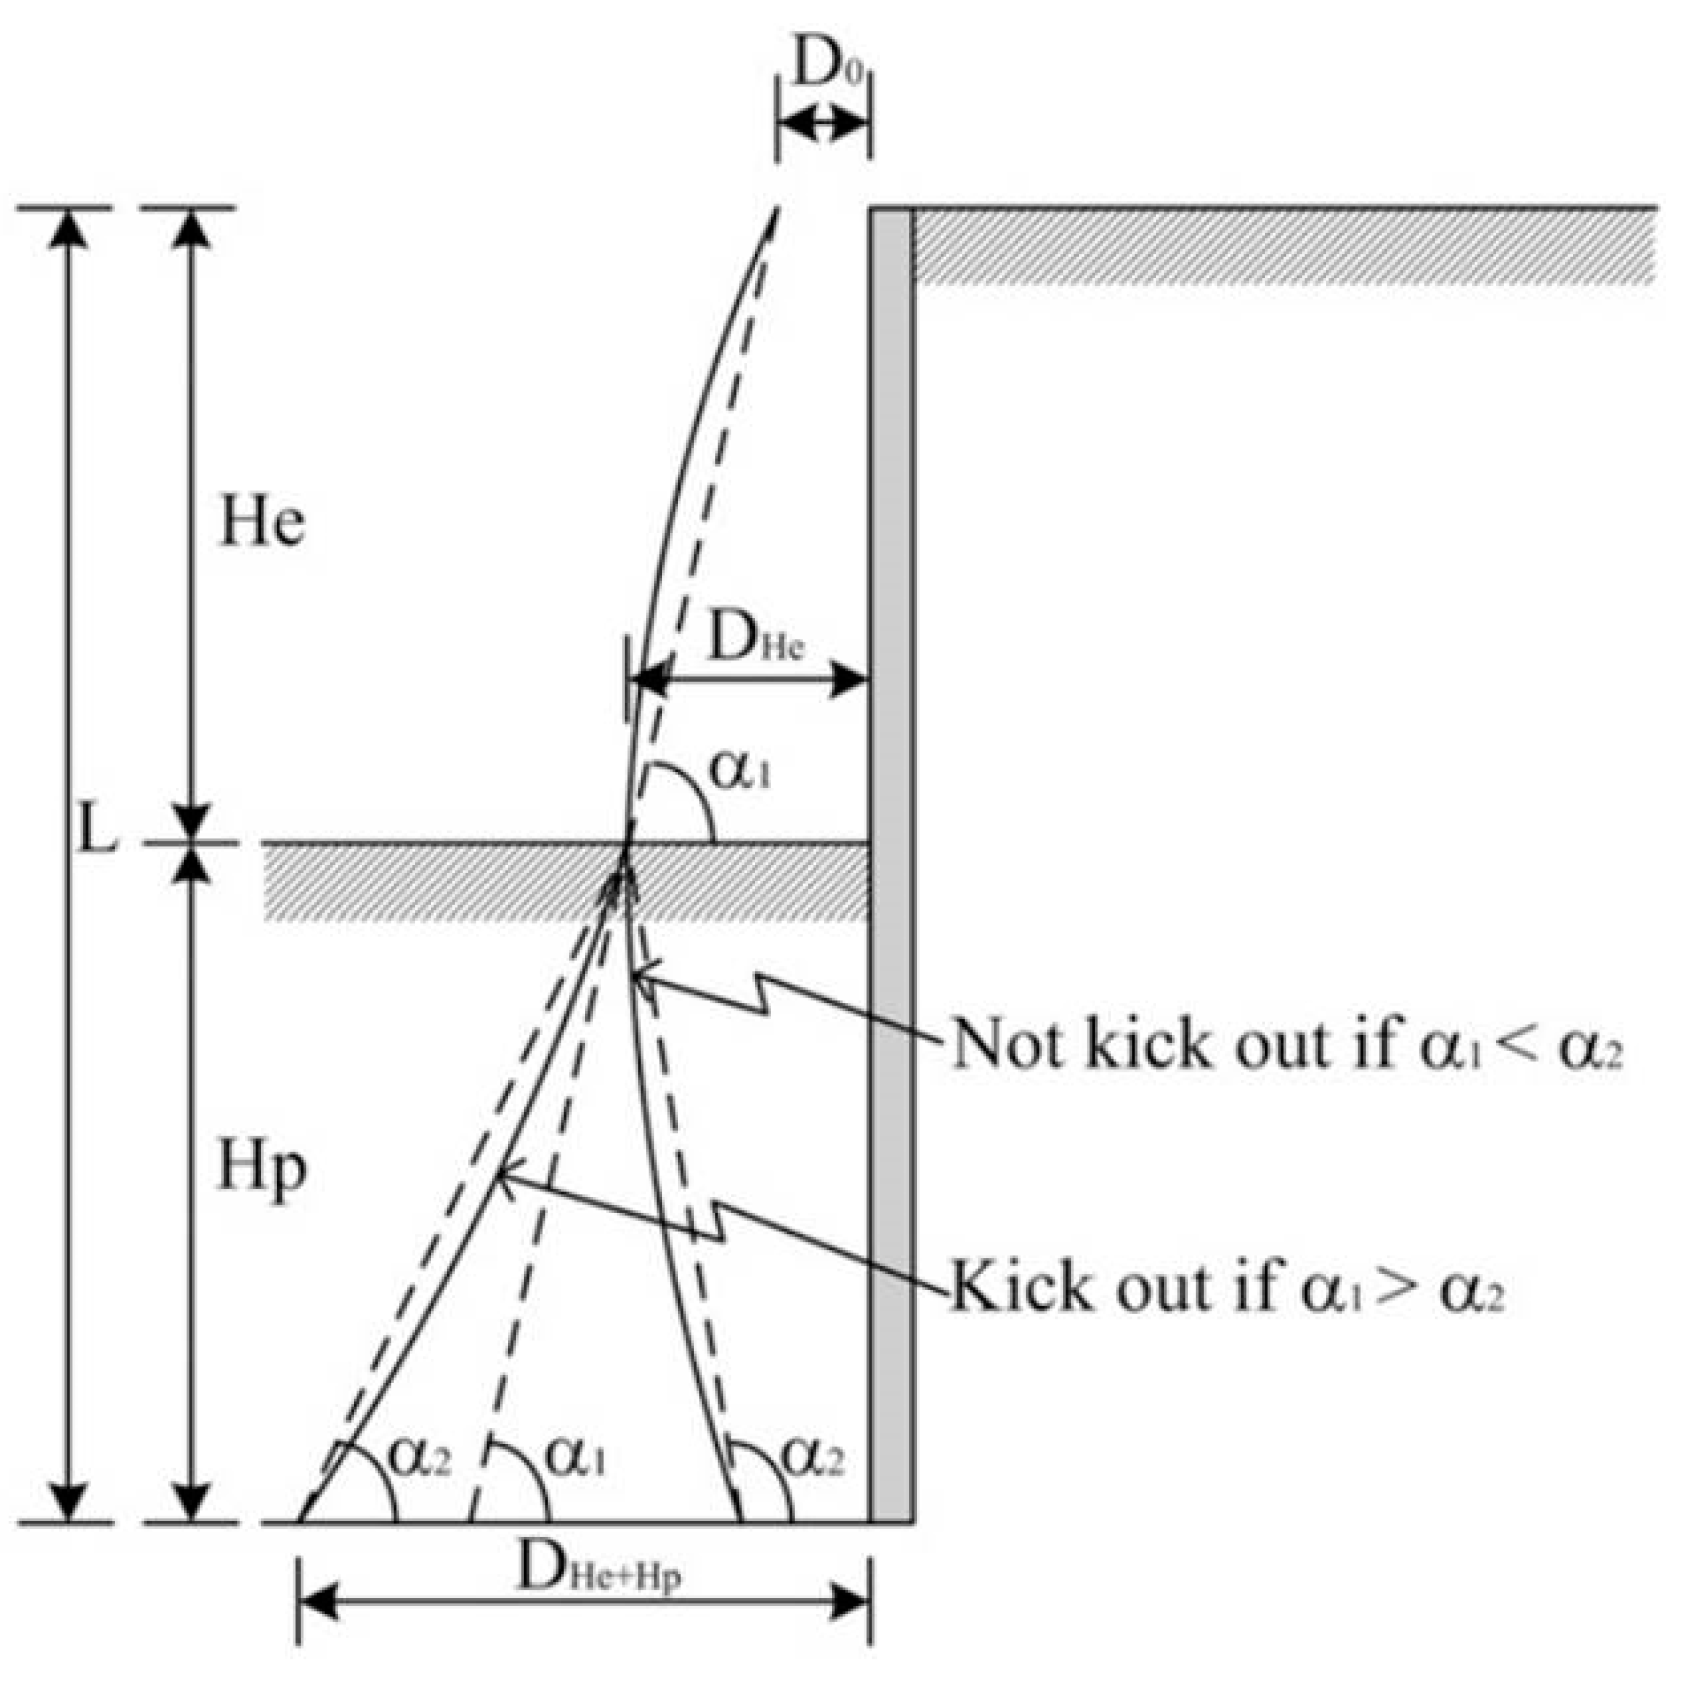
- Numerical simulations and monitoring data indicate that this construction method results in a cantilever-type wall deformation.
- 2.
- Lateral Displacement Phenomena of Diaphragm Walls:
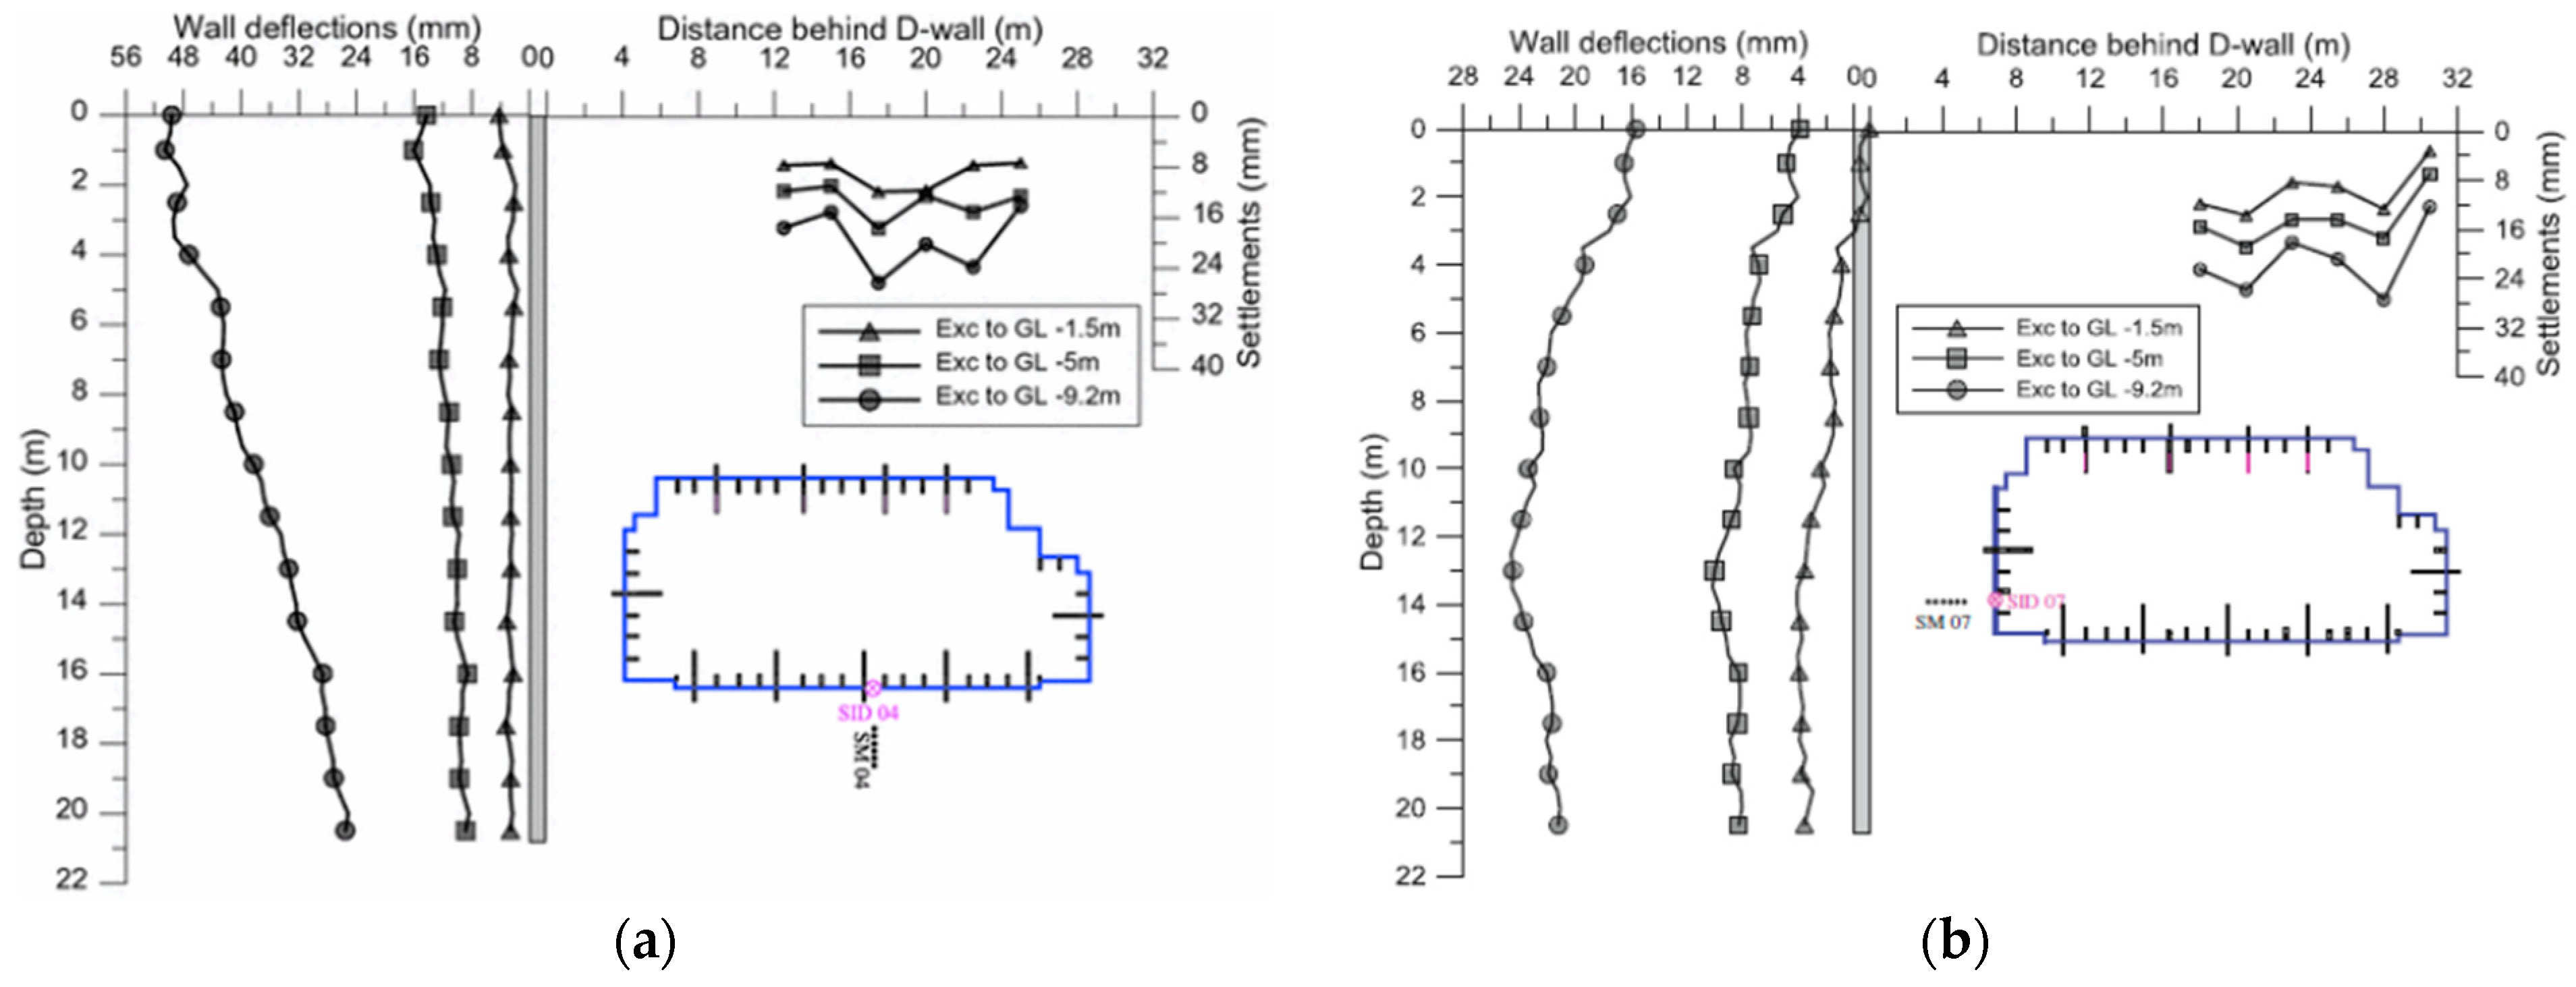
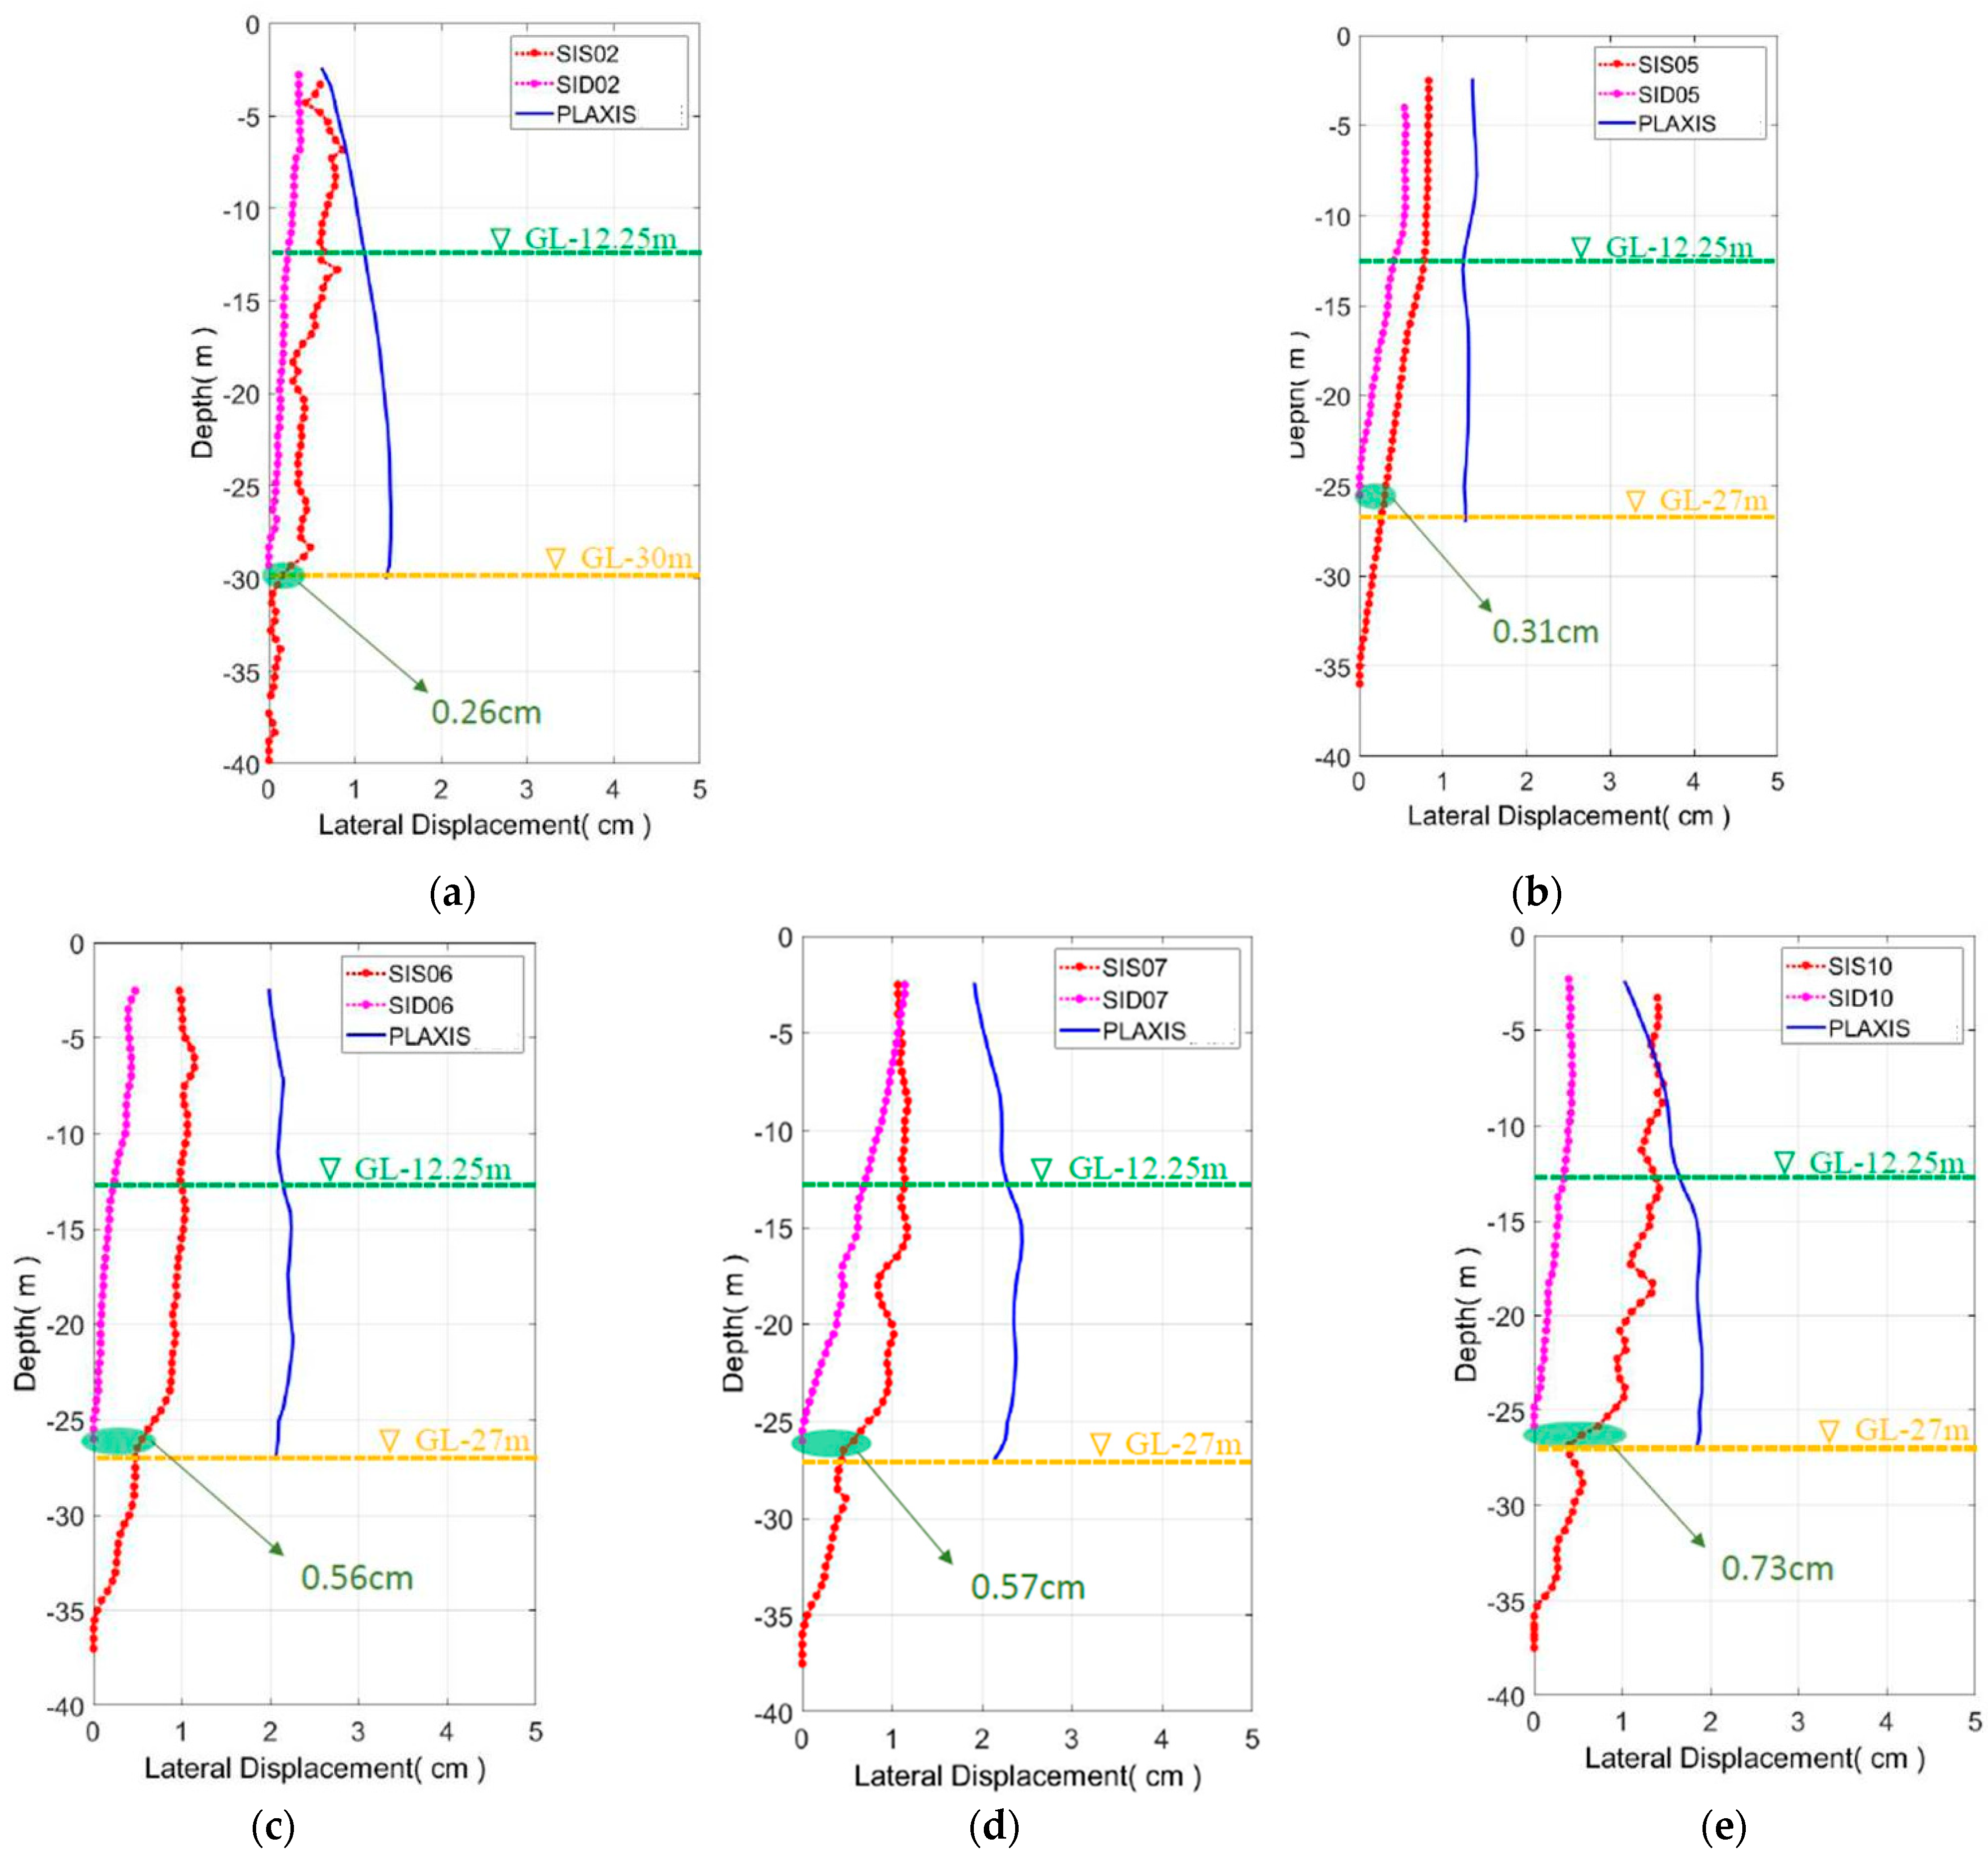
- The construction method in this study causes displacement at the toe of the diaphragm wall, as observed through external and internal inclinometers.
- Different inclinometer installation depths may alter the assumed position of the neutral point. Both numerical analysis and monitoring show toe displacement, so there remains some discrepancy in accurately estimating lateral displacement through either method.
- 3.
- Influence of Back-Pull Slabs on Lateral Wall Displacement:
- In the construction method involving peripheral top-down and central bottom-up approaches, the study finds that back-pull slabs, when feasible in large site areas, significantly enhance the stiffness and connection between the main diaphragm wall and external buttress walls, effectively reducing lateral displacement. In this case, it could reduce up to 65.19% of the lateral deformation.
- 4.
- Influence of Cross Walls on Lateral Wall Displacement:
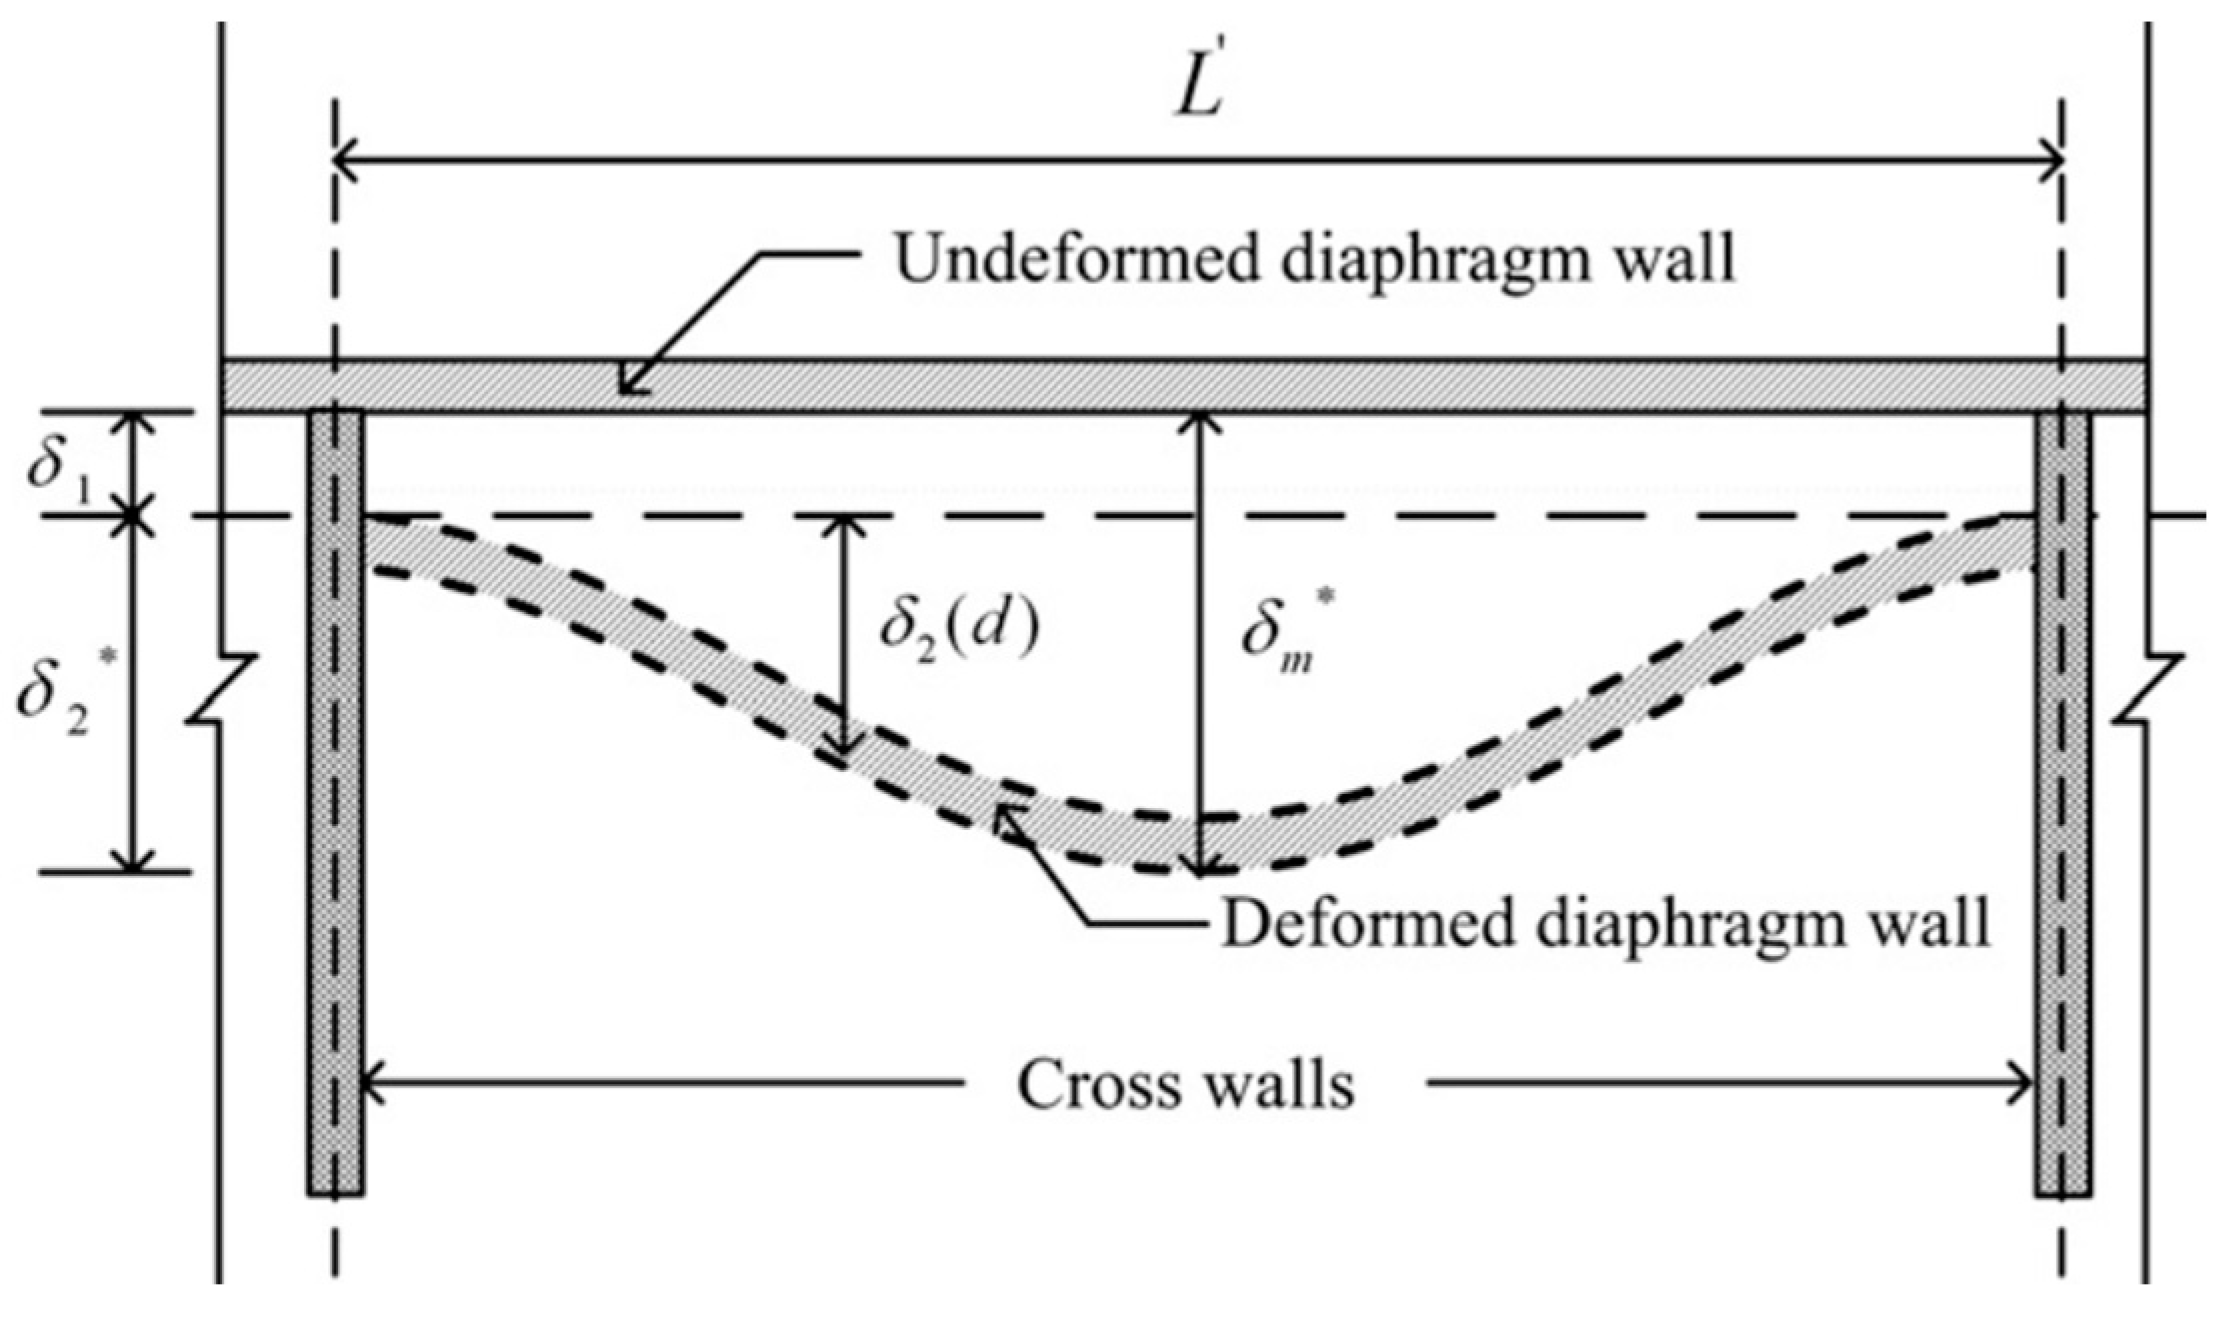
- Due to the large excavation area and elongated site width, this study analyzes the effect of two cross walls on wall displacement. Results show that even with a width of 60 m, cross walls can effectively control lateral displacement of the main diaphragm wall.
- One of the cross walls, due to the site’s shape, is not perpendicular to the diaphragm wall and shows less effective deformation control compared to perpendicular walls.
- Horizontal steel stress meters in cross walls and inclinometer installation positions do not directly prove the mechanical behavior of cross walls; their effectiveness is primarily observed through numerical simulation.
4.2. Recommendations
- The biggest challenge in this study was model construction. The case is extremely complex, including diaphragm walls, cross walls, internal and external buttress walls, back-pull slabs, and internal structural slabs, combined with the site’s irregular geometry, multiple turns, and sloping edges. This complexity often led to meshing failures at interfaces, requiring adjustments in overall mesh density and fine-tuning of conflicting structural coordinates to avoid small area mesh generation and model failures.
- In Taiwan, engineering cases using this excavation method are currently very rare, which limits the scope of research findings. In the future, collecting and analyzing more cases related to this method could help in substantiating the research with additional relevant data.
- For future monitoring device setup, placing inclinometers at the junctions of cross walls and diaphragm walls could allow for directly observing the impact of cross walls on diaphragm walls, facilitating validation with numerical simulations. Steel stress meters in cross walls should be installed on both sides of the wall to explore the force behavior of cross walls.
- The analysis could be further enhanced by using a wider variety of soil models. Comparing a hardening soil model or hardening soil with a small strain model could identify the most conservative design approach, thereby increasing overall safety.
Supplementary Materials
Author Contributions
Funding
Data Availability Statement
Conflicts of Interest
Appendix A


| Soil Layer | Average Depth | γt (kN/m3) | N | Su (kN/m2) | e | C′ref (kN/m2) | φ′(°) |
|---|---|---|---|---|---|---|---|
| CL1 | 0~−5.5 | 18.6 | 6 | 29.4 | 0.92 | 0.2 | 28 |
| CL/ML1 | −5.5~−7.2 | 18.3 | 3 | 39.24 | 1.00 | 0.2 | 27 |
| SM1 | −7.2~−11.0 | 19.5 | 9 | − | 0.65 | 0.2 | 30 |
| CL/ML2 | −11.0~−14.1 | 18.5 | 7 | 49.05 | 0.87 | 0.2 | 28 |
| SM2 | −14.1~−17.4 | 19.1 | 14 | − | 0.71 | 0.2 | 32 |
| CL2 | −17.4~−20.6 | 18.6 | 7 | 58.86 | 0.85 | 0.2 | 28 |
| SM3 | −20.6~−25.1 | 19.4 | 15 | − | 0.60 | 0.2 | 32 |
| CL3 | −25.1~−29.3 | 18.8 | 7 | 78.48 | 0.79 | 0.2 | 29 |
| SM4 | −29.3~−31.6 | 18.9 | 16 | − | 0.76 | 0.2 | 32 |
| CL-ML | −31.6~−38.6 | 18.5 | 10 | 98.10 | 0.90 | 0.2 | 30 |
| CL4 | −38.6~−43.2 | 20.7 | 22 | 107.91 | 0.55 | 0.2 | 32 |
| SM5 | −43.2~−44.8 | 19.7 | 23 | − | 0.60 | 0.2 | 33 |
| GW/GP | −44.8 down | 21.6 | 50 | − | − | 0.2 | 40 |
References
- Weidong, L.G.W. Foundation Pit Engineering Handbook, 2nd ed.; China Architecture & Building Press: Beijing, China, 2009. [Google Scholar]
- Lim, A.; Ou, C.-Y. Case Record of a Strut-free Excavation with Buttress Walls in Soft Soil. In Proceedings of the 2nd International Symposium on Asia Urban GeoEngineering; Springer Singapore: Singapore; 2018. [Google Scholar]
- Ou, C.Y. Advanced Deep Excavation Engineering Analysis and Design; Tech Books Incorporated: Taipei, Taiwan, 2017. [Google Scholar]
- Jeng, C.-J.; Ho, S.-K. A Case Study of 3-D Numerical Analysis for Nonstrut Construction Method in Huge Area Foundation Excavation. J. Art Des. Huafan Univ. 2016, 11, 75–87. [Google Scholar]
- Li, M.-G.; Zhang, Z.-J.; Chen, J.-J.; Wang, J.-H.; Xu, A.-J. Zoned and staged construction of an underground complex in Shanghai soft clay. Tunn. Undergr. Space Technol. 2017, 67, 187–200. [Google Scholar] [CrossRef]
- Wang, J.H.; Xu, Z.H.; Wang, W.D. Wall and Ground Movements due to Deep Excavations in Shanghai Soft Soils. J. Geotech. Geoenviron. Eng. 2010, 136, 985–994. [Google Scholar] [CrossRef]
- Clough, G.W.; O’Rourke, T.D. Construction-Induced Movements of In Situ Wall, Design and Performance of Earth Retaining Structure; ASCE: Reston, VA, USA, 1990. [Google Scholar]
- Ou, C.-Y.; Hsieh, P.-G.; Chiou, D.-C. Characteristics of ground surface settlement during excavation. Can. Geotech. J. 1993, 30, 758–767. [Google Scholar] [CrossRef]
- Mana, A.I.; Clough, G.W. Prediction of movements for braced cuts in clay. J. Geotech. Eng. Div. 1981, 107, 759–777. [Google Scholar] [CrossRef]
- Masuda, T.; Einstein, H.H.; Mitachi, T. Prediction of lateral deflection of diaphragm wall in deep excavations. Doboku Gakkai Ronbunshu 1994, 1994, 19–29. [Google Scholar] [CrossRef] [PubMed]
- Wu, S.-H.; Ching, J.; Ou, C.-Y. Predicting wall displacements for excavations with cross walls in soft clay. J. Geotech. Geoenviron. Eng. 2013, 139, 914–927. [Google Scholar] [CrossRef]
- Do, T.-N.; Ou, C.-Y.; Lim, A. Evaluation of factors of safety against basal heave for deep excavations in soft clay using the finite-element method. J. Geotech. Geoenviron. Eng. 2013, 139, 2125–2135. [Google Scholar] [CrossRef]
- Chheng, C.; Likitlersuang, S. Underground excavation behaviour in Bangkok using three-dimensional finite element method. Comput. Geotech. 2018, 95, 68–81. [Google Scholar] [CrossRef]
- Chen, S.-L.; Ho, C.-T.; Li, C.-D.; Gui, M.-W. Efficiency of buttress walls in deep excavations. J. Geoeng. 2011, 6, 145–156. [Google Scholar]
- Hsiung, B.-C.; Yang, K.-H.; Aila, W.; Ge, L. Evaluation of the wall deflections of a deep excavation in Central Jakarta using three-dimensional modeling. Tunn. Undergr. Space Technol. 2018, 72, 84–96. [Google Scholar] [CrossRef]
- Lim, A.; Hsieh, P.-G.; Ou, C.-Y. Evaluation of buttress wall shapes to limit movements induced by deep excavation. Comput. Geotech. 2016, 78, 155–170. [Google Scholar] [CrossRef]
- Chuah, S.; Harry, S.T. Numerical study on a new strut-free counterfort embedded wall in Singapore. In Proceedings of the Earth Retention Conference 3, Bellevue, Washington, 1–4 August 2010. [Google Scholar]
- Liu, G.; Guo, J.; Li, M.; Qin, T.; Huang, P. Measured behaviors of an oversized irregular basement excavation and its surrounding responses in thick soft clay. Arab. J. Geosci. 2019, 13, 3. [Google Scholar] [CrossRef]
- Liu, Y.; Xiang, B.; Fu, M. Observed Performance of a Large-Scale Deep Triangular Excavation in Shanghai Soft Clays. Geotech. Geol. Eng. 2019, 37, 2791–2809. [Google Scholar] [CrossRef]
- Ren, D.; Kang, C.; Liu, H.; Li, Y.; Wang, J. Characteristics of a Large-Scale Deep Foundation Pit Excavated by the Central-Island Technique in Chengdu Soft Clay. KSCE J. Civ. Eng. 2022, 26, 2610–2623. [Google Scholar] [CrossRef]
- Liang, R.; Wu, J.; Sun, L.; Shen, W.; Wu, W. Performances of adjacent metro structures due to zoned excavation of a large-scale basement in soft ground. Tunn. Undergr. Space Technol. 2021, 117, 104123. [Google Scholar] [CrossRef]
- Ho, S.K.; Gao, F. Case Study of Large-Scale Unsupported Excavation. Sino-Geotech. 2011, 128, 89–98. [Google Scholar]
- Liao, N.-H. Application of Empirical Soil Parameters in Numerical Analysis. Master’s Thesis, National Cheng Kung University, Tainan, Taiwan, 2003. [Google Scholar]
- Ou, C.-Y. Deep Excavation Engineering: Analysis, Design Theories and Practices; Science and Technology Books: Taipei, Taiwan, 2002. [Google Scholar]
- Wu, P.-Z.; Wang, M.-J.; Peng, Y.-R. Investigation of Continuous Wall Deformation Behavior. In Proceedings of the 7th Geotechnical Engineering Research Symposium, Berlin, Germany, 8–11 September 1997. [Google Scholar]


| Researcher | Location | Depth/Area | Numerical Analysis Method | Construction Method (Supported/Unsupported) | Field Monitoring | Key Findings |
|---|---|---|---|---|---|---|
| Liu et al. [18] | Shanghai/China | 10.9–15.6 m/70,500 m2 | 3D Numerical Method | Bottom-Up (Unsupported) | Wall Deflection, Ground Subsidence | Maximum wall deformation and ground subsidence exceed 0.86% of excavation depth |
| Liu et al. [19] | Shanghai/China | 18.4 m/approx. 10,000 m2 | No | Bottom-Up (Supported) | Wall Deflection, Vertical Wall and Column Movements, Ground Subsidence | Unique deformation characteristics due to the triangular shape of the pit |
| Ren et al. [20] | Chengdu/China | 20 m/25,720 m2 | No | Bottom-Up Central-island (Supported) | Column Movements, Deflections, Internal Stress, Anchor Cable Forces, Ground Settlement, Water Levels | Maximum column deflection usually occurs at the top |
| Liang et al. [21] | Shanghai/China | 23.2–27.3 m/ 31,309 m2. | Finite Element Method | Zoned Excavation (Unsupported) | Lateral Wall Deflections, Surface Settlements, Metro Station and Tunnels Vertical/Horizontal Displacements | Significant ground settlements and horizontal movements in metro station and tunnels |
| Ho and Gao [22] | Xizhi District, New Taipei City/ Taiwan | 9.2 m/over 2 hectares | GTS 3D Numerical Method | Peripheral Top-Down and Central Bottom-Up (Unsupported) | Wall Stability and Deformation | Actual deformation smaller than anticipated |
| This Study | Zhonghe District, New Taipei City/ Taiwan | 12.25 m/13,720 m2. | Plaxis 3D Finite Element Method | Peripheral Top-Down and Central Bottom-Up (Unsupported) | Lateral Displacement of Diaphragm Walls, Impact of Back-Pull Slabs and Cross Walls | Zoned excavation effectively controls lateral displacement on longer sides of the site |
| Depth (m) | γ (kN/m3) | Su (kN/m2) | Eu (kN/m2) | νu | Rinter |
|---|---|---|---|---|---|
| 0~0.5 | 18.6 | 29.4 | 23,520 | 0.495 | 0.67 |
| 5.5~7.2 | 18.3 | 39.24 | 31,392 | 0.495 | 0.67 |
| 11.0~14.1 | 18.5 | 49.05 | 39,240 | 0.495 | 0.67 |
| 17.4~20.6 | 18.6 | 58.86 | 47,088 | 0.495 | 0.67 |
| 25.1~29.3 | 18.8 | 78.48 | 62,784 | 0.495 | 0.67 |
| 31.6~38.6 | 18.5 | 98.1 | 78,480 | 0.495 | 0.67 |
| 38.6~43.2 | 20.7 | 107.91 | 86,328 | 0.495 | 0.67 |
| Depth (m) | γ (kN/m3) | φ′ (°) | E′ (kN/m2) | ν′ | Rinter |
|---|---|---|---|---|---|
| 7.2~11.0 | 19.5 | 30 | 21,924 | 0.2 | 0.67 |
| 14.1~17.4 | 18.5 | 32 | 34,104 | 0.2 | 0.67 |
| 20.6~25.1 | 19.4 | 32 | 36,540 | 0.2 | 0.67 |
| 29.3~31.6 | 18.9 | 32 | 38,976 | 0.2 | 0.67 |
| 43.2~44.8 | 19.7 | 33 | 56,028 | 0.2 | 0.67 |
| 44.8~50 | 21.6 | 40 | 121,800 | 0.2 | 0.67 |
| Type | Thickness (m) | Depth (m) | E (kN/m2) | Poisson’s Ratio υ | (kg/cm2) |
|---|---|---|---|---|---|
| Diaphragm walls | 0.7 | 2.4~27 2.4~30 | 2.42 × 10⁷ | 0.15 | 280 |
| Buttress walls (Layered Elimination) | 0.7 | 2.4~12.25 | 1.74 × 10⁷ | 0.15 | 140 |
| Buttress walls | 0.7/0.6 | 2.4~27 2.4~30 | 2.42 × 10⁷ | 0.15 | 280 |
| Cross walls (Layered Elimination) | 0.7 | 2.4~12.25 | 1.74 × 10⁷ | 0.15 | 140 |
| Cross walls | 0.7 | 12.25~27 | 2.42 × 10⁷ | 0.15 | 280 |
| 1FL Back-Pull Slabs | 0.4 | 2.0~2.4 | 2.42 × 10⁷ | 0.15 | 280 |
| B1F Internal Structure Slabs | 0.4 | 3.55~3.95 | 3.02 × 10⁷ | 0.15 | 420 |
| Foundation Slab Back-pull Slabs | 0.8 | 11.45~12.25 | 2.42 × 10⁷ | 0.15 | 280 |
| Excavation Zone | Area | Location Photo |
|---|---|---|
| Zone ① | 1307 | Figure S6 |
| Zone ② | 1506 | Figure S7 |
| Zone ③ | 1500 | Figure S8 |
| Zone ④ | 822 | Figure S9 |
| Zone ⑤ | 884 | Figure S10 |
| Zone ⑥ | 1664 | Figure S11 |
| Total Area | 7683 |
| Zone | Max. Displacement in 6 Zones (cm) | Max. Displacement in 3 Zones (cm) | Max. Displacement in 6 Zones (cm) | Max. Displacement in 3 Zones (cm) |
|---|---|---|---|---|
| Local @ GL −2.4 m | Local @ GL −12.25 m | |||
| Zone 1 | 1.33 | 2.09 | 1.22 | 1.87 |
| Zone 2 | 1.51 | 1.63 | 1.84 | 1.23 |
| Zone 3 | 1.08 | 4.28 | 1.12 | 3.77 |
| Zone 6 | 2.06 | - | 2.37 | - |
| Zone | Zoned Exc. | Layer Exc. | Zoned Exc. | Layer Exc. |
|---|---|---|---|---|
| Displacement (cm) | ||||
| Local @ GL −2.4 m | Local @ GL −12.25 m | |||
| #5 Section | 1.91 | 2.58 | 2.29 | 2.7 |
| #6 Section | 0.67 | 1.92 | 1.25 | 2.16 |
| #7 Section | 1.33 | 2.07 | 1.22 | 2.12 |
| Section | Wall Displacement (cm) with Back-Pull Slab | Wall Displacement (cm) without Back-Pull Slab | MDR (%) |
|---|---|---|---|
| #5 Section | 1.33 | 1.46 | 8.9 |
| #6 Section | 0.63 | 1.81 | 65.2 |
| #7 Section | 1.91 | 3.77 | 49.3 |
| Level | Perpendicular Cross Wall Displacement (cm) | Non-Perpendicular Cross Wall Displacement (cm) |
|---|---|---|
| Surface Level (GL −2.4 m) | 0.49 | 0.89 |
| Final Excavation Level (GL −12.25 m) | 0.19 | 0.63 |
Disclaimer/Publisher’s Note: The statements, opinions and data contained in all publications are solely those of the individual author(s) and contributor(s) and not of MDPI and/or the editor(s). MDPI and/or the editor(s) disclaim responsibility for any injury to people or property resulting from any ideas, methods, instructions or products referred to in the content. |
© 2023 by the authors. Licensee MDPI, Basel, Switzerland. This article is an open access article distributed under the terms and conditions of the Creative Commons Attribution (CC BY) license (https://creativecommons.org/licenses/by/4.0/).
Share and Cite
Chiu, H.-W.; Hsu, C.-F.; Tsai, F.-H.; Chen, S.-L. Influence of Different Construction Methods on Lateral Displacement of Diaphragm Walls in Large-Scale Unsupported Deep Excavation. Buildings 2024, 14, 23. https://doi.org/10.3390/buildings14010023
Chiu H-W, Hsu C-F, Tsai F-H, Chen S-L. Influence of Different Construction Methods on Lateral Displacement of Diaphragm Walls in Large-Scale Unsupported Deep Excavation. Buildings. 2024; 14(1):23. https://doi.org/10.3390/buildings14010023
Chicago/Turabian StyleChiu, Hao-Wei, Chia-Feng Hsu, Fu-Huan Tsai, and Shong-Loong Chen. 2024. "Influence of Different Construction Methods on Lateral Displacement of Diaphragm Walls in Large-Scale Unsupported Deep Excavation" Buildings 14, no. 1: 23. https://doi.org/10.3390/buildings14010023