Article

Geopolymer Made from Kaolin, Diatomite, and Rice Husk Ash for Ceiling Thermal Insulation

by
Cinthya Alvarado
1,*,
Daniel Martínez-Cerna
2 and
Hernán Alvarado-Quintana
3
1
Carrera de Ingeniería Civil, Facultad de Ingeniería, Universidad Privada del Norte, Trujillo 13011, Peru
2
Laboratorio de Materiales Cerámicos, Universidad Nacional de Trujillo, Trujillo 13011, Peru
3
Departamento de Ingeniería de Materiales, Universidad Nacional de Trujillo, Trujillo 13011, Peru
*
Author to whom correspondence should be addressed.
Buildings 2024, 14(1), 112; https://doi.org/10.3390/buildings14010112
Submission received: 11 November 2023 / Revised: 15 December 2023 / Accepted: 28 December 2023 / Published: 31 December 2023
(This article belongs to the Special Issue Advances in Sustainable Building Materials)

Abstract

:
In this study, geopolymers made of metakaolin (MK), diatomite (D), and rice husk ash (RHA) were developed for ceiling thermal insulation in houses to provide protection against cold temperatures. The influence of the constituent mixing ratio and the temperature of curing on the heat conductivity and compressive strength of the geopolymer was investigated. Specimens were formed according to a 10-level mix design with three replicates and subjected to curing at 40 °C and 80 °C. Heat conductivity and compressive strength were determined in accordance with established standards. The simplex lattice method was used to obtain the response surfaces, contour plots, and tracking curves. The geopolymers under study displayed a reduction in heat conductivity and an increase in compressive strength when the curing temperature was raised. The optimal mixing ratio to achieve a balance between the compressive strength and thermal conductivity of the geopolymers investigated was 0.50 MK and 0.50 RHA. Diatomite’s thermal insulation contribution is neutralized when crystals from the geopolymer gel fill the pore volume. The mixture’s optimal results were achieved when cured at 80 °C, demonstrating a thermal conductivity of 0.10 W/m·K and a compressive strength of 5.37 MPa.

1. Introduction

Ordinary Portland cement (OPC) manufacturing now has significant energy and environmental costs. Due to population growth and globalization in recent decades [1], there has been an increase in the demand for housing, which has led to a rapid growth in the use of OPC as a binding material, reaching 6000 million metric tons by the year 2060 [2]. Unfortunately, the manufacture of OPC has become a distressing problem, not only because of the environmental pollution it generates [3] but also because of the enormous energy demand it incurs: 6.67 MJ per ton of clinker [4]. OPC has a high embodied energy, with carbon dioxide emissions ranging between 0.8 and 1.0 tons of CO2 emitted for each ton made [5]. The carbon dioxide emitted due to OPC manufacture accounts for about 7% of global anthropogenic CO2 [6]. As a result, finding environmentally friendly building materials has become a major priority for both human wellness and the conservation of the environment.
The importance of improving environmentally responsible processes, technologies, and materials has grown due to the need to control nonrenewable natural resource consumption and reduce energy demand. Geopolymers, which are inorganic polymers obtained at near-ambient temperatures [7], have attracted increasing interest because of their reduced CO2 emissions and lower energy consumption [8]. Geopolymers are more environmentally responsible substitutes for more standard petrochemical solutions as they are flame-retardant and insulating [9].
Geopolymers arise from aluminosilicate precursors and alkaline activators. Geopolymers are created when amorphous or semicrystalline aluminosilicates combine with alkali metal silicates or hydroxides under extremely basic conditions, resulting in the formation of a three-dimensional structure. The following steps make up the geopolymerization process: (a) alkaline treatment; (b) the depolymerization of silica–alumina species; (c) the formation of oligomers; (d) gel rearrangement; (e) polymerization; and (f) solidification [10].
Studies highlight the use of various aluminosilicate materials for geopolymerization due to their accessibility, affordability, and minimal heat activation requirements [11,12,13]. The use of solid wastes or industrial by-products as precursor materials results in reduced CO2 production, reduced energy usage, and lower costs [14,15]. Geopolymer technology is expected to continue gaining popularity due to its practical and economical solutions in various applications [16,17]. Its exceptional adhesive behavior, mechanical strength, high chemical and thermal stability, and long-term robustness are all remarkable [18,19]. Moreover, due to their outstanding properties, geopolymers can possibly be utilized as warm protection materials to save energy and minimize CO2 emissions [20]. However, some porous geopolymers are obtained with additions of aluminum powder, silicon, zinc, or hydrogen peroxide which are not so ecologically friendly, and to avoid the segregation of bubbles, they require the additional use of a foam stabilizer, making the product even more expensive.
Geopolymers are being researched for thermal insulation, with thermal conductivity (λ) being a key metric for evaluating insulation quality, with lower values indicating better insulation [21]. A geopolymer typically has a low λ, approximately 50% lower than Portland-cement-based materials [22]. The addition of holes or voids in the geopolymer matrix can significantly improve its thermal insulating properties.
As a result of the global warming scenario, the building industry faces a significant demand for thermal insulation materials [23,24]. Buildings require significant energy for air conditioning units; reducing energy usage is crucial for reducing thermal energy loss. Insulating walls and ceilings helps slow heat transfer, boosting energy efficiency. High-efficiency materials are needed to provide insulation, leading to less expensive air conditioning equipment. Heat insulation, often achieved with specialized substances, significantly improves building efficiency by reducing energy transfer [25].
Since organic thermal insulators, which are frequently employed in modern construction, are combustible materials, geopolymers have good potential for use as thermal insulating materials in particular circumstances. Furthermore, inorganic thermal insulators are known to require intricate high-temperature processing, which raises the cost of production [26,27]. A few toxic inorganic thermal insulators, like asbestos and fiberglass, are also no longer permitted to be produced [28]. Insulating materials produced using waste and renewable resources provide public benefits like temperature control, fire protection, and cost-effectiveness due to their use from various waste products and by-products [29].
This study investigates the impact of the mixing ratio and curing temperature of a geopolymer on its thermal insulation capacity and compressive strength. The reason for this is that the pores are not made by adding outside substances but rather through the cross-linking of acicular crystals that are generated during the geopolymerization process.

2. Material and Methods

2.1. Materials

The new geopolymeric materials investigated were made from kaolin, a clay from Huamachuco, Peru, which was calcined to obtain metakaolin (MK). Diatomite (D), obtained from the company Silicis Perú, located in the department of Piura, was also used. Rice husk ash (RHA), an industrial residue obtained from local brick kilns, was also used.
The chemical compositions of the raw materials were acquired via X-ray fluorescence. The surface areas and volume of pores for the three precursor materials were determined using a Micromeritics Gemini VII 2390 surface area and porosity analyzer. The crystalline phases discovered in the raw materials were detected utilizing a Rigaku Mini-flex 600 X-ray diffractometer.

2.2. Design of Experiment

The experiment was bifactorial in design, having as factors the mixing ratio of MK–RHA–D used to obtain the geopolymer and the curing temperature. The Scheffé mixing design of 10 levels with three replicates was used. Figure 1 displays a ternary diagram illustrating the mixing ratio of MK–RHA–D at 10 different levels. The mixing ratios are represented by red circles.
The simplex lattice method was utilized to determine the proportions of raw materials to be mixed as a unit fraction, as illustrated in Table 1. Thermal conductivity and compressive strength were the response variables. Therefore, the total number of specimens to be generated was 120, gained by multiplying 10 levels by 3 repetitions by 2 curing temperatures by 2 response variables.

2.3. Experimental Procedure

Figure 2 shows a graphical representation of the experimental methods used in this study. Once the raw materials were received, they were prepared. Kaolin was calcined at 600 °C for 2 h to transform it into metakaolin. The diatomite and rice husk ash were pulverized in a laboratory ball mill over the course of 2 h. Textural characterization of the three starting materials was then performed using a Micromeritics Gemini VII 2390 surface area and porosity analyzer.
According to the weight ratio established in the design presented in Table 1, the raw materials were weighed on a 0.01 g precision balance. As an alkaline activator, a 10 M sodium hydroxide solution was utilized. This activator was made from reagent-grade sodium hydroxide granules that were supplied in 1 kg bottles from the supplier, Dropaksa. The 10 M solution was produced by dissolving 400 g of solid NaOH in 1 L of distilled water and stirring the solution with a 2-inch magnetic stir bar over a heating element at 40 °C until the pH of the solution reached 12. Once there was sufficient alkaline activator solution, a predetermined amount was placed into a 20 L reservoir to which the solids (MK–RHA–D) were added according to the design. Segregation was prevented by vigorously swirling the mixture with an electric mixer for mortars at an L/S ratio of 0.6 by weight.
Then, the paste was gradually poured into removable stainless-steel molds to obtain a series of 4 cubes with 5 cm sides for the compressive strength test and 4 square prisms with side lengths of 15 cm and a thickness of 1 cm for the thermal conductivity measurement. The molds were placed on a Humboldt vibrating table during the casting process. To ensure complete filling, the molds were vibrated for around 15 min before they were smoothed with a stainless-steel spatula.
The resulting geopolymers were cured for 48 h at 40 °C (60 specimens) and 80 °C (60 specimens) in a natural convection-drying oven to expedite the geopolymerization operations of crystallization and crystal formation from the gels formed. After they were demolded, the specimens were left to cure for 12 days at room temperature, allowing the chemicals to react and strengthen.
Heat conductivity was evaluated using calibrated equipment made in compliance with ASTM C177 [30], according to the law of Fourier. This approach makes use of a guarded-hot-plate apparatus, a steady-state measurement method that measures a material’s thermal conductivity by monitoring the electrical power generated by a heated plate with directed heat conduction. A known-thermal-conductivity expanded polystyrene (EPS) plate was used to calibrate this measuring apparatus. The data were acquired using InstaCal 6.73 software, and a graph was plotted using TracerDAQ 2.3.4.0 software to confirm that the temperature measurements were made in a steady condition.
A Humbolt HM3000 hydraulic press was utilized to collect compressive strength data. According to ASTM C109 [31], 5 cm cubic specimens were tested at a load rate of 1 mm/min to assess their maximum strength at room temperature.
Following the completion of the experimental tests, the data were processed in accordance with the relevant standards. The impact of the various levels studied on the response variables in terms of thermal conductivity and compressive strength was then ascertained from building response surfaces and/or contour diagrams using the simplex lattice method. The statistical studies were conducted using Statistica 12.0 software.
Finally, the microstructure was established by discriminating between the porosities detected at various scales, utilizing a Tescan Vega 3 SEM.

3. Results

3.1. Characterisation of Used Materials

The textural characterization results for MK, RHA, and D were as follows: pore volumes of 0.0015, 0.0093, and 0.0021 cm3/g, respectively, and surface areas, determined by the BET method, of 21.4318, 44.4245, and 41.0959 m2/g, respectively.
The chemical compositions of RHA, D, and K are displayed in Table 2. According to the findings, the main components of the three raw materials are silica (SiO2) and alumina (Al2O3).
Figure 3 illustrates X-ray diffractograms of RHA, D, K, and MK. It illustrates the peaks that relate to the phases of the crystalline material. In the lower part of the diagrams, a large quantity of glassy phase was detected.

3.2. Thermal Conductivity According to Mixing Ratio

The bar chart in Figure 4 and the response surface from the cubic model in Figure 5 show the thermal conductivities as functions of the mix ratios and the curing temperatures of 40 °C and 80 °C, respectively. These revealed that the geopolymers’ thermal conductivities varied from 0.10 W/m·K (mix a4, cured at 80 °C) to 1.58 W/m·K (mix a2, cured at 40 °C) utilizing the guarded-hot-plate method. The geopolymer blends demonstrate the lowest thermal conductivities when they approach the MK vertex and maximum thermal conductivities when they approach the RHA vertex. Furthermore, it is evident that blends cured at 80 °C have lower thermal conductivities than blends cured at 40 degrees Celsius.
The contour map of the thermal conductivities according to mixture composition and curing temperatures of 40 °C and 80 °C is shown in Figure 6. In the plot, the little circles represent the mixtures studied.
In Figure 5 and Figure 6, the geopolymers shown with red and yellow colors present higher thermal conductivities, and those indicated with dark green colors present the lowest thermal conductivities, the latter having higher potential as thermal insulators. Therefore, the dark green sections have the optimal combinations that provide the best thermal insulation.
In general, it can be seen from the contour plots in Figure 6 that the ternary geopolymers near the a10 mixture provide the lowest thermal conductivities at the 40 °C curing temperature. Conversely, the binary geopolymers near blends a4 (0.10 W/m·K) and a5 (0.13 W/m·K) achieve the lowest thermal conductivities at the curing temperature of 80 °C, making them the finest thermal insulators. Because rich RHA geopolymers have the highest thermal conductivities at both curing temperatures, their potential as thermal insulators is limited.
Using the a10 mixture (composed of 0.33 MK, 0.33 RHA, and 0.33 D) as a reference, Figure 7 illustrates a plot of thermal conductivity tracking as a function of the value of each component in the mixture cured at 40 °C and at 80 °C.
Figure 7a shows how the thermal conductivity becomes nearly unaltered as the MK levels in the mix grow at a curing temperature of 40 °C. On the other hand, the addition of more RHA to the blend greatly enhances thermal conductivity, resulting in a geopolymer that is more thermally conductive than anticipated at the curing temperature. Then, as the proportion of D in the mix grows, the thermal conductivity becomes practically unchanged at 40 °C.
As observed in Figure 7b, adding more MK to the blend causes the thermal conductivity to drop, making the geopolymer more insulating, which is what we desire. However, when the proportion of RHA in the mix grows, the geopolymer becomes more thermally conductive, which is not ideal. Because of this, increasing the portion of D in the blend below 0.50 at the 80 °C cure temperature decreases the thermal conductivity, making the geopolymer more insulating, which is desired, while raising it over 0.50 at the same temperature enhances the thermal conductivity.

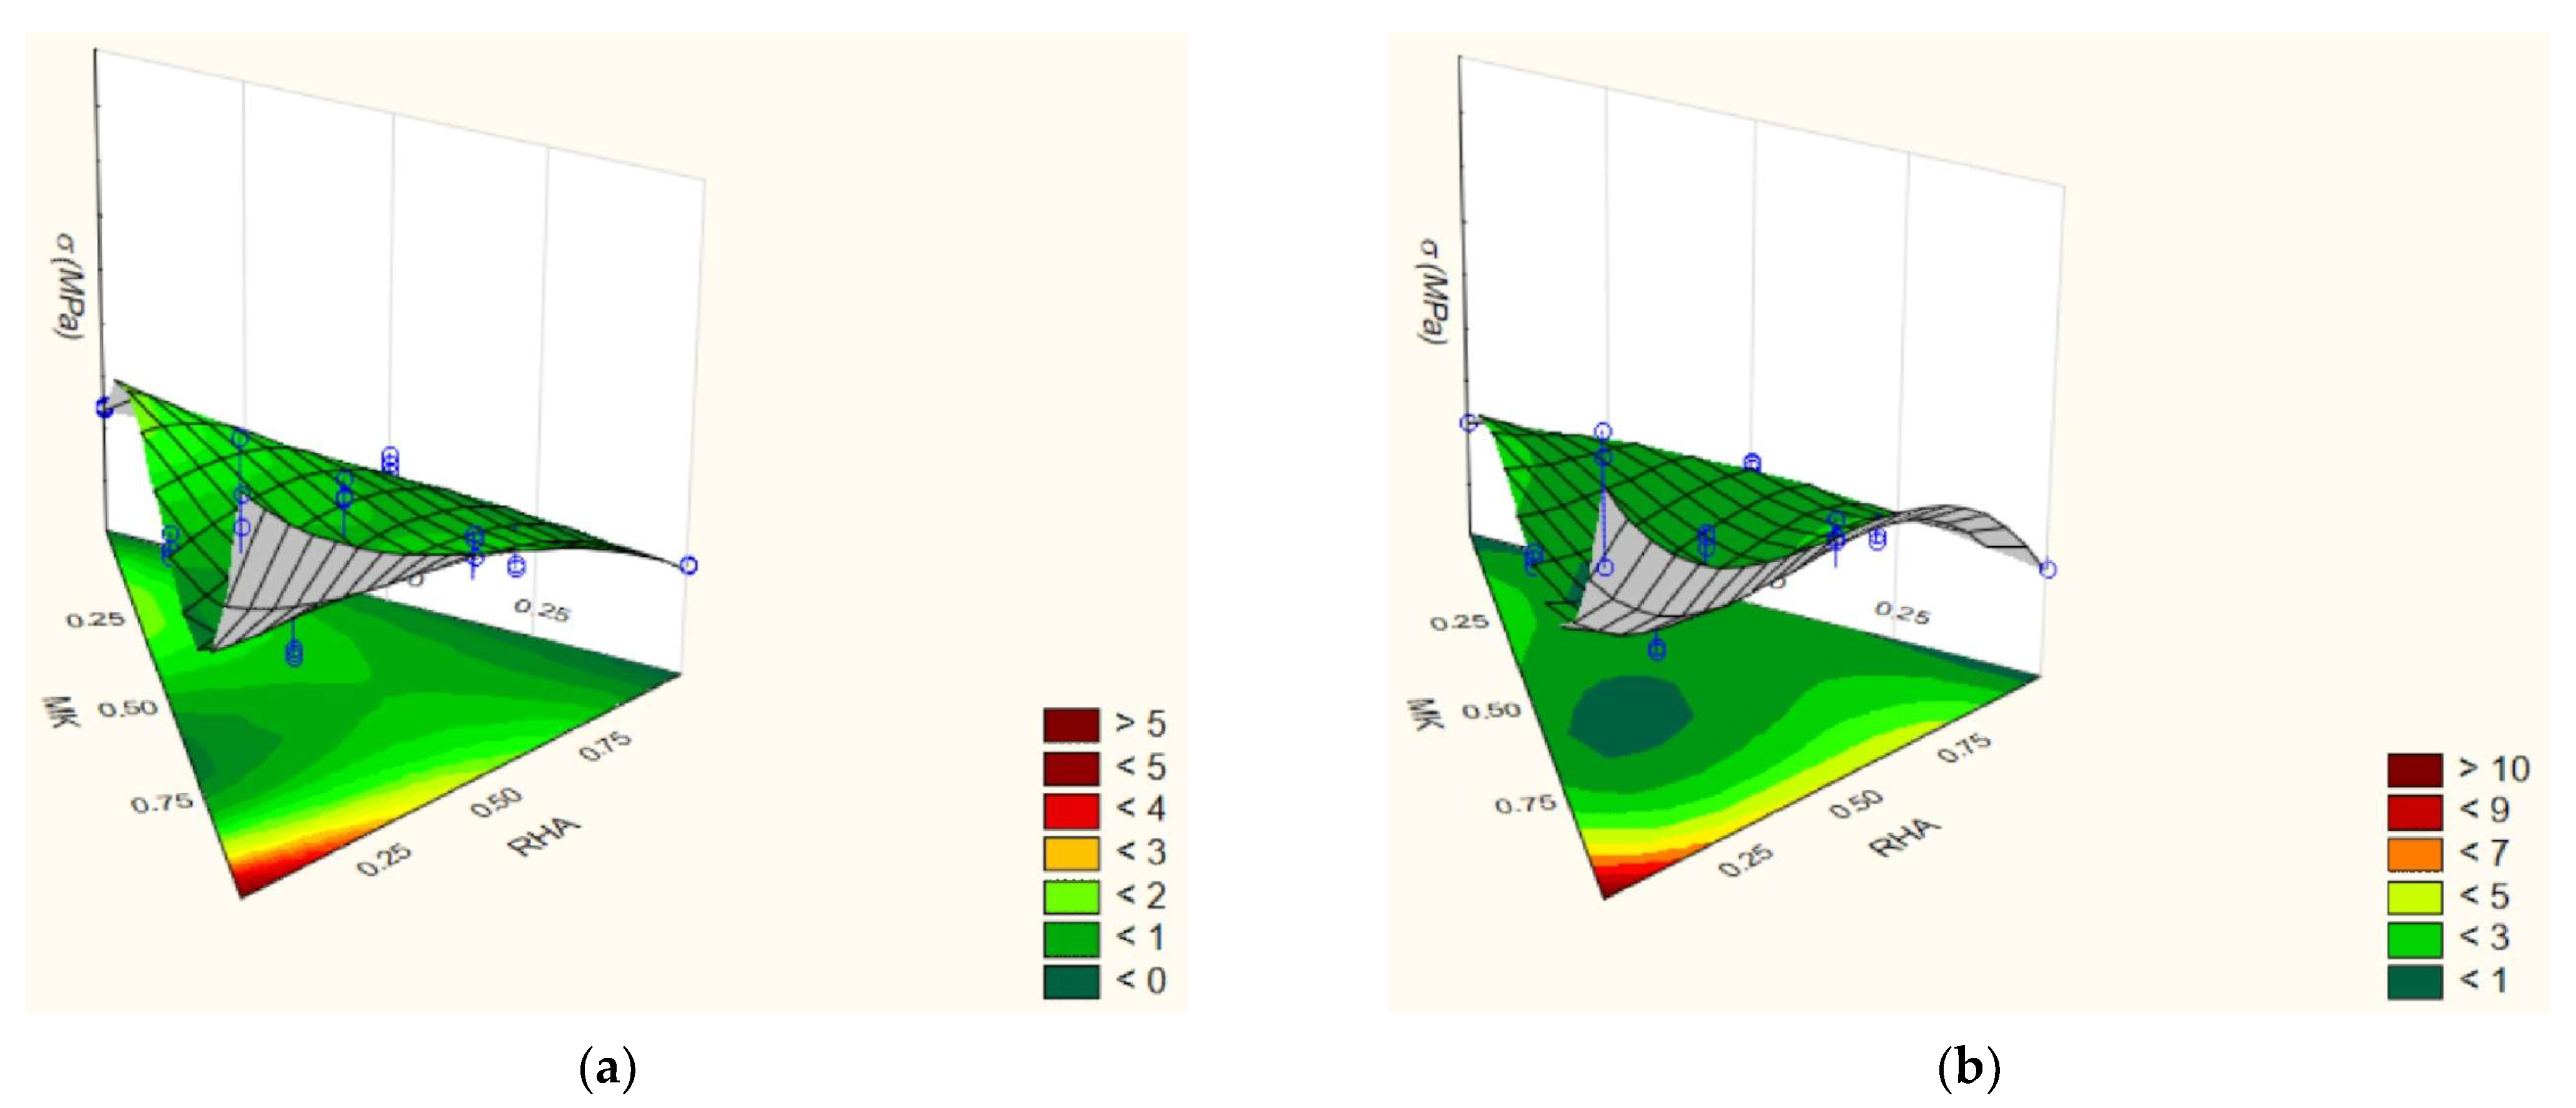
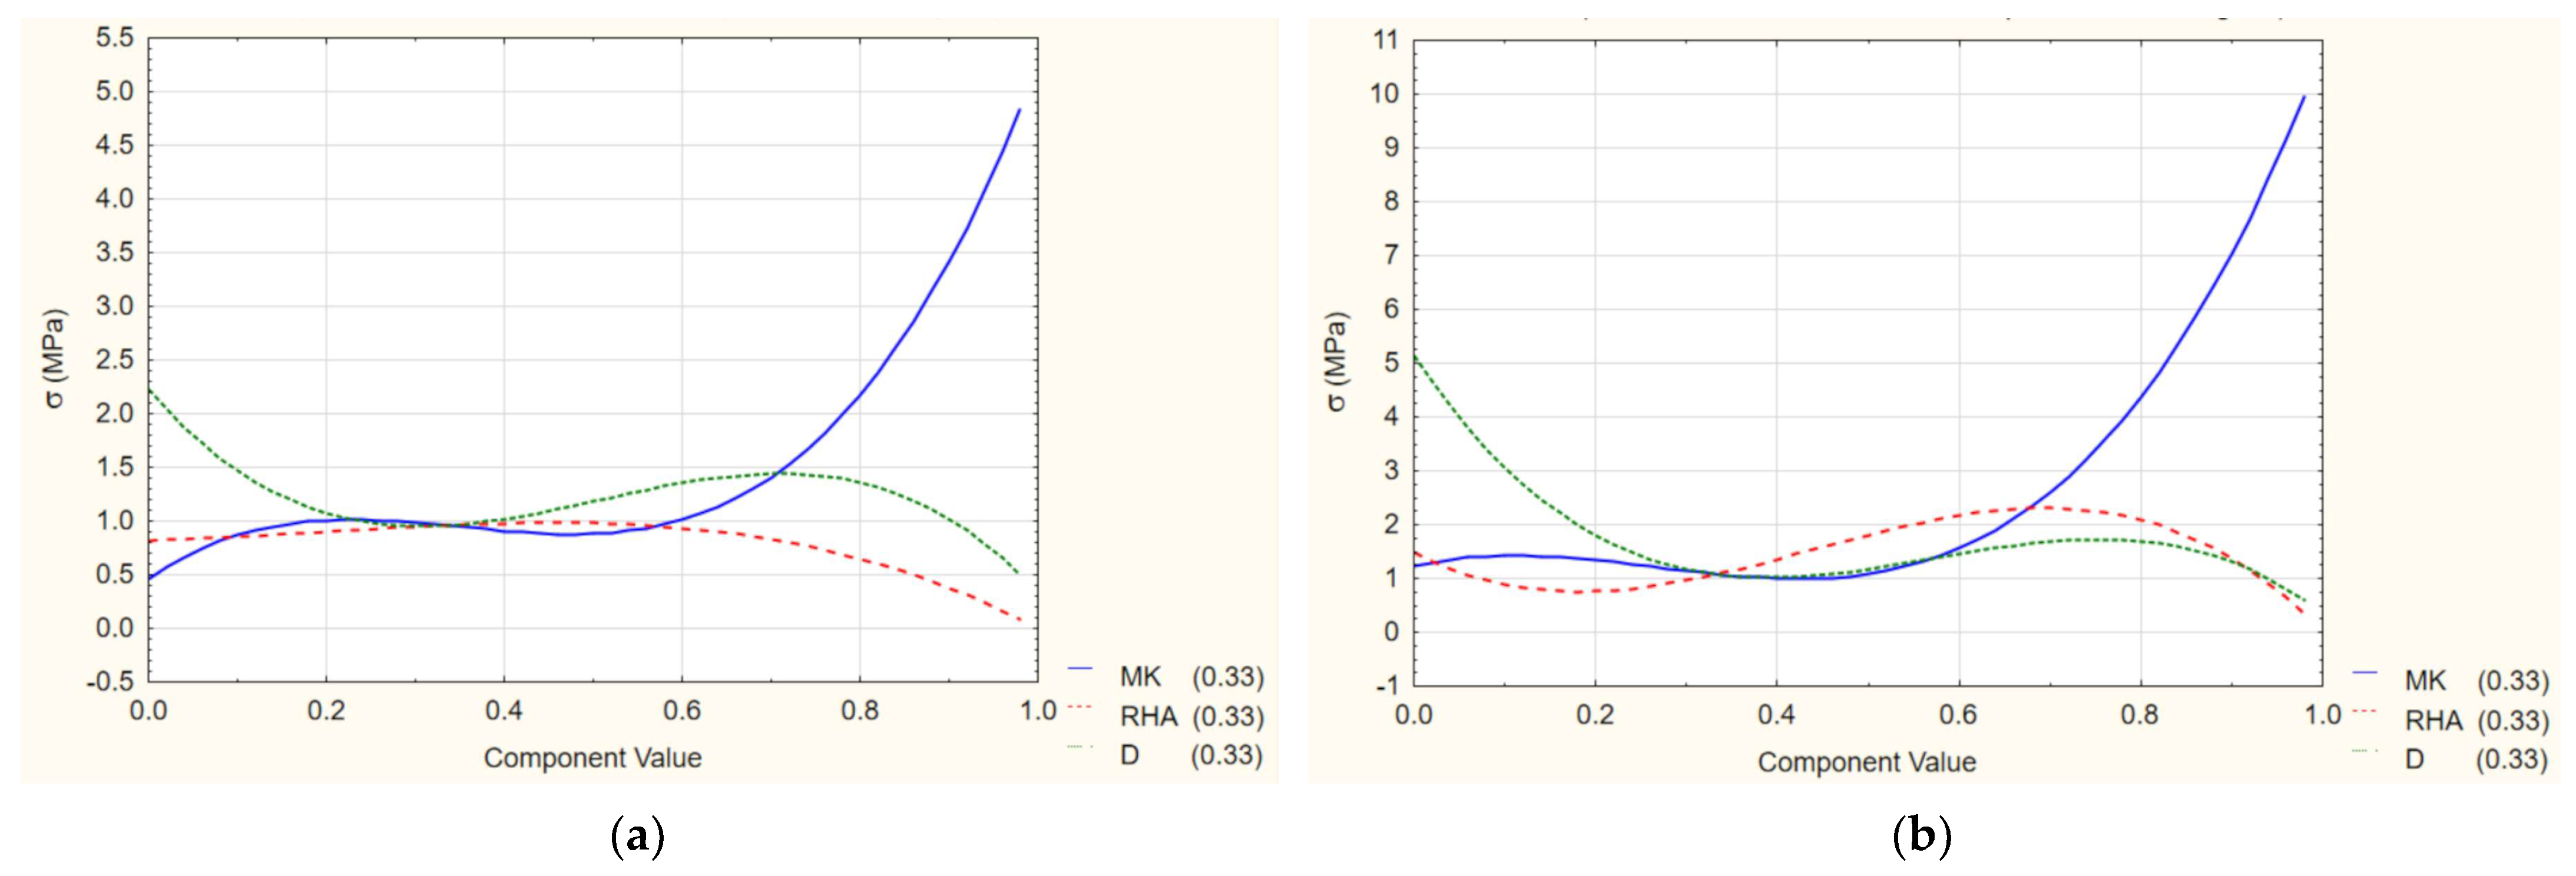
3.3. Compressive Strength According to Mixing Ratio

The bar chart in Figure 8 and the response surface from the cubic model in Figure 9 illustrate the compressive strengths as functions of the mix ratios and the curing temperatures of 40 °C and 80 °C, respectively.
It is observed that the compressive strengths achieved according to ASTM C109 [31] range from 0.10 MPa to 10.88 MPa, with geopolymer mixtures close to a1 (10.88 MPa) and a4 (5.37 MPa) having the highest values, respectively. Similarly, it is often recognized that blends treated at 80 °C have stronger compressive strengths than those cured at 40 °C.
Figure 10 illustrates the contour plot of the compressive strengths as functions of the mix proportions at the 40 °C and 80 °C curing temperatures computed using the cubic model. In the graph, little circles reflect the blends investigated.
Figure 9 and Figure 10 show the maximum compressive strengths in dark red and the lowest compressive values in dark green. The authors of [33] argue that insulating boards must have a minimum compressive strength of 1 MPa to be used as self-supporting materials. Therefore, the sections spanning from dark green to yellow and red would include the best mixes in terms of strength.
In general, we notice from the response surfaces in Figure 9 and the contour plots in Figure 10 that the MK-rich geopolymers exhibit the best compressive strengths among the three types of geopolymers examined. In contrast, the RHA-rich geopolymers offer the lowest strengths of the examined geopolymers. The D-rich geopolymers show intermediate compressive strengths compared to the two extremes listed above. It can also be shown in these figures that mixtures cured at 80 °C have higher compressive strengths than those treated at 40 °C.
Figure 11 illustrates compressive strength tracking plots as functions of the amount of the component in the mix, using as a reference the a10 mix (0.33 MK, 0.33 RHA, and 0.33 D) cured at 40 °C and at 80 °C.
Figure 11a shows how adding more MK to the mix increases the compressive strength of the geopolymer at the curing temperature of 40 °C. In contrast, the compressive strength tends to decrease somewhat when RHA and D grow, which is not what we desire.
Figure 11b demonstrates how the compressive strength of the mix increases as the MK content increases at the 80 °C curing temperature. Conversely, increasing RHA and D tends to slightly diminish the compressive strength.

3.4. SEM Microstructures

The SEM micrographs of the geopolymers of the ten MK–RHA–D mixes under investigation are displayed in Figure 12. The first two columns (a–j) represent specimens cured at 40 °C, while the last two columns (k–t) represent specimens cured at 80 °C.
Microstructures with a 40 °C curing temperature (a–j) show amorphous phases and grains without shape, while an 80 °C curing temperature (k–t) results in more crystallized phases and developed acicular crystallizations.
The microstructures of single-component specimens cured at 40 °C (a–c) and 80 °C (k–m) show acicular crystal growth in MK and D, while RHA exhibits crystal growth in rosettes.
Comparing the microstructures of specimens of two components cured at 40 °C (d–f) and 80 °C (n–p), if you raise the temperature of mixture a4 (MK–RHA), you can see the change from an amorphous rosette phase to well-defined acicular crystallization. In mixture a5 (MK–D), it can be seen how elongated crystals are formed from the MK and how it is covered with a network of crystalline fibers from the D as the curing temperature increases. In mixture a6 (D–RHA), it can be seen that when the curing temperature increases, the pores in the D material become filled with a crystalline phase in the shape of a rosette.
Comparing the microstructures of the three-component geopolymeric mixtures cured at 40 °C (g–i) and 80 °C (q–s), they differ in the predominant type of crystallization provided by the majority component. In the mixture, a7 predominates the crystallization of the MK gel, producing a geopolymer with a predominance of acicular crystals. In mixture A8, crystallization of the RHA gel predominates, producing a geopolymer with a predominance of rosette-shaped crystals. In mixture a9, crystallization of the D gel predominates, achieving a geopolymer with crystals in the form of fibers. Finally, in the a10 mixture with equal proportions of MK, RHA, and D, a geopolymer is obtained in equal amounts from the crystallization of the three forms.
An SEM analysis revealed that the mix ratio and curing temperature significantly impact the microstructure of geopolymers, highlighting the influence of K, RHA, and D.

4. Discussion

The production of two gels rich in Si and Al is the initial stage in the alkaline activation of aluminosilicates [34,35]. These gels, when dried, start to build elongated crystals that have a crosslinking effect to form nanopores, and this increase depends on the temperature of the curing process. On the other hand, the raw materials (rich in Si and Al in the form of oxides) are amorphized by chemical and/or mechanical activation to allow for geopolymerization. Crystalline silica (SiO2) and alumina (Al2O3) have thermal conductivities of 6–10 W/m·K and 18–30 W/m·K, respectively [36]. The unique arrangement of atoms becomes exceedingly chaotic when the crystal structure becomes amorphous, which reduces the thermal conductivity to 1.5 W/m·K. In addition, the increased pores and cavities will allow the amorphous structure to fill with air and/or insulating gas, drastically decreasing the heat-conducting capacity of the amorphous matrix. As a result, the solid matter structure is more essential than the gas-filled pores, which have just a modest impact.
According to the theory of heat transfer, it is known that heat transfers through the vibrating waves of the atomic lattice, known as phonons in ceramics. The transmission of phonons is negligible or nonexistent in pores in which there is vacuum or gas. Furthermore, the relationship between temperature and atom vibration amplitude is well established; if the lattice were continuous, the higher the temperature, the higher the vibration of the lattice. In addition, Fourier’s law tells us that the heat flow is a function of the temperature gradient.
A structure of cross-linked acicular microcrystals is created when the geopolymeric material cures, producing microcavities between them. Because of this, geopolymers will have more nanopores when cured at higher temperatures. More nanopores indicate more discontinuities, which reduces heat conductivity and offers a material that is more thermally insulating. According to Refs. [37,38], the reduction in effective thermal conductivity caused by phonon ballistic effects can be attributed to the effects of pore size and pore volume. Phonon scattering is dramatically improved by nanoscale pores. Larger strain fields are introduced into materials through fine holes. These random flaws produce strain fields which, by clustering and enhancing phonon scattering, greatly limit the cross-sectional area for heat transfer.
Dark green areas with lower thermal conductivity are the most insulating, as shown in Figure 5 and Figure 6, near binary mixtures a4 (0.50 MK, 0.50 RHA) and a5 (0.50 MK, 0.50 D).
Because of RHA’s high initial specific surface area, more acicular crystals grow, and their cross-linking produces more tiny pores, which impede heat transport via the phonon mechanism. Similarly, diatomite (D) has a high specific surface area but presents a high degree of natural porosity which, when crystals grow from the geopolymer gel, fills the pore volume, neutralizing its contribution to thermal insulation.
The best MK–RHA–D geopolymer mix discovered in this research had a heat conductivity of 0.10 W/m·K after 14 days of curing without the use of a foaming agent. This result was equal to or better than those obtained in Ref. [39] with a porous inorganic polymeric cement (a geopolymeric foam produced with additions of aluminum powder) that obtained a 0.15 W/m·K thermal conductivity; Ref. [40] obtained a geopolymeric foam based on heat-treated biomass residues (referred to as “biochar”) and silica fume as a blowing agent with a 0.13 W/m·K thermal conductivity; Ref. [41] obtained a geopolymer cellular concrete (GFC) with a partial replacement of blast furnace slag by fly ash to improve its strength and foaming agent, achieving thermal conductivities of the order of 0.15 to 0.48 W/m·K; Ref. [33] obtained a geopolymer cellular concrete (GFC) with additions of metakaolin (MK), fly ash (FA), and hydrogen peroxide (H2O2) as a foaming agent and surfactant, achieving thermal conductivities of the order of 0.07 to 0.12 W/m·K; and according to [33], a geopolymeric foam using biomass fly ash and aluminum powder as foaming agents has a heat conductivity of 0.08 W/m·K.
The outcomes achieved in this research are highly encouraging because geopolymer foams have lower heat conductivities (0.15–0.40 W/m·K) than solid geopolymers (0.60 W/m·K) [42]. In light of this, thermal conductivities similar to those of geopolymer foams were attained without a need for modifiers or pore-forming chemicals; this makes them more economical to create. In comparison with the thermal conductivities of common building materials, such as concrete (which ranges from 1.50 to 1.70 W/m·K), cement mortar (0.88 to 0.94 W/m·K), extruded solid brick (0.71 W/m·K), gypsum (0.81 W/m·K), and thermo-clay brick (0.39 W/m·K), the materials developed in this study (0.10 W/m·K) are promising [43,44].
The current method of increasing a material’s thermal conductivity involves adding a particular quantity of thermally conductive fillers to open up a channel for phonon transit [45]. Conversely, adding a specific amount of non-thermally conductive pores to a material is one technique to reduce its thermal conductivity by blocking phonon transmission.
The introduction of small pores into a homogenous geopolymer matrix leads to an increase in the volume of the pores and an improvement in insulation from heat. A homogenous matrix that facilitates the easy introduction and uniform dispersion of small pores is necessary for the fabrication of porous insulating materials [39].
The dark red zones represent increased compressive strength in Figure 9 and Figure 10, which depict how the strength contour plots fluctuate as a function of the mix ratio. These zones are positioned around the metakaolin vertex, but unlike those mentioned previously, the next in compressive strength are those near the 0.75 MK/0.25 RHA binary geopolymeric (orange zone). This is explained by the same factors as the previous ones, but it highlights that at high curing temperatures, more Si starts to dissolve not only from MK but also from RHA. According to Figure 3, out of the three materials studied, RHA (for having more amorphous phase) has the highest Si dissolution rates. This agrees with Ref. [46], as ash reactivity correlates with the amorphous phase fraction, which is also true with the MK amorphous phase. Likewise, the Si/Al ratio impacts the compressive strength of geopolymers [47].
The compressive strength results with a 14-day cure are consistent with the investigations in Refs. [22,41], which showed a link between compressive strength and pore density and structure. In this study, thermally insulating geopolymers with densities between 1180 and 1550 kg/m3 and minute pore sizes were generated without the use of pore-forming agents or modifiers, which is helpful for strength. The authors of [33] argue that for thermally insulating panels to be deployed as self-supporting materials, it is necessary to have at least a compressive strength of 1 MPa, which most of the combinations created in this study meet. Gas-forming techniques in geopolymer foams result in low densities (1000 kg/m3) and compressive strengths in the range of 1.7 to 2.4 MPa [33]; higher compressive strengths at a lower cost were obtained in the geopolymer blends studied in this work since no modifiers or pore-forming agents were required.
As discussed above, to achieve a compromise between compressive strength and thermal conductivity, the ideal geopolymer mix ratio is 0.50 MK and 0.50 RHA (a4). Such a mixture cured at a temperature of 80 °C produces the best results. This new material can be applied as a thermal insulator to the ceilings of houses in rural areas in cold regions, as shown in Figure 13.
As our research uses industrial waste that local brick kilns discard, it contributes to the circular economy, giving added value to such waste. Finally, the new thermal insulator developed in this research is a sustainable building material because it is manufactured using the geopolymerization process, which is a low-temperature consolidation process that is economical and environmentally friendly.

5. Conclusions

Experiments have demonstrated that the curing temperature and mixing ratio of geopolymers have an important effect on their compressive capacity and heat conductivity.
The MK–RHA–D geopolymer mixes display a reduction in heat conductivity and an increase in strength under compression when the curing temperature is raised.
On the one hand, the compressive strength rises when MK is added to the mixture, while the thermal conductivity somewhat drops. Conversely, as the mixture’s proportion of RHA is raised, the heat conductivity rises while the compressive strength marginally falls. Increasing the proportion of D has little effect on either of the two features. As a result, a mix ratio exists that strikes a balance (a trade-off) between strength in compression and heat conductivity.
The optimal mix ratio to achieve a compromise between compressive capacity and heat conductivity is 0.50 MK to 0.50 RHA (a4). Even though diatomite has a natural porosity, diatomite’s contribution to thermal insulation is neutralized when crystals form from the geopolymer gel and fill the pore volume.
Therefore, the mix a4 cured at 80 °C yielded optimal results, with a thermal conductivity of 0.10 W/m·K and a compressive strength of 5.37 MPa, and can be applied as a thermal insulator to the ceilings of houses in rural areas in cold regions.

Author Contributions

Conceptualization, C.A., D.M.-C. and H.A.-Q.; methodology, C.A., D.M.-C. and H.A.-Q.; software, C.A., D.M.-C. and H.A.-Q.; validation, C.A., D.M.-C. and H.A.-Q.; formal analysis, C.A., D.M.-C. and H.A.-Q.; investigation, C.A., D.M.-C. and H.A.-Q.; resources, C.A., D.M.-C. and H.A.-Q.; data curation, C.A., D.M.-C. and H.A.-Q.; writing—original draft preparation, C.A., D.M.-C. and H.A.-Q.; writing—review and editing, C.A., D.M.-C. and H.A.-Q.; visualization, C.A., D.M.-C. and H.A.-Q.; supervision, H.A.-Q. and C.A.; project administration, H.A.-Q. and C.A.; funding acquisition, H.A.-Q. and C.A. All authors have read and agreed to the published version of the manuscript.

Funding

This research received no external funding.

Data Availability Statement

The data described in this study are accessible from the corresponding author upon request. The data are not publicly available due to privacy.

Acknowledgments

We are grateful to the Universidad Privada del Norte and the Universidad Nacional de Trujillo for their logistical and technical cooperation with this project.

Conflicts of Interest

The authors declare no conflict of interest.

References

  1. Bilici, S.; Carvalheiras, J.; Labrincha, J.A.; Novais, R.M. Evaluation of the Nature and Concentration of the Surfactant on the Properties of Red Mud/Metakaolin Porous Geopolymers Foamed with Aluminium. Materials 2022, 15, 7486. [Google Scholar] [CrossRef] [PubMed]
  2. Niyazuddin, B.U. Mechanical and Durability Properties of Standard and High Strength Geopolymer Concrete Using Particle Packing Theory. Constr. Build. Mater. 2023, 400, 132722. [Google Scholar] [CrossRef]
  3. Lei, J.; Kumar, D.; Goh, H.S.; Yang, E.H. Synthesizing Alkali-Activated Binder from Locally Available Sedimentary Rock as Precursors. Cem. Concr. Compos. 2023, 143, 105263. [Google Scholar] [CrossRef]
  4. Abdellatief, M.; Elrahman, M.A.; Abadel, A.A.; Wasim, M.; Tahwia, A. Ultra-High Performance Concrete versus Ultra-High Performance Geopolymer Concrete: Mechanical Performance, Microstructure, and Ecological Assessment. J. Build. Eng. 2023, 79, 107835. [Google Scholar] [CrossRef]
  5. Chen, F.; Zhao, J.; Zhang, B.; Feng, Y.; Chen, C.; Lu, Z.; Yang, J.; Xie, J. Physical, Mechanical and Microstructural Properties of Ultra-Lightweight High-Strength Geopolymeric Composites. Case Stud. Constr. Mater. 2023, 19, e02446. [Google Scholar] [CrossRef]
  6. Atienza, E.M.; De Jesus, R.M.; Ongpeng, J.M.C. Development of Foam Fly Ash Geopolymer with Recycled High-Density Polyethylene (HDPE) Plastics. Polymers 2023, 15, 2413. [Google Scholar] [CrossRef] [PubMed]
  7. Borçato, A.G.; Thiesen, M.; Medeiros-Junior, R.A. Mechanical Properties of Metakaolin-Based Geopolymers Modified with Different Contents of Quarry Dust Waste. Constr. Build. Mater. 2023, 400, 132854. [Google Scholar] [CrossRef]
  8. Shee-Ween, O.; Cheng-Yong, H.; Yun-Ming, L.; Mustafa Al Bakri Abdullah, M.; Li-Ngee, H.; Pakawanit, P.; Suhaimi Khalid, M.; Hazim Bin Wan Muhammad, W.; Wan-En, O.; Yong-Jie, H.; et al. Green Development of Fly Ash Geopolymer via Casting and Pressing Approaches: Strength, Morphology, Efflorescence and Ecological Properties. Constr. Build. Mater. 2023, 398, 132446. [Google Scholar] [CrossRef]
  9. Gómez-Casero, M.A.; De Dios-Arana, C.; Bueno-Rodríguez, J.S.; Pérez-Villarejo, L.; Eliche-Quesada, D. Physical, Mechanical and Thermal Properties of Metakaolin-Fly Ash Geopolymers. Sustain. Chem. Pharm. 2022, 26, 100620. [Google Scholar] [CrossRef]
  10. Coelho, T.P.P.; Bezerra, B.P.; Verza, J.R.; Luz, A.P.; Morelli, M.R. Physico-Mechanical Properties of Metakaolin and Diatomite-Based Geopolymers. Mater. Lett. 2023, 349, 134784. [Google Scholar] [CrossRef]
  11. Nana, A.; Singla, R.; Alomayri, T.; Epey, N.; Kassem, N.N.; Sakue, E.N.; Kaze, R.C.; Kamseu, E.; Kumar, S.; Leonelli, C. Design and Characterization of Cameroonian Pegmatite-Calcined Clay Binary Mortars via Geopolymerization. J. Build. Eng. 2023, 76, 107078. [Google Scholar] [CrossRef]
  12. Bayer Öztürk, Z.; Çam, T. Performance of Eco-Friendly Fly Ash-Based Geopolymer Mortars with Stone-Cutting Waste. Mater. Chem. Phys. 2023, 307, 128112. [Google Scholar] [CrossRef]
  13. Hamdi, O.M.; Ahmed-Chaouch, A.; Saïdani, M.; Alioui, H. Use of the Algerian Natural Pozzolan for the Production of a Geopolymer as a Complete Cement Replacement. Constr. Build. Mater. 2023, 400, 132723. [Google Scholar] [CrossRef]
  14. Witzke, F.B.; Beltrame, N.A.M.; Angulski da Luz, C.; Medeiros-Junior, R.A. Abrasion Resistance of Metakaolin-Based Geopolymers through Accelerated Testing and Natural Wear. Wear 2023, 530–531, 204996. [Google Scholar] [CrossRef]
  15. Liang, G.; Yao, W.; Wei, Y. A Green Ultra-High Performance Geopolymer Concrete Containing Recycled Fine Aggregate: Mechanical Properties, Freeze-Thaw Resistance and Microstructure. Sci. Total Environ. 2023, 895, 165090. [Google Scholar] [CrossRef] [PubMed]
  16. Grance, E.G.O.; Paiva, M.D.D.M.; Toledo Filho, R.D.; Souza, F.G., Jr. Geopolymer: A Review of Structure, Applications and Properties of Fiber Reinforced Composites. Res. Dev. Mater. Sci. 2018, 7, 1–8. [Google Scholar] [CrossRef]
  17. Alvarado, C.; Cavero, M.S.; Alvarado-Quintana, H. Geopolymeric Filter Based on Metakaolin and Rice Husk Ash for Removal of Chromium Ions. In Proceedings of the LACCEI International Multi-Conference for Engineering, Education and Technology, Boca Raton, FL, USA, 18–22 July 2022; Latin American and Caribbean Consortium of Engineering Institutions: Boca Raton, FL, USA, 2022. [Google Scholar]
  18. Novais, R.M.; Pullar, R.C.; Labrincha, J.A. Geopolymer Foams: An Overview of Recent Advancements. Prog. Mater. Sci. 2020, 109, 100621. [Google Scholar] [CrossRef]
  19. Elemam, W.E.; Tahwia, A.M.; Abdellatief, M.; Youssf, O.; Kandil, M.A. Durability, Microstructure, and Optimization of High-Strength Geopolymer Concrete Incorporating Construction and Demolition Waste. Sustainability 2023, 15, 15832. [Google Scholar] [CrossRef]
  20. Rao, P.R.; Momayez, M.; Runge, K.A.; Muralidharan, K. Recent Developments in Thermally Insulating Materials Based on Geopolymers—A Review Article. Min. Metall. Explor. 2020, 37, 995–1014. [Google Scholar] [CrossRef]
  21. Fongang, R.T.T.; Pemndje, J.; Lemougna, P.N.; Melo, U.C.; Nanseu, C.P.; Nait-Ali, B.; Kamseu, E.; Leonelli, C. Cleaner Production of the Lightweight Insulating Composites: Microstructure, Pore Network and Thermal Conductivity. Energy Build. 2015, 107, 113–122. [Google Scholar] [CrossRef]
  22. Jaya, N.A.; Yun-Ming, L.; Cheng-Yong, H.; Abdullah, M.M.A.B.; Hussin, K. Correlation between Pore Structure, Compressive Strength and Thermal Conductivity of Porous Metakaolin Geopolymer. Constr. Build. Mater. 2020, 247, 118641. [Google Scholar] [CrossRef]
  23. Andrić, I.; Pina, A.; Ferrão, P.; Fournier, J.; Lacarrière, B.; Le Corre, O. The Impact of Climate Change on Building Heat Demand in Different Climate Types. Energy Build. 2017, 149, 225–234. [Google Scholar] [CrossRef]
  24. Yang, C.; You, J.-J.; Huang, Y.-W.; Ji, X.-M.; Song, Q.-Y.; Liu, Q. Low-Carbon Enhancement of Fly Ash Geopolymer Concrete: Lateral Deformation, Microstructure Evolution and Environmental Impact. J. Clean. Prod. 2023, 422, 138610. [Google Scholar] [CrossRef]
  25. Majdoubi, H.; Haddaji, Y.; Bourzik, O.; Nadi, M.; Ziraoui, J.; Alomayri, T.S.; Oumam, M.; Manoun, B.; Alami, J.; Tamraoui, Y.; et al. Enhancing Thermal Insulation with Phosphate Washing Sludge Waste as an Inorganic Foaming Agent in Porous Acid-Based Geopolymers: Formulation and Processing Optimization. Constr. Build. Mater. 2023, 407, 133486. [Google Scholar] [CrossRef]
  26. Li, X.; Bai, C.; Qiao, Y.; Wang, X.; Yang, K.; Colombo, P. Preparation, Properties and Applications of Fly Ash-Based Porous Geopolymers: A Review. J. Clean. Prod. 2022, 359, 132043. [Google Scholar] [CrossRef]
  27. Li, H.; Zou, S.; Liu, T.; Wang, S.; Zou, J.; Zhang, X.; Liu, L.; Bai, C.; Zhang, G. Research on a Composite Biomass Insulation Material with Geopolymers as Binders and Forestry Waste as Fillers. J. Therm. Sci. 2022, 31, 590–605. [Google Scholar] [CrossRef]
  28. Ramada Rodilla, J.M.; Calvo Cerrada, B.; Serra Pujadas, C.; Delclos, G.L.; Benavides, F.G. Fiber Burden and Asbestos-Related Diseases: An Umbrella Review. Gac. Sanit. 2022, 36, 173–183. [Google Scholar] [CrossRef]
  29. Boros, A.; Korim, T. Development of Geopolymer Foams for Multifunctional Applications. Crystals 2022, 12, 386. [Google Scholar] [CrossRef]
  30. ASTM C177; Standard Test Method for Steady-State Heat Flux Measurements and Thermal Transmission Properties by Means of the Guarded-Hot-Plate Apparatus. ASTM International: West Conshohocken, PA, USA, 2019.
  31. ASTM C109/C109M-21; Standard Test Method for Compressive Strength of Hydraulic Cement Mortars (Using 2-in. or [50-mm] Cube Specimens). ASTM International: West Conshohocken, PA, USA, 2021.
  32. Alvarado, C.; Alvarado-Quintana, H.; Siche, R. Ceramic Thermal Insulator Based on Diatomite Obtained by Starch Consolidation Casting. Materials 2023, 16, 4028. [Google Scholar] [CrossRef]
  33. Samson, G.; Cyr, M. Porous Structure Optimisation of Flash-Calcined Metakaolin/Fly Ash Geopolymer Foam Concrete. Eur. J. Environ. Civil Eng. 2018, 22, 1482–1498. [Google Scholar] [CrossRef]
  34. Duxson, P.; Lukey, G.C.; Van Deventer, J.S.J. Evolution of Gel Structure during Thermal Processing of Na-Geopolymer Gels. Langmuir 2006, 22, 8750–8757. [Google Scholar] [CrossRef] [PubMed]
  35. Ma, Z.; Wang, W.; Li, J.; Gao, J.; Lu, G.; Song, H.; Wu, H.; Guo, Y. Long-Term Dissolution Behavior of Amorphous Aluminosilicate in Sodium Hydroxide Solution for Geopolymer Synthesis Using Circulating Fluidized Bed Combustion Fly Ash. Constr. Build. Mater. 2023, 394, 132143. [Google Scholar] [CrossRef]
  36. Kamseu, E.; Ceron, B.; Tobias, H.; Leonelli, E.; Bignozzi, M.C.; Muscio, A.; Libbra, A. Insulating Behavior of Metakaolin-Based Geopolymer Materials Assess with Heat Flux Meter and Laser Flash Techniques. J. Therm. Anal. Calorim. 2012, 108, 1189–1199. [Google Scholar] [CrossRef]
  37. Alvarez, F.X.; Jou, D.; Sellitto, A. Pore-Size Dependence of the Thermal Conductivity of Porous Silicon: A Phonon Hydrodynamic Approach. Appl. Phys. Lett. 2010, 97, 033103. [Google Scholar] [CrossRef]
  38. Chen, J.; Zhang, X. Pore-Size Dependence of the Heat Conduction in Porous Silicon and Phonon Spectral Energy Density Analysis. Phys. Lett. Sect. A Gen. At. Solid State Phys. 2020, 384, 126503. [Google Scholar] [CrossRef]
  39. Kamseu, E.; Nait-Ali, B.; Bignozzi, M.C.; Leonelli, C.; Rossignol, S.; Smith, D.S. Bulk Composition and Microstructure Dependence of Effective Thermal Conductivity of Porous Inorganic Polymer Cements. J. Eur. Ceram. Soc. 2012, 32, 1593–1603. [Google Scholar] [CrossRef]
  40. Farges, R.; Gharzouni, A.; Ravier, B.; Jeulin, P.; Rossignol, S. Insulating Foams and Dense Geopolymers from Biochar By-Products. J. Ceram. Sci. Technol. 2018, 9, 193–200. [Google Scholar] [CrossRef]
  41. Zhang, Z.; Provis, J.L.; Reid, A.; Wang, H. Mechanical, Thermal Insulation, Thermal Resistance and Acoustic Absorption Properties of Geopolymer Foam Concrete. Cem. Concr. Compos. 2015, 62, 97–105. [Google Scholar] [CrossRef]
  42. Yan, S.; Ren, X.; Wang, W.; He, C.; Xing, P. Preparation of Eco-Friendly Porous Ceramic with Low Thermal Conductivity by High-Temperature Treatment of Foamed Solid Waste Based Geopolymer with Cenospheres. Constr. Build. Mater. 2023, 398, 131190. [Google Scholar] [CrossRef]
  43. Hung Anh, L.D.; Pásztory, Z. An Overview of Factors Influencing Thermal Conductivity of Building Insulation Materials. J. Build. Eng. 2021, 44, 102604. [Google Scholar] [CrossRef]
  44. Asadi, I.; Shafigh, P.; Hassan, Z.F.B.A.; Mahyuddin, N.B. Thermal Conductivity of Concrete—A Review. J. Build. Eng. 2018, 20, 81–93. [Google Scholar] [CrossRef]
  45. Zhu, Y.; Qian, Y.; Zhang, L.; Bai, B.; Wang, X.; Li, J.; Bi, S.; Kong, L.; Liu, W.; Zhang, L. Enhanced Thermal Conductivity of Geopolymer Nanocomposites by Incorporating Interface Engineered Carbon Nanotubes. Compos. Commun. 2021, 24, 100691. [Google Scholar] [CrossRef]
  46. Lemougna, P.N.; Chinje Melo, U.F.; Delplancke, M.P.; Rahier, H. Influence of the Chemical and Mineralogical Composition on the Reactivity of Volcanic Ashes during Alkali Activation. Ceram. Int. 2014, 40, 811–820. [Google Scholar] [CrossRef]
  47. Duxson, P.; Provis, J.L.; Lukey, G.C.; Mallicoat, S.W.; Kriven, W.M.; Van Deventer, J.S.J. Understanding the Relationship between Geopolymer Composition, Microstructure and Mechanical Properties. Colloids Surf. A Physicochem. Eng. Asp. 2005, 269, 47–58. [Google Scholar] [CrossRef]
Figure 1. Ternary diagram showing the location of the 10 studied levels.
Buildings 14 00112 g001
Figure 2. The main stages of the experimental procedure.
Buildings 14 00112 g002
Figure 3. X-ray diffractograms of (a) RHA, (b) D, (c) K, and (d) MK.
Buildings 14 00112 g003
Figure 4. Bar graph of average thermal conductivities as functions of mixing ratio and curing temperatures of 40 °C and 80 °C.
Buildings 14 00112 g004
Figure 5. Response surfaces of thermal conductivities according to mixing ratios and curing temperatures of (a) 40 °C and (b) 80 °C. The circles shown are the same as those defined in Figure 1.
Buildings 14 00112 g005
Figure 6. Contour plots of thermal conductivities as a function of mixing ratios and curing temperatures of (a) 40 °C and (b) 80 °C. The circles shown are the same as those defined in Figure 1.
Buildings 14 00112 g006
Figure 7. Monitoring of the thermal conductivity with the reference mixture in a10 depends on the mixture ratio and curing temperatures of (a) 40 °C and (b) 80 °C.
Buildings 14 00112 g007
Figure 8. Bar graph of the average compressive strengths as functions of the mixing ratio and curing temperatures of 40 °C and 80 °C.
Buildings 14 00112 g008
Figure 9. Response surface of compressive strengths as functions of mixing ratios and curing temperatures of (a) 40 °C and (b) 80 °C. The circles shown are the same as those defined in Figure 1.
Buildings 14 00112 g009
Figure 10. Contour plots of compressive strengths according to mixing ratios and curing temperatures of (a) 40 °C and (b) 80 °C. The circles shown are the same as those defined in Figure 1.
Buildings 14 00112 g010
Figure 11. Compressive strength tracking as a function of mixing ratio using as a reference the mix a10 at curing temperatures of (a) 40 °C and (b) 80 °C.
Buildings 14 00112 g011
Figure 12. SEM microstructures of the geopolymers studied at 5000×. Specimens cured at 40 °C: (a) a1; (b) a2; (c) a3; (d) a4; (e) a5; (f) a6; (g) a7; (h) a8; (i) a9; (j) a10. Specimens cured at 80 °C: (k) a1; (l) a2; (m) a3; (n) a4; (o) a5; (p) a6; (q) a7; (r) a8; (s) a9; (t) a10.
Buildings 14 00112 g012aBuildings 14 00112 g012b
Figure 13. Application of the geopolymeric thermal insulators.
Buildings 14 00112 g013
Table 1. Mix design represented as a raw material unit fraction.
Mix RatioMKRHAD
a11.000.000.00
a20.001.000.00
a30.000.001.00
a40.500.500.00
a50.500.000.50
a60.000.500.50
a70.670.170.17
a80.170.670.17
a90.170.170.67
a100.330.330.33
Table 2. X-ray fluorescence analysis of RHA, D, and K.
Chemical Compound wt. (%)SiO2Al2O3CaOSO3Fe2O3MgONa2OK2OP2O5ClTiO2SrOV2O5MnOZrO2LOI
RHA61.136.890.621.191.440.530.371.720.370.150.280.010.000.080.0025.2
D 159.9610.694.994.054.022.862.011.451.211.060.330.090.040.000.007.20
K56.4530.730.070.040.840.400.082.270.060.001.290.010.000.000.057.70
1 The diatomite analysis was taken from [32].
Disclaimer/Publisher’s Note: The statements, opinions and data contained in all publications are solely those of the individual author(s) and contributor(s) and not of MDPI and/or the editor(s). MDPI and/or the editor(s) disclaim responsibility for any injury to people or property resulting from any ideas, methods, instructions or products referred to in the content.

