Article

Mechanical Properties and Microstructure of Highly Flowable Geopolymer Composites with Low-Content Polyvinyl Alcohol Fiber

1
College of Civil Engineering and Architecture, Zhejiang University, Hangzhou 310058, China
2
College of Civil Engineering, Tongji University, Shanghai 200092, China
*
Author to whom correspondence should be addressed.
Buildings 2024, 14(2), 449; https://doi.org/10.3390/buildings14020449
Submission received: 14 December 2023 / Revised: 21 January 2024 / Accepted: 29 January 2024 / Published: 6 February 2024
(This article belongs to the Special Issue Advances in Sustainable Building Materials)

Abstract

:
Geopolymer enhances mechanical properties with polyvinyl alcohol (PVA) fibers, but there has been limited research exploring low PVA fiber dosages for mechanical properties in 3D printing or shotcrete. This study experimentally investigated slag and fly ash-based geopolymer mixtures reinforced with 0.1%, 0.15%, and 0.2% PVA fiber by volume as well as a control group without PVA fibers. These mixtures were prepared using fly ash, quartz sand, slag powder, silica fume, and an aqueous sodium silicate solution as the alkali activator, with the addition of PVA fiber to enhance composite toughness. The mechanical properties of the composites, encompassing dog-bone tensile properties, cubic compressive strength, bending and post-bending compressive strength, and prism compressive properties, were evaluated. Significantly, specimens with 0.15% PVA fibers exhibited optimal performance, revealing a notable 28.57% increase in tensile stress, a 36.45% surge in prism compressive strain, and a 47.59% rise in tensile strain compared to fiber-free specimens. Furthermore, environmental scanning electron microscopy observations were employed to scrutinize the microscopic mechanisms of composites incorporating PVA fibers, slag, and fly ash. In comparison to fiber-free specimens, prism compressive specimens with 0.15% PVA fibers demonstrated a 27.17% increase in post-cracking loading capacity, a 44.07% increase in post-cracking ductility, a 50.00% increase in peak strain energy, and a 76.36% increase in strain energy ratio.

1. Introduction

Cement is a widely used construction material [1]. In recent years, many researchers have explored alternative materials to traditional cement for environmentally friendly purposes [2]. Among these alternatives, geopolymer is a novel alkali-activated inorganic cementitious material [3]. Geopolymer stands out as an appealing option due to its utilization of raw materials from the industry, resulting in minimal energy consumption, low CO2 emissions, and the recycling of industrial waste [4,5,6]. The incorporation of fly ash, mineral waste, and construction waste into geopolymer offers significant advantages, enhancing mechanical properties, ensuring volume stability, providing resistance to chloride ion penetration, improving freeze–thaw resistance, increasing erosion resistance, and imparting high-temperature resistance [7,8,9,10,11,12].
3D printing technology and shotcrete technology for buildings represent advanced construction techniques aligned with the demands of the rapidly urbanizing world. Compared to conventional construction methods, both 3D printing and shotcrete technologies offer distinct advantages, including significant savings in labor costs, enhanced construction efficiency, and increased affordability for nonstandard solutions [13,14,15]. Geopolymer, an eco-friendly material boasting numerous outstanding properties, is extensively employed in both 3D printing and shotcrete technologies. Xia et al. [16] fabricated geopolymer with a composition of 50% slag powder and 50% fly ash powder by weight to form a powder-based 3D printing mixture. The achieved 7-day compressive strength of up to 25 MPa meets the requirements for most construction applications. McAlorum et al. [17] showcased significant progress in civil engineering applications by innovatively employing robotic control in the spray coating of geopolymers. Their work resulted in a compressive strength of 20 MPa and a bond strength of 0.5 MPa of the concrete substrate.
Nevertheless, the utilization of geopolymer in both 3D printing and shotcrete technologies encounters various challenges and limitations. To address issues such as costly raw materials and the brittleness of pure metakaolin-based geopolymer, researchers have explored alternatives using slag and fly ash-based geopolymers [13,15]. While the early-age strength and fast-hardening characteristics of slag and fly ash-based geopolymer have shown promise in experimental applications for 3D printing and shotcrete technologies [18,19], the material components still require optimization to enhance their mechanical properties. Concerning slag and fly ash-based geopolymer, the tightly arranged molecular chains of the geopolymer result in reduced porosity, potentially leading to low impact strength, poor toughness, and susceptibility to cracking [20,21]. Various types of fiber reinforcement, including polypropylene (PP) fiber, carbon fiber, basalt fiber, steel fiber, and polyvinyl alcohol (PVA) fiber, have been studied to improve the material’s mechanical properties and toughness [22,23,24,25]. Natali et al. [26] systematically studied the effects of carbon fiber, glass fiber, PVA fiber, and polyvinyl chloride (PVC) fiber on improving the toughness of geopolymers. Cai et al. [27] revealed the toughening mechanisms, mechanical properties, freeze–thaw cycle resistance, and thermal decomposition properties of PVA fiber-reinforced geopolymer.
For 3D-printed slag and fly ash-based geopolymer, the fiber-incorporated material exhibits enhanced mechanical properties and toughness [28]. Nematollahi et al. [29] examined the impact of PVA fiber, PP fiber, and polyphenylene benzobisoxazole (PBO) fiber on the flexural strength of extrusion-based 3D-printed geopolymer, discovering a significant increase compared to fiber-free specimens. In the case of sprayed slag and fly ash-based geopolymer, Li [30] explored the physical and mechanical properties of a novel fiber-reinforced sprayed geopolymer material composed of slag powder, fly ash, fine sand, and alkali activator. The resulting specimens exhibited surface crack widths ranging from 30 to 60 μm during four-point bending tests. Among all types of fiber reinforcement, PVA fibers are extensively used due to their high strength, durability, and toughness [31,32,33]. The study by Ohno et al. [31] showed that PVA fiber in slag and fly ash-based geopolymer can exhibit a strain-hardening stage. Zhang et al. [32] discovered that PVA fiber improves the impact toughness of fly ash-based geopolymer materials. Bong et al. [33] found that PVA fiber with a length of 8 mm had a positive influence on the compressive strength of 3D-printed slag and fly ash-based geopolymer.
In addition to evaluating the material properties of slag and fly ash-based geopolymer, it is crucial to assess their workability for both 3D printing and shotcrete technologies, considering factors such as extrudability, rheology, free-forming ability, and thixotropic properties [34,35]. While the literature recommends a PVA fiber dosage ranging from 0.2% to 2% [15,24] to enhance geopolymer toughness and meet workability requirements, practical challenges persist, particularly regarding the occurrence of clogging in the print or spray ports during 3D printing or shotcrete processes. To tackle port clogging, the concept of low-content PVA fiber has gained acceptance in fiber-reinforced cementitious composites [36,37,38,39]. Wang et al. [36] explored low volume fractions of PVA fiber at 0.1%, 0.2%, 0.3%, and 0.4% to assess their impact on the cracking performance of 3D-printed mortar. Pham et al. [37] observed that incorporating a relatively small volume fraction of fiber (0.2%) into a 3D-printed cementitious composite resulted in a significant increase in yield stress and green strength. Tian et al. [38] introduced an innovative high-strength shotcrete, incorporating approximately 0.08% PVA fiber by volume, specifically designed for high-geothermal tunnels. Ma et al. [39] examined the printable properties of cementitious materials containing copper tailings during 3D printing, and the composite demonstrated favorable printability by adding a 0.13% volume fraction of PP fibers.
While the application of low-content PVA fibers has been proven to be a viable approach for addressing tensile toughness in 3D printing or shotcrete technologies, there is currently limited research on this practice in geopolymers [40]. To address the requirements of 3D printing and shotcrete technologies and gain insights into the properties of geopolymer reinforced with low-content PVA fiber, this study conducted mechanical tests and microscopic observations on a series of geopolymer specimens incorporating low-content PVA fiber. The study aims to identify mechanical properties and microscopic mechanisms and explore the reinforcing mechanisms of low-content PVA fiber on load capacities and damage inhibition in slag and fly ash-based geopolymer with varying fiber dosages. For this purpose, mixtures of reinforced slag and fly ash-based geopolymer with 0.1%, 0.15%, and 0.2% (by volume) PVA fiber, along with a fiber-free mixture, were designed. These fiber dosage variables were determined through a further conservative estimation based on researchers in cementitious materials [36,37,38,39]. By employing macroscopic mechanical tests, microscopic observations, and pertinent analysis, this study delved into the impact of PVA fiber dosage on the mechanical properties of slag and fly ash-based geopolymer, along with an exploration of the microscopic mechanisms. This study recommends the optimal PVA fiber dosage for real 3D printing and shotcrete, among other applications.

2. Testing Design

Tensile tests, cubic compressive tests, bending tests, post-bending compressive tests, prism compressive tests, and measurement tests of modulus of elasticity and Poisson’s ratio were performed to evaluate the mechanical behavior of the four types of composites with fiber volume dosages of 0%, 0.1%, 0.15%, and 0.2%.

2.1. Preparation of Slag and Fly Ash-Based Geopolymer

The primary raw material used for geopolymer production is metakaolin, which can be costly, and the resulting hardened paste can be brittle compared to organic polymers. To address this, previous studies have explored the use of slag powder and fly ash as substitutes for metakaolin [13,15]. The main components used in this study comprised slag powder, fly ash, quartz sand, silica fume, short PVA fiber, alkali activator, and water. The slag powder and fly ash used in this study were purchased from Baotian New Building Material Co., Ltd. (Shanghai, China) and Wujing Thermal Power Plant (Shanghai, China), respectively. The aggregate employed was quartz sand with a particle size of 0.180–0.425 mm, a bulk density of 1.72 g/cm3, and a SiO2 content of approximately 99.84% by weight. Silica fume, containing about 90.85% SiO2 by weight, was produced by Langtian Resource Comprehensive Utilization Co., Ltd. (Chengdu, China).
The slag and fly ash-based geopolymers were synthesized through alkali activation of the aforementioned materials by employing an alkali activator formulated with a sodium hydroxide–aqueous sodium silicate solution. The aqueous sodium silicate solution was purchased from Yourui Refractory Material Co., Ltd. (Jiaxing, China) with an initial M (n(SiO2)/n(Na2O)) value of 2.25. Sodium hydroxide, a white granular crystal with a purity of 98.7%, was obtained from Sinopharm Chemical Reagent Co., Ltd. (Shanghai, China). The M value of the aqueous sodium silicate solution was adjusted to 1.5 using sodium hydroxide, as suggested by Guo et al. [41], and left for 24 h before use. The PVA fiber utilized in this study was manufactured by Sinopec Chongqing SVW Chemical Co., Ltd. (Chongqing, China). The material properties of the PVA fiber are presented in Table 1.
Given the rheological requirements for slag and fly ash-based geopolymers, the mix proportions of slag powder, fly ash, quartz sand, and silica fume were set at 1:8:12:1, referencing the work by Guo et al. [13]. The water-to-binder ratio and alkaline activator dosage by weight of Na2O were set at 0.32 and 6%, respectively, drawing from the research conducted by Guo et al. [41]. Following trial mixing, the mix design for producing 1 m3 of slag and fly ash-based geopolymer is presented in Table 2. As the aqueous sodium silicate solution already contained water, the mass of the added water was subtracted from the water in the aqueous sodium silicate solution during the mix design calculation based on the water-to-binder ratio.

2.2. Specimen Design and Preparation

To examine the mechanical properties of the composite, various types of specimens were employed for distinct tests. These included dog-bone specimens for tensile tests; cubic specimens for cubic compressive tests; and prismatic specimens for bending, post-bending compressive tests, and prism compressive tests. For convenience, the term “x-day” will be abbreviated as “xd” hereafter. Detailed information on the specimens used is provided in Table 3, with three to six specimens utilized for each test case to minimize test variability. The specimen preparation process, outlined in Figure 1, entailed blending the dry materials (slag powder, fly ash, quartz sand, silica fume, and PVA fiber) in a mixer for one minute at a slow mixing speed to ensure complete dispersion. Subsequently, water was added to the alkali activator solution (M = 1.5) and mixed using a glass rod. The mixed solution was then added to the dry mixture, and activation took place for approximately one minute at a slow speed. Finally, the mixture was blended at a relatively high speed for four to five minutes to ensure the full dispersion of the admixture in the mixture.
Table 3. Specimen design for mechanical testing.
SpecimensSpecimen Size (mm × mm × mm)Fiber Dosage (%)Test ContentDescriptionStandards
D-1-(1–4)See Figure 20Dog-bone tensile testTest tensile strength[42]
D-2-(1–4)0.1
D-3-(1–4)0.15
D-4-(1–4)0.2
C-1-(1–3)70.7 × 70.7 × 70.70Cubic compressive testTest 3d compressive strength[43]
C-2-(1–3)0.1
C-3-(1–3)0.15
C-4-(1–3)0.2
C-1-(4–9)0Test 28d compressive strength
C-2-(4–9)0.1
C-3-(4–9)0.15
C-4-(4–9)0.2
P-1-(1–4)40 × 40 × 1600Bending and post-bending compressive testTest bending and post-bending compressive strength[43]
P-2-(1–4)0.1
P-3-(1–4)0.15
P-4-(1–4)0.2
P-1-(5–8)0Prism compressive testObtain compressive stress–strain curve
P-2-(5–8)0.1
P-3-(5–8)0.15
P-4-(5–8)0.2
P-1-(9–12)0Measurement test of modulus of elasticity and Poisson’s ratioMeasure the modulus of elasticity and Poisson’s ratio[44]
P-2-(9–12)0.1
P-3-(9–12)0.15
P-4-(9–12)0.2

3. Mechanical Behavior Testing

Before conducting mechanical tests on specimens with different fiber dosages, the tensile properties of the PVA fibers were tested. The INSTRON-3343 single-column table frame material testing machine (with a maximum applied load of 1 kN), depicted in Figure 3a, was employed for conducting the tensile tests on the PVA fiber. Furthermore, the INSTRON-8802 electro-hydraulic servo fatigue testing machine (with a maximum applied load of 250 kN), as shown in Figure 3b, was utilized to perform tensile tests on the dog-bone specimens under displacement control with a loading speed of 0.2 mm/min [42]. For the cubic compressive test, the YAW-3000G electro-hydraulic servo testing machine (with a maximum applied load of 3000 kN), illustrated in Figure 3c, was employed to uniformly load the cubic specimens with a length of 70.7 mm under force control with a loading speed of 1.5 kN/s [43]. The DY-208MC full-automatic pressure testing machine (with a maximum applied load of 300 kN), depicted in Figure 3d and containing two modules of bending and compressive testing, was selected to perform the bending and post-bending compressive tests on prismatic specimens with dimensions of 40 mm × 40 mm × 160 mm. After the bending test, the post-bending compressive test was conducted. The loading rate of the bending test is 50 N/s and that is 2400 N/s for the post-bending compressive test [43]. The same prismatic specimen was also used for the prism compressive test by the YAW-3000G electro-hydraulic servo testing machine, with the loading procedure controlled by displacement and the loading speed decreasing from 0.04 to 0.003 mm/min, to obtain the falling branch of the stress–strain curve. The modulus of elasticity and Poisson’s ratio were determined through a prism compressive test, with the peak loading being approximately 25% of the ultimate bearing capacity of the specimen [44]. The NCS YYU-5/50 extensometer was used for measuring the strain of the specimens, with a gauge length of 50 mm, a maximum range of 5 mm, and an accuracy of 0.001.

4. Mechanical Behavior

4.1. Tensile Behavior of PVA Fiber

The tensile properties of PVA fiber play a crucial role in influencing the mechanical properties of fiber-reinforced geopolymer. In this study, high-strength hydrophilic PVA fiber was utilized, and to comprehensively understand its tensile properties, a testing setup, as depicted in Figure 3a, was employed for conducting the tensile tests. To minimize incidental errors in the experiment, the tensile tests were simultaneously conducted in eight sets, and the results for breaking elongation, breaking strength, and initial modulus are presented in Table 4. For these eight sets of data, the corresponding sample standard deviation σ s and coefficient of variation c v s , calculated using σ s and average μ , were statistically determined using Equations (1) and (2), respectively, and are presented in Table 4. The average breaking elongation, breaking strength, and initial modulus stood at 7.28%, 10.27cN/dtex, and 89.35 cN/dtex, respectively. Their coefficients of variation, all under 15%, signified a commendable level of stability.
σ s = i = 1 n x i μ 2 n 1 ,
c v s = σ s μ ,
where x i is a sample, and n denotes the number of samples.

4.2. Dog-Bone Tensile Behavior

The dimensional information of the dog-bone specimens used in the tensile test is presented in Figure 3, and the testing setup is depicted in Figure 3b. After conducting tests on 16 dog-bone specimens with varying PVA fiber dosages following established loading regimes, Figure 4a,b illustrates typical damage cases and post-failure cross sections. In Figure 4c, the average stress–strain curves for each condition are displayed, featuring marked peak points and their corresponding values. During the tensile test of the dog-bone specimens, rupture occurred at the small cross section and had a non-neat fracture surface, as depicted in Figure 4a. The toughening effect of PVA fiber led to a rougher fracture surface for D-3-3 compared to D-2-3, as shown in Figure 4b. In comparison to specimens without fibers, peak tensile stress increased by 19.21%, 28.57%, and 34.48% with increasing PVA fiber dosage. Zhang et al. [45] delved into the impact of PVA fiber dosages ranging from 0% to 1% in volume on the tensile strength of geopolymer and similarly observed that the tensile strength consistently increased with the increase in fiber dosage. Additionally, the peak tensile strain increased by 26.39%, 47.59%, and 34.76% for the 0.1%, 0.15%, and 0.2% fiber dosage specimens, respectively. From Figure 4b, it can be observed that as the fiber dosage increased from 0% to 0.15%, there was an overall decrease in stiffness. However, when the fiber dosage reached 0.2%, although the stress still increased, the strain decreased, and the stiffness recovered to a level similar to that of the plain specimens. This increased stress and strain when the fiber content is with 0% to 0.15% is due to the reinforcing effect on strength and toughness. In terms to the ultimate stress increase and strain decrease for specimen with fiber content of 0.2%, the reason can attribute to that although the increase in fiber content contributes to the strength growth of the composite material, phenomena such as aggregation and bending caused by the increase in fibers have an impact. Additionally, fibers may experience greater influence on ultimate strain due to factors such as bridging fracture or debonding, possibly caused by uneven distribution [45]. Nevertheless, with a fiber dosage of 0.2%, the increased volume content compensated for the strength reduction.

4.3. Cubic Compressive Behavior

Table 5 presents the average 3d and 28d strengths for the four types of slag and fly ash-based geopolymer. Three specimens were tested for 3d strength and six specimens for 28d strength for each composite. The table reveals minimal differences in compressive strength among specimens with varying fiber dosages in both 3d and 28d conditions. Notably, the test results highlighted that the highest cubic compressive strength was achieved at a 0.15% fiber dosage in both 3d and 28d conditions. Xu et al. [46] investigated the influence of PVA fiber dosage ranging from 0% to 0.4% in volume on the cubic compressive strength and similarly observed that the highest 28d cubic compressive strength was achieved when the fiber dosage was 0.2%. Moreover, compared with the 28d strength, the 3d strength of every type of specimen with varying fiber dosages was about 44%, surpassing the 3d/28d strength ratio of 30% for Portland cement-based concrete. This indicates that the strength of slag and fly ash-based geopolymer grows faster than that of traditional concrete, which is a critical requirement for 3D printing or shotcrete technologies.

4.4. Bending and Post-Bending Compressive Behavior

Table 6 outlines the bending strength and post-bending compressive strength of four types of slag and fly ash-based geopolymers, denoted as P-(1–4)-(1–4). The numbers in the middle denote the fiber dosage, ranging from 0% to 0.2%, while the second number represents the specimen number in the test group. The bending compressive ratio was calculated as the ratio of bending strength to post-bending compressive strength. The results indicate that average bending strengths, average post-bending compressive strengths, and bending compressive ratios initially increased and then decreased with the rise in fiber dosage under the given conditions. In comparison to fiber-free specimens, the average bending strength increased by 7.54%, 12.28%, and 0.88% for PVA fiber dosages of 0.1%, 0.15%, and 0.2%, respectively. The specimens with 0.15% fiber exhibited the most significant enhancement compared to the 0.2% fiber and fiber-free specimens. Wang et al. [36] and Xu et al. [46] investigated the impact of PVA fiber dosages ranging from 0% to 0.4% in volume on the bending strength of mortar and geopolymer, respectively. Both studies similarly revealed that a PVA fiber dosage of 0.2% yielded the highest bending strength. Post-bending compressive strength also initially increased and then decreased with the rise in fiber dosage, with a decrease in the post-bending compressive strength of the specimens with 0.2% fiber compared to the fiber-free ones. The average post-bending compressive strengths of the specimens with 0.1%, 0.15%, and 0.2% fiber dosage increased by 1.78% and 4.49% and decreased by 1.12%, respectively, compared to the fiber-free ones. Similarly, the bending compressive ratios of the specimens increased by 5.61%, 7.48%, and 1.87%, respectively, compared to the fiber-free ones. The decline in mechanical properties when the fiber dosage reached 0.2% can be attributed to the adverse impact of fibers on the encapsulation of the geopolymer and partial fiber agglomeration, which increases when the fiber dosage exceeds a reasonable range [36,47]. In addition to the average, the coefficient of variation c v p was used to characterize the stability of the results between specimens. It was calculated using Equation (3), where the population standard deviation σ d was determined from Equation (4). Table 6 shows that the coefficients of variation for bending strength, post-bending compressive strength, and bending compressive ratio in all four cases were less than 4%, indicating a commendable stabilization of specimen properties.
c v p = σ d μ ,
σ d = i = 1 n x i μ 2 n ,
where x i denotes an individual, and n and μ denote the number and average of the entire population.

4.5. Prism Compressive Behavior

4.5.1. Damage Mechanisms and Stress–Strain Relationships

The prismatic specimens, with dimensions detailed in Table 3, underwent a prism compressive test. The stress–strain curves obtained during the procedure are presented in Figure 5, excluding specimens P-4-5 and P-4-7, as the acquisition system crashed during the loading process. In the initial loading phase, the stress–strain curves exhibited an approximately linear growth trend, transitioning to the plasticity stage as stress reached around half of the peak value. Continuing the loading, fine cracks emerged on the specimen surface, progressing into macrocracks. Notably, crack expansion in fiber-free specimens occurred significantly earlier than in fiber-reinforced specimens. At peak stress, cracks in the fiber-free group swiftly penetrated the specimens, resulting in loss of load-bearing capacity and destruction, as depicted in Figure 6a. In contrast, crack propagation in fiber-reinforced specimens was noticeably impeded by the fibers as strain increased. With increased displacement, the disordered short-cut fibers on both sides of the crack transferred tension stress, preventing rapid crack propagation until reaching ultimate stress. Following the specimen’s attainment of ultimate bearing capacity, it entered the descending section. While it did not immediately lose bearing capacity, it continued deforming during unloading. After descending to a certain degree, a precipitous fall occurred, rendering it incapable of further bearing loads. As cracks extended to the edge, as shown in Figure 6b–d, fiber-reinforced specimens were deemed damaged, yet they exhibited enhanced toughness in both the damage pattern and the descending branch, as illustrated in Figure 5 and Figure 6.
To analyze the impact of PVA fiber dosage on the prism compressive test of slag and fly ash-based geopolymer, Table 7 lists the peak stress σ p and peak strain ε p of specimens P-(1–4)-(5–8), along with the average and coefficient of variation c v p determined by Equation (3) for each working condition. The deformation performance of this geopolymer surpassed that of Portland cement-based concrete, which typically exhibits a peak strain of about 2000 μ ε [48]. Compared to the fiber-free specimens, the average peak stresses of the 0.1%, 0.15%, and 0.2% fiber-reinforced specimens increased by 2.81%, 5.33%, and −1.45%, respectively. In a study conducted by Zhang et al. [45] examining the influence of PVA fiber dosages ranging from 0% to 1% in volume on prism compressive strength, a similar observation emerged. The highest prism compressive strength was achieved with a fiber dosage of 0.2%, but the strength consistently declined with an increase in fiber dosage. Furthermore, the average peak strains of the 0.1%, 0.15%, and 0.2% fiber-reinforced specimens increased by 20.73%, 36.45%, and 2.92%, respectively. As fiber dosage increased, both peak stress and peak strain increased, indicating an enhancement in compressive bearing capacity. However, when the dosage reached 0.2%, the improvement in load-bearing capacity and ductility decreased. Table 7 illustrates that the coefficient of variation for peak stress and peak strain in all four cases was less than 6%, indicating a commendable stabilization of specimen properties.

4.5.2. Compressive Toughness Analysis

The toughness of a material is intricately linked to both its deformation capacity and its energy dissipation capacity. This study assessed the pre-cracking toughness of slag and fly ash-based geopolymer by analyzing the initial cracking point. The initial cracking point C ( ε c , σ c ) was determined by calculating the areas enclosed by the horizontal axis and two stress–strain curves of the geopolymer and a linear elastic material before reaching the initial cracking point [49]. This process is detailed in Figure 7. Before the initial cracking, the area S t enclosed by the test curve and the horizontal axis was computed using Equation (5), and the area S l enclosed by the stress–strain curve of the linear elastic material under the same load and deformation and the horizontal axis was calculated using Equation (6).
S t = 0 ε c σ d ε ,
S l = σ c ε c / 2 .
The point of initial cracking indicates that the stress–strain curves of the two mentioned materials have reached their proportional limit, wherein Equations (5) and (6) are ideally expected to be equal. However, to accommodate potential errors, the relative deviation between the two area values was maintained at a small value, as illustrated in Equation (7). By setting ξ = 0.02 , the initial cracking point C of the specimens was determined and is presented in Table 8.
S t S l / S t = ξ .
In this study, the post-cracking toughness of slag and fly ash-based geopolymer was assessed by analyzing the peak point P ( ε p , σ p ). The post-cracking loading capacity and ductility of the specimens, δ σ and δ ε , calculated using Equation (8) for all relevant specimens P-(1–4)-(5–8), are presented in Table 8. As the PVA fiber dosage increased, both δ σ and δ ε increased, but they decreased when the dosage reached 0.2%. The peak strain energy E p was calculated as the total mechanical energy consumed per unit volume of slag and fly ash-based geopolymer from the beginning of loading to the peak using Equation (9). The higher the E p , the greater the cumulative energy dissipated, but the magnitude of E p can be influenced by σ p and ε p . To facilitate comparison between groups of specimens, E p was divided by the product of the corresponding σ p and ε p , yielding the relative strain energy Δ , as calculated in Equation (10). A larger Δ indicates a higher relative energy dissipation capacity for the specimen.
δ σ = σ p / σ c , δ ε = ε p / ε c ,
E p = 0 ε p σ d ε ,
Δ = E p / σ p ε p .
Additionally, to assess the energy dissipation capacity of the specimen after initial cracking, the ratio of E p to the total mechanical energy E c consumed per unit volume of slag and fly ash-based geopolymer during the loading process from the beginning to initial cracking, as calculated in Equation (11), was defined as the strain energy ratio η , as shown in Equation (12). A larger η indicates a higher energy dissipation capacity of the specimen after cracking.
E c = 0 ε c σ d ε ,
η = E p / E c .
Based on the above analysis, the E c reflects the toughness of the specimens before initial cracking, while η represents the toughness from initial cracking to damage, and E p , Δ describe the toughness during the entire loading process. Table 8 shows these four indices for each specimen. From Table 8, it can be seen that the δ σ , δ ε , E p , Δ , and η of the specimens exhibited a trend of increasing and then decreasing with increasing PVA fiber dosage, but they all increased to some extent compared to the fiber-free specimens. The specimens with 0.15% fiber showed a greater increase, with their δ σ , δ ε , E p , Δ , and η increasing by 27.17%, 44.07%, 50.00%, 4.91%, and 76.36%, respectively, compared to the fiber-free specimens.

4.6. Modulus of Elasticity and Poisson’s Ratio Analysis

To measure the modulus of elasticity E , an extensometer was used to measure strain along the long side of the specimen within the middle 100 mm range. Poisson’s ratio μ was determined using resistance strain gauges at the midpoint of both sides of the specimen, calculating strains along the short and long sides at that point. Table 9 displays the E and μ of slag and fly ash-based geopolymer specimens P-(1–4)-(9–12). Regarding the E , there was a decrease of 1.00%, 2.14%, and 5.71% with an increase in fiber dosage from 0.1% to 0.2% compared to the fiber-free specimens. In a study by Zhang et al. [45] investigating the impact of PVA fiber dosage ranging from 0% to 1% in volume on modulus of elasticity, a similar observation emerged. The highest E was achieved with a fiber dosage of 0.2%, but it consistently declined with further increases. Similarly, μ decreased by 10.33%, 14.13%, and 7.07% for the 0.1%, 0.15%, and 0.2% fiber-reinforced specimens, respectively, compared to the fiber-free ones. Throughout the process of increasing the fiber dosage from 0% to 0.2%, the toughening effect of the fibers faced challenges due to stress-concentration-induced cracking resulting from the growing non-uniformity of the matrix. Regarding the coefficients of variation c v p , determined by Equation (3) for both E and μ in all four cases, they were all less than 4%, indicating commendable stability in specimen properties.

5. Microscopic Mechanisms and Discussion

This study investigated the mechanical properties of slag and fly ash-based geopolymer with varying PVA fiber dosages ranging from 0% to 0.2%. The aim was to tailor these properties for 3D printing and shotcrete technologies, considering extrudability, rheology, free-forming ability, and thixotropic properties. Macroscopic mechanical tests were used to evaluate PVA fiber tensile properties and their impact on geopolymer mechanical properties. Microscopic mechanisms were examined using environmental scanning electron microscopy (ESEM) and energy-dispersive X-ray analysis (EDX) to identify component interactions at a microlevel [50,51]. ESEM and EDX sample preparation involved cutting specimens, selecting representative pieces, removing microorganisms, eliminating free water, and fixing samples with conductive epoxy resin. Figure 8 displays ESEM images and an EDX chart (analysis of the red cross position in the corresponding ESEM images) of slag powder, fly ash, quartz sand, and silica fume in the composites.
Ingredients were observed at various magnification levels, employing EDX for analysis. The irregular-shaped slag powder had a length of about 500 μm, as shown in Figure 8a, and a primary element distribution, as shown in Figure 8e, preventing crack propagation. Fly ash particles, with a diameter of about 10 μm and a primary element distribution, as shown in Figure 8f, maintained integrity even when the composite cracked, as shown in Figure 8b. The lengths of quartz sand and silica fume, as shown in Figure 8c,d, were approximately 1 μm and far less than 1 μm, respectively, with Si, O, and Al being the most common elements, as demonstrated in Figure 8g,h. This aggregate grade theoretically guarantees the strength and workability of the composites.
Additionally, ESEM investigation was carried out to analyze microscopic mechanisms. Typical ESEM images, as shown in Figure 9, revealed that using quartz sand instead of coarse aggregates significantly reduced microcrack size in the composite after loading [52]. As shown in Figure 9a, there are PVA fibers drawn out and ruptured, and the damaged fiber’s cross section was shown in Figure 9b. Considering pore size, smaller voids within the yellow cycle, as shown in Figure 9c, were likely formed by fibers pulled out [53]. While for the fiber content of 0.2% specimen, fiber clustering was observed as Figure 9d, marked as “initial defect”.
For the low-content PVA fibers studied in this research, achieving a uniform distribution within the matrix was challenging, as depicted in Figure 9a. It was observed that until the fiber dosage reached a sufficient value, the uneven distribution became more prominent with increasing fiber dosage, resulting in localized stress concentration and heightened susceptibility to cracking. However, beyond this specified value, the uneven distribution phenomenon was alleviated, and the bridging effect of the fibers contributed more to balancing these adverse effects. Concerning the modulus of elasticity, it decreased with increasing dosage. Regarding Poisson’s ratio, it decreased with the dosage increase from 0% to 0.15% but then increased as the dosage reached 0.2%.
Considering both macrostructure and microstructure phenomena, the impact of PVA fiber on the geopolymer’s mechanical properties and microscopic mechanisms can be analyzed. Initially, PVA fiber incorporation enhances load-bearing capacity and toughness by reducing crack tip stress through fiber rupture and pullout. However, adverse effects on geopolymer encapsulation occur, acting as initial defects in the matrix due to PVA fibers, despite their bonding capacity with the matrix. Consequently, the test results reflect the combined influence of these conflicting effects. Peak tensile strain, cubic compressive stress at 3d and 28d, bending strength, post-bending compressive strength, bending compressive ratio, peak stress, peak strain in the stress–strain curve of the prism compressive test, and relevant toughness evaluation indices increased with PVA fiber dosage up to 0.15%. Beyond this, a decrease was noted as the fiber dosage reached 0.2%, signifying negative effects on encapsulation and significant defects due to partial fiber agglomeration, as demonstrated in Figure 9d.
The mix design and the resulting specimens in this research elucidate the impact of low-content PVA fiber on the mechanical properties of slag and fly ash-based geopolymer. PVA fiber exhibits high tensile strength, substantial elongation, and an effective bridging effect, essentially serving as reinforcement integrated into the geopolymer matrix. It enhances the geopolymer’s ability to withstand tensile stress, resist loads, and mitigate issues like plastic and dry shrinkage, thereby slowing down and limiting crack expansion. An appropriate amount of PVA fiber aids in stress dispersion during specimen loading, here, in this study, the low fiber dosage geopolymer showed optimized disperse distribution and increased mechanical properties with the fiber dosage of 0.15%. However, when the fiber dosage exceeds a critical range, partial fiber agglomeration occurs. This not only fails to disperse stress but also induces stress concentration, which is detrimental to the overall mechanical properties of slag and fly ash-based geopolymer. Following the analysis mentioned earlier, the suggested PVA fiber dosage stands at 0.15%, in this study. Subsequent studies will delve into the fresh properties as well as the printing or shotcrete performance of the geopolymer matrix with this optimal fiber dosage. The engineering applicability of the material will then be validated by utilizing it in the structures through 3D printing or shotcrete techniques.

6. Conclusions

In this study, the mechanical properties of slag and fly ash-based geopolymer were enhanced by the incorporation of low-content PVA fiber, meeting the rheological requirements for 3D printing and shotcrete technologies. The influence of fibers on tensile properties, cubic compressive strength, bending and post-bending compressive properties, prism compressive properties, modulus of elasticity, and Poisson’s ratio of slag and fly ash-based geopolymer was investigated, with microscopic mechanisms observed. The main conclusions are summarized here.
(1)
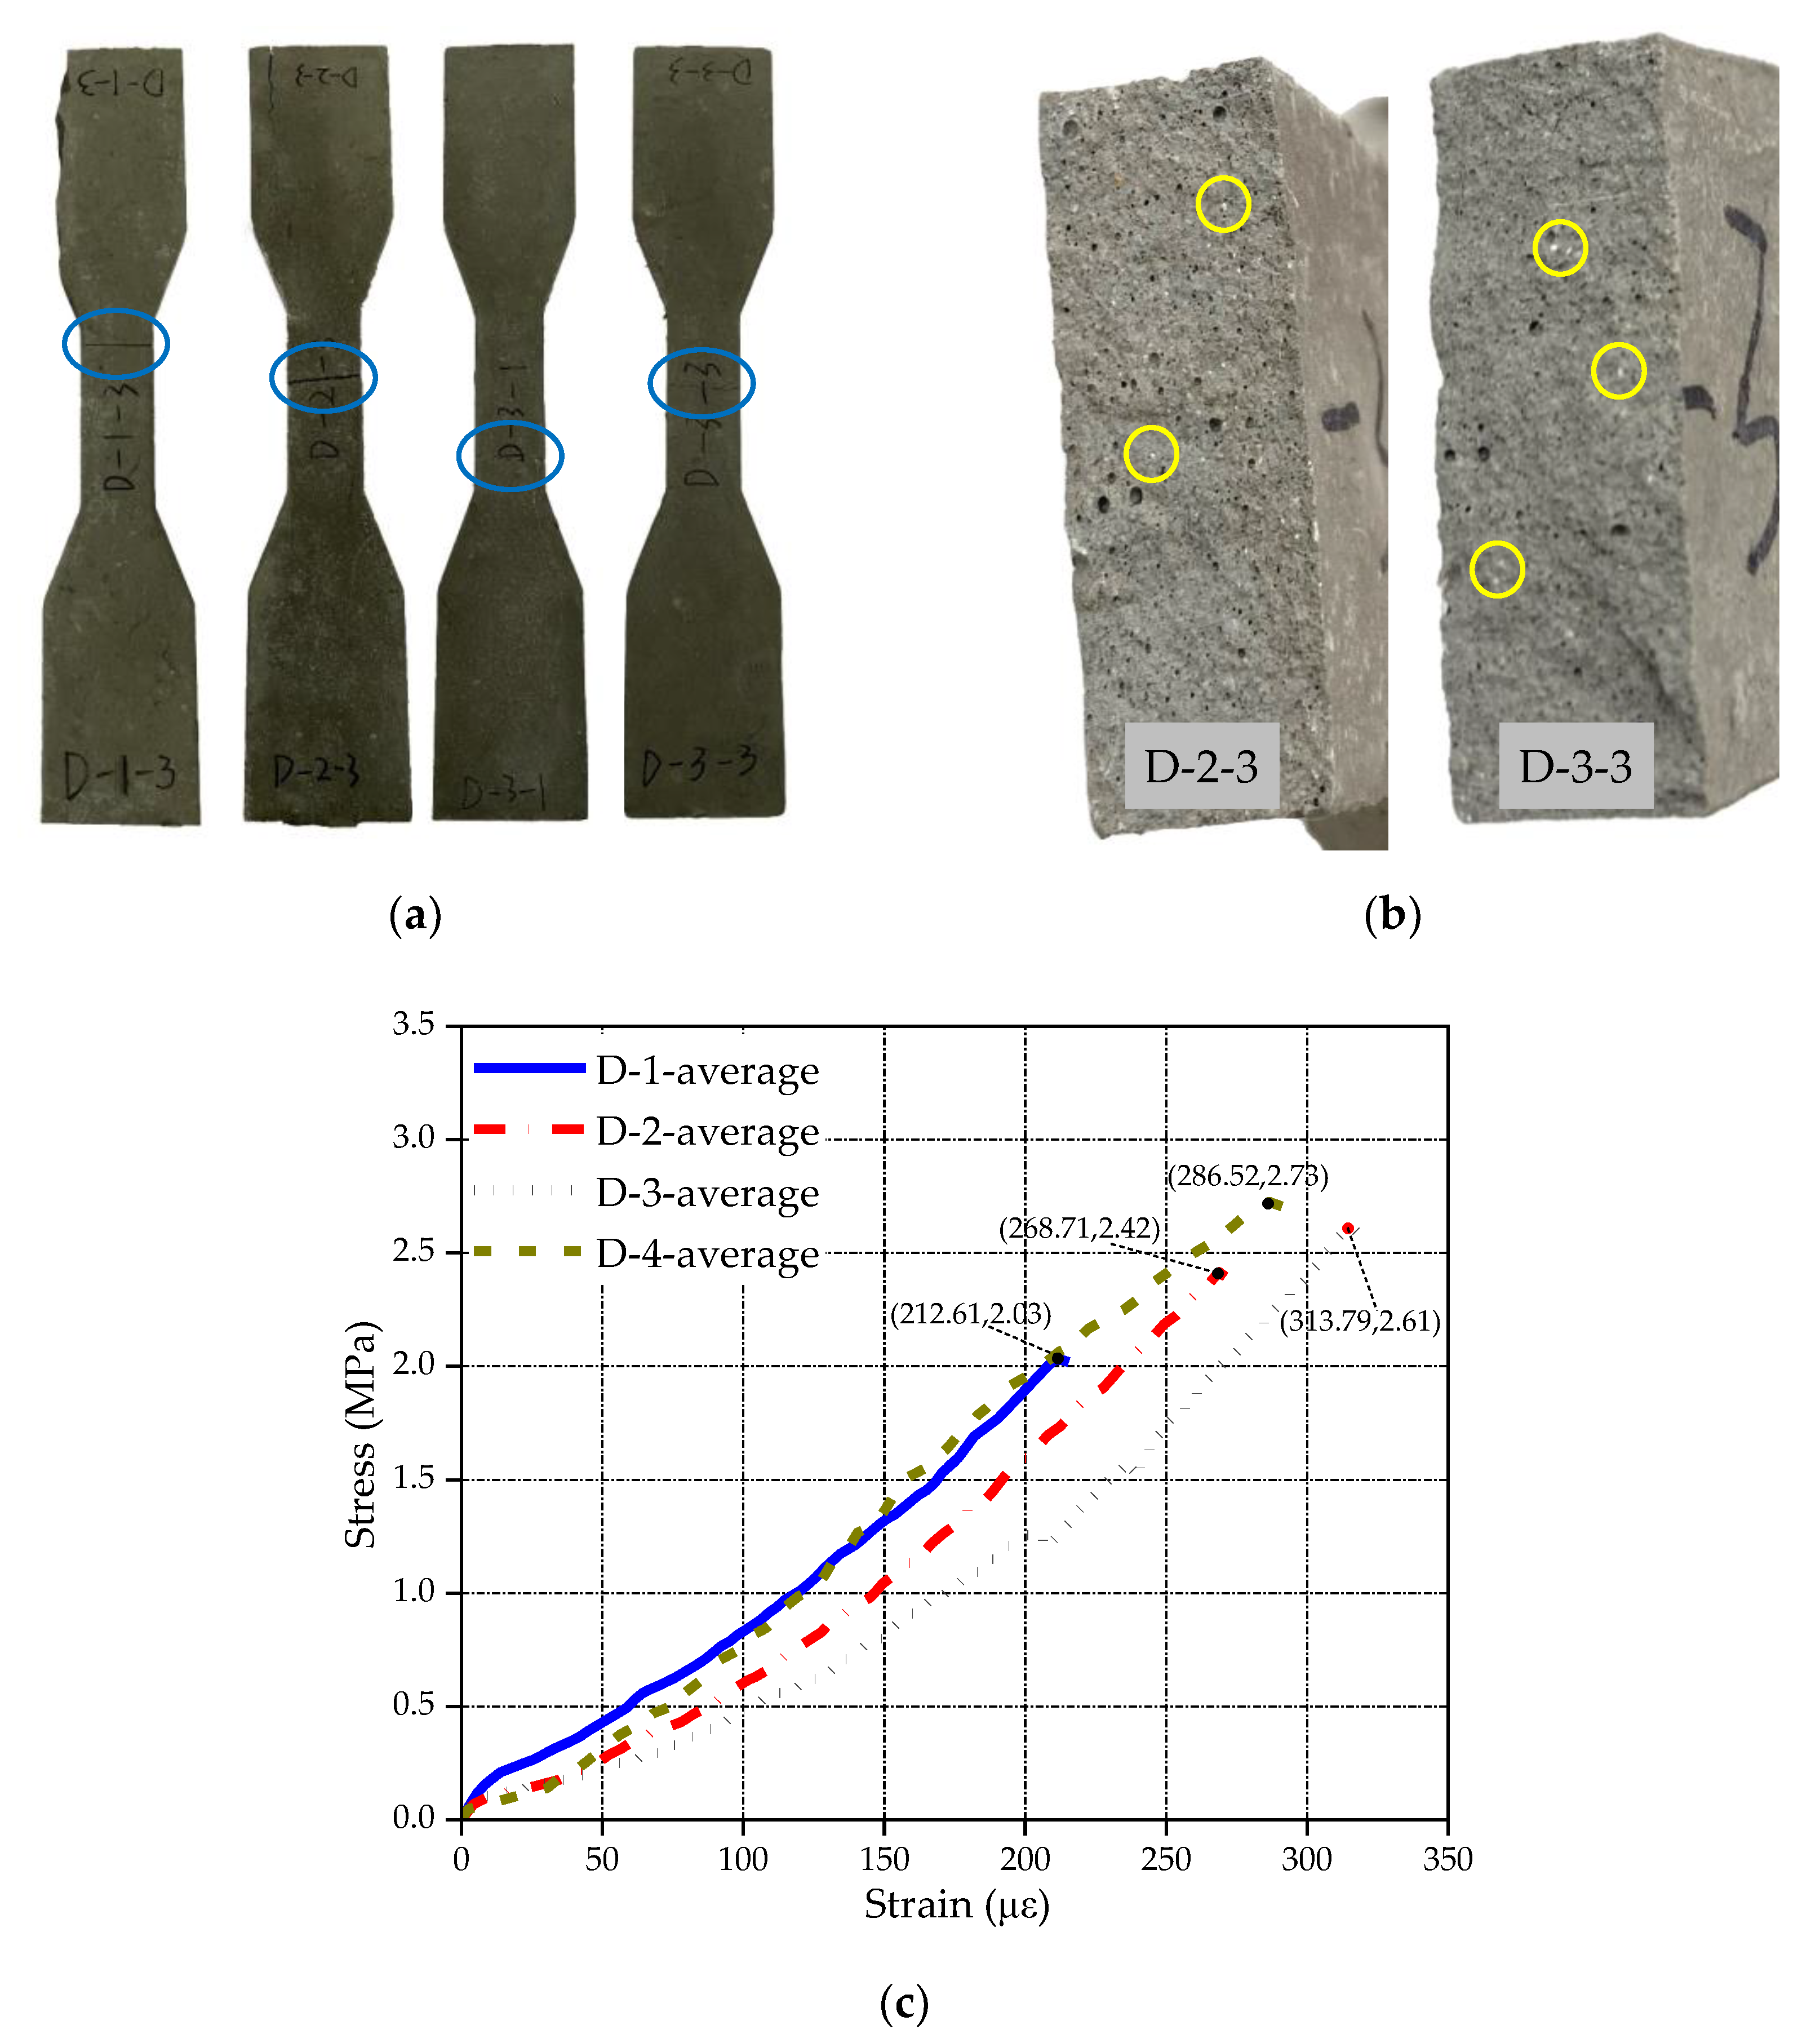
By adding 0.1%, 0.15%, and 0.2% PVA fiber, the dog-bone specimens showed increases in peak tensile stress by 19.21%, 28.57%, and 34.48%, and peak tensile strain by 26.39%, 47.59%, and 34.76%, respectively, compared to the fiber-free counterparts. However, stiffness experienced a continuous decrease up to 0.15% fiber dosage, followed by recovery to a level similar to that of the plain specimens at 0.2%.
(2)
As the PVA fiber dosage increased from 0% to 0.15%, there was an increase in cubic compressive strength at 3d and 28d, bending strength, post-bending compressive strength, bending compressive ratio, peak stress, peak strain in the stress–strain curve of the prism compressive test, and relevant toughness evaluation indices. However, these values decreased when the fiber dosage was further increased to 0.2%. The 28d cubic compressive strength, bending strength, post-bending compressive strength, and prism compressive strength of specimens with 0.15% fiber reached 50.04, 6.40, 55.83, and 39.35 MPa, respectively.
(3)
Appropriate PVA fiber inclusion enhances load-bearing capacity and toughness, and an excessive amount of fiber weakens this enhancement due to increased adverse effects on geopolymer encapsulation and notable defects caused by partial fiber agglomeration. Microstructural observations reveal that when the fiber dosage is below 0.15%, fiber pullout and rupture are more thorough. However, when the fiber dosage reaches 0.2%, fiber agglomeration is observed, and the bonding between agglomerated fibers and the matrix is not effective, leading to a decrease in mechanical properties. A 0.15% addition of PVA fiber to slag and fly ash-based geopolymer was recommended in this study.
Maintaining a low PVA fiber dosage to ensure proper extrudability, rheology, and other workability properties in 3D printing or shotcrete technologies, it still significantly enhances toughness and various mechanical properties. This makes slag and fly ash-based geopolymer reinforced with an appropriate low content of PVA fiber a fitting high-performance engineering cement for modern construction. For the real application, addressing the uneven distribution phenomenon and balancing the adverse effects through dispersion enhancement or surface improvement techniques, along with the bridging effect of the fibers, still remains challenge.

Author Contributions

Conceptualization, H.Z., F.H., Y.D. and J.L.; data curation, F.H.; formal analysis, F.H.; funding acquisition, H.Z. and Y.D.; investigation, F.H., J.L. and J.Y.; methodology, H.Z., F.H. and J.L.; project administration, H.Z.; resources, H.Z. and J.Y.; software, F.H.; supervision, H.Z. and Y.D.; visualization, F.H. and J.Y.; writing—original draft, F.H.; writing—review and editing, H.Z. and Y.D. All authors have read and agreed to the published version of the manuscript.

Funding

This research was funded by the National Natural Science Foundation of China (Grant Nos. 52078459 and 52378540), the National Key R&D Program of China (Grant No. 2019YFE0112600), and the Natural Science Foundation of Zhejiang Province (Grant Nos. LZ22E080005 and LHZ23E080003).

Data Availability Statement

The data presented in this study are available on request from the corresponding author. The data are not publicly available due to privacy.

Acknowledgments

The authors express sincere gratitude to Xiaolu Guo of Tongji University for her valuable suggestions regarding the tests conducted in this study, as well as to the reviewers for their efforts in improving the quality of this paper.

Conflicts of Interest

The authors declare no conflicts of interest.

References

  1. Zhang, H.M.; Hu, F.; Duan, Y.F.; Shi, D.W.; Hu, G.M. Metaheuristic optimization algorithm for rapid parameter identification of the Bouc-Wen model for self-centering shear walls. Int. J. Struct. Stab. Dyn. 2022, 22, 2350041. [Google Scholar] [CrossRef]
  2. Andrew, R.M. Global CO2 emissions from cement production, 1928–2017. Earth Syst. Sci. Data 2018, 10, 2213–2239. [Google Scholar] [CrossRef]
  3. Davidovits, J. Geopolymers, and geopolymeric materials. J. Therm. Anal. 1989, 35, 429–441. [Google Scholar] [CrossRef]
  4. Habert, G.; Ouellet-Plamondon, C. Recent update on the environmental impact of geopolymers. RILEM Tech. Lett. 2016, 1, 17–23. [Google Scholar] [CrossRef]
  5. Duxson, P.; Provis, J.L.; Lukey, G.C.; Van Deventer, J.S.J. The role of inorganic polymer technology in the development of ‘green concrete’. Cem. Concr. Res. 2007, 37, 1590–1597. [Google Scholar] [CrossRef]
  6. Zhuang, X.Y.; Chen, L.; Komarneni, S.; Zhou, C.H.; Tong, D.S.; Yang, H.M.; Yu, W.H.; Wang, H. Fly ash-based geopolymer: Clean production, properties and applications. J. Clean. Prod. 2016, 125, 253–267. [Google Scholar] [CrossRef]
  7. Baran, P.; Nazarko, M.; Włosińska, E.; Kanciruk, A.; Zarebska, K. Synthesis of geopolymers derived from fly ash with an addition of perlite. J. Clean. Prod. 2021, 293, 126112. [Google Scholar] [CrossRef]
  8. Lemougna, P.N.; Adediran, A.; Yliniemi, J.; Ismailov, A.; Levanen, E.; Tanskanen, P.; Kinnunen, P.; Roning, J.; Illikainen, M. Thermal stability of one-part metakaolin geopolymer composites containing high volume of spodumene tailings and glass wool. Cem. Concr. Compos. 2020, 114, 103792. [Google Scholar] [CrossRef]
  9. Zhang, X.M.; Zhang, P.; Wang, T.Y.; Zheng, Y.; Qiu, L.H.; Sun, S.W. Compressive strength and anti-chloride ion penetration assessment of geopolymer mortar merging PVA fiber and nano-SiO2 using RBF-BP composite neural network. Nanotechnol. Rev. 2022, 11, 1181–1192. [Google Scholar] [CrossRef]
  10. Zhou, G.Z.; Su, R.K.L. A review on durability of foam concrete. Buildings 2023, 13, 1880. [Google Scholar] [CrossRef]
  11. Pasupathy, K.; Berndt, M.; Sanjayan, J.; Rajeev, P.; Cheema, D.S. Durability of low-calcium fly ash based geopolymer concrete culvert in a saline environment. Cem. Concr. Res. 2017, 100, 297–310. [Google Scholar] [CrossRef]
  12. Luhar, S.; Nicolaides, D.; Luhar, I. Fire resistance behaviour of geopolymer concrete: An overview. Buildings 2021, 11, 82. [Google Scholar] [CrossRef]
  13. Guo, X.L.; Yang, J.Y.; Xiong, G.Y. Influence of supplementary cementitious materials on rheological properties of 3D printed fly ash based geopolymer. Cem. Concr. Compos. 2020, 114, 103820. [Google Scholar] [CrossRef]
  14. Zhao, J.P.; Meng, X.R.; Chen, L.J.; Liu, G.M.; Zhang, Z.X.; Xu, Q.Q. Correlation between the mechanical properties and the fiber breaking morphology of fiber reinforced shotcrete (FRS). Compos. Struct. 2021, 277, 114641. [Google Scholar] [CrossRef]
  15. Panda, B.; Paul, S.C.; Tian, M.J. Anisotropic mechanical performance of 3D printed fiber reinforced sustainable construction material. Mater. Lett. 2017, 209, 146–149. [Google Scholar] [CrossRef]
  16. Xia, M.; Nematollahi, B.; Sanjayan, J. Printability, accuracy and strength of geopolymer made using powder-based 3D printing for construction applications. Autom. Constr. 2019, 101, 179–189. [Google Scholar] [CrossRef]
  17. McAlorum, J.; Perry, M.; Vlachakis, C.; Biondi, L.; Lavoie, B. Robotic spray coating of self-sensing metakaolin geopolymer for concrete monitoring. Autom. Constr. 2021, 121, 103415. [Google Scholar] [CrossRef]
  18. Nematollahi, B.; Sanjayan, J. Effect of different superplasticizers and activator combinations on workability and strength of fly ash based geopolymer. Mater. Des. 2014, 57, 667–672. [Google Scholar] [CrossRef]
  19. Raza, M.H.; Zhong, R.Y.; Khan, M. Recent advances and productivity analysis of 3D printed geopolymers. Addit. Manuf. 2022, 52, 102685. [Google Scholar] [CrossRef]
  20. Xiao, S.H.; Cai, Y.J.; Guo, Y.C.; Lin, J.X.; Liu, G.T.; Lan, X.W.; Song, Y. Experimental study on axial compressive performance of polyvinyl alcohol fibers reinforced fly ash—Slag geopolymer composites. Polymers 2022, 14, 142. [Google Scholar] [CrossRef]
  21. Castel, A.; Foster, S.J.; Ng, T.; Sanjayan, J.G.; Gilbert, R.I. Creep and drying shrinkage of a blended slag and low calcium fly ash geopolymer Concrete. Mater. Struct. 2016, 49, 1619–1628. [Google Scholar] [CrossRef]
  22. Mahmood, A.; Noman, M.T.; Pechociakova, M.; Amor, N.; Petru, M.; Abdelkader, M.; Militky, J.; Sozcu, S.; Ul Hassan, S.Z. Geopolymers and fiber-reinforced concrete composites in civil engineering. Polymers 2021, 13, 2099. [Google Scholar] [CrossRef]
  23. Ranjbar, N.; Talebian, S.; Mehrali, M.; Kuenzel, C.; Metselaar, H.S.C.; Jumaat, M.Z. Mechanisms of interfacial bond in steel and polypropylene fiber reinforced geopolymer composites. Compos. Sci. Technol. 2016, 122, 73–81. [Google Scholar] [CrossRef]
  24. Ranjbar, N.; Zhang, M.Z. Fiber-reinforced geopolymer composites: A review. Cem. Concr. Compos. 2020, 107, 103498. [Google Scholar] [CrossRef]
  25. Zhang, H.M.; Cao, L.N.; Duan, Y.F.; Tang, Z.Z.; Hu, F.; Chen, Z.Y. High-flowable and high-performance steel fiber reinforced concrete adapted by fly ash and silica fume. Case Stud. Constr. Mater. 2024, 20, e02796. [Google Scholar] [CrossRef]
  26. Natali, A.; Manzi, S.; Bignozzi, M.C. Novel fiber-reinforced composite materials based on sustainable geopolymer matrix. Procedia Eng. 2011, 21, 1124–1131. [Google Scholar] [CrossRef]
  27. Cai, J.C.; Jiang, J.Y.; Gao, X.; Ding, M.Y. Improving the mechanical properties of fly ash-based geopolymer composites with PVA fiber and powder. Materials 2022, 15, 2363. [Google Scholar] [CrossRef] [PubMed]
  28. Liu, J.; Lv, C. Properties of 3D-printed polymer fiber-reinforced mortars: A review. Polymers 2022, 14, 1315. [Google Scholar] [CrossRef] [PubMed]
  29. Nematollahi, B.; Xia, M.; Sanjayan, J.; Vijay, P. Effect of type of fiber on inter-layer bond and flexural strengths of extrusion-based 3D printed geopolymer. Mater. Sci. Forum 2018, 939, 155–162. [Google Scholar] [CrossRef]
  30. Li, S. Research on the Properties of Fiber Reinforced Engineered Geopolymer Spray Composite. Master’s Thesis, China University of Mining and Technology, Xuzhou, China, 2019. (In Chinese with English Abstract). [Google Scholar]
  31. Ohno, M.; Li, V.C. A feasibility study of strain hardening fiber reinforced fly ash-based geopolymer composites. Constr. Build. Mater. 2014, 57, 163–168. [Google Scholar] [CrossRef]
  32. Zhang, Y.S.; Sun, W.; Li, Z.J.; Zhou, X.M.; Eddie; Chau, C.K. Impact properties of geopolymer based extrudates incorporated with fly ash and PVA short fiber. Constr. Build. Mater. 2008, 22, 370–383. [Google Scholar] [CrossRef]
  33. Bong, S.H.; Nematollahi, B.; Xia, M.; Nazari, A.; Sanjayan, J.; Pan, J. Properties of 3D-printable ductile fibre-reinforced geopolymer composite for digital construction applications. In Rheology and Processing of Construction Materials; Mechtchrine, V., Khayat, K., Secrieru, E., Eds.; Springer: Cham, Switzerland, 2020; Volume 23, pp. 363–372. [Google Scholar] [CrossRef]
  34. Nerella, V.N.; Nather, M.; Iqbal, A.; Butler, M.; Mechtcherine, V. Inline quantification of extrudability of cementitious materials for digital construction. Cem. Concr. Compos. 2019, 95, 260–270. [Google Scholar] [CrossRef]
  35. Liu, G.M.; Cheng, W.M.; Chen, L.J.; Pan, G.; Liu, Z.X. Rheological properties of fresh concrete and its application on shotcrete. Constr. Build. Mater. 2020, 243, 118180. [Google Scholar] [CrossRef]
  36. Wang, L.; Hu, Y.Y.; Wang, Q.; Cui, T.L. Shrinkage and cracking performance of PP/PVA fiber-reinforced 3D-printed mortar. J. Mater. Civ. Eng. 2023, 35, 04023132. [Google Scholar] [CrossRef]
  37. Pham, L.; Panda, B.; Tran, P. Fresh and hardened properties of 3D printable polymer-fibre-reinforced high-performance cementitious composite. Adv. Cem. Res. 2022, 34, 80–92. [Google Scholar] [CrossRef]
  38. Tian, W.; Zhang, X.D.; Zhang, L.; Xiao, Y.Q.; Yu, C. Yizhong Gaodiwen Suidaoyong Gaoqiang Penshe Hunningtu Jiqi Zhibei Fangfa (A High-Strength Shotcrete for High Geo-thermal Tunnels and Its Preparation Method). CN201910892544.6, 27 November 2020. (In Chinese). Available online: https://kns.cnki.net/kcms2/article/abstract?v=3IEynGI71r8K7SXxdAs8kNN2xCCkrwKRtBuMzVeIpnlv8gf2m-qByvTjwnYmdD-cX7Oyb9ZaKARp84vK0EKs0dMAuClHvfo3r_3ae0hlvhjAVKaL0OiUrPqgNBRwkvrVZjUIA4YQR3I=&uniplatform=NZKPT&language=CHS (accessed on 20 January 2024).
  39. Ma, G.W.; Li, Z.J.; Wang, L. Printable properties of cementitious material containing copper tailings for extrusion based 3D printing. Constr. Build. Mater. 2018, 162, 613–627. [Google Scholar] [CrossRef]
  40. Korniejenko, K.; Lach, M. Geopolymers reinforced by short and long fibres—Innovative materials for additive manufacturing. Curr. Opin. Chem. Eng. 2020, 28, 167–172. [Google Scholar] [CrossRef]
  41. Guo, X.L.; Xiong, G.Y. Preparation and performance of ultra-high toughness fly ash based geopolymer. J. Build. Mater. 2019, 22, 949–956. (In Chinese) [Google Scholar]
  42. ISO 6892-1; Metallic Materials–Tensile Testing–Part 1: Method of Test at Room Temperature. ISO: Geneva, Switzerland, 2019.
  43. ISO 679; Cement–Test Methods–Determination of Strength. ISO: Geneva, Switzerland, 2009.
  44. GB/T 7897-2008; Test Methods of Mechanical Properties of Mortar for Ferrocement. AQSIQ: Beijing, China, 2008. (In Chinese)
  45. Zhang, P.; Han, X.; Zheng, Y.X.; Wan, J.Y.; Hui, D. Effect of PVA fiber on mechanical properties of fly ash-based geopolymer concrete. Rev. Adv. Mater. Sci. 2021, 60, 418–437. [Google Scholar] [CrossRef]
  46. Xu, S.T.; Wu, C.F.; Yue, J.C.; Xu, Z.K. Shrinkage and mechanical properties of fibre-reinforced blast furnace slag-steel slag-based geopolymer. Adv. Civ. Eng. 2022, 2022, 8931401. [Google Scholar] [CrossRef]
  47. Zhang, P.; Wang, C.; Guo, Z.H.; Hong, J.; Wang, F. Effect of polyvinyl alcohol fibers on mechanical properties of nano-SiO2-reinforced geopolymer composites under a complex environment. Nanotechnol. Rev. 2023, 12, 20230142. [Google Scholar] [CrossRef]
  48. Rossi, L.; Patel, R.A.; Dehn, F. Compressive behaviour of alkali-activated slag-based concrete and Portland cement concrete incorporating novel multiple hooked-end steel fibres. Mater. Struct. 2023, 56, 96. [Google Scholar] [CrossRef]
  49. Li, L.H.; Li, B.X.; Wang, Z.W.; Zhang, Z.B.; Alselwi, O. Effects of hybrid PVA-steel fibers on the mechanical performance of high-ductility cementitious composites. Buildings 2022, 12, 1934. [Google Scholar] [CrossRef]
  50. Zhang, H.M.; Hu, F.; Duan, Y.F.; Yang, J.Q.; Duan, Z.T.; Cao, L.N. Interaction mechanism of cementitious composites containing different twisted PVA fiber bundles. Buildings 2023, 13, 2194. [Google Scholar] [CrossRef]
  51. Malathy, R.; Sentilkumar, S.R.R.; Prakash, A.R.; Das, B.B.; Chung, I.M.; Kim, S.H.; Prabakaran, M. Use of industrial silica sand as a fine aggregate in concrete-an explorative study. Buildings 2022, 12, 1273. [Google Scholar] [CrossRef]
  52. Shi, C.J.; Wu, Z.M.; Xiao, J.F.; Wang, D.H.; Huang, Z.Y.; Fang, Z. A review on ultra high performance concrete: Part I. Raw materials and mixture design. Constr. Build. Mater. 2015, 101, 741–751. [Google Scholar] [CrossRef]
  53. Curosu, I.; Muja, E.; Ismailov, M.; Ahmed, A.H.; Liebscher, M.; Mechtcherine, V. An experimental-analytical scale-linking study on the crack-bridging mechanisms in different types of SHCC in dependence on fiber orientation. Cem. Concr. Res. 2022, 152, 106650. [Google Scholar] [CrossRef]
Figure 1. Preparation process of specimens.
Buildings 14 00449 g001
Figure 2. Dimensions of the dog-bone mold (mm).
Buildings 14 00449 g002
Figure 3. Loading devices: (a) INSTRON-3343 single-column table frame material testing machine; (b) INSTRON-8802 electro-hydraulic servo fatigue testing machine; (c) YAW-3000G electro-hydraulic servo testing machine; (d) DY-208MC full-automatic pressure testing machine (left side for bending test and right side for post-bending compressive test).
Buildings 14 00449 g003
Figure 4. Tensile test results: (a) final morphology after tensile test for dog-bone specimens (fracture area highlighted in blue circle); (b) post-failure cross section (PVA fibers highlighted in yellow circle); (c) average stress–strain curves for four different conditions.
Buildings 14 00449 g004
Figure 5. Stress–strain curves of prism compressive test for specimens: (a) without fiber; (b) with 0.1% fiber; (c) with 0.15% fiber; (d) with 0.2% fiber.
Buildings 14 00449 g005
Figure 6. Final morphology after prism compressive test for specimens: (a) without fiber; (b) with 0.1% fiber; (c) with 0.15% fiber; (d) with 0.2% fiber.
Buildings 14 00449 g006
Figure 7. Schematic of compressive toughness calculation.
Buildings 14 00449 g007
Figure 8. ESEM images and EDX charts. ESEM image of (a) slag powder; (b) fly ash; (c) quartz sand; (d) silica fume. EDX chart of (e) slag powder; (f) fly ash; (g) quartz sand; (h) silica fume.
Buildings 14 00449 g008
Figure 9. ESEM images of PVA fiber-reinforced slag and fly ash-based geopolymer at different dosages: (a) 0.1%; (b) Enlarged image of fiber rupture; (c) 0.15%; (d) 0.2%.
Buildings 14 00449 g009
Table 1. Material properties of the PVA fiber.
Length (mm) Diameter   ( μ m )Density (g/cm3)Slenderness (dtex/1000f)
6171.292000
Table 2. Mix proportions of the geopolymer (kg/m3).
Slag PowderFly AshQuartz SandSilica FumeAqueous Sodium Silicate SolutionSodium HydroxidePVA FiberWater
80.2641.6962.480.2270.824.30104.3
80.2641.6962.480.2270.824.31.29 (0.1%)104.3
80.2641.6962.480.2270.824.31.935 (0.15%)104.3
80.2641.6962.480.2270.824.32.58 (0.2%)104.3
Table 4. Mechanical properties of PVA fiber investigated through eight parallel tensile tests.
No.Breaking Elongation (%)Breaking Strength (cN/dtex)Initial Modulus (cN/dtex)
17.109.5887.45
28.009.6974.80
37.208.9384.64
46.7010.05108.06
56.7010.89105.11
67.2010.6089.62
77.8011.2387.21
88.0011.2277.89
Average7.3410.2789.35
c v s (%)7.288.2013.19
Table 5. Cubic compressive strength of slag and fly ash-based geopolymer composites.
SpecimensAverage 3d Cubic Compressive Strength (MPa)Average 28d Cubic Compressive Strength (MPa)3d/28d Strength Ratio (%)
C-1-(1–3)21.08-44.21
C-1-(4–9)-47.68
C-2-(1–3)21.66-44.10
C-2-(4–9)-49.12
C-3-(1–3)22.04-44.04
C-3-(4–9)-50.04
C-4-(1–3)21.04-44.24
C-4-(4–9)-47.56
Table 6. Bending and post-bending compressive strength of slag and fly ash-based geopolymer composites.
SpecimensBending Strength (MPa)Post-Bending Compressive Strength (MPa)Bending Compressive Ratio
P-1-15.955.00.107
P-1-25.650.60.111
P-1-35.755.00.104
P-1-45.653.10.105
Average5.7053.430.107
c v p (%)2.153.382.51
P-2-16.052.90.113
P-2-26.253.80.115
P-2-36.155.20.111
P-2-46.255.60.112
Average6.1354.380.113
c v p %)1.351.991.31
P-3-16.555.50.117
P-3-26.456.00.114
P-3-36.356.20.112
P-3-46.455.60.115
Average6.4055.830.115
c v p (%)1.100.511.57
P-4-15.954.50.108
P-4-25.651.00.110
P-4-35.550.80.108
P-4-46.055.00.109
Average5.7552.830.109
c v p (%)3.593.660.76
Table 7. Prism compressive peak stress and peak strain of slag and fly ash-based geopolymer composites.
Specimens σ p (MPa) ε p   ( μ ε )
Test ResultAverage c v p (%)Test ResultAverage c v p (%)
P-1-537.6337.360.453669.543742.071.23
P-1-637.193796.75
P-1-737.253750.38
P-1-837.383751.59
P-2-539.2538.411.974386.104517.643.74
P-2-637.254616.26
P-2-738.884325.90
P-2-838.254742.30
P-3-538.1939.352.065305.215106.015.90
P-3-639.004861.03
P-3-739.945490.74
P-3-840.254767.08
P-4-636.8836.820.183782.453851.361.79
P-4-836.753920.26
Table 8. Characterization of compressive toughness of slag and fly ash-based geopolymer composites.
Specimens σ c (MPa) ε c   ( μ ε ) δ σ δ ε E p (MPa) Δ E c (MPa) η
P-1-524.691867.801.521.960.0840.6080.0243.50
P-1-617.331184.592.153.210.0890.6300.0108.90
P-1-724.441908.941.521.960.0840.6010.0243.50
P-1-821.721624.441.722.310.0850.6060.0184.72
Average22.051646.441.732.360.0860.6110.0195.16
P-2-519.981574.611.962.790.1070.6220.0176.29
P-2-617.061394.112.183.310.1090.6340.0129.08
P-2-717.961328.052.163.260.1070.6360.0128.92
P-2-816.681304.132.293.640.1170.6450.01110.64
Average17.921400.232.153.250.1100.6340.0138.73
P-3-518.641782.552.052.980.1270.6270.0177.47
P-3-616.421229.842.383.950.1250.6590.01210.42
P-3-717.291482.502.313.700.1430.6520.01311.00
P-3-819.601601.742.052.980.1200.6250.0167.50
Average17.991524.162.203.400.1290.6410.0159.10
P-4-624.191925.271.521.960.0840.6020.0243.50
P-4-816.321125.122.253.480.0920.6390.00910.22
Average20.261525.201.892.720.0880.6210.0176.86
Table 9. Modulus of elasticity and Poisson’s ratio of slag and fly ash-based geopolymer composites.
Specimens E (GPa) μ
Test ResultAverage c v p (%)Test ResultAverage c v p (%)
P-1-914.2014.020.910.1830.1843.01
P-1-1013.860.189
P-1-1114.070.175
P-1-1213.950.188
P-2-913.8613.880.890.1620.1653.59
P-2-1014.020.174
P-2-1113.690.166
P-2-1213.950.158
P-3-913.6213.720.550.1580.1582.49
P-3-1013.760.163
P-3-1113.820.152
P-3-1213.690.159
P-4-913.0413.221.250.1640.1713.72
P-4-1013.160.179
P-4-1113.490.176
P-4-1213.190.166
Disclaimer/Publisher’s Note: The statements, opinions and data contained in all publications are solely those of the individual author(s) and contributor(s) and not of MDPI and/or the editor(s). MDPI and/or the editor(s) disclaim responsibility for any injury to people or property resulting from any ideas, methods, instructions or products referred to in the content.

