
Simulation-Based Analysis of Micro-Damage to Recycled Concrete-Containing Brick Coarse Aggregates
Abstract
:1. Introduction
2. Experiments
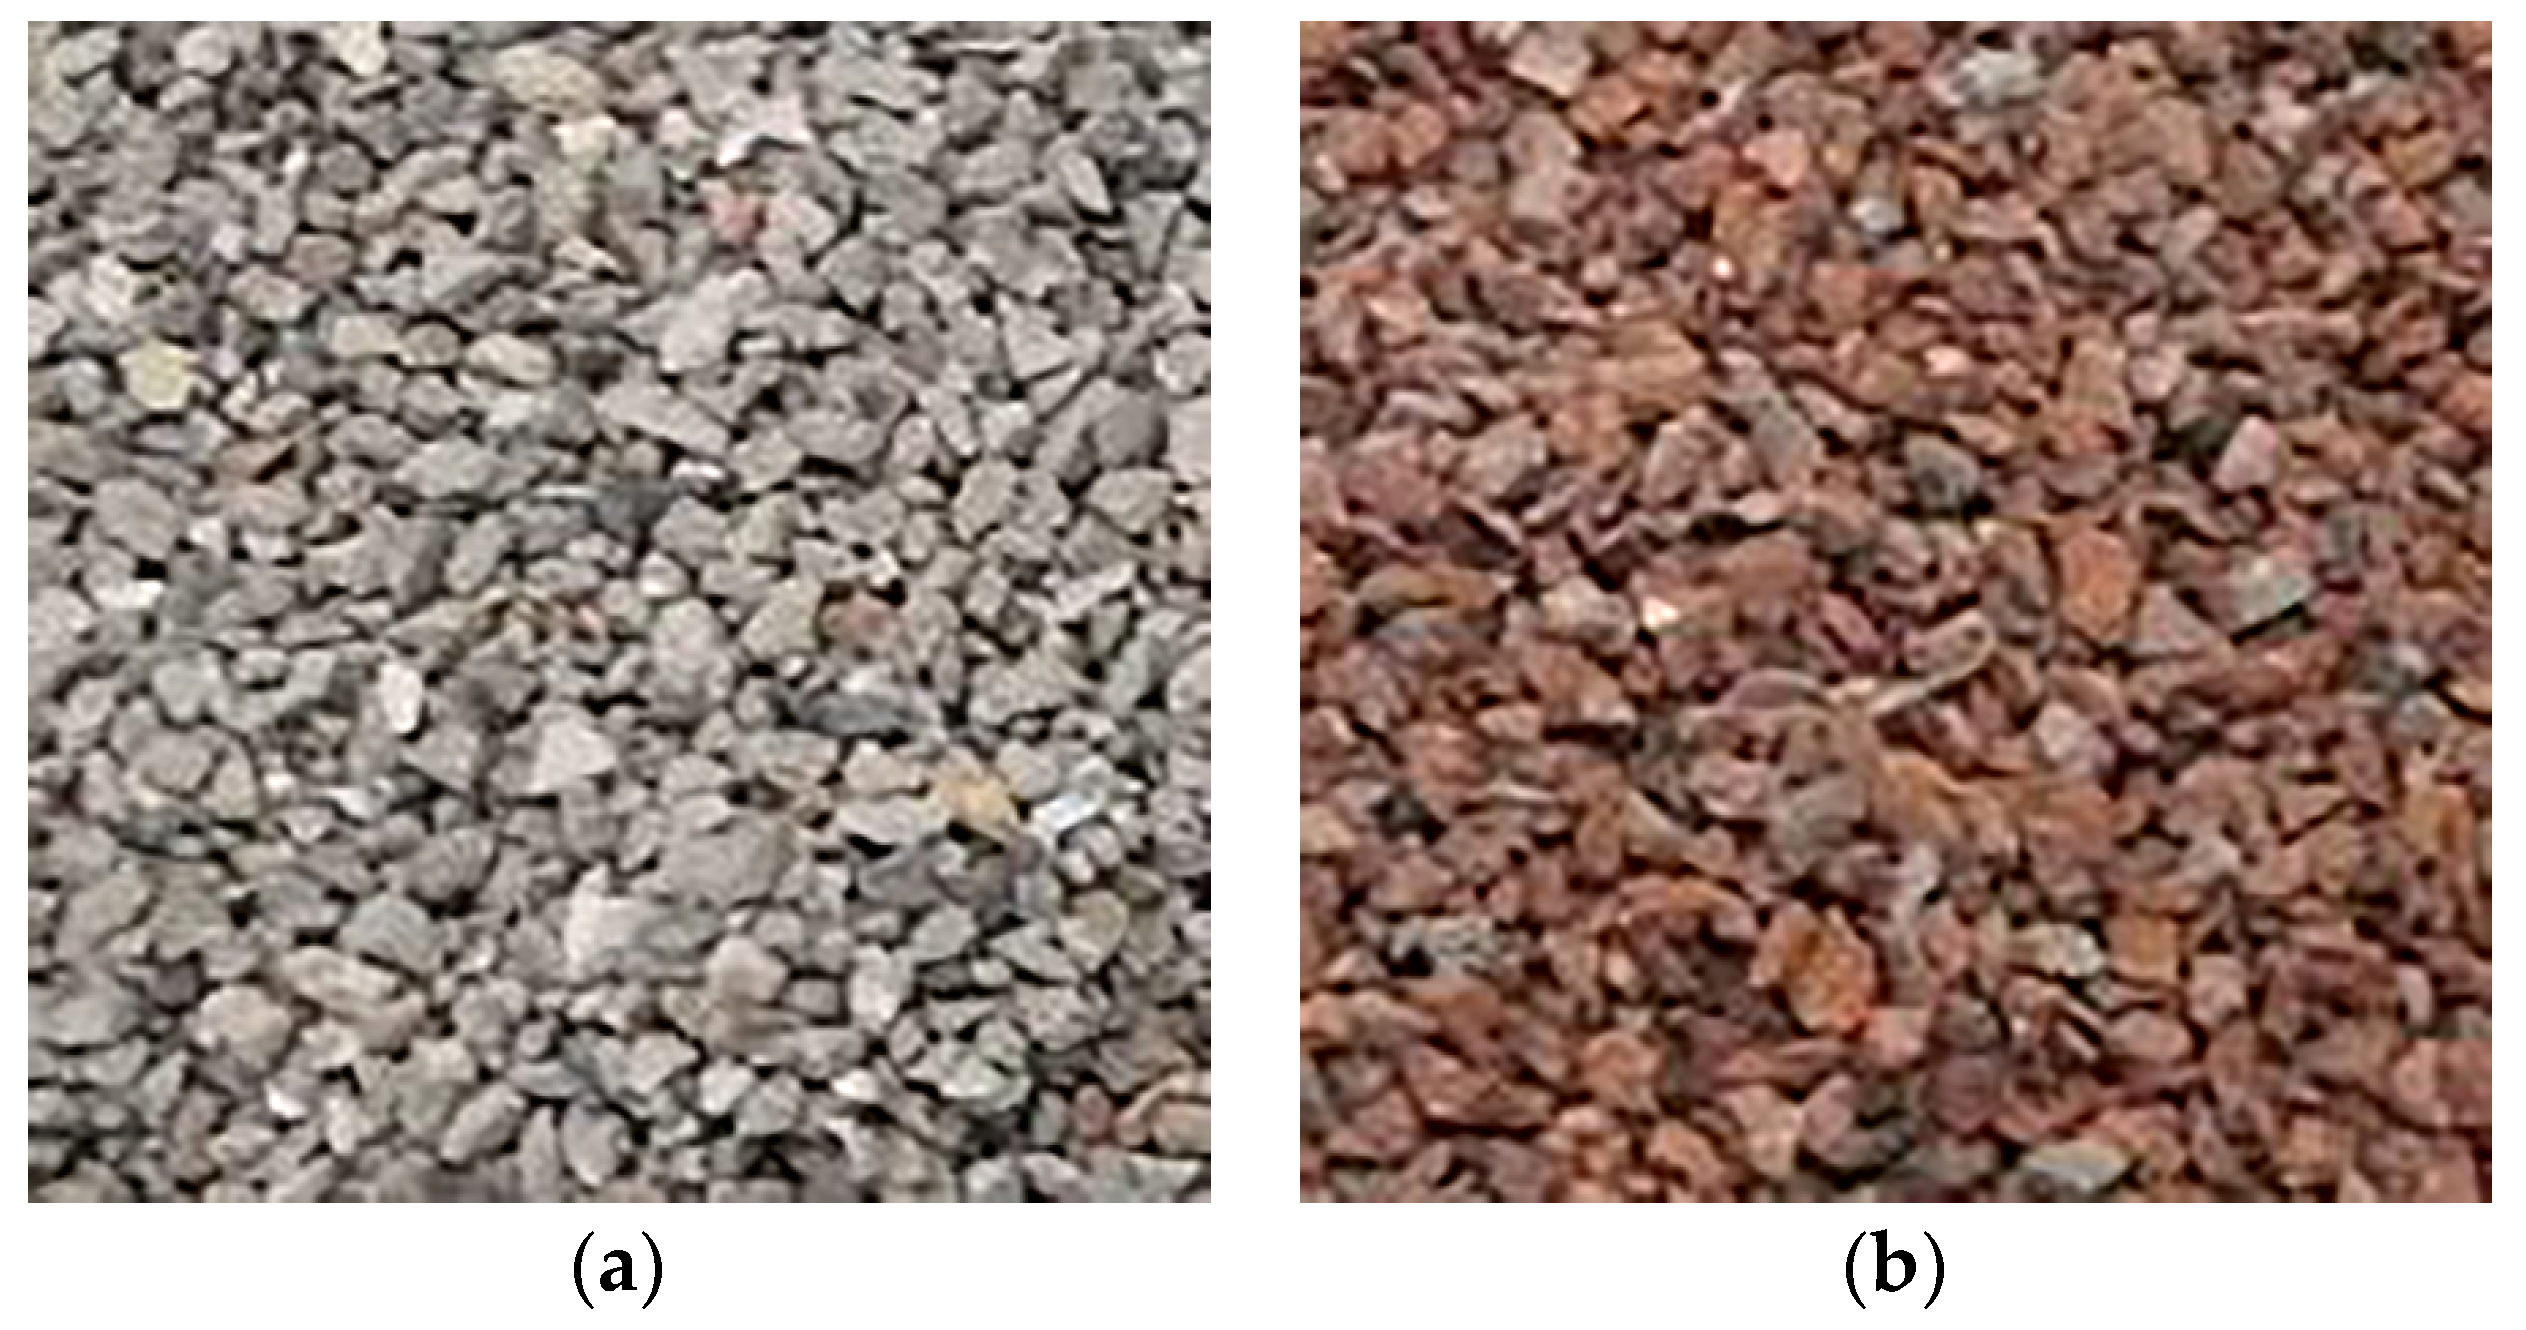
2.1. Materials
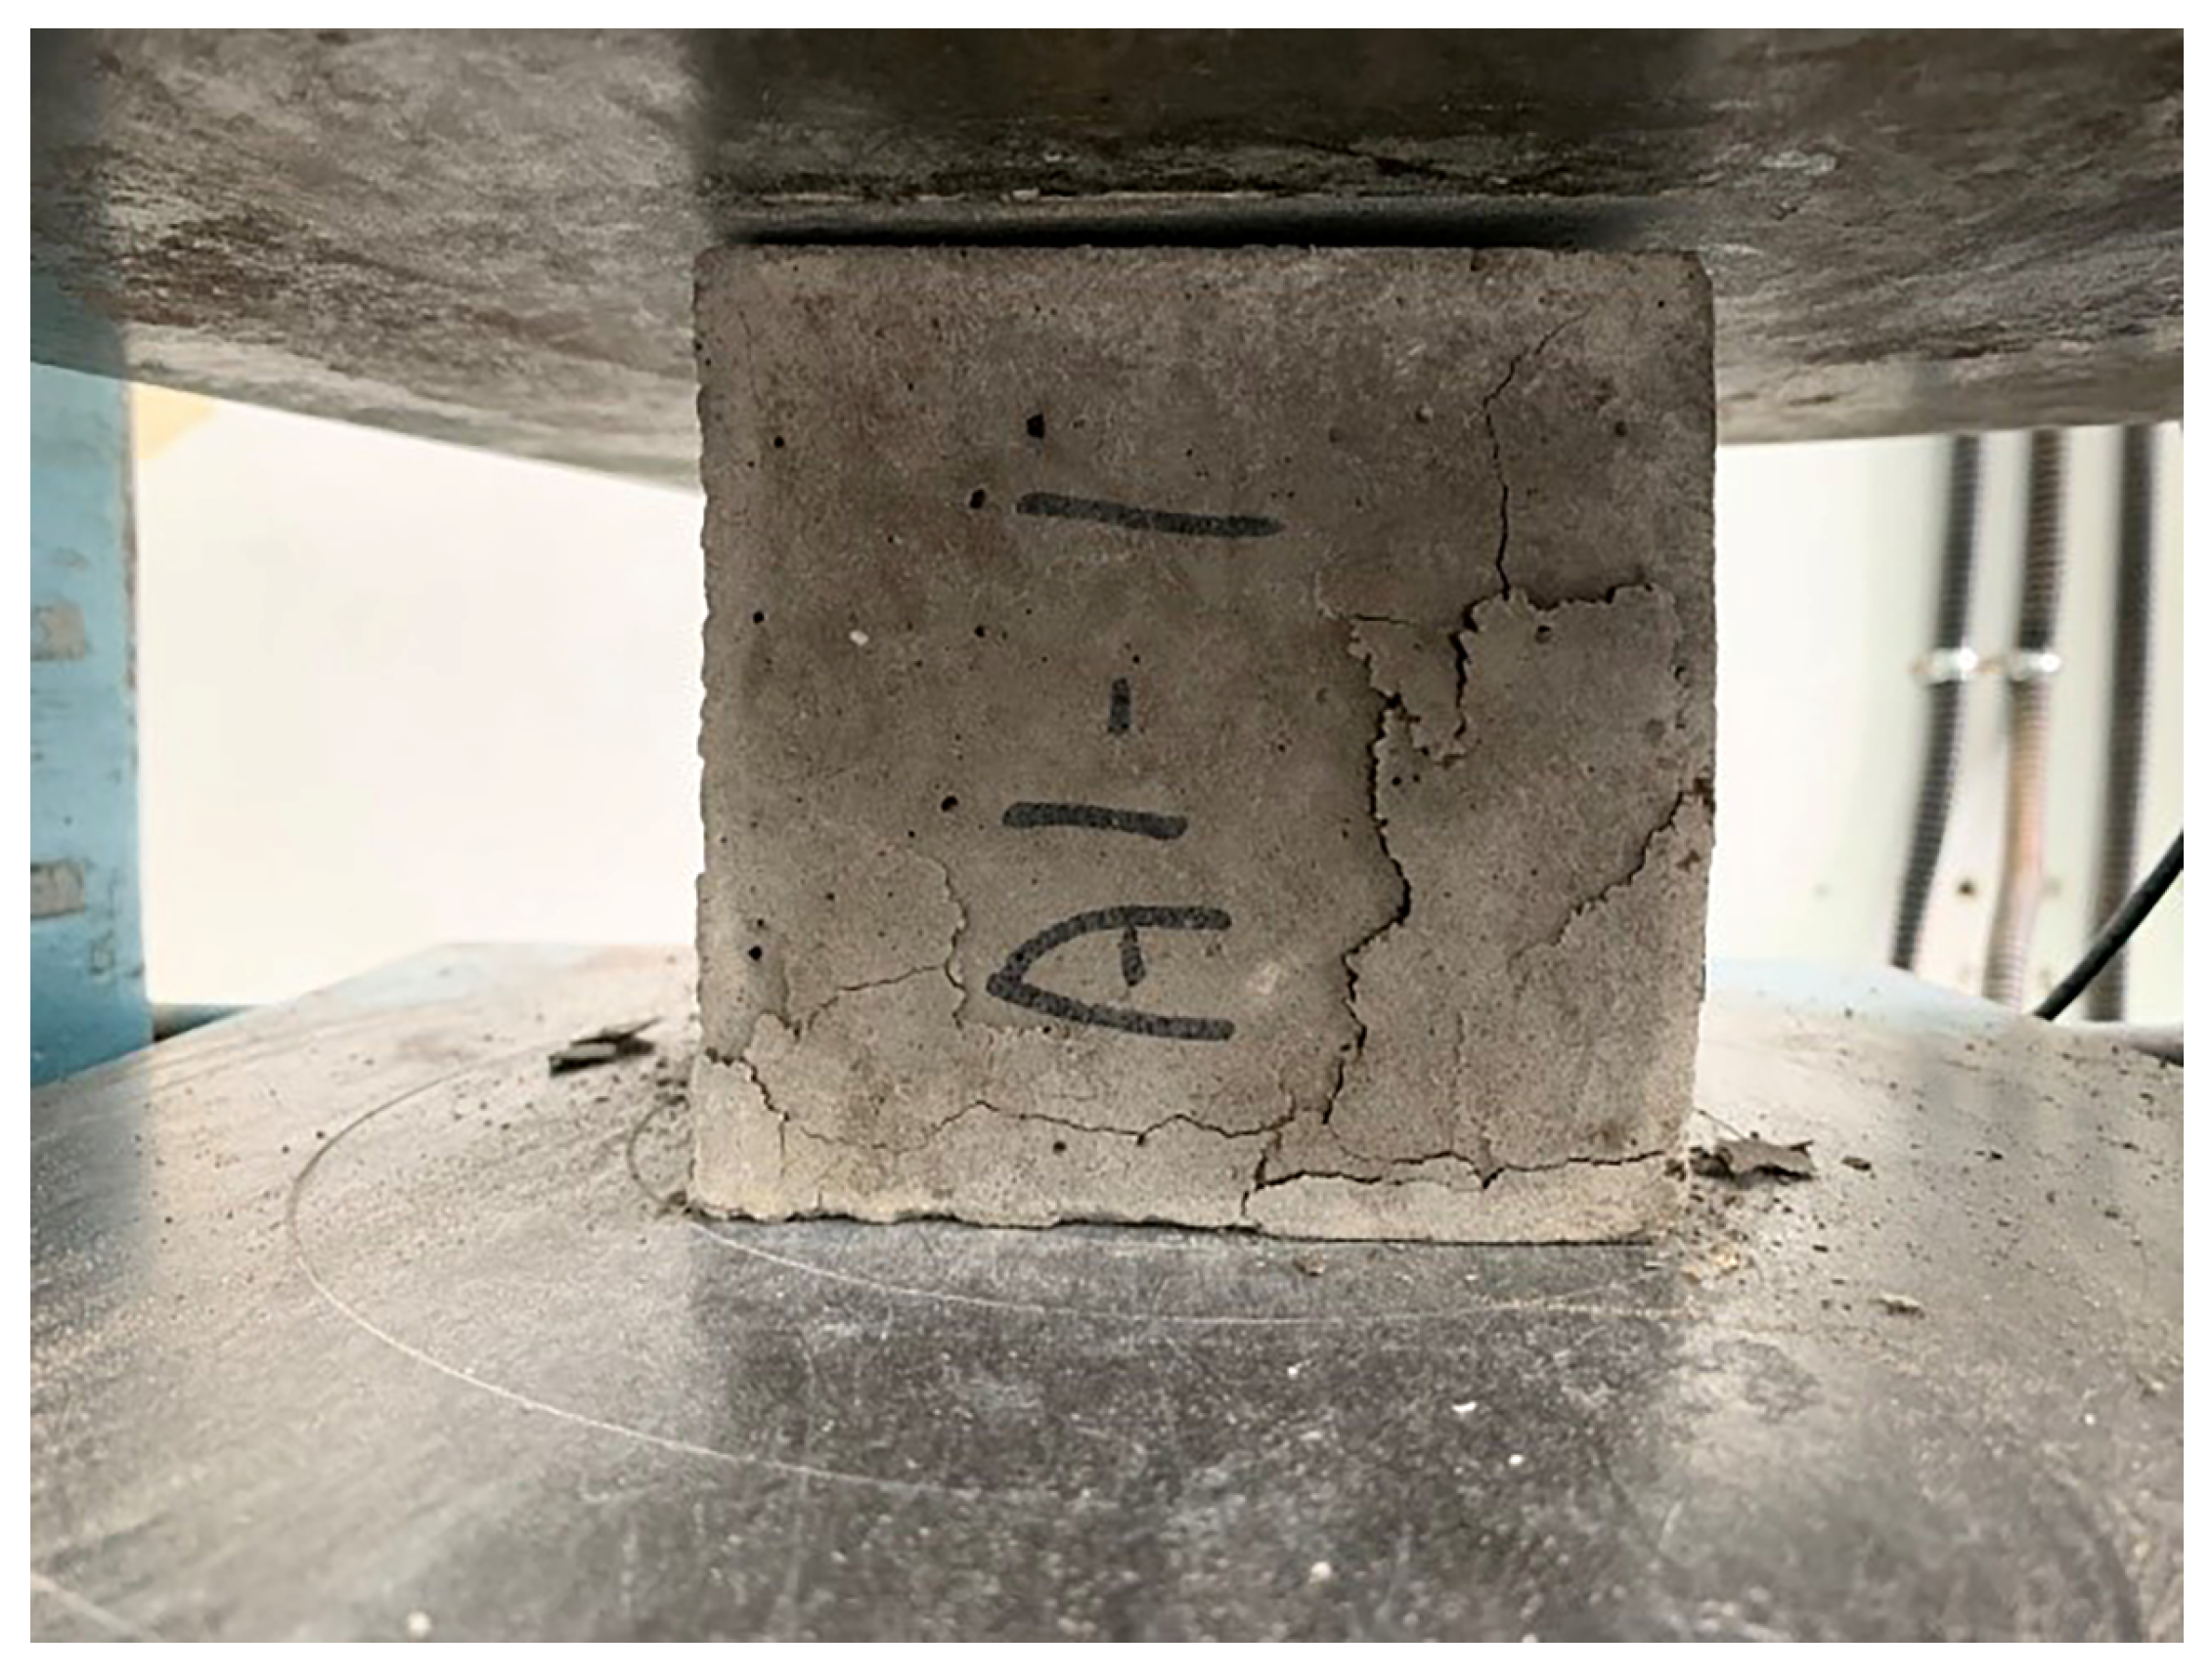
2.2. Test Method
3. Two-Dimensional Random Aggregate Model for RC
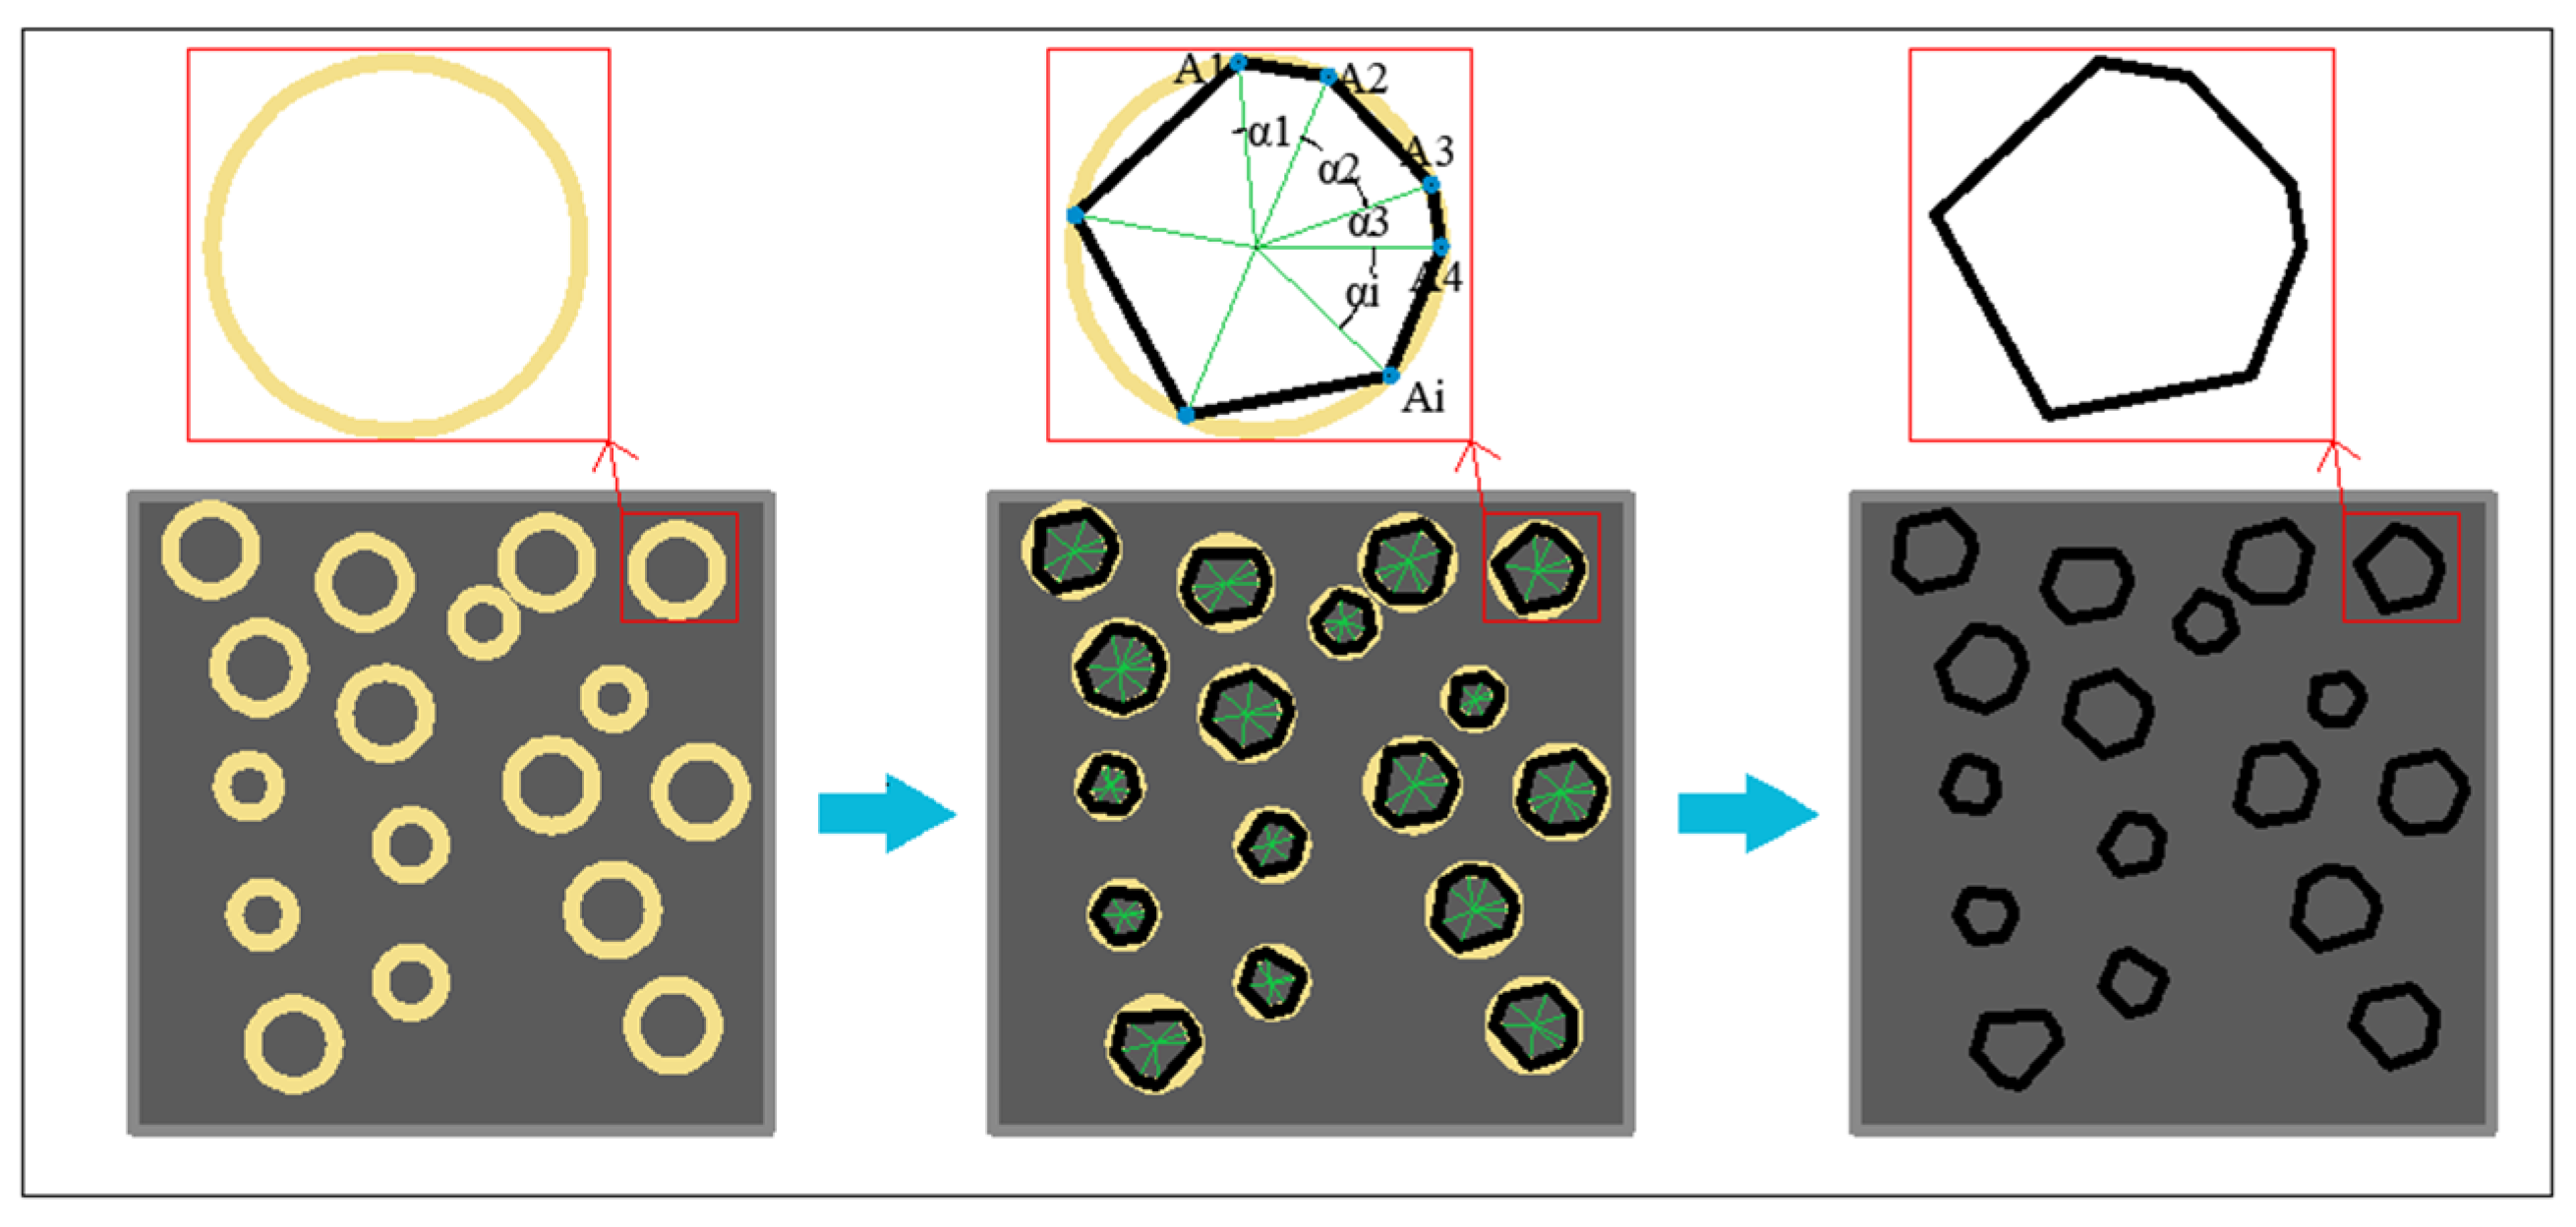
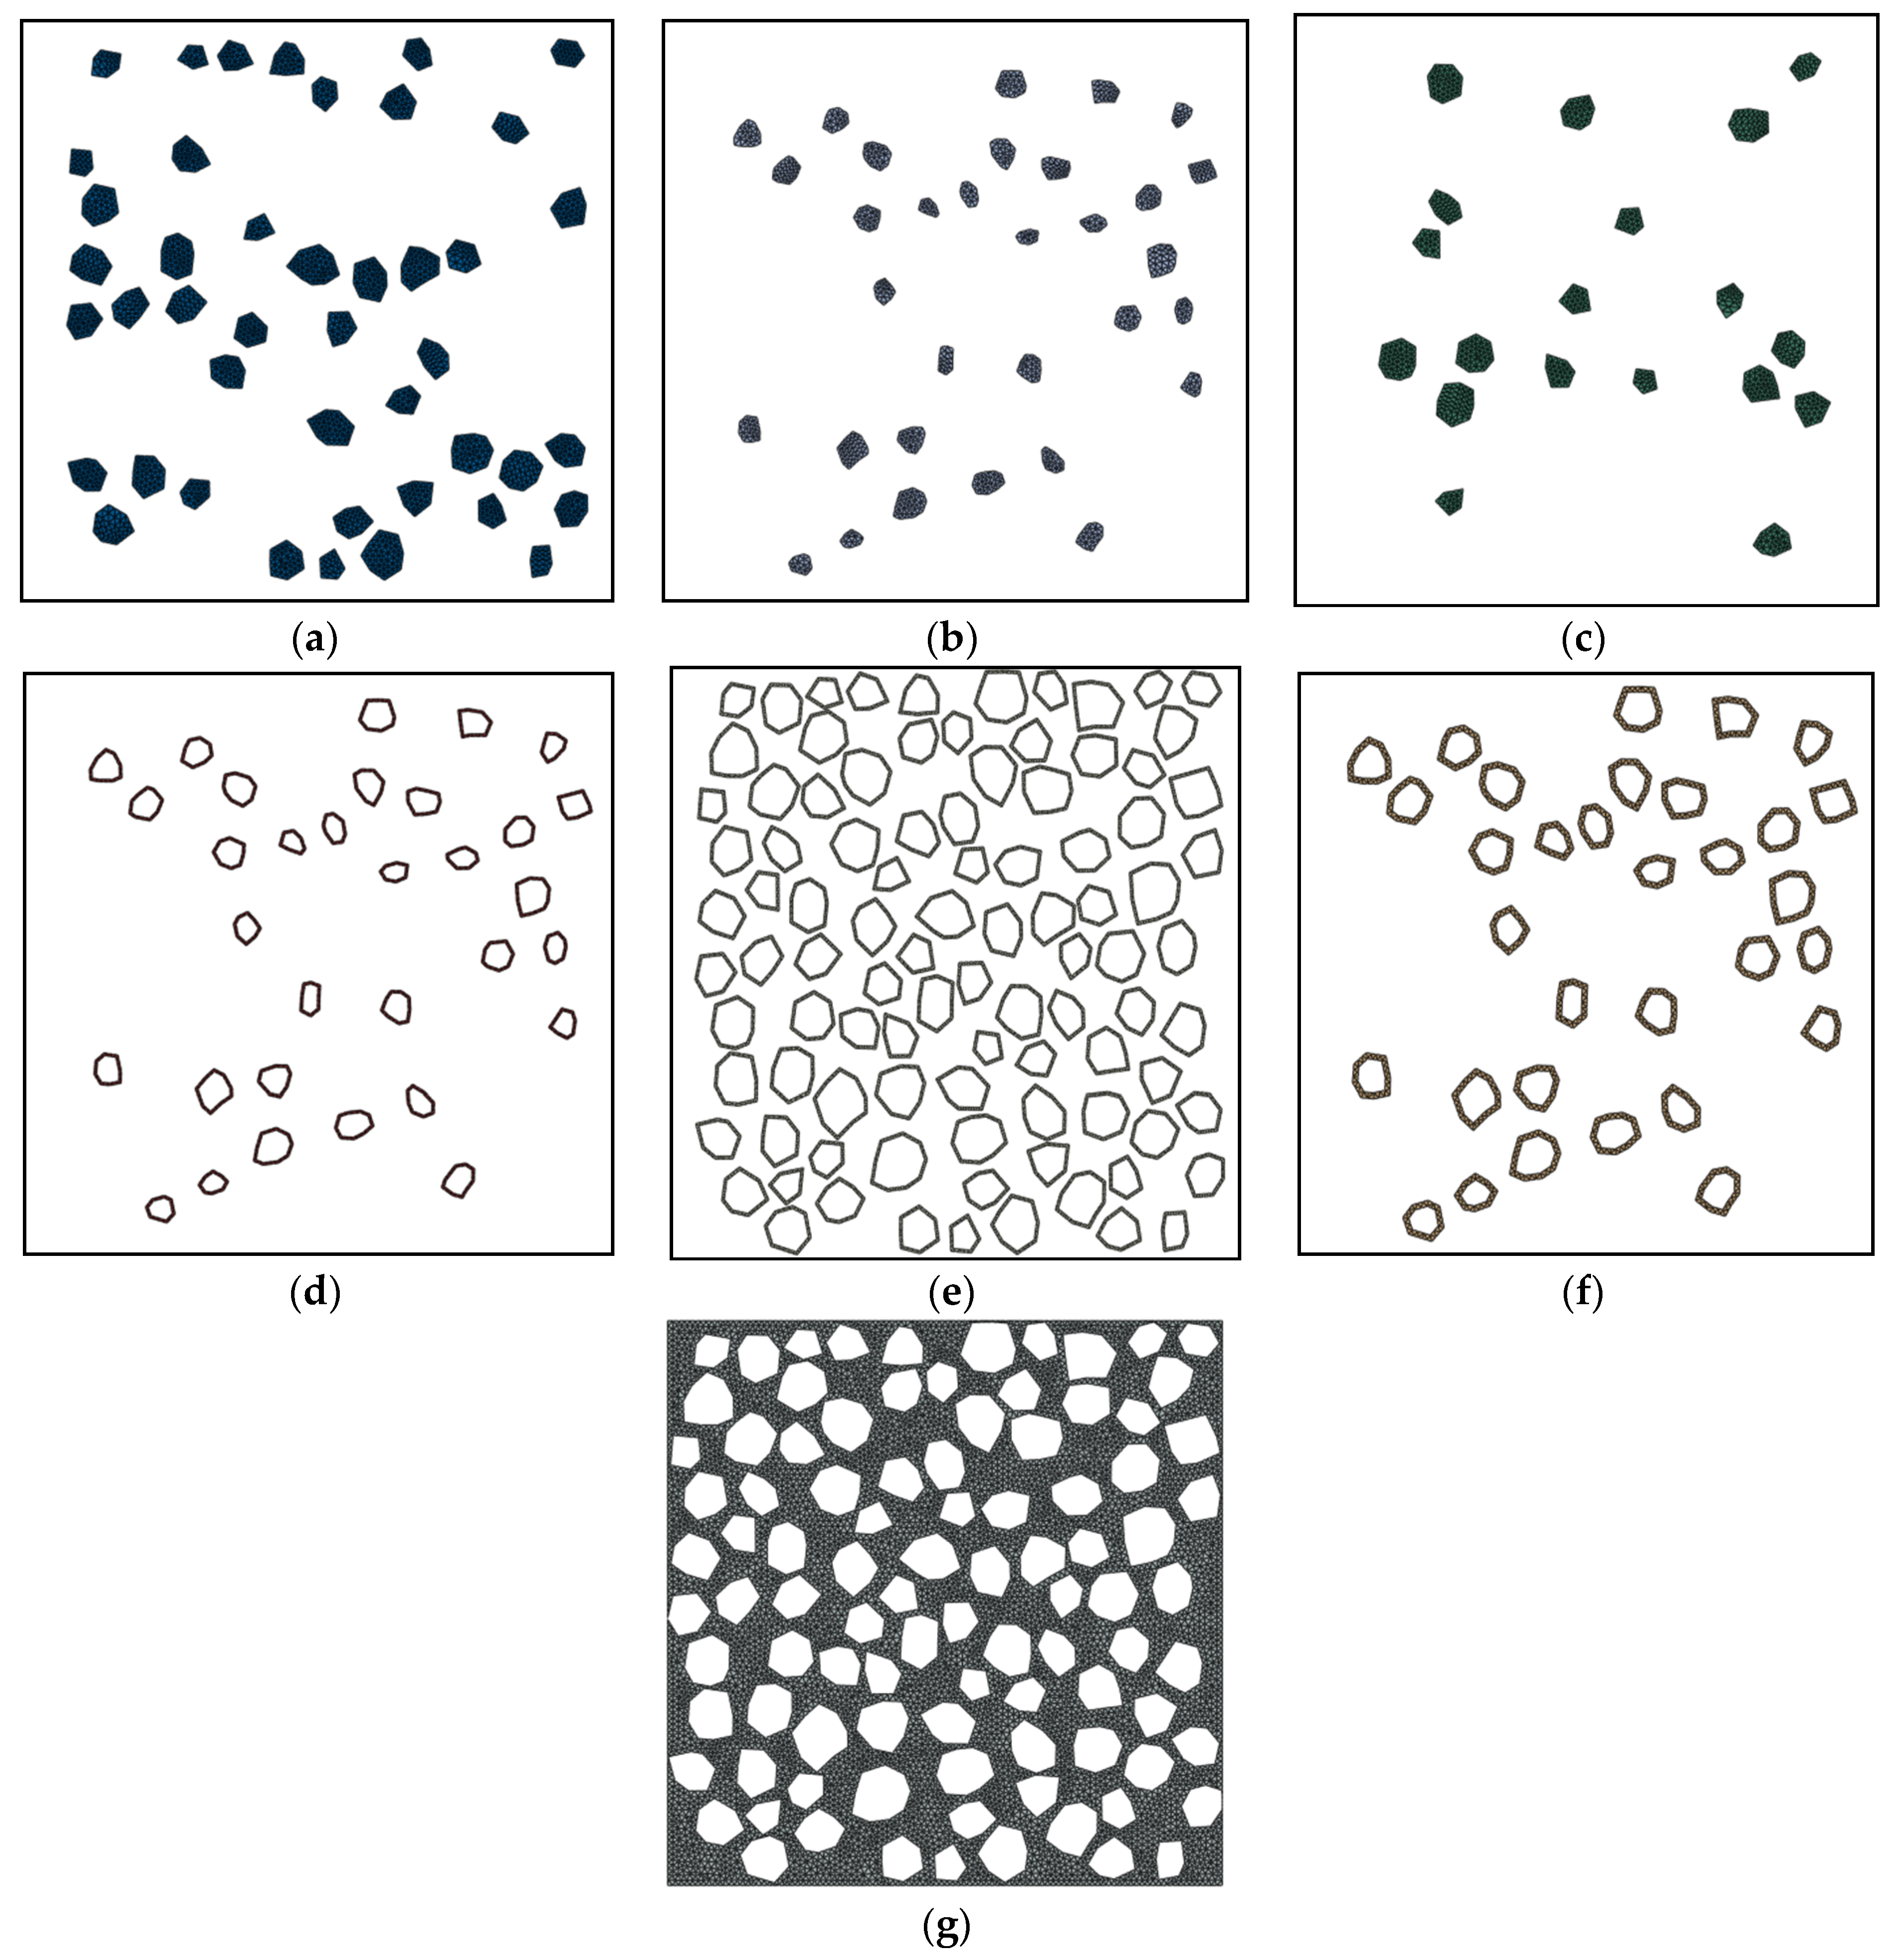
3.1. Random Aggregate Model Based on the Monte Carlo Method
3.2. Aggregate Generation
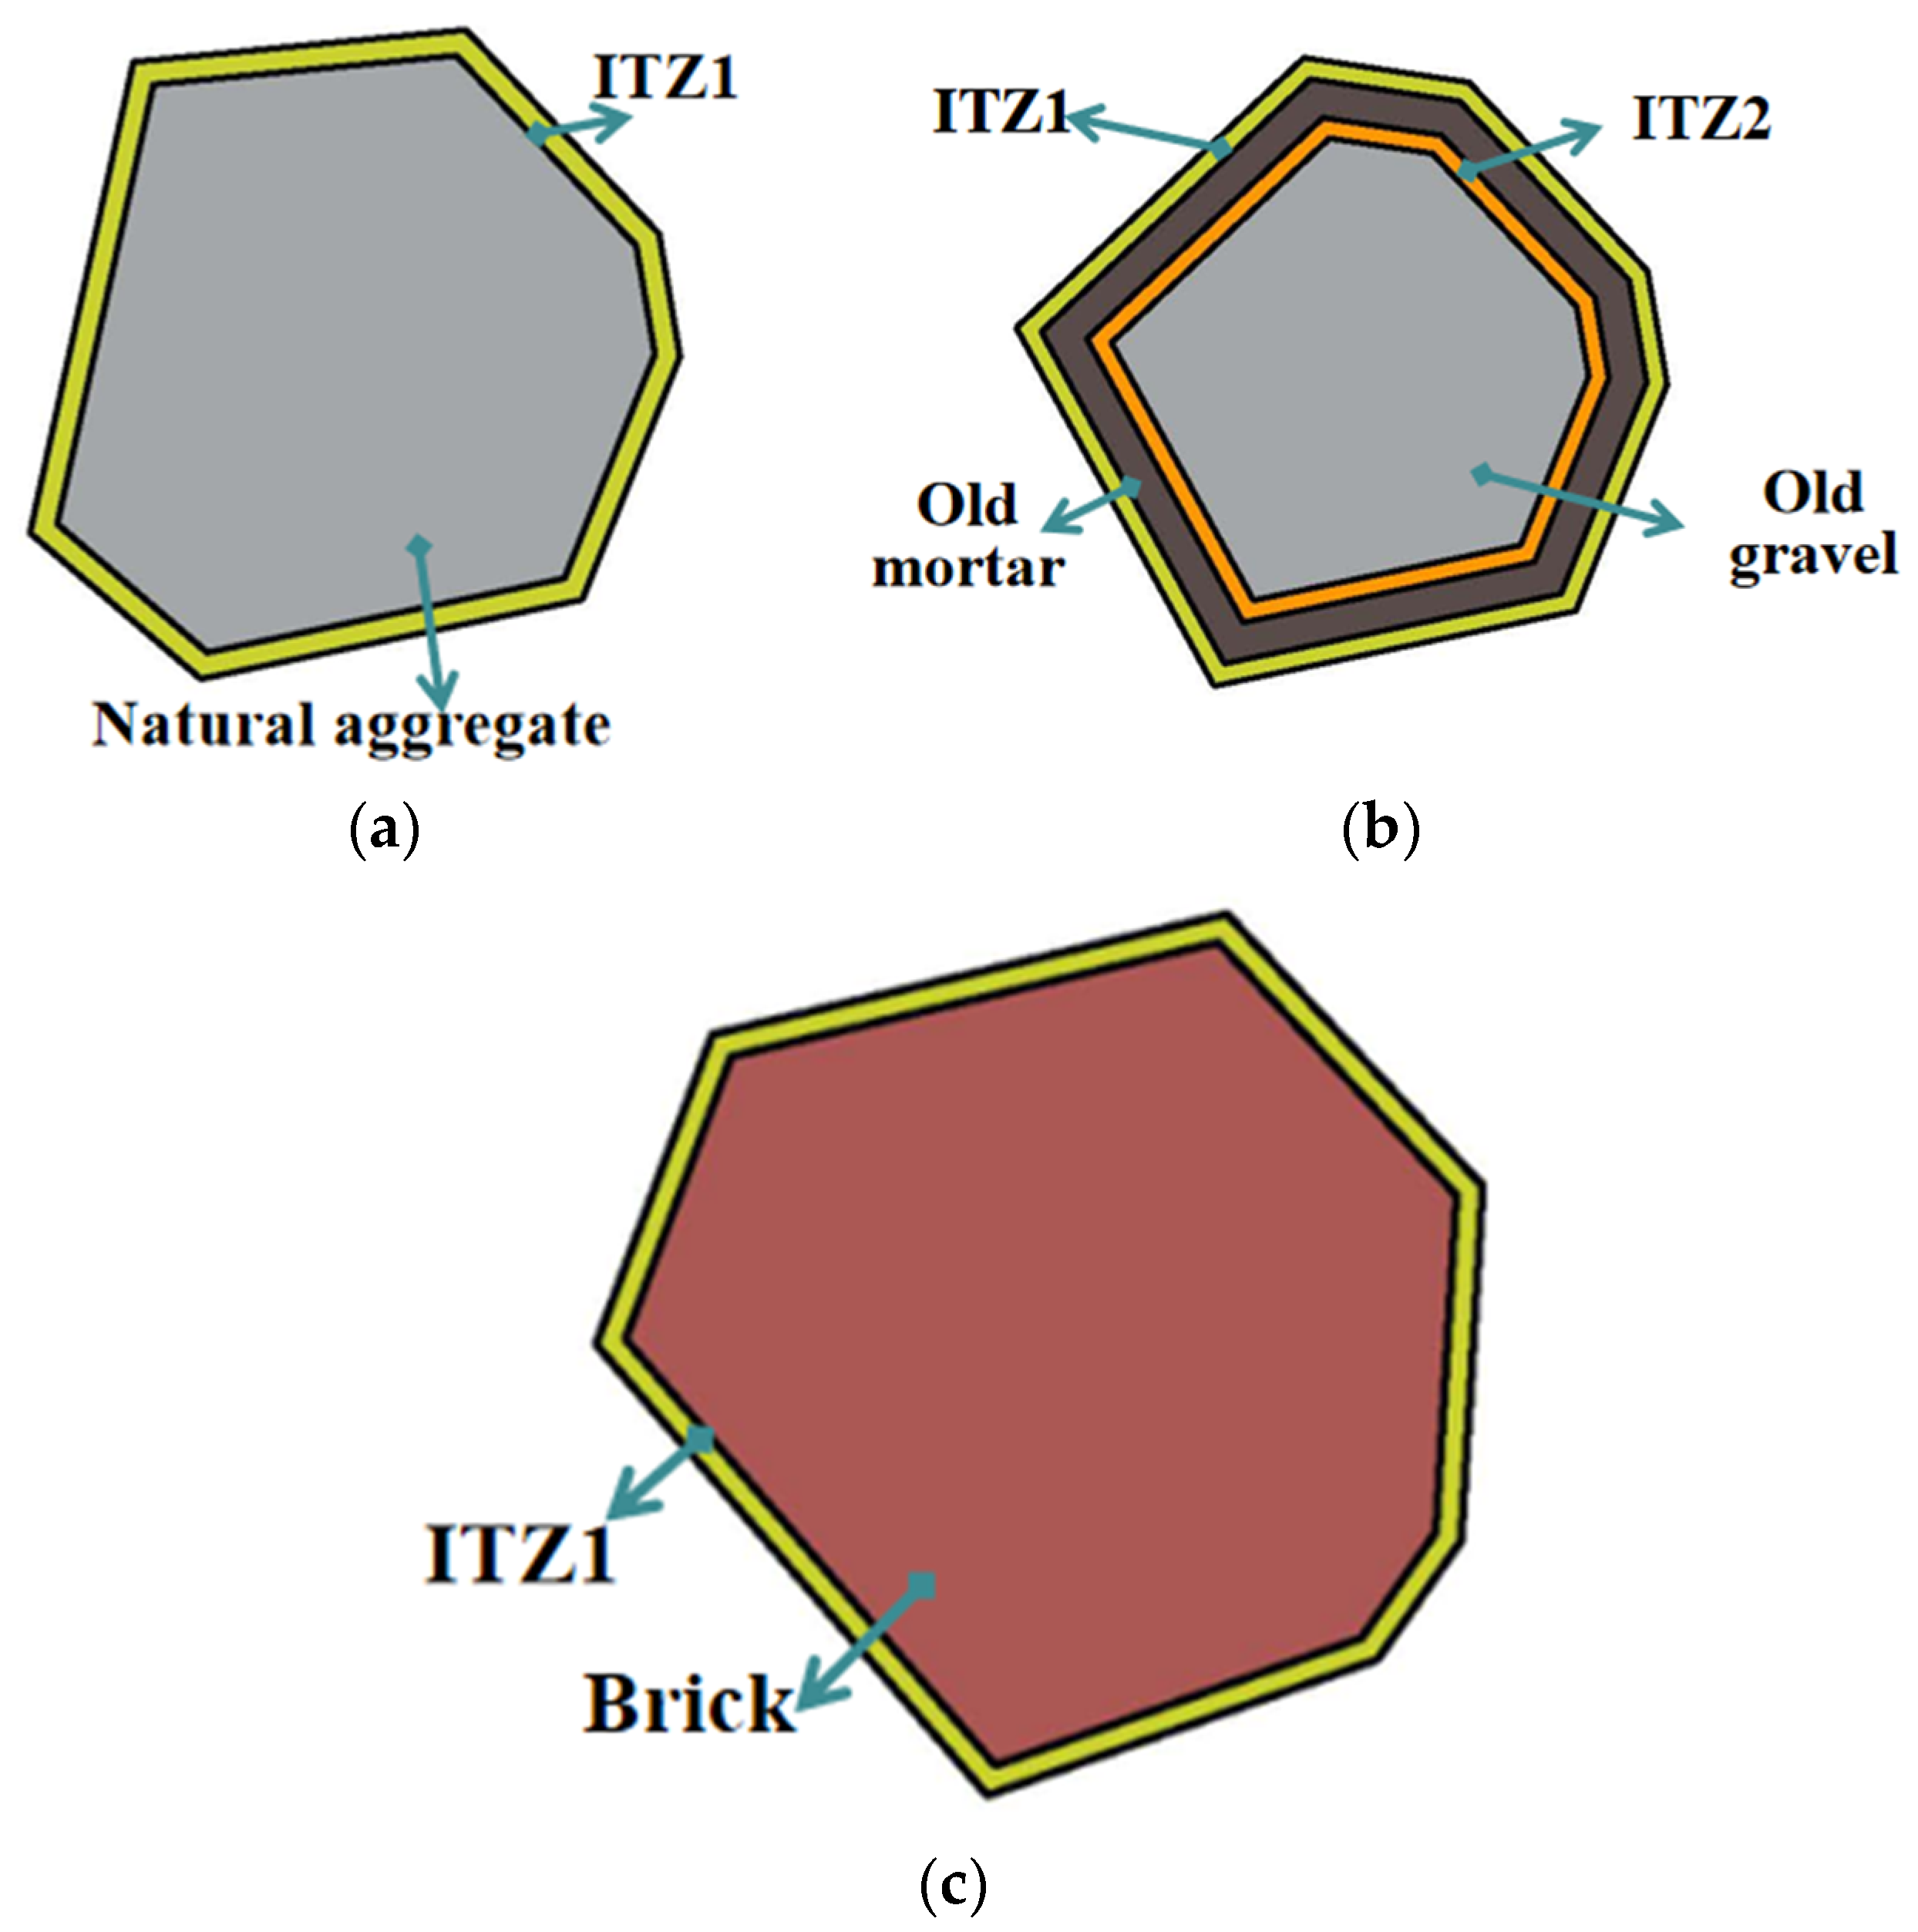
3.3. ITZ Generation
4. Determination of Constitutive Model Equation and Related Parameters
4.1. Constitutive Model for Concrete Damage
4.2. Determination of Material Parameters
4.3. Model Pre-processing and Grid Partitioning
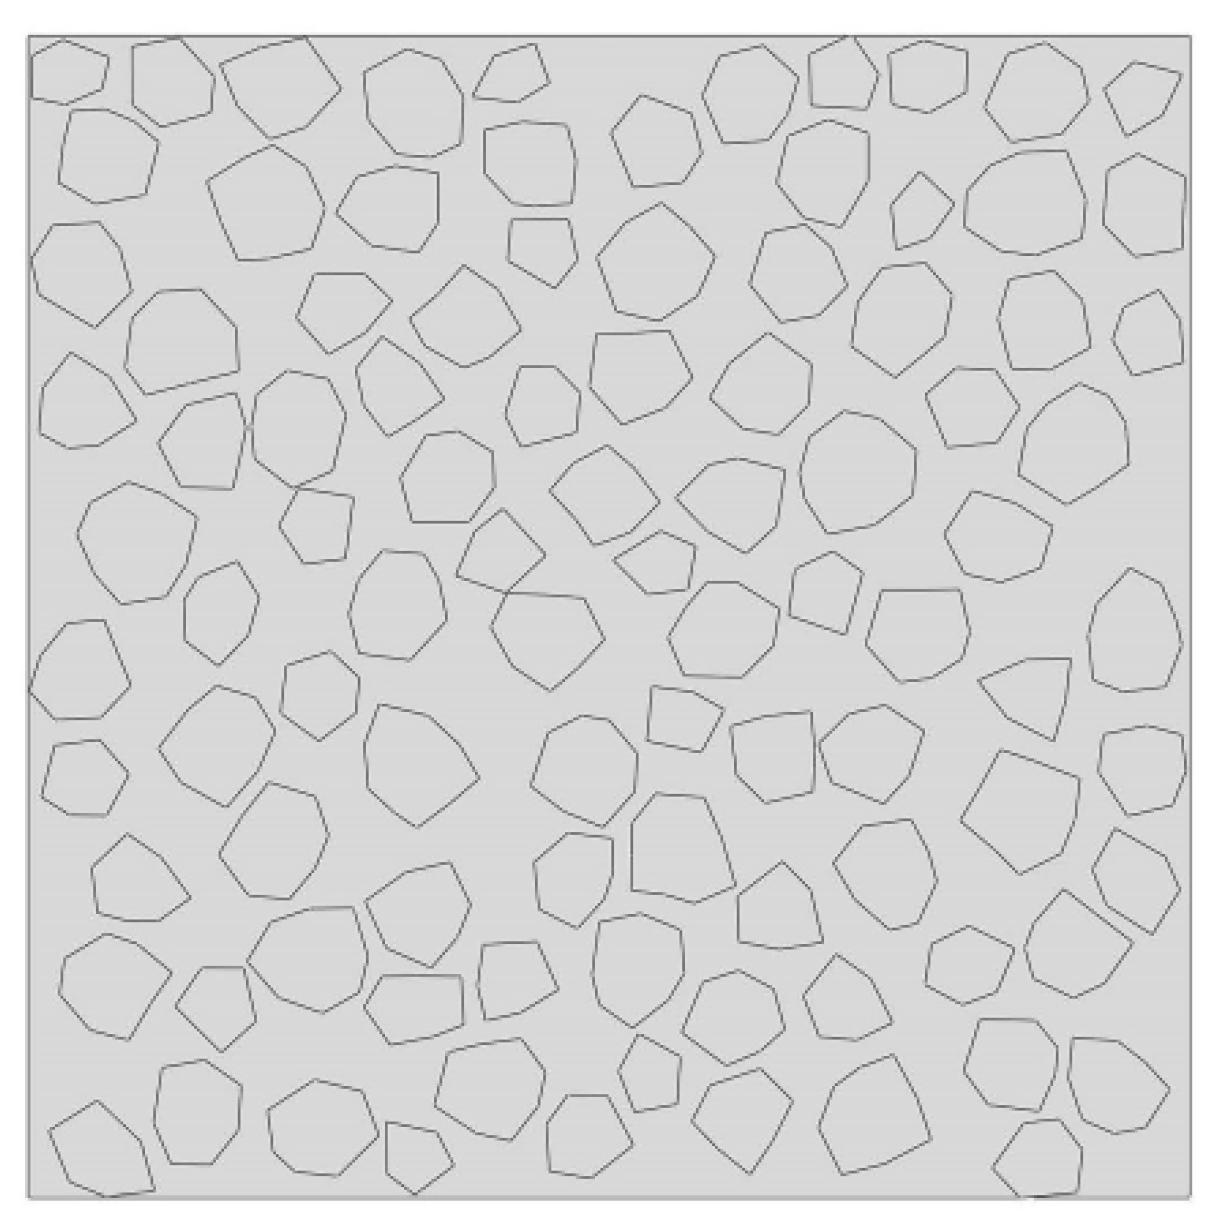
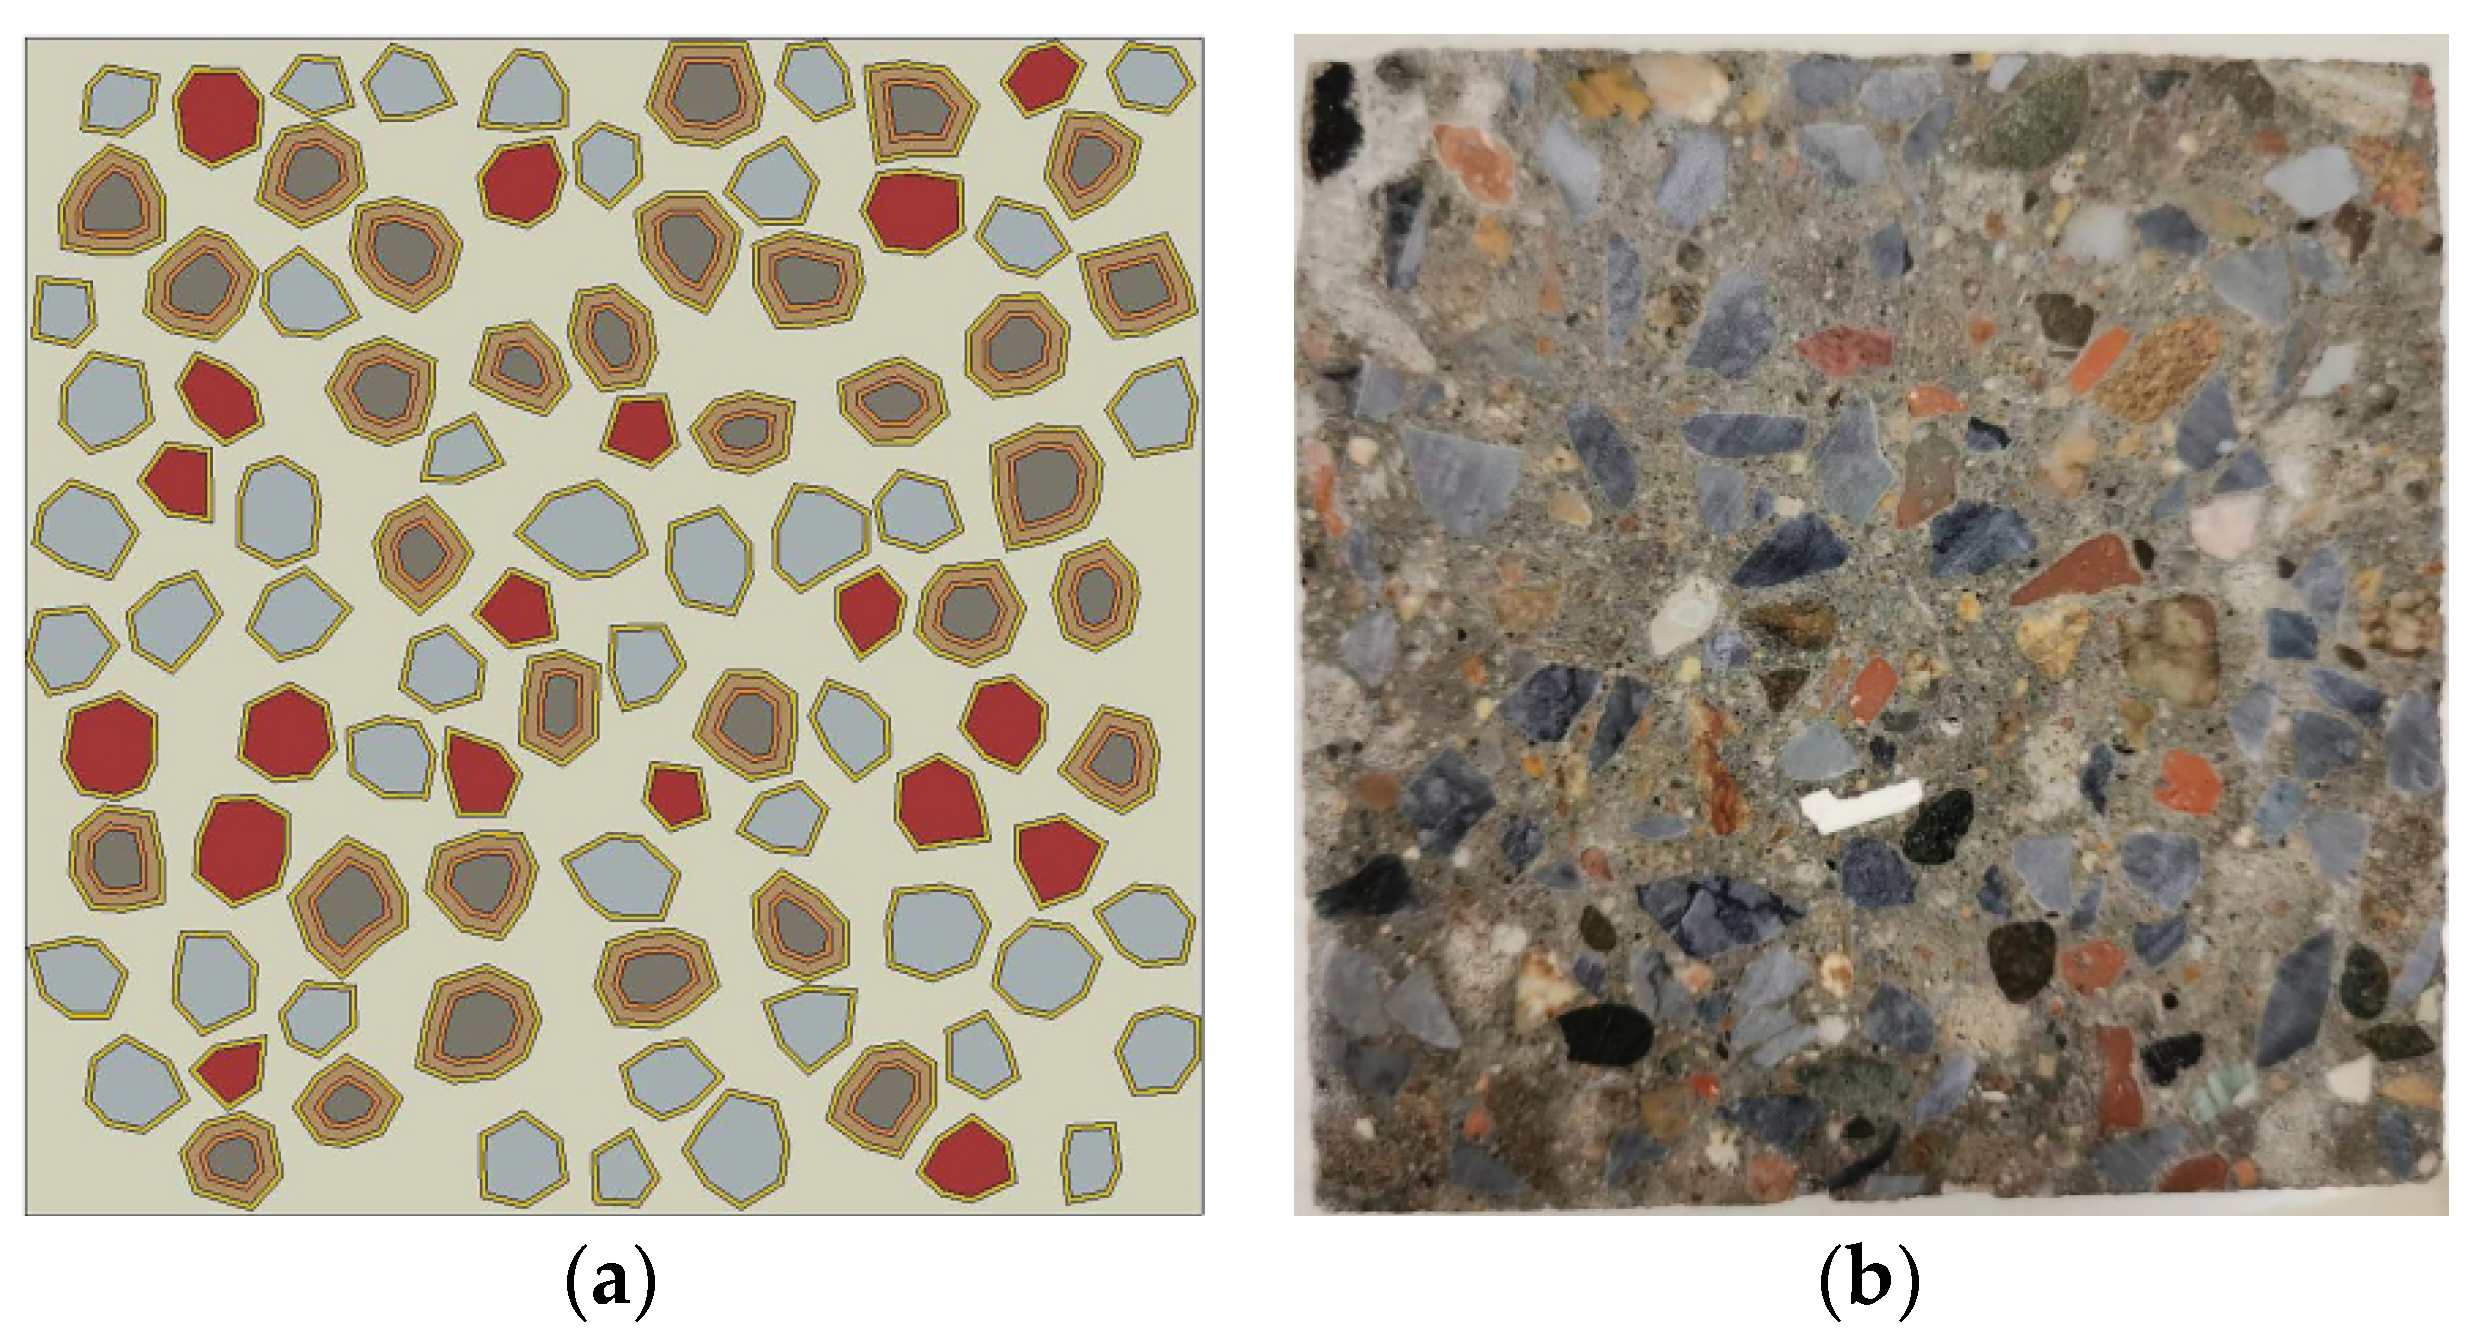
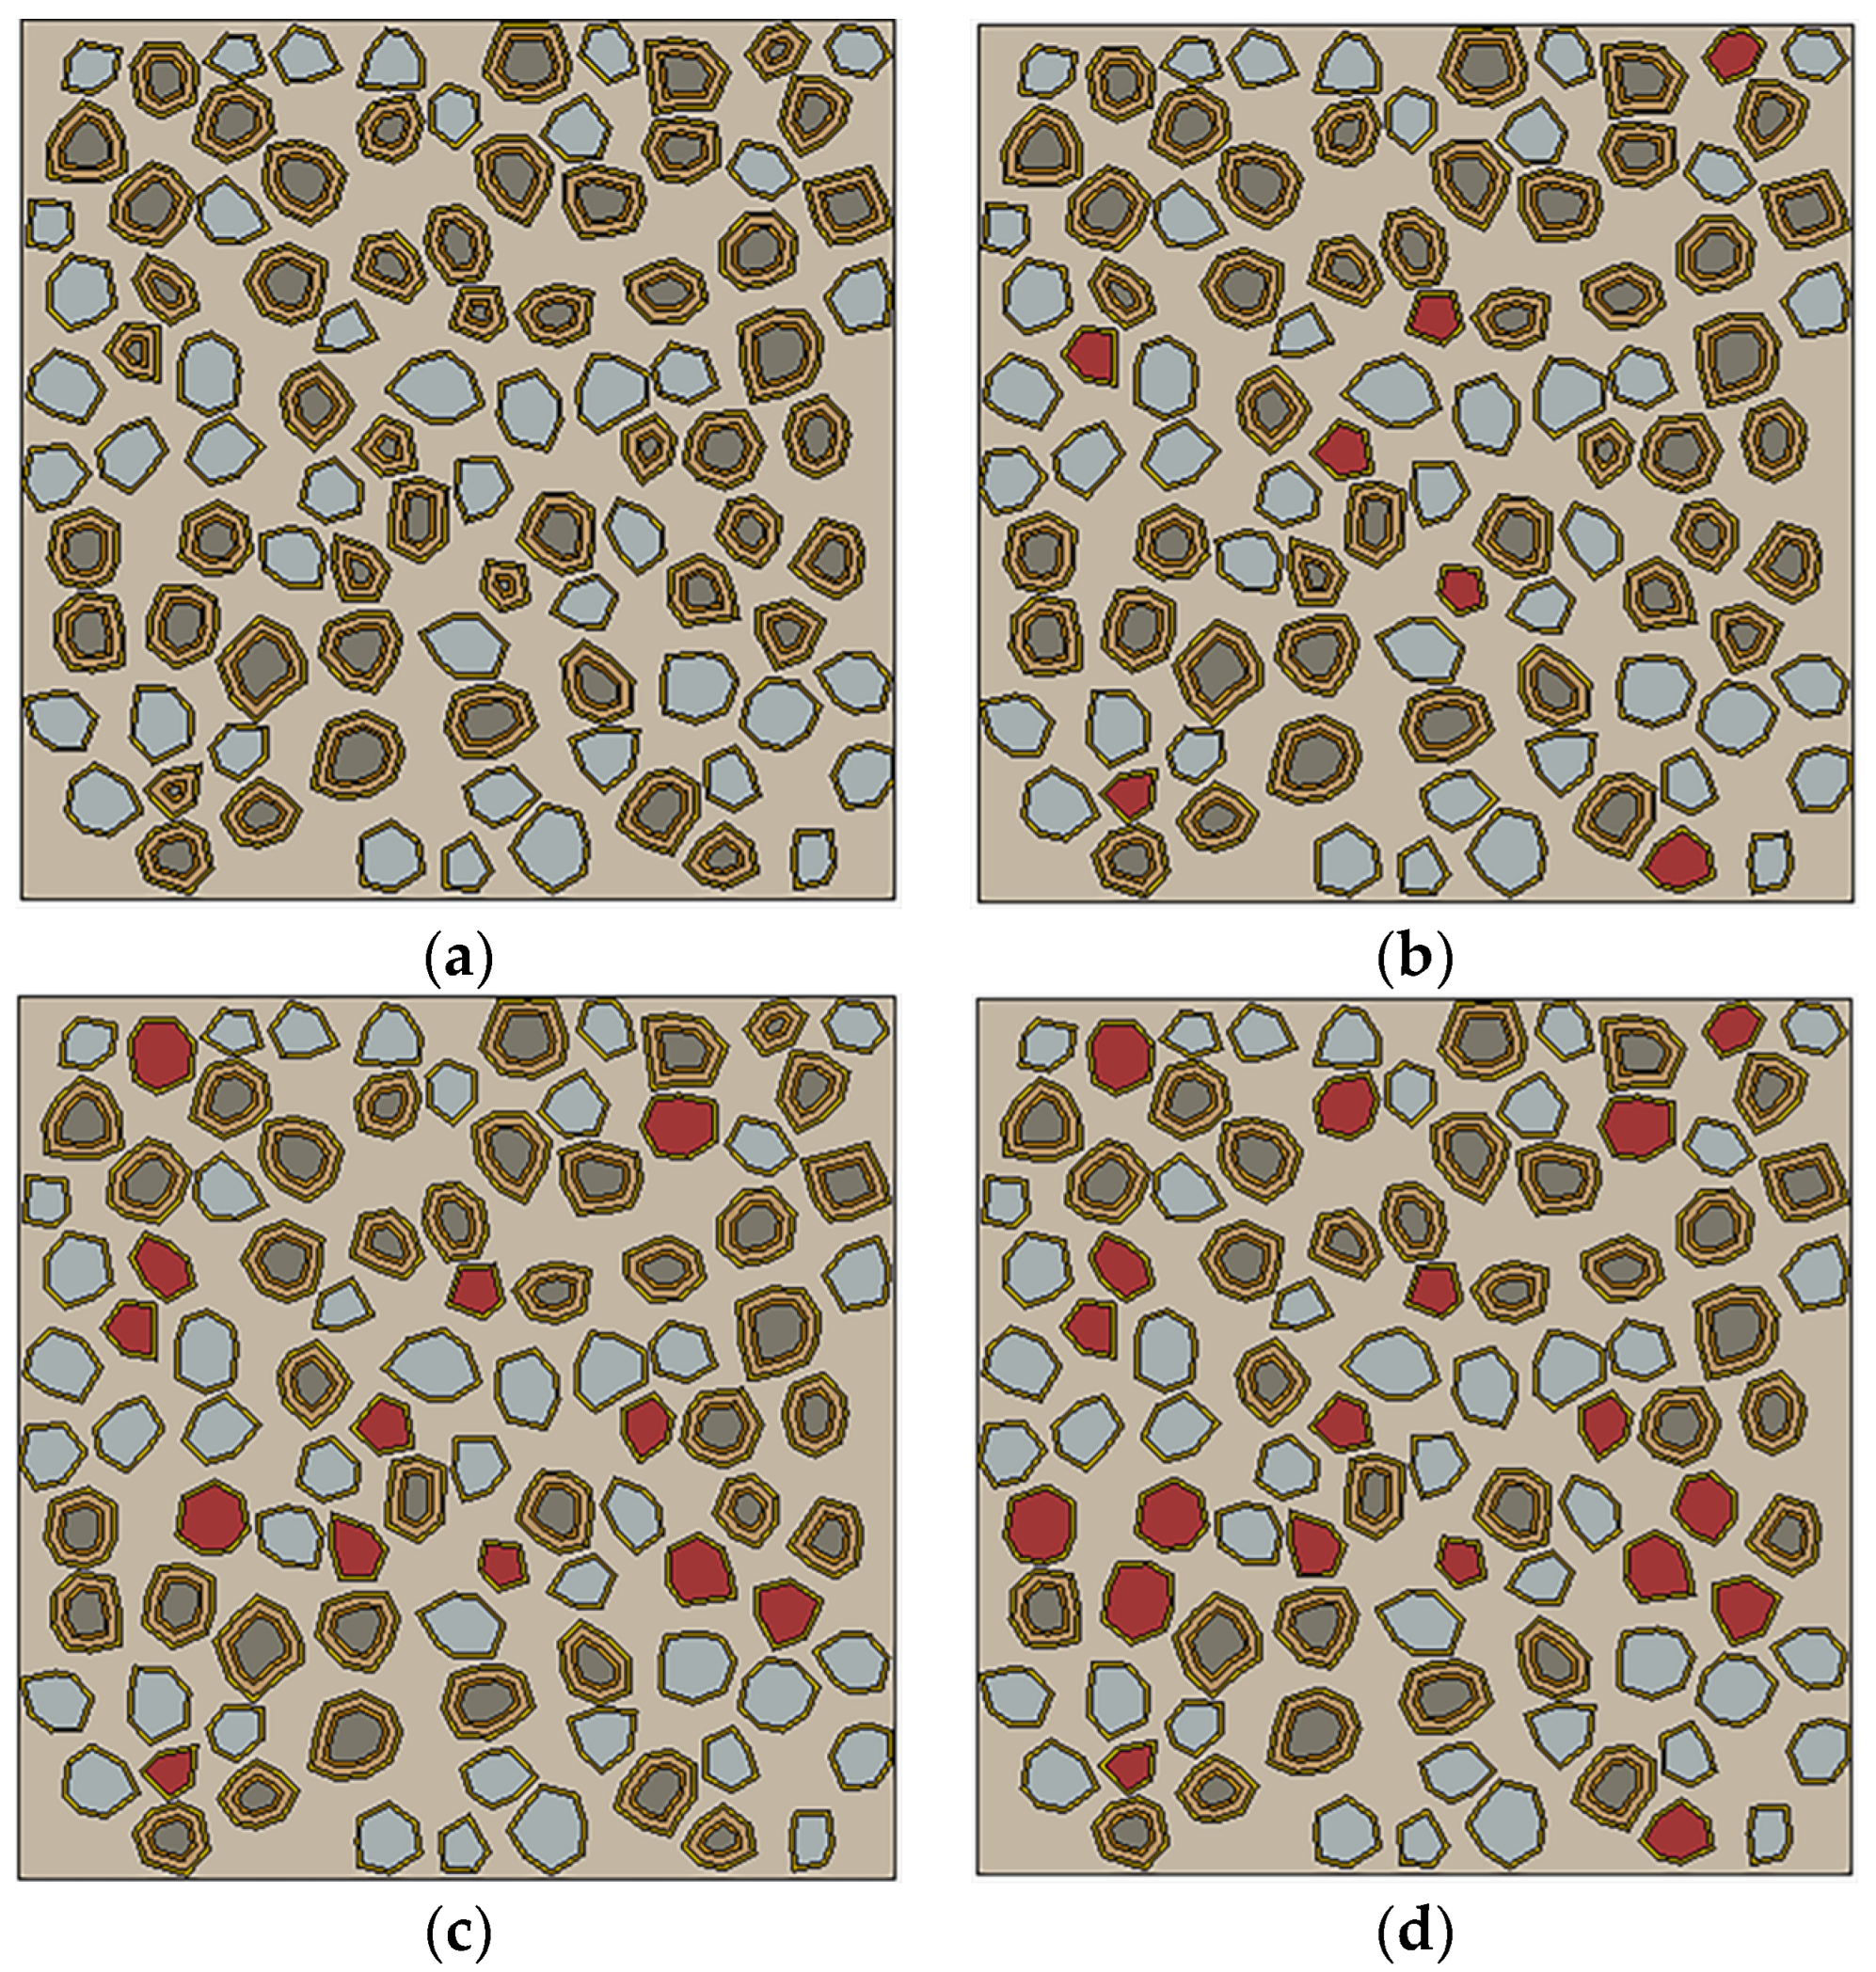
4.4. Verification of the Random Aggregate Model
5. Simulation and Analysis of Micro-Damage in RC
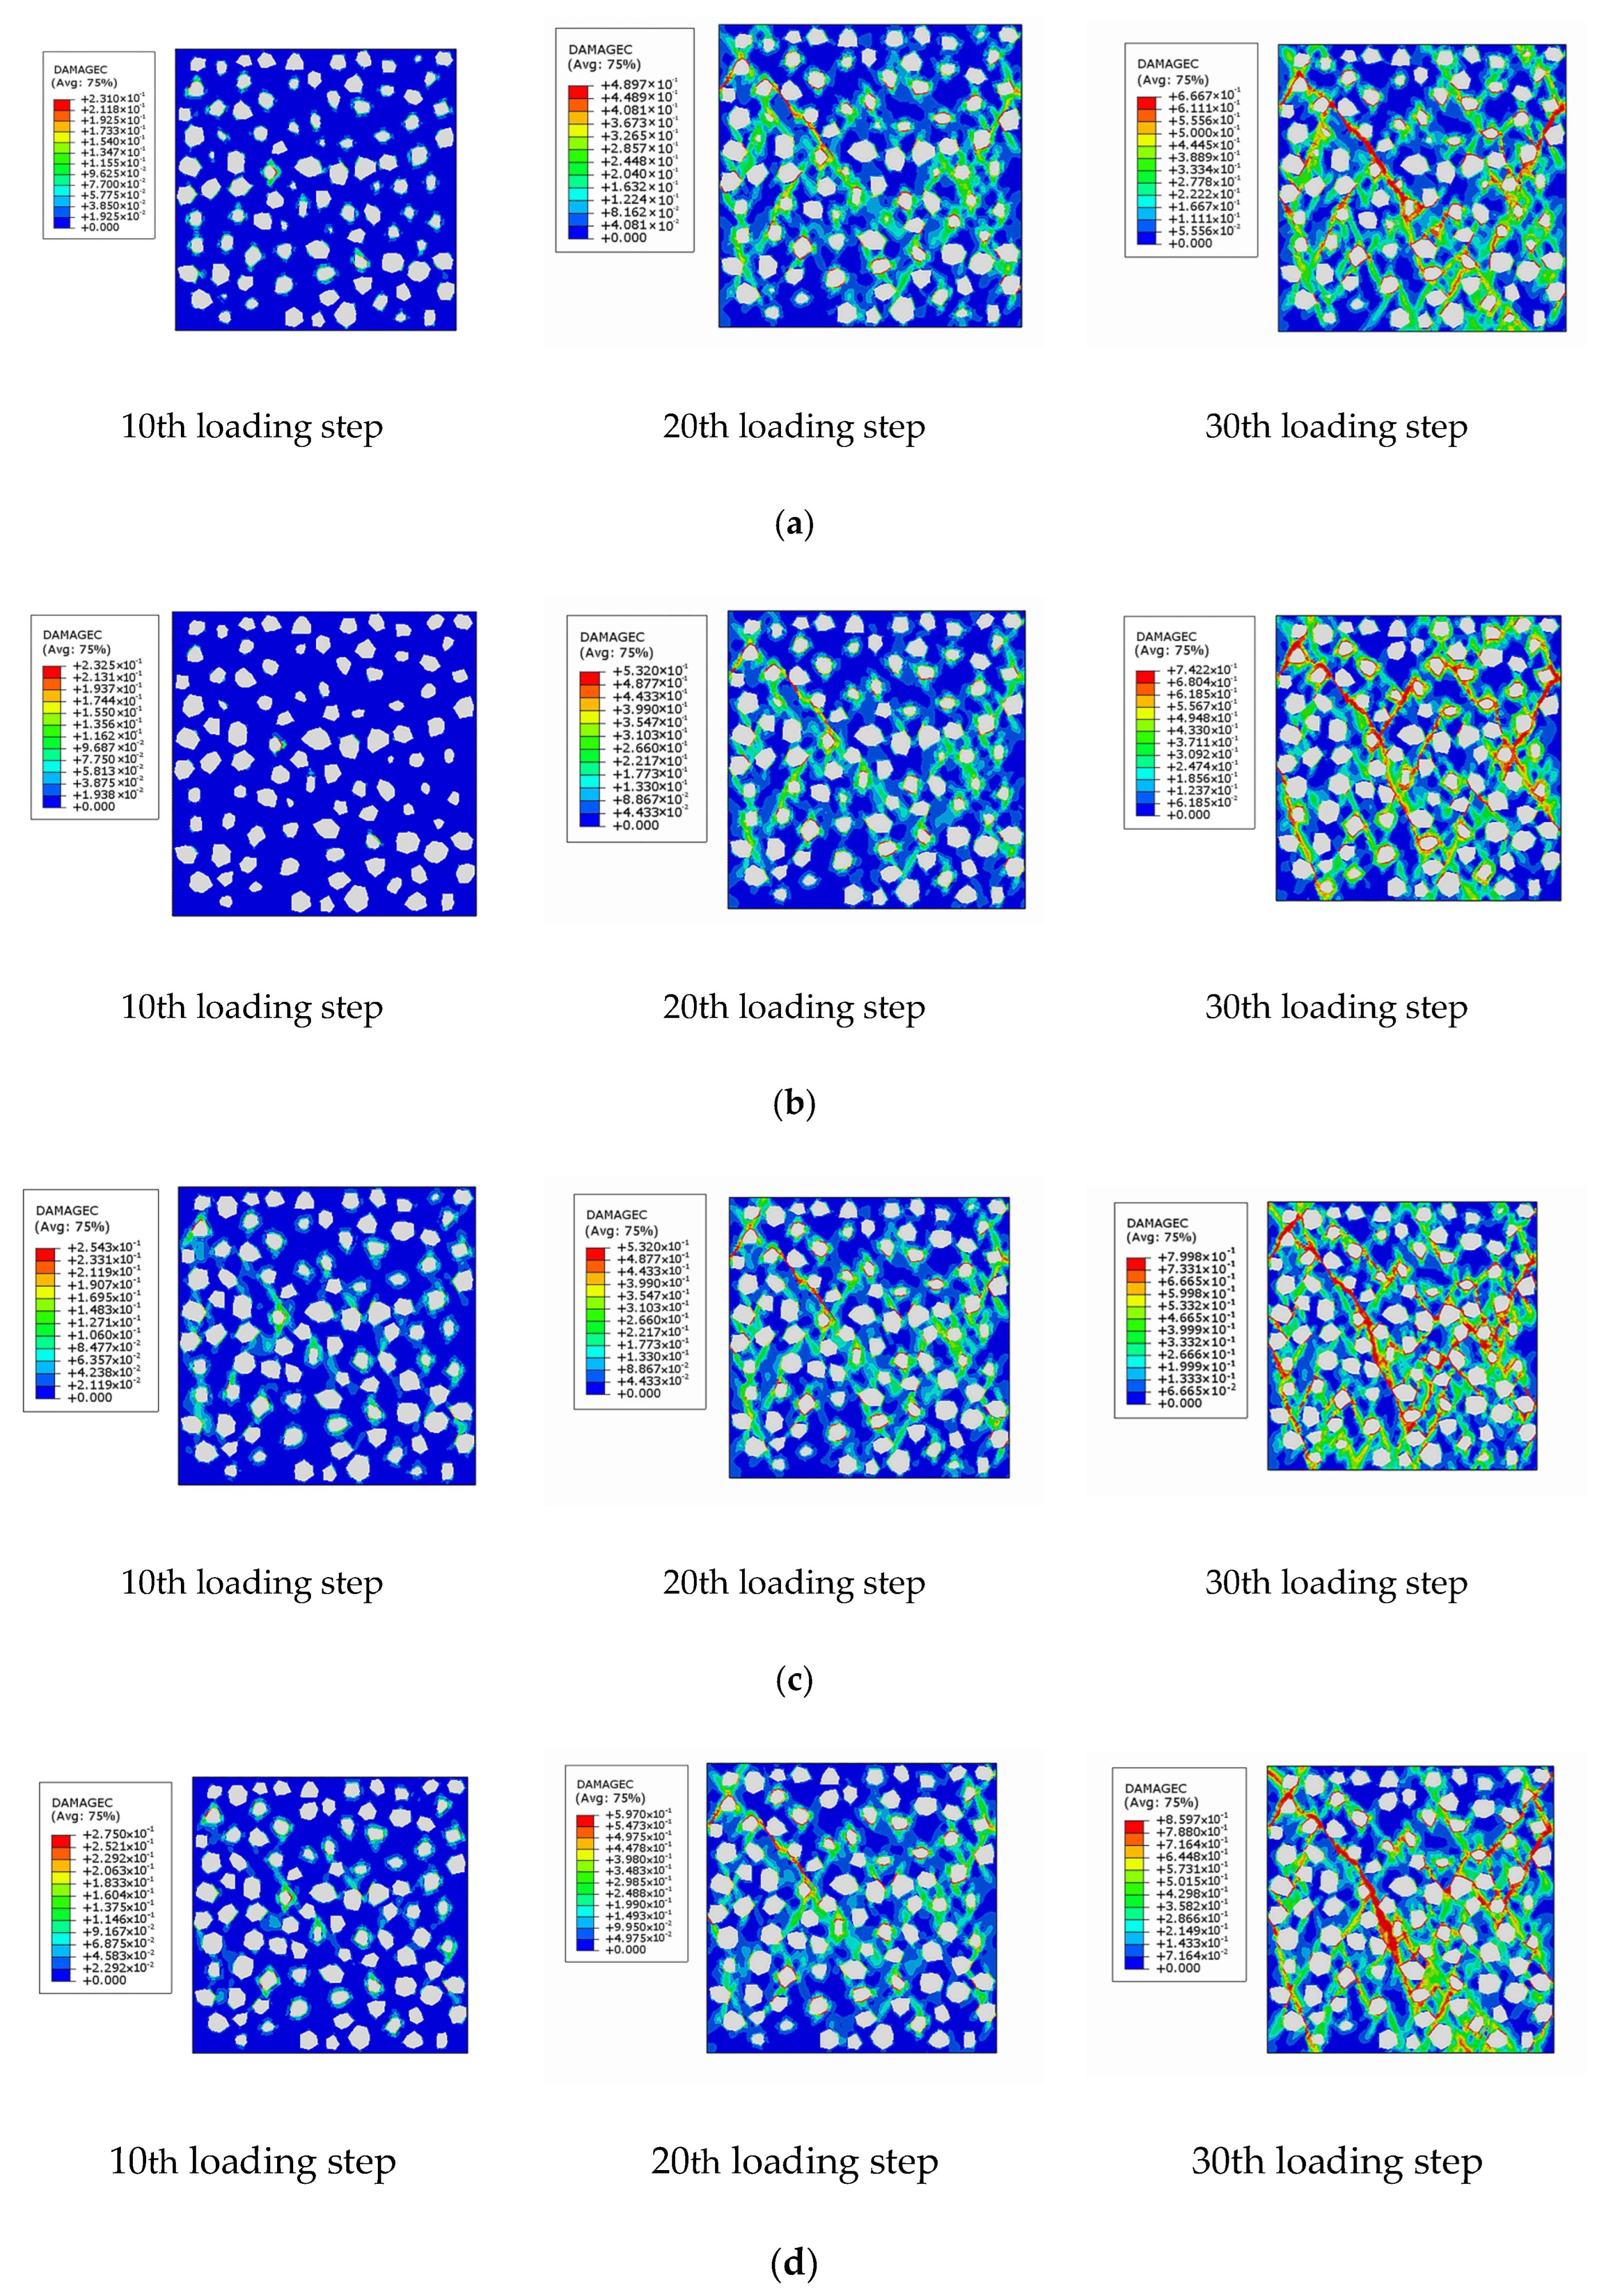
5.1. Microscopic Damage Development in RC
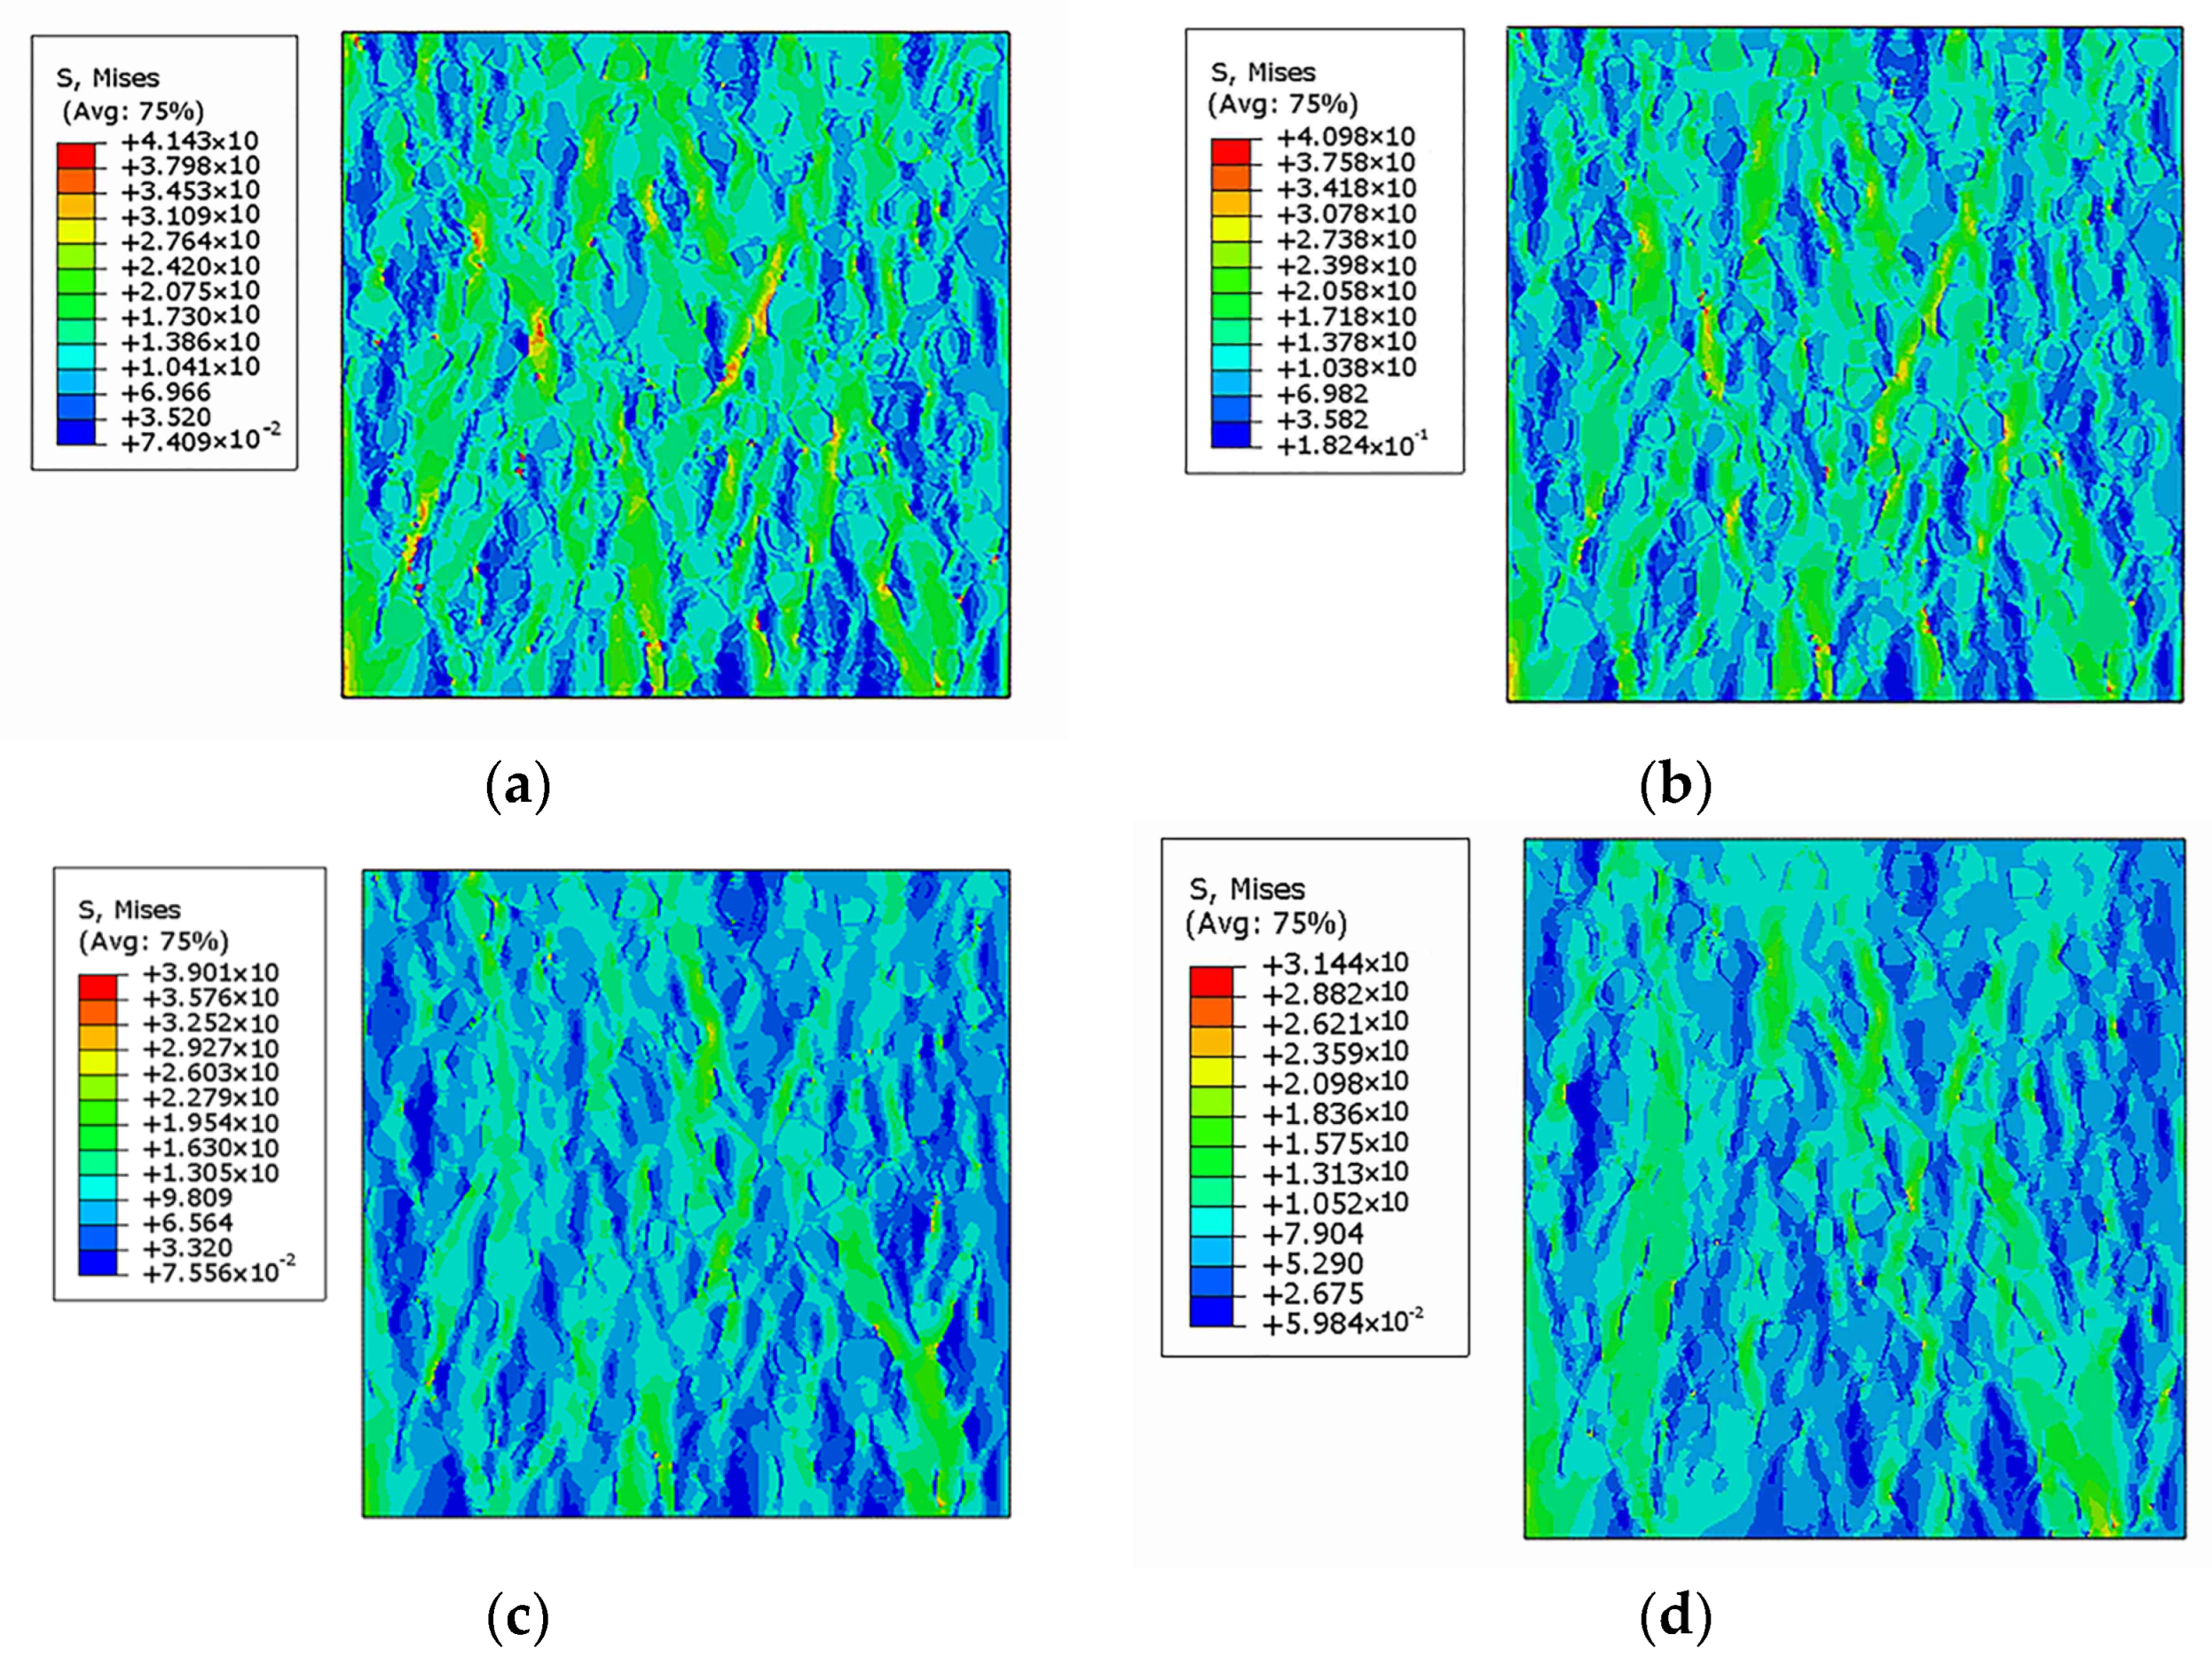
5.2. Stress Nephograms of RC Specimens with Brick and Concrete Aggregates
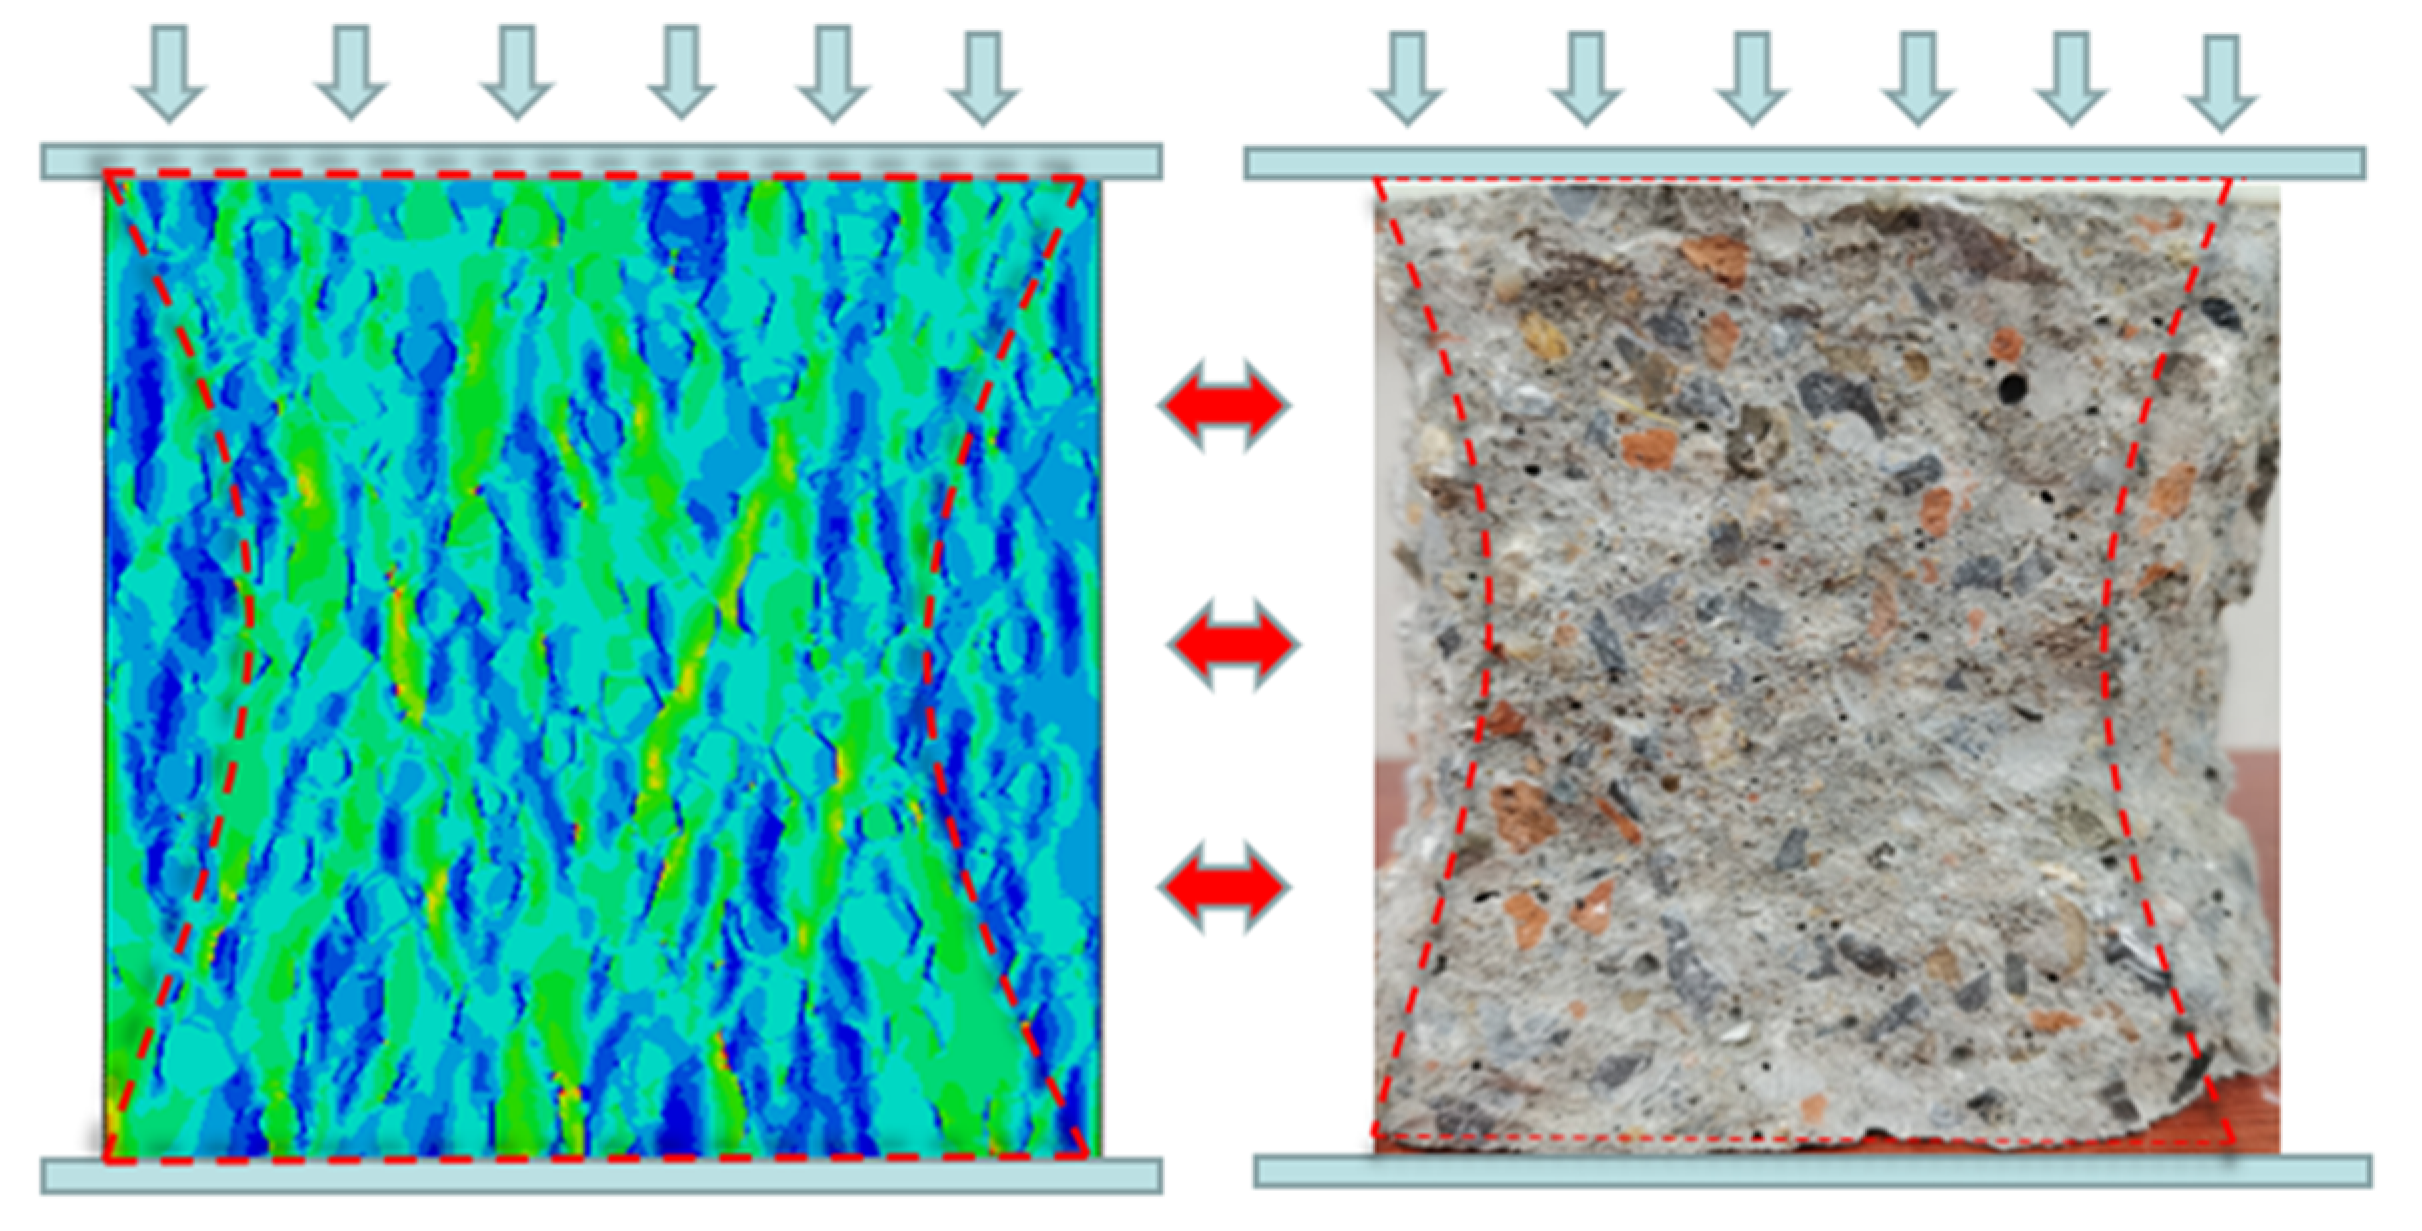
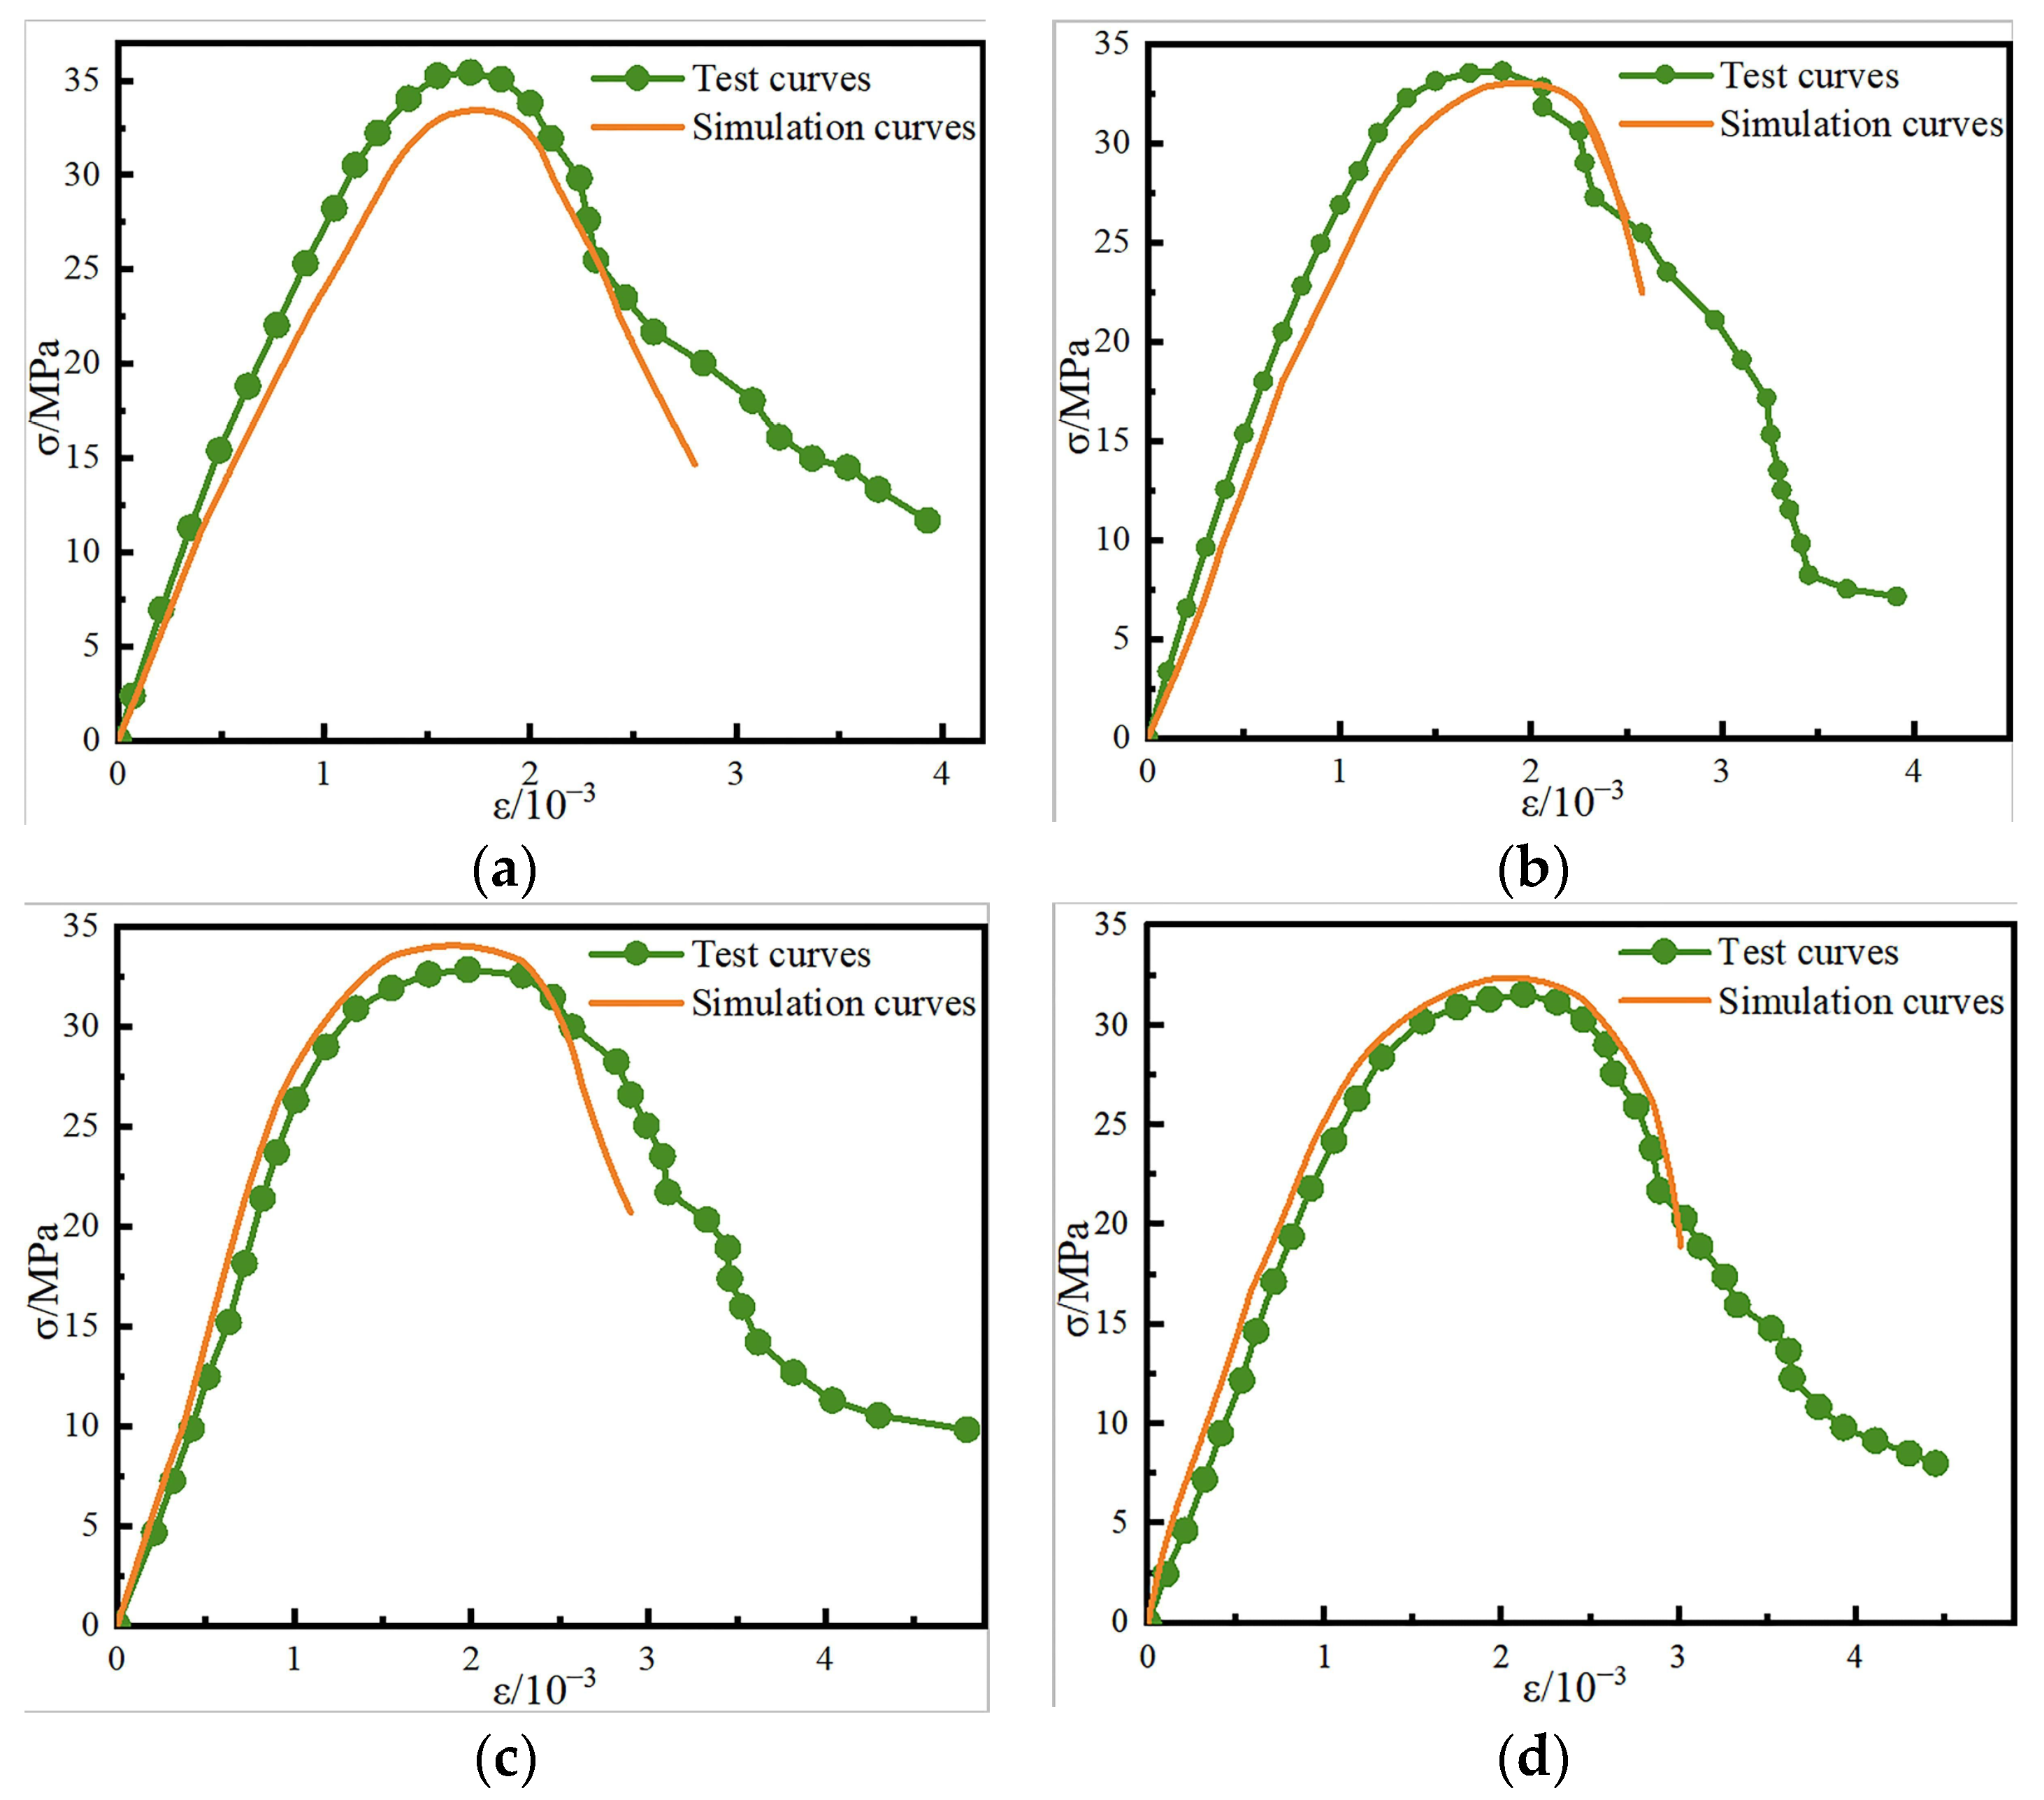
5.3. Model Validation
6. Conclusions
- (1)
- In a process based on the Monte Carlo method, random aggregates were generated and placed in a two-dimensional plane within a specified area. The resultant random aggregate model was in good agreement with the physical specimen cross-section.
- (2)
- For each specimen, the initial damage under compressive stress occurred as a subtle damage band. After additional loading steps, multiple connected damage bands developed inside the specimens. When complete damage was achieved, the specimen interior exhibited a V-shaped damage band. Higher brick contents were correlated with larger damage network areas inside the specimen. The damage began with microcracks, which expanded and penetrated the specimen, producing macroscopic cracks and ultimately inducing complete failure.
- (3)
- The stress nephograms of all specimens exhibited hourglass-type stress concentration areas that contracted from the upper and lower ends to the center. At higher brick contents, the stress concentration area decreased, which was reflected in the physical properties of the specimen as lower skeletal strength and compressive capacity.
- (4)
- The stress–strain curves of the RC specimens with different brick contents obtained from the macroscopic mechanical tests coincided well with those obtained from the simulations. This outcome verifies the reliability of the meso-constitutive model for the RC specimens containing brick aggregate produced in this study.
Author Contributions
Funding
Data Availability Statement
Acknowledgments
Conflicts of Interest
References
- Cantero, B.; Sáez del Bosque, I.F.; Sánchez de Rojas, M.I.; Matías, A.; Medina, C. Durability of concretes bearing construction and demolition waste as cement and coarse aggregate substitutes. Cem. Concr. Compos. 2022, 134, 104722. [Google Scholar] [CrossRef]
- Alexandridou, C.; Angelopoulos, G.N.; Coutelieris, F.A. Mechanical and durability performance of concrete produced with recycled aggregates from Greek construction and demolition waste plants. J. Clean. Prod. 2018, 176, 745–757. [Google Scholar] [CrossRef]
- Liu, Y.; Zhou, J.; Wu, D.; Kang, T.; Liu, A. Bond behavior of recycled fiber recycled concrete with reinforcement after freeze-thaw cycles. Crystals 2021, 11, 1506. [Google Scholar] [CrossRef]
- Zhu, Q.; Chen, J.; He, Y.; Sun, X. Bond stress distribution and bond–slip model of deformed steel bars in iron tailing sand recycled aggregate concrete. Buildings 2023, 13, 1176. [Google Scholar] [CrossRef]
- Ahmed, W.; Lim, C.W. Evaluating fracture parameters of basalt fiber reinforced and pozzolana slurry modified recycled concrete produced from waste. Structures 2023, 50, 1476–1492. [Google Scholar] [CrossRef]
- Chakraborty, S.; Subramaniam, K.V.L. Influences of matrix strength and weak planes on fracture response of recycled aggregate concrete. Theor. App. Fract. Mech. 2023, 124, 103801. [Google Scholar] [CrossRef]
- Tabsh, S.W.; Abdelfatah, A.S. Influence of recycled concrete aggregates on strength properties of concrete. Constr. Build. Mater. 2008, 23, 1163–1167. [Google Scholar] [CrossRef]
- Zheng, C.; Lou, C.; Du, G.; Li, X.; Liu, Z.; Li, L. Mechanical properties of recycled concrete with demolished waste concrete aggregate and clay brick aggregate. Results Phys. 2018, 9, 1317–1322. [Google Scholar] [CrossRef]
- Rahal, K. Mechanical properties of concrete with recycled coarse aggregate. Build. Environ. 2005, 42, 407–415. [Google Scholar] [CrossRef]
- Mohammed, T.U.; Hasnat, A.; Awal, M.A.; Bosunia, S.Z. Recycling of brick aggregate concrete as coarse aggregate. J. Mater. Civ. Eng. 2015, 27, B4014005.1-B4014005.9. [Google Scholar] [CrossRef]
- Letelier, V.; Ortega, J.M.; Muñoz, P.; Tarela, E.; Moriconi, G. Influence of waste brick powder in the mechanical properties of recycled aggregate concrete. Sustainability 2018, 10, 1037. [Google Scholar] [CrossRef]
- Meng, T.; Wei, H.; Dai, D.; Liao, J.; Ahmed, S. Effect of brick aggregate on failure process of mixed recycled aggregate concrete via X-CT. Constr. Build. Mater. 2022, 327, 126934. [Google Scholar] [CrossRef]
- Xiao, J.; Zhang, H.; Zou, S.; Duan, Z.; Ma, Y. Developing recycled foamed concrete for engineered material arresting system. J. Build. Eng. 2022, 53, 104555. [Google Scholar] [CrossRef]
- He, Z.; Shen, A.; Wu, H.; Wang, W.; Wang, L.; Guo, Y. Properties and mechanisms of brick-concrete recycled aggregate strengthened by compound modification treatment. Constr. Build. Mater. 2022, 315, 125678. [Google Scholar] [CrossRef]
- Hu, K.; Chen, Y.; Naz, F.; Zeng, C.; Cao, S. Separation studies of concrete and brick from construction and demolition waste. Waste Manag. 2019, 85, 396–404. [Google Scholar] [CrossRef]
- Jayasuriya, A.; Adams, M.P.; Bandelt, M.J. Understanding variability in recycled aggregate concrete mechanical properties through numerical simulation and statistical evaluation. Constr. Build. Mater. 2018, 178, 301–312. [Google Scholar] [CrossRef]
- Otsuki, N.; Miyazato, S.; Yodsudjai, W. Influence of recycled aggregate on interfacial transition zone, strength, chloride penetration and carbonation of concrete. J. Mater. Civ. Eng. 2003, 15, 443–451. [Google Scholar] [CrossRef]
- Xiao, J.; Li, W.; Corr, D.J.; Shah, S.P. Effects of interfacial transition zones on the stress–strain behavior of modeled recycled aggregate concrete. Cem. Concr. Res. 2013, 52, 82–99. [Google Scholar] [CrossRef]
- Liu, Q.; Xiao, J.; Sun, Z. Experimental study on the failure mechanism of recycled concrete. Cem. Concr. Res. 2011, 41, 1050–1057. [Google Scholar] [CrossRef]
- JGJ 52-2006; Standard for Technical Requirements and Test Method of Sand and Crushed Stone (or Gravel) for Ordinary Concrete. Ministry of Construction of the People’s Republic of China: Beijing, China, 2006.
- GB/T 25177-2010; Recycled Coarse Aggregate for Concrete. Ministry of Housing and Urban-Rural Development: Beijing, China, 2010.
- GB/T 14685-2022; Pebble and Crushed Stone for Construction. China Construction Material Federation: Beijing, China, 2022.
- JGJ 55-2011; Specification for Mix Proportion Design of Ordinary Concrete. Ministry of Construction of the People’s Republic of China: Beijing, China, 2011.
- GB/T 50107-2010; Standard for Evaluation of Concrete Compressive Strength. Ministry of Construction of the People’s Republic of China: Beijing, China, 2010.
- Debieb, F.; Kenai, S. The use of coarse and fine crushed bricks as aggregate in concrete. Constr. Build. Mater. 2006, 22, 886–893. [Google Scholar] [CrossRef]
- Jayasuriya, A.; Adams, M.P.; Bandelt, M.J. Generation and numerical analysis of random aggregate structures in recycled concrete aggregate systems. J. Mater. Civ. Eng. 2020, 32, 04020044. [Google Scholar] [CrossRef]
- Kosmatka, S.; Kerkhoff, B.; Panarese, W. Design and Control of Concrete Mixtures, 14th ed.; Portland Cement Association: Skokie, IL, USA, 2011. [Google Scholar]
- Wang, Z.M.; Kwan, A.K.H.; Chan, H.C. Mesoscopic study of concrete I: Generation of random aggregate structure and finite element mesh. Comput. Struct. 1999, 70, 533–544. [Google Scholar] [CrossRef]
- Ma, H.; Tu, Y.; Yu, H.; Diao, Y.; Han, W.; Zhang, M. Mechanical properties and microstructural characteristics of coral-aggregate-concrete ITZ: Experimental study. J. Build. Eng. 2023, 72, 106647. [Google Scholar] [CrossRef]
- Königsberger, M.; Pichler, B.L.A.; Hellmich, C. Micromechanics of ITZ-Aggregate Interaction in Concrete Part II: Strength Upscaling. J. Am. Ceram. Soc. 2014, 97, 543–551. [Google Scholar] [CrossRef]
- Ding, Y.; Wu, J.Y.; Xu, P.; Zhang, X.; Fan, Y. Treatment Methods for the Quality Improvement of Recycled Concrete Aggregate (RCA)—A Review. J. Wuhan Univ. Technol.-Mater. Sci. Ed. 2021, 36, 77–92. [Google Scholar] [CrossRef]
- Poon, C.S.; Shui, Z.H.; Lam, L. Effect of microstructure of ITZ on compressive strength of concrete prepared with recycled aggregates. Constr. Build. Mater. 2004, 18, 461–468. [Google Scholar] [CrossRef]
- Xiao, J.; Li, W.; Sun, Z.; Lange, D.A.; Shah, S.P. Properties of interfacial transition zones in recycled aggregate concrete tested by nanoindentation. Cem. Concr. Compos. 2013, 37, 276–292. [Google Scholar] [CrossRef]
- Kim, S.-M.; Al-Rub, R.K.A. Meso-scale computational modeling of the plastic-damage response of cementitious composites. Cem. Concr. Res. 2011, 41, 339–358. [Google Scholar] [CrossRef]
- Tan, X.; Li, W.; Zhao, M.; Tam, V.W.Y. Numerical discrete-element method investigation on failure process of recycled aggregate concrete. J. Mater. Civ. Eng. 2019, 31, 04018353.1–04018353.14. [Google Scholar] [CrossRef]


| Coarse Aggregate Type | Water Absorption Rate (%) | Apparent Density (kg·m−3) | Crushing Index (%) |
|---|---|---|---|
| Natural crushed stone | 2.25 | 2.667 | 9.8 |
| Old concrete | 8.53 | 2.312 | 19.8 |
| Brick | 13.58 | 1.996 | 31.2 |
| Water Consumption | Cement | Fine Aggregate | Natural Crushed Stone | Old Concrete | Brick | Water Reducing Agent |
|---|---|---|---|---|---|---|
| 190 | 500 | 602 | 559 | 559 | 0 | 5 |
| 503.1 | 55.9 | |||||
| 447.2 | 111.8 | |||||
| 391.3 | 167.7 |
| Brick Content of Recycled Aggregate (%) | Coarse Aggregate: Specimen Volume Ratio |
|---|---|
| 0 | 45.5 |
| 10 | 45.8 |
| 20 | 46.1 |
| 30 | 46.5 |
| Expansion Angle | Eccentricity | fb0/fc0 | K | Viscosity Coefficient |
|---|---|---|---|---|
| 30° | 0.1 | 1.16 | 0.6667 | 0.005 |
| Type | Elastic Modulus E (GPa) | Poisson’s Ratio μ | Compressive Strength (MPa) | Tensile Strength (MPa) | Density (kg·m−3) |
|---|---|---|---|---|---|
| New mortar | 35 | 0.22 | 45 | 2.5 | 2370 |
| Old mortar | 25 | 0.22 | 30 | 2 | 2370 |
| ITZ1 | 28 | 0.22 | 36 | 2 | 2370 |
| ITZ2 | 20 | 0.22 | 24 | 1.6 | 2370 |
| Natural aggregate | 80 | 0.16 | – | – | 2667 |
| Old gravel | 50 | 0.16 | – | – | 2667 |
| Brick | 13 | 0.20 | – | – | 1996 |
Disclaimer/Publisher’s Note: The statements, opinions and data contained in all publications are solely those of the individual author(s) and contributor(s) and not of MDPI and/or the editor(s). MDPI and/or the editor(s) disclaim responsibility for any injury to people or property resulting from any ideas, methods, instructions or products referred to in the content. |
© 2023 by the authors. Licensee MDPI, Basel, Switzerland. This article is an open access article distributed under the terms and conditions of the Creative Commons Attribution (CC BY) license (https://creativecommons.org/licenses/by/4.0/).
Share and Cite
Qi, L.; Yu, B.; Yu, M.; Zhang, M. Simulation-Based Analysis of Micro-Damage to Recycled Concrete-Containing Brick Coarse Aggregates. Buildings 2023, 13, 2297. https://doi.org/10.3390/buildings13092297
Qi L, Yu B, Yu M, Zhang M. Simulation-Based Analysis of Micro-Damage to Recycled Concrete-Containing Brick Coarse Aggregates. Buildings. 2023; 13(9):2297. https://doi.org/10.3390/buildings13092297
Chicago/Turabian StyleQi, Lin, Baoyang Yu, Mingxin Yu, and Mingyue Zhang. 2023. "Simulation-Based Analysis of Micro-Damage to Recycled Concrete-Containing Brick Coarse Aggregates" Buildings 13, no. 9: 2297. https://doi.org/10.3390/buildings13092297