

The Safe Load-Bearing Capacity of Railway Tunnel Linings under High-Pressure and Water-Rich Conditions

Abstract
:1. Introduction
2. Regression Analysis-Based Calculation Formula for Water Pressure in Railway Tunnels
2.1. Calculation Principles and Model Establishment
- (1)
- Calculation Principles
- (2)
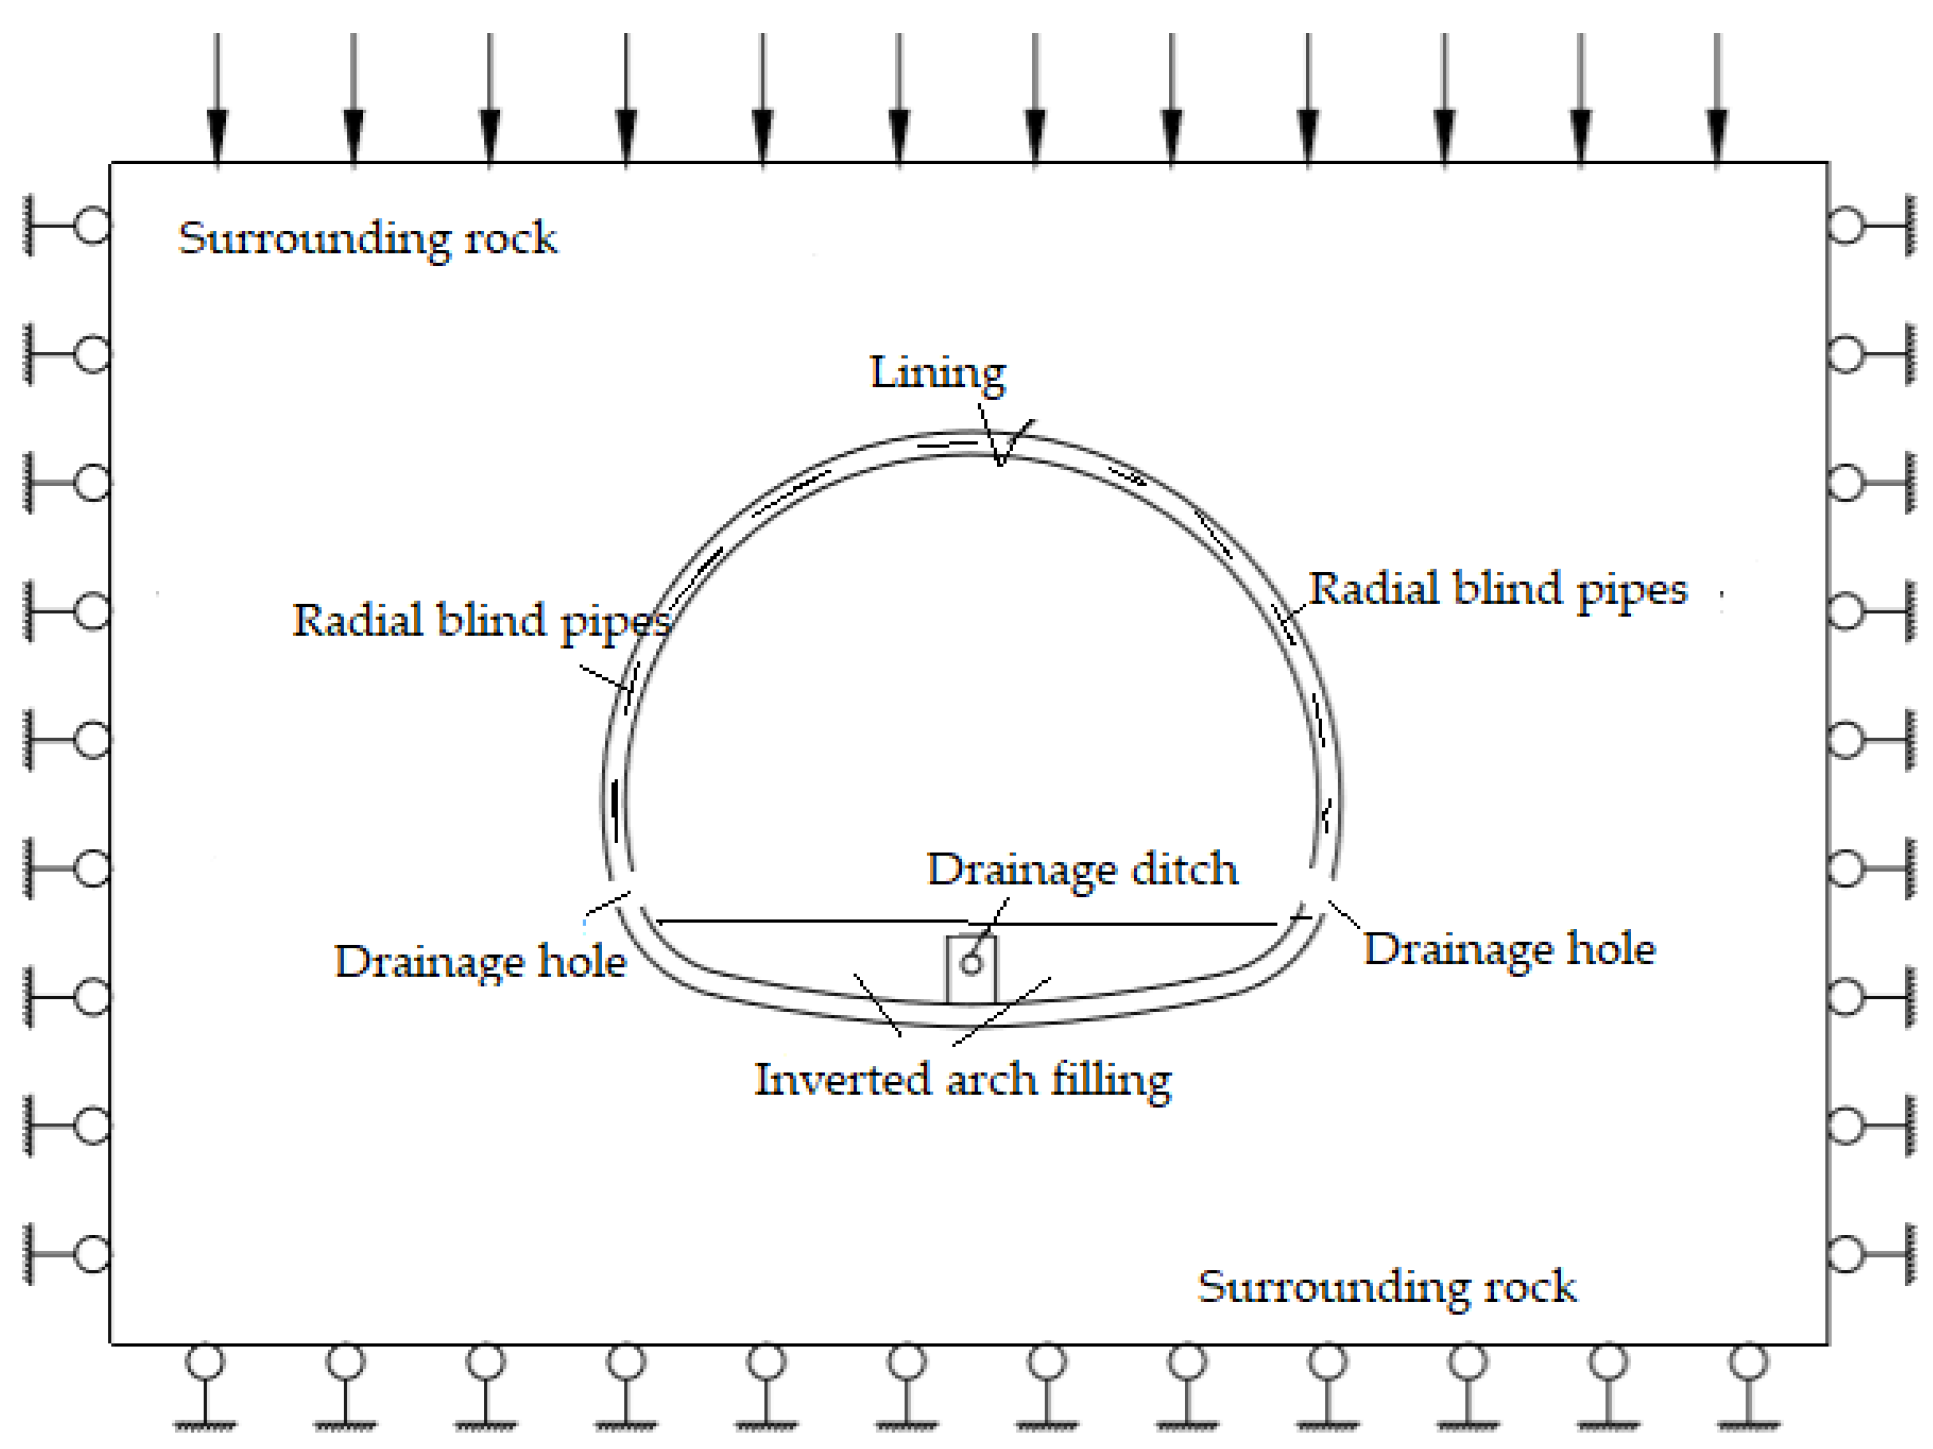
- Numerical Calculation Model
- The surrounding rock is isotropic, homogeneous, continuous, and a medium.
- Groundwater seepage complies with Darcy’s law.
- Groundwater replenishment is sufficient.
- (3)
- Boundary Conditions
- The seepage boundary conditions are as follows: the permeable boundary has a fixed pore pressure on both sides of the formation; a permeable boundary with fixed pore pressure is set at the top of the formation to ensure that the lining bears the corresponding head pressure; the bottom of the formation is impermeable.
- The mechanical boundary conditions are as follows: horizontal constraints are set on the left and right sides of the formation; vertical constraints are set at the bottom of the formation; mechanical boundary conditions are set at the top of the formation to ensure that the tunnel bears the corresponding buried depth pressure.
2.2. Derivation of Water Pressure on Tunnel Lining
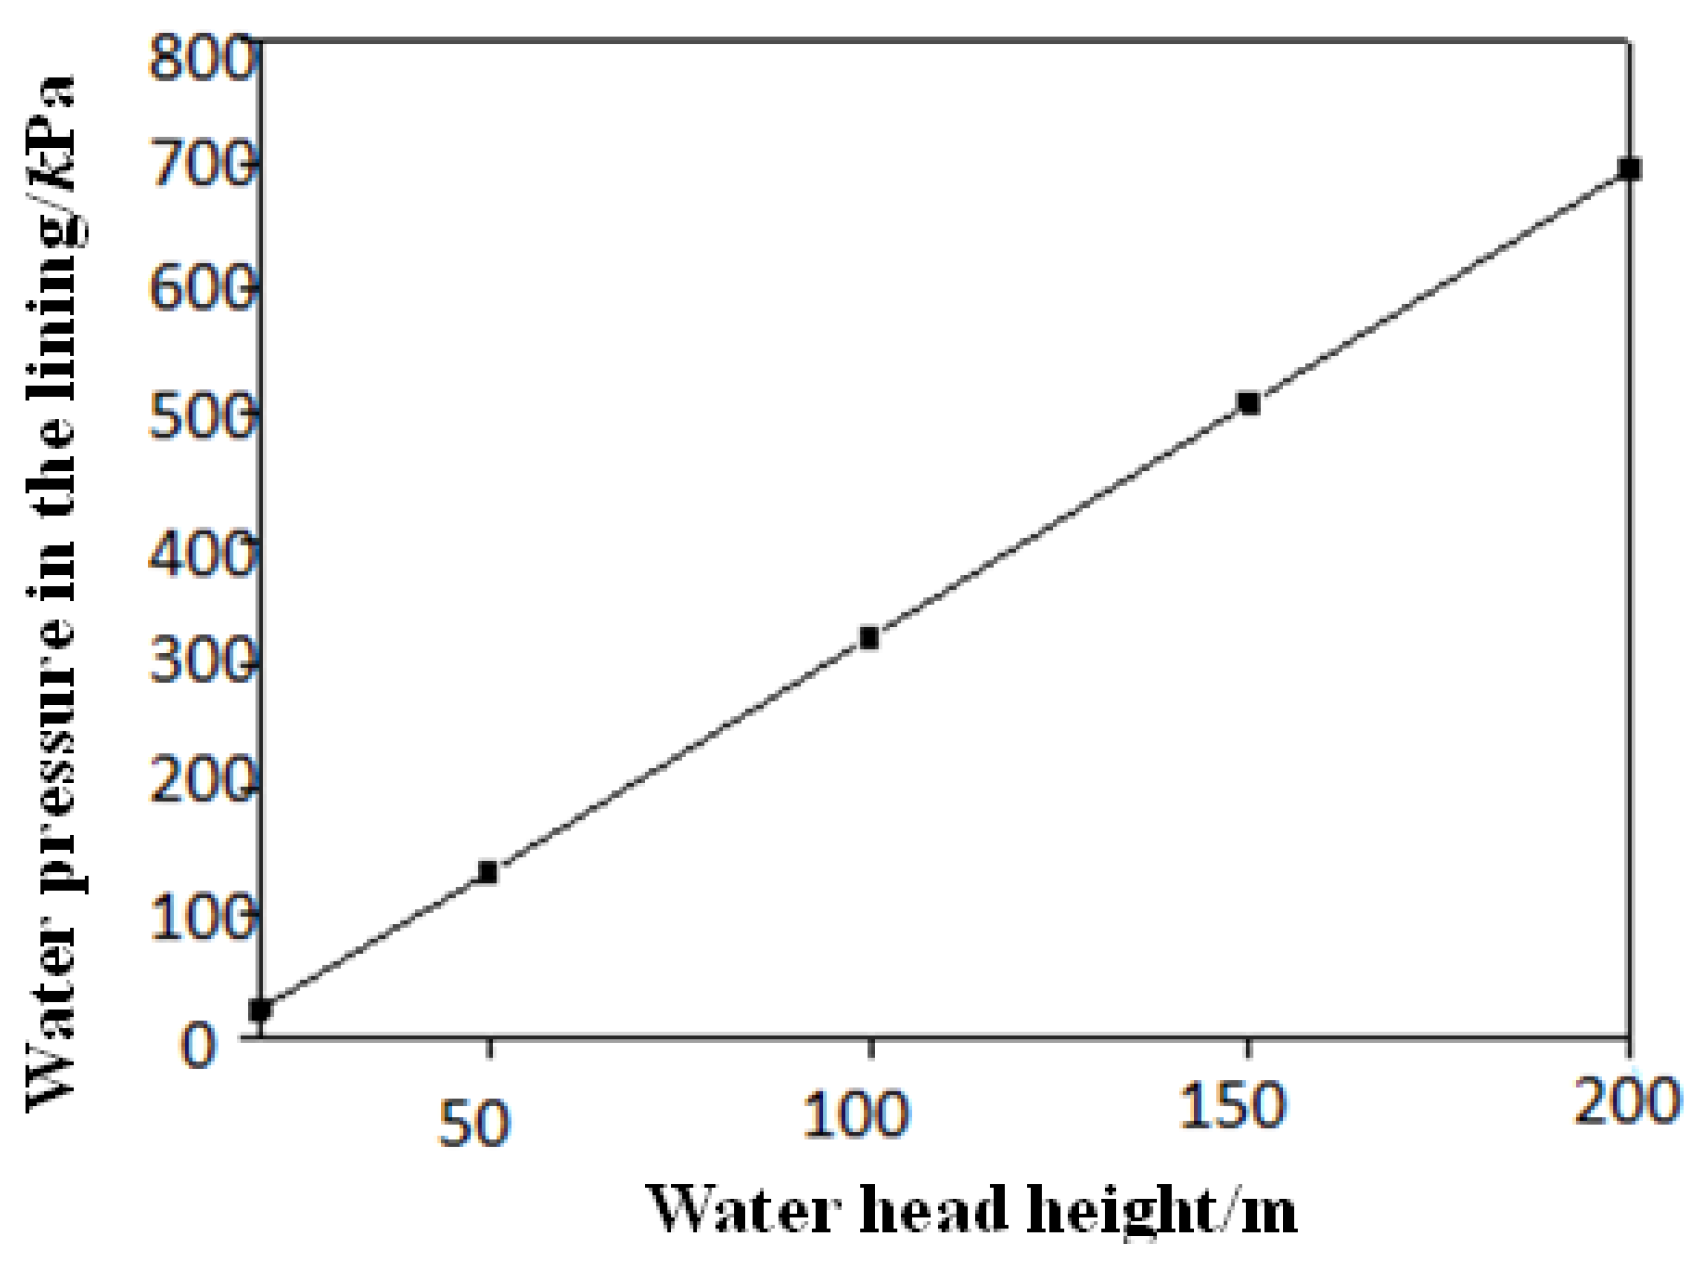
2.2.1. Tunnel Lining Water Pressure and Water Head Height
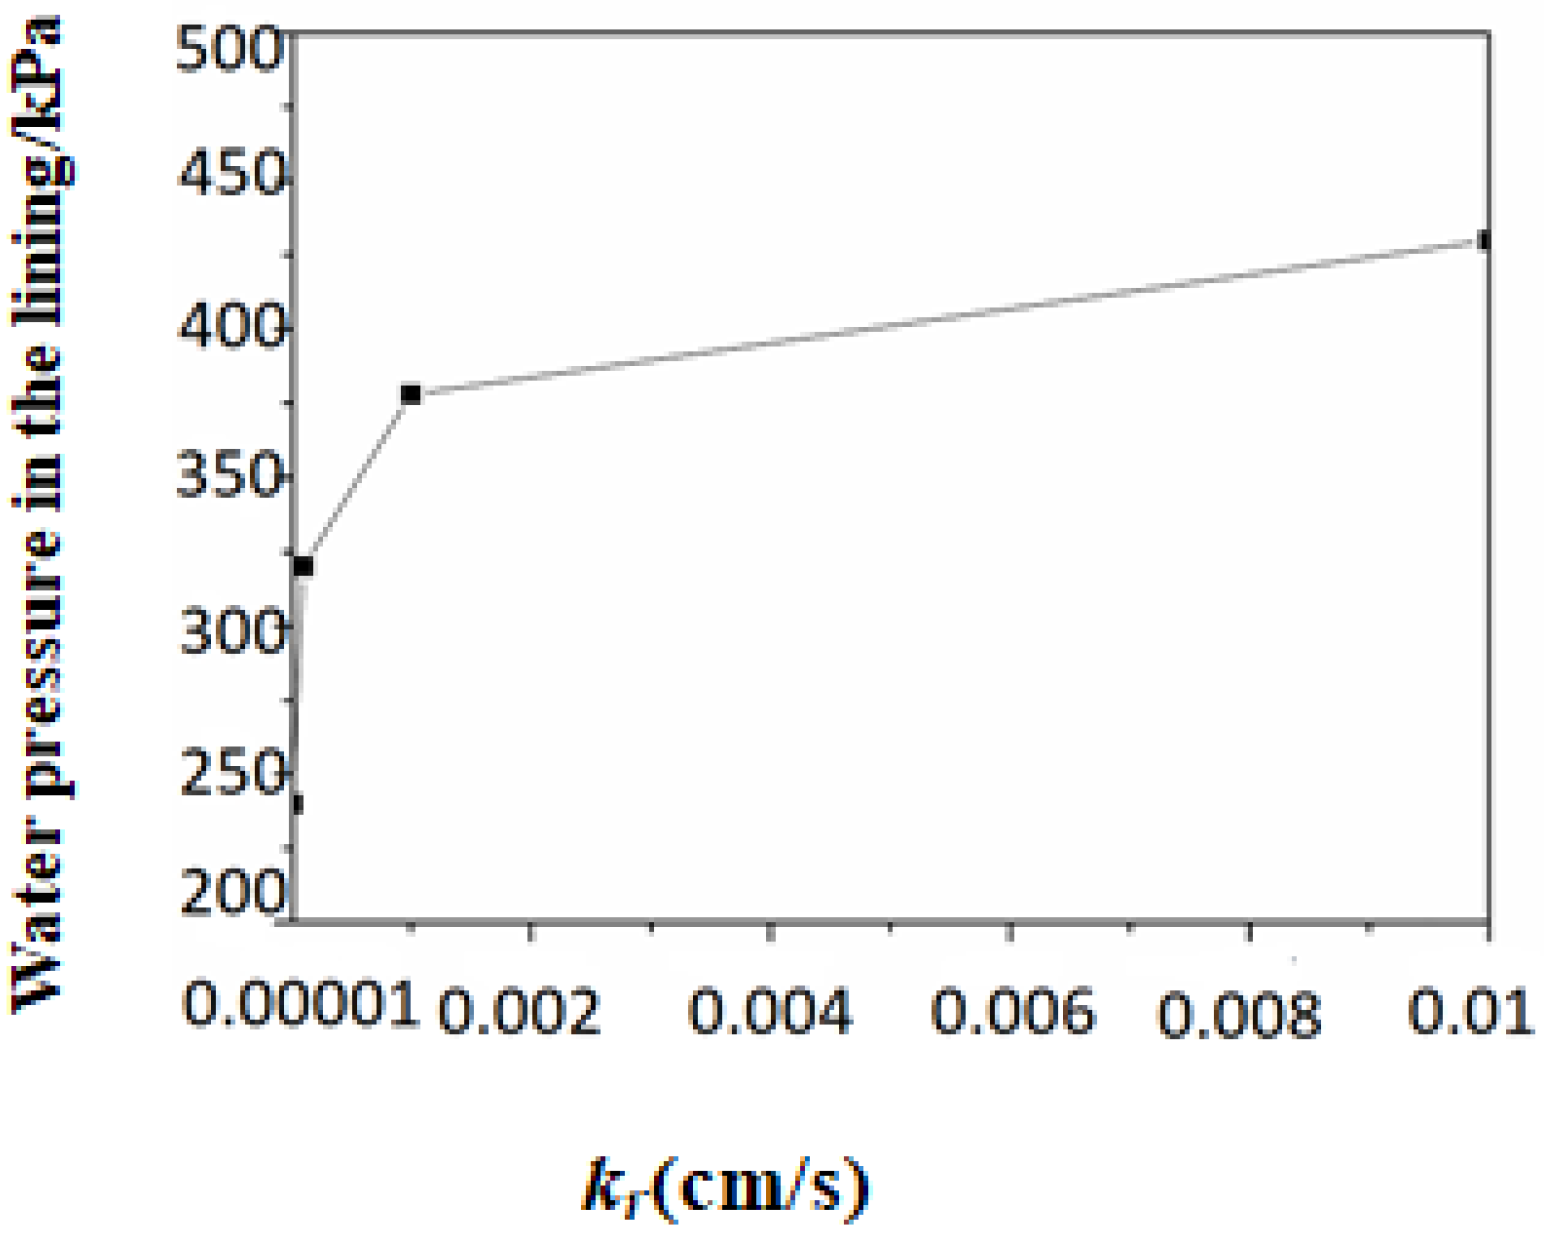
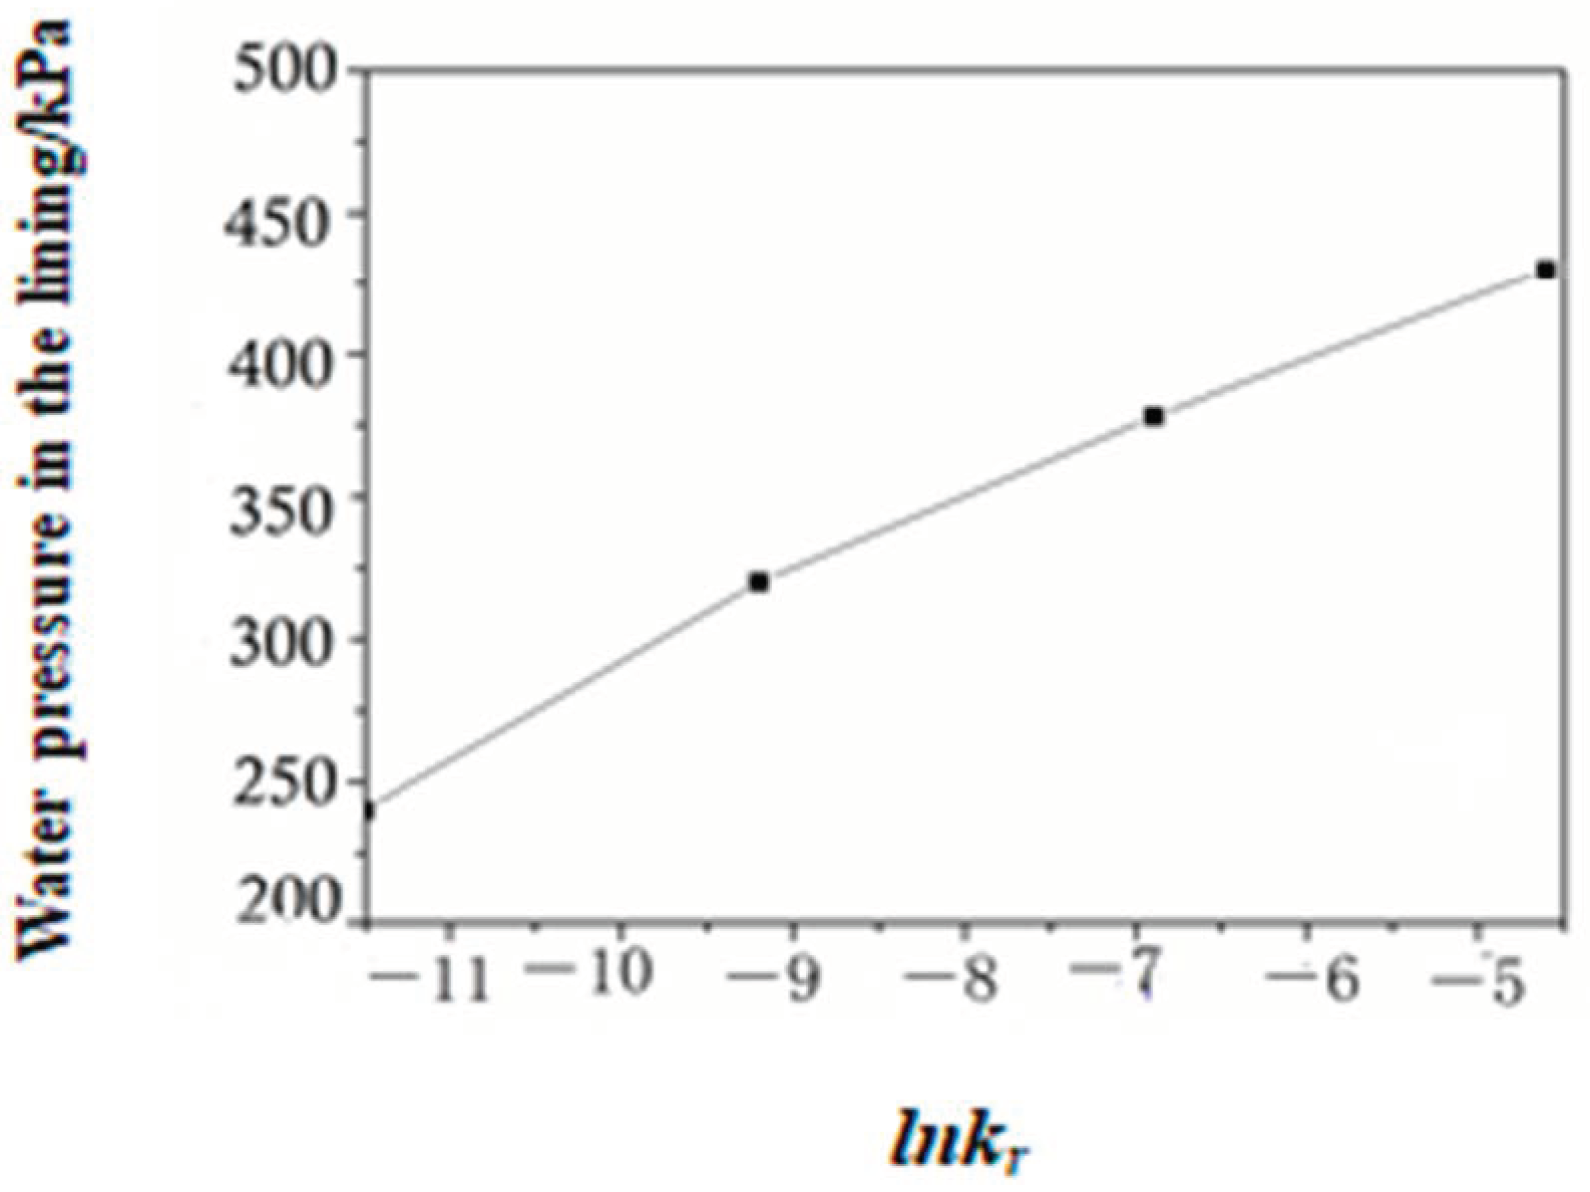
2.2.2. Lining Water Pressure and Surrounding Rock Permeability Coefficient
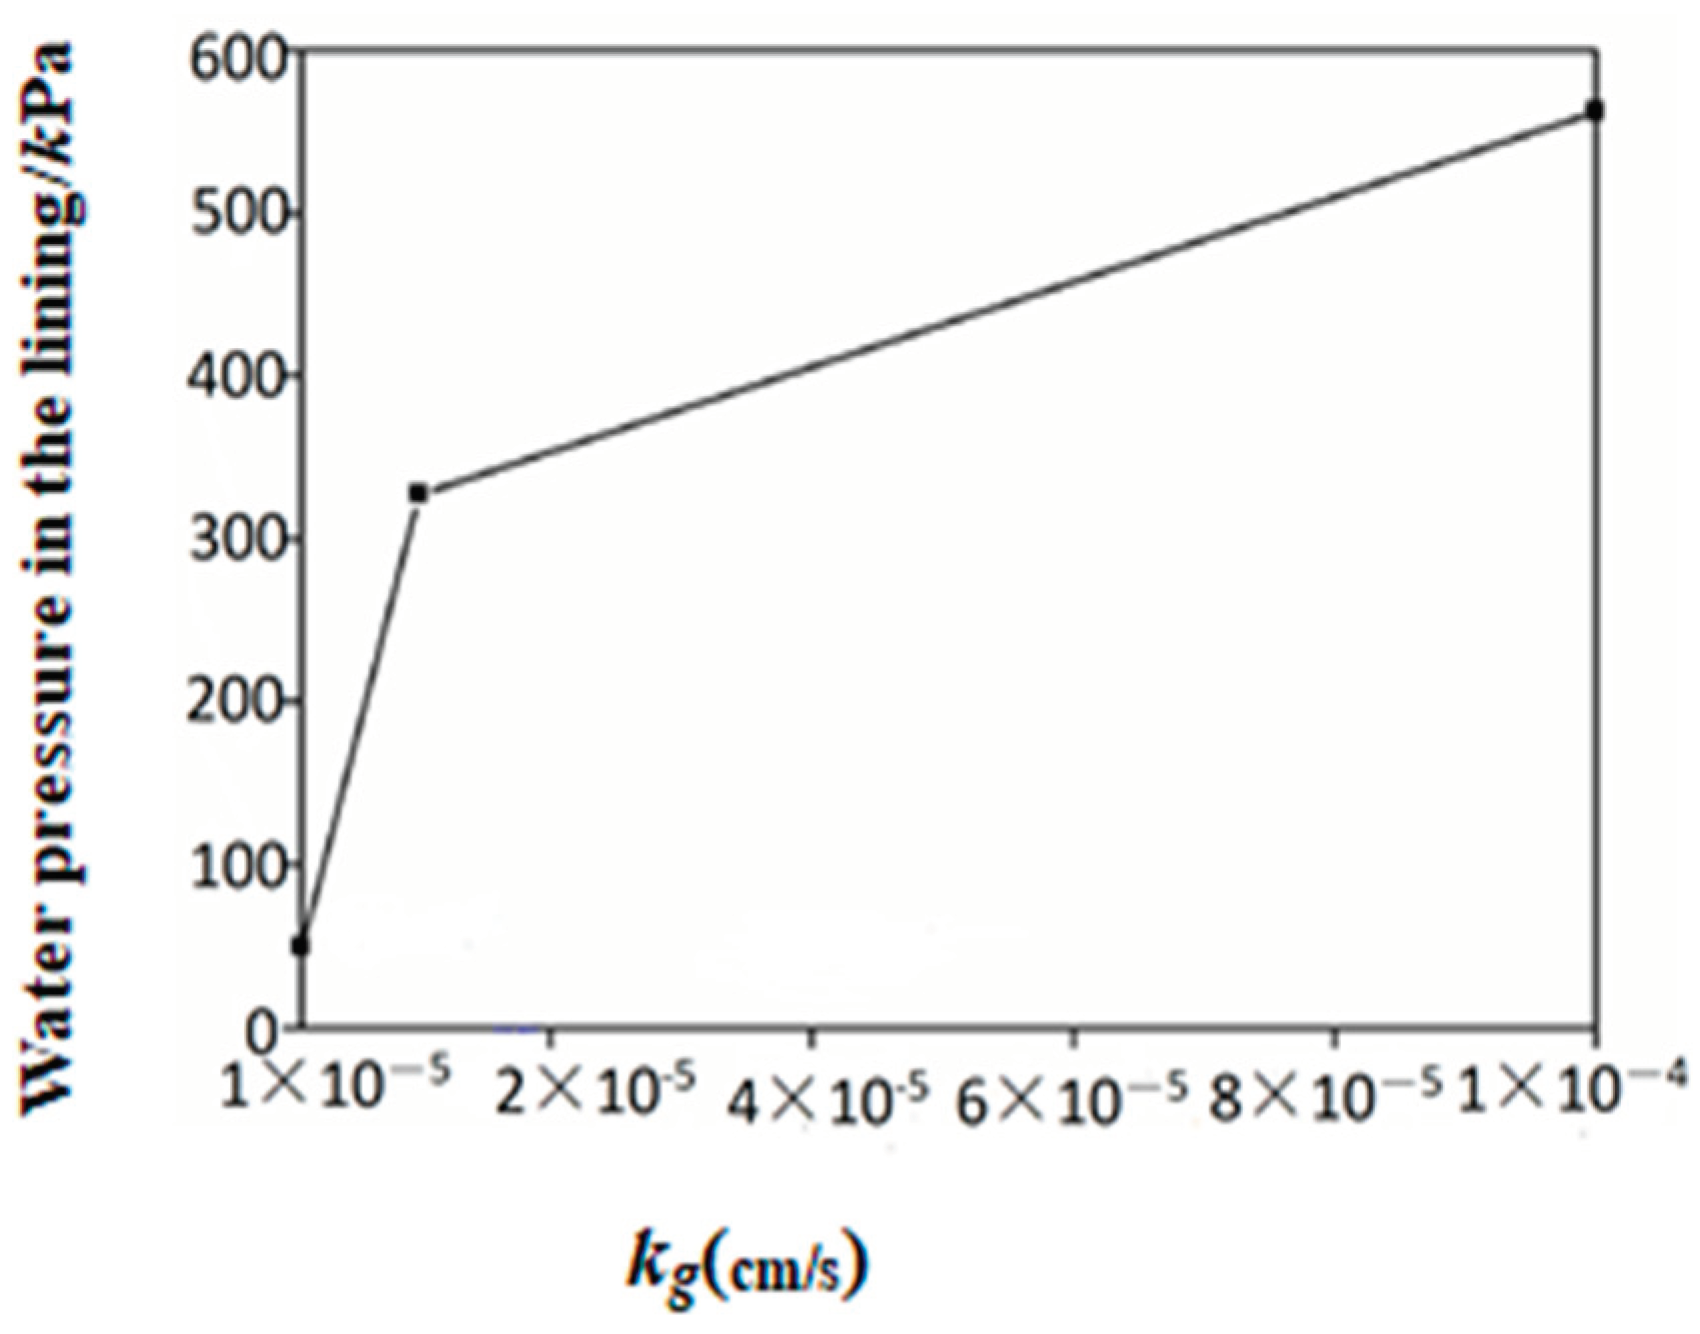
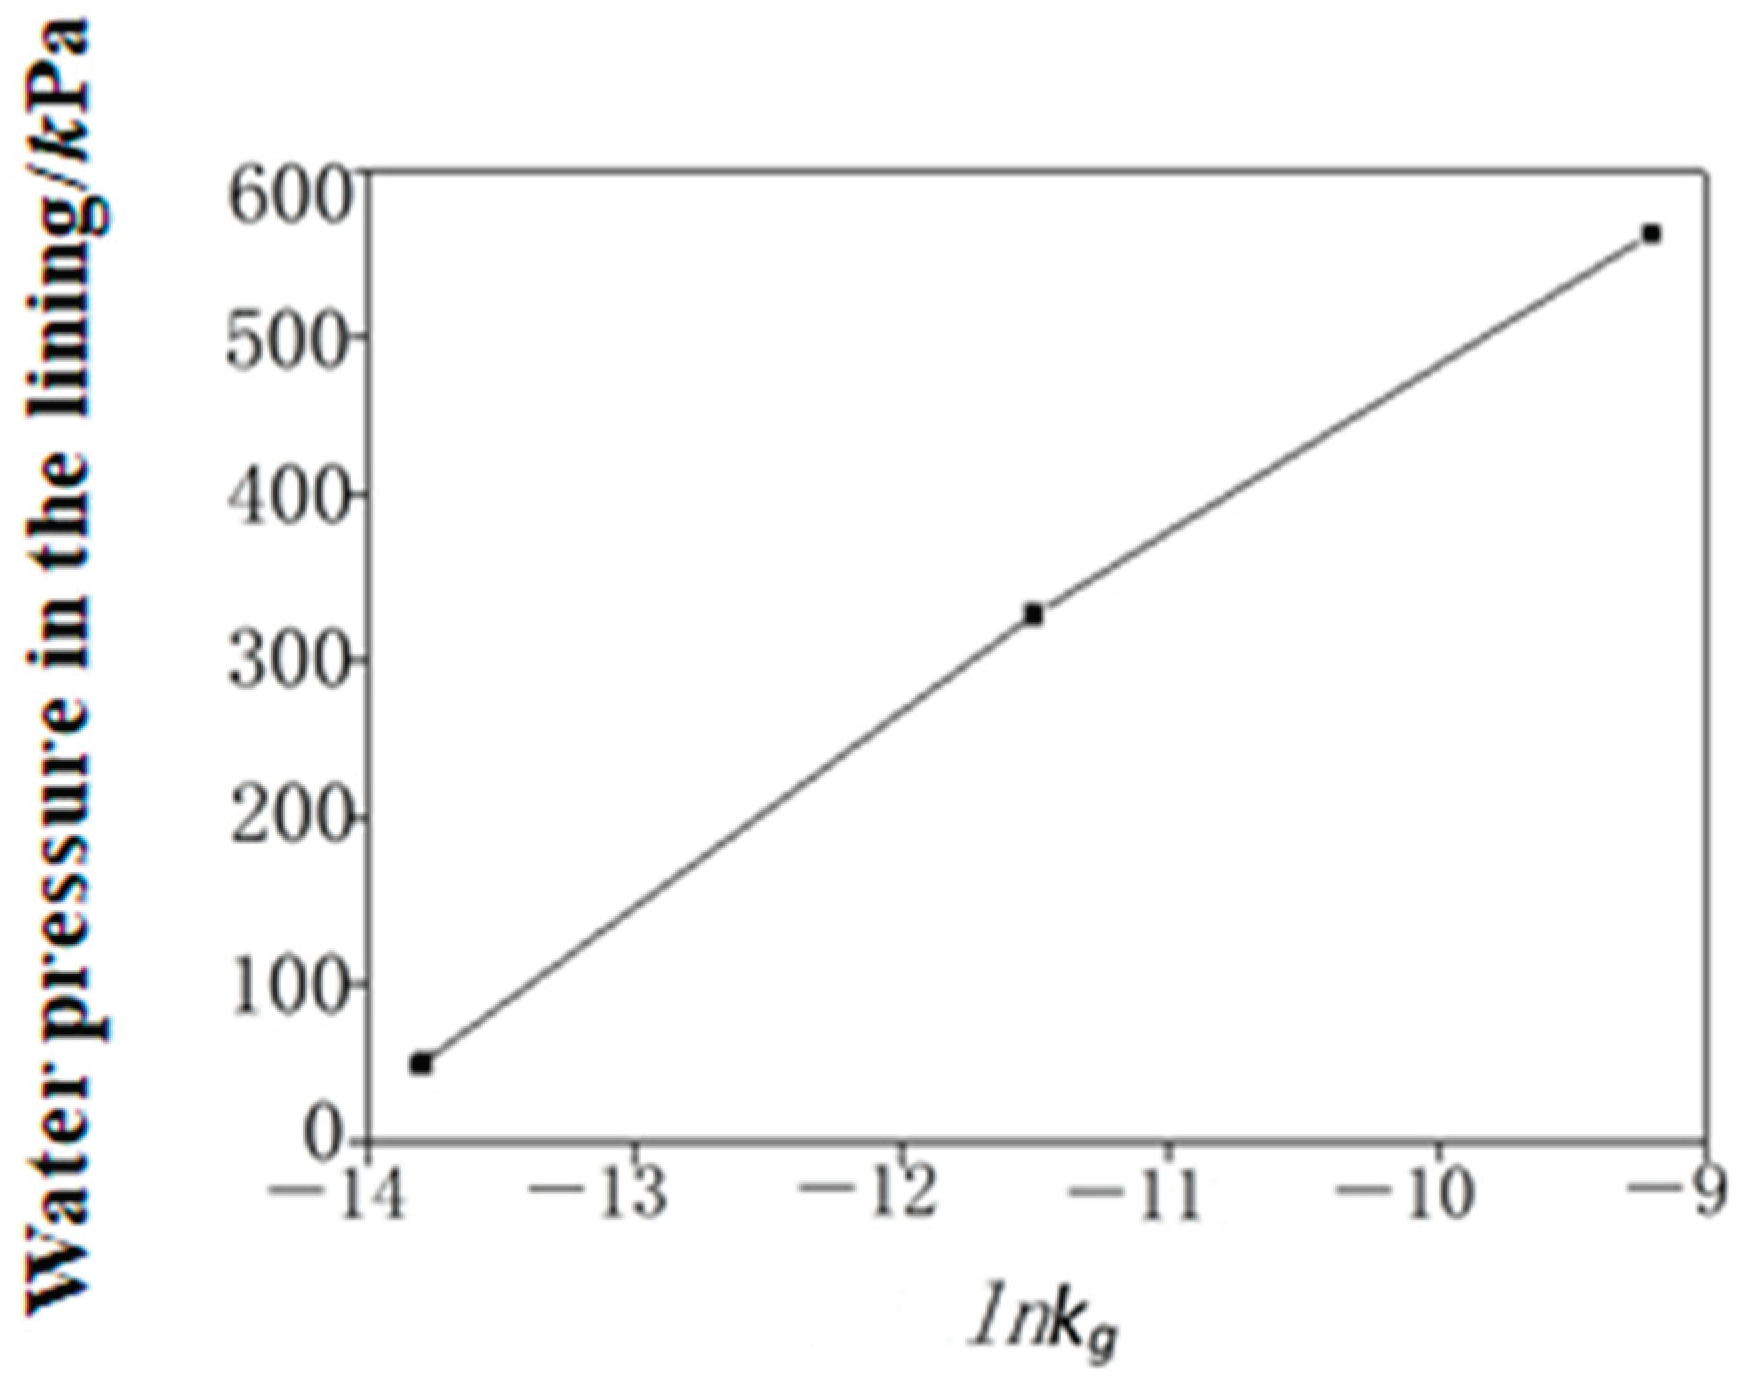
2.2.3. Grouting Ring Permeability Coefficient and Lining Water Pressure
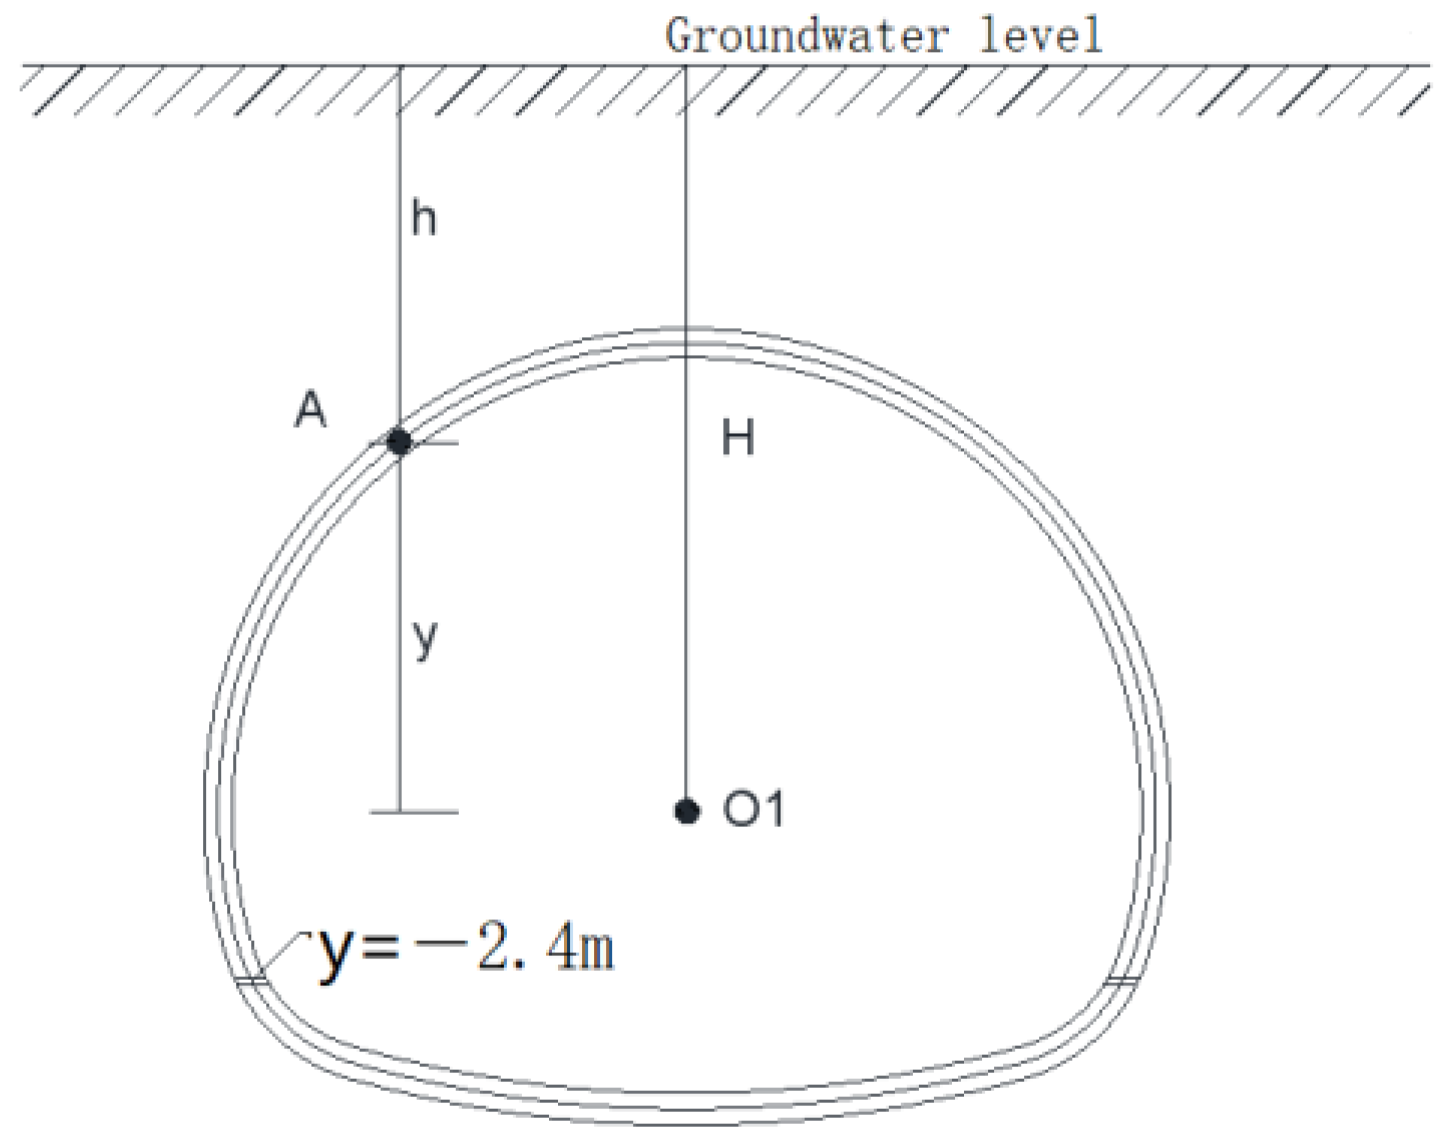
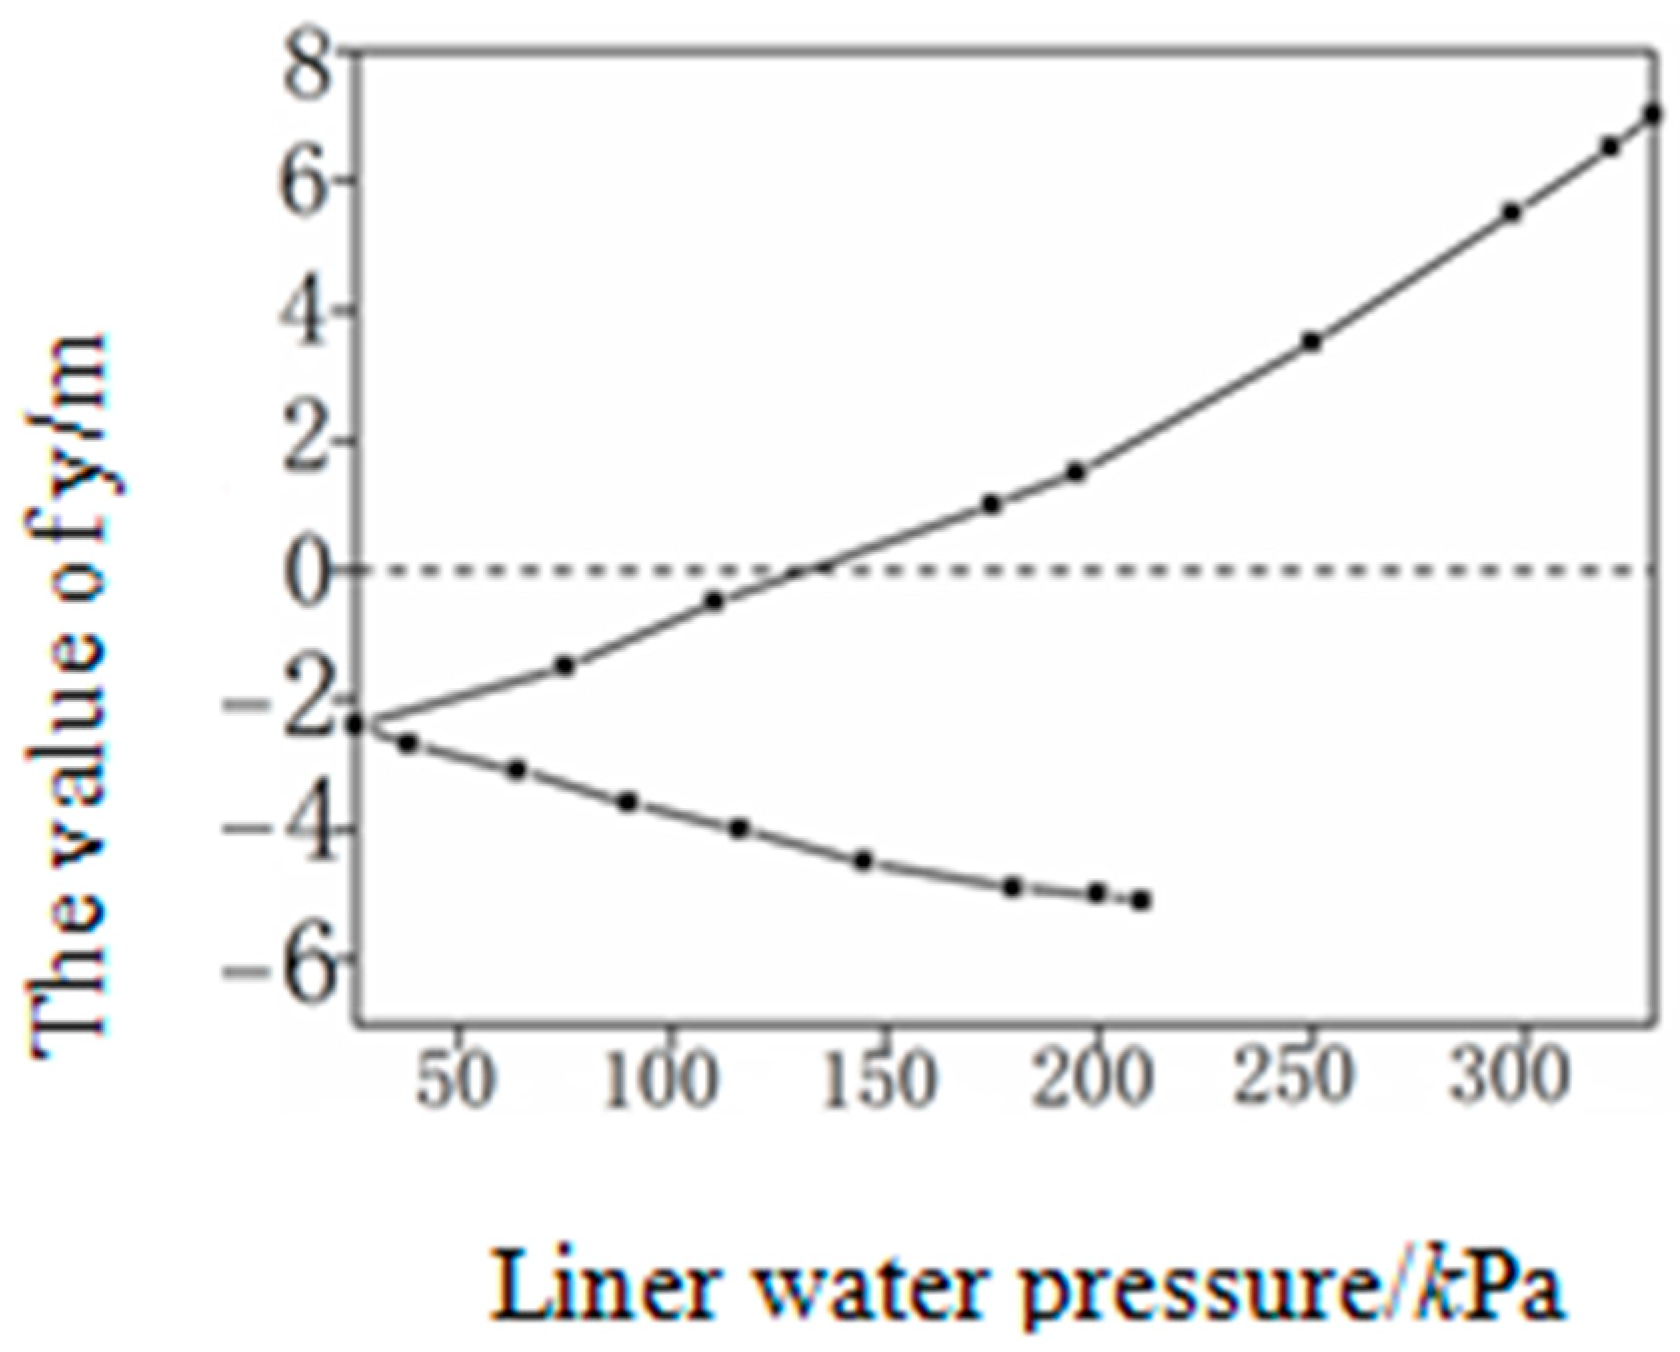
2.2.4. Maximum Lining Water Pressure and Lining Coordinates
2.3. Final Determination of Formula
3. Calculation of Stress on Lining Structure of Railway Tunnels in High-Pressure, Water-Rich Zones
3.1. Computational Approach and Selection of Working Conditions
- Computational Approach
- (1)
- For deep-buried tunnels, a groundwater head height H is initially selected, and the surrounding rock is classified as grade II, with type IIb lining selected. The permeability coefficient of the surrounding rock is set at cm/s and the grouting ring permeability coefficient at cm/s. On the basis of the conventional load structure method, the water pressure load (Formulas (9) and (10)) developed in this study is applied to the tunnel lining, the internal forces in the lining are extracted, and the minimum safety factor of the lining is calculated for comparison with the code limits.
- (2)
- The water head height is varied, and the calculations are repeated to find the water head height at which the minimum safety factor of the lining just meets the code requirements, which is termed the “safe water head height” under the given working conditions.
- (3)
- The permeability coefficients of the surrounding rock and the grouting reinforcement ring are varied to find the “safe water head height” under type IIb lining and grade II surrounding rock at different permeability coefficients.
- (4)
- The surrounding rock grade is varied, selecting grades II–V, to find the “safe water head height” for type IIb, IIIa, IVa, and Va linings under different surrounding rock grades and permeability coefficients.
- (5)
- The results are summarized in a reference table.
- Selection of Working Conditions
3.2. Computational Models and Parameter Selection
- (1)
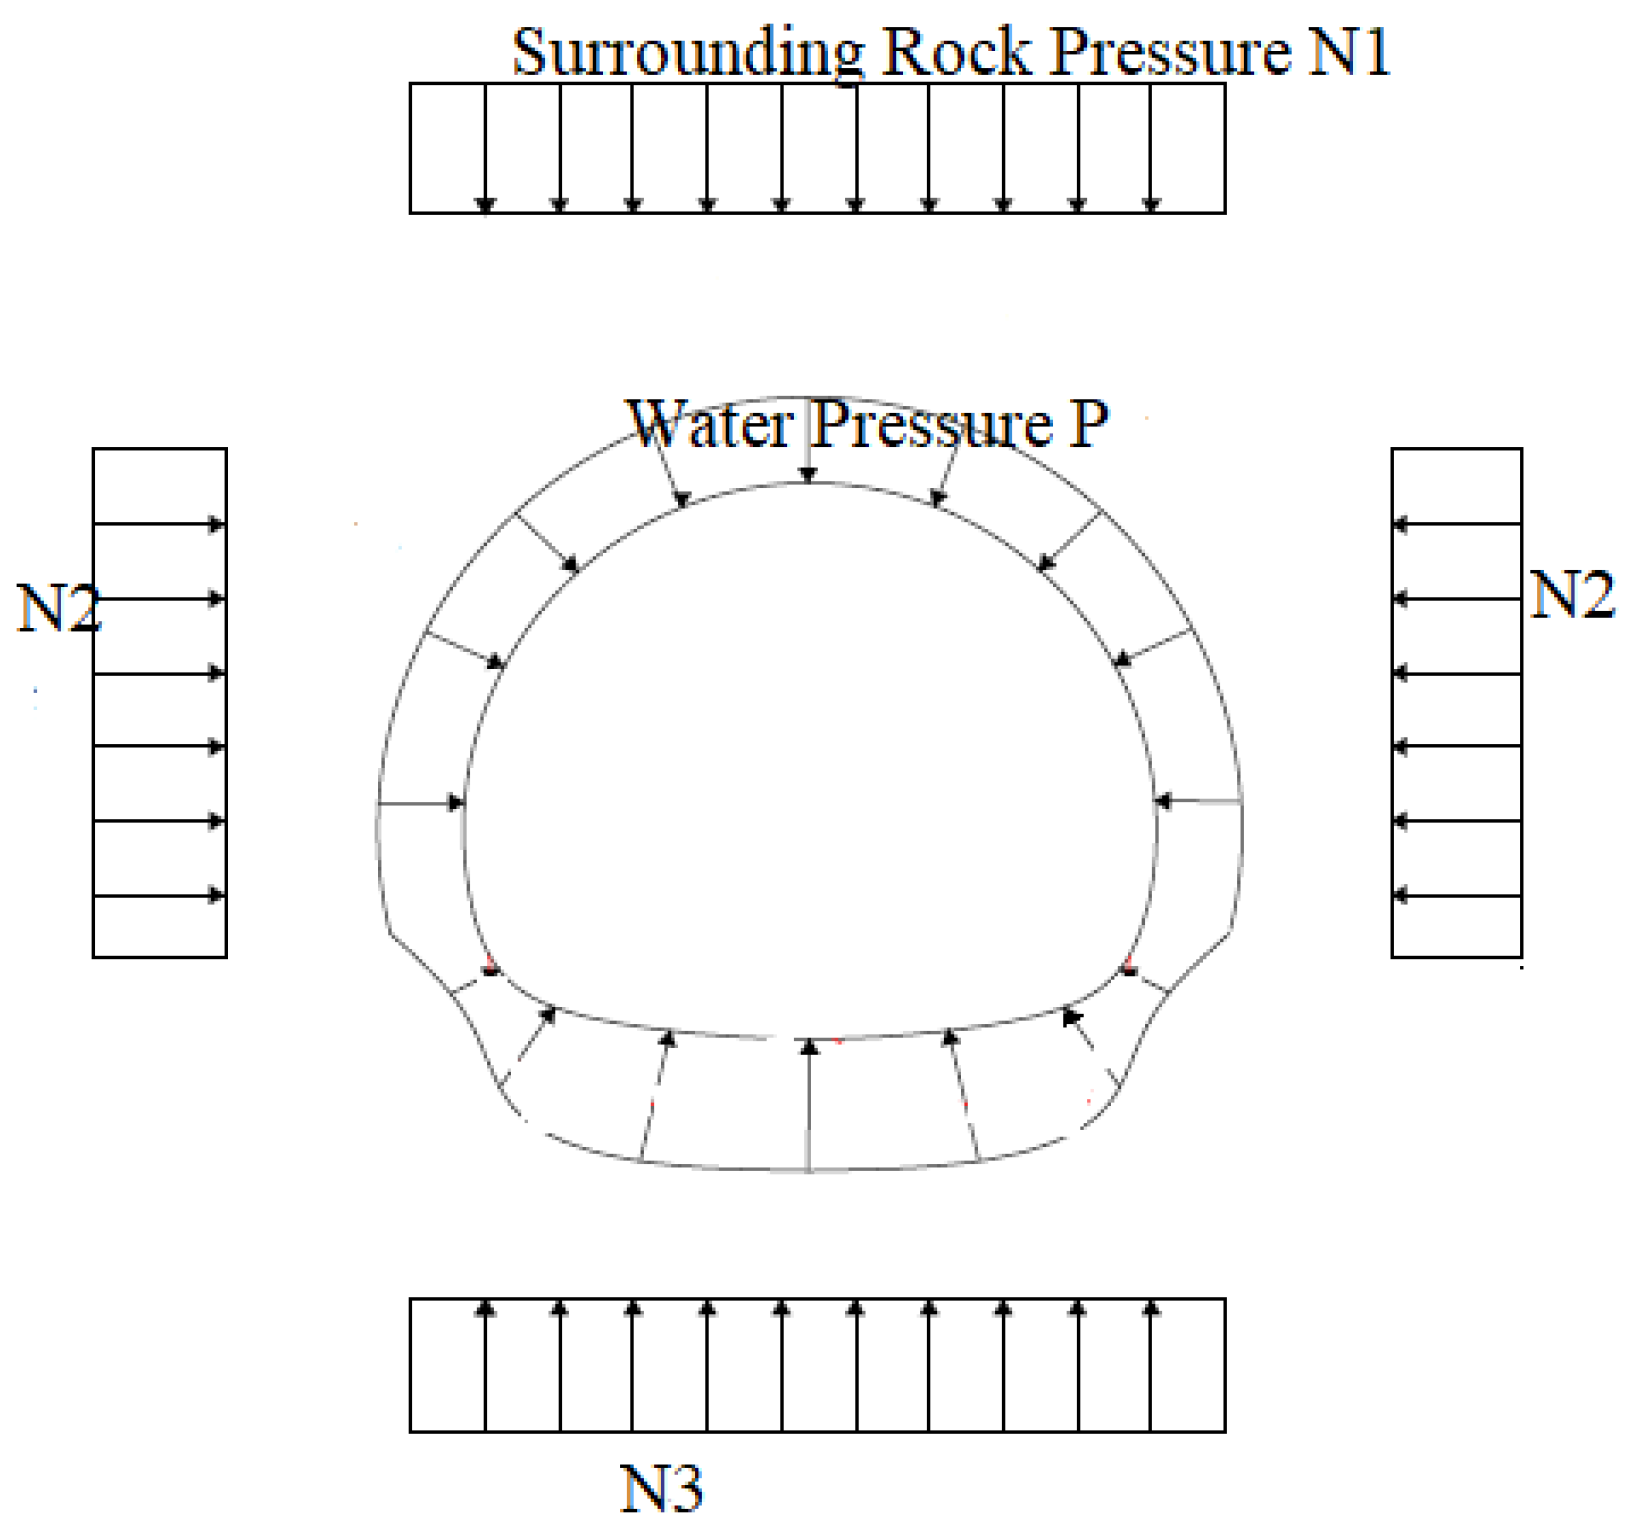
- Computational Models
- (2)
- Computational Parameters
3.3. Analysis of Lining Safe Water Head Calculation Results
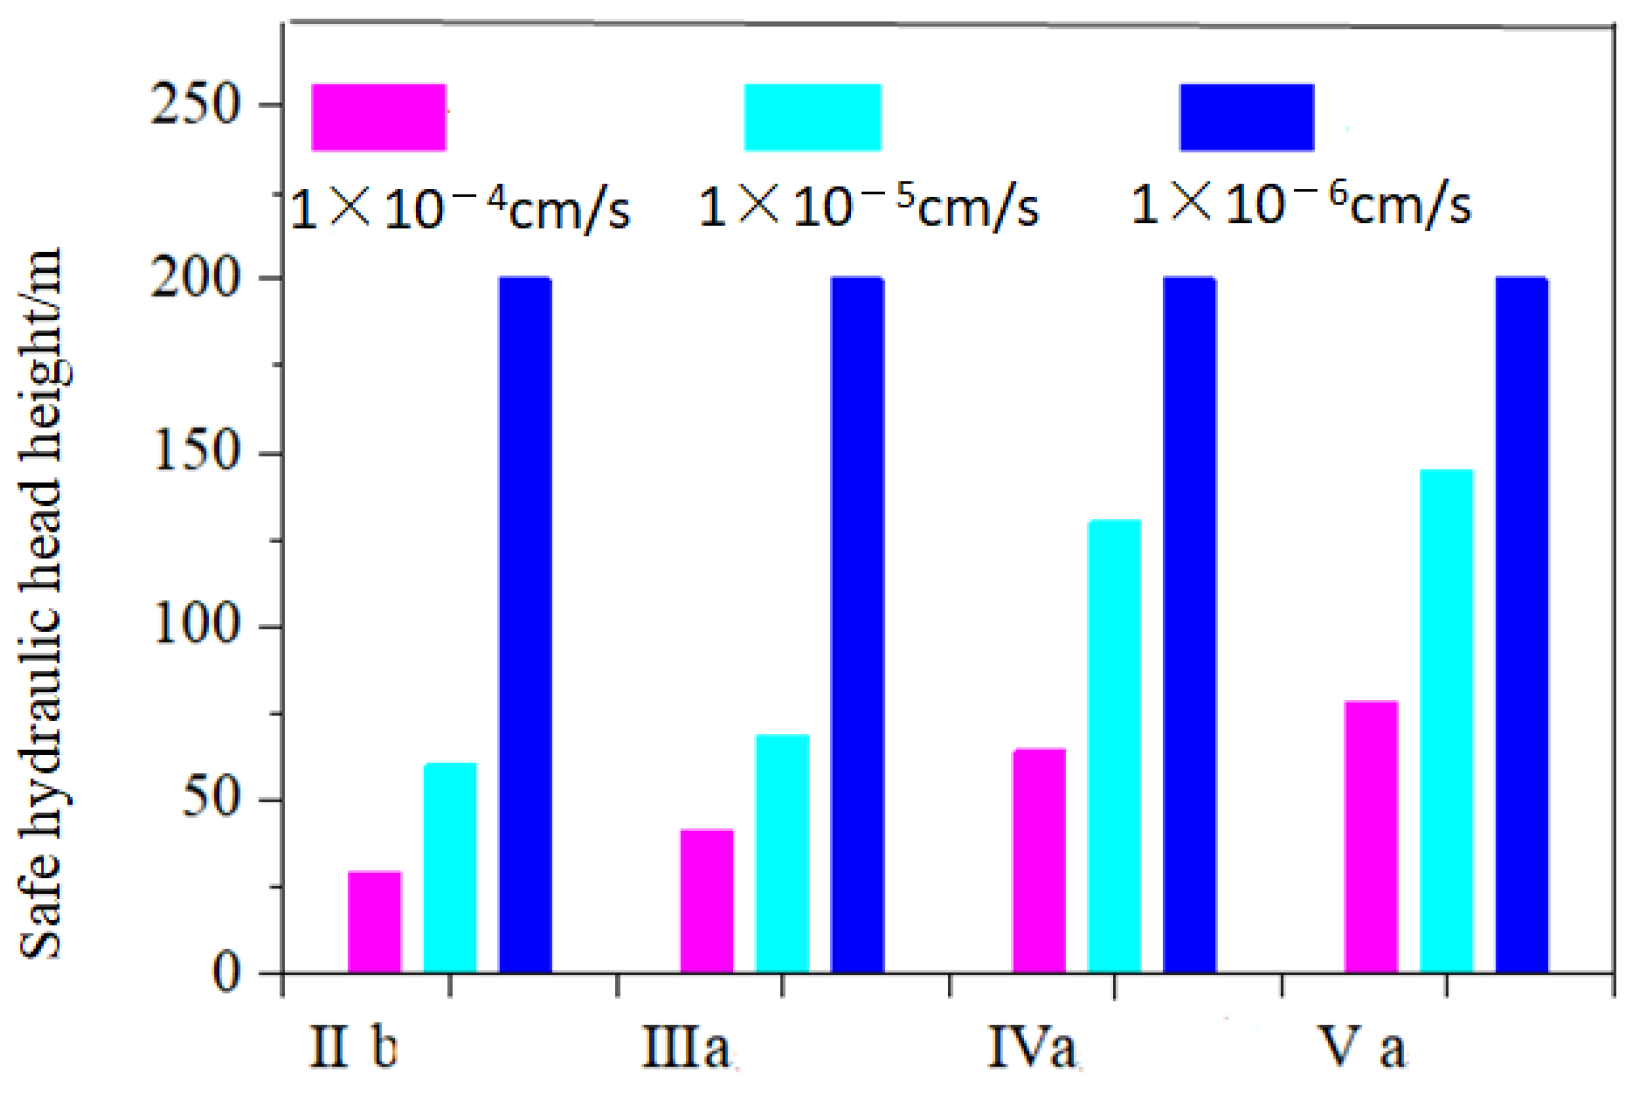
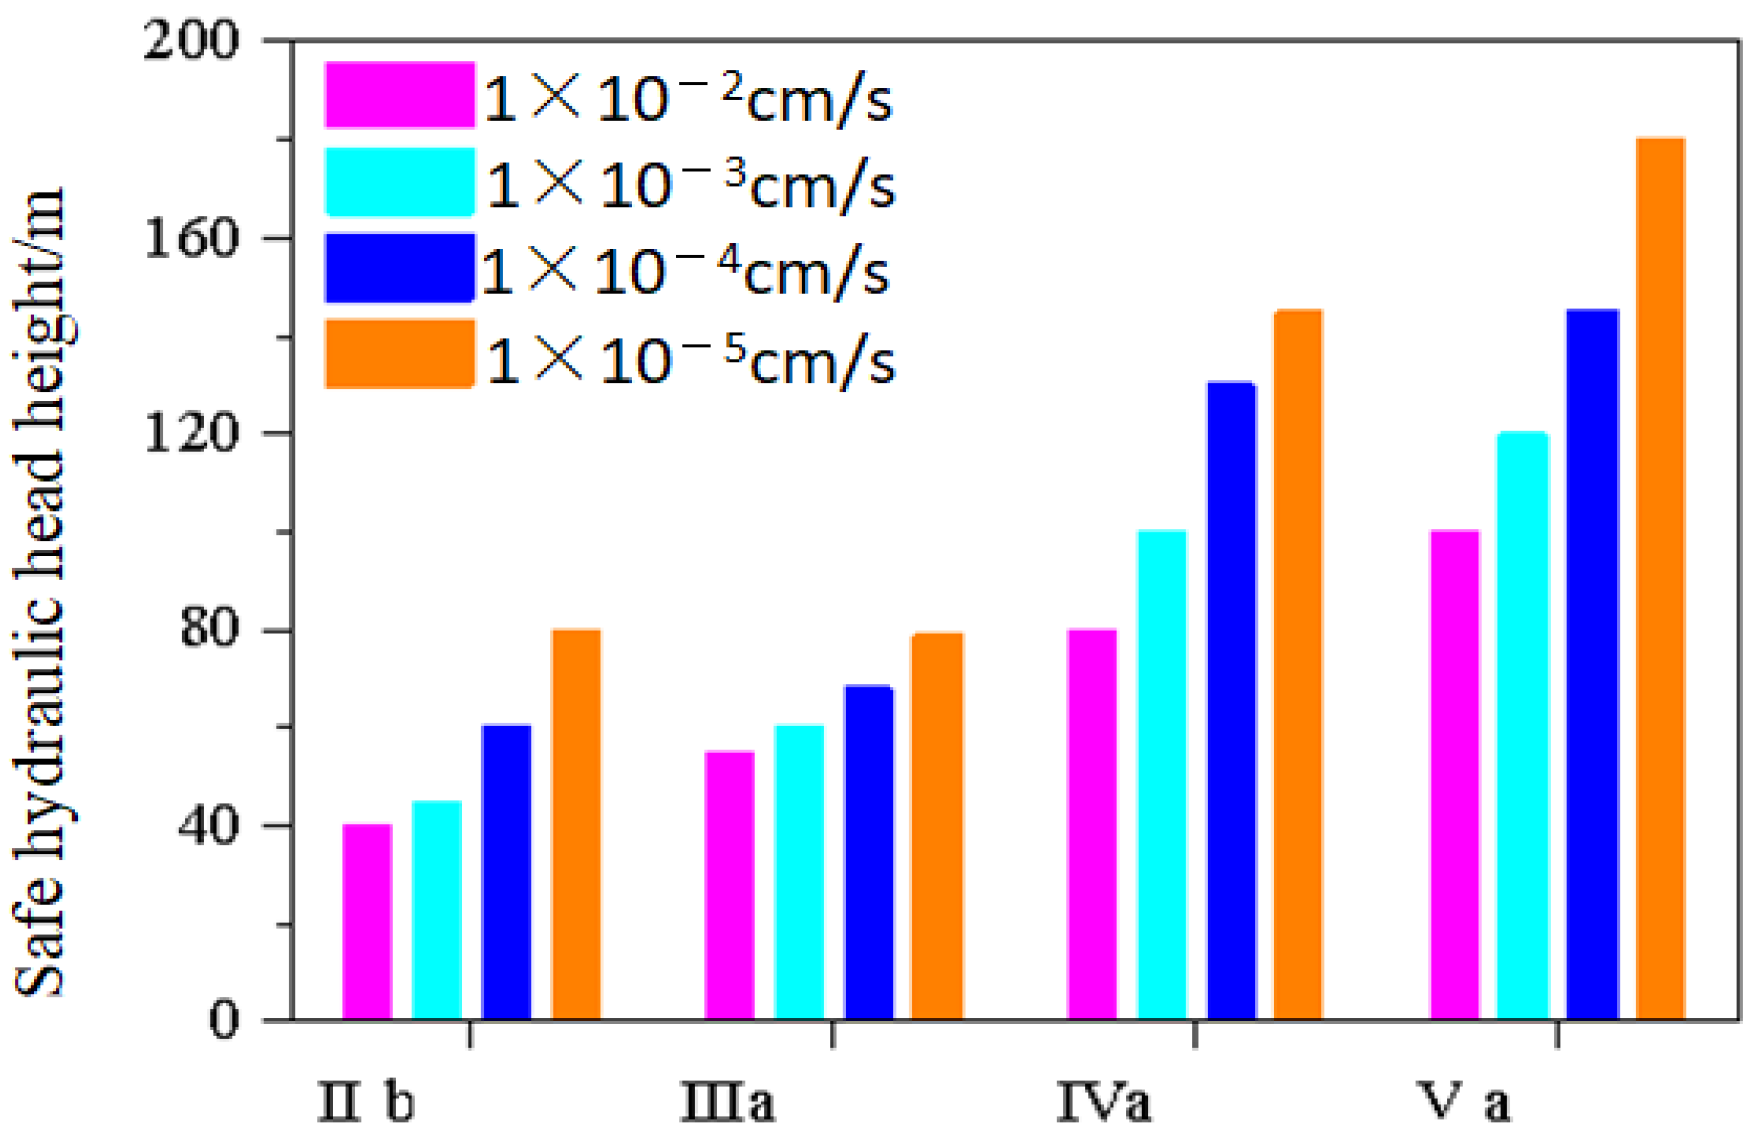
- It can be observed from Table 8 that, when the lining types were the same, a smaller permeability coefficient of the grouting reinforcement ring resulted in a higher safe water head for the lining. When the permeability coefficient of the grouting ring reached 10−6 cm/s, the safe water head of the lining exceeded 200 m under almost all working conditions.
- With the lining types being the same, a smaller permeability coefficient of the surrounding rock led to a higher safety water head for the lining. Therefore, for surrounding rocks with strong permeability, it is recommended to use grouting reinforcement to reduce the permeability of the surrounding rocks, thereby enhancing the safety of the lining.
3.4. Application of Lining Structure Safety Water Head Summary Table
4. Conclusions
- (1)
- A general calculation formula for water pressure on the lining of high-pressure, water-rich railway tunnels is provided, serving as a reference for tunnel lining design.
- (2)
- Calculations were performed to determine the safety water head heights for standard tunnel lining under various working conditions, which were then summarized in a table. This table enables the rapid querying of critical water head values for safety loading in tunnels under similar conditions.
- (3)
- A smaller permeability coefficient of the grouting ring results in a greater safety water head height and more secure lining load. Similarly, a smaller permeability coefficient of the surrounding rock results in greater water head pressure that the lining can withstand, thereby enhancing the safety of the lining.
- (4)
- This manuscript method can be used for railway tunnel design, taking into account the surrounding groundwater content, groundwater recharge, and adverse weather conditions to determine the type of tunnel lining.
- (5)
- The method in this manuscript only considers the influence of the permeability coefficient of the grouting reinforcement ring (kg) on the water pressure of the lining, without considering the influence of the thickness of the grouting ring. In numerical calculations, the thickness of the grouting ring is taken as 5 m.
- (6)
- The method used in this manuscript is based on numerical calculations. Next, the tunnel lining water pressure formula can be improved by comprehensively considering indoor experiments, on-site testing, and other data.
Author Contributions
Funding
Data Availability Statement
Conflicts of Interest
References
- Lamas, L.N.; Leitão, N.S.; Esteves, C.; Plasencia, N. First infilling of the Venda Nova II unlined high-pressure tunnel: Observed behaviour and numerical modelling. Rock Mech. Rock Eng. 2014, 47, 885–904. [Google Scholar] [CrossRef]
- Fang, Y.; Guo, J.; Grasmick, J.; Mooney, M. The effect of external water pressure on the liner behavior of large cross-section tunnels. Tunn. Undergr. Space Technol. 2016, 60, 80–95. [Google Scholar] [CrossRef]
- Harr, M.E. Groundwater and seepage. Soil Sci. 1963, 95, 289. [Google Scholar] [CrossRef]
- Bloodworth, A.; Su, J. Numerical analysis and capacity evaluation of composite sprayed concrete lined tunnels. Undergr. Space 2018, 3, 87–108. [Google Scholar] [CrossRef]
- Li, H.Z.; Low, B.K. Reliability analysis of circular tunnel under hydrostatic stress field. Comput. Geotech. 2010, 37, 50–58. [Google Scholar] [CrossRef]
- Yoo, C. Interaction between tunneling and groundwater—Numerical investigation using three dimensional stress–pore pressure coupled analysis. J. Geotech. Geoenviron. Eng. 2005, 131, 240–250. [Google Scholar] [CrossRef]
- Xu, P.Y.; Zhang, L.M.; Zhang, J.Y.; Wang, J.X.; Zhang, S.L.; Zhang, P.C. Progressive Failure Characteristics and Failure Symptoms of Straight-Walled Arched Sandstone Tunnels. Acadlore Trans. Geosci. 2023, 2, 46–57. [Google Scholar] [CrossRef]
- Qiu, Y.; Feng, K.; He, C.; Zhang, L.; Wang, C. Investigation of the ultimate bearing capacity of a staggered assembly segmental lining for an urban gas transmission tunnel. Sustain. Cities Soc. 2019, 48, 101551. [Google Scholar] [CrossRef]
- Murillo, C.A.; Shin, J.H.; Kim, K.H.; Colmenares, J.E. Performance tests of geotextile permeability for tunnel drainage systems. KSCE J. Civ. Eng. 2014, 18, 827–830. [Google Scholar] [CrossRef]
- Leung, C.; Meguid, M.A. An experimental study of the effect of local contact loss on the earth pressure distribution on existing tunnel linings. Tunn. Undergr. Space Technol. 2011, 26, 139–145. [Google Scholar] [CrossRef]
- Khezri, N.; Mohamad, H.; HajiHassani, M.; Fatahi, B. The stability of shallow circular tunnels in soil considering variations in cohesion with depth. Tunn. Undergr. Space Technol. 2015, 49, 230–240. [Google Scholar] [CrossRef]
- Mashimo, H.; Ishimura, T. Evaluation of the load on shield tunnel lining in gravel. Tunn. Undergr. Space Technol. 2003, 18, 233–241. [Google Scholar] [CrossRef]
- British Tunneling Society. Tunnel Lining Design Guide; Thomas Telford: London, UK, 2004. [Google Scholar]
- Ishii, H.; Akita, K.; Iura, T. Development of flat insulated lining method and its application for Shinkansen tunneling. In Underground-The Way to the Future: Proceedings of the World Tunnel Congress, Geneva, Switzerland, 31 May–5 June 2013; CRC Press: Boca Raton, FL, USA, 2013; pp. 1488–1495. [Google Scholar]
- Pantelides, C.P.; Burkhart, B.A.; Reaveley, L.D.; Platt, D. Short-span and full-scale experiments of a prefabricated composite floor-building system. J. Perform. Constr. Facil. 2016, 30, 04015018. [Google Scholar] [CrossRef]
- Abbo, A.J.; Wilson, D.W.; Sloan, S.W.; Lyamin, A.V. Undrained stability of wide rectangular tunnels. Comput. Geotech. 2013, 53, 46–59. [Google Scholar] [CrossRef]
- Yamamoto, K.; Lyamin, A.V.; Wilson, D.W.; Sloan, S.W.; Abbo, A.J. Stability of dual circular tunnels in cohesive-frictional soil subjected to surcharge loading. Comput. Geotech. 2013, 50, 41–54. [Google Scholar] [CrossRef]
- Liu, H.J.; Wu, P. Stability Analysis of Gentle Dip Thick Ore Body Mining Based on the Integration of SURPAC-FLAC3D. Acadlore Trans. Geosci. 2023, 2, 58–69. [Google Scholar] [CrossRef]
- TB10003-2016; Code for Design on Tunnel of Railway. China Railway Corporation: Beijing, China, 2016.
- Chinese Academy of Engineering, Institute of Geomechanics. Engineering Geological Manual; China Architecture & Building Press: Beijing, China, 2017. [Google Scholar]


| Water Head Height/m | kg/kr | 10−2 cm/s | 10−3 cm/s | 10−4 cm/s | 10−5 cm/s |
|---|---|---|---|---|---|
| 20 | 10−4 cm/s | Working conditions 1 | Working conditions 2 | Working conditions 3 | Working conditions 4 |
| 10−5 cm/s | Working conditions 5 | Working conditions 6 | Working conditions 7 | Working conditions 8 | |
| 10−6 cm/s | Working conditions 9 | Working conditions 10 | Working conditions 11 | Working conditions 12 | |
| 50 | 10−4 cm/s | Working conditions 13 | Working conditions 14 | Working conditions 15 | Working conditions 16 |
| 10−5 cm/s | Working conditions 17 | Working conditions 18 | Working conditions 19 | Working conditions 20 | |
| 10−6 cm/s | Working conditions 21 | Working conditions 22 | Working conditions 23 | Working conditions 24 | |
| 100 | 10−4 cm/s | Working conditions 25 | Working conditions 26 | Working conditions 27 | Working conditions 28 |
| 10−5 cm/s | Working conditions 29 | Working conditions 30 | Working conditions 31 | Working conditions 32 | |
| 10−6 cm/s | Working conditions 33 | Working conditions 34 | Working conditions 35 | Working conditions 36 | |
| 150 | 10−4 cm/s | Working conditions 37 | Working conditions 38 | Working conditions 39 | Working conditions 40 |
| 10−5 cm/s | Working conditions 41 | Working conditions 42 | Working conditions 43 | Working conditions 44 | |
| 10−6 cm/s | Working conditions 45 | Working conditions 46 | Working conditions 47 | Working conditions 48 | |
| 200 | 10−4 cm/s | Working conditions 49 | Working conditions 50 | Working conditions 51 | Working conditions 52 |
| 10−5 cm/s | Working conditions 53 | Working conditions 54 | Working conditions 55 | Working conditions 56 | |
| 10−6 cm/s | Working conditions 57 | Working conditions 58 | Working conditions 59 | Working conditions 60 |
| Material | Density (kg/m3) | Density (kg/m3) | Poisson’s Ratio | Internal Friction Angle | Cohesion (GPa) | Porosity | Coefficient (cm/s) |
|---|---|---|---|---|---|---|---|
| Surrounding rock | 2000 | 1.5 | 0.35 | 20 | 0.1 | 0.2 | |
| Lining | 2500 | 35 | 0.2 | - | - | 0.1 | 1 × 10⁻⁶ |
| Drainage hole | 2500 | 35 | 0.2 | - | - | 0.5 | 7.85 × 10⁻³ |
| Inverted arch filling | 2300 | 28 | 0.2 | - | - | 0.15 | 2 × 10⁻⁶ |
| Drainage ditch | 2300 | 35 | 0.2 | - | - | 0.2 | 2 × 10⁻⁶ |
| Radial blind pipes | 2000 | 1.5 | 0.35 | 20 | 0.1 | 0.5 | 2.45 × 10⁻³ |
| Rock Level | Qualitative Characteristics | Basic Quality Indicators of Rock Mass (BQ) (MPa) |
|---|---|---|
| I | Hard rock, complete rock mass | >550 |
| II | Hard rock, sub-complete rock mass Sub-hard rock, complete rock mass | 550~451 |
| III | Hard rock, some broken Some Soft rock, complete rock mass | 450~351 |
| IV | Hard rock, broken rock mass Soft rock, complete rock mass | 350~251 |
| V | Soft rock, broken rock mass | <250 |
| Grade | State | Seepage Amount (L/(min·10 m)) |
|---|---|---|
| I | Dry or Damp | <10 |
| II | Occasional Seepage | 10~25 |
| III | Regular Seepage | 25~125 |
| Groundwater State Grade | Surrounding Rock Grade | |||||
|---|---|---|---|---|---|---|
| I | II | III | IV | V | VI | |
| I | I | II | III | IV | V | - |
| II | I | II | IV | V | VI | - |
| III | II | III | IV | V | VI | - |
| Surrounding Rock and Lining | kg | kr | |||
|---|---|---|---|---|---|
| 10−2 cm/s | 10−3 cm/s | 10−4 cm/s | 10−5 cm/s | ||
| Grade II Type IIb Lining | 10−4 cm/s | Working conditions 1 | Working conditions 2 | Working conditions 3 | Working conditions 4 |
| 10−5 cm/s | 5 | 6 | 7 | 8 | |
| 10−6 cm/s | 9 | 10 | 11 | 12 | |
| Grade III Type IIIa Lining | 10−4 cm/s | Working conditions 12 | Working conditions 14 | Working conditions 15 | Working conditions 16 |
| 10−5 cm/s | 17 | 18 | 19 | 20 | |
| 10−6 cm/s | 21 | 22 | 23 | 24 | |
| Grade IV Type IVa Lining | 10−4 cm/s | Working conditions 25 | Working conditions 26 | Working conditions 27 | Working conditions 28 |
| 10−5 cm/s | 29 | 30 | 31 | 32 | |
| 10−6 cm/s | 33 | 34 | 35 | 36 | |
| Grade V Type Va Lining | 10−4 cm/s | Working conditions 37 | Working conditions 38 | Working conditions 39 | Working conditions 40 |
| 10−5 cm/s | 41 | 42 | 43 | 44 | |
| 10−6 cm/s | 45 | 46 | 47 | 48 | |
| Surrounding Rock Grade | Unit Weight (kN/m3) | Elastic Reaction Coefficient (MPa/m) | Lining Selection | Lining Circumferential Reinforcement Configuration |
|---|---|---|---|---|
| II | 26 | 1500 | IIb | Plain Concrete |
| III | 24 | 850 | IIIa | Plain Concrete |
| IV | 20 | 300 | IVa | 18@200 |
| V | 18 | 150 | Va | 20@200 |
| Surrounding Rock and Lining | kg | kr | |||
|---|---|---|---|---|---|
| 10−2 cm/s | 10−3 cm/s | 10−4 cm/s | 10−5 cm/s | ||
| Grade II Surrounding Rock Type IIb Lining | 10−4 cm/s | 20 m | 24 m | 29 m | 35 m |
| 10−5 cm/s | 40 m | 45 m | 60 m | 80 m | |
| 10−6 cm/s | 120 m | 150 m | >200 m | >200 m | |
| Grade III Surrounding Rock Type IIIa Lining | 10−4 cm/s | 32 m | 36 m | 41 m | 46 m |
| 10−5 cm/s | 55 m | 60 m | 68 m | 79 m | |
| 10−6 cm/s | 130 m | >200 m | >200 m | >200 m | |
| Grade IV Surrounding Rock Type IVa Lining | 10−4 cm/s | 50 m | 56 m | 64 m | 78 m |
| 10−5 cm/s | 80 m | 100 m | 130 m | 150 m | |
| 10−6 cm/s | 170 m | >200 m | >200 m | >200 m | |
| Grade V Surrounding Rock Type Va Lining | 10−4 cm/s | 62 m | 67 m | 78 m | 90 m |
| 10−5 cm/s | 100 m | 120 m | 145 m | 180 m | |
| 10−6 cm/s | >200 m | >200 m | >200 m | >200 m | |
Disclaimer/Publisher’s Note: The statements, opinions and data contained in all publications are solely those of the individual author(s) and contributor(s) and not of MDPI and/or the editor(s). MDPI and/or the editor(s) disclaim responsibility for any injury to people or property resulting from any ideas, methods, instructions or products referred to in the content. |
© 2023 by the authors. Licensee MDPI, Basel, Switzerland. This article is an open access article distributed under the terms and conditions of the Creative Commons Attribution (CC BY) license (https://creativecommons.org/licenses/by/4.0/).
Share and Cite
Ma, Y.; Wang, Z.; Wang, D. The Safe Load-Bearing Capacity of Railway Tunnel Linings under High-Pressure and Water-Rich Conditions. Buildings 2023, 13, 2154. https://doi.org/10.3390/buildings13092154
Ma Y, Wang Z, Wang D. The Safe Load-Bearing Capacity of Railway Tunnel Linings under High-Pressure and Water-Rich Conditions. Buildings. 2023; 13(9):2154. https://doi.org/10.3390/buildings13092154
Chicago/Turabian StyleMa, Yanna, Zhenyu Wang, and Dan Wang. 2023. "The Safe Load-Bearing Capacity of Railway Tunnel Linings under High-Pressure and Water-Rich Conditions" Buildings 13, no. 9: 2154. https://doi.org/10.3390/buildings13092154