Article

Two-Step Identification Method and Experimental Verification of Weld Damage at Joints in Spatial Grid Structures

1
School of Civil Engineering and Architecture, Wuhan University of Technology, Wuhan 430070, China
2
Hainan Institute of Wuhan University of Technology, Sanya 572025, China
*
Author to whom correspondence should be addressed.
Buildings 2023, 13(9), 2141; https://doi.org/10.3390/buildings13092141
Submission received: 16 July 2023 / Revised: 12 August 2023 / Accepted: 18 August 2023 / Published: 23 August 2023
(This article belongs to the Special Issue Advanced Numerical and Computer Methods in Civil Engineering)

Abstract

:
Welded joints in grid structures are susceptible to damage and destruction when exposed to random excitation. The complexity of the grid structure poses challenges for realizing the damage recognition of welded joints. In this study, a two-step method is proposed specifically for damage identification of welded joints in grid structures, combining wavelet analysis and fuzzy pattern recognition to accurately identify the location and extent of damage in welded joints. Firstly, the structure is divided based on the analysis of the influence range of joint damage. Key joints are selected within the sub-regions where sensors are installed, and the acceleration response of these key joints is measured. Wavelet analysis is then applied to identify the sub-regions where weld damage occurs. Secondly, an equivalent finite element model is established for joints with varying degrees of damage. The damage index, calculated as the ratio of the absolute value of the difference in the first-order element strain mode of the members, increases with the degree of damage during joint weld damage. By monitoring the changes in the damage index of sensitive members, which exhibit significant changes with varying weld damage degrees, a damage pattern database is constructed for each sub-region. The membership degree between joint damage and the patterns in the pattern database is then calculated to determine the location and degree of weld damage. To validate the effectiveness of the proposed method, an experiment was conducted using a grid structure model with replaceable members. Highly sensitive FBG sensors were designed to measure the acceleration response of the joints, resulting in accurate identification of damaged sub-regions solely through the measurement of key joint acceleration responses. Furthermore, within the damaged sub-regions, the fuzzy pattern recognition method precisely determined the location and degree of weld damage in the joints. The experimental results demonstrate that the proposed method effectively reduces the complexity of the structure by dividing the grid structure into sub-regions, and enables the two-step identification method to achieve successful damage identification for the joints in the grid structure with high efficiency and accuracy.

1. Introduction

Welded spatial grid structures are extensively utilized in civil engineering, particularly in densely populated public areas like exhibition halls, stadiums, and theaters, which often serve as prominent architectural landmarks in cities. The occurrence of engineering accidents in these structures can result in significant economic losses and have severe social implications. Among the various components of welded grid structures, welded hollow spherical joints are particularly prone to damage due to the complex multi-directional loading conditions they experience. Moreover, Adin analyzed the mechanical properties of welded joints produced by different welding methods and pointed out that the welding methods have great influence on the mechanical properties of welded joints [1]. Wu et al., indicated that due to the welding process and environmental influences, the welding zone tended to lead to stress concentration, making the welded joints vulnerable locations for structural damage [2]. Therefore, it is essential to accurately identify any damage that may occur in these joints to ensure the safety of such structures in service.
The dynamic responses of engineering structures often contain valuable information that can provide insights into their working performance and condition. Analyzing the dynamic response enables us to understand dynamic characteristics and assess structural integrity to a certain extent. Several studies have focused on structural damage identification based on modal parameters extracted from dynamic response. Wei et al., conducted a comprehensive review of methods for damage identification in beams or plates, considering modal parameters such as natural frequencies, modal shapes, curved modal shapes, and a combination of modal shapes and frequencies [3]. Similarly, Zhu et al., developed an effective damage detection method for shear wall structures by analyzing variations in first-mode amplitudes [4]. Yin et al., proposed a practical method for detecting damage in bolted joints using noisy incomplete modal parameters by only limited data acquisition, and demonstrated the effectiveness of the combination of numerical simulations and experimental validations [5]. Ditommaso et al., proposed a methodology for damage localization in frame structures subjected to strong ground motion through monitoring modal curvature variations [6]. Zhang et al., introduced a displacement modal shape processing method based on difference accumulation, which was used as a damage characterization parameter to detect damage in composite materials [7]. Zhou et al., investigated modal flexibility extraction and damage identification using multi-reference hammering in reinforced concrete (RC) beams, and performed static and dynamic experiments on simply supported RC beams to validate this method [8]. Chang et al., demonstrated the effectiveness of modal parameter identification and vibration-based damage detection through field experiments on a simply supported steel truss bridge [9]. Fang et al., employed a substructure-based damage identification method utilizing the acceleration frequency response function (FRF) to identify damage in a six-story steel frame structure [10]. These studies highlight the significance and potential of using dynamic response analysis for structural damage identification. However, as the complexity of the structure increases, the sensitivity of damage identification methods that rely on changes in structural dynamic characteristics as damage indicators becomes less robust. This makes it difficult to apply these damage identification methods to practical structures.
The modal strain energy (MSE), derived from the structural modal shape and stiffness matrix, has been recognized as a sensitive physical property that undergoes changes before and after structural damage. As a result, several damage identification methods utilize modal strain energy as a damage indicator in structural health monitoring. Cha et al., proposed a novel damage detection method that employed a hybrid multi-objective optimization algorithm based on MSE to detect damages in various three-dimensional steel structures [11]. Li et al., developed an improved modal strain energy (IMSE) method for detecting damage in offshore platform structures, utilizing modal frequencies as the basis for the approach. Numerical and experimental studies both demonstrated the effectiveness and practicality of the IMSE method [12]. Arefi et al., employed MSE and modal shapes reconstructed by the Guyan reduction method (GRM) as damage indices for identifying structural damage [13]. Huang et al., addressed computational efficiency and the lack of high-sensitivity damage indices in structural damage identification by proposing a framework based on the modal frequency strain energy assurance criterion (MFSEAC), modal flexibility, and an enhanced moth–flame optimization algorithm [14]. These studies highlight the significance of modal strain energy as a valuable parameter for structural damage identification based on dynamic characteristics. However, when the scale of the structure increases, the high dimensionality of the stiffness matrix and the truncation effects of modal shapes lead to a decrease in the ability of modal strain energy to characterize structural damage, potentially resulting in the inability to detect structural damage.
Spatial grid structures, with their complex shapes and large scale, exhibit complex stiffness characteristics, resulting in a dense distribution of natural frequencies. In the case of damage to multiple members within the structure, even complete loss of their bearing capacity, the resulting changes in modal parameters, such as natural frequencies, tend to be minimal. Consequently, damage indicator methods relying solely on the magnitude of modal parameter changes are often inadequate for diagnosing damage in these structures. To overcome this limitation, damage identification methods based on direct structural response information have been proposed. Sohn et al., utilized time series methods to identify structural damage by analyzing the dynamic response of the structure [15]. Lam et al., developed a Bayesian method to assess the damage status of railway ballast under a concrete sleeper using vibration data from in situ sleepers [16]. Salehi et al., introduced a novel structural damage detection technique based on multi-channel empirical mode decomposition (MEMD) of vibrational response data [17]. Zhu et al., used a combination of statistical regression and deep learning methods to predict the deformation of a dam based on multiple measuring points in different sections of the dam [18]. Xiao et al., proposed a methodology for identifying damage in semi-rigid frames with slender beams, which was applied on semi-rigid frame structures with different cross-sectional shapes by formulating an objective function based on minimizing the difference between the analyzed and measured joint displacements [19]. However, the practical application of these methods to grid structures is often hindered by the large-scale nature of the structures and the significant number of connections and members involved. Consequently, the installation of a large number of sensors on the structure to obtain the required response information for identifying damaged spherical weld joints becomes challenging and restricts the feasibility of such approaches in grid structures.
Xiao et al., proposed a stiffness separation method for damage identification in large-scale space truss structures that simplified the high-dimensional structural damage identification problem [20]. Therefore, dividing the grid structure into several simpler substructures provides a practical method for identifying joint damage within each substructure, which is analogous to dimensionality reduction processing. This concept forms the basis for the development of the two-step method presented in this paper, specially designed to identify weld damage in the welded joints of grid structures. The first step involves partitioning the grid structure into sub-regions and utilizing data acquired from a limited number of measurement key joints to identify the sub-regions where joint weld damage has occurred. In the second step, the focus is on recognizing the precise location and extent of joint weld damage within the identified sub-regions. The key to implementing the two-step approach for identifying weld damage at the joints of grid structures lies in the selection of appropriate identification methods for each step. These identification methods should meet criteria such as requiring minimal information, while also ensuring high accuracy and ease of implementation.
Wavelet analysis has gained attention in the field of structural damage detection due to its ability to capture local characteristics of signals in both time and frequency domains, leading to significant achievements. Kim et al., utilized continuous and discrete wavelet transforms in structural health monitoring (SHM) to investigate damage identification in beam structures [21]. Zhe F. et al., introduced a novel transmissibility concept based on wavelet transform to detect slight structural damage at its early stage [22]. Janeliukstis et al., employed a two-dimensional wavelet transform algorithm with isotropic Pet Hat wavelet to locate areas of damage in a numerically simulated aluminum plate model, finding that the lowest scale of the selected wavelet function yielded the best results for damage identification [23]. Zhu et al., proposed a new damage index for crack identification in functionally graded material (FGM) beams using wavelet analysis, defining the index based on the position of the maximum value of the wavelet coefficient modulus in the scale space [24]. Katunin et al., presented a novel damage identification approach using the 2D continuous wavelet transform-based algorithm to analyze differences in modal rotation fields obtained from shearographic measurements of structures [25]. Yazdanpanah et al., proposed an efficient wavelet-based refined damage-sensitive feature for nonlinear damage diagnosis in steel moment resisting frames (MRFs), which utilized acceleration responses extracted from the structures analyzed by incremental dynamic analysis (IDA) under various ground motion records [26]. Zhu et al., used the variational mode decomposition (VMD) wavelet packet denoising method to denoise the prototypical seepage pressure data of dams, and it was demonstrated through experiments that the method achieved high prediction accuracy and flexibility [27].
However, directly applying wavelet analysis to identify joint damage in grid structures may lead to incorrect results due to the complexity and symmetry of the structure. The presence of joint damage in the grid structure can cause significant response changes, especially at symmetrical locations. To overcome this challenge, partitioning the grid structure becomes essential as it effectively reduces complexity and breaks symmetry, rendering wavelet analysis advantageous for damage identification in sub-regions of the structure.
Furthermore, damage to a joint can result in amplitude changes in the singular values of the wavelet-transformed acceleration response of adjacent joints. Therefore, the wavelet analysis method can be employed not only for damage identification but also to determine the influence range of a damaged joint by analyzing the amplitude changes in the singular values of the wavelet transform of adjacent joints. This additional feature enhances the capabilities of the wavelet analysis method for accurately detecting and localizing joint damage within the grid structure.
Fuzzy pattern recognition, a method that involves extracting identification indicators and establishing membership functions, has been widely employed in structural damage identification. Wang et al., proposed a two-stage fuzzy pattern identification method based on fuzzy theory to establish a fuzzy pattern database for cable force, key point strain, and weld crack growth length. This method enabled the identification of earplate crack length in guyed mast structures under wind load [28]. Ren et al., extracted damage-sensitive features through statistical analysis of time history response data, forming statistical mode vectors that characterize the structural status. By comparing the distances between mode vectors in the feature set for different structural conditions, they were able to determine the damage [29]. Jiang et al., proposed a data fusion damage identification method based on fuzzy neural networks, which effectively utilized redundant and uncertain information for more accurate damage diagnosis [30].
However, extracting damage indices becomes challenging in grid structures with numerous joints and members. Moreover, pattern matching in a large pattern database based on established membership functions requires extensive analysis, which may result in low recognition accuracy or errors due to the complexity of the grid structure. Nevertheless, the implementation of the fuzzy pattern recognition method in sub-regions of the structure where joint damage has been identified presents a practical solution, which can significantly reduce the difficulty of identifying the location and extent of joint damage. By focusing pattern matching solely on the sub-region containing joint damage, the computational burden is substantially reduced, and potential identification errors caused by the complexity of the grid structure are effectively avoided.
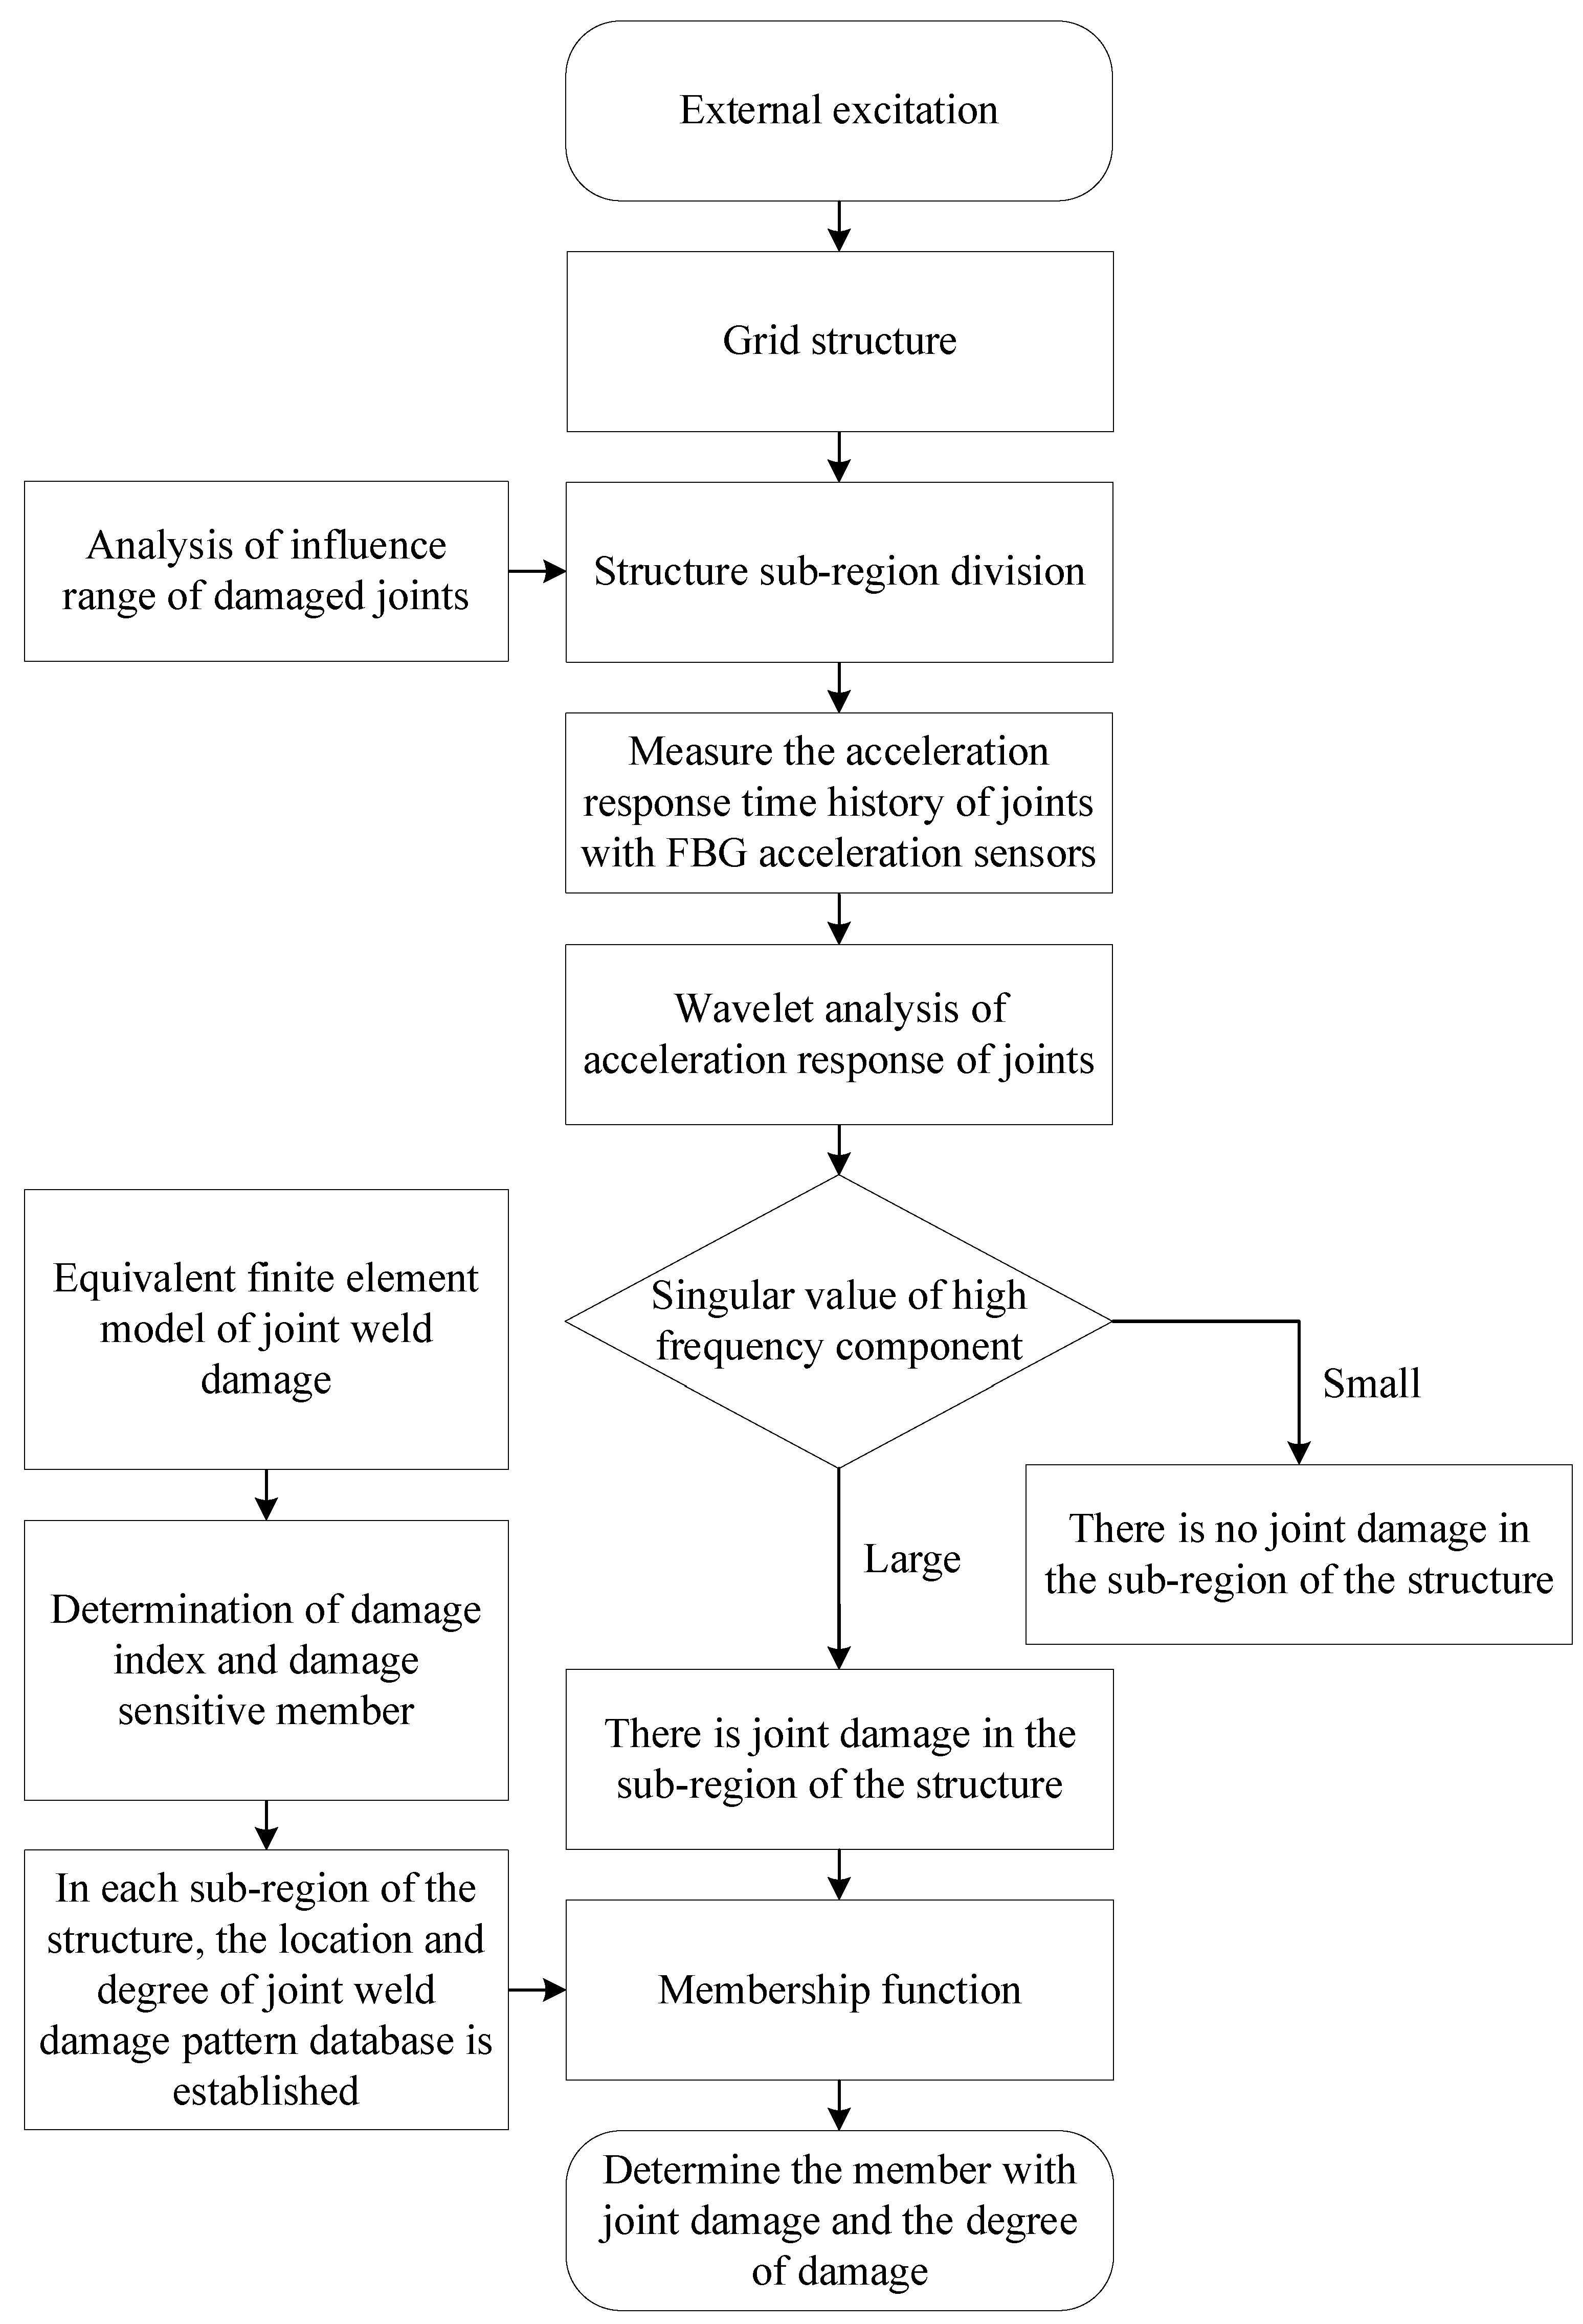
Therefore, it is recommended to combine the wavelet analysis method in the first step and the fuzzy pattern recognition method in the second step to achieve joint weld damage identification in grid structures. In this way, the objective of the study was attained through the selective placement of acceleration sensors on key joints within the structural sub-region. By subjecting the response time histories collected from these sensors to wavelet analysis, the presence of joint damage within the sub-region can be identified. Subsequently, using this outcome, fuzzy pattern recognition can be applied specifically to the sub-region where the damage has been detected, allowing the determination of the location and severity of the joint damage. Furthermore, to validate the effectiveness of the proposed method, a physical grid structure model was fabricated and subjected to testing. The results of these experiments demonstrate that the proposed method can accurately identify the location and degree of damage in the structural joints. Importantly, this method requires minimal measurement information, making it practical and feasible for implementation in practical engineering applications.

2. The Methodology of Two-Step Identification Technology for Weld Damage of Welded Spherical Joints

The two-step damage recognition procedures for joints in grid structures are illustrated in Figure 1.
According to Figure 1, the first step involves identifying the influence region of the damaged joints through wavelet transform analysis, arranging sensors in each sub-region, and identifying the damaged sub-region. The procedure is as followed: firstly, acquiring the time history of the acceleration response of both the damaged joint and neighboring joints when the grid structure is subjected to external excitation. Then, using the wavelet transform to analyze the acceleration response to obtain the singularity amplitude of the high-frequency signal, and determining the influence areas of the damaged joints, leading to the establishment of sub-regions within the structure. Additionally, the key joints in each sub-region were determined for deploying the fiber Bragg grating (FBG) acceleration sensors. In practical engineering, only the acceleration responses of the joints with FBG sensors in each sub-region are measured. The singular amplitude of the high-frequency signal of these acceleration responses, obtained through wavelet transform analysis, helps to judge whether weld damage in joints occurs in a sub-region.
The second step involves establishing a damage pattern database for welded joints in each sub-region, and identifying the location and degree of weld damage in the joints of sub-regions by adopting the fuzzy pattern recognition method. To ensure that the database covers various hollow spherical joints, three-dimensional solid weld connections between joints and members are modelled using the finite element method. These models consider different spherical wall thicknesses and pipe–sphere diameter ratios within the range of 0.3 d / D 0.5 , as specified by the JG/T11-2009 Standard for Welded Hollow Spherical Joints of Steel Grid Structures [31]. The axial stiffness coefficient and bending stiffness coefficient are obtained from these models and used in equivalent finite element models with varying crack sizes. Damage indices that characterize the location and extent of joint damage are extracted based on the damage equivalent model, and can be used to determine the members that are sensitive to joint damage. A vector composed of these damage indices from the sensitive members is used to characterize different patterns of joint damage. A pattern library of joint damage is then established, which contains information about the location and degree of joint damage for each sub-region.
Following the first step, if joint damage is identified to occur in a sub-region, the membership degree between the damage indices vector of each joint and each pattern in the pattern database is calculated only in this sub-region. Based on the membership values, the damaged joints can be located and the extent of damage can be assessed.

2.1. Damage Sub-Region Identification Based on Wavelet Analysis

The wavelet transform is a mathematical operation that involves taking the inner product between a basic wavelet function, denoted as ψ x , and the signal to be analyzed, denoted as f x , at different scales a and displacements b. It can be expressed as:
W f a , b = f x , ψ a , b x = 1 a + f x ψ x b a d x
where ψ x represents the basic wavelet function, while a and b represent the scale factor and displacement factor, respectively.
The key characteristic of wavelet transform is its ability to provide variable time–frequency windows. The time–frequency window can be conveniently adjusted using an optimal base searching method. Wavelet analysis offers excellent time–frequency localization, allowing it to detect various frequency components of a signal by utilizing its adjustable time–frequency window. This property makes wavelet transform effective in detecting small-scale structural damage by analyzing signal singularities [32].
In this study, the acceleration response of joints was subjected to wavelet analysis. If a joint is damaged, not only that specific joint but also the neighboring joints exhibit singularities in the high-frequency signal. The magnitude of the singularity in the high-frequency signal of each joint determines the influence range of the joint’s damage. By assessing the singularity values of each joint, the structure can be divided into sub-regions, and the key joints where sensors should be installed can be determined. Consequently, by measuring the response of these key joints, the identification of joint damage in the corresponding sub-region can be achieved.

2.2. Damage Location and Degree of Joints in the Damage Sub-Region Based on Fuzzy Pattern Recognition

2.2.1. Pattern Database

To establish the pattern database of weld damage in joints, the relationship between the degree of weld damage and the damage index was analyzed. The weld crack length was divided into intervals of 15 degrees, and different damage equivalent models were constructed and analyzed for each crack size. The first-order strain mode of each member was calculated, and the absolute difference in strain modes was obtained.
For each crack length, a set of absolute difference data of strain modes was generated. These data were used to determine the crack length of the joints. The absolute difference of strain modes was considered as the eigenvector to construct the pattern database. Each entry in the database corresponded to a specific crack length and its corresponding absolute difference data of strain modes.
To identify the damage in a joint with an unknown crack length, the absolute difference of strain modes for that joint was compared with the pattern database. By finding the closest match or determining the degree of similarity between the absolute difference of strain modes and the entries in the database, damage identification could be achieved.
The case study focused on a welded hollow sphere joint, specifically the WS1204 joint, which consisted of a hollow sphere with a diameter of 120 mm and a wall thickness of 4 mm, connected to a steel pipe with an external diameter of 48 mm and a wall thickness of 3.5 mm. To simplify the analysis, the calculation model considered only half of the sphere, as the stressed state of the welded hollow spherical joint under a unidirectional force was symmetrical. The fixed boundary conditions were applied along the hemisphere edge. The crack in the joint was assumed to be an opening penetrating crack located on the surface, which is a common type of crack in engineering. The crack section is shaded in Figure 2, where 2θ represents the crack angle. A three-dimensional solid model of the crack was established by dividing the structure into the crack body and non-crack body components, allowing accurate analysis of the crack behavior [33].
To accurately capture the singularity at the crack tip, the meshing process involved defining the singularity using the ANSYS pre-processing command KSCON. The parameters of the KSCON command were adjusted to ensure a uniform radiation pattern on the surface of the crack tip, as illustrated in Figure 3a. The mesh on the crack tip surface was then extended in the crack depth direction to form a solid mesh using a degenerated 20-node SOLID95 quadratic element, which is a singular element specifically designed to reflect the strain and stress singularity at the crack tip, as shown in Figure 3b.
For the transition region adjacent to the crack and the remaining portion of the structure, the element size was controlled using the LESIZE command, and the refinement of elements was controlled using the SMART command. This allowed for an appropriate mesh density in the vicinity of the crack and a coarser mesh in other regions. Finally, the complete mesh model of the joint was obtained, as shown in Figure 4.
The crack shape of the weld joint was characterized by its depth and width, which had a notable impact on the stiffness of the welded hollow spherical joint. However, in this study, the influence of crack depth on the joint stiffness was neglected due to the observation that the axial and bending stiffness coefficients showed minimal variations when the crack depth changed within the small range of the pipe wall thickness [34]. Therefore, only the influence of crack width was considered.
To establish the relationship between crack width and axial and bending stiffness coefficients, an axial force F was applied to the welded hollow spherical joint model to obtain the average vertical displacement ω ¯ . The ratio of axial force to displacement yielded axial stiffness, expressed as k = F / ω ¯ . Additionally, a bending moment M was applied to the spherical joints, resulting in an angular displacement θ ¯ , and the bending stiffness k e = M / θ ¯ , approximated as k e M / ω + ¯ ω ¯ / d , where ω + ¯ was the mean displacement value of joints with positive vertical displacement, ω ¯ was the mean displacement value of joints with negative vertical displacement, and d was the pipe diameter.
By assuming the crack depth to be half of the pipe wall thickness and varying the crack width, the axial stiffness coefficient and bending stiffness coefficient of the welded hollow spherical joint were calculated as shown in Figure 5.
To simulate the equivalent model of a joint with a member, the piecewise equivalent stiffness method is commonly used. In this method, the member is divided into three parts: the middle element and the fixed-length elements at both ends. The length of the elements at both ends is determined based on the size of the joint, and the rotation capacity of the joint is represented by reducing the moment of inertia of the beam element at both ends. This allows the continuous modification of the reduced coefficient of moment of inertia and the length of the member end to simulate different degrees of joint damage [35]. However, the length of the member end depends on the degree of joint damage, and it is not easy to determine the length in this way. Xiao et al., proposed a method for simultaneous damage identification of both section damage and joint damage in rigid frames, which furthermore can also be used to assess the rotational stiffness of semi-rigid connections, represented by fixed coefficients at the ends of components to characterize the rotational capacity between beams and columns [36]. In this study, the concept of adjustable stiffness is utilized to represent different connection cracks. The Matrix 27 element provided by ANSYS software was selected to simulate the stiffness of joints with cracks. The joint dimensions were ignored, and the effect of cracks on the stiffness of welded hollow spherical joints was considered. The connection stiffness of the joints was simulated by adjusting the spring stiffness, allowing consideration of changes in the axial, bending, or torsional stiffness. By adjusting the values of the corresponding elements in the Matrix 27 element’s stiffness matrix, different crack-connected joints could be described.
When the structure is damaged, the stiffness in the damaged area decreases, leading to significant stress redistribution around the damage location. This, in turn, causes a substantial change in the strain mode at the damage location [37,38]. However, strain mode, as a relative quantity, can only be used for locating structural damage. Nevertheless, it is acknowledged that more severe damage results in a more significant change in strain modes. Therefore, in this paper, the ratio of the absolute value of the difference in the first-order element strain modes is proposed as the damage index to quantify and assess the extent of damage. By calculating this index, the damage location of the joint can be determined, and the severity of the damage can also be assessed.
The link element k in the structure is connected by nodes i , j . the strain ε k which ignores the higher order terms is as follows:
ε k = [ u j u i x j x i + v j v i y j y i + w j w i z j z i ] / L 2
where x i , y i , z i and x j , y j , z j are the coordinates of nodes j and j respectively, u i , v i , w i and u j , v j , w j are the displacements of nodes i and j respectively, and L is the length of the link element.
The absolute value of the element strain modal difference is sensitive to local damage and can be used to locate structural damage, which is expressed as follows:
Δ ε k = ε u n d k ε d a m k   k = 1 , 2 , , N
where ε u n d k , ε d a m k are the strain mode of the k th element before and after structural damage, and N is the total number of elements.
Based on the analysis results of the equivalent model of welded hollow spherical joints with cracks, it was observed that the absolute value of the element strain mode difference increased with the damage aggravation. In particular, it was found that the absolute value of the element strain modal difference approached its maximum when the crack length was 345°. To quantify the damage degree of each element, the damage index of the k th element was defined as:
I d k = Δ ε k Δ ε ( k ) 345 °
where Δ ε k and Δ ε ( k ) 345 ° are the absolute differences of strain modes of the k th elements at arbitrary damage degree and crack length of 345°, respectively. The I d k increased with the damage degree monotonically. The crack length increased with the increase of I d k ; when I d k = 1 , the crack length was 345°.
To determine the eigenvector that can effectively characterize the pattern of joint weld damage, it is important to identify the members that are most sensitive to the damage. When weld damage occurs at a particular joint, the corresponding member connected to that joint exhibits the most significant change in the damage index Id, and adjacent members may also experience considerable changes in their damage indices. These sensitive members are highly responsive to the joint damage, and their damage indices tend to increase as the degree of the joint damage worsens. Hence, these sensitive members can be selected as the key indicators (eigenvector) to characterize the specific damage pattern. The damage index Id values associated with these members are considered as the eigenvector components, representing the pattern of joint weld damage. Each set of damage indices Id corresponds to a specific damage pattern for a given joint, and together they form a pattern database.
To obtain the damage indices Id for each member, the strain modes are calculated using the vibration mode shapes of both the intact structure and various damage cases, based on the equivalent finite element model of the joint with weld damage. By analyzing the strain modes, the corresponding damage indices Id for each member can be determined and used to construct the pattern database, which facilitates the identification of the location and degree of joint weld damage in the structure.

2.2.2. Implementation of Fuzzy Pattern Recognition

The fuzzy pattern recognition process consists of the following steps. Firstly, the eigenvector is determined to establish the fuzzy pattern database. Then, the membership function is defined. Finally, the membership degree is calculated based on the membership principle to judge the membership pattern of the object and recognize it.
The membership function employs the distance formula to calculate the distance between the object to be identified, denoted as b = b 1 , b 2 , , b m , and every pattern in the pattern database, represented as a i = a i 1 , a i 2 , , a i m i = 1 , 2 , , n . The distance formula is given by:
d i b , a i = j = 1 m b j a i j a i j 2
where m and n are the dimension of the eigenvector and the number of patterns in the pattern database, respectively. The membership function is defined as:
A b i = 1 d i b , a i D
where D = max d 1 b , a 1 , d 2 b , a 2 , , d n b , a n ; if A b l = max A b 1 , A b 2 , , A b n , the object to be identified b = b 1 , b 2 , , b m belongs to the pattern a l = a l 1 , a l 2 , , a l m .
In this study, b = b 1 , b 2 , , b m is the eigenvector composed of the Id value of the member, assuming the damage location and degree of joint are unknown, and a l = a l 1 , a l 2 , , a l m is the eigenvector composed of the Id of members connecting with different joints with different crack lengths.

3. Damage Identification of Weld Joints in Spatial Grid Structure

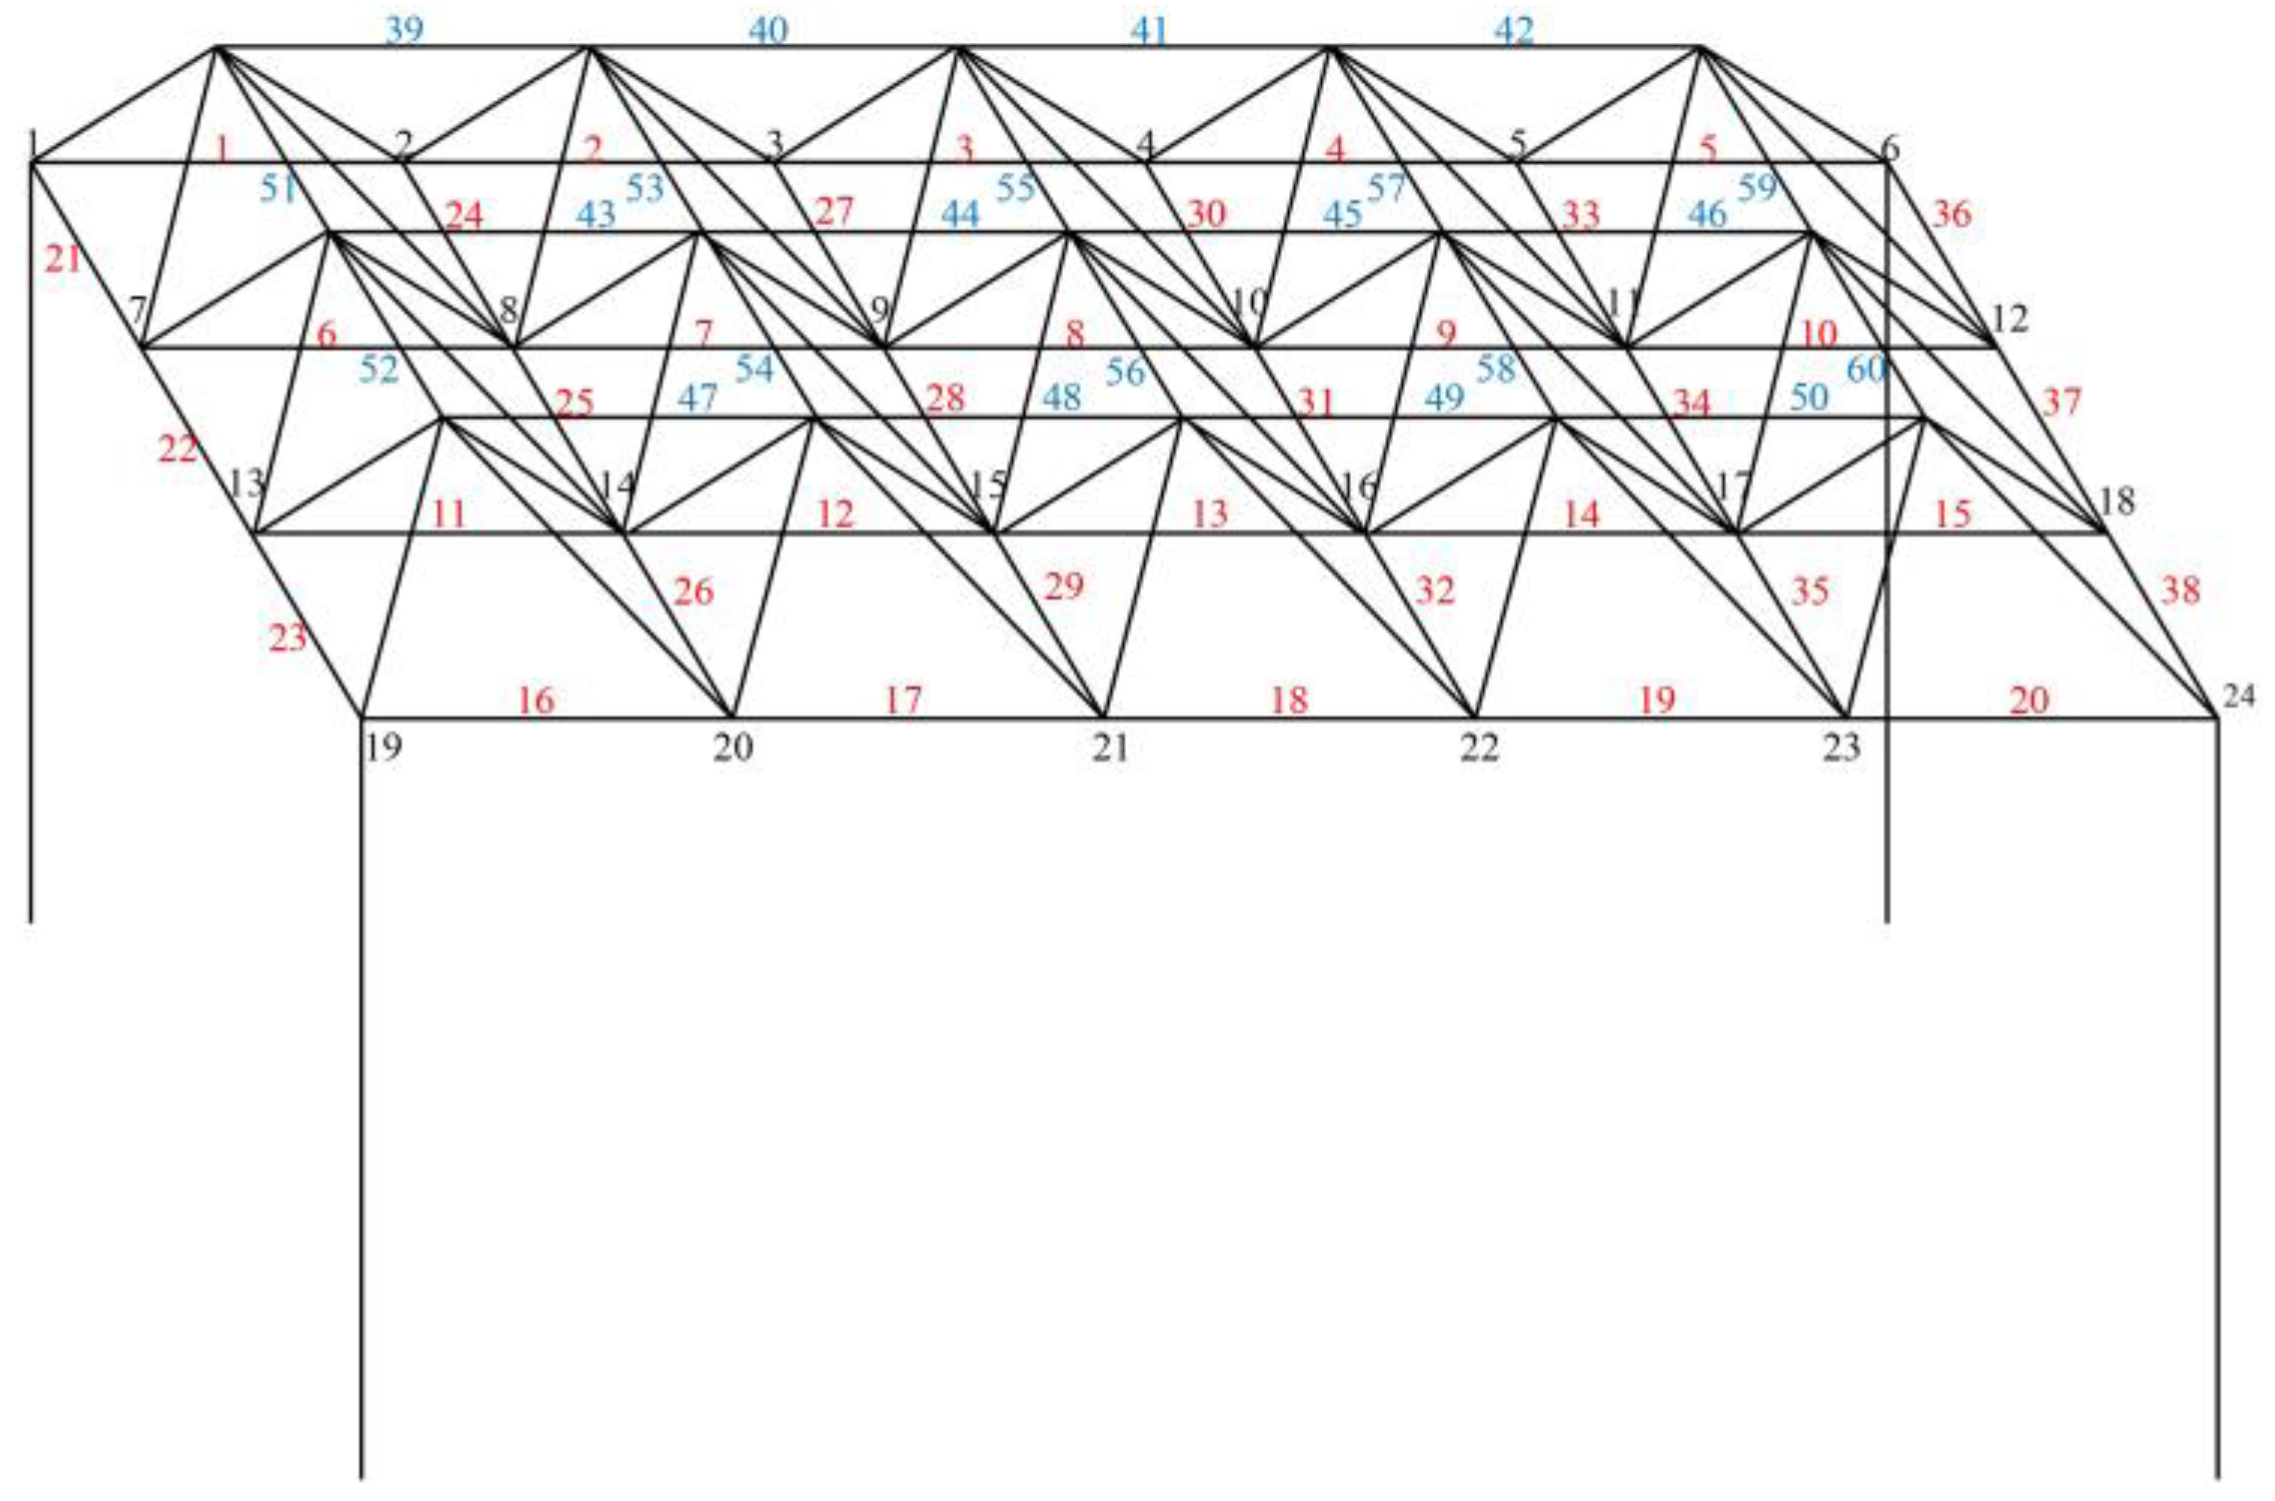
To investigate the applicability of the two-step method for identifying weld crack damage to joints, a welded space steel structure model was developed, as shown in Figure 6 (the numbers of the upper and lower chords are marked), which was used in the numerical analysis and experimental verification. Due to space limitation in the laboratory, the model dimensions were set to 3 m in length, 1.8 m in width, and 1.85 m in height. The overall height of 1.85 m was composed of a 1.5 m pillar and 0.35 m corresponding to the upper and lower chords of the grid structure. The hollow spheres utilized in the model were of WS1204 specification.
The grid structure consisted of lower chords with a grid pattern of 5 × 3 and upper chords with a grid pattern of 4 × 2. All members in the structure were of type ϕ48 × 3.5, with an outer diameter of 48 mm and a wall thickness of 3.5 mm. The structure was supported at all four corners by the pillars, constructed using circular steel tubes of type ϕ60 × 3.5, with a net height of 1.5 m. The steel material in the structure had an elastic modulus of 206 GPa, Poisson’s ratio of 0.3, and a density of 7850 kg/m3.
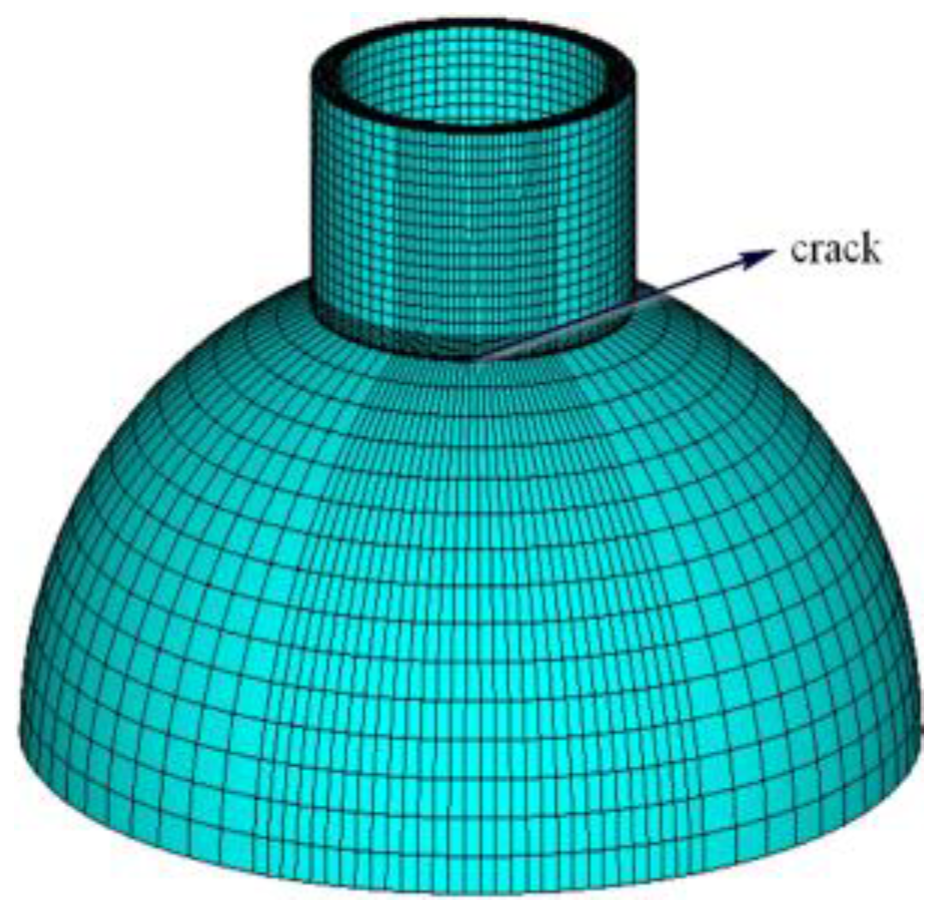
The finite element model of the structure was created using the ANSYS (v. 12.0.) finite element analysis software. The member elements were simulated using the element type BEAM188. The mass of the spherical joints was represented by the MASS21. The welded spherical joints with cracks were simulated by the MATRIX27. The finite element model consisted of 43 nodes and 124 elements.

3.1. Damage Identification Sub-Region Division of Spatial Grid Structure

When weld damage occurs at a joint in the grid structure, it can lead to changes in the acceleration responses of this joint as well as the adjacent joints when subjected to external excitation. By performing wavelet transform on these acceleration responses, the singular values of the high-frequency components can be obtained. These singular values help determine the influence range of the damaged joint and guide the placement of sensors at specific locations within the structure.
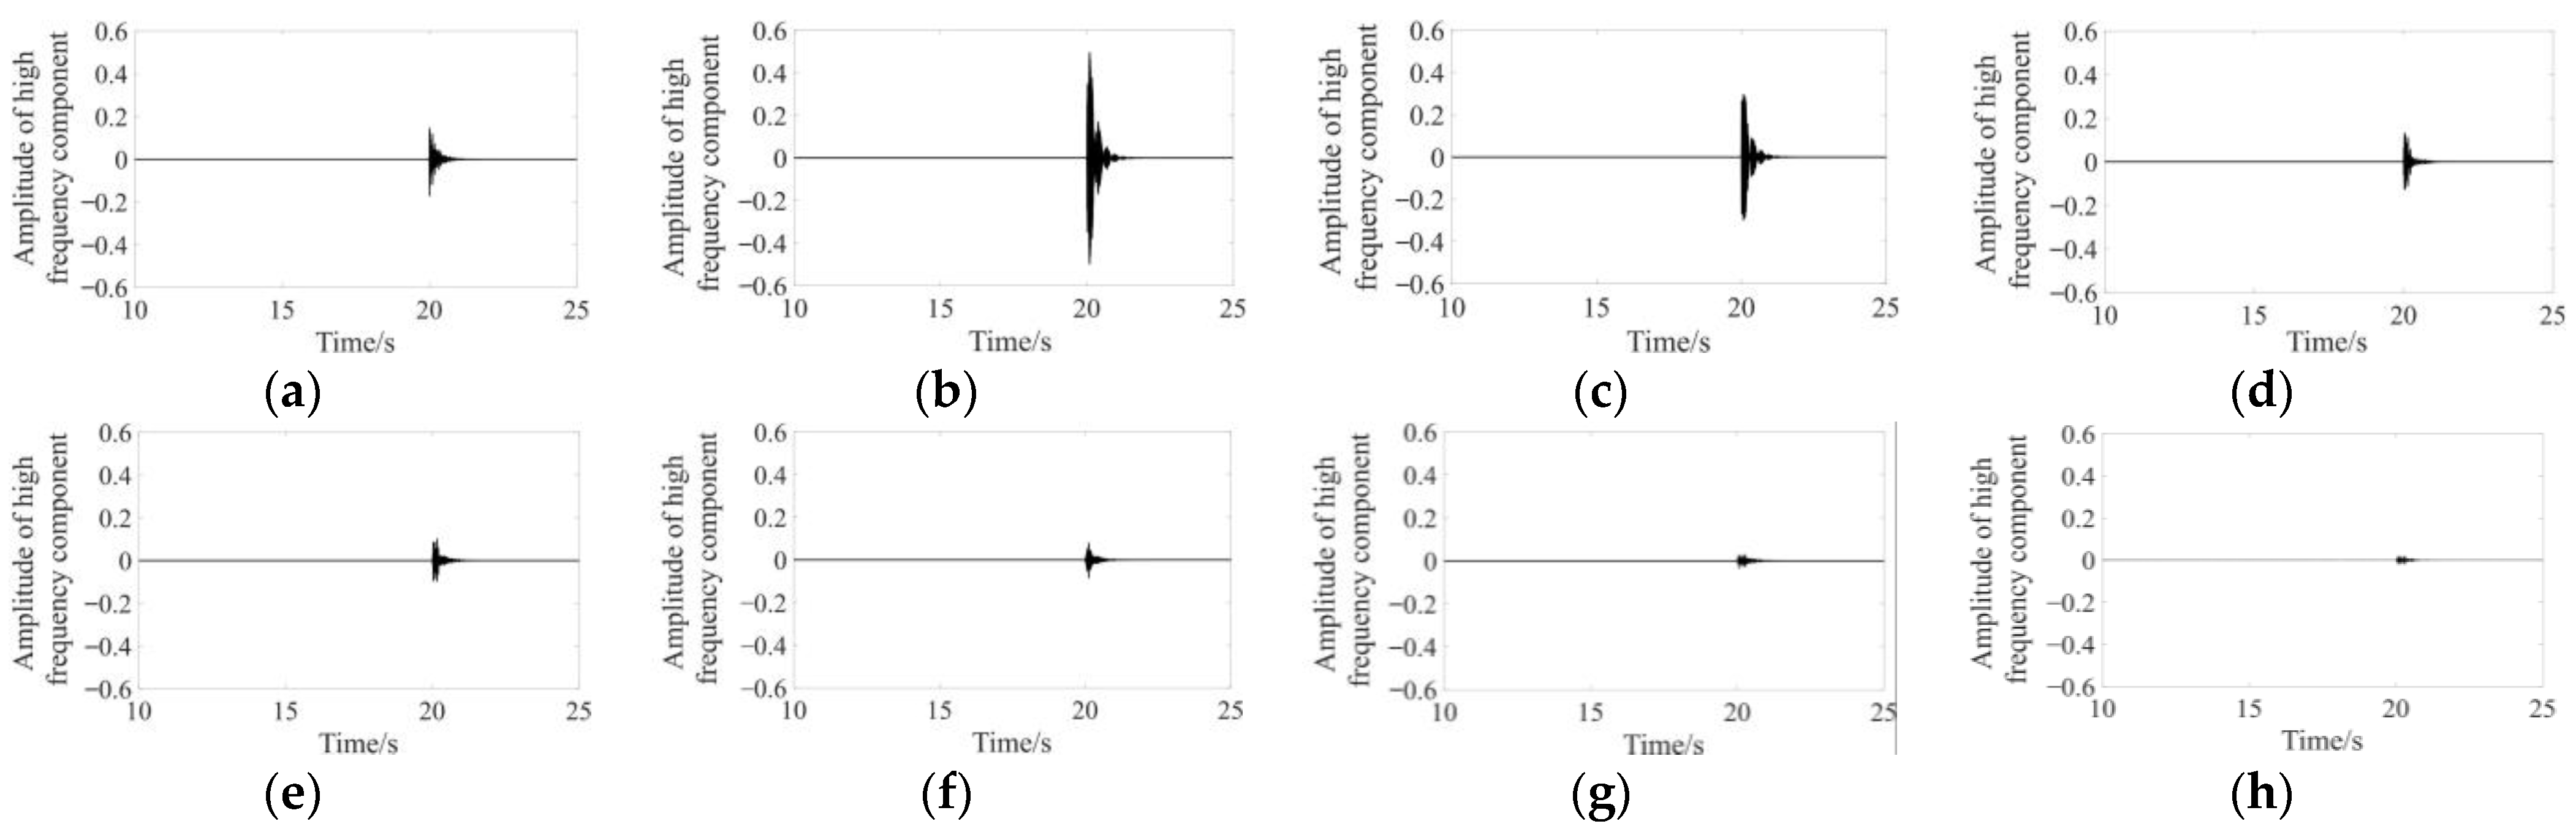
In the analysis, joint 8 was chosen as an example. When a 90° weld damage occurred on the right side of joint 8, the singular values of the high-frequency components in the acceleration responses of joint 8 and its neighboring joints were examined using wavelet transform. The magnitude of these singular values was used to determine the range of influence caused by the weld damage.
To initiate the free vibration of the grid structure, a horizontal displacement of 2 cm was applied. At 20 s, the weld damage occurred on the right side of joint 8. The time–history acceleration responses of all joints in the structure were then calculated. Subsequently, the wavelet transform was performed on the acceleration response of each joint to obtain the singular value of the high-frequency component. Figure 7 illustrates the singular values of the high-frequency components for the lower chord joints 7, 8, 9, 10, and the upper chord joints 25, 31, 36, 37.
From 
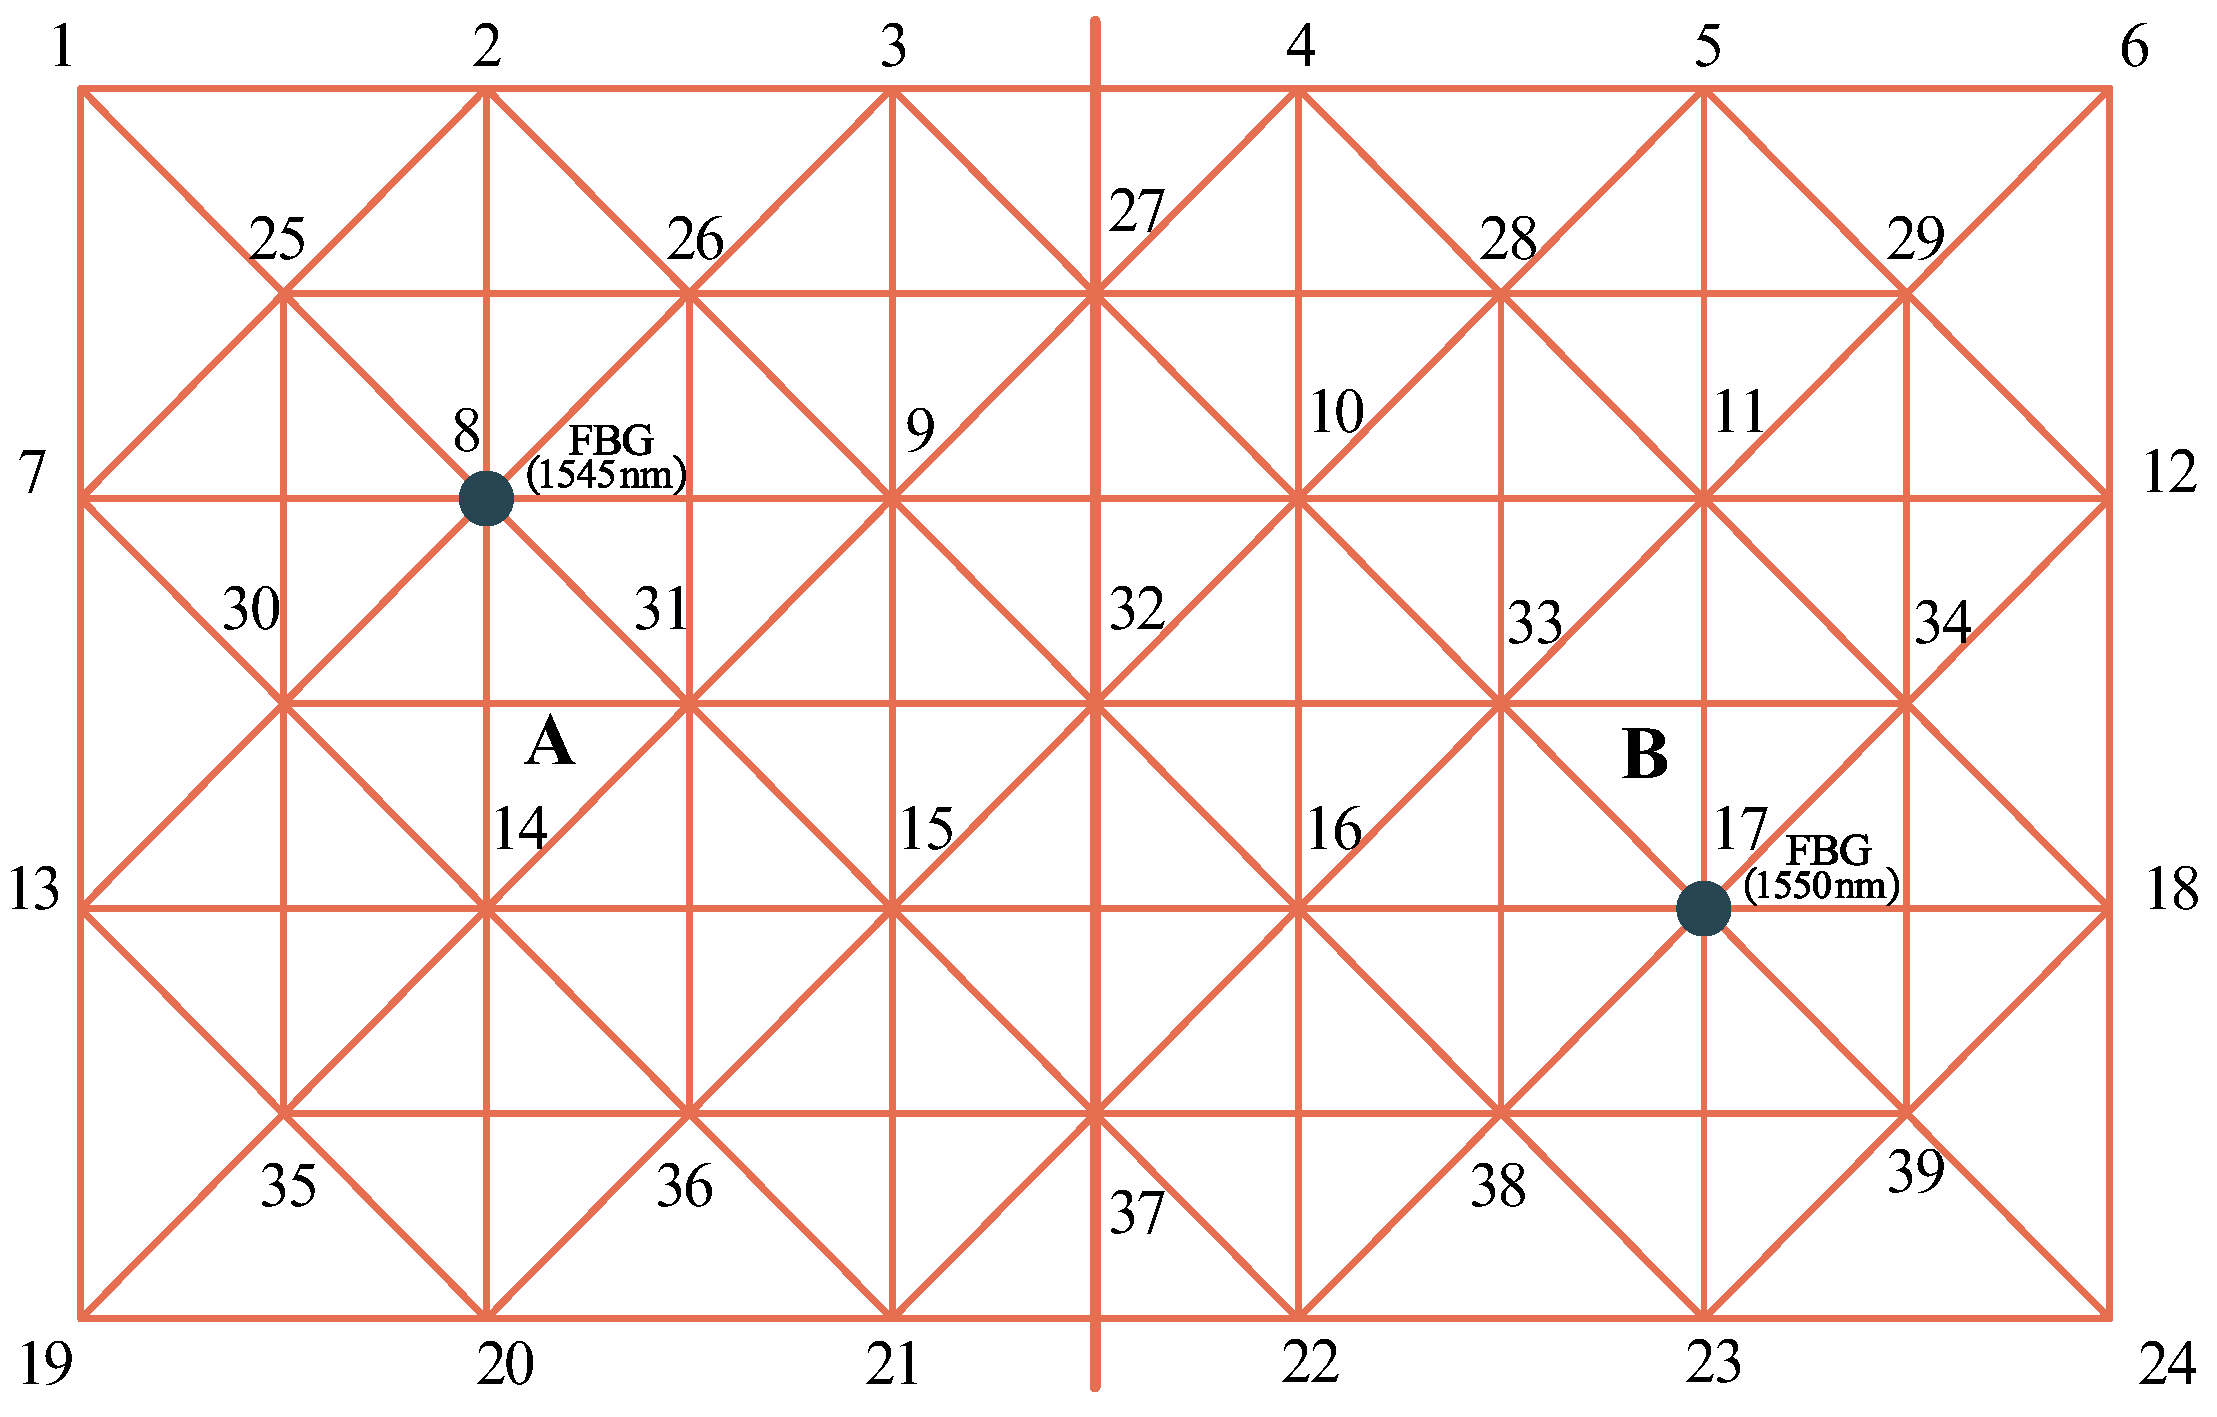
Figure 7, it is evident that when joint 8 is damaged, its acceleration response exhibits the highest singular value for the high-frequency component. As the distance from joint 8 increases, the singular values of the high-frequency components for the lower chord joints gradually decrease, indicating a diminishing influence caused by the damage of joint 8 with increasing distance. The distribution of singular values for the high-frequency components in the upper chord joints follows a similar pattern, and with a sufficient distance, the influence caused by joint 8 damage becomes negligible. By comparing the maximum singular value of the high-frequency component for each joint to that of joint 8, structural sub-regions can be identified, and the locations for sensor placement can be determined. In this case, the maximum singular value at joint 37 is significantly smaller than that at joint 8. Therefore, considering joint 37 as the boundary, the damage influence range of an individual joint is defined as a rectangle measuring 1.5 m × 1.8 m in the lower chord and a square measuring 1.2 m × 1.2 m in the upper chord. Consequently, the grid structure is divided into two sub-regions, labeled as A and B. An FBG accelerometer was mounted on joint 8 of sub-region A and joint 17 of sub-region B, as depicted in Figure 8.

3.2. Formation of Damage Recognition Pattern Database

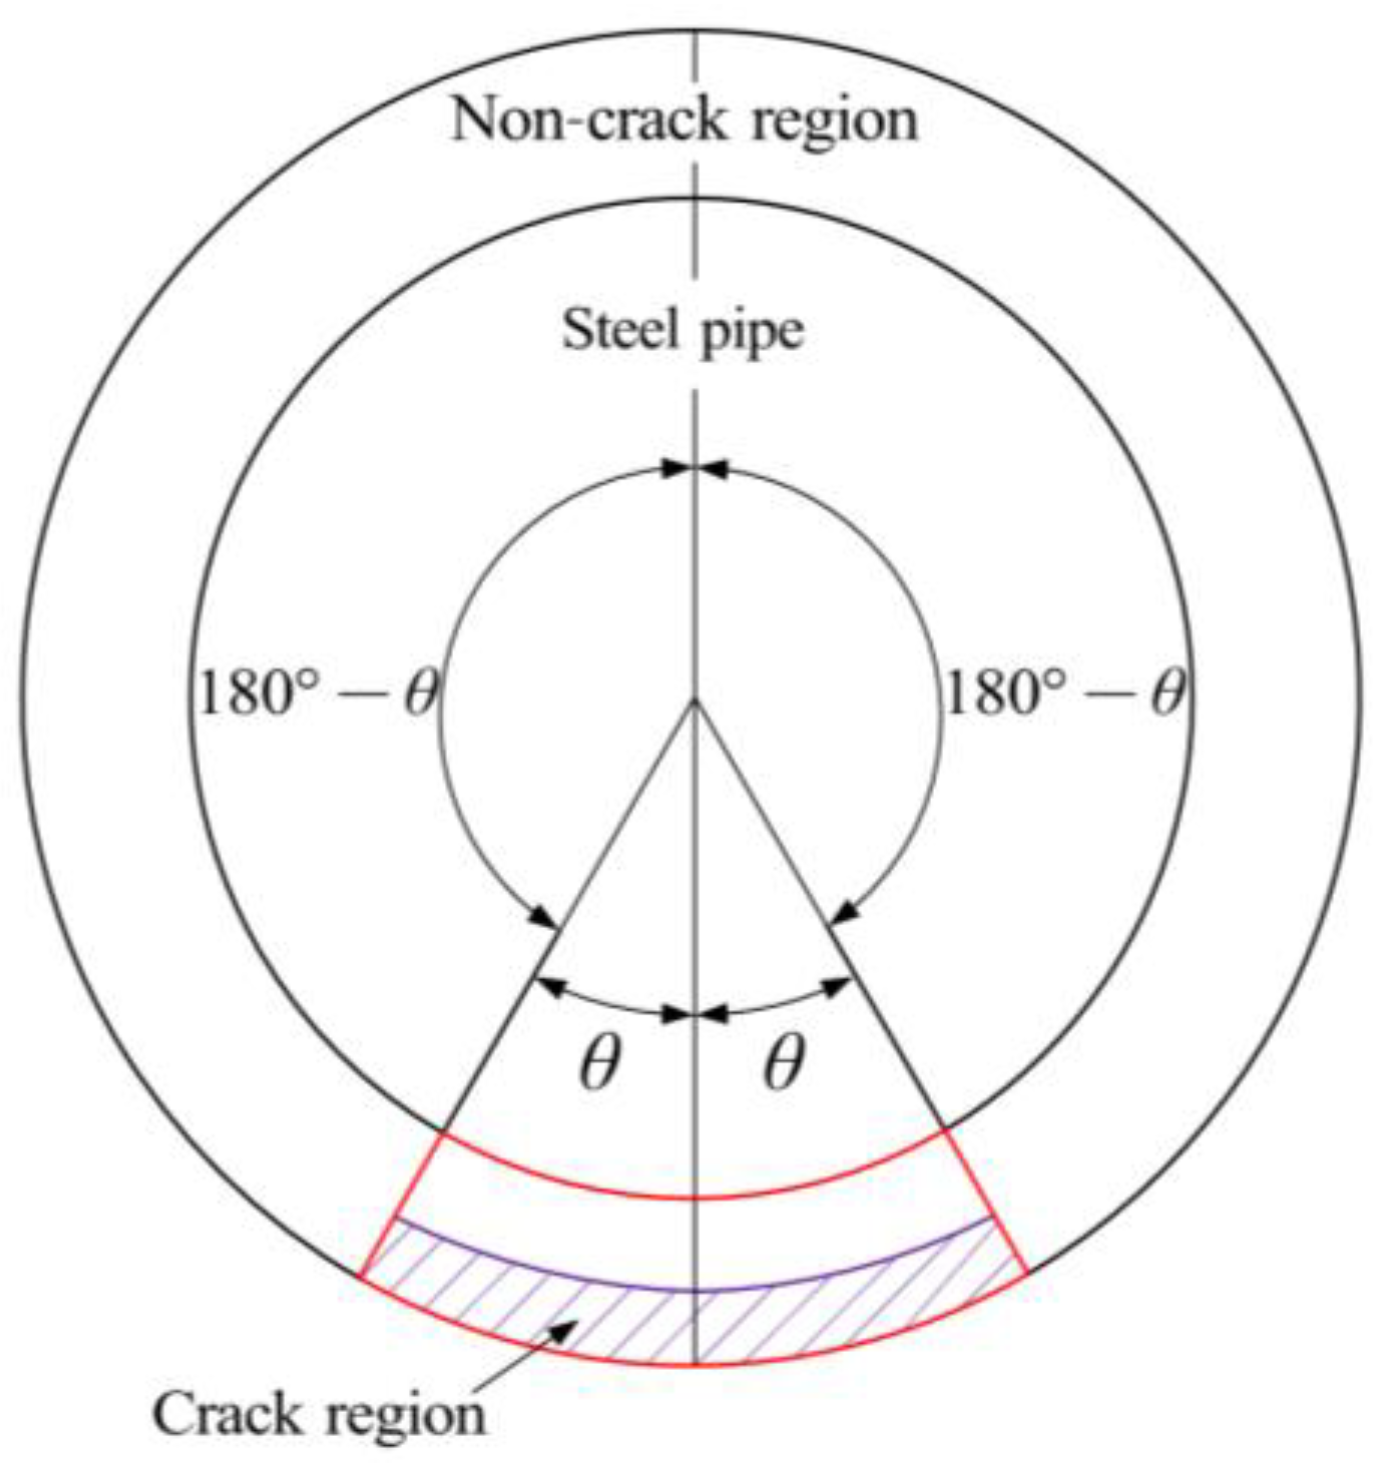
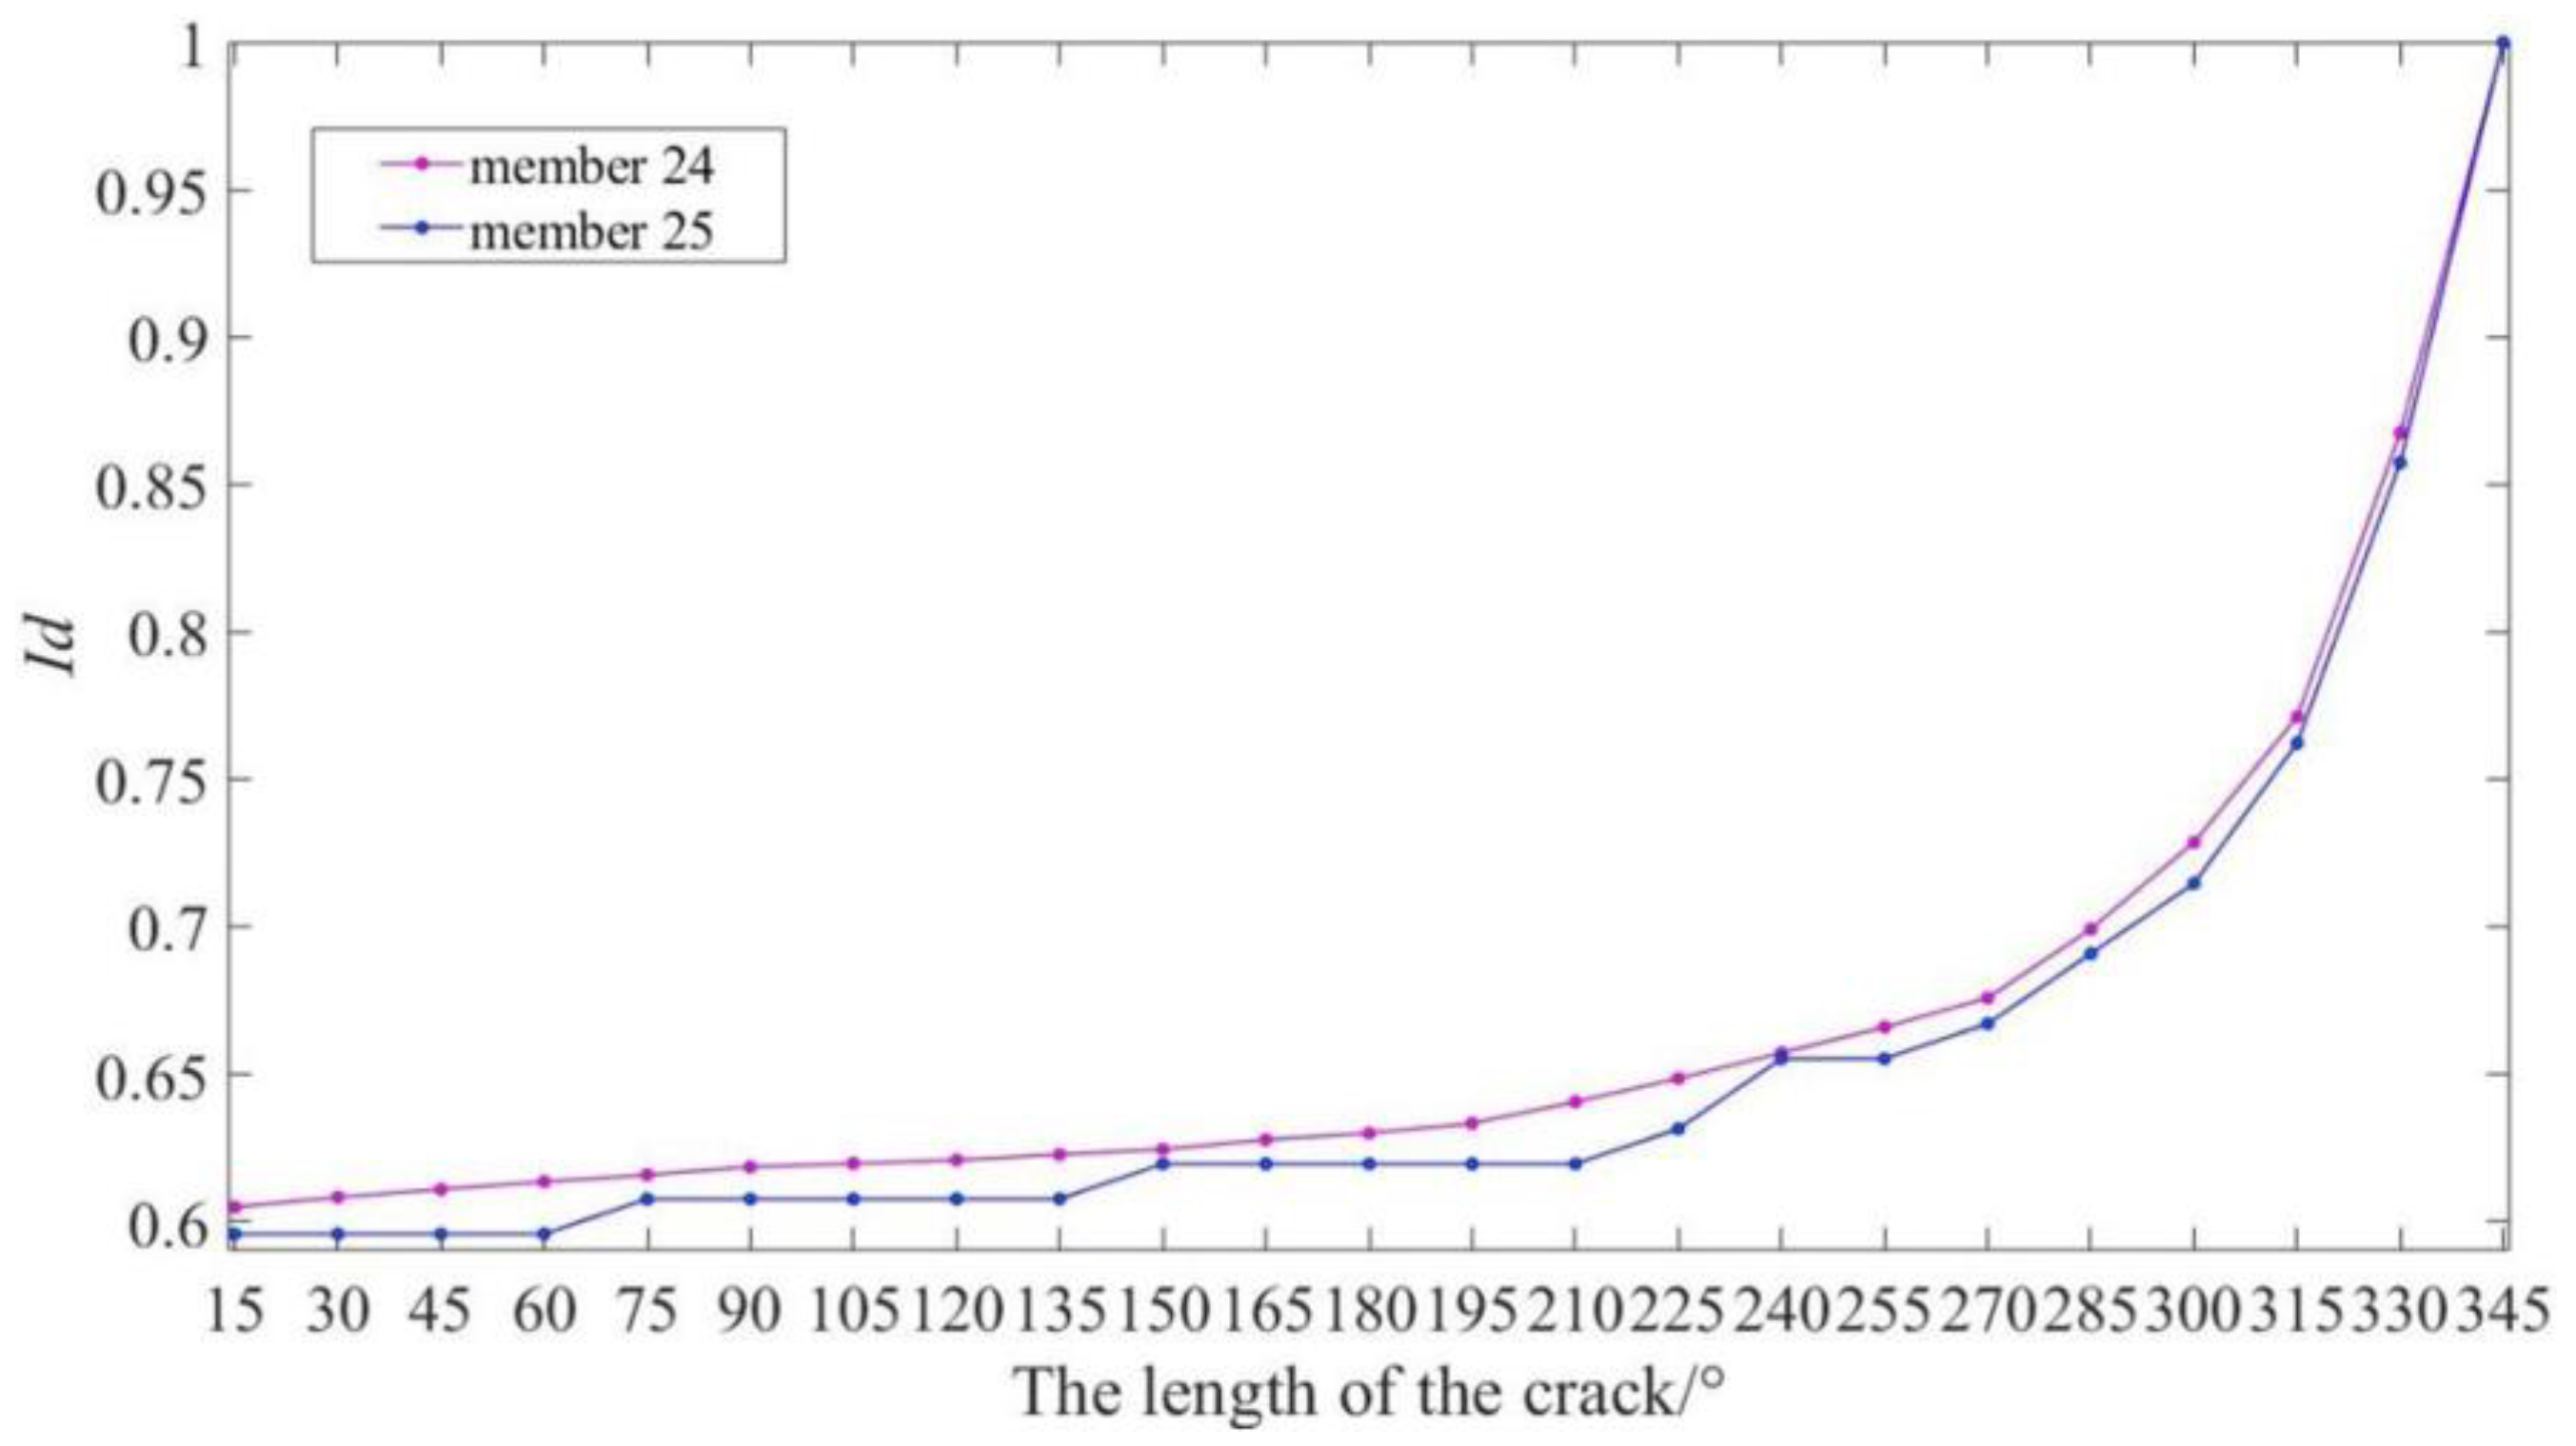
The formation of an appropriate pattern database is crucial for diagnosing structural damage using the fuzzy pattern recognition method. To illustrate the process, the damage to joint 2 in the No. 24 member was taken as an example. In this case, the crack length range was assumed to be between 15 π r / 180 and 345 π r / 180 (where r was the outer radius of the tube), with an interval of 15πr/180. Consequently, there were a total of 23 damage patterns for each weld damage scenario at joint 2.
Figure 9 displays the relationships between the Id values of the No. 24 and No. 25 members and the damage extent of joint 2. As the damage of joint 2 aggravated, the Id value of the No. 24 member connected to joint 2 exhibited the most significant change, while the Id value of the adjacent No. 25 member also experienced a noticeable change. Both Id values gradually increased with the aggravation of the damage to joint 2. Consequently, these sensitive members’ Id values were selected as eigenvectors to effectively characterize this particular damage pattern.
Following a similar approach, the damage patterns for all joints corresponding to members were determined. In each sub-region, there were 60 pattern libraries, with each pattern library containing 23 damage patterns.
Then, a sinusoidal load close to the natural frequency of the structure was applied to induce forced vibrations. The displacement response of the structure during steady-state vibration was selected for analysis, allowing the determination of the strain mode of each member in the structure. In the sub-region where joint damage occurred, the strain mode of each member was compared with that observed during the 345° weld damage of the connecting joint, resulting in the acquisition of the Id for each member in the sub-region.
Subsequently, the membership degree between the eigenvectors representing each pattern library and the corresponding Id vectors of members in the damaged sub-region was calculated. The pattern associated with the highest membership degree represented the location and degree of the joint weld damage. To enhance accuracy, multiple peak displacement responses were selected to calculate the Id for each member, and the average value was employed for fuzzy pattern recognition.

3.3. Experimental Model and Sensor Placement for Grid Structures

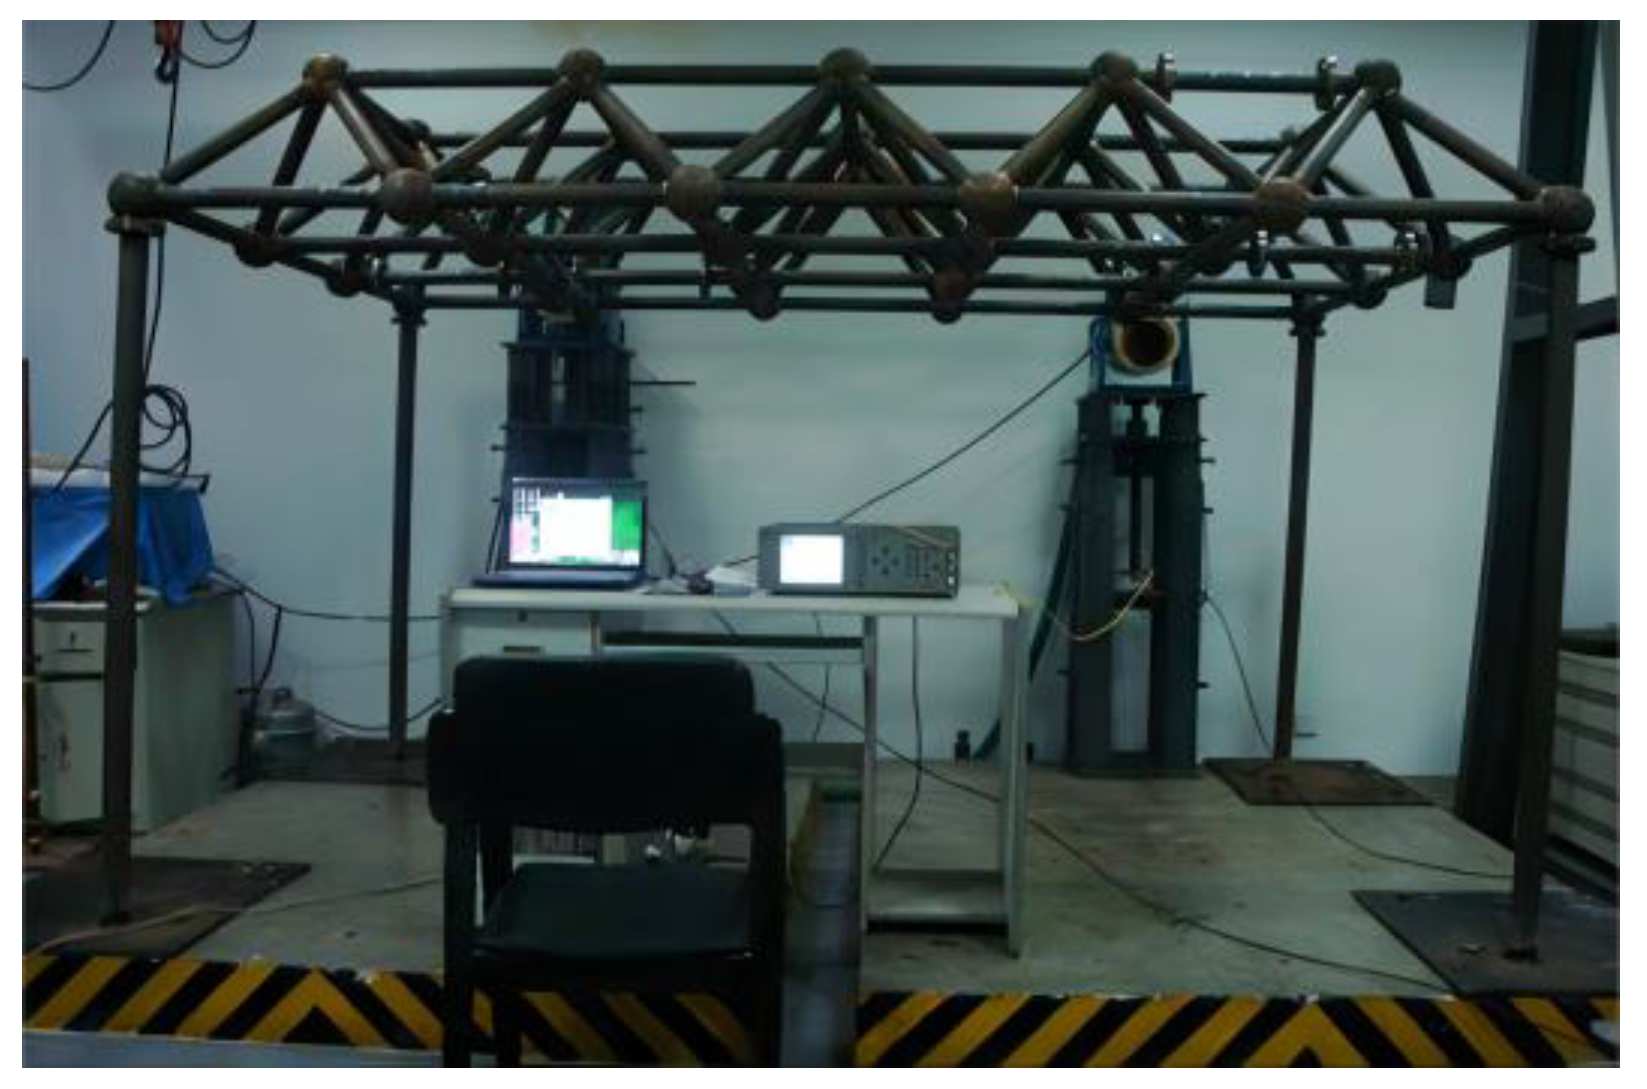
In the aforementioned model, the members utilized were circular steel pipes with dimensions of ϕ48 × 3.5. The four pillars were constructed using ϕ60 × 3.5 circular steel pipes, which were welded onto 10mm thick steel plates measuring 0.5 m × 0.5 m. These steel plates were securely fastened to the concrete platform using high-strength bolts forming fixed supports. The upper ends of each pillar were connected to the upper grid via flanges. Each flange was fastened using six outer hexagon bolts with a diameter of 6 mm. The grid structure model was made by Q235; the yield strength of steel is 235 Mpa, as illustrated in Figure 10.
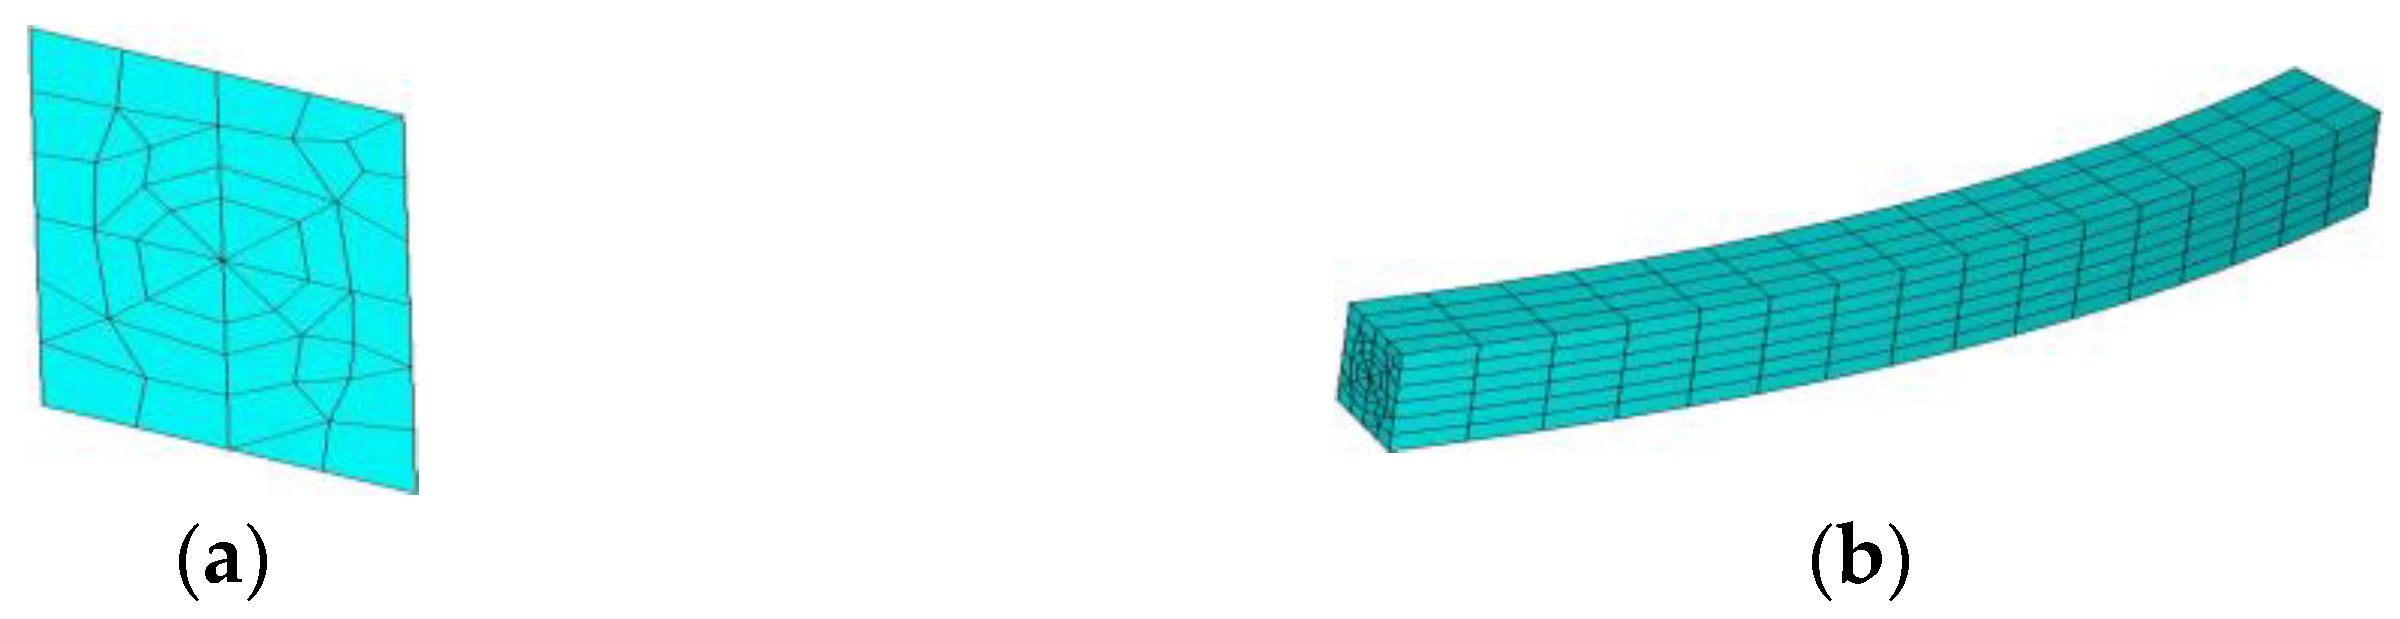
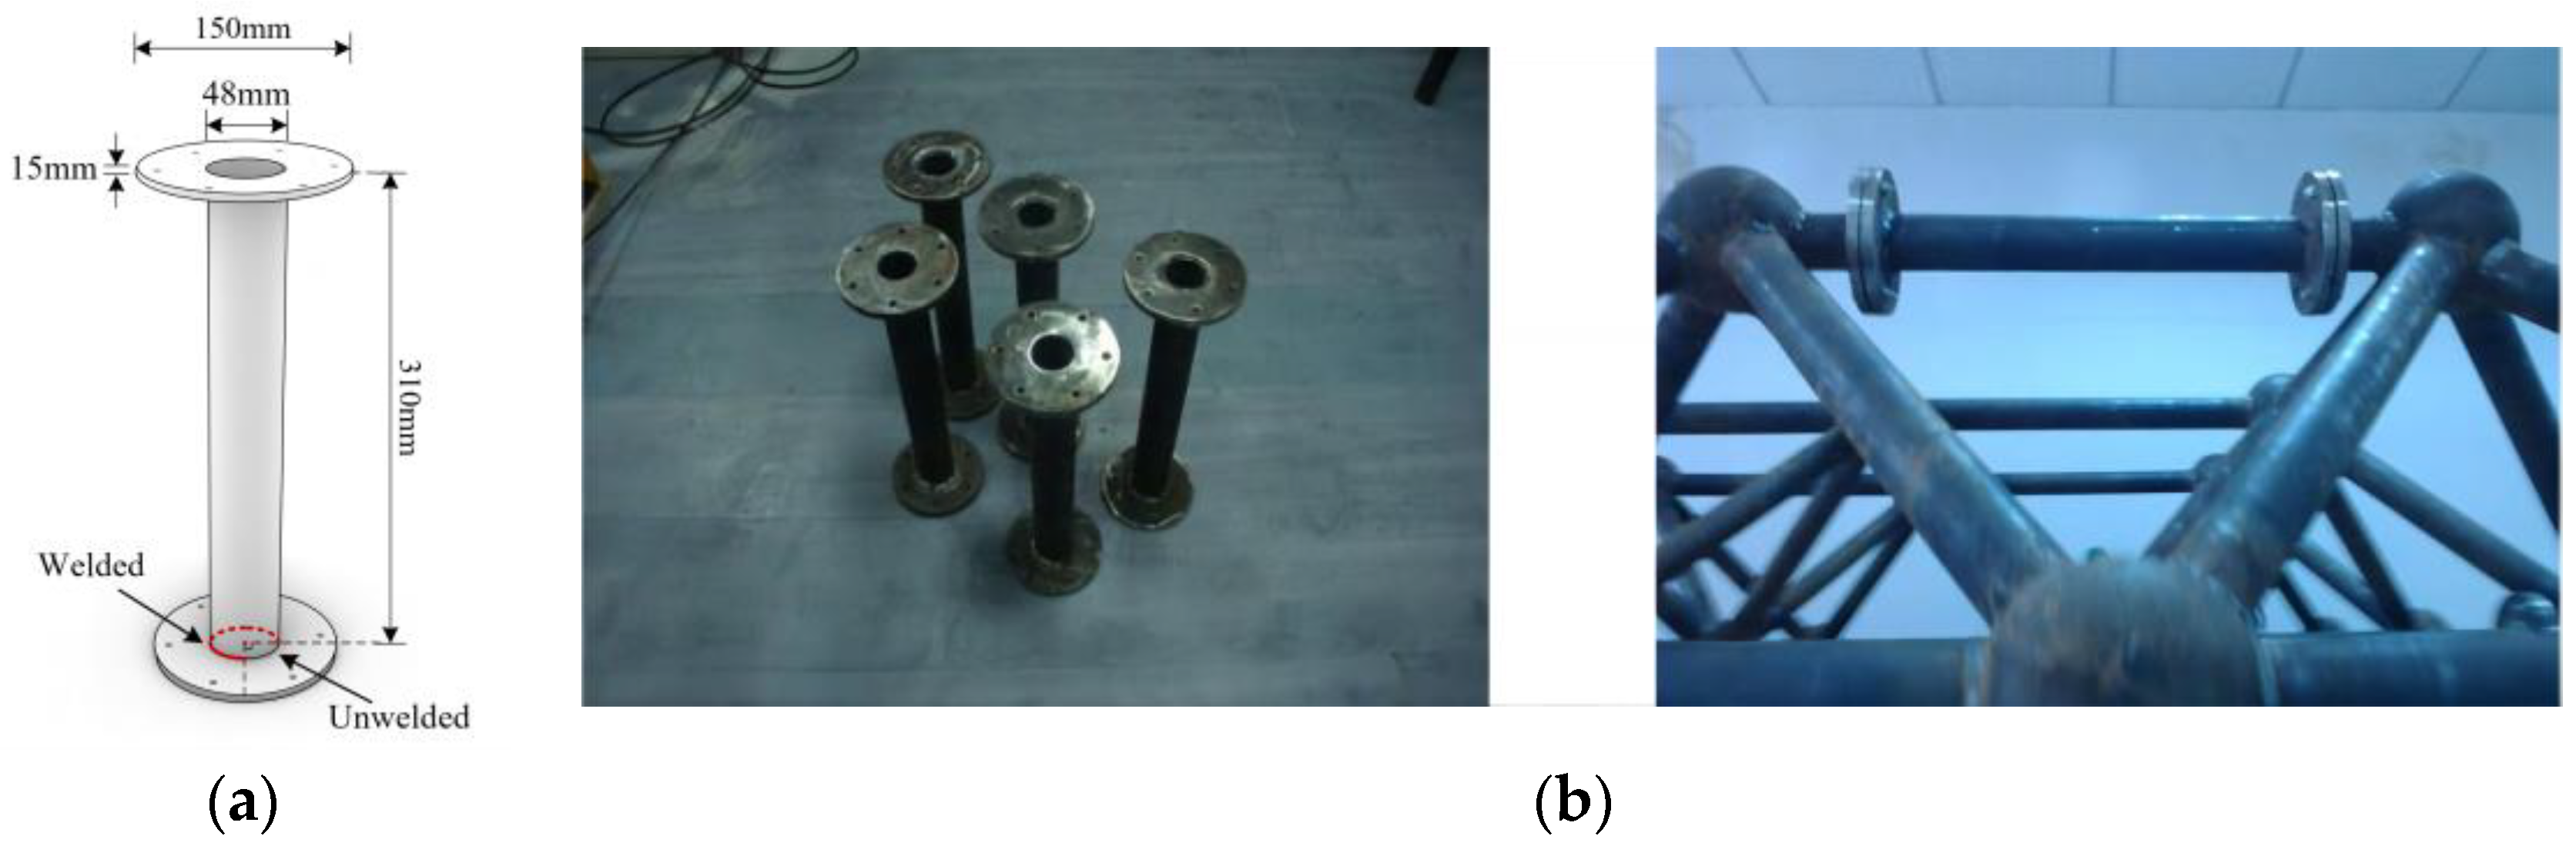
To ensure the accuracy of experimental verification, it is essential to produce both undamaged and damaged structures with identical quality. This is to prevent any identification errors caused by fabrication variations. Consequently, a model of the grid structure with replaceable rods was developed. To simulate joint weld damage, specific individual damaged members were designed. These damaged members could be substituted for the members within the test model, leaving the 90° angle at one end of the damaged member unwelded to the flange, as illustrated in Figure 11a. When weld damage occurred at a specific location in the model, the corresponding undamaged member could be replaced by the appropriate damaged member, resulting in a grid structure with a weld-damaged joint. The replaceable damaged members are presented in Figure 11b.
The FBG (fiber Bragg grating) sensor utilizes wavelength modulation as its sensing signal, ensuring that measurement signals remain unaffected by factors such as light source fluctuations, fiber bending losses, connection losses, and detector aging. Additionally, the use of wavelength division multiplexing enables the convenient connection of multiple FBGs in series on a single fiber, allowing distributed measurements. Due to these advantages, FBG sensors have found wide application in civil engineering monitoring and damage identification [39,40,41]. Malekzadeh et al., employed robust regression analysis (RRA) and cross-correlation analysis (CCA) techniques to locate structural damage using strain data collected by FBG sensors deployed on four-span bridge-type structures [42]. Elshafey designed and fabricated a fiber optic sensing array with eight sensing elements to measure time–history strain at various points on a simply supported beam subjected to random loading, by comparing the random decrements at different damage ratios to an intact case to identify the existence of damage [43].
In the whole length of FBG, there is such a relationship between the central wavelength, period, and effective refractive index:
λ b = 2 n Λ
where λ b is the central wavelength, n is the effective refractive index of the core, Λ is the refractive index modulation period of the core.
When the strain ε of the optical fiber occurs, Λ becomes Λ′:
Λ = Λ 1 + ε
According to photoelastic theory, the wavelength chan Δ λ is:
Δ λ / λ b = 1 p ε
where p is the effective photoelastic coefficient.
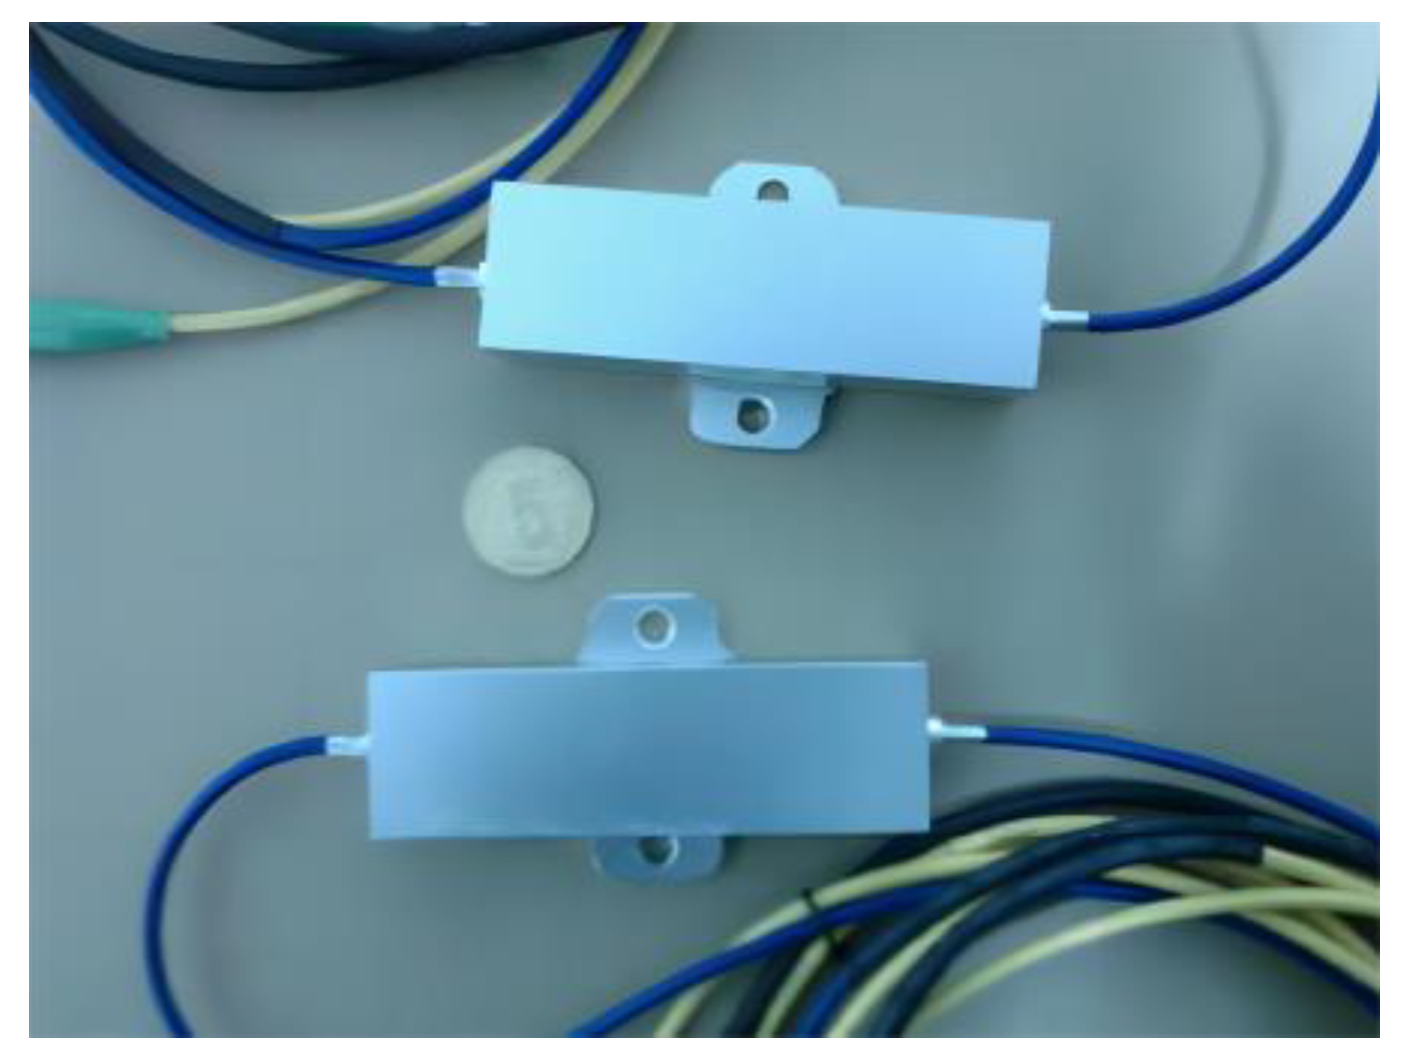
To avoid low measurement stability and noise disturbance in the existing methods, and consider the characteristics of low structural vibration frequency at the same time, a FBG (fiber Bragg grating) acceleration sensor was developed in this study based on the principle that strain and temperature variations affect the refractive index and period of the FBG, subsequently changing its reflection wavelength. In the configuration of the FBG sensor, a lever was located in the center of the sensor, the FBG was straightened above the lever, and a mass block located under the lever. The top of the mass block was connected to the bottom of the lever, and the bottom of the mass block was connected to the inside bottom of the sensor envelope by a spring. When the sensor was installed on the structure, the structure vibration drove the mass block to vibrate, and caused occurrence of tensile force in the FBG through the lever, changing the period and the refractive index of the FBG, and thus modifying the wavelength of its reflection. Notably, a linear relationship between the reflection wavelength and acceleration was observed, allowing acceleration measurement by monitoring the wavelength change. The design of the FBG acceleration sensor is shown in Figure 12.
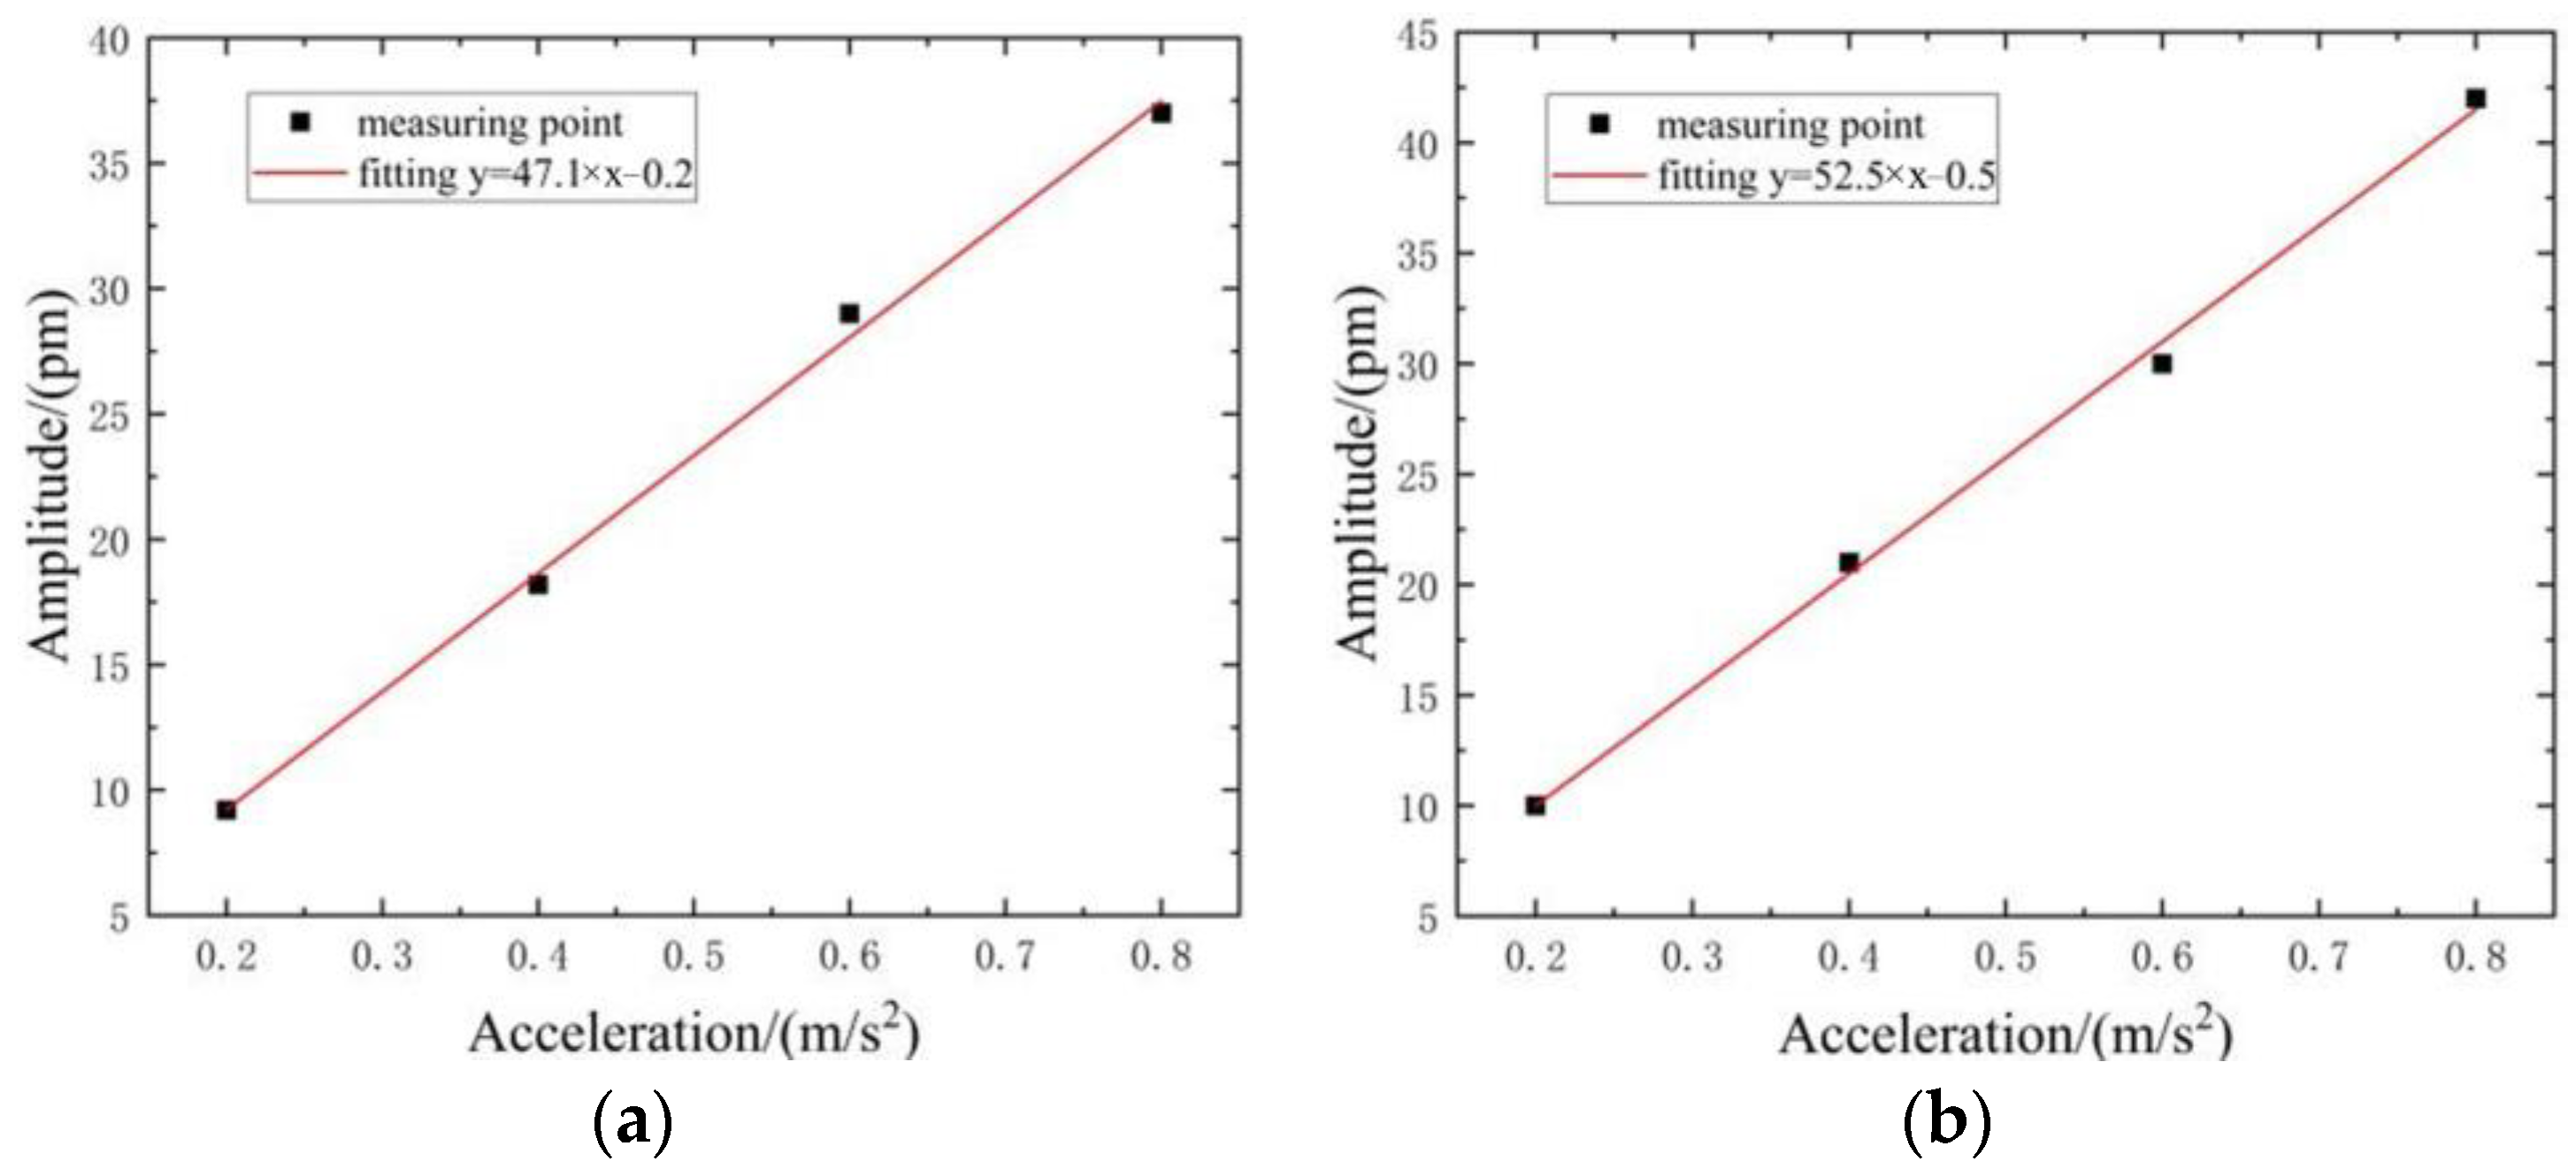
In order to achieve higher sensitivity, the measurement range of the FBG acceleration sensor was set to ±1.0 g, taking into account the expected structural vibration amplitude. Two types of FBG acceleration sensors were designed, with central wavelengths of 1545 nm and 1550 nm, and tested to evaluate their performance, respectively. The test data are shown in Table 1. Additionally, the corresponding acceleration response curves are depicted in Figure 13.
Figure 13 illustrates the sensitivity of the FBG accelerometers with central wavelengths of 1545 nm and 1550 nm as 47.1 pm/(m/s2) and 52.5 pm/(m/s2), with measurement accuracies of 0.021 m/s2 and 0.019 m/s
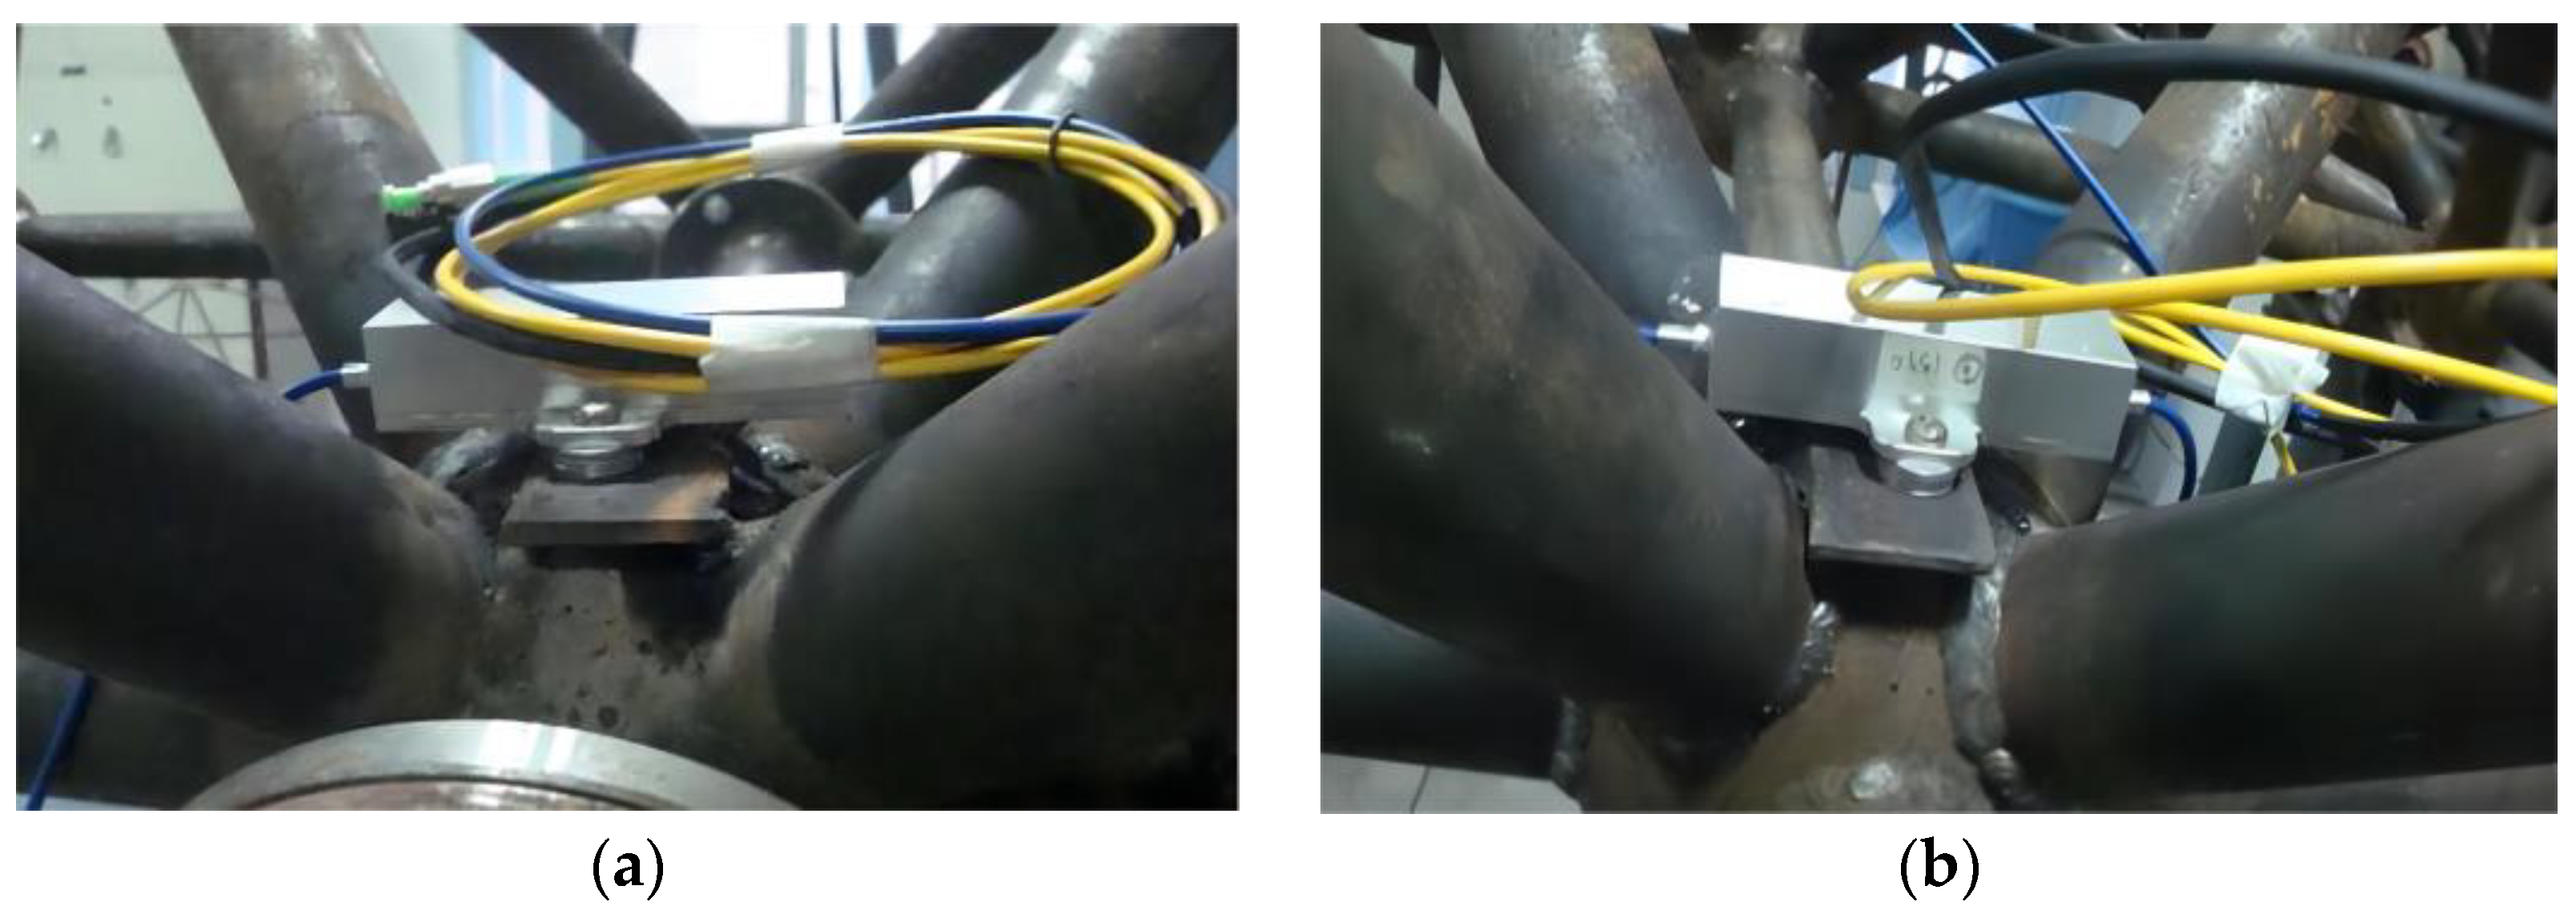
2, respectively. To monitor the structural vibrations, the two FBG accelerometers were installed on key joint 8 in sub-region A and key joint 17 in sub-region B, as shown in Figure 14.
The si425-500 FBG sensor demodulator, along with its supporting software, was employed to collect the testing data, which is a multi-channel, multi-sensor measurement system utilizing a calibrated wavelength scanning laser, operating at a sampling frequency of 250 Hz and offering a resolution of 1 pm.

3.4. Damage Identification of Weld Joints in Grid Structures

In order to further validate the feasibility and effectiveness of the proposed method, some damage cases were considered, as shown in Table 2.
By applying an initial displacement on its top, the grid model was excited to vibrate freely, the acceleration responses of the representative joints 8 and 17 were measured with the FBG sensors and analyzed by wavelet transform. Subsequently, when weld damage occurred on a specific joint within this sub-region, the singular value of the high-frequency components of the acceleration response was obtained through wavelet transform, which was then used to determine whether weld damage had occurred in this particular sub-region.
To simulate the sudden occurrence of joint damage in the test and capture the time–history acceleration response, three steps of free vibrations were conducted. In the first step, a horizontal initial displacement of 2 cm in the X direction was applied to the intact structure, causing it to vibrate freely. The time–history acceleration responses of joint 8 and joint 17, referred to as data I, were collected during this vibration. In the second step, a 1 cm displacement in the X direction was applied to the intact structure, leading to another round of free vibration. The acceleration responses of the two joints, referred to as data II, were recorded. In the third step, the same 1 cm displacement in the X direction was applied to the damaged structure resulting in free vibration. The acceleration responses of the two joints were measured as data III.
The splice point of data I and data III was determined by overlapping the corresponding parts of data I and data II, on which data I and data III were spliced together. The combined dataset included the acceleration response information of the joints before and after the occurrence of structural damage.
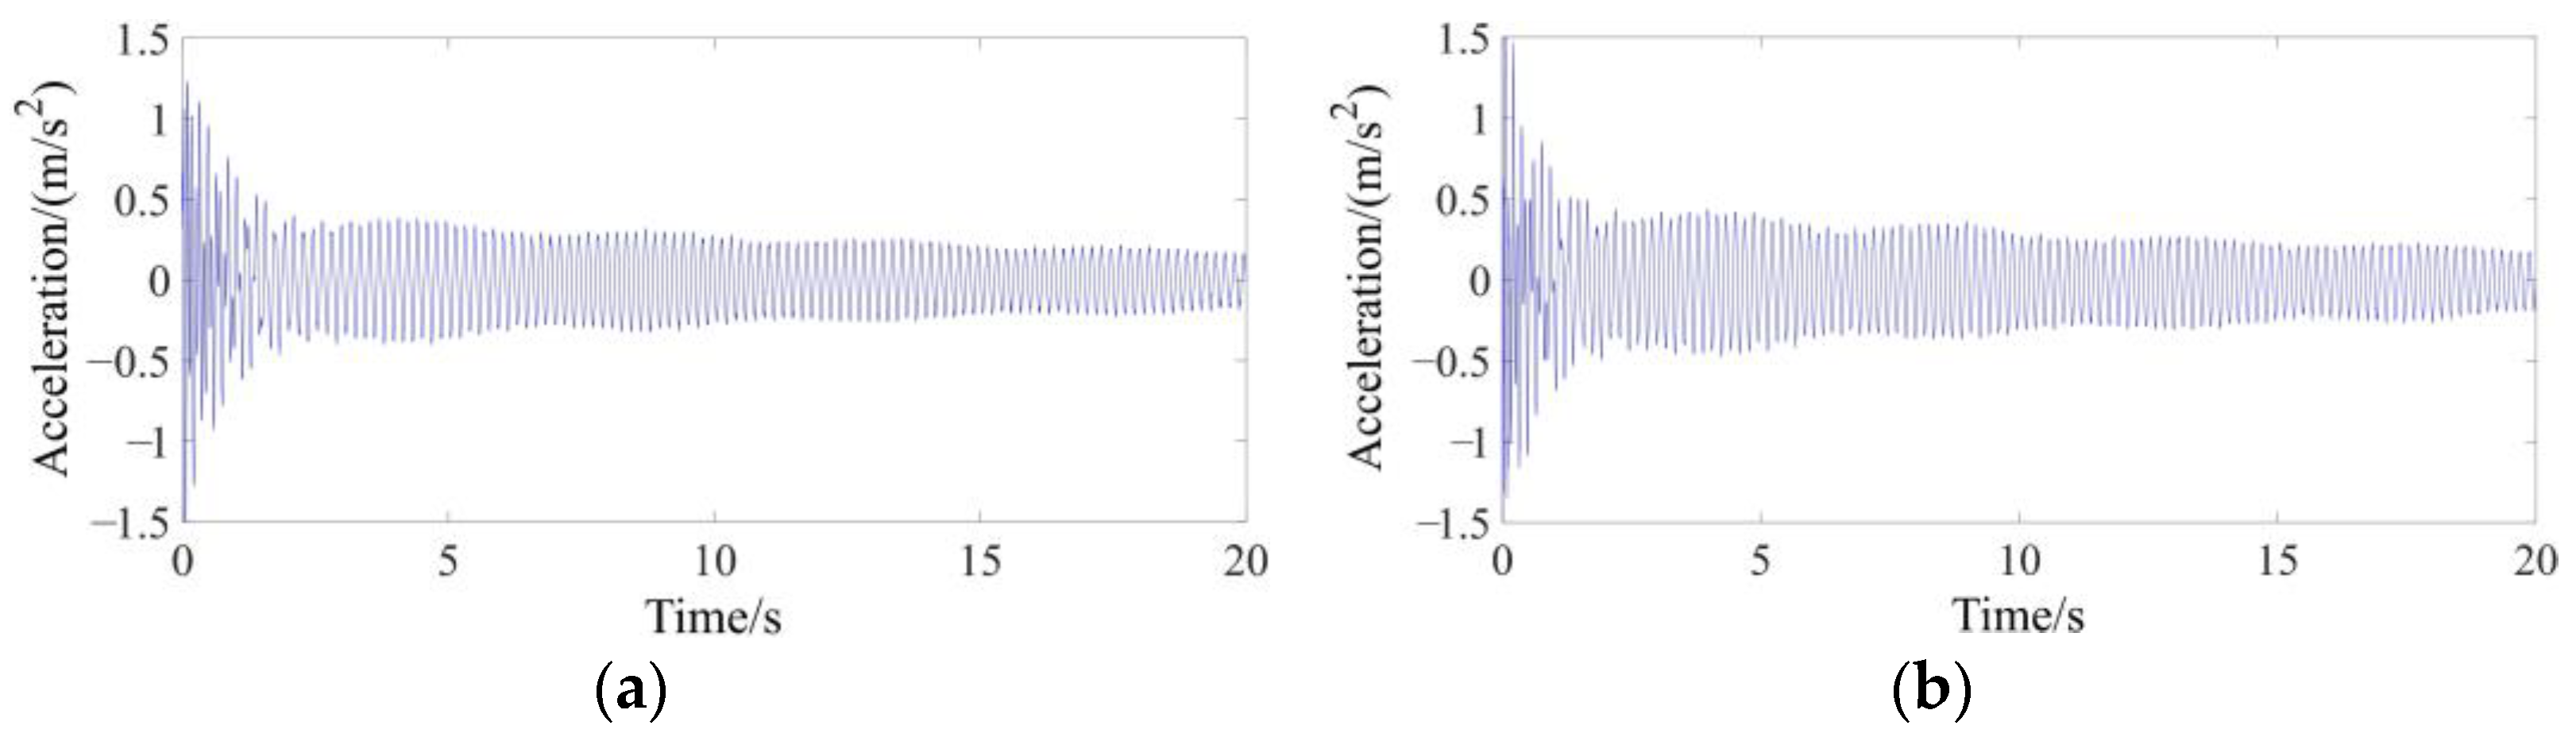
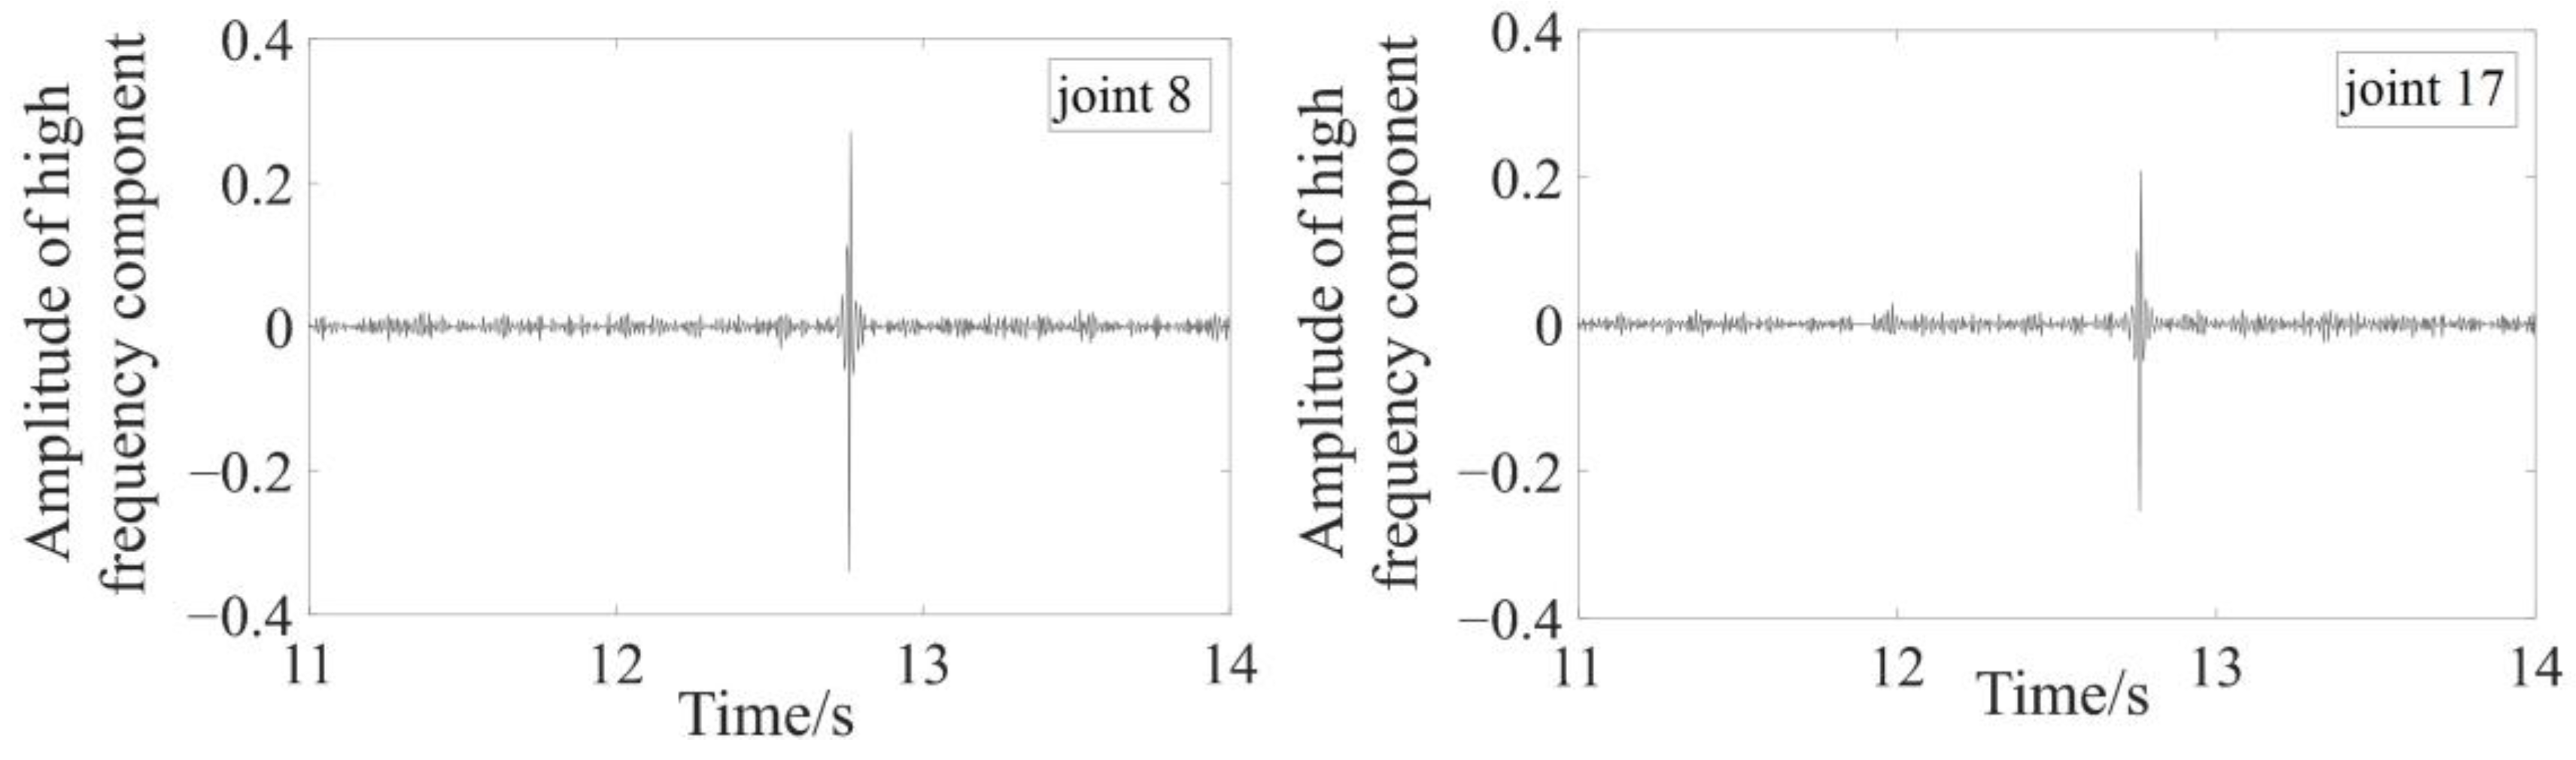
Case 1, which serves as an example to demonstrate the steps of damage identification, involves damage solely at joint 2. The measured acceleration responses of joint 8 and joint 17 are presented in Figure 15.
Upon observation, it becomes evident that during the stable free-vibration stage that the time–history curves obtained from the FBG accelerometers exhibit relatively smooth and sensitive behavior. This characteristic indicates that the designed accelerometer possesses excellent anti-noise performance and sensitivity, allowing precise measurement of the structural response.
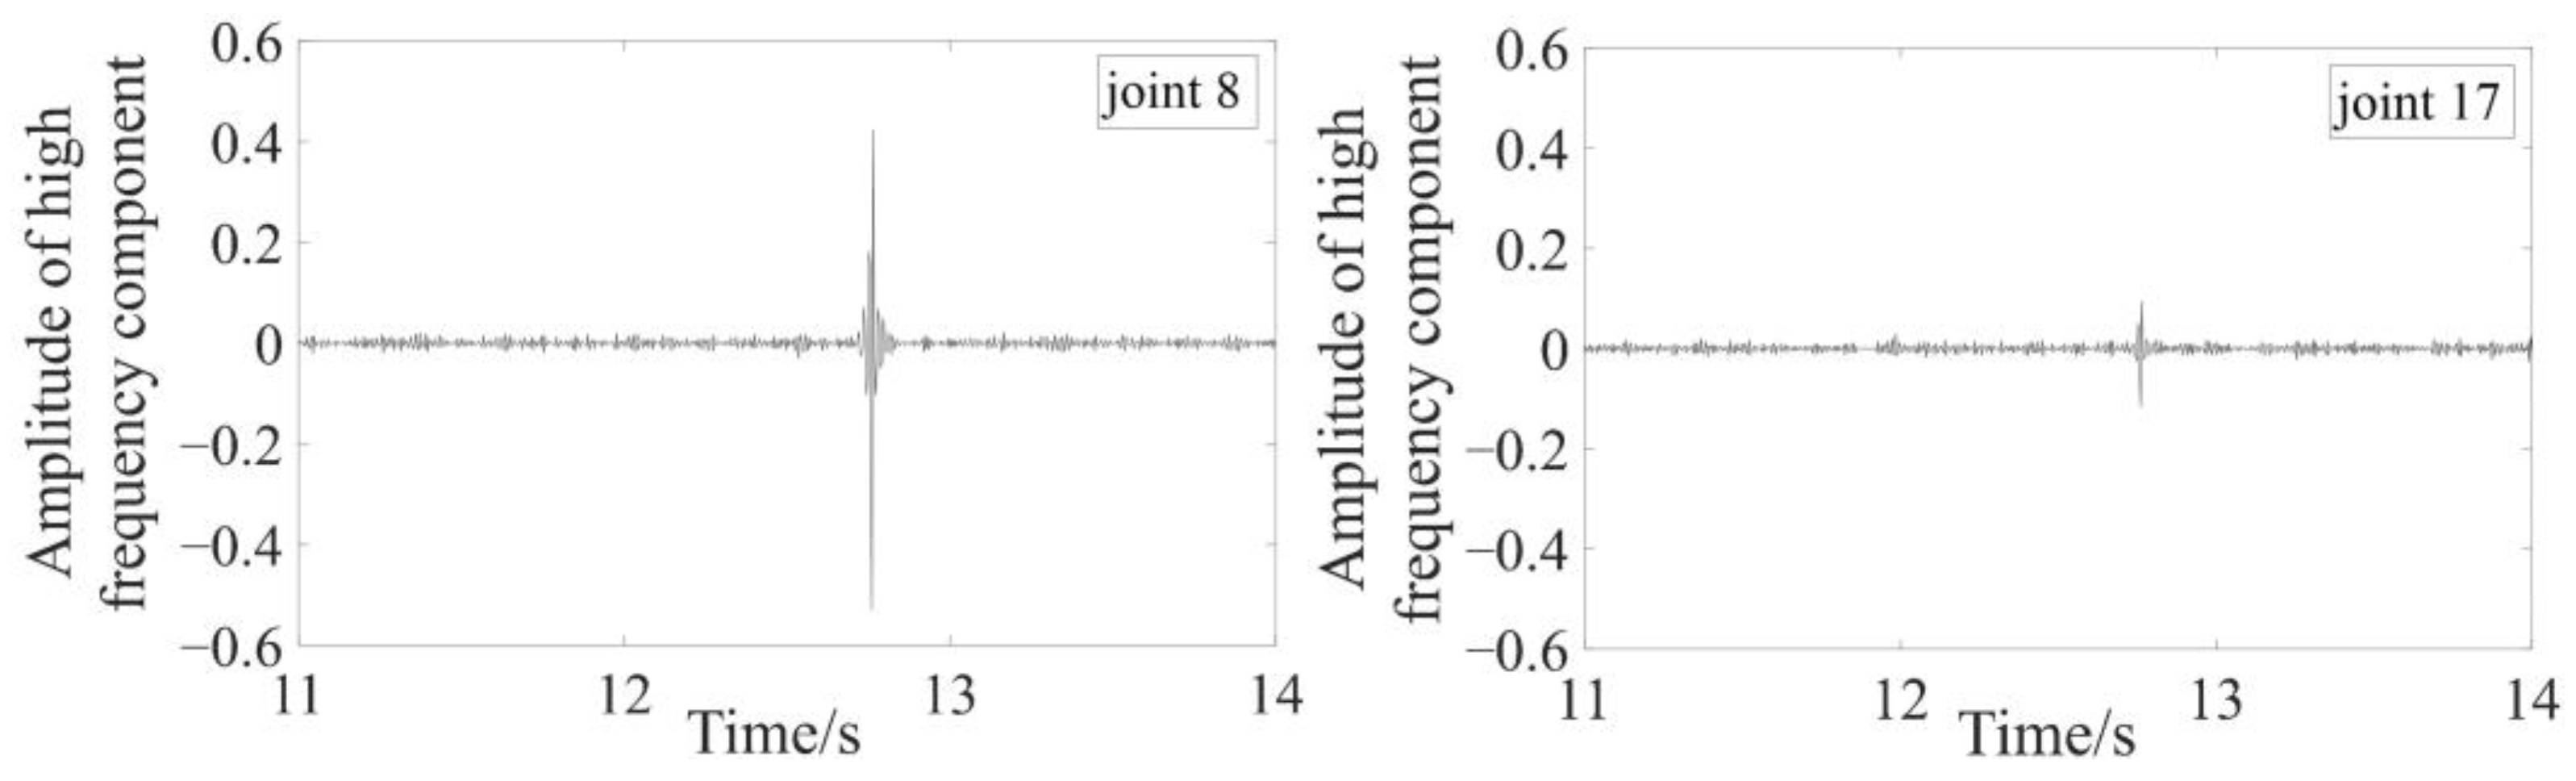
The wavelet transform was performed on the acceleration responses of the joints to analyze and extract the singular value of the high-frequency component. The amplitude of this singular value can be utilized to determine whether weld damage has occurred at sub-region A or B within the structure. Figure 16 displays the amplitudes of the singular value of the high-frequency component for the two key joints.
Figure 16 reveals that the amplitude of the singular value of joint 8 is notably higher than that of joint 17. This stark difference indicates the presence of weld damage in structural sub-region A. Moreover, the results of Figure 16 also illustrate the feasibility of adopting the method proposed in this paper to simulate weld damage at the joints of the grid structure in the experiment, and the obtained acceleration response time histories of arrayed sensor joints also successfully characterize the occurrence of weld damage at the joints.
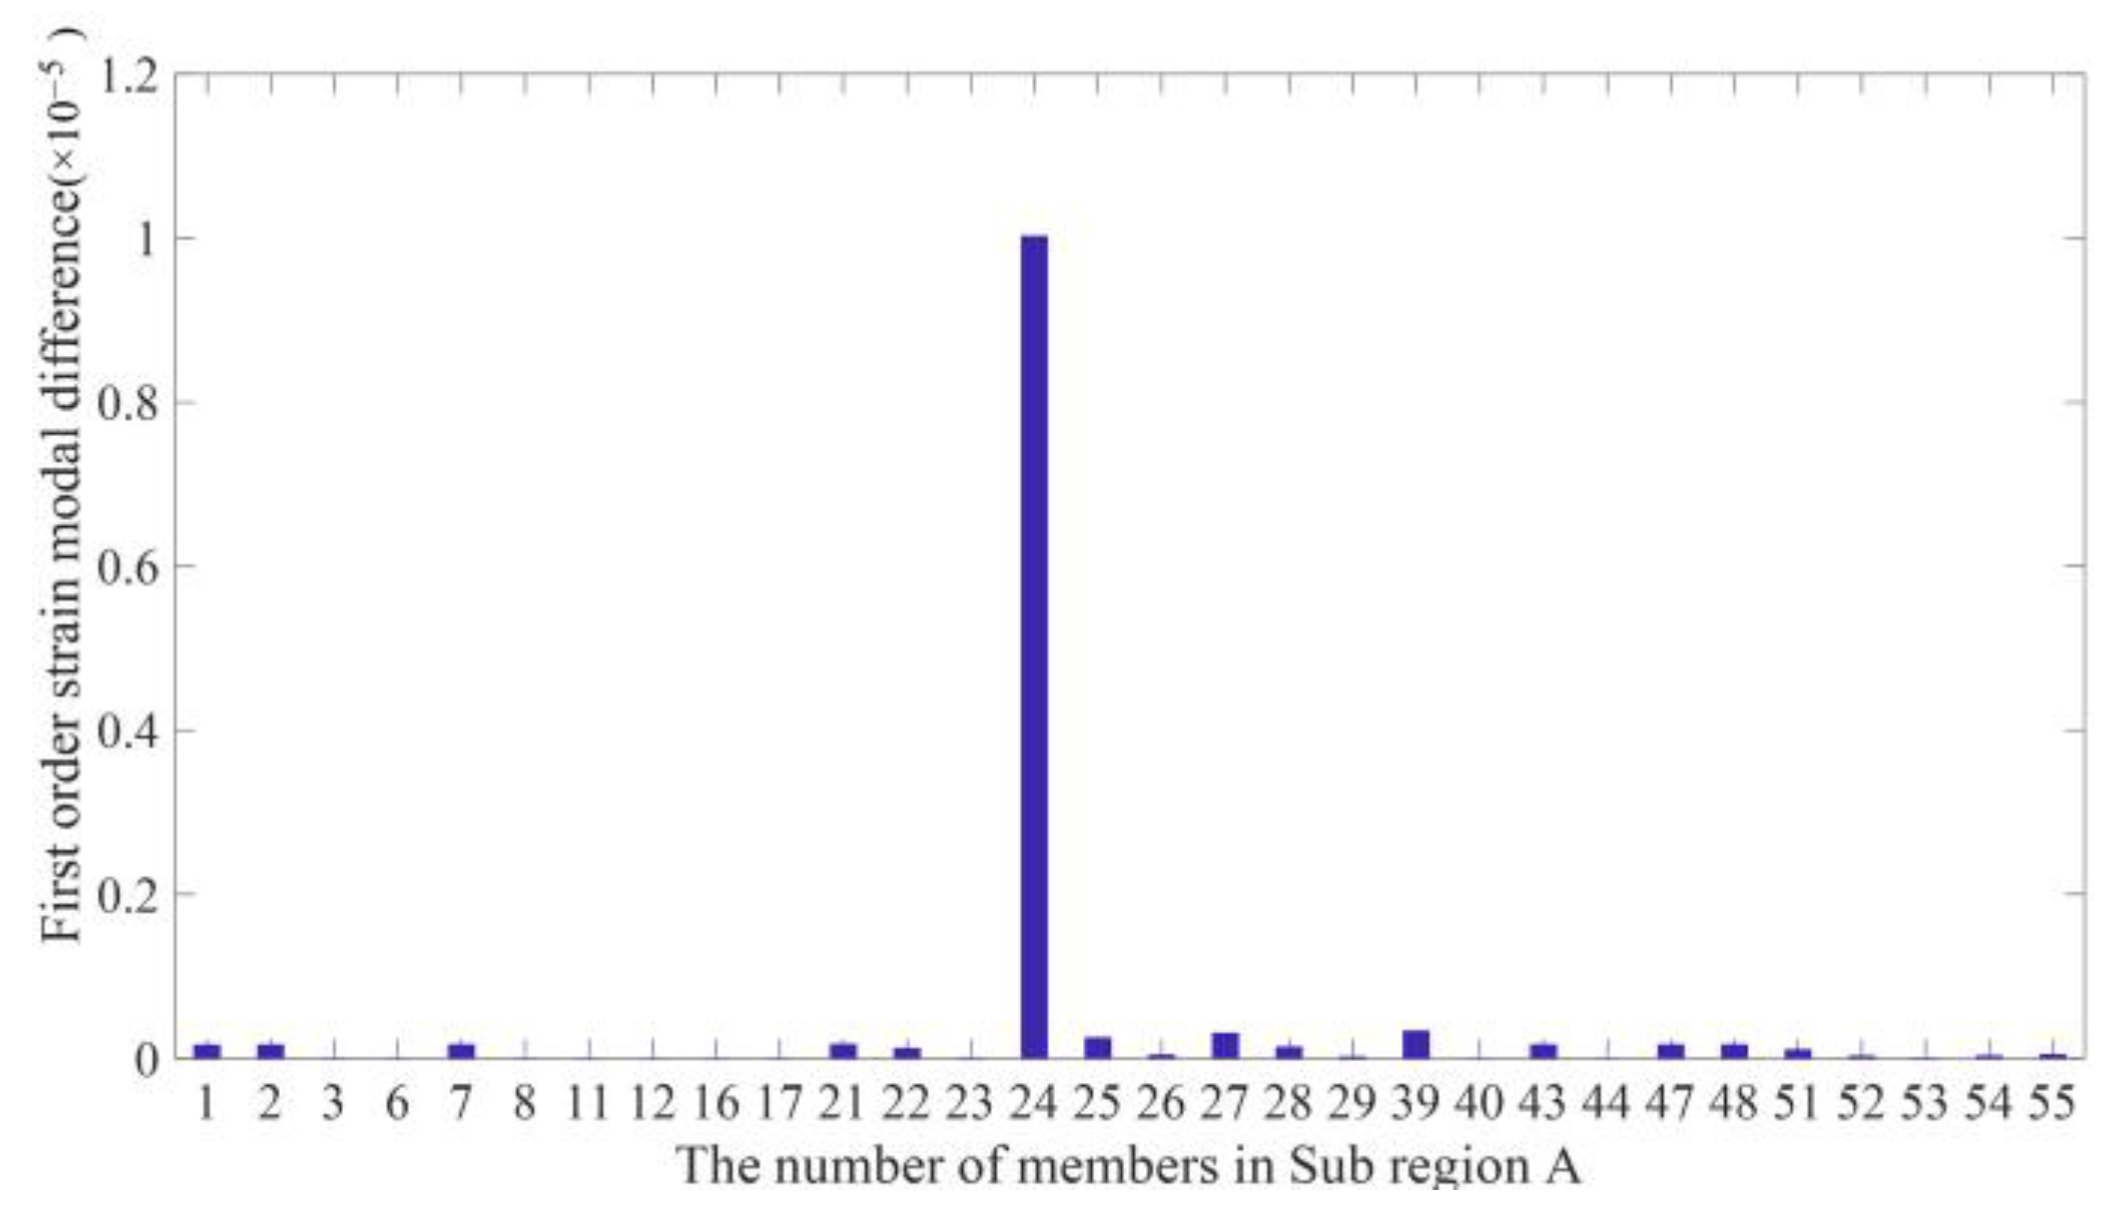
In the first step it was determined that the weld damage occurred in the sub-region A. In the second step, the membership degree between the eigenvectors of each pattern library and the corresponding Id vectors in this sub-region A was calculated using the strain mode difference. The strain mode difference of each member in sub-region A is shown in Figure 17.
Subsequently, the damage index Id was determined by comparing the strain mode difference with the corresponding member with 345° joint damage in each pattern library. Finally, the membership degrees between the Id vector and all pattern libraries in sub-region A were calculated. The pattern with the highest membership degree represents the pattern of joint damage. Some membership degree diagrams are shown in Figure 18.
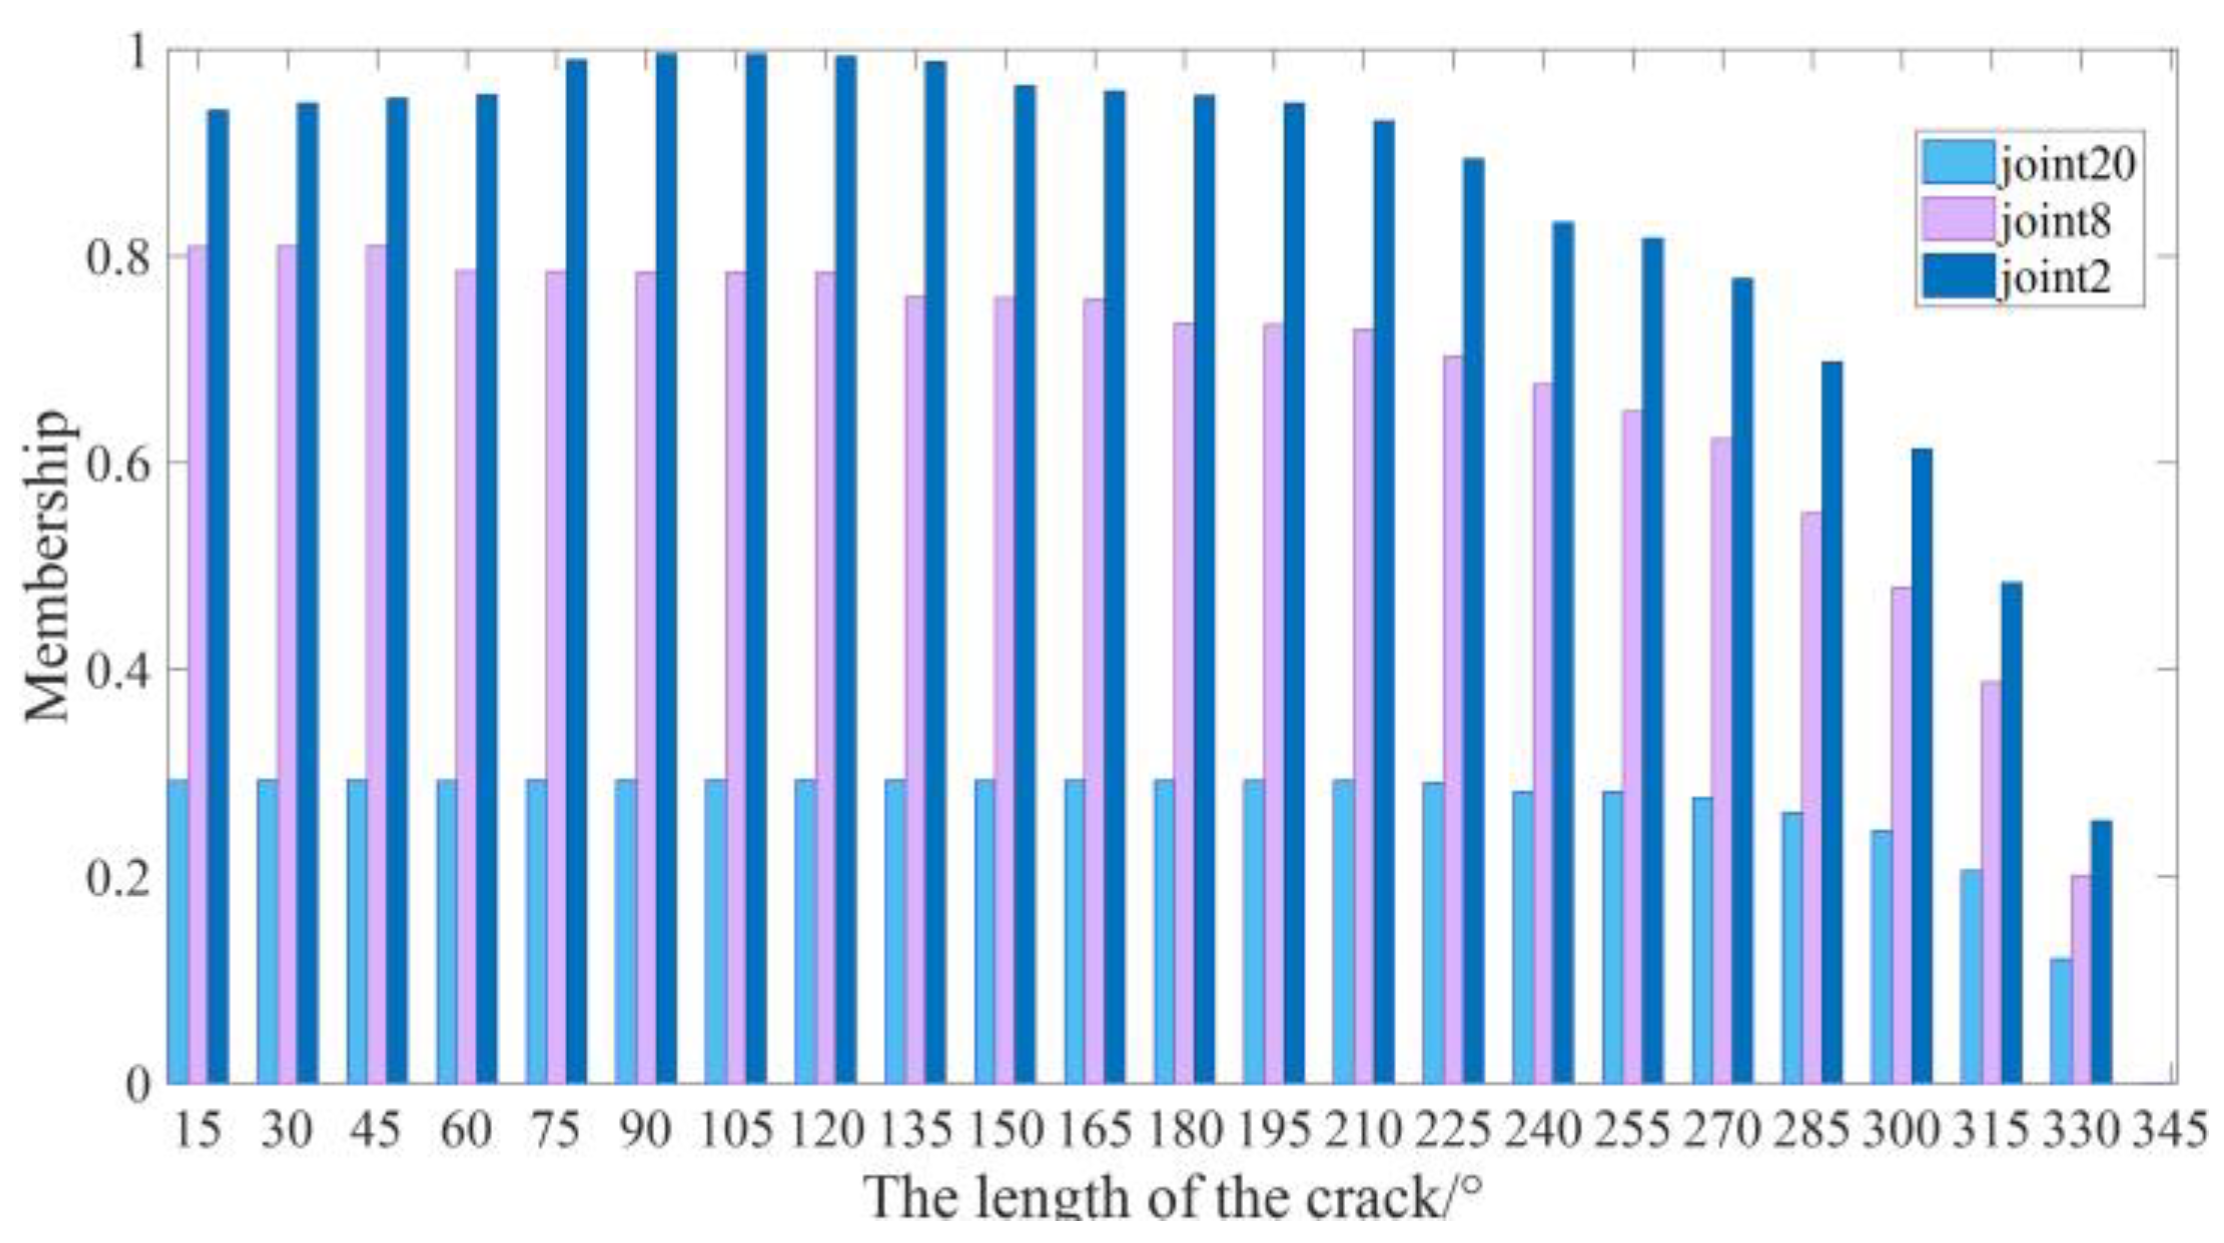
Figure 18 depicts the membership degree between the damage pattern of Case 1 and the 23 pattern libraries of the damaged joint 2 of No. 24 member. It also shows the membership degree between Case 1 and the pattern libraries of the damaged joint 8 of No. 24 member, as well as the membership degree between Case 1 and the pattern libraries of the damaged joint 20 of No. 26 member.
Since joint 2 is adjacent to joint 8, and the sensitive members of the damage pattern for joint 8 are the No. 24 and No. 25 members, which are the same as those for joint 2, the membership degree is higher but still smaller than that of joint 2. On the other hand, joint 20 is farther away from joint 2, and its sensitive members are No. 25 and No. 26, which are not exactly the same as those for joint 2. As a result, the membership degree for joint 20 is much smaller compared with joint 2. Therefore, it is confirmed that the damage occurred on joint 2 of No. 24 member. The corresponding membership values are shown in Table 3.
Based on the values of the membership degree, it is evident that the maximum membership degree is 0.9958 when the weld damage of joint 2 in No. 24 member is approximately 90°. This high membership degree indicates that the damage location is indeed at joint 2 of No. 24 member in sub-region A. Furthermore, the damage extent is most likely to be around 90°, which aligns with the findings of Case 1.
In Case 2, the identification process is similar to that of Case 1. Figure 19 and Figure 20 present the results identifying the location and extent of weld damage for two joints. Table 4 provides further details and information related to the results.
Based on Figure 19, it is apparent that there is minimal difference between the singular values of joint 8 and joint 17. This suggests that weld damage has occurred in both sub-regions A and B. Figure 20 and Table 4 provide additional insights into the identification process.
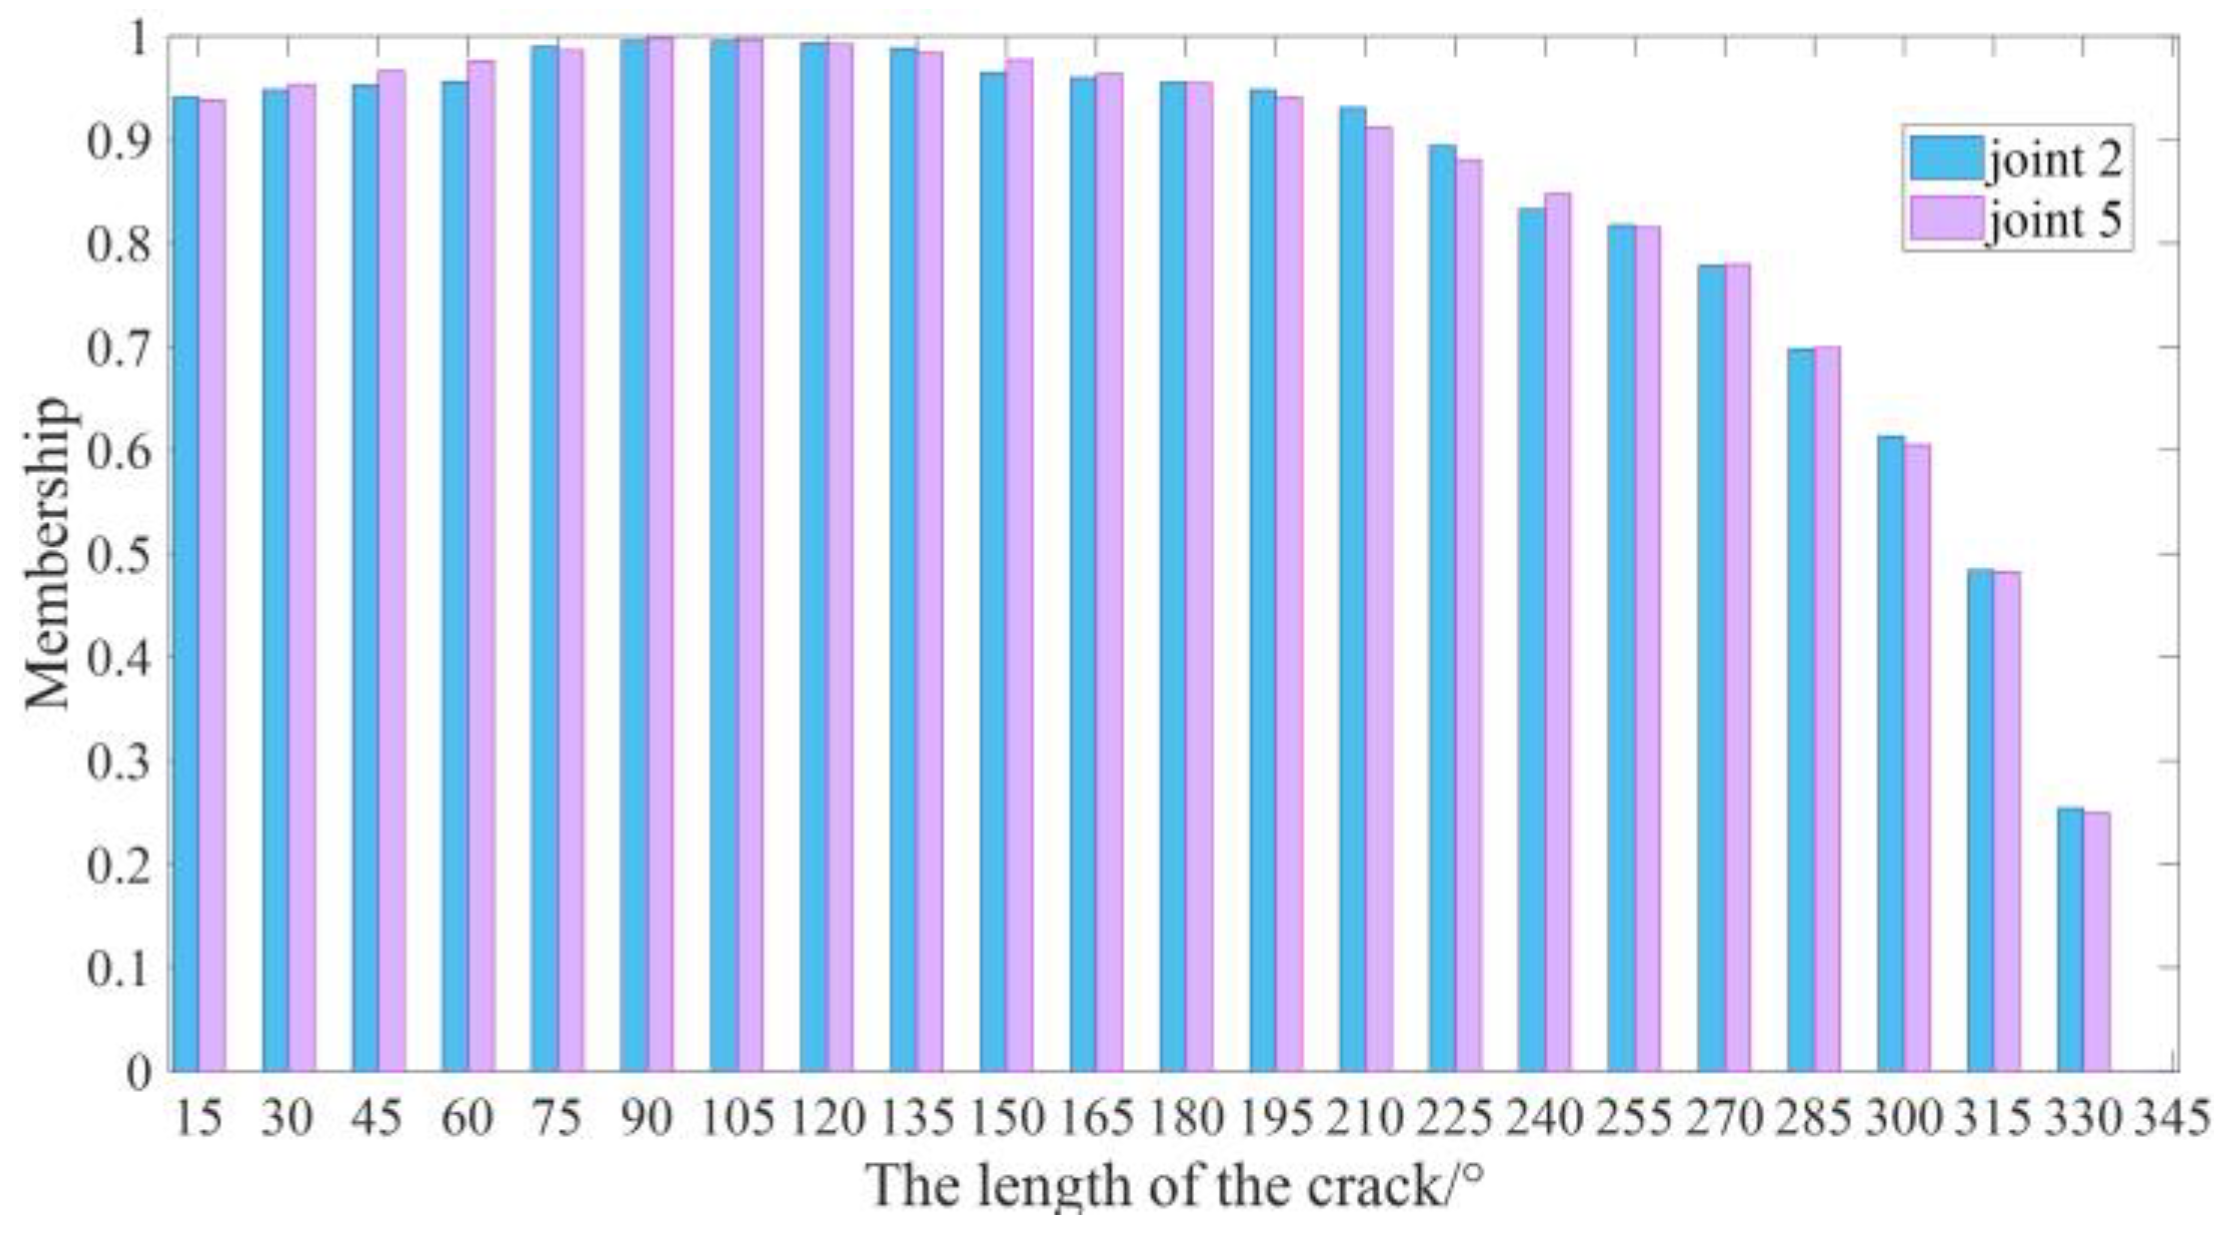
From Figure 20 and Table 4, it can be observed that the maximum membership degree for joint weld damage in the pattern library is 0.9954 for joint 2 connected with No. 24 member in sub-region A and 0.9933 for joint 5 connected with No. 33 member in sub-region B. Both cases indicate a possibility of 90° weld damage. These findings confirm that both joint 2 of No. 24 member in sub-region A and joint 5 of No. 33 member in sub-region B have the highest likelihood of experiencing 90° weld damage, which aligns with the damage scenario presented in Case 2.

3.5. Discussion

The experimental verification demonstrates that partitioning the grid structure allows it to fully leverage the benefits of the wavelet analysis method in capturing sudden shifts in joint response signals caused by structural damage, leading to a reduction in complexity and symmetry. As a result, it becomes feasible to identify the specific sub-region where joint damage occurs by solely analyzing the acceleration responses from sensors deployed on the joints.
By limiting the number of joints and members in each sub-region, the number of potential joint damage patterns per sub-region is significantly reduced. Consequently, a comprehensive pattern library can be constructed with minimal computational effort. Moreover, the adoption of the fuzzy pattern recognition method in the sub-regions with joint damage not only simplifies the recognition of structural damage but also enhances the efficiency and accuracy of the method’s application.
Thus, the combination of these two methods enables the effective recognition of damage in large and intricate structures, such as grid structures, offering a promising approach for practical application.
While the experimental results have demonstrated the effectiveness of the method, its application to a practical engineering scenario poses certain challenges. One notable difficulty is the demanding service conditions of grid structures, leading to the inclusion of inherent noise in the original measurement information. Despite the recommendation to employ FBG acceleration sensors for enhanced measurement accuracy, the measured acceleration responses may still be affected by noise, potentially leading to an increase in the number of structural sub-regions. Consequently, this may result in reduced recognition efficiency and accuracy.
To address this issue, it is essential to process the measured raw information and apply noise reduction techniques. By doing so, the method can be effectively applied to accurately recognize damage in joints of grid structures in practical engineering.

4. Conclusions

Weld damage in joints is a prevalent issue in welded spatial grid structures. To address this problem, a two-step method for identifying weld damage in joints in such structures has been proposed and experimentally verified. The conclusions are as follows:
  • The structure is divided into sub-regions based on the influence range of joint weld damage, determined by analyzing the singular value of the high-frequency component of the acceleration response using wavelet transform. Thereby, reducing the complexity and breaking the symmetry of the grid structure transforms the structure into multiple simple structures. FBG accelerometers are installed only at representative joints within each sub-region. The wavelet transforms of the measured acceleration response at these very few joints facilitate the identification of sub-regions where weld damage has occurred, allowing subsequent damage location and extent identification limited to these sub-regions.
  • In the second step, a fuzzy pattern database is developed considering different damage extents and different damaged joints within each sub-region. The strain modal difference of all members, given the specific damaged location and extent, is used as a damage index to form a pattern. Since the number of joints in the sub-region of the grid structure is rather small, fewer calculations are required to build up the pattern library, and the scale of the pattern library is also smaller. Then, the membership degree between the measurement data and the pattern library enables easy identification of the location and extent of joint damage in the identified sub-region. The step-by-step application of wavelet analysis and fuzzy pattern recognition technology reduces calculation requirements and improves recognition efficiency.
  • The designed FBG accelerometer, which exhibits high sensitivity, is utilized in the identification technology. Performance tests and verification experiments demonstrate that data measured by the FBG accelerometer possess high accuracy and smoothness. By effectively reducing noise, recognition accuracy can be further improved. Consequently, both the proposed two-step identification method and the designed FBG accelerometer offer efficient solutions for damage identification in large-span grid structures, with potential applications in engineering.
These conclusions demonstrate that the proposed method addresses the barriers to damage identification in welded joints of grid structures, and in combination with FBG accelerometers, which have high measurement sensitivity and noise immunity, highlights its effectiveness, efficiency, and potential practical applications in the field of damage identification in welded spatial grid structures.
Although this paper has developed a two-step method for welded joint damage identification in grid structures, there are still some issues for further clarification. The use of crack-equivalent finite element model analysis to establish a library of welded joint damage patterns introduces a certain degree of error. Therefore, it is necessary to investigate a multiscale model capable of characterizing joint crack damage to provide more accurate damage patterns.
If this method is applied to damage identification in practical grid structures, in addition to processing original measurement information for noise reduction, it should also be considered that the damage index plays a crucial role in damage identification, and is the key to the success of damage identification [44]. The complexity of the grid structure may result in identification difficulties due to the high dimensionality of the damage index vectors. As a solution, more concise and sensitive damage indices should be developed to improve the applicability of the damage identification method.

Author Contributions

Supervision, H.L.; methodology, H.L. and X.W.; software, J.H.; test, X.W. and X.L.; writing—review and editing, H.L. and X.W.; funding acquisition, H.L. All authors have read and agreed to the published version of the manuscript.

Funding

The work described in this paper was funded by Hainan Provincial Joint Project of Sanya Yazhou Bay Science and Technology City (Grant No. 520LH058), Hainan Provincial Natural Science Foundation of China (Grant No. 522CXTD517, 522RC879).

Data Availability Statement

Not applicable.

Conflicts of Interest

The authors declare no conflict of interest.

References

  1. Adin, M.S. A Parametric Study on the Mechanical Properties of MIG and TIG Welded Dissimilar Steel Joints. J. Adhes. Sci. Technol. 2023, 37, 1–24. [Google Scholar] [CrossRef]
  2. Wu, Q.; Yu, A.; Kang, Z.; Kuang, C.; Liu, H. Molecular Dynamics Study on the Microscopic Mechanism of In-Service Welding Damage and Failure. Eng. Fail. Anal. 2022, 137, 106402. [Google Scholar] [CrossRef]
  3. Wei, F.; Qiao, P. Vibration-Based Damage Identification Methods: A Review and Comparative Study. Struct. Health Monit. 2011, 9, 83–111. [Google Scholar]
  4. Zhu, H.P.; Lin, L.; He, X.Q. Damage Detection Method for Shear Buildings Using the Changes in the First Mode Shape Slopes. Comput. Struct. 2011, 89, 733–743. [Google Scholar] [CrossRef]
  5. Yin, T.; Jiang, Q.H.; Yuen, K.V. Vibration-Based Damage Detection for Structural Connections Using Incomplete Modal Data by Bayesian Approach and Model Reduction Technique. Eng. Struct. 2017, 132, 260–277. [Google Scholar] [CrossRef]
  6. Ditommaso, R.; Ponzo, F.C.; Auletta, G. Damage Detection on Framed structures: Modal Curvature Evaluation Using Stockwell Transform under Seismic Excitation. Earthq. Eng. Eng. Vib. 2015, 2, 265–274. [Google Scholar] [CrossRef]
  7. Zhang, Y.Z.; Yang, Y.; Kong, L.J.; Du, W.H. Research on Damage Identification Method of Composite Materials Based on Displacement Modal Shape Parameters. J. Phys. Conf. Ser. 2019, 1168, 52046. [Google Scholar] [CrossRef]
  8. Zhou, Y.; Jiang, Y.Z.; Yi, W.J.; Xie, L.M.; Jia, F.D. Experimental Research on Structural Damage Detection Based on Modal Flexibility Theory. J. Hunan Univ. Nat. Sci. Ed. 2015, 42, 36–45. [Google Scholar]
  9. Chang, K.C.; Kim, C.W. Modal-Parameter Identification and Vibration-Based Damage Detection of a Damaged Steel Truss Bridge. Eng. Struct. 2016, 122, 156–173. [Google Scholar] [CrossRef]
  10. Fang, Y.L.; Su, P.R.; Shao, J.Y.; Lou, J.Q.; Zhang, Y. Substructure Damage Identification Based on Model Updating of Frequency Response Function. Int. J. Struct. Stab. Dyn. 2021, 21, 1–32. [Google Scholar] [CrossRef]
  11. Cha, Y.J.; Buyukozturk, O. Structural Damage Detection Using Modal Strain Energy and Hybrid Multiobjective Optimization. Comput. Aided Civil Infrastruct. Eng. 2015, 30, 347–358. [Google Scholar] [CrossRef]
  12. Li, Y.C.; Wang, S.Q.; Zhang, M.; Zheng, C.M. An Improved Modal Strain Energy Method for Damage Detection in Offshore Platform Structures. J. Mar. Sci. Appl. 2016, 15, 182–192. [Google Scholar] [CrossRef]
  13. Arefi, S.L.; Gholizad, A.; Seyedpoor, S.M. Damage Detection of Structures Using Modal Strain Energy with Guyan Reduction Method. J. Rehabil. Civ. Eng. 2020, 8, 47–60. [Google Scholar]
  14. Huang, M.; Li, X.; Lei, Y.; Gu, J. Structural Damage Identification Based on Modal Frequency Strain Energy Assurance Criterion and Flexibility Using Enhanced Moth-Flame Optimization. Structures 2020, 28, 1119–1136. [Google Scholar] [CrossRef]
  15. Sohn, H.; Farrar, C.R. Damage Diagnosis Using Time Series Analysis of Vibration Signals. Smart Mater. Struct. 2001, 10, 446–451. [Google Scholar] [CrossRef]
  16. Lam, H.F.; Yang, J.H.; Hu, Q.; Ng, C.T. Railway Ballast Damage Detection by Markov Chain Monte Carlo-based Bayesian Method. Struct. Health Monit. 2018, 17, 706–724. [Google Scholar] [CrossRef]
  17. Salehi, M.; Azami, M. Structural Damage Localization through Multi-channel Empirical Mode Decomposition. Int. J. Struct. Integr. 2019, 10, 102–117. [Google Scholar] [CrossRef]
  18. Zhu, Y.T.; Xie, M.X.; Zhang, K.; Li, Y.T. Dam Deformation Residual Correction Method for High Arch Dams Using Phase Space Reconstruction and an Optimized Long Short-Term Memory Network. Mathematics 2023, 11, 2010. [Google Scholar] [CrossRef]
  19. Xiao, F.; Meng, X.W.; Zhu, W.W.; Chen, G.S.; Yu, Y. Combined Joint and Member Damage Identification of Semi-rigid Frames with Slender Beams Considering Shear Deformation. Buildings 2023, 13, 1631. [Google Scholar] [CrossRef]
  20. Xiao, F.; Sun, H.M.; Mao, Y.X.; Chen, G.S. Damage Identification of Large-scale Space Truss Structures Based on Stiffness Separation Method. Structures 2023, 53, 109–118. [Google Scholar] [CrossRef]
  21. Kim, H.; Melhem, H. Damage Detection of Structures by Wavelet Analysis. Eng. Struct. 2004, 26, 347–362. [Google Scholar] [CrossRef]
  22. Zhe, F.; Xin, F.; Jing, Z. A Novel Transmissibility Concept Based on Wavelet Transform for Structural Damage Detection. Smart Struct. Syst. 2013, 12, 291–308. [Google Scholar]
  23. Janeliukstis, R.; Rucevskis, S.; Akishin, P. Wavelet Transform Based Damage Detection in a Plate Structure. Procedia Eng. 2016, 161, 127–132. [Google Scholar] [CrossRef]
  24. Zhu, L.F.; Ke, L.L.; Zhu, X.Q.; Xiang, Y.; Wang, Y.S. Crack Identification of Functionally Graded Beams Using Continuous Wavelet Transform. Compos. Struct. 2019, 210, 473–485. [Google Scholar] [CrossRef]
  25. Katunin, A.; Santos, J.; Lopes, H. Damage Identification by Wavelet Analysis of Modal Rotation Differences. Structures 2021, 30, 1–10. [Google Scholar] [CrossRef]
  26. Yazdanpanah, O.; Mohebi, B.; Yakhchalian, M. Selection of Optimal Wavelet-based Damage-sensitive Feature for Seismic Damage Diagnosis. Measurement 2020, 154, 107447. [Google Scholar] [CrossRef]
  27. Zhu, Y.T.; Zhang, Z.D.; Gu, C.S.; Li, Y.T.; Zhang, K.; Xie, M.X. A Coupled Model for Dam Foundation Seepage Behavior Monitoring and Forecasting Based on Variational Mode Decomposition and Improved Temporal Convolutional Network. Struct. Control Health Monit. 2023, 2023, 3879096. [Google Scholar] [CrossRef]
  28. Wang, X.L.; Qu, W.L.; Liu, H.; Caicedo, J.M.; Wang, X.X. Fuzzy Pattern Recognition Technique for Crack Propagation on Earplate Connection of Guyed Mast under Wind Load. Struct. Control Health Monit. 2017, 24, e2010. [Google Scholar] [CrossRef]
  29. Ren, W.X.; Lin, Y.Q.; Fang, S.E. Structural Damage Detection Based on Stochastic Subspace Identification and Statistical Pattern Recognition: I. Theory. Smart Mater. Struct. 2011, 20, 115009. [Google Scholar] [CrossRef]
  30. Jiang, S.F.; Zhang, S. Structural Damage Identification Method with Data Fusion on Fuzzy Neural Network. Eng. Struct. 2008, 25, 95–101. [Google Scholar]
  31. JG/T11-2009; Welded Hollow Spherical Node of Space Grid Structures. China Building Industry Press: Beijing, China, 2009.
  32. Feng, X.; Zhang, X.T.; Sun, C.S.; Motamedi, M.; Ansari, F. Stationary Wavelet Transform for Distributed Detection of Damage by Fiber-optic Sensors. J. Eng. Mech. 2014, 140, 04013004. [Google Scholar] [CrossRef]
  33. Qu, W.L.; Lu, L.J.; Li, M. Solid Modeling Method for Structure with 3-D Straight Through Clack. J. Wuhan Univ. Technol. 2008, 30, 88–90. (In Chinese) [Google Scholar]
  34. Ding, L.J. The Study of Equivalent Finite Element of Welded Hollow Ball with a Crack. Master’s Thesis, Wuhan University of Technology, Wuhan, China, 2012. (In Chinese). [Google Scholar]
  35. Li, L.J.; Che, W.X.; Yang, X.M.; Liu, F. Finite Element Analysis of Reticulated Shells with Semi-rigid Connections. Spat. Struct. 2007, 39, 43–49. (In Chinese) [Google Scholar]
  36. Xiao, F.; Zhu, W.W.; Meng, X.W.; Chen, G.S. Parameter Identification of Structures with Different Connections Using Static Responses. Appl. Sci. 2022, 12, 5896. [Google Scholar] [CrossRef]
  37. Li, Y.M.; Gao, X.Y.; Shi, Y.S.; Zhou, X.Y. Damage Diagnosis of Space Truss based on Change of Elemental Strain Modal. J. Build Struct. 2009, 30, 152–159. (In Chinese) [Google Scholar]
  38. Yin, Z.X.; Xu, Z.M. Damage Identification of Cable Truss-cable Net Structure based on Strain Mode Difference. Build Struct. 2016, 46, 99–103. (In Chinese) [Google Scholar]
  39. Zhang, X.L.; Liang, D.K.; Zeng, J.; Asundi, A. Genetic Algorithm-support Vector Regression for High Reliability SHM System based on FBG Sensor Network. Opt. Lasers Eng. 2012, 50, 148–153. [Google Scholar] [CrossRef]
  40. Jang, B.W.; Lee, Y.G.; Kim, J.H.; Kim, Y.Y.; Kim, C.G. Real-time Impact Identification Algorithm for Composite Structures Using Fiber Bragg Grating Sensors. Struct. Control Health Monit. 2012, 19, 580–591. [Google Scholar] [CrossRef]
  41. Kinet, D.; Megret, P.; Goossen, K.W.; Qiu, L.; Heider, D.; Caucheteur, C. Fiber Bragg Grating Sensors toward Structural Health Monitoring in Composite Materials: Challenges and Solutions. Sensors 2014, 14, 7394–7419. [Google Scholar] [CrossRef]
  42. Malekzadeh, M.; Catbas, F.N. A Comparative Evaluation of Two Statistical Analysis Methods for Damage Detection Using Fibre Optic Sensor Data. Int. J. Reliab. Qual. Saf. Eng. 2014, 8, 135–155. [Google Scholar] [CrossRef]
  43. Elshafey, A.; Marzouk, H.; Gu, X.; Haddara, M.; Morsy, R. Use of Fiber Bragg Grating Array and Random Decrement for Damage Detection in Steel Beam. Eng. Struct. 2016, 106, 348–359. [Google Scholar] [CrossRef]
  44. Chen, Y.; Chen, W.S.; Hao, H.; Xia, Y. Damage Evaluation of a Welded Beam-column Joint with Surface Imperfections Subjected to Impact Loads. Eng. Struct. 2022, 261, 114276.1–114276.12. [Google Scholar] [CrossRef]
Figure 1. The detection framework of weld damage in joints.
Buildings 13 02141 g001
Figure 2. Location of cracks.
Buildings 13 02141 g002
Figure 3. Mesh generation of cracked body, (a) element of the surface of crack front edge, (b) front body of crack.
Buildings 13 02141 g003
Figure 4. Model of welded hollow ball joint.
Buildings 13 02141 g004
Figure 5. Fitting curves of stiffness coefficient.
Buildings 13 02141 g005
Figure 6. The numbers of nodes and chords of the structural finite element model.
Buildings 13 02141 g006
Figure 7. Wavelet transform of acceleration response of each joint, (a) No. 7 joint, (b) No. 8 joint, (c) No. 9 joint, (d) No. 10 joint, (e) No. 25 joint, (f) No. 31 joint, (g) No. 36 joint, (h) No. 37 joint.
Buildings 13 02141 g007
Figure 8. Sub-regional division of the structure and arrangement of joints for FBG accelerometers. A and B represent sub-region A and sub-region B.
Buildings 13 02141 g008
Figure 9. Id Changes with crack length.
Buildings 13 02141 g009
Figure 10. Structural model.
Buildings 13 02141 g010
Figure 11. Replaceable members, (a) Three-dimensional schematic, (b) Actual object.
Buildings 13 02141 g011
Figure 12. FBG accelerometers.
Buildings 13 02141 g012
Figure 13. The performance curve of acceleration sensors, (a) 1545 nm, (b) 1550 nm.
Buildings 13 02141 g013
Figure 14. Acceleration sensors distribution, (a) No. 8 joint, (b) No. 17 joint.
Buildings 13 02141 g014
Figure 15. Acceleration response time history of two joints, (a) No. 8 joint, (b) No. 17 joint.
Buildings 13 02141 g015
Figure 16. Case 1, the singular value amplitudes of high-frequency component of key joints.
Buildings 13 02141 g016
Figure 17. First order strain mode difference of elements in Sub-region A.
Buildings 13 02141 g017
Figure 18. The membership degree between the damage pattern of case 1 and each typical pattern library.
Buildings 13 02141 g018
Figure 19. Case 2, the amplitude of singular value of high-frequency component of key joints.
Buildings 13 02141 g019
Figure 20. The membership degree between the damage pattern of Case 2 and corresponding pattern library.
Buildings 13 02141 g020
Table 1. The performance test data of acceleration sensors.
Acceleration (m/s2)Amplitude of Acceleration Sensors (pm)
1545 nm1550 nm
0.29.210
0.418.221
0.62930
0.83742
Table 2. Damage Cases.
Damage CasesDamaged MembersDamaged Joints of MemberExtent of Damage
Case1Member 24Joint 290°
Case2Member 24Joint 290°
Member 33Joint 590°
Table 3. The Degree of Membership between the damage pattern of Case 1 and Pattern Library of Joint 2 Damage.
Extent of DamageDegree of MembershipExtent of DamageDegree of MembershipExtent of DamageDegree of Membership
15°0.9411135°0.9882255°0.8172
30°0.9481150°0.9649270°0.7782
45°0.9527165°0.9596285°0.6978
60°0.9562180°0.9553300°0.6135
75°0.9898195°0.9480315°0.4840
90°0.9958210°0.9307330°0.2538
105°0.9954225°0.8941345°0.00
120°0.9931240°0.8325
Table 4. The Membership Degree between the damage pattern of Case 2 and Pattern Library of Joint 2 and Joint 5 Damage.
Extent of DamageDegree of MembershipExtent of DamageDegree of Membership
Joint 2Joint 5Joint 2Joint 5
15°0.94580.9453195°0.93450.9343
30°0.96050.9601210°0.90560.9056
45°0.97210.9727225°0.87460.8746
60°0.98320.9822240°0.84180.8418
75°0.99300.9915255°0.80960.8096
90°0.99540.9933270°0.77420.7742
105°0.99050.9893285°0.69430.6943
120°0.98570.9848300°0.60110.6011
135°0.97780.9773315°0.47900.4790
150°0.97060.9703330°0.24650.2478
165°0.95710.9569345°0.000.00
180°0.94810.9479
Disclaimer/Publisher’s Note: The statements, opinions and data contained in all publications are solely those of the individual author(s) and contributor(s) and not of MDPI and/or the editor(s). MDPI and/or the editor(s) disclaim responsibility for any injury to people or property resulting from any ideas, methods, instructions or products referred to in the content.

