Article

A Continuously Derivable Uniaxial Tensile Stress-Strain Model of Cold-Formed Circular Steels

College of Architecture and Urban-Rural Planning, Sichuan Agricultural University, Chengdu 611830, China
*
Author to whom correspondence should be addressed.
Buildings 2024, 14(1), 36; https://doi.org/10.3390/buildings14010036
Submission received: 21 November 2023 / Revised: 14 December 2023 / Accepted: 19 December 2023 / Published: 22 December 2023
(This article belongs to the Special Issue Advanced Numerical and Computer Methods in Civil Engineering)

Abstract

:
Promoting prefabricated steel structures is considered one of the crucial approaches to meeting the objectives of “carbon peak” and “carbon neutrality” in the construction industry. Due to insufficient practical experience and incomplete fine engineering techniques in civil construction, the sustainable development of prefabricated building systems in China faces many challenges. Taking steel components as an example, the design process of tubular columns does not pay enough attention to the influence of the cold-working effect on material mechanical properties, and the constitutive relationship of cold-formed steels is not clear, which will cause an engineering economic burden and may affect the judgment of catastrophic problems. To serve the refined design and meet the intelligent construction technology using the computer platform, a modified Menegotto-Pinto model using a continuously derivable function is proposed in the paper. The proposed model can successfully describe the complete stress-strain curve of cold-formed circular mild steels as long as the basic mechanical parameters of the parent material are determined. Taking into account the influence of the strength and thickness of the parent steel sheets, as well as the internal bending radius r, on the cold-rolling effect, the model can also flexibly track the elastic-plastic nonlinearity of the cold-formed materials. In addition, the research shows that the cold-rolling effect will weaken with the increase of the yield strength fsy,0 of the parent steels and r/t ratio, and may disappear when fsy,0 reaches 1748 MPa or the r/t ratio is approximately 60, which can be used as economic indicators during the design process.

1. Introduction

To accomplish the objectives of “carbon peak” and “carbon neutrality” in the building and construction industries, the promotion and application of prefabricated steel structure buildings are advocated to meet the requirements of the circular economy and sustainable development in China [1,2]. The measures to promote prefabricated steel structure buildings can be divided into the following broad categories: construction technology, the use of high-strength steel, intelligent construction technology using the computer platform, and so on [3]. In recent years, due to their high capacity, ease of construction, and recyclable utilization, cold-formed steel structures have shown great potential in intelligent design. While experiencing cold-forming, the uniaxial tensile stress-strain curve of mild steels exhibits a more rounded stress-strain response which is no longer suitable to be described by an ideal elastic-plastic model or simple broken line models. However, the most popular structural design is still inclined to use such models to simulate cold-formed steels. On the other side, the guidance contents in most of the current specifications [4,5,6] are on the basis of early experimental work, which limits the range of material strength and geometry parameters. In fact, there are significant differences in the strength improvement of different steel section types formed through cold-rolling. Those specifications primarily concentrate on the strength enhancement for the corner sections but neglect the cold-rolling effect for the circular hollow sections (CHSs for short). The above issues may lead to some key technical issues being vague and increasing the economic burden of engineering, which contradicts the intention of green building and intelligent design.
Determining a material constitutive model is one of the essential parts of structural analysis. Establishing an efficient computational numerical model in intelligent design requires defined material strength and a continuous function to deal with the stress-strain relationship of materials. Many studies have been carried out to study the uniaxial tensile stress-strain models of cold-formed steels as well as the strength enhancement due to cold work. Li et al. [7] have contrasted several available predictive methods of strength enhancement and found that current specifications, such as AISI [5] and Eurocode 3 [6], overestimate the cold-formed effect on corner yield strength, while the empirical methods proposed by various researchers have limitations in terms of the r/t ratio. Liu et al. [8] proposed a new method to predict the corner strength of cold-formed conventional steels based on measured data, and the method can be applicable to the yield strength fsy,0 of parent materials, which ranges from 256 MPa to 497 MPa and the r/t ranges from 0.57 to 7.54. Masoud Kalani [9] investigated the cold work effect on the tensile behavior of thick steel plates and verified the accuracy of several available equations for predicting the average yield stress of the experimental specimens. Pham [10] investigated the G450 channel steels to better predict the strength enhancement of high-strength steels. Chen [11] conducted an investigation into the material properties of high-strength CHS steels with r/t ranging from 11.5 to 32.3 and found that the yield strength improvement rate fsy/fsy,0 of the Q460 was 1.09, while the Q960 section exhibited no increase in strength. Meng [12] discovered that tensile coupons of high-strength CHS (fsy,0 = 799 MPa, r/t = 7~29) exhibit lower fsu/fsy as the r/t ratio decreases. Generally, the use of high-strength material leads to a longer life span of the structure and brings cost-effectiveness [13]. However, based on experimental investigations, Chan et al. [14] found that the measured failure strain of high-strength steels cannot meet the requirements of Eurocode 3 due to the press-braking process.
Given that most research has focused on the effect of cold-forming on material strength enhancement, the influence of cold-forming on the deformation ability of steels should be given more attention and carefully introduced into the relationship between stress and strain. Based on the differences in the fabrication process, Yao et al. [15] established a finite element-based method for plastic strains, as well as residual stresses, in cold-formed steel hollow sections, but the stress-strain relationships of cold-formed steels used in the finite element model were transformed from experimental curves. Gardner [16] proposed a method to predict the strength enhancement in the corner regions of cold-formed sections by considering the plastic strains associated with the dominant stages in the fabrication process. Further, Gardner [17] improved the Ramberg-Osgood model [18] by using piecewise functions to describe the stress-strain curve of cold-formed steels, and the improved model was confirmed to have good accuracy. Similarly, Quach and Huang [19] also raised a modified Ramberg-Osgood model to describe the uniaxial tensile stress-strain curve of cold-formed steels. Based on detailed experimental testing, Li et al. [20] established a material model to simulate cold-formed high-strength steels. Note that although the above models can reflect the rounded tensile curve characteristics of cold-formed steels, their mathematical carriers are all piecewise functions, and the steel yield strength fsy after cold work is required before using these models.
In summary, the cold-rolling effect of steel is generally affected by the yield strength fsy,0, and thickness t of the parent steel sheets, the internal bending radius r, and the section shape [21,22]. The available prediction expressions used to reveal the strength enhancement and stress-strain curves of cold-formed steels were more for corner sections than for CHSs. In order to better promote the efficient, intelligent design of prefabricated steel structures, the objective of this paper is to propose a continuously derivable uniaxial tensile stress-strain model of cold-formed circular steels. The paper focuses on the influence of cold-rolling on the material properties of CHS mild steels based on the design parameters of the parent steels. More specifically, based on the collected experimental data of CHS mild steels with a wide range of yield strength and r/t ratio, a systematic analysis was conducted on the influence of cold-rolling on the strength and deformation of different sections of slenderness. The proposed constitutive model was established by modifying the Megenetto-Pinto model [23] since the function image can reflect a complete nonlinear characteristic of cold-formed steels under uniaxial tension and exhibits a clear physical meaning. Finally, in order to demonstrate the superiority of the proposed model, comparative studies of the full range of stress-strain curves and corresponding absorption capacity were carried out with the measured curves and available models.

2. Uniaxial Tensile Stress-Strain Model Based on the Menegotto-Pinto Model

Establishing a complete stress-strain model with a unified function will enhance the design and process of intelligent platforms. Through detailed comparison and investigation, a modified Menegotto-Pinto model was raised to describe the uniaxial tensile stress-strain relationship of cold-formed CHS mild steels. In fact, the Menegotto-Pinto model was first raised to deal with the nonlinear responses of reinforced concrete members under earthquakes, and the material law of mild steels is a four-parameter model, which is described by a continuously derivable composite function [23]. In previous studies, the model was successfully improved to fit the ascending stage of the equivalent stress-strain relationship of cold-formed steel stub columns [24], and its mathematical expression and corresponding figure are shown in Equation (1) and Figure 1, respectively. Note that the parameter S, as shown in Figure 1, represents the ratio of ultimate tensile strength to yield strength. Combining Equation (1) and Figure 1, it can be seen that the modified model is composed of a derivable function and can flexibly track the material nonlinearity by adjusting the value of N.
f s = E s ε s ( Q + 1 Q ( 1 + ( ε s ε s y ) N ) 1 N ) , ε s ε s u
where Q is the strain-hardening coefficient; the exponent N mainly controls the roundness of the yield stage; εsy is the nominal yield strain; εsu is the ultimate strain corresponding to the ultimate tensile strength fsu.
To improve the efficiency of intelligent design and to highlight the relationship between the constitutive model of cold-formed mild steels and design parameters (fsy,0 and t of the parent material and the r/t ratio of CHS), the paper intends to continue improving the modified Megenetto-Pinto model for fitting the material constitutive model of cold-formed CHS mild steels.

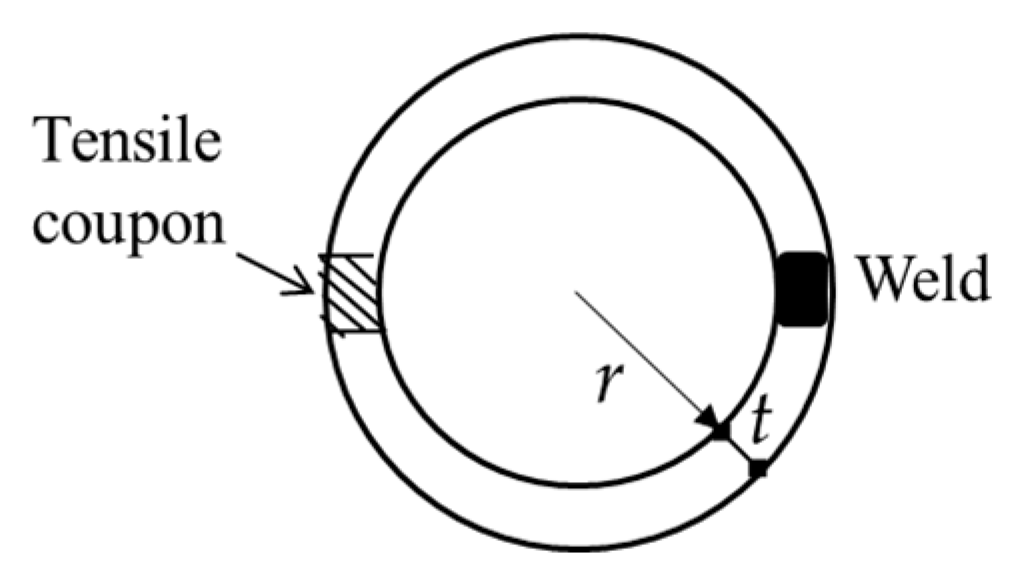
3. Tensile Coupon Details of Cold-Formed CHS Steels

A comprehensive collection of 74 experimental results from the available literature is assembled. Figure 2 displays the labels assigned to the tensile coupon, while specimens from the weld area are excluded from the analysis. Additionally, specimens failing to meet the ductility requirements of the specifications are also eliminated. A summary of the variables of specimens as well as necessary experimental results is provided in Table 1, where fsy,0 and fsy are the yield strengths of the same material before and after cold-rolling, respectively. Additionally, fsu represents the ultimate tensile strength of cold-formed CHS steel specimens. For convenience, based on the parent steel, coupons with fsy,0 exceeding 460 MPa are considered high-strength steels [25]. As shown in Table 1, the range of fsy,0 is from 400 MPa to 1400 MPa, corresponding to the thickness t of steel sheets varying from 1.5 mm to 10 mm, while the yield strength improves from 357 MPa to 1402 MPa for cold-formed CHSs with a r/t ratio of 6~32.
Figure 3 summarizes the range of values for several key parameters of the collected tensile coupons. The coupons are divided into three groups, with the boundaries of fsy,0 being 460 MPa and 690 MPa, respectively. As shown in Figure 3, the number of coupons for the three groups is relatively uniform, as well as the range of r/t.
All the gathered measured data are utilized to establish a predictive expression for the yield strength fsy and ultimate tensile strength fsu considering the cold work of materials. 54 sets of experimental values of ultimate strain εsu from cold-formed CHS steel specimens are used to assess the corresponding empirical formula. Furthermore, a total of 26 stress-strain curves spanning the full range are examined and analyzed to derive suitable prediction formulas for the curvature coefficient N and the strain-hardening exponent Q. The mathematical expressions of these parameters will be derived in the following sections.

4. Analysis of Results and Recommendations

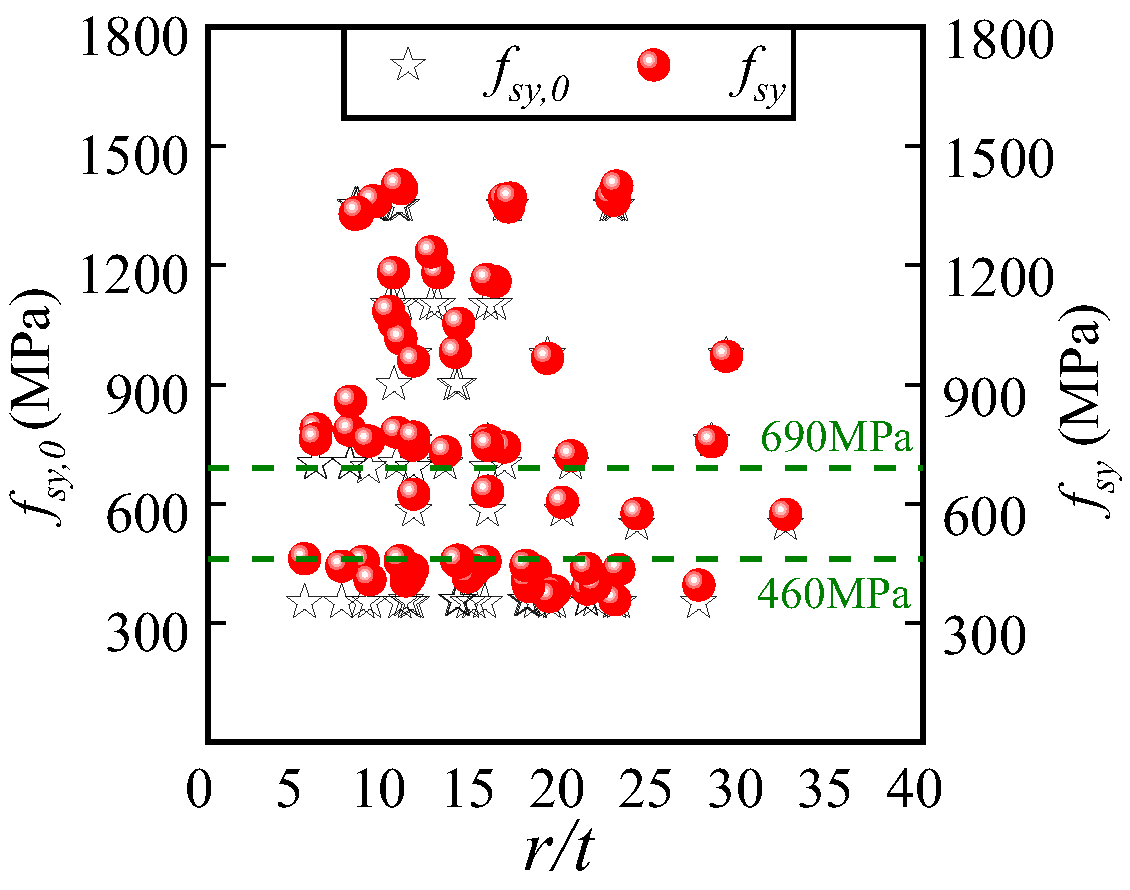
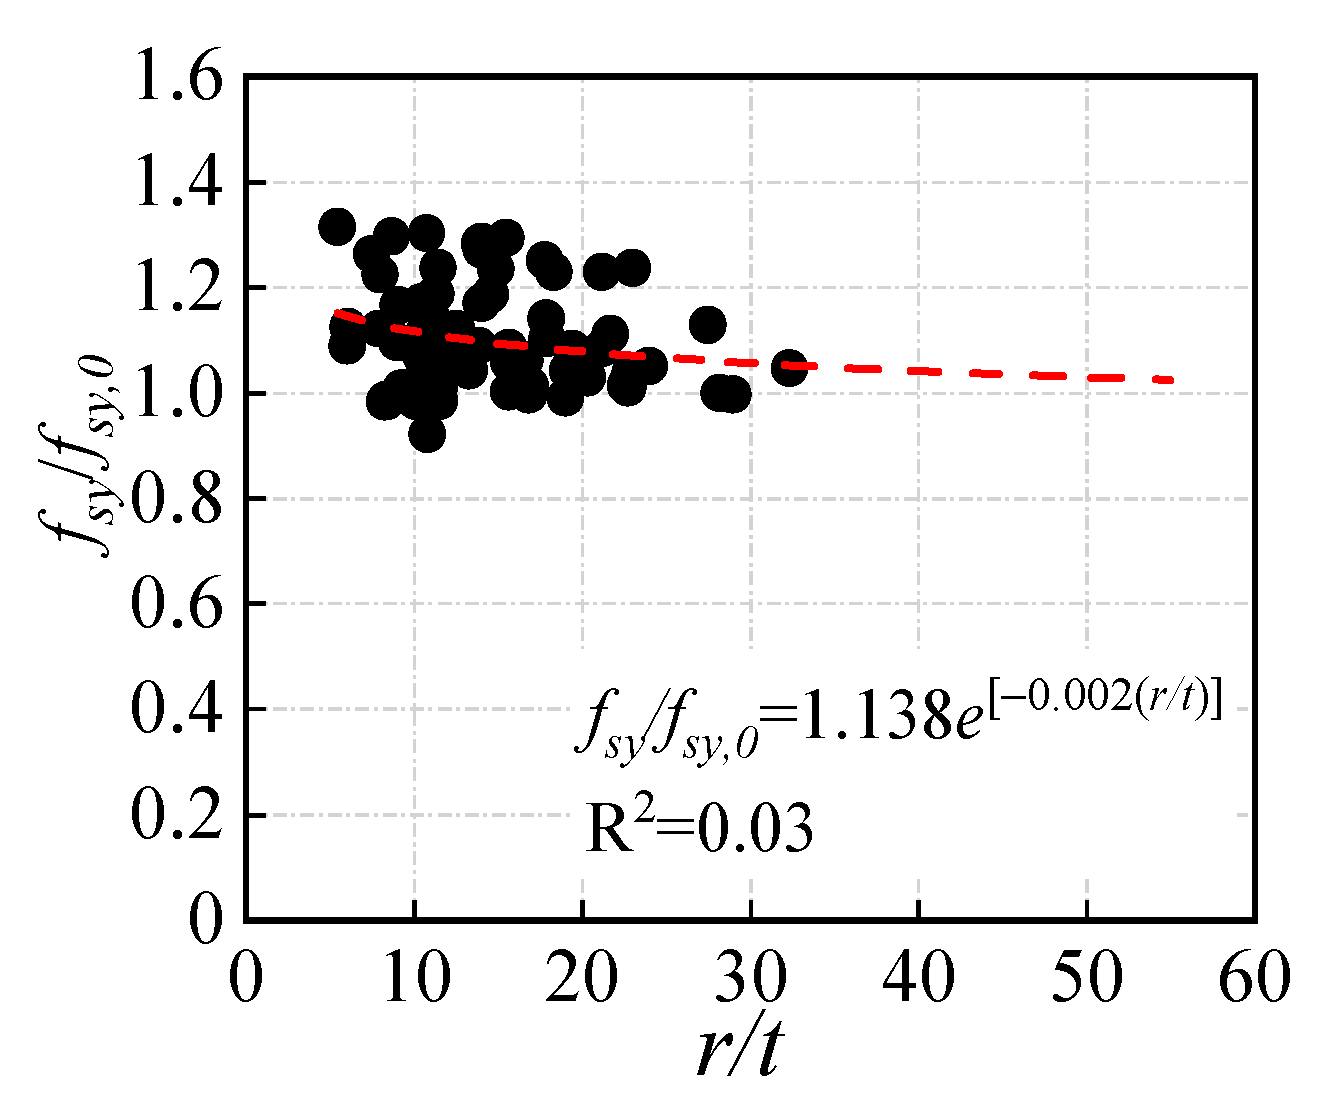
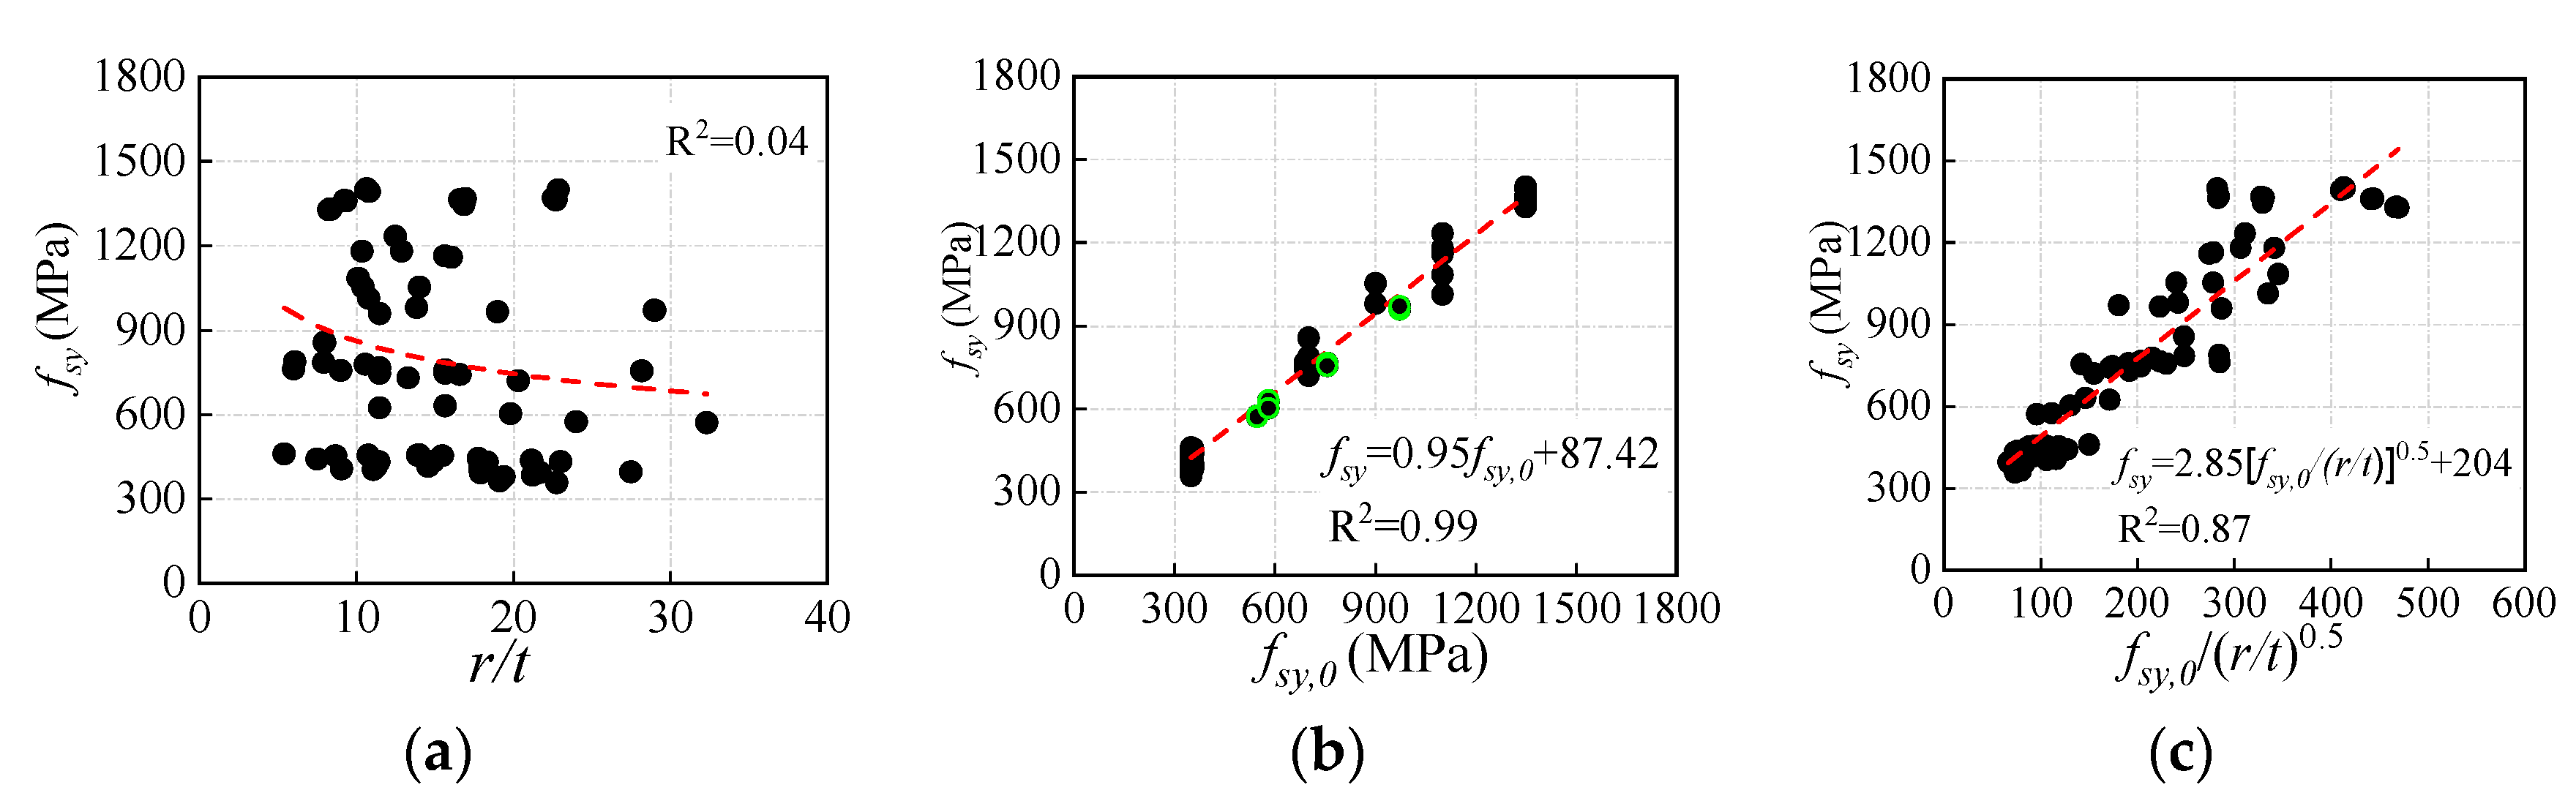
4.1. Yield Strength fsy of Cold-Formed CHSs

Based on the collected data of Table 1, Figure 4 presents the relationship between the measured yield strength fsy and the r/t ratio, and fsy has been normalized by the measured fsy,0. According to the trend line of the red dotted line shown in Figure 4, it can be found that the fsy/fsy,0 ratio decreases with the r/t ratio increasing, and the cold-rolling effect seems to disappear when the value of the r/t ratio reaches 60 based on the trend line of Figure 4.
The yield strength of the cold-formed CHS steels differs from that of the parent material. To examine the influence of the cold-rolling effect, a sensitivity analysis is conducted on the r/t ratio and the yield strengths fsy,0 and fsy. By comparing the relationship between fsy and three different physical quantities shown in Figure 5, it can be found that the independent r/t is different in establishing connections with fsy, while the compound parameter fsy,0/(r/t)0.5 exhibits a better correlation with fsy as the R2 reaches 0.87. The optimal group is the relationship between fsy,0 and fsy because the measured fsy has the strongest correlation with fsy,0, which can be expressed by a linear function.
The red trend line in Figure 5b shows that the relationship between fsy,0 and fsy exhibits a strong linear correlation. The difference between fsy and fsy,0 decreases and even disappears with the increase of fsy,0, and the results is also confirmed by previous research [11], the relevant experimental data of which is highlighted in green dots in Figure 5b. Furthermore, if setting the fsy/fsy,0 ratio to 1.0, it can be obtained that the value of fsy is 1748 MPa, and the value suggests that the influence of material strength on the cold-rolling effect has an upper limit. Based on the results shown above, a more physically meaningful way of determining fsy can be obtained, as shown in Equation (2). When fsy,0 exceeds 1748 MPa, the value of fsy can be considered consistent with fsy,0.
f s y 1748 = 0.95 f s y , 0 1748 + 0.05   ( f s y , 0     1748   MPa )

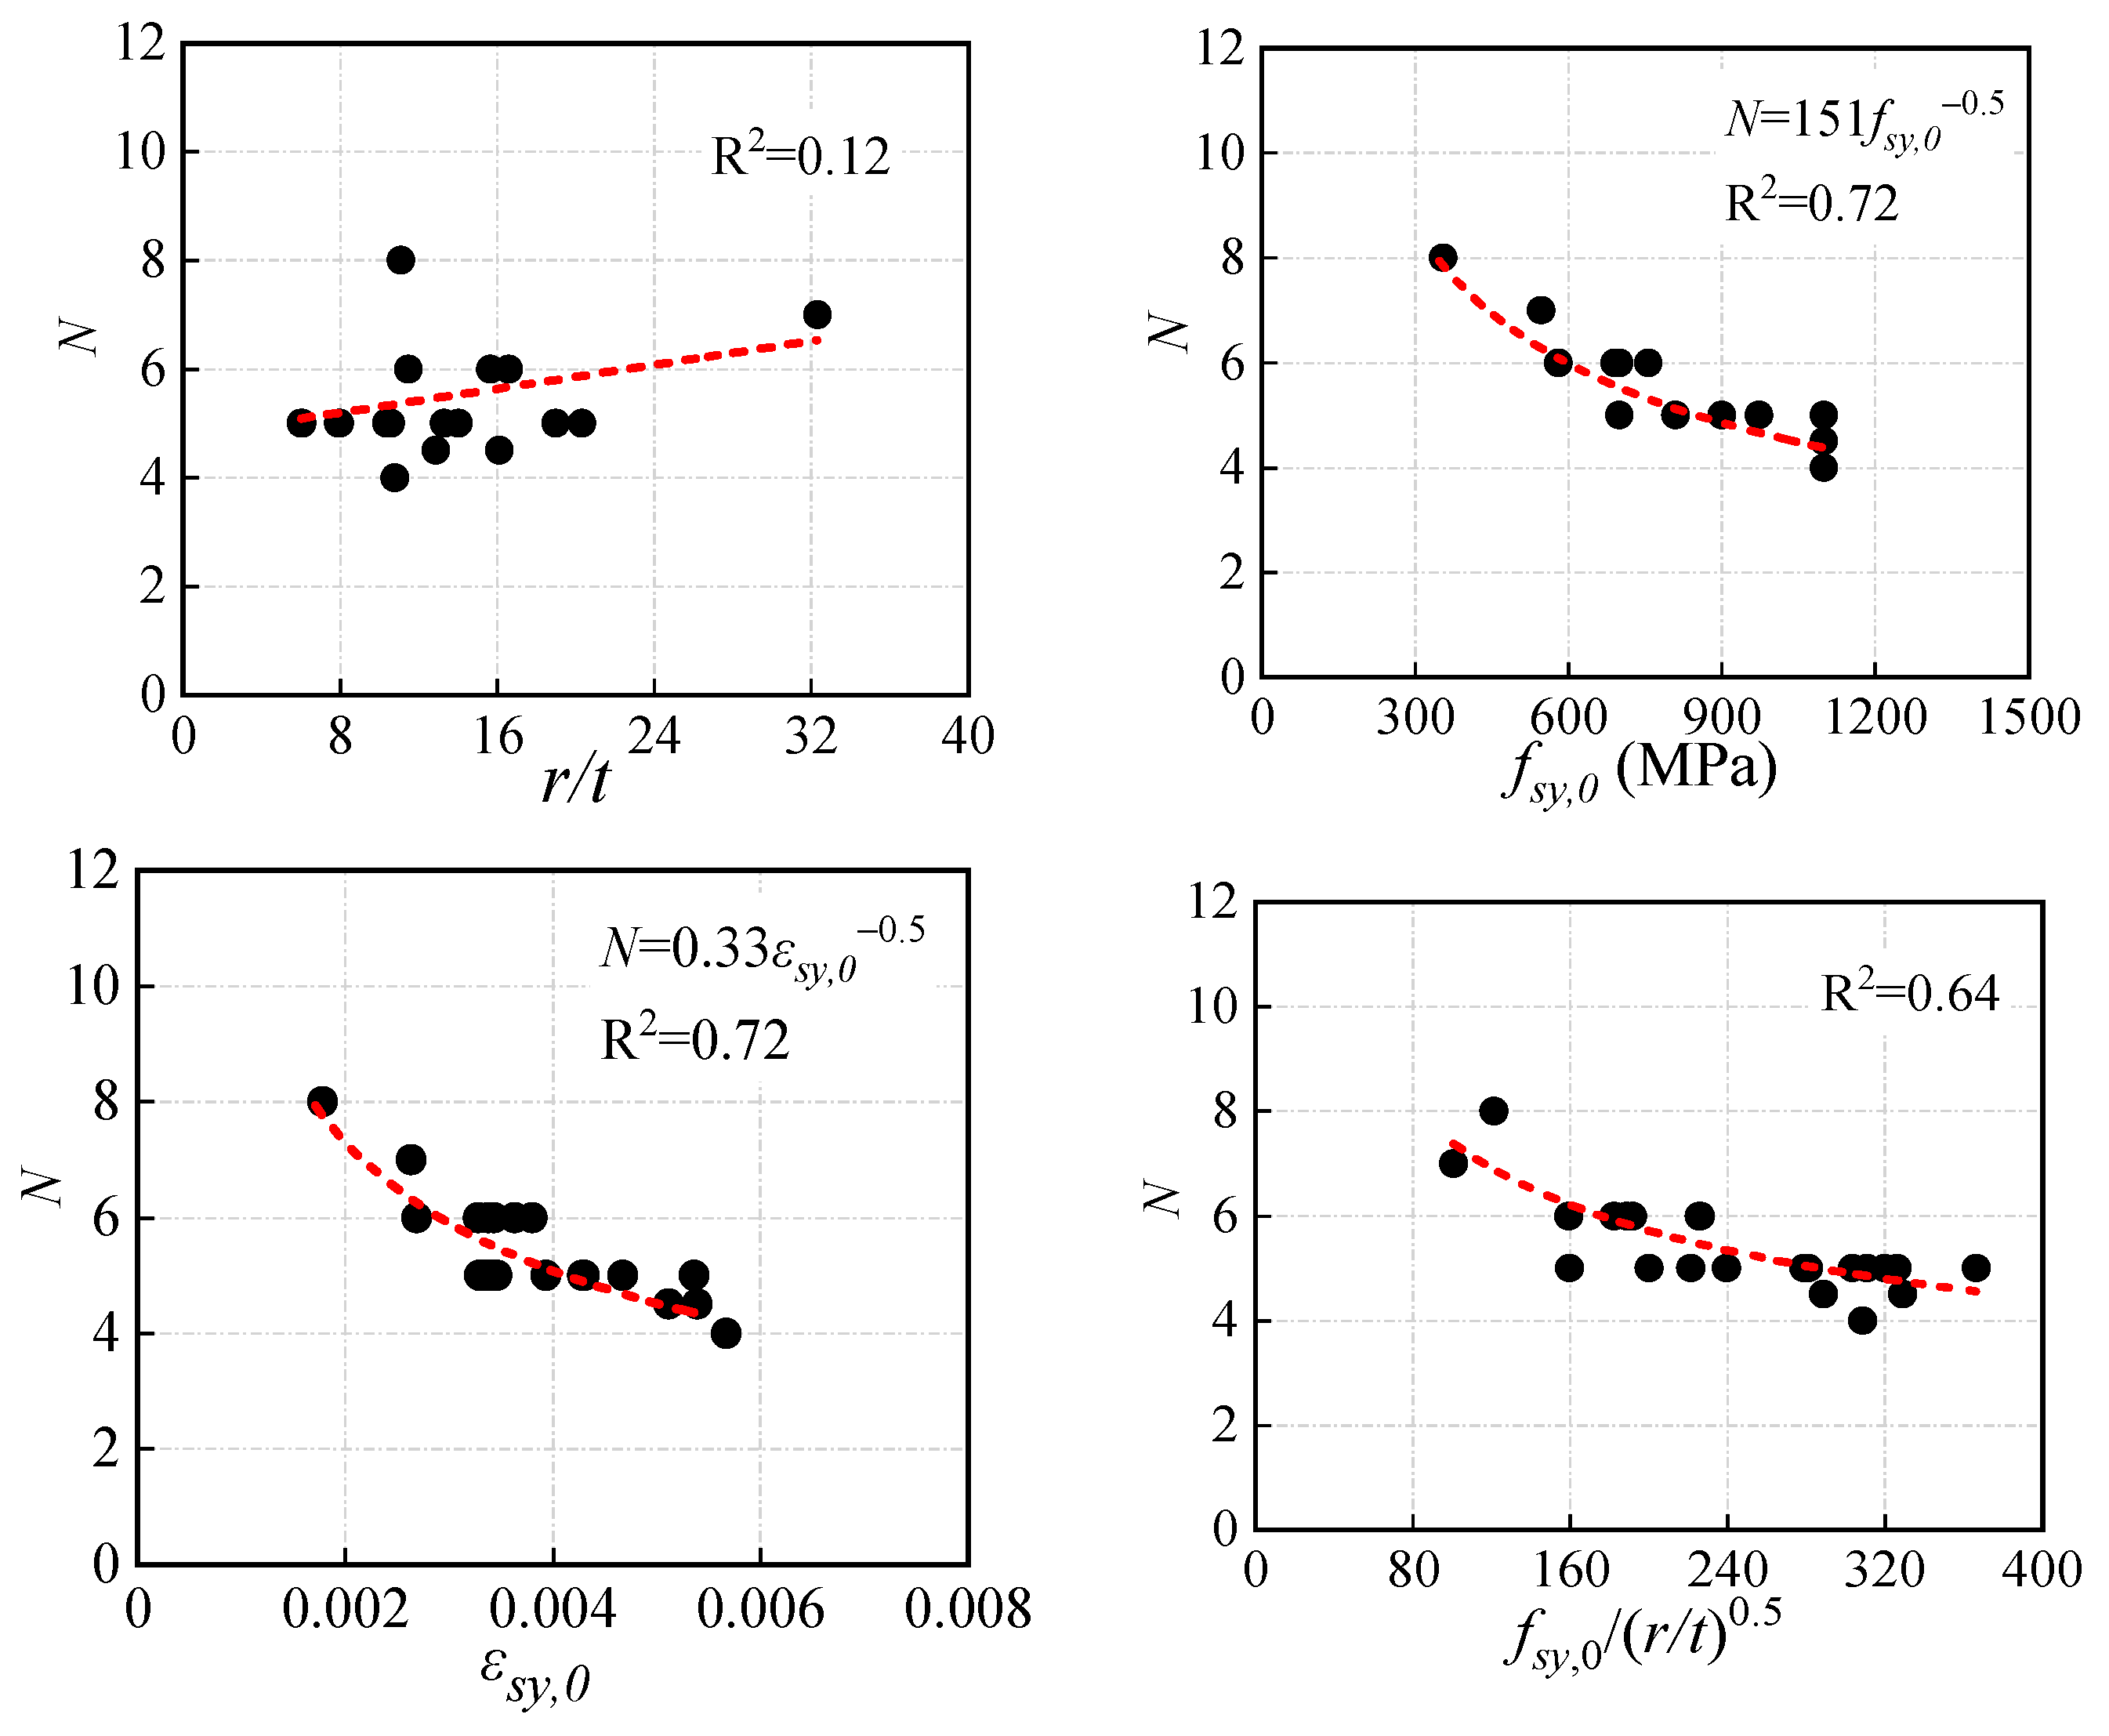
4.2. Curvature Coefficient N

The curvature coefficient N is the critical roundness variable at the yield stages of the stress-strain curve. In this section, the analytical curve is required to pass through the coordinate origin and the point (εsu, fsu) shown in Figure 1. The ideal value of N is evaluated based on two criteria: (1) the envelope area ratio of the calculated results Acal to the experimental results Aexp (corresponding to Figure 6a), and (2) the coincidence degree of the transition curvature in the elastic-plastic stage (corresponding to Figure 6b). Through debugging and analysis, as shown in Figure 6, the empirical values of N are almost in the range of 4 to 8.
The relationships between the curvature coefficient N and the main variables are shown in Figure 7. It is clear that the r/t ratio and the combined parameter fsy,0/(r/t)0.5 are not the primary factors affecting the curvature coefficient N, while fsy,0 and the corresponding strain εsy,0 have the same correlation coefficient relationship with N. Considering the influence of the elastic modulus Es of tensile coupons, εsy,0 is chosen to be the primary factor, and Equation (3) is proposed to calculate the curvature coefficient N.
N = 0.33 ε s y , 0 - 0.05 = 0.33 ( f s y , 0 / E s ) 0.5

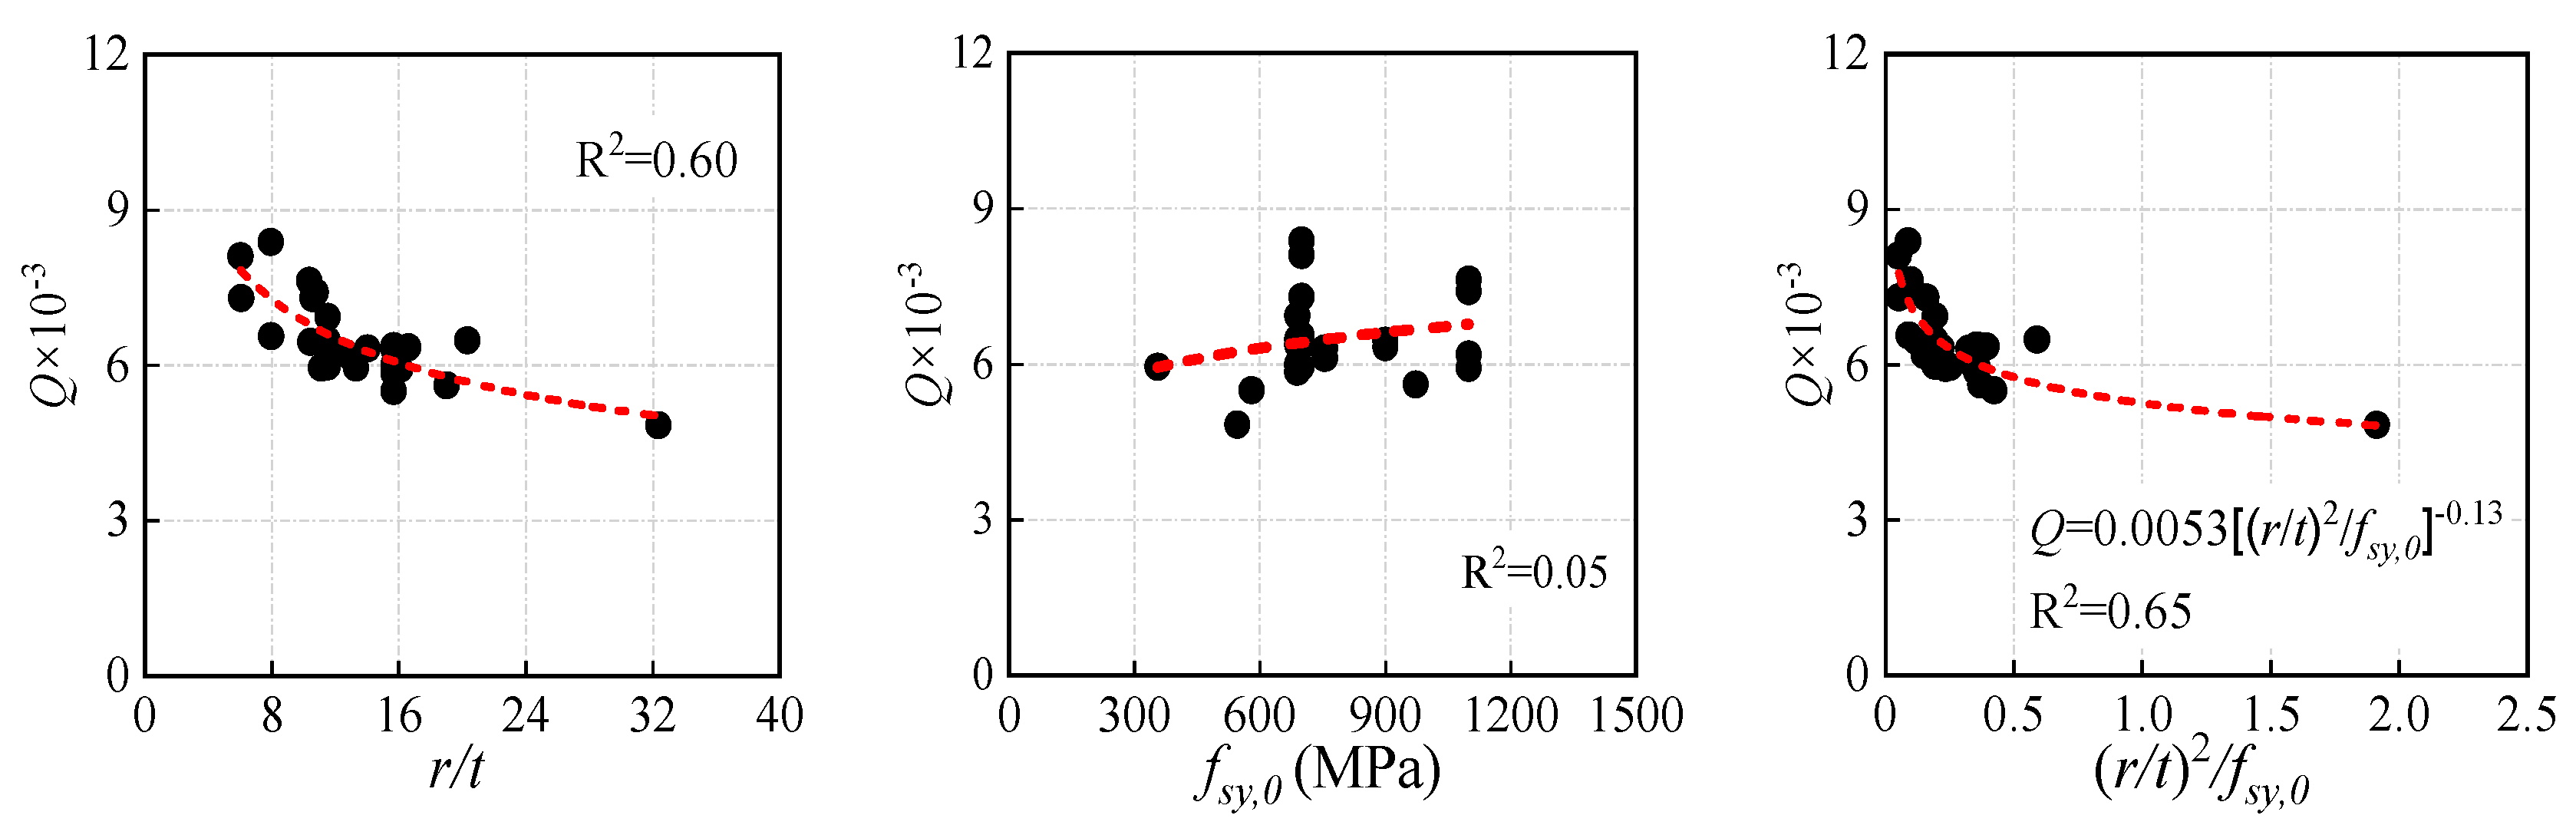
4.3. Strain-Hardening Exponent Q

The strain-hardening exponent Q characterizes the strain-hardening behavior of the strengthening segment. The value of Q can be determined by defining two points (εsy, fsy) and (εsu, fsu), as shown in Figure 1. To identify the critical factor for Q, the relationships between the measured Q and the main variables are shown in Figure 8. It can be concluded that the correlation coefficient R2 between the combination parameter (r/t)2/fsy,0 and Q is 0.65, which is higher than that of the other variables. Therefore, the strain-hardening coefficient Q can be calculated using Equation (4).
Q = 0.0053 [ ( r / t ) 2 / f s y , 0 ] - 0.13

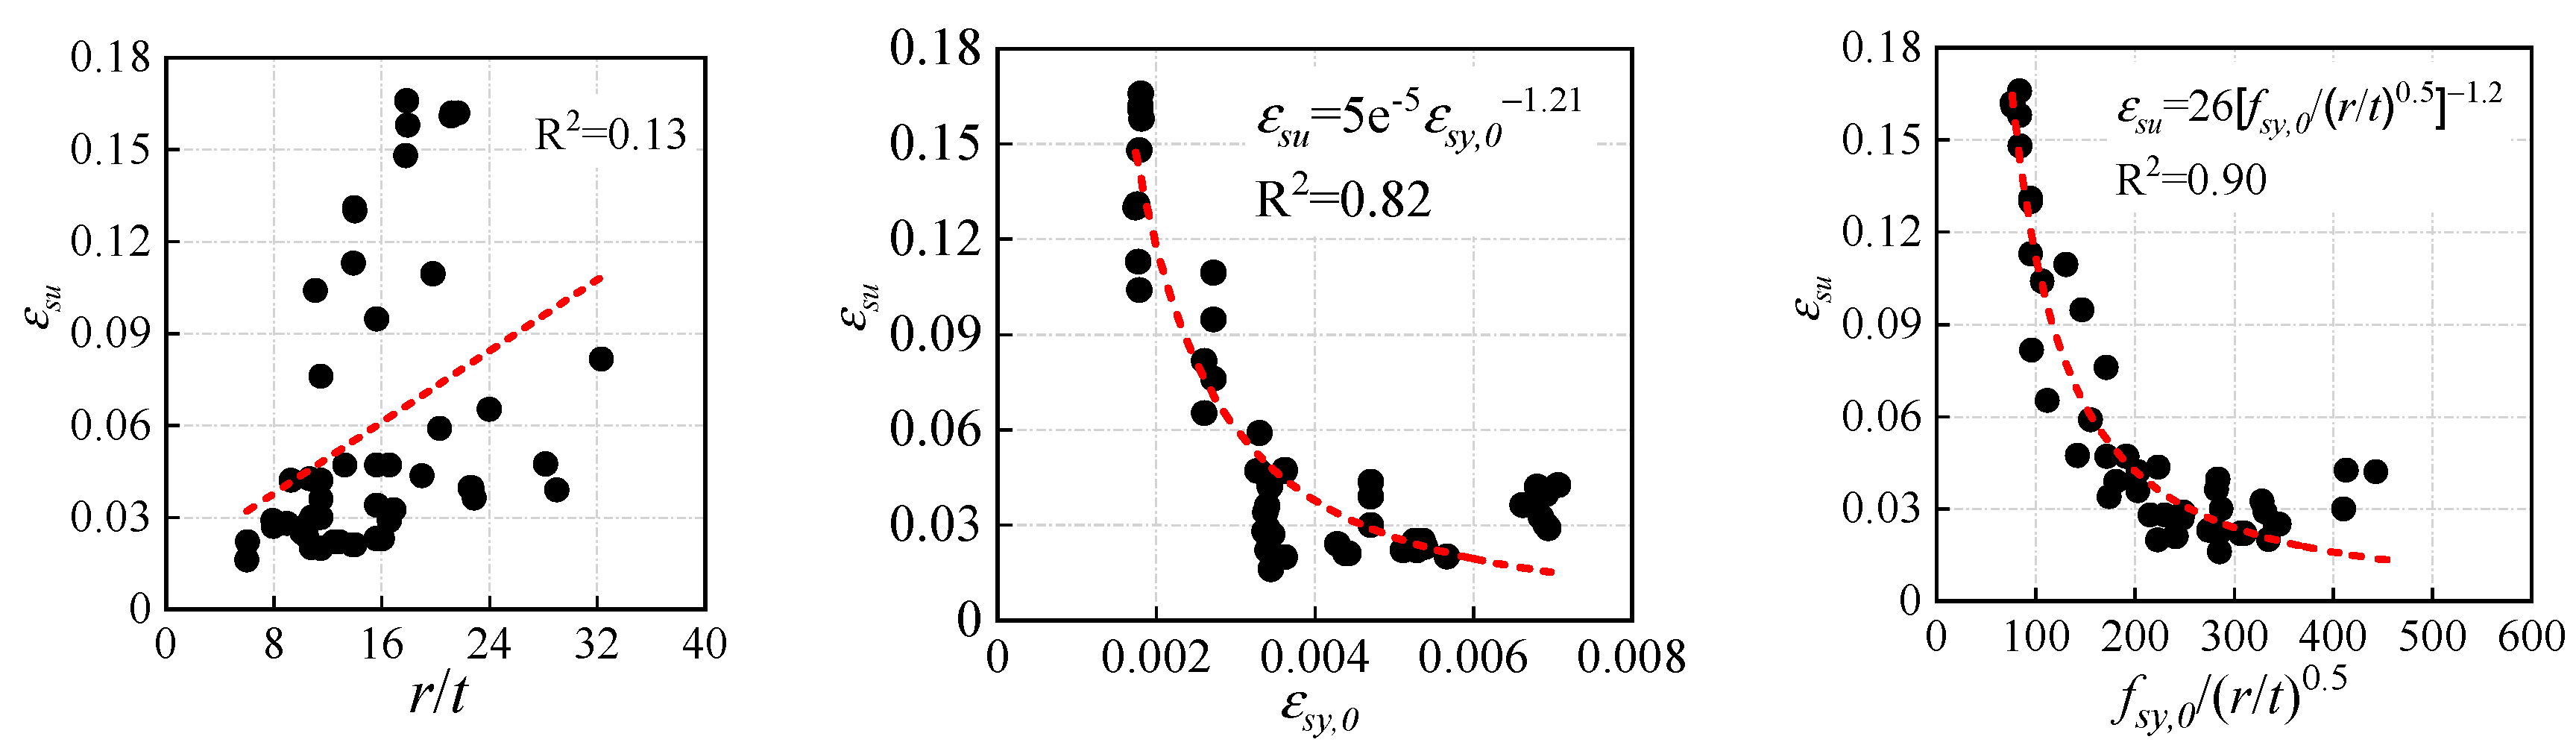
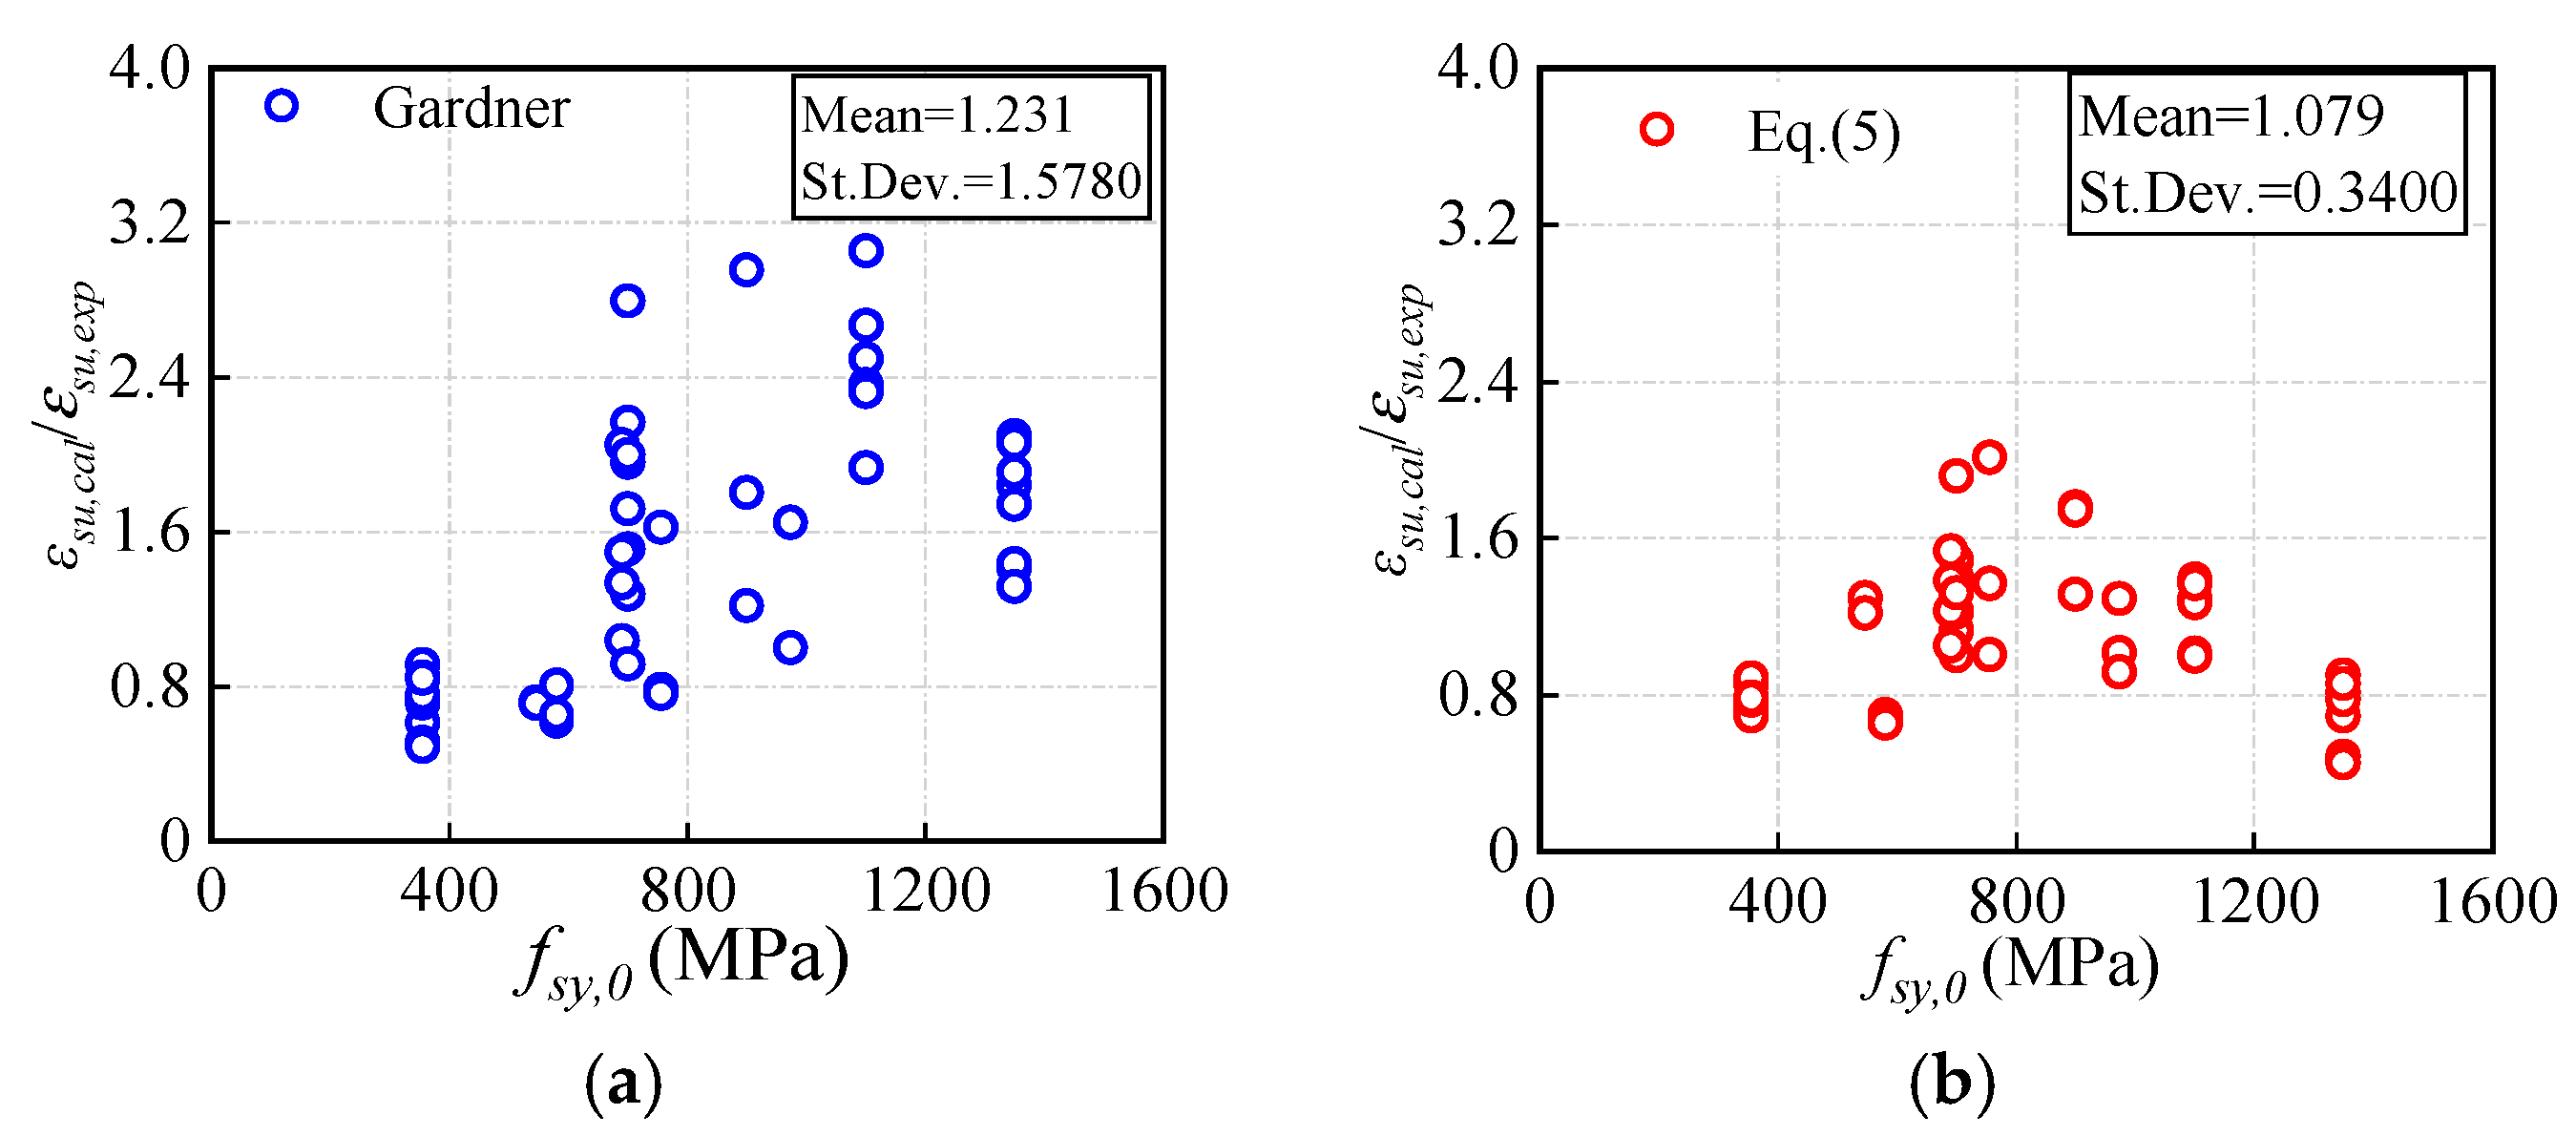
4.4. Ultimate Strain εsu

The relationships between the ultimate strain εsu and the main variables are shown in Figure 9. There is no obvious relationship between the measured ultimate strain εsu,cal, and the r/t ratio. The correlation coefficient between εsu and the εsy,0 is 0.82. It can be observed that the ultimate strain εsu shows a stronger correlation with the combined parameter fsy,0/(r/t)0.5 compared with εsy,0, whose correlation coefficient is 0.9.
To summarize, the ultimate strain εsu can be calculated by the following formula:
ε s u = 26 [ f s y , 0 / ( r / t ) 0.5 ] - 1.2

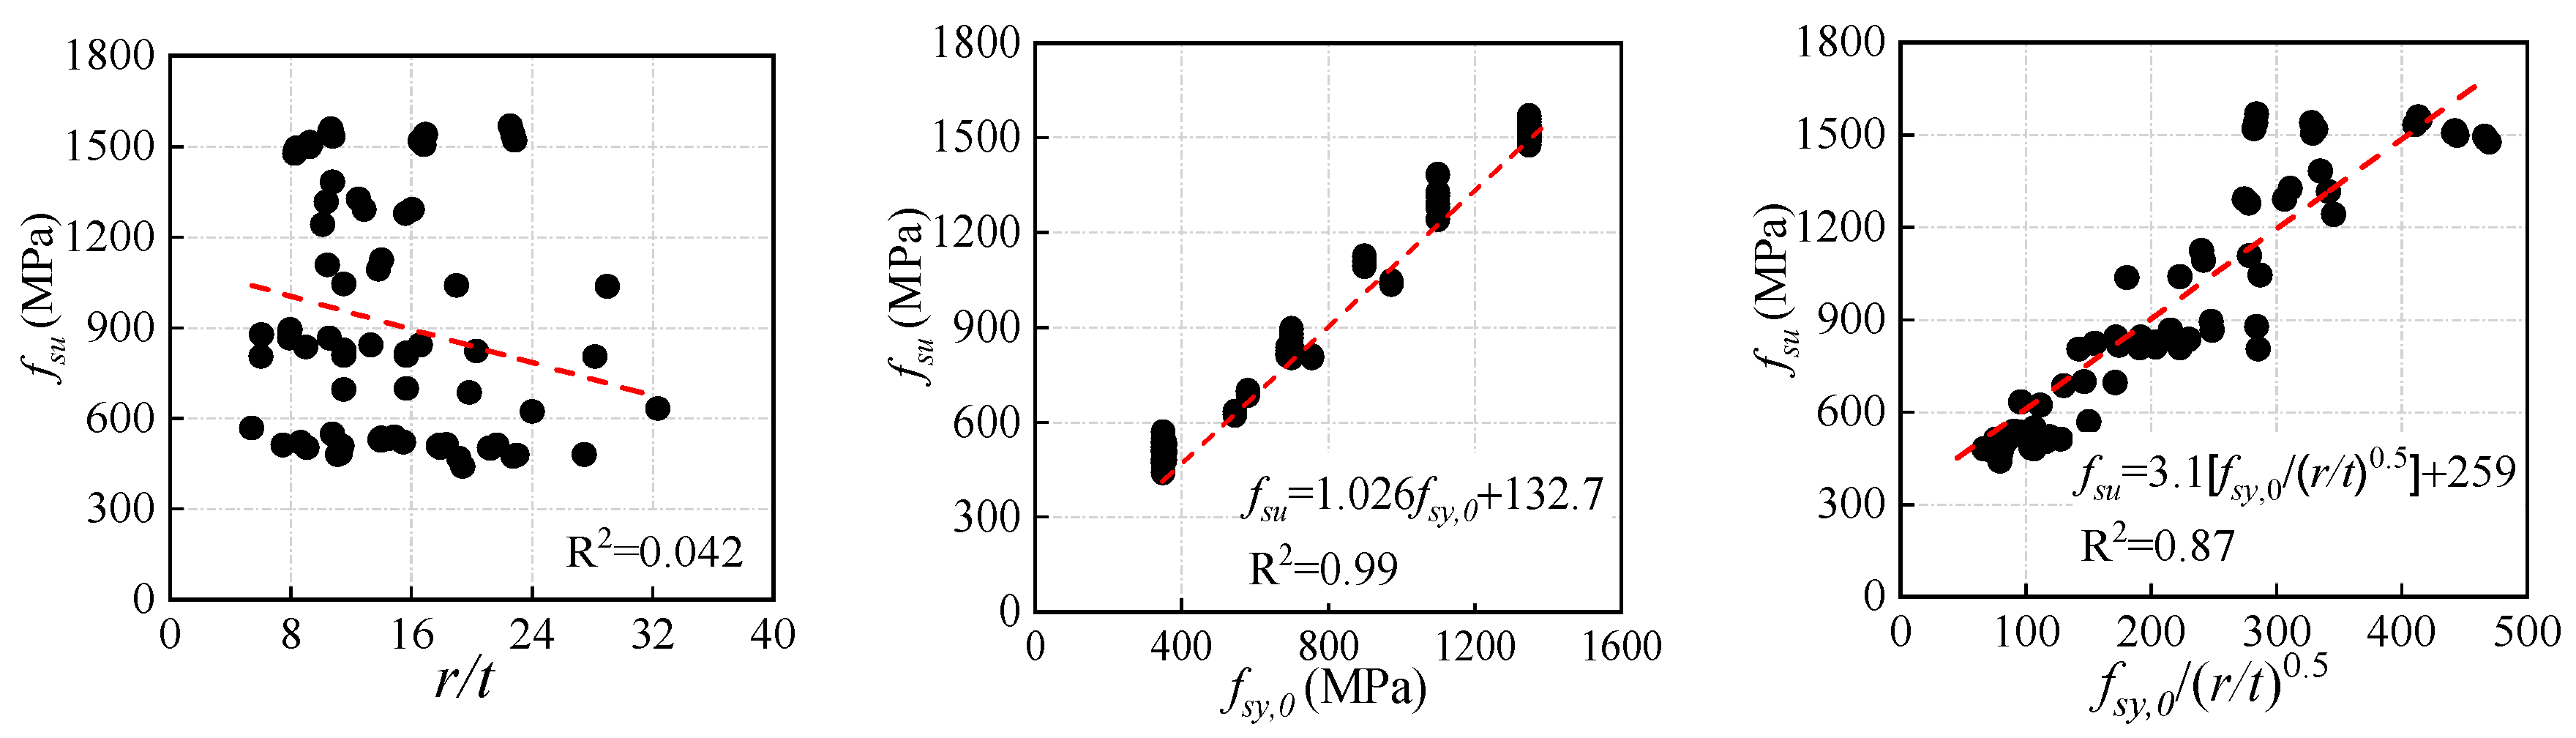
4.5. Ultimate Strength fsu

Figure 10 shows the relationship between ultimate tensile strength fsu and three main factors. There is no obvious relationship between the r/t ratio and fsu. The correlation coefficient between fsu and the combined parameter is 0.87, while the strongest correlation can be observed between fsy,0 and fsu with a correlation coefficient as high as 0.99, which implies an extremely strong linear correlation.
By comparing the relationship between fsu and three different physical quantities shown in Figure 10, it can be found that the optimal group is the linear relationship between fsy,0, and fsu. This indicates that there is a significant correlation between the yield strength of the parent steels and fsy compared with other factors, and the following equation is derived to calculate the ultimate tensile strength:
f s u = 1.026 f s y , 0 + 1 32.7

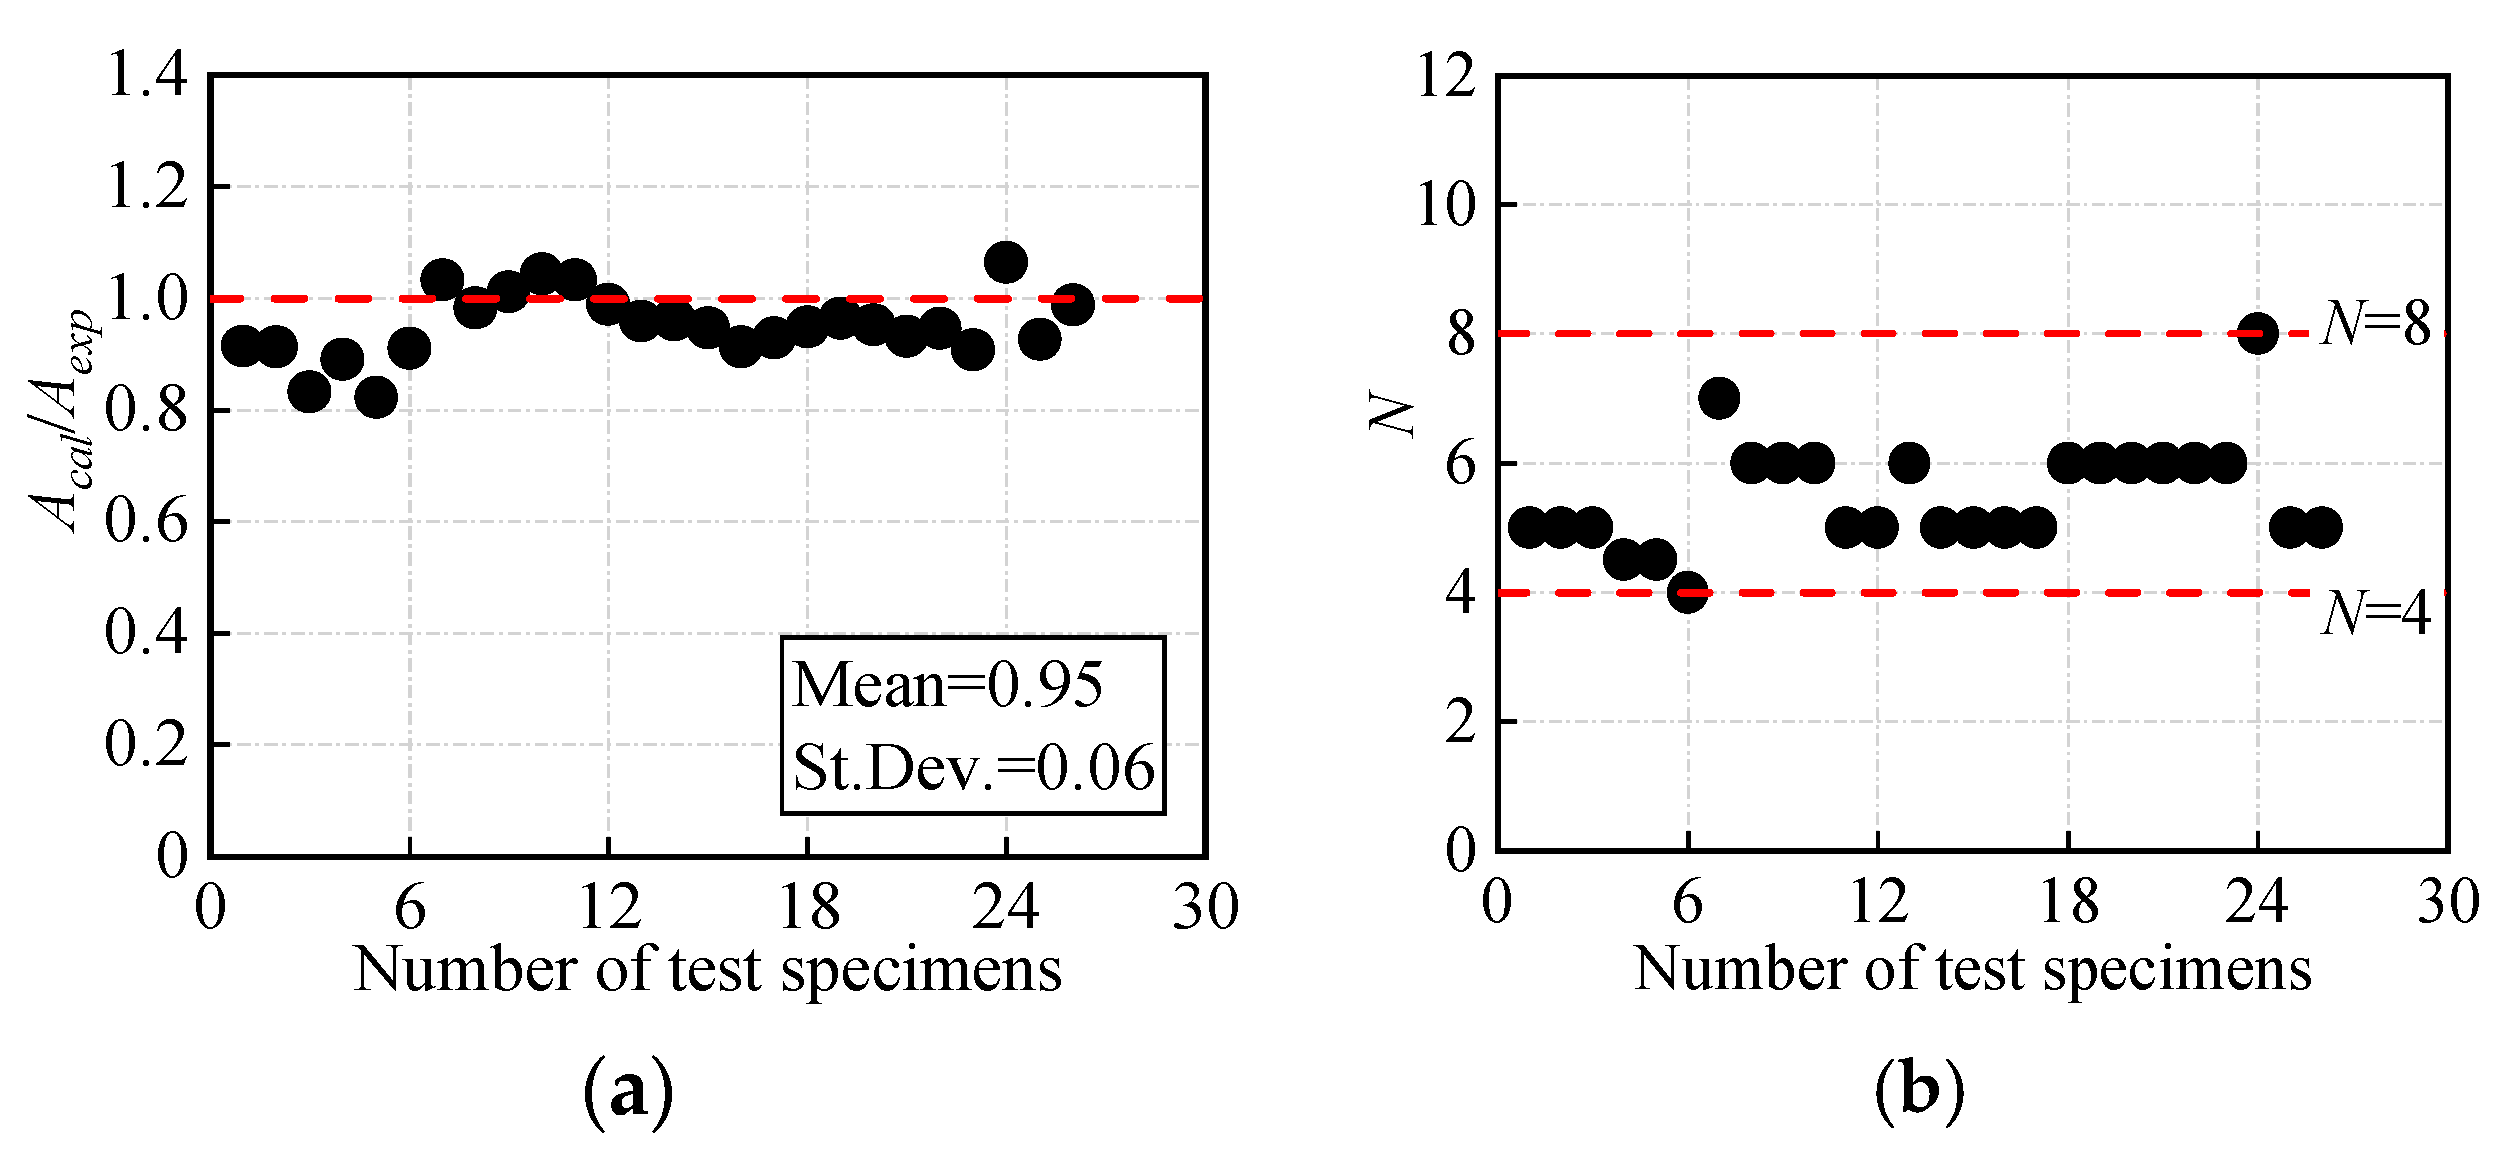
5. Verification of the Proposed Model

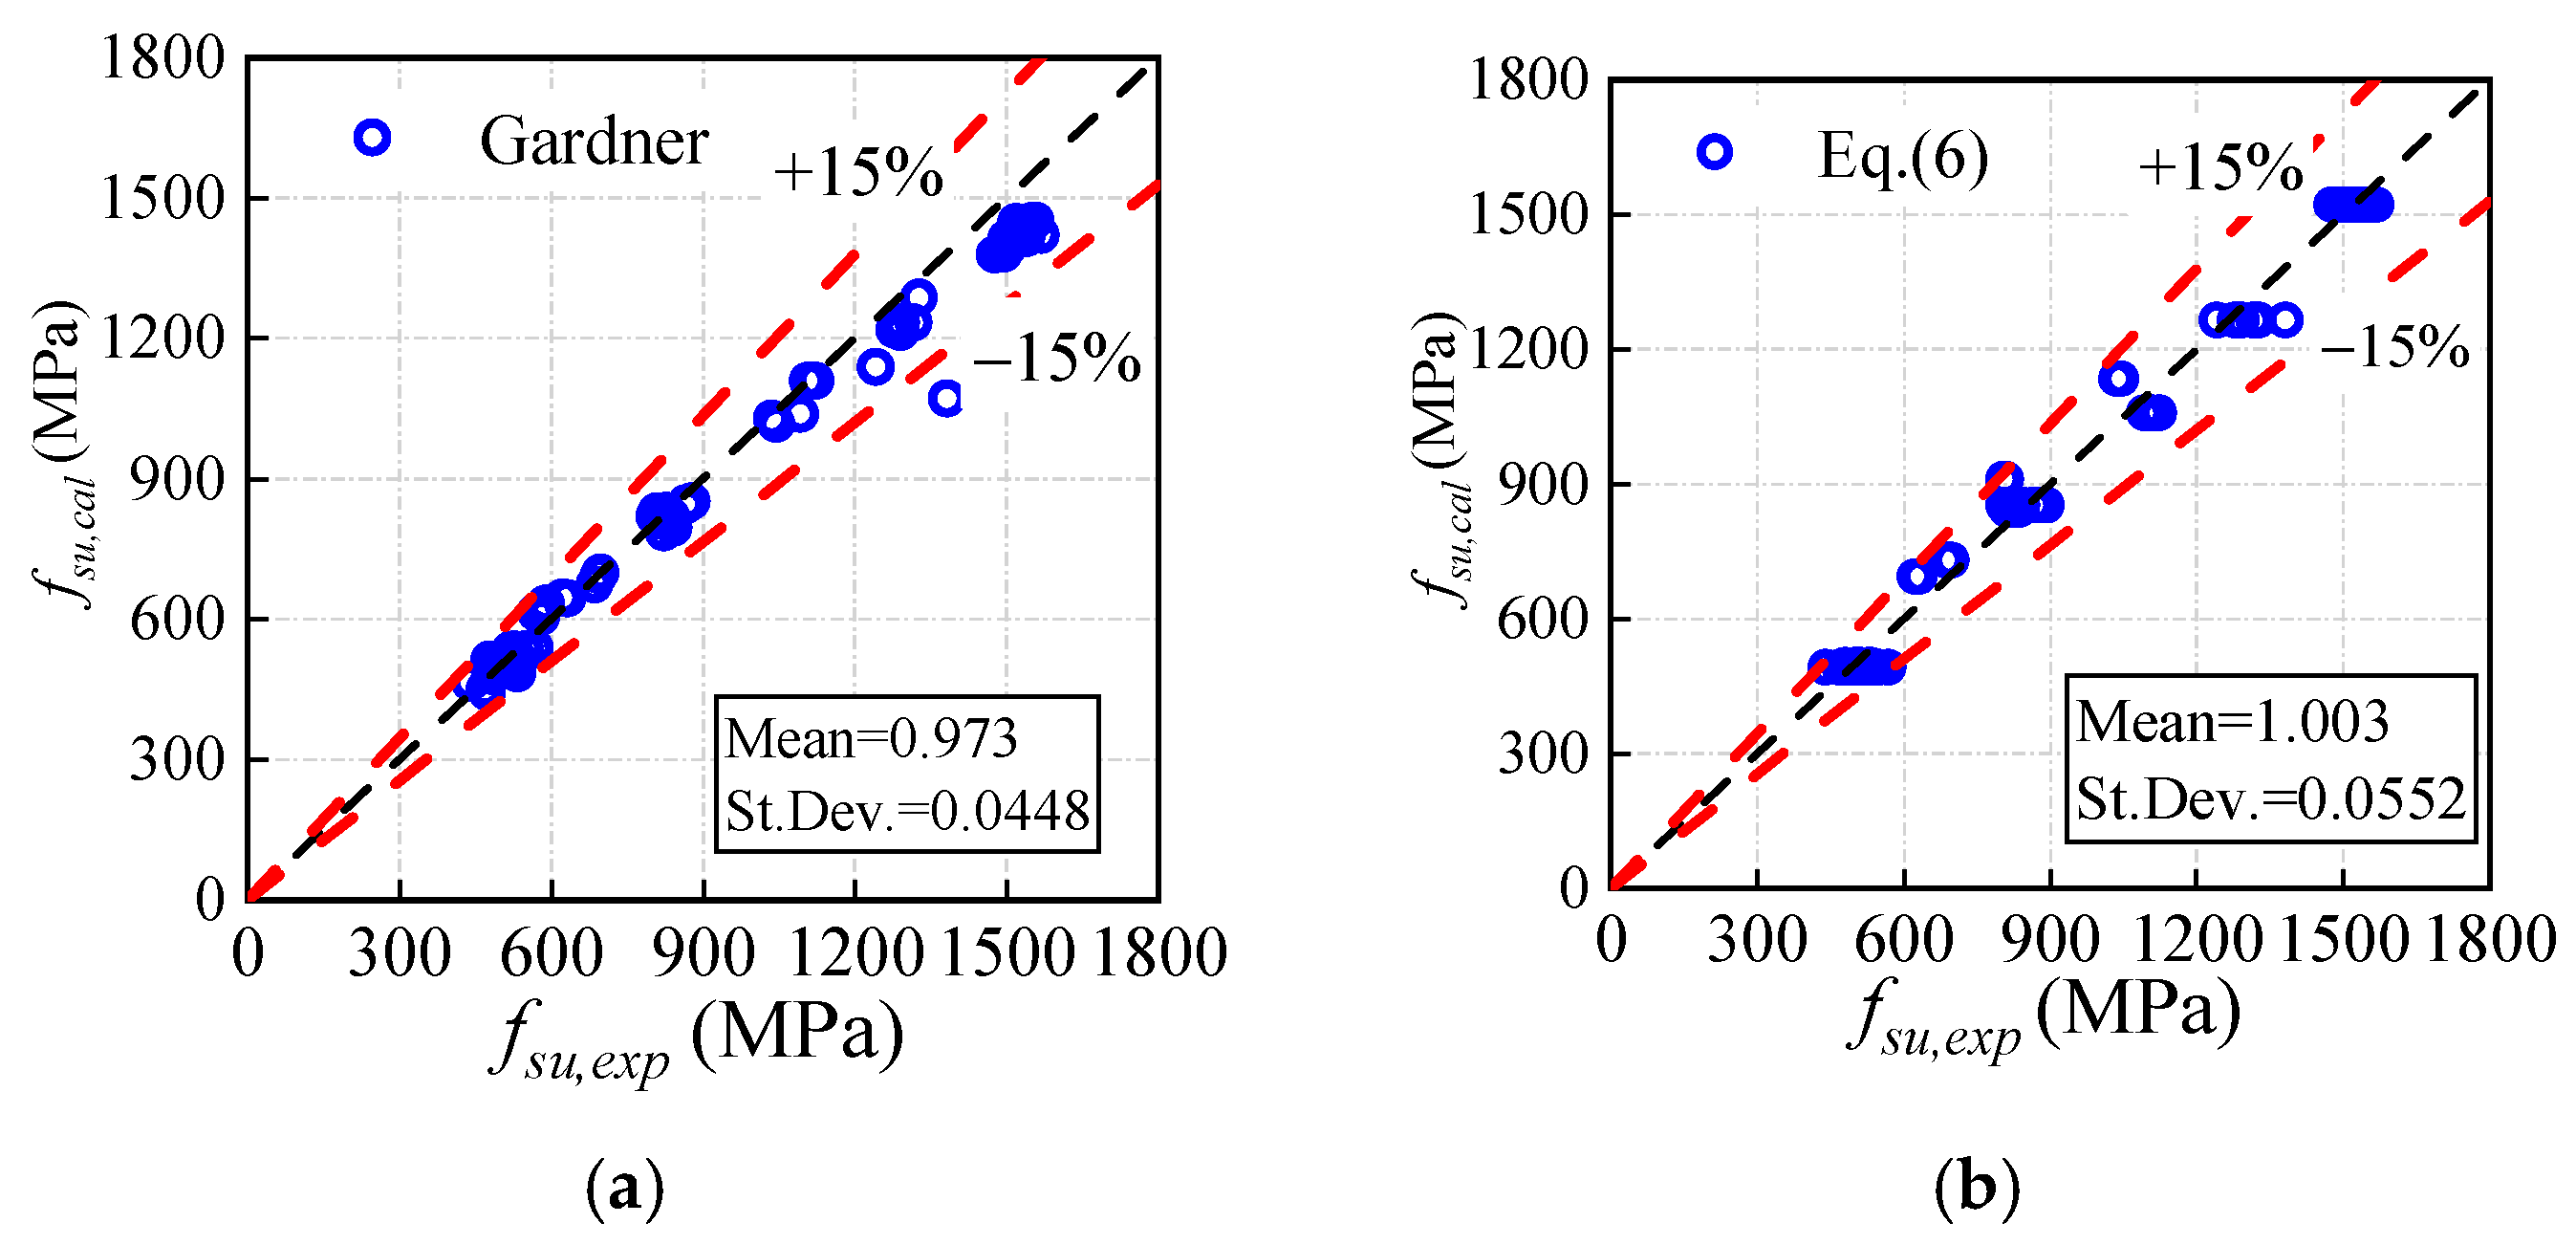
5.1. Comparison of the Calculated Results and Measured Results

Comparisons between the experimental and calculated results are conducted, including ultimate tensile strength fsu, ultimate strain εsu, and uniaxial tensile stress-strain curves of cold-formed steels. Firstly, the experimental ultimate strain of 54 groups of specimens is compared with the calculated results εsu,cal based on both Equation (5) and the method by Gardner [17]. As shown in Figure 11, the proposed method by Equation (5) can better predict the actual results by Gardner than the method proposed by Gardner (the corresponding equations can be found in Appendix A), because its mean εsu,cal/εsu,exp of 1.079 and moderate standard deviation of 0.3400 are both smaller than the other.
Secondly, the comparison between the experimental ultimate tensile strength fsu,exp (from 74 test groups) and the calculated results fsu,cal (obtained using Equation (6)) is conducted, as illustrated in Figure 12. The predictive expression of ultimate strength fsu proposed by Gardner is also plotted in the figure. Both expressions proposed demonstrate relatively high accuracy in predicting the ultimate tensile strength with errors of approximately 15%, while Equation (6) proposed by the authors is better suited for high-strength steels.
It is crucial to elucidate the difference between the stress-strain relationship prediction models. In order to evaluate the overall accuracy of the proposed model, a comparison is made between the measured stress-strain curves of tensile coupons and the corresponding calculated ones. Similarly, as a representative of existing models, the improved Ramberg-Osgood model proposed by Gardner is still being compared. Table 2 lists the main variables of the chosen specimens. As shown in Figure 13, both of the predictive models for cold-formed CHS steels have good consistency. Concretely, when fsy,0 is within 600 MPa, as shown in Figure 13a,b, the proposed model based on the Megenetto-Pinto model is almost better than the one based on the Ramberg-Osgood model. With the value of fsy,0 increasing, as shown in Figure 13c, the two models are seen to have consistent accuracy. However, it should be noted that the improved Megenetto-Pinto model proposed in the paper is directly based on the most basic design parameters, including fsy,0 and t of the parent steels and internal bending radius r, while the model proposed by Gardner needs to know the yield strength of cold-formed steel.

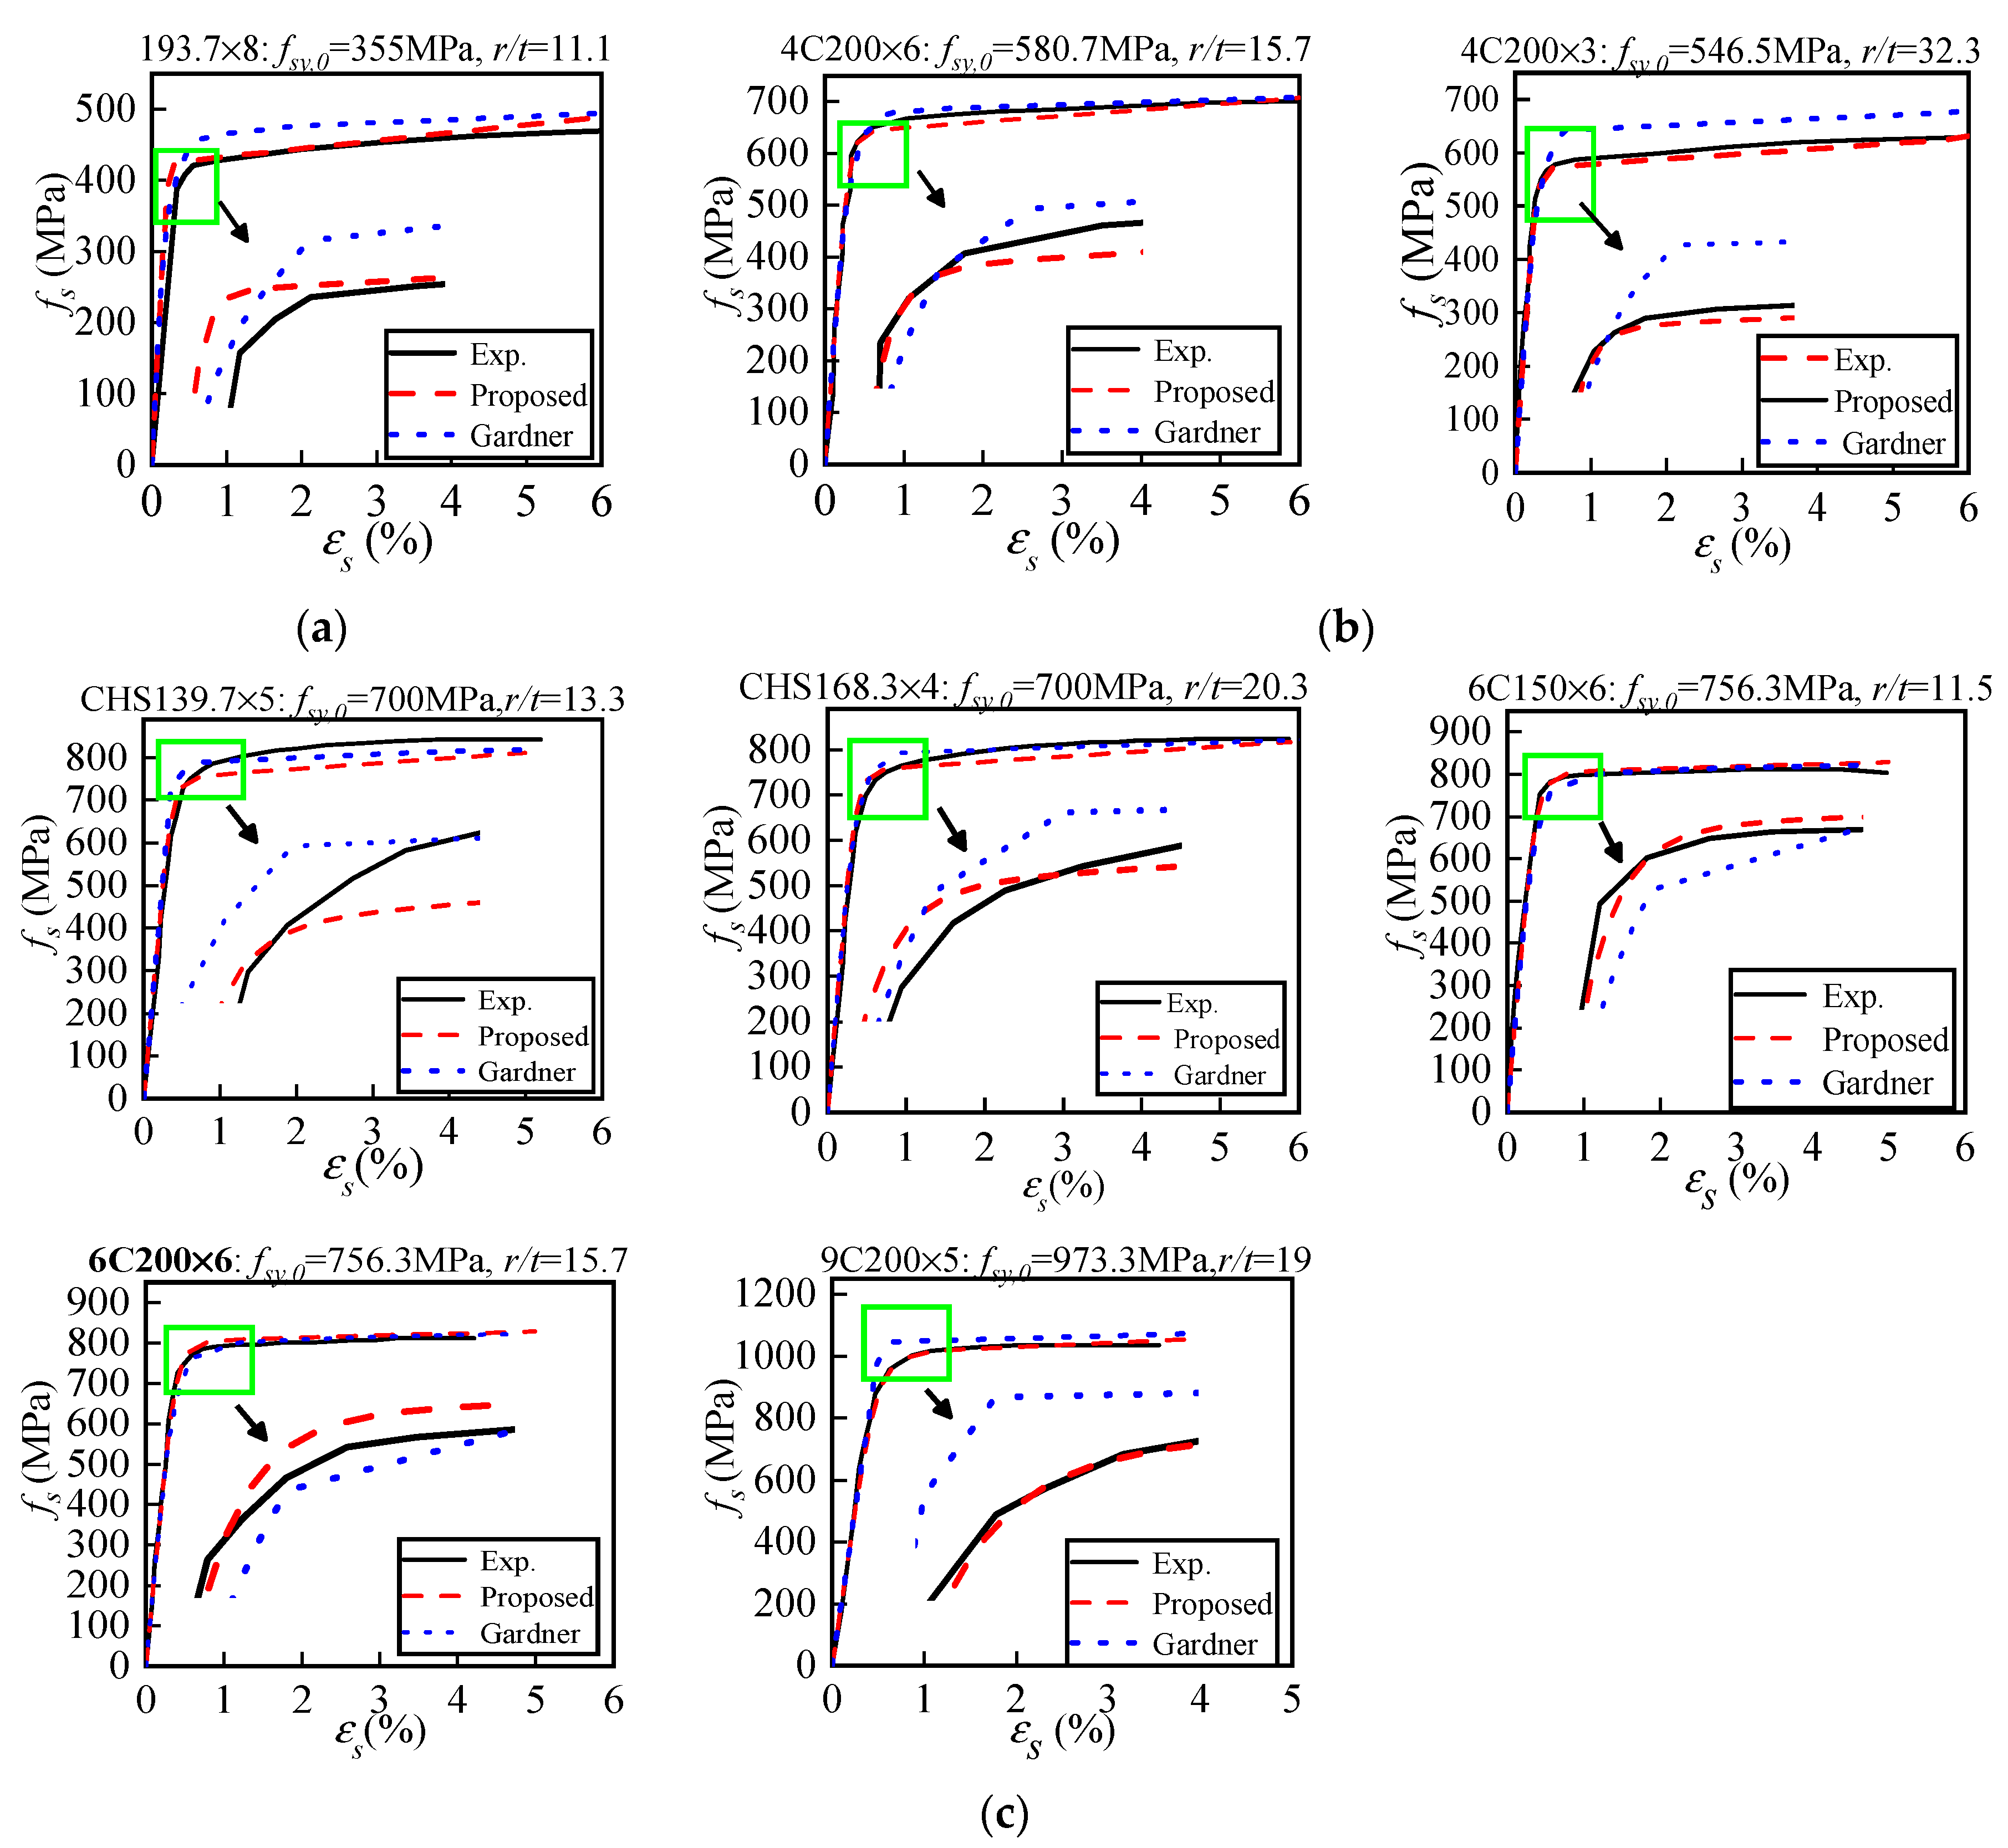
5.2. Case Application Analysis

Choosing the cold-formed CHS steel stub columns under axial load as simulated subjects, a comparison of energy absorption, which is gained from the load-bearing curves, are carried out based on 0material constitutive models of the ideal elastoplastic model and the modified model, respectively. The energy absorption can be obtained by Equation (7). The higher the value, the stronger the ability of the component to resist deformation will become.
E = 0 D F ( s ) d s
where E represents the energy absorbed by the component through the entire ascending stage; F(s) is the load; and D is the displacement corresponding to the load.
Table 3 shows the main variables of the numerical examples, in which the thickness t is 3 mm, the r/t ratio varies from 10 to 60, and the range of fsy,0 is 235 MPa to 1900 MPa. Figure 14 shows the ultimate energy absorption of the total numerical examples. It can be seen that the energy absorption is often underestimated for the specimens without considering the cold-rolling effect. For the example specimens with fsy,0 of 235 MPa shown in Figure 14a, the energy absorption capacity obtained by using the proposed model is twice that of using the ideal elastoplastic model. However, the difference in the energy absorption capacity caused by the two models decreases with fsy,0 increasing. When the value of fsy,0 is 960 MPa and the r/t ratio is about 60, the cold-rolling effect has little influence on the energy absorption. As fsy,0 reaches 1800 MPa, the influence of material models seems to disappear regardless of the value of r/t.
Overall, the consistency between the calculated results and measured results shows that the proposed model can be used as a digital platform for intelligent construction. In addition, compared with the ideal elastoplastic model, the proposed model established in this paper has more distinct material properties and can more accurately evaluate the ultimate bearing capacity and corresponding deformation of the components to achieve energy saving, which is beneficial to the sustainable development of prefabricated steel buildings.

6. Conclusions

In order to provide a unified and efficient material constitutive model for the digital intelligent design, a continuously derivable function based on the Menegotto-Pinto model is proposed to describe a complete uniaxial tensile stress-strain relationship for cold-formed circular mild steel. The key physical quantities and auxiliary parameters of the proposed model can be calibrated once the r/t ratio of CHSs, thickness t and yield strength fsy,0 of parent steels are determined.
To verify the validity and accuracy of the proposed model, 74 sets of experimental data on mild steel have been collected. Through comparisons between the measured results and the calculated ones, the following conclusions can be drawn:
(1)
The proposed model can predict the complete uniaxial tensile stress-strain behavior of cold-formed circular steels with high accuracy. Considering the wide varying range of the collected experimental variables such as fsy,0 (400~1400 MPa), and r/t (5.4~32.3), the good agreement observed between the predictive and measured stress-strain curves indicates that the improved Menegotto-Pinto model proposed in this paper has a wide application scope.
(2)
The ultimate tensile strain εsu of cold-formed circular steels can be predicted by Equation (5) with more improved accuracy than the model proposed by Gardner, due to the comprehensive consideration of the influence of fsy,0 and r/t.
(3)
The cold-rolling effect that causes strength enhancement will weaken with fsy,0 and r/t increasing and seems to be neglected when fsy,0 reaches 1748 MPa or the r/t ratio is approximately 60.
(4)
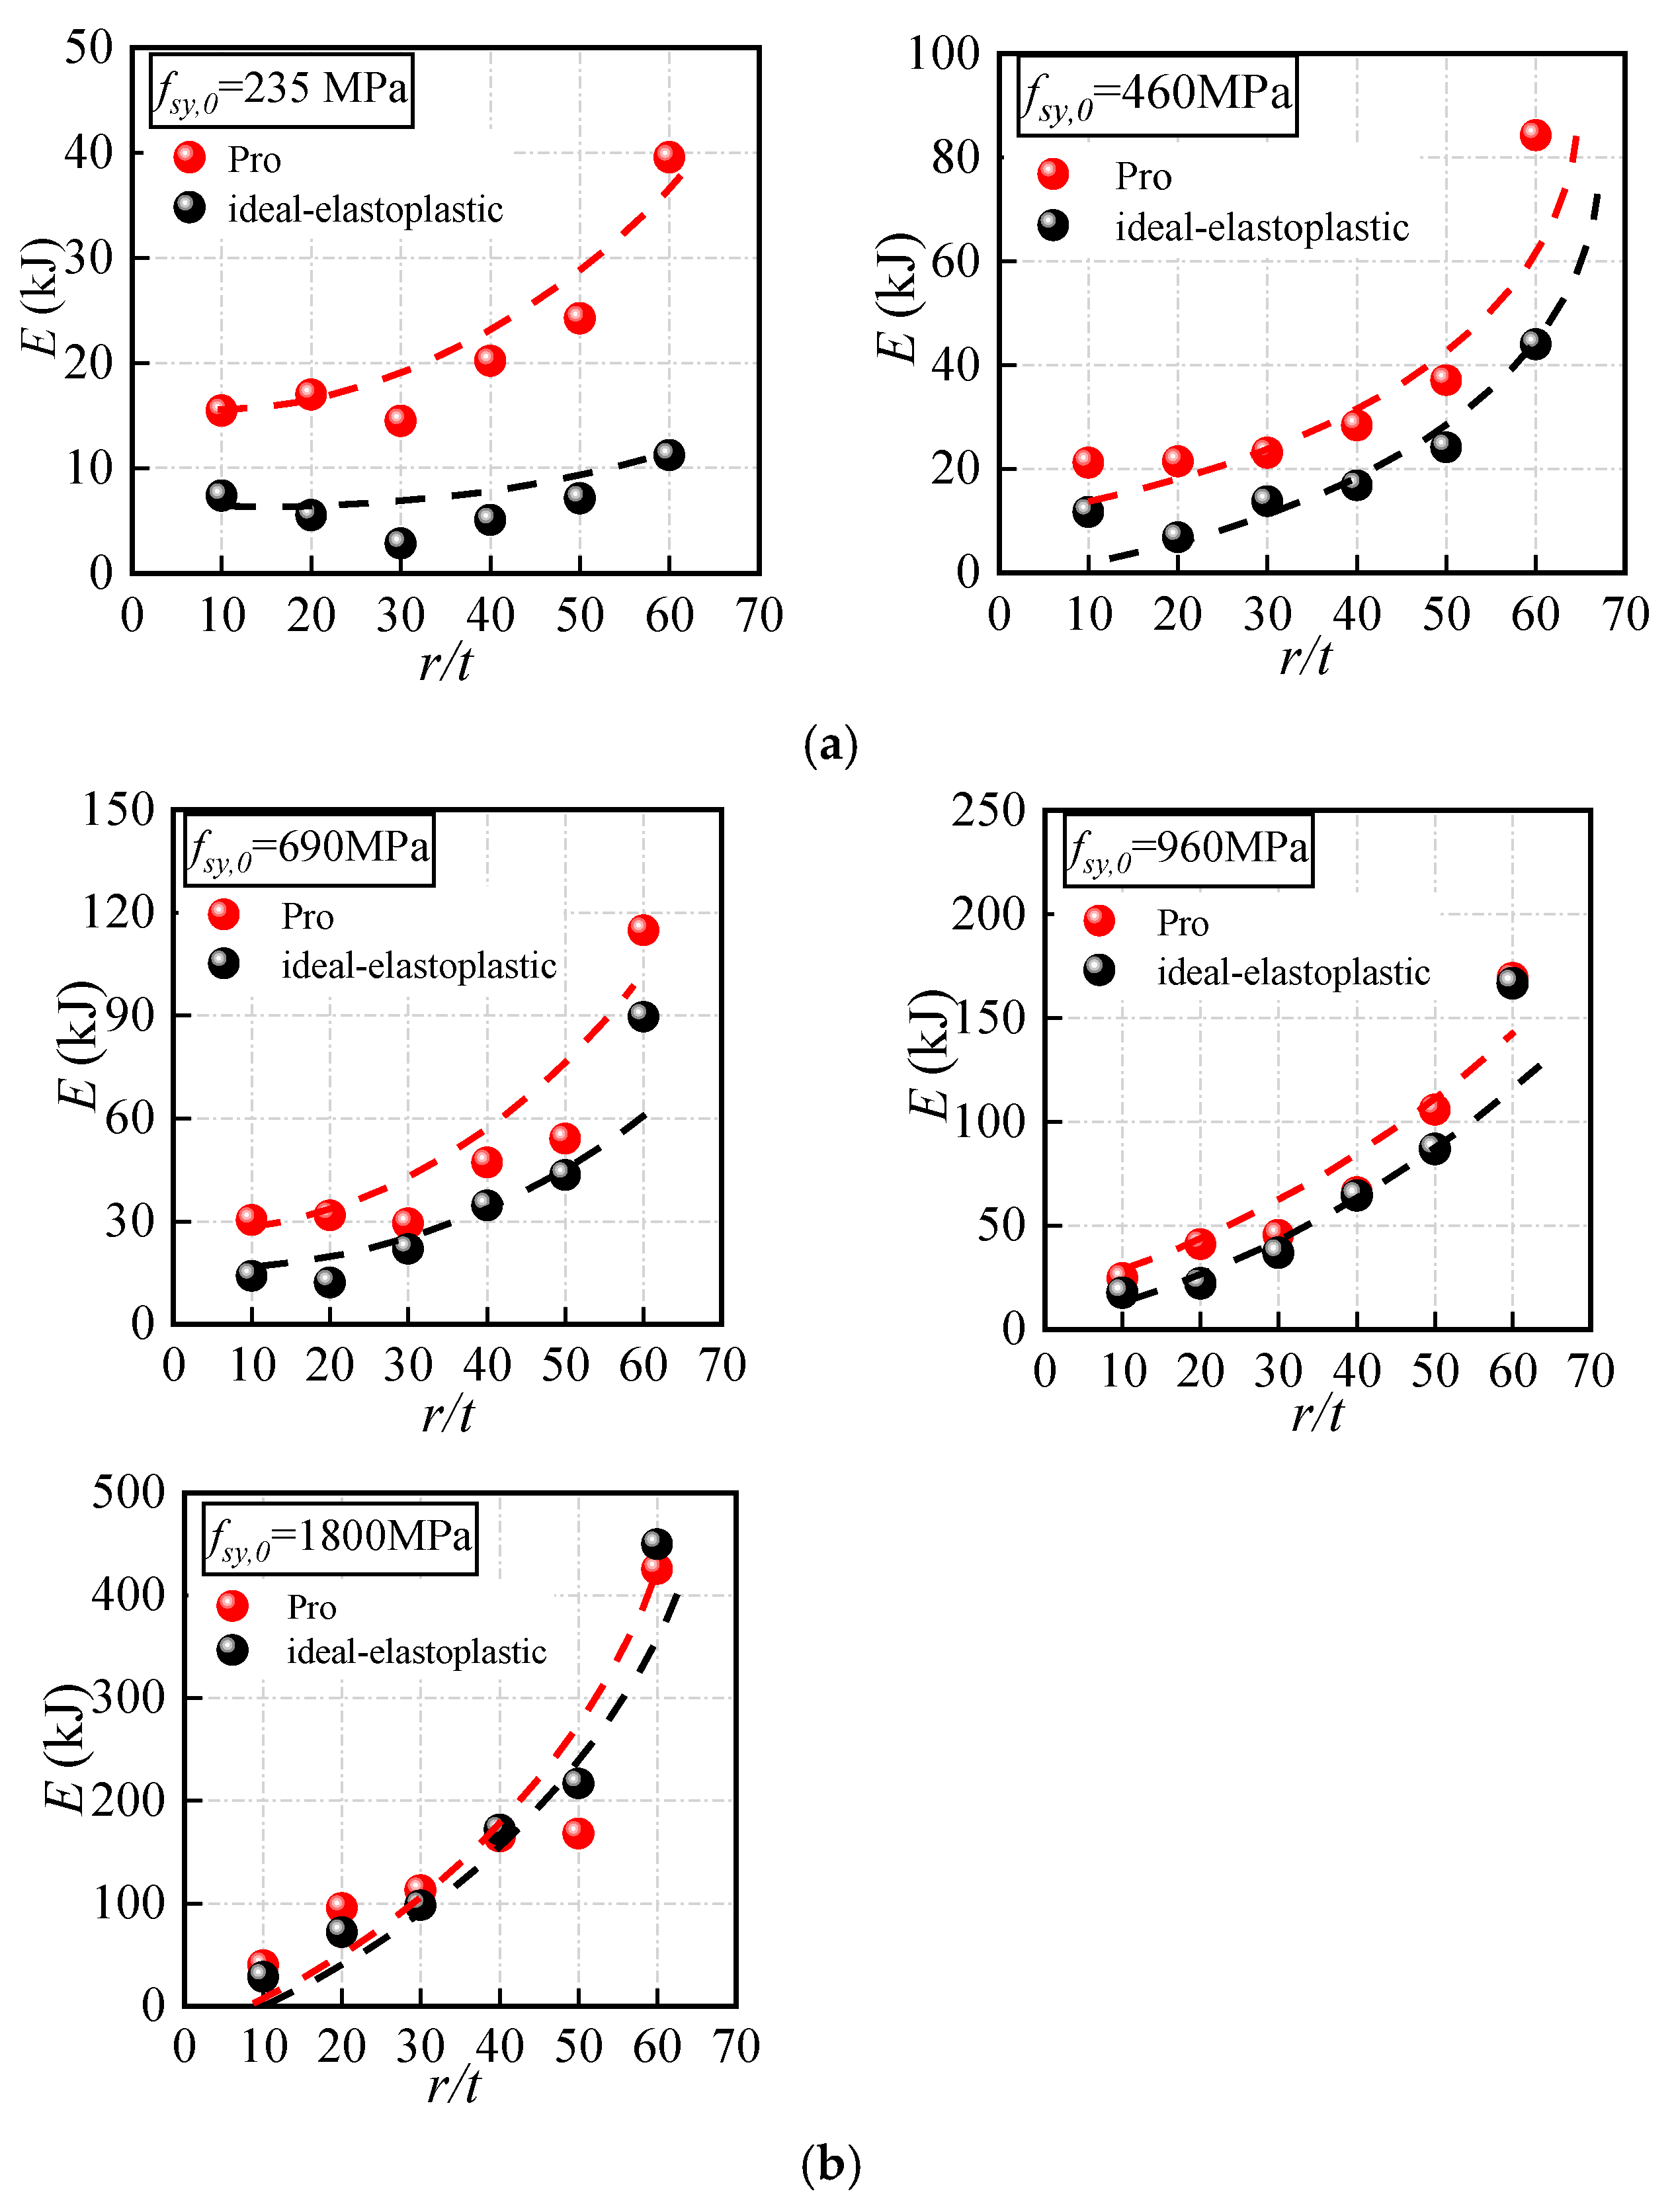
Compared with the ideal elastoplastic model, the proposed model can more accurately estimate the load-bearing capacity of the components under extreme loads, which reduces the economic burden of engineering.
Based on the mathematical and statistical analysis process presented in the paper, the proposed material constitutive model has reparability to a certain degree, which can also be a helpful tool to develop more models for the CHS and CFST members for analyzing catastrophic engineering problems. The related studies will be reported in the near future.

Author Contributions

Conceptualization, C.Y., L.Y. and Q.L.; methodology, C.Y. and L.Y. software, C.Y. and L.Y.; analysis, C.Y., L.Y., B.W. and Q.L.; writing—original draft preparation, L.Y.; writing—reviewing and editing, C.Y. and L.Y.; supervision, C.Y., B.W. and Q.L. All authors have read and agreed to the published version of the manuscript.

Funding

This work is supported by the Opening Project of Sichuan Province University Key Laboratory of Bridge Non-destruction Detecting and Engineering Computing (Grant No. 2021QZJ02 and 2019OYJ01).

Data Availability Statement

Data is contained within the article.

Conflicts of Interest

The authors declare no conflict of interest.

Appendix A

Uniaxial tensile stress-strain model of cold-formed steels including the mathematical expressions for the ultimate tensile strength fsu and the corresponding strain εsu proposed by Gardner [17] are expressed by Equations (A1)–(A3), respectively. Note that the models are based on the available experimental specimens with fsy,0 of 235~1100 MPa.
ε s = { f s E s + 0.002 ( f s f s y ) n ,   f s f s y f s - f s y E 0.2 + ( ε s u - ε 0.2 - f s u - f s y E 0.2 ) ( f s - f s y f s u - f s y ) m + ε 0.2 ,   f s y < f s f s u
ε s u = 0.6 ( 1 - f s y / f s u )
f s u = 1 + ( 130 / f s y ) 1.4

References

  1. Guiding Opinions of the General Office of the State Council on Vigorously Developing Prefabricated Buildings; State Council Bulletin of the People’s Republic of China; The State Council: Beijing, China, 2016; pp. 24–26. (In Chinese)
  2. GB/T 51232-2016; Prefabricated Steel Structure Building Technical Standards. China Construction Industry Press: Beijing, China, 2016. (In Chinese)
  3. Li, Q.W.; Yue, Q.R.; Feng, P.; Xie, N.; Liu, Y. Development Status and Prospect of Steel Structure Industry Based on Carbon Peak and Carbon Neutrality Target. Prog. Steel Build. Struct. 2022, 24, 1–6+23. (In Chinese) [Google Scholar]
  4. GB 50017-2017; Standard for Design of Steel Structures. Ministry of Housing Urban-Rural Construction of the People’s Republic of China: Beijing, China, 2017.
  5. AISI S100-16; North American Specification for the Design of Cold-Formed Steel Structural Members. American Iron and Steel Institute: Washington, DC, USA, 2016.
  6. EN 1993-1-12; Eurocode 3: Design of Steel Structures-Part 1-12: Additional Rules for the Extension of EN 1993 up to Steel Grades S 700. European Committee for Standardization (CEN): Brussels, Belgium, 2007.
  7. Li, C.L.; Yuan, H.; Hong, H.P. Predicting yield strength of cold-formed carbon steel: A review and new approaches. J. Constr. Steel. Res. 2023, 206, 107926. [Google Scholar] [CrossRef]
  8. Liu, H.X.; Chen, J.; Chan, T.M. Predictive methods for material properties of cold-formed conventional steels in the corner region. Thin-Walled Struct. 2023, 187, 110740. [Google Scholar] [CrossRef]
  9. Kalani, M.; Bakhshi, A. Investigation of cold work effect, Karren (AISI) and ECCS (Euro Code3) equations validity and tension failure modes in thick plate cold-formed steel angle sections. Structures 2023, 57, 105092. [Google Scholar] [CrossRef]
  10. Pham, C.H.; Trinh, H.N.; Proust, G. Effect of manufacturing process on microstructures and mechanical properties, and design of cold-formed G450 steel channels. Thin-Walled Struct. 2021, 162, 107620. [Google Scholar] [CrossRef]
  11. Chen, J.B.; Chan, T.M. Material properties and residual stresses of cold-formed high-strength-steel circular hollow sections. J. Constr. Steel Res. 2020, 170, 106099. [Google Scholar] [CrossRef]
  12. Meng, X.; Gardner, L. Cross-sectional behaviour of cold-formed high strength steel circular hollow sections. Thin. Wall. Struct. 2020, 156, 106822. [Google Scholar] [CrossRef]
  13. Javidan, F.; Heidarpour, A.; Zhao, X.L.; Minkkinen, J. Application of high strength and ultra-high strength steel tubes in long hybrid compressive members: Experimental and numerical investigation. Thin-Walled Struct. 2016, 102, 273–285. [Google Scholar] [CrossRef]
  14. Liu, J.Z.; Fang, H.; Chan, T.M. Experimental investigations on material properties and stub column behavior of high strength steel irregular hexagonal hollow sections. J. Constr. Steel Res. 2022, 196, 107343. [Google Scholar] [CrossRef]
  15. Yao, Y.; Quach, W.M.; Young, B. Finite element-based method for residual stresses and plastic strains in cold-formed steel hollow sections. Eng. Struct. 2019, 188, 24–42. [Google Scholar] [CrossRef]
  16. Rossi, B.; Afshan, S.; Gardner, L. Strength enhancements in cold-formed structural sections—Part II: Predictive models. J. Construct. Steel Res. 2013, 83, 189–196. [Google Scholar] [CrossRef]
  17. Gardner, L.; Yun, X. Description of stress-strain curves for cold-formed steels. Constr. Build. Mater. 2018, 189, 527–538. [Google Scholar] [CrossRef]
  18. Ramberg, W.; Osgood, W.R. Description of Stress-Strain Curves by Three Parameters; National Advisory Committee for Aeronautics: Washington, DC, USA, 1943. [Google Scholar]
  19. Quach, W.; Huang, J. Stress-strain models for light gauge steels. Procedia Eng. 2011, 14, 288–296. [Google Scholar] [CrossRef]
  20. Li, G.W.; Wu, Z.X.; Wen, D.H.; Shao, J.F.; Hu, C.X. Experimental investigation on the cold-forming effect of high strength cold-formed steel sections. Structures 2023, 58, 105615. [Google Scholar] [CrossRef]
  21. Chajes, A.; Britvec, S.; Winter, G. Effects of cold-straining on structural sheet steels. J. Struct. Div. 1963, 89, 1–32. [Google Scholar] [CrossRef]
  22. Bui, Q.; Ponthot, J. Numerical simulation of cold roll-forming processes. J. Mater. Process. Technol. 2008, 202, 275–282. [Google Scholar] [CrossRef]
  23. Menegotto, M.; Pinto, R.E. Method of analysis for cyclically loaded RC plane frames including changes in geometry and non-elastic behavior of elements under combined normal force and bending. In IABSE Symposium on Resistance and Ultimate Deformability of Structures Acted on by Well Defined Repeated Loads; IABSE: Zurich, Switzerland, 1973; Volume 13, pp. 15–22. [Google Scholar]
  24. Yang, C.; Zhao, H.; Sun, Y.P.; Zhao, S.C. Compressive stress-strain model of cold-formed circular hollow section stub columns considering local buckling. Thin-Walled Struct. 2017, 120, 495–505. [Google Scholar] [CrossRef]
  25. Ban, H.Y.; Shi, G.; Shi, Y.J.; Wang, Y.Q. Research progress on the mechanical property of high strength structural steels. Adv. Mater. Res. 2011, 250, 640–648. [Google Scholar] [CrossRef]
  26. Su, M.; Cai, Y.; Chen, X.; Young, B. Behaviour of concrete-filled cold-formed high strength steel circular stub columns. Thin-Walled Struct. 2020, 157, 107078. [Google Scholar] [CrossRef]
  27. Ma, J.L.; Chan, T.M.; Young, B. Material properties and residual stresses of cold-formed high strength steel hollow sections. J. Constr. Steel Res. 2015, 109, 152–165. [Google Scholar] [CrossRef]
  28. Hu, Y.F.; Xiao, M.; Chung, K.; Ban, H.; Nethercot, D.A. Experimental investigation into high strength S690 cold-formed circular hollow sections under compression. J. Constr. Steel Res. 2022, 194, 107306. [Google Scholar] [CrossRef]
  29. McCann, F.; Gardner, L.; Kirk, S. Elevated temperature material properties of cold-formed steel hollow sections. Thin-Walled Struct. 2015, 90, 84–94. [Google Scholar] [CrossRef]
  30. Elchalakani, M.; Zhao, X.L.; Grzebieta, R. Tests on concrete filled double-skin (CHS outer and SHS inner) composite short columns under axial compression. Thin-Walled Struct. 2002, 40, 415–441. [Google Scholar] [CrossRef]
  31. Elchalakani, M.; Zhao, X.L.; Grzebieta, R.H. Concrete-filled circular steel tubes subjected to pure bending. J. Constr. Steel Res. 2001, 57, 1141–1168. [Google Scholar] [CrossRef]
  32. Jiao, H.; Zhao, X.L. Material ductility of very high strength (VHS) circular steel tubes in tension. Thin-Walled Struct. 2001, 39, 887–906. [Google Scholar] [CrossRef]
  33. Sadowski, A.J.; Wong, W.J.; Li, S.C.S.; Málaga-Chuquitaype, C.; Pachakis, D. Critical buckling strains in thick cold-formed circular-hollow sections under cyclic loading. J. Struct. Eng. 2020, 146, 04020179. [Google Scholar] [CrossRef]
  34. Zhong, Y.; Zhao, O. Experimental and numerical studies on post-fire behaviour of S700 high strength steel circular hollow sections under combined compression and bending. Thin-Walled Struct. 2022, 181, 110004. [Google Scholar] [CrossRef]
Figure 1. Outline of the improved uniaxial stress-strain model for cold-formed CHS steels based on the Menegotto-Pinto model.
Buildings 14 00036 g001
Figure 2. Location of the tensile coupon.
Buildings 14 00036 g002
Figure 3. Distribution of the main measured variables of the collected experimental data.
Buildings 14 00036 g003
Figure 4. Relationship between the measured fsy/fsy,0 ratio and r/t.
Buildings 14 00036 g004
Figure 5. Relationships between the yield strength fsy of CHS and the main variables. (a) r/t. (b) fsy,0. (c) combined parameters based on r/t and fsy,0.
Buildings 14 00036 g005
Figure 6. The value of the curvature coefficient N. (a) Optimal envelope area. (b) Optimal elastic-plastic curvature.
Buildings 14 00036 g006
Figure 7. Relationships between the curvature coefficient N and the main variables.
Buildings 14 00036 g007
Figure 8. Relationships between the strain-hardening exponent Q and the main variables.
Buildings 14 00036 g008
Figure 9. Relationships between the ultimate strain εsu and the main variables.
Buildings 14 00036 g009
Figure 10. Relationships between the ultimate strength fsu and the main variables.
Buildings 14 00036 g010
Figure 11. Comparison between the measured and calculated ultimate strain εsu. (a) Available method raised by Gardner. (b) Proposed method in the paper
Buildings 14 00036 g011
Figure 12. Comparisons between the measured and calculated ultimate strength fsu. (a) Available method raised by Gardner. (b) Proposed method in the paper
Buildings 14 00036 g012
Figure 13. Comparison of experimental and calculated uniaxial tensile stress-strain curves. (a) Conventional strength steels. (b) High-strength steels with an average fsy,0 of 565 MPa. (c) Ultra-high strength steels with fsy,0 greater than 690 MPa
Buildings 14 00036 g013
Figure 14. Energy absorption of numerical examples using different material constitutive models. (a) Conventional strength steels within 460 MPa. (b) High-strength steels exceeding 690 Mpa.
Buildings 14 00036 g014
Table 1. Summary of the detail of tensile coupons.
Ref.Specimensr/tEs (Gpa)fsy,0 (MPa)fsy (MPa)fsu (MPa)
[11]4C200 × 3 32.3207.4546.5571.7632.8
4C150 × 324205.4546.5574.4623.2
4C150 × 6 11.5217.2580.7623.9694.8
4C200 × 6 15.7216580.7630.3698.5
4C250 × 6 19.8217.8580.7603.5685.2
6C150 × 6 11.5198.8756.3765.1808.6
6C200 × 6 15.7208756.3758.3808
6C350 × 6 28.2207.7756.3755.6804.1
9C150 × 6 11.5205.6973.39591045.2
9C200 × 6 19208.3973.3964.71040.5
9C300 × 6 29207.7973.3969.91037.1
[12]CHS139.7 × 4 16.6213.3700742.4842.3
CHS168.3 × 4 20.3211.7700720823.4
CHS139.7 × 5 13.3212.5700729.7843.3
CHS139.7 × 6 10.6207.9700779866.7
CHS139.7 × 8 7.9205.7700784.8866.8
CHS139.7 × 10 6.1205.6700787.6877.5
[26]89 × 4 10.1209110010841242
108 × 4 12.5208110012331327
133 × 4 15.6210110011641278
89 × 3 13.82039009801093
[27]V89 × 4 10.421090010541108
S89 × 4 10.4205110011801317
S108 × 4 12.9215110011801292
S133 × 4 16.1204110011591291
S139 × 6 10.8194110010141382
V89 × 3 14.0320990010531124
Total21 coupons6.1~32.3198.8~217.8546.5~1100571.7~1233623.2~1382
[28]CHS0111.5203690746811
CHS0215.7204690747816
CHS039202690757837
CHS0411.5201690767827
[29]193.7 × 8 11.1198.6355404480
[30]C18.7191350454520
C211.3220350416484
C315.5204350453521
C418.3200350430514
C519.4204350379440
C622.8207350357474
C723193350433479
C827.5206350395481
[31]CBC119.1200350365469
CBC214.9210350432538
CBC314.6218350415534
CBC411.4211350433508
CBC510.8205350456548
CBC69.1204350408503
CBC77.1207350442511
CBC85.4209350460568
[32]TS1A10.7190.9135014021558
TS1B10.8195.1135013921533
TS1C10.6190.7135014001550
TS2A9.3198.3135013611513
TS2B9.4204.4135013601507
TS2C9.2197.6135013621499
TS3A8.3195.6135013281477
TS3B8.4197.1135013291495
TS3C8.3200.2135013321487
TS4A16.8203135013461506
TS4B16.6194.2135013651519
TS4C16.9197135013681540
TA5A16.9195.2135013631540
TS5B16.9196.7135013701568
TS5C22.7203.7135013991520
[33]122.6201.6355456.8527
222.9203.6355451.7534.2
314200.2355455.6529.2
414195.4355392503.7
517.9196.6355405.2511.8
617.9198.5355443.9508.1
721.2196.7355385500
821.2197.3355397.4511.1
921.2196.7355436.4502.1
[34]CHS139.7 × 8 8202.2700856.8893.7
CHS139.7 × 10 6203.1700762804.9
Total53 coupons5.4~27.5190.7~220350~1350357~1402440~1568
Table 2. Main variables of the test specimens for comparison.
Notation193.7 × 84C200 × 34C200 × 6CHS168.3 × 4CHS139.7 × 56C200 × 66C150 × 69C200 × 5
fsy,0 (MPa)355546.5580700700756.3756.3973
r/t11.132.215.720.313.315.715.715
Ref.[29][11][12][11]
Table 3. Main variables of the numerical examples.
Setsfsy,0 (MPa)t (mm)r/tL (mm)
1235, 460, 690, 960, 1800310198
2235, 460, 690, 960, 1800320378
3235, 460, 690, 960, 1800330558
4235, 460, 690, 960, 1800340738
5235, 460, 690, 960, 1800350918
6235, 460, 690, 960, 18003601098
Disclaimer/Publisher’s Note: The statements, opinions and data contained in all publications are solely those of the individual author(s) and contributor(s) and not of MDPI and/or the editor(s). MDPI and/or the editor(s) disclaim responsibility for any injury to people or property resulting from any ideas, methods, instructions or products referred to in the content.

