Article

Experimental Study and Finite Element Modelling of Squat Shear Walls under Combined Cyclic Loads and High Axial Loads

1
School of Architectural Engineering, Jinling Institute of Technology, Nanjing 211169, China
2
Key Laboratory of Concrete and Prestressed Concrete Structures of Ministry of Education, Southeast University, Nanjing 211189, China
3
College of Civil Engineering, Tongji University, Shanghai 200092, China
*
Author to whom correspondence should be addressed.
Buildings 2023, 13(8), 2104; https://doi.org/10.3390/buildings13082104
Submission received: 15 July 2023 / Revised: 17 August 2023 / Accepted: 18 August 2023 / Published: 20 August 2023

Abstract

:
Experimental observations on three reinforced concrete shear walls with small shear span-to-depth ratio (SDR) under combined high vertical axial load and horizontal cyclic loads are presented. The influence of high axial load ratio (ALR) on the failure mode, hysteretic behaviour, displacement ductility, shear strength and stiffness of the squat shear walls is investigated. In addition, a novel built-in strain gauges measuring system is employed for measuring the strain conditions in the reinforcements during the whole test process. Test results indicate that high axial load restrains the development of cracks and improves the shear load capacity, but that it also decreases ductility and energy dissipation and aggravates stiffness degradation. Concrete crush and out-of-plane buckling were observed in all specimens, resulting in the final failure of the specimens. According to the strain analysis, the section of the squat walls coincided well with the assumption of plane section under the condition of high ALR. With the increase of ALR, the depth of the compression zone of members increases, while the length of plastic hinge decreases. When the axial load is relatively small, the vertical and horizontal reinforcements provided almost equal contribution to the shear capacity of squat shear walls. However, under extremely high axial load, both vertical and horizontal reinforcements cannot provide full contribution to the shear capacity. The hysteretic behaviours of the tested shear walls were simulated by a cyclic softened membrane model (CSMM). Simulation results indicate that CSMM captured well the nonlinear characteristics of the squat shear wall under high axial load.

1. Introduction

Shear walls with small shear span-to-depth ratio (SDR) are mainly subjected to shear force and prone to a brittle failure. Through post-earthquake field studies, researchers have reported that severe damage to squat shear walls is one of the most crucial causes of structural failure [1]. Extensive theoretical and experimental studies have been conducted focusing on the strength and deformation capacity of squat shear walls since the 1940s [2,3,4,5,6,7,8,9,10]. Terzioglu T [11] studied the strength degradation characteristics of squat walls, as well as the contribution of shear, flexural and sliding deformations to wall lateral displacements. Baek [12] investigated the effect of 550 MPa reinforcing bars on the shear strength of squat walls. Ma [13] discussed the seismic response of H-shaped squat walls, and proposed equations to assess the peak shear strength of specimens. Peng [14] tested six rectangular squat recycled concrete wall specimens under in-plane cyclic loading and developed a simplified analytical method to predict the peak loads of squat walls failed in flexure or a mixed flexural–diagonal compression mode. Maier [15] studied the shear capacity and deformation of squat shear walls subjected to cyclic lateral loads and pointed out that transverse reinforcement contributed little to the shear capacity, while it has a great influence on the deformation capacity. Lefas et al. [16] tested seventeen squat shear walls under large inelastic deformations to analyse the influence of shear span-to-depth ratio, axial load, transverse reinforcement ratio and loading history on the seismic behaviour of shear walls, and critically examined the American Concrete Institute’s code requirements for shear capacity. Hidalgo et al. [17] conducted an experimental study of 26 squat shear walls under cyclic lateral loads and pointed out that when the SDR decreased, shear capacity increased while deformation capacity decreased. But longitudinal reinforcement ratio has only a minor influence on the shear capacity. Salonikios et al. [18] discussed the performance of squat shear walls in terms of ductility and strength, as well as the shear slip failure mode. Based on their study, the shear design equations in European code were also evaluated. Oesterle et al. [19] carried out an experiment to investigate the diagonal compression strength of the web and analysed the upper limit of shear strength and deformation capacity, as well as their relationship. Lopes [20,21] studied the influence of transverse reinforcement ratio on the seismic behaviour of shear-dominated walls with a novel test method and concluded that in walls with small SDRs, the longitudinal reinforcement contributed more to shear capacity than horizontal reinforcement. Sozen and Moehle [22] studied a number of force–displacement characteristics of squat shear walls and proposed a backbone curve considering the combination of flexure deformation, shear deformation and sliding.
Axial load ratio (ALR) is an important factor affecting the seismic performance of shear walls. It limits the development of inclined cracks and increases the area of sectional compression zone. However, as the axial load increases, the ductility of shear walls reduces leading to poor seismic performance. Lv et al. [23] pointed out that under excessively high ALR, significant strength degradation may occur within a relatively small drift, resulting in a loss of load capacity. Therefore, it is necessary to limit the magnitude of the ALR. Wong et al. [24] conducted an experimental study on three slender shear walls with ALR of 0.25 and 0.5. The test results indicated that axial load has a great influence on the ductility and energy dissipation of the specimens. A ductile flexure failure was occurred in the specimen with ALR of 0.25, while a brittle compression failure was occurred in the specimen with ALR of 0.5. According to the survey of the ALR of medium-high buildings in Hong Kong, Su et al. [25] revealed that the ALR is generally around 0.2 in serviceability limit state, while it is about 0.3~0.5 in ultimate limited state, furthermore, it will increase by 17~41% when earthquake is considered. Through a literature review, Zhang et al. [26] found that the ALR was no more than 0.15 in most of the past experiments, and only three slender shear walls had an ALR of 0.4; however, under the combined action of gravity load and seismic load, the ALR of shear walls is usually between 0.3 and 0.6. Looi [7] studied the effects of axial load on seismic performance of reinforced concrete walls with short shear spans and proposed two modified empirical prediction models to estimate the shear strength capacity and ultimate drift ratio. In present codes [27,28,29], the limit value of ALR for reinforced concrete shear walls is determined by the seismic grade and fortification intensity without considering the influence of ductility requirements, aspect ratio and boundary constraints.
Existing studies have primarily focused on the seismic behaviour of slender shear walls, whereas less information can be found about the seismic performance of squat shear walls, especially for the squat walls under high axial load. In addition, there is no unified conclusion about the contributions of vertical and horizontal reinforcements in the web to the shear behaviour of the squat shear walls as well as the calculation method of the shear capacity and deformation capacity under high axial load. The investigation reported herein emphasizes the seismic behaviour of reinforced concrete shear walls with small SDR under combined high axial load and reversed cyclic loads. Through experimental research, the seismic behaviour of squat shear walls is studied, and the strain conditions of the web reinforcements in two directions are discussed. The nonlinear behaviours of tested shear walls were then simulated with a finite element model.

2. Experimental Program

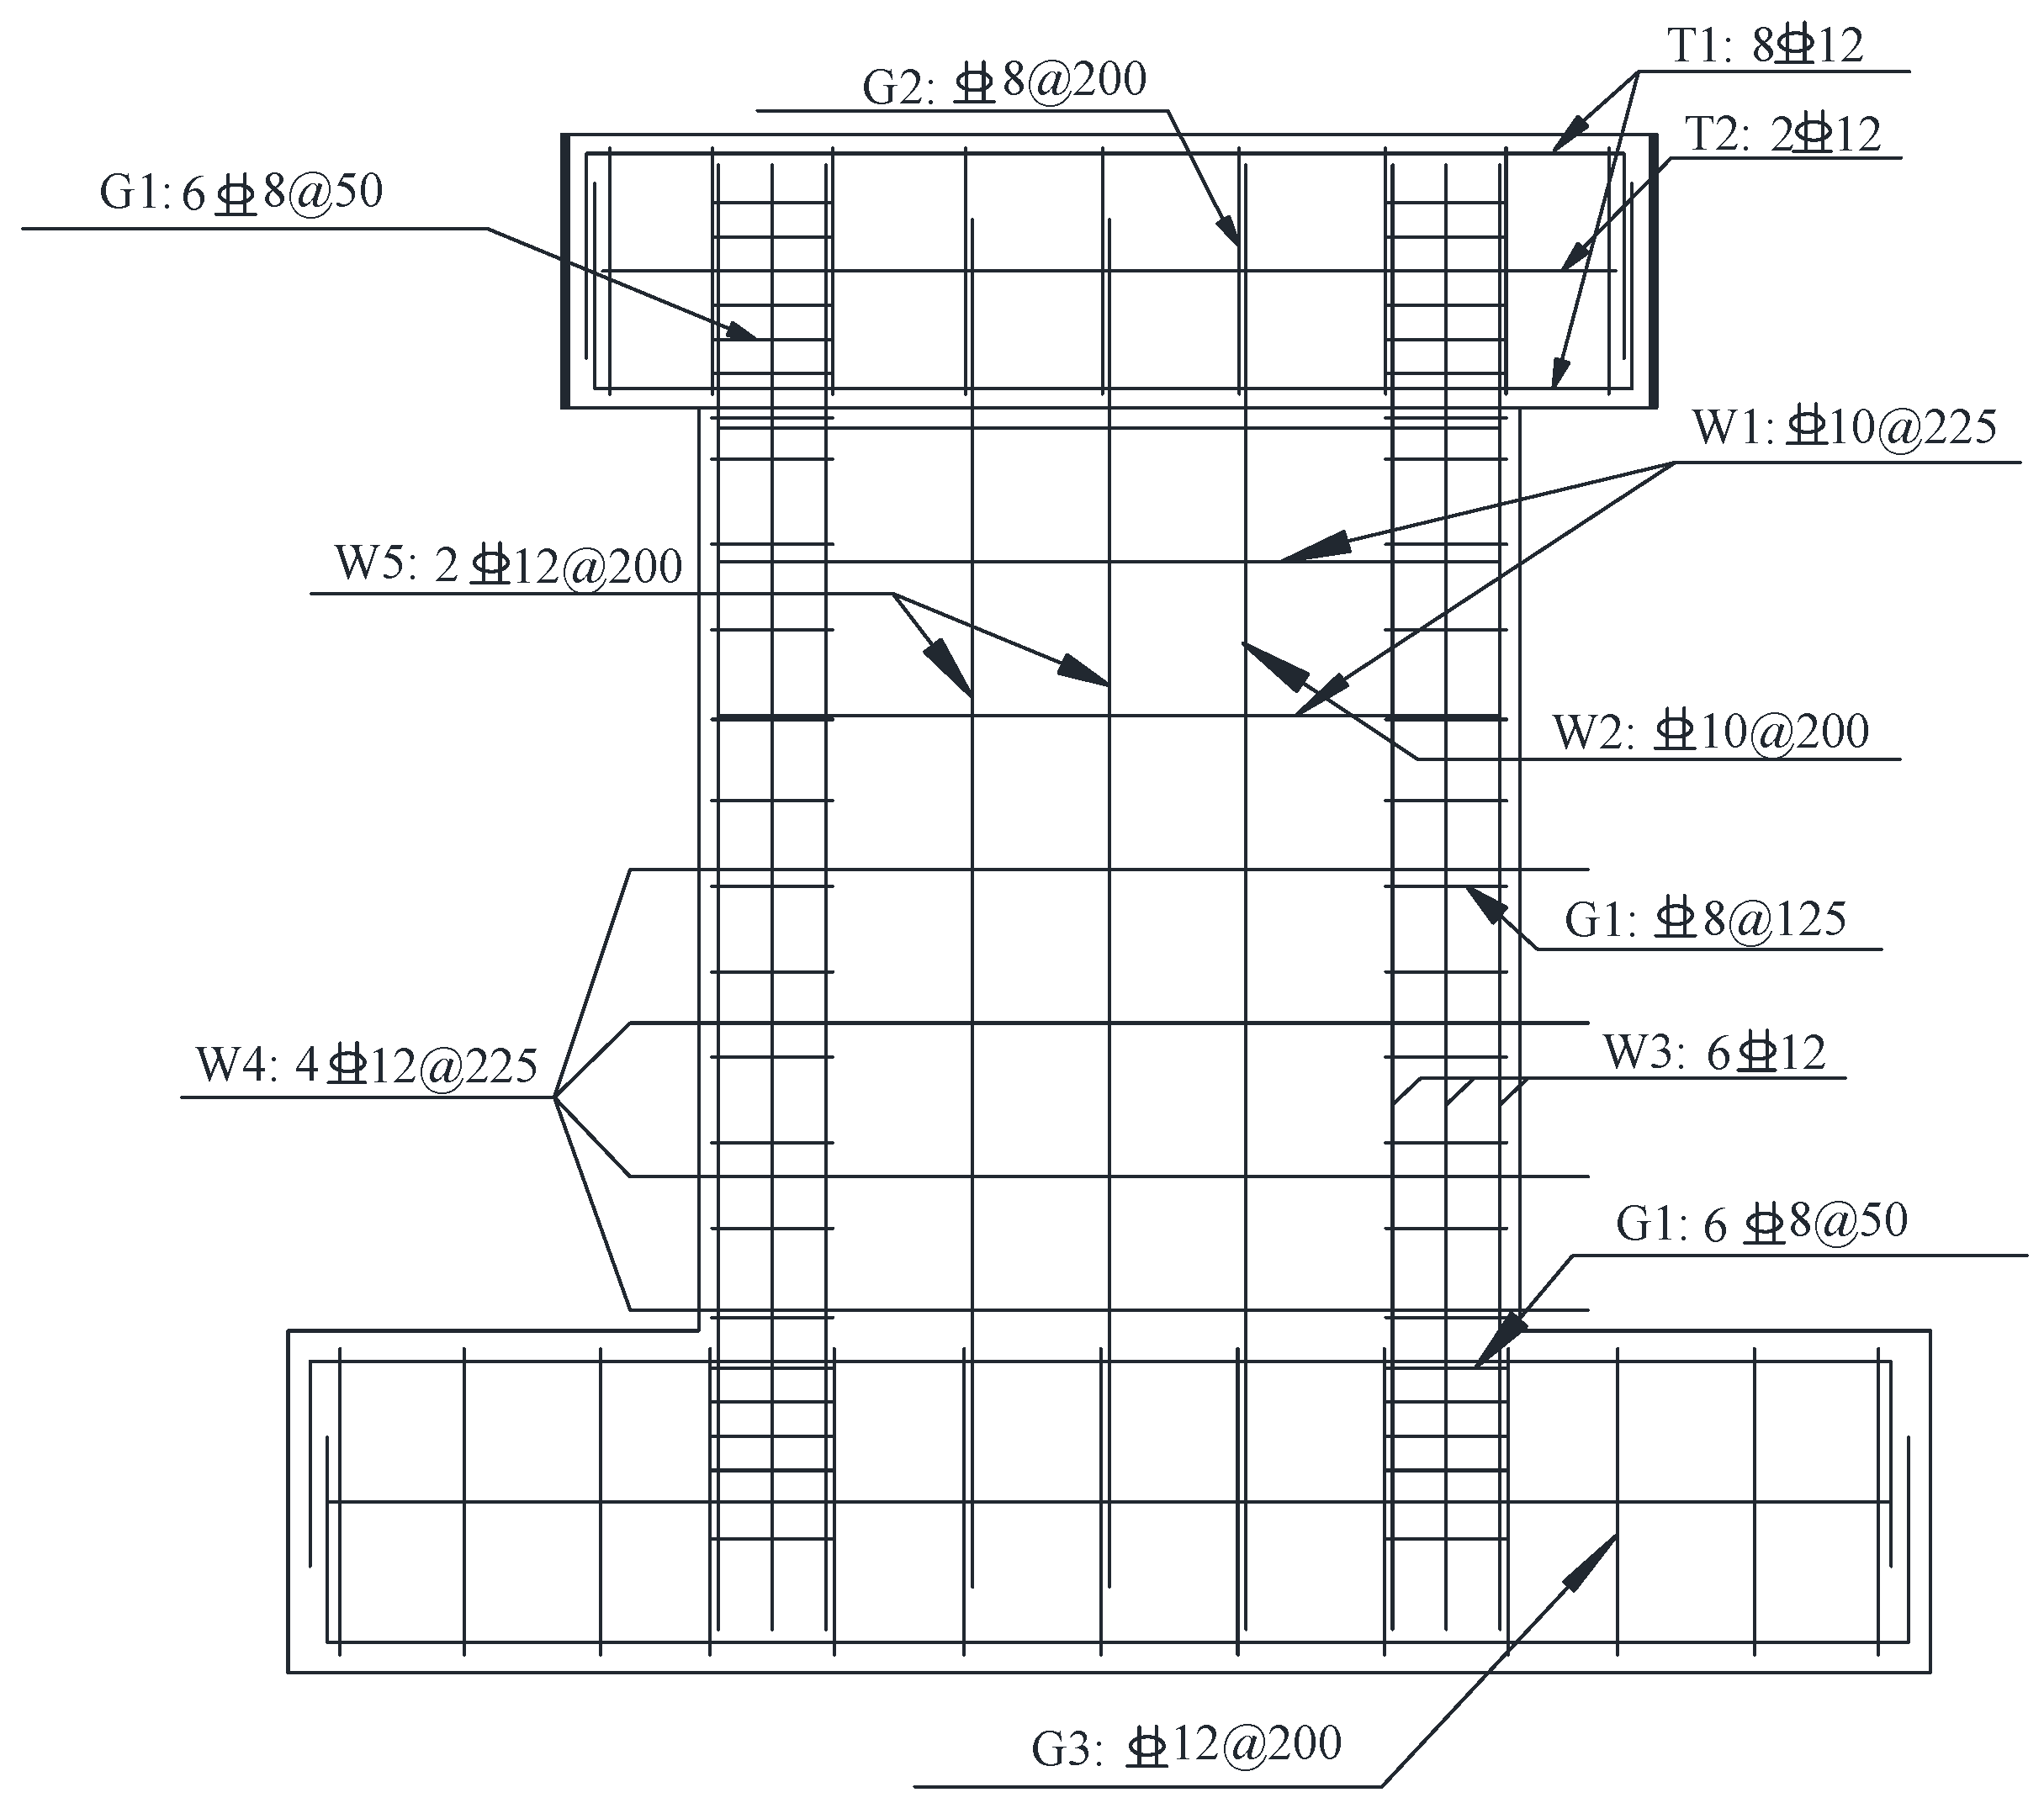
2.1. Specimen Design and Material Properties

Three reinforced concrete (RC) shear walls with small shear span-to-depth ratio (SDR) were tested under constant axial load and cyclic horizontal load. All the designed SDRs of the shear walls were 1.25, and the dimensions were 1200 mm × 120 mm × 1500 mm (length × thickness × height). Due to the restriction of the sectional size, the thickness of the concrete cover was designed as 15 mm. The vertical and horizontal reinforcement ratios were 0.65% and 0.58%, respectively, for all specimens with rebars of 10 mm in diameter. The boundary elements were designed with a cross-section of 200 mm × 120 mm (depth × width). During the testing, in order to ensure shear failure of the specimens, the longitudinal reinforcement ratio of boundary elements was intentionally enhanced, and was 2.82% with the rebar diameter of 12 mm. All stirrups were uniformly distributed along the height and consisted of closed rectangular hoops with 135° end hooks to ensure positive anchorage. The volumetric ratio of stirrups in the boundary element was 0.92%. The influence of axial load on the seismic behaviour of squat shear walls was investigated in this paper. The applied axial load ratios (ALRs) for the specimens were 0.2, 0.4 and 0.6, respectively. Figure 1 shows the geometry of the specimens and layout of reinforcements. The concrete used in this experiment was prepared with water-binder ratio of 0.39 and maximum aggregate size of 20 mm. The geometric details and material mechanical properties of the specimens are shown in Table 1: fcu is the measured cubic compressive strength; fc is axial compressive strength; ρv and fy,v are the reinforcement ratio and yield strength of vertical reinforcements in web, respectively; ρh and fy,h are the reinforcement ratio and yield strength of horizontal reinforcements in web, respectively; ρcc and fy,cc are the reinforcement ratio and yield strength of longitudinal reinforcements in boundary element, respectively, and ρw and fy,w are the volumetric ratio and yield strength of stirrups in boundary element, respectively.

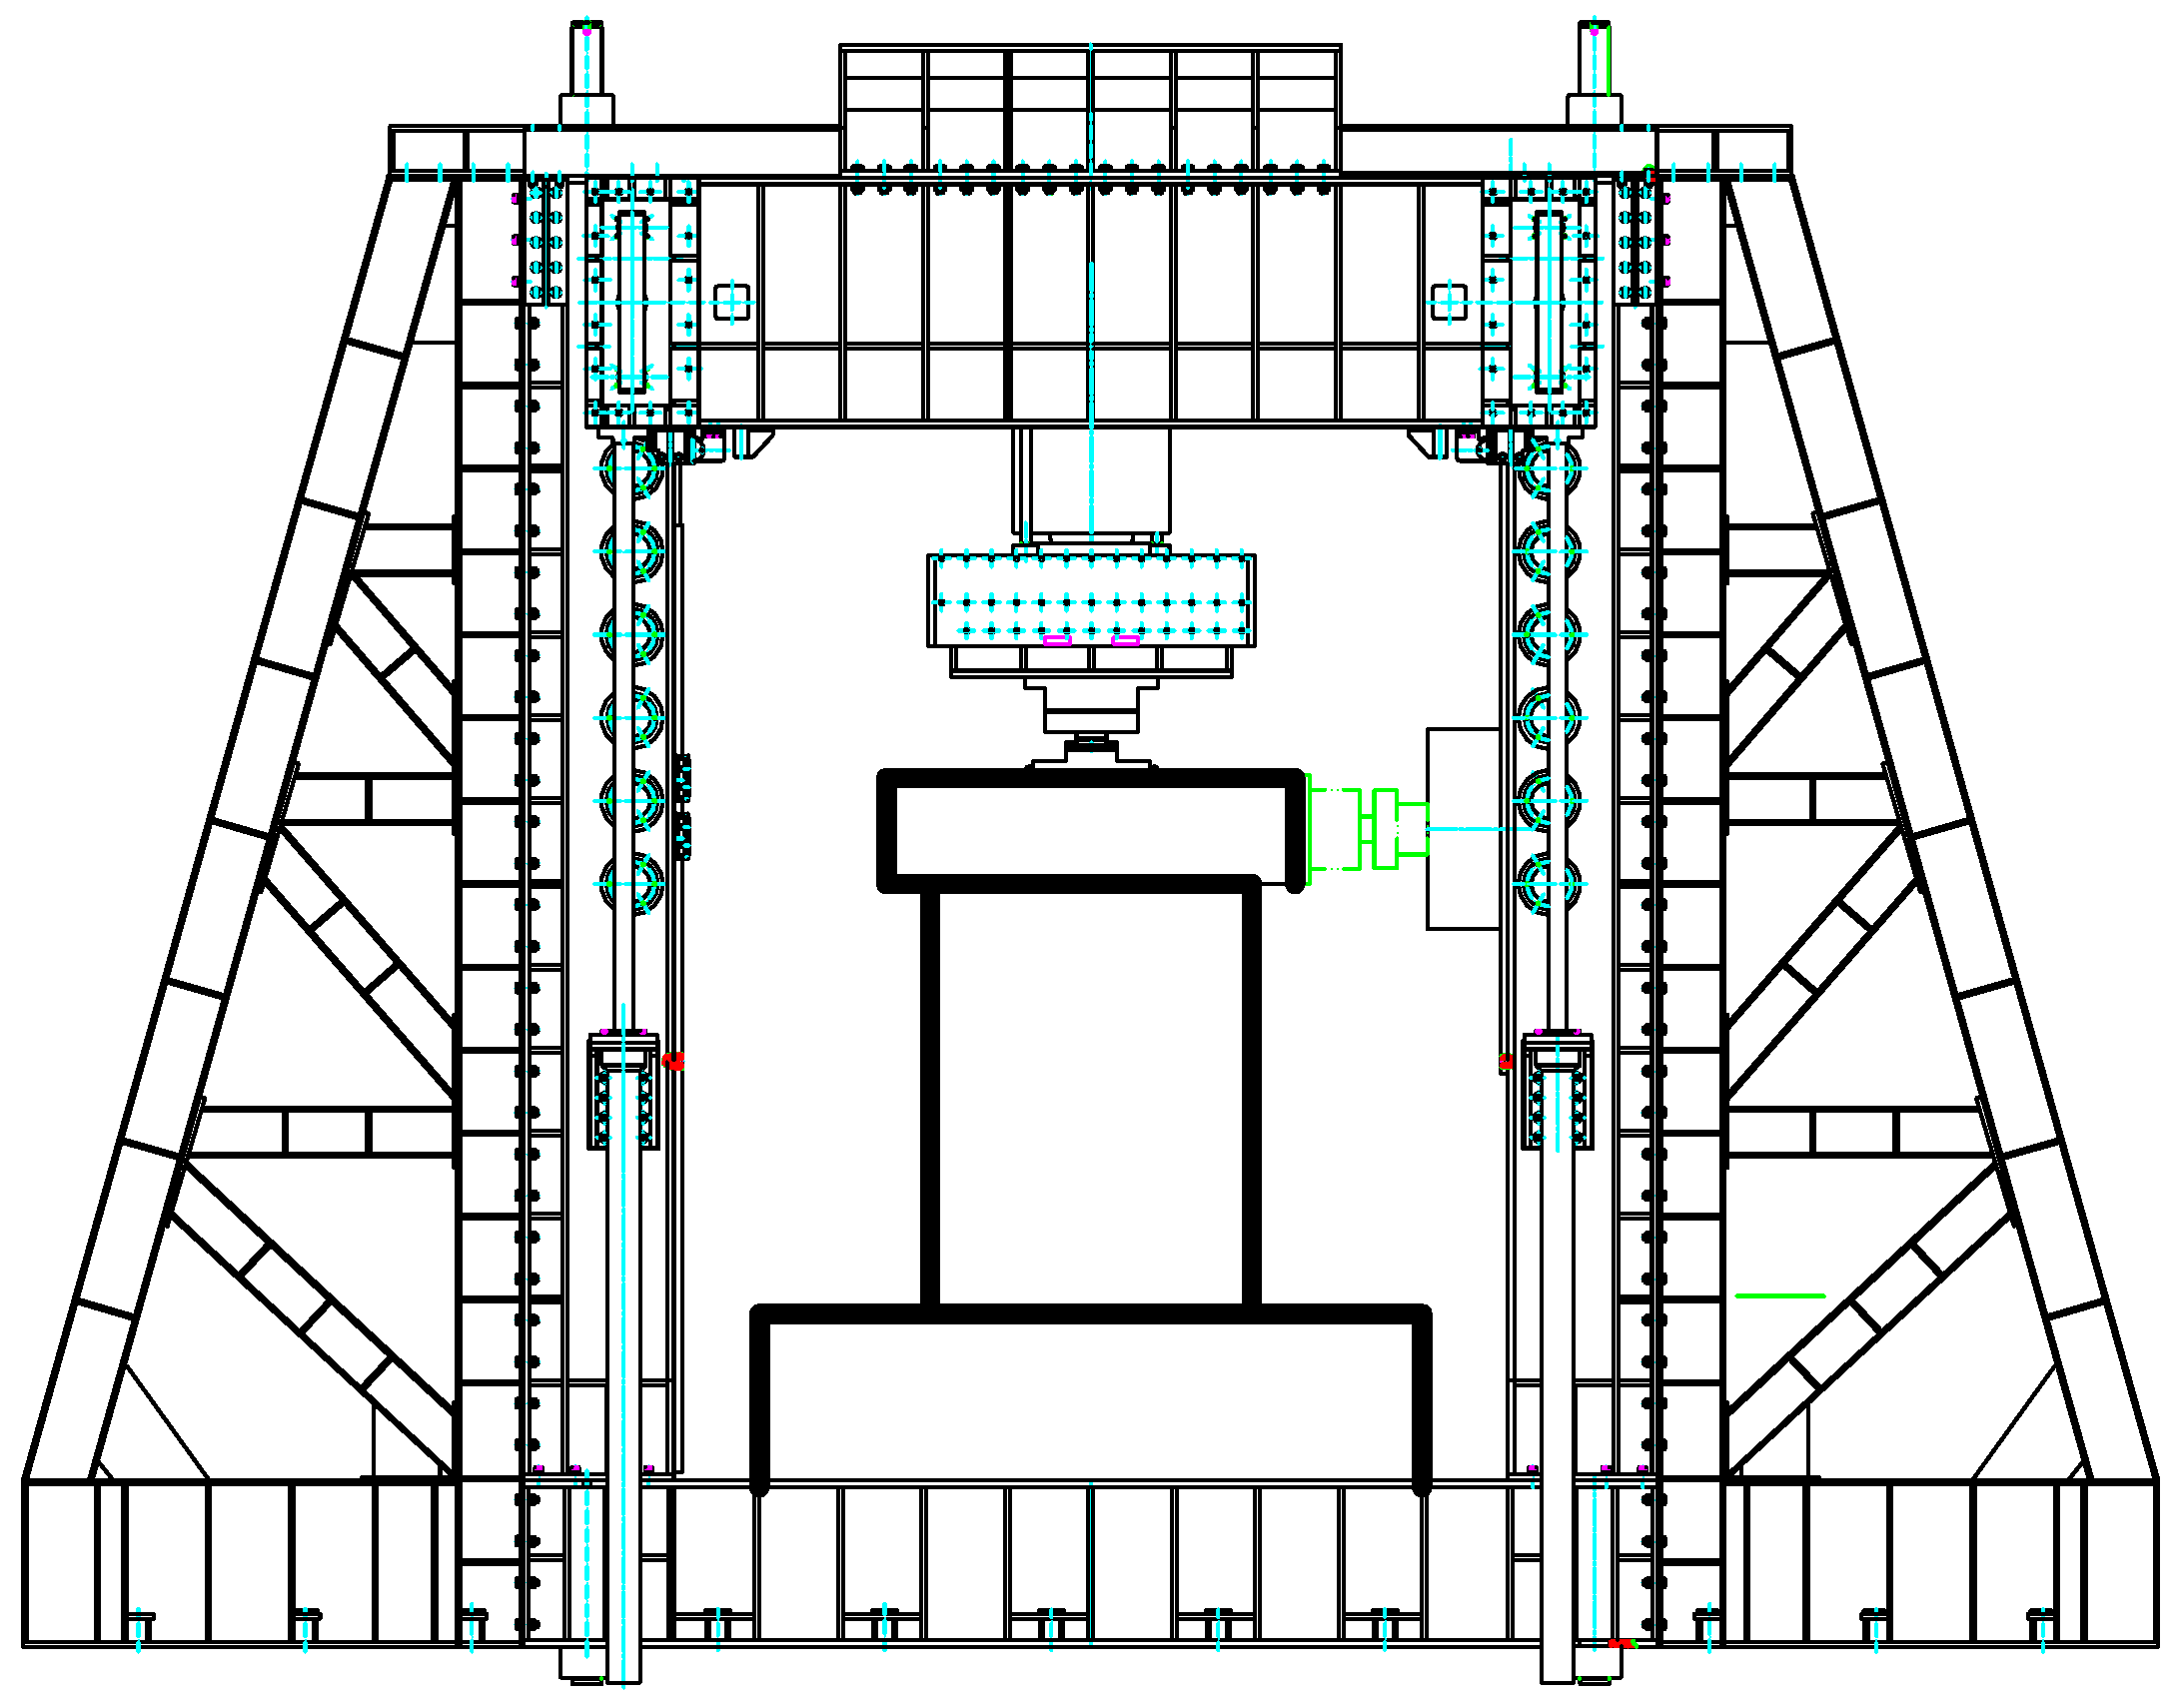
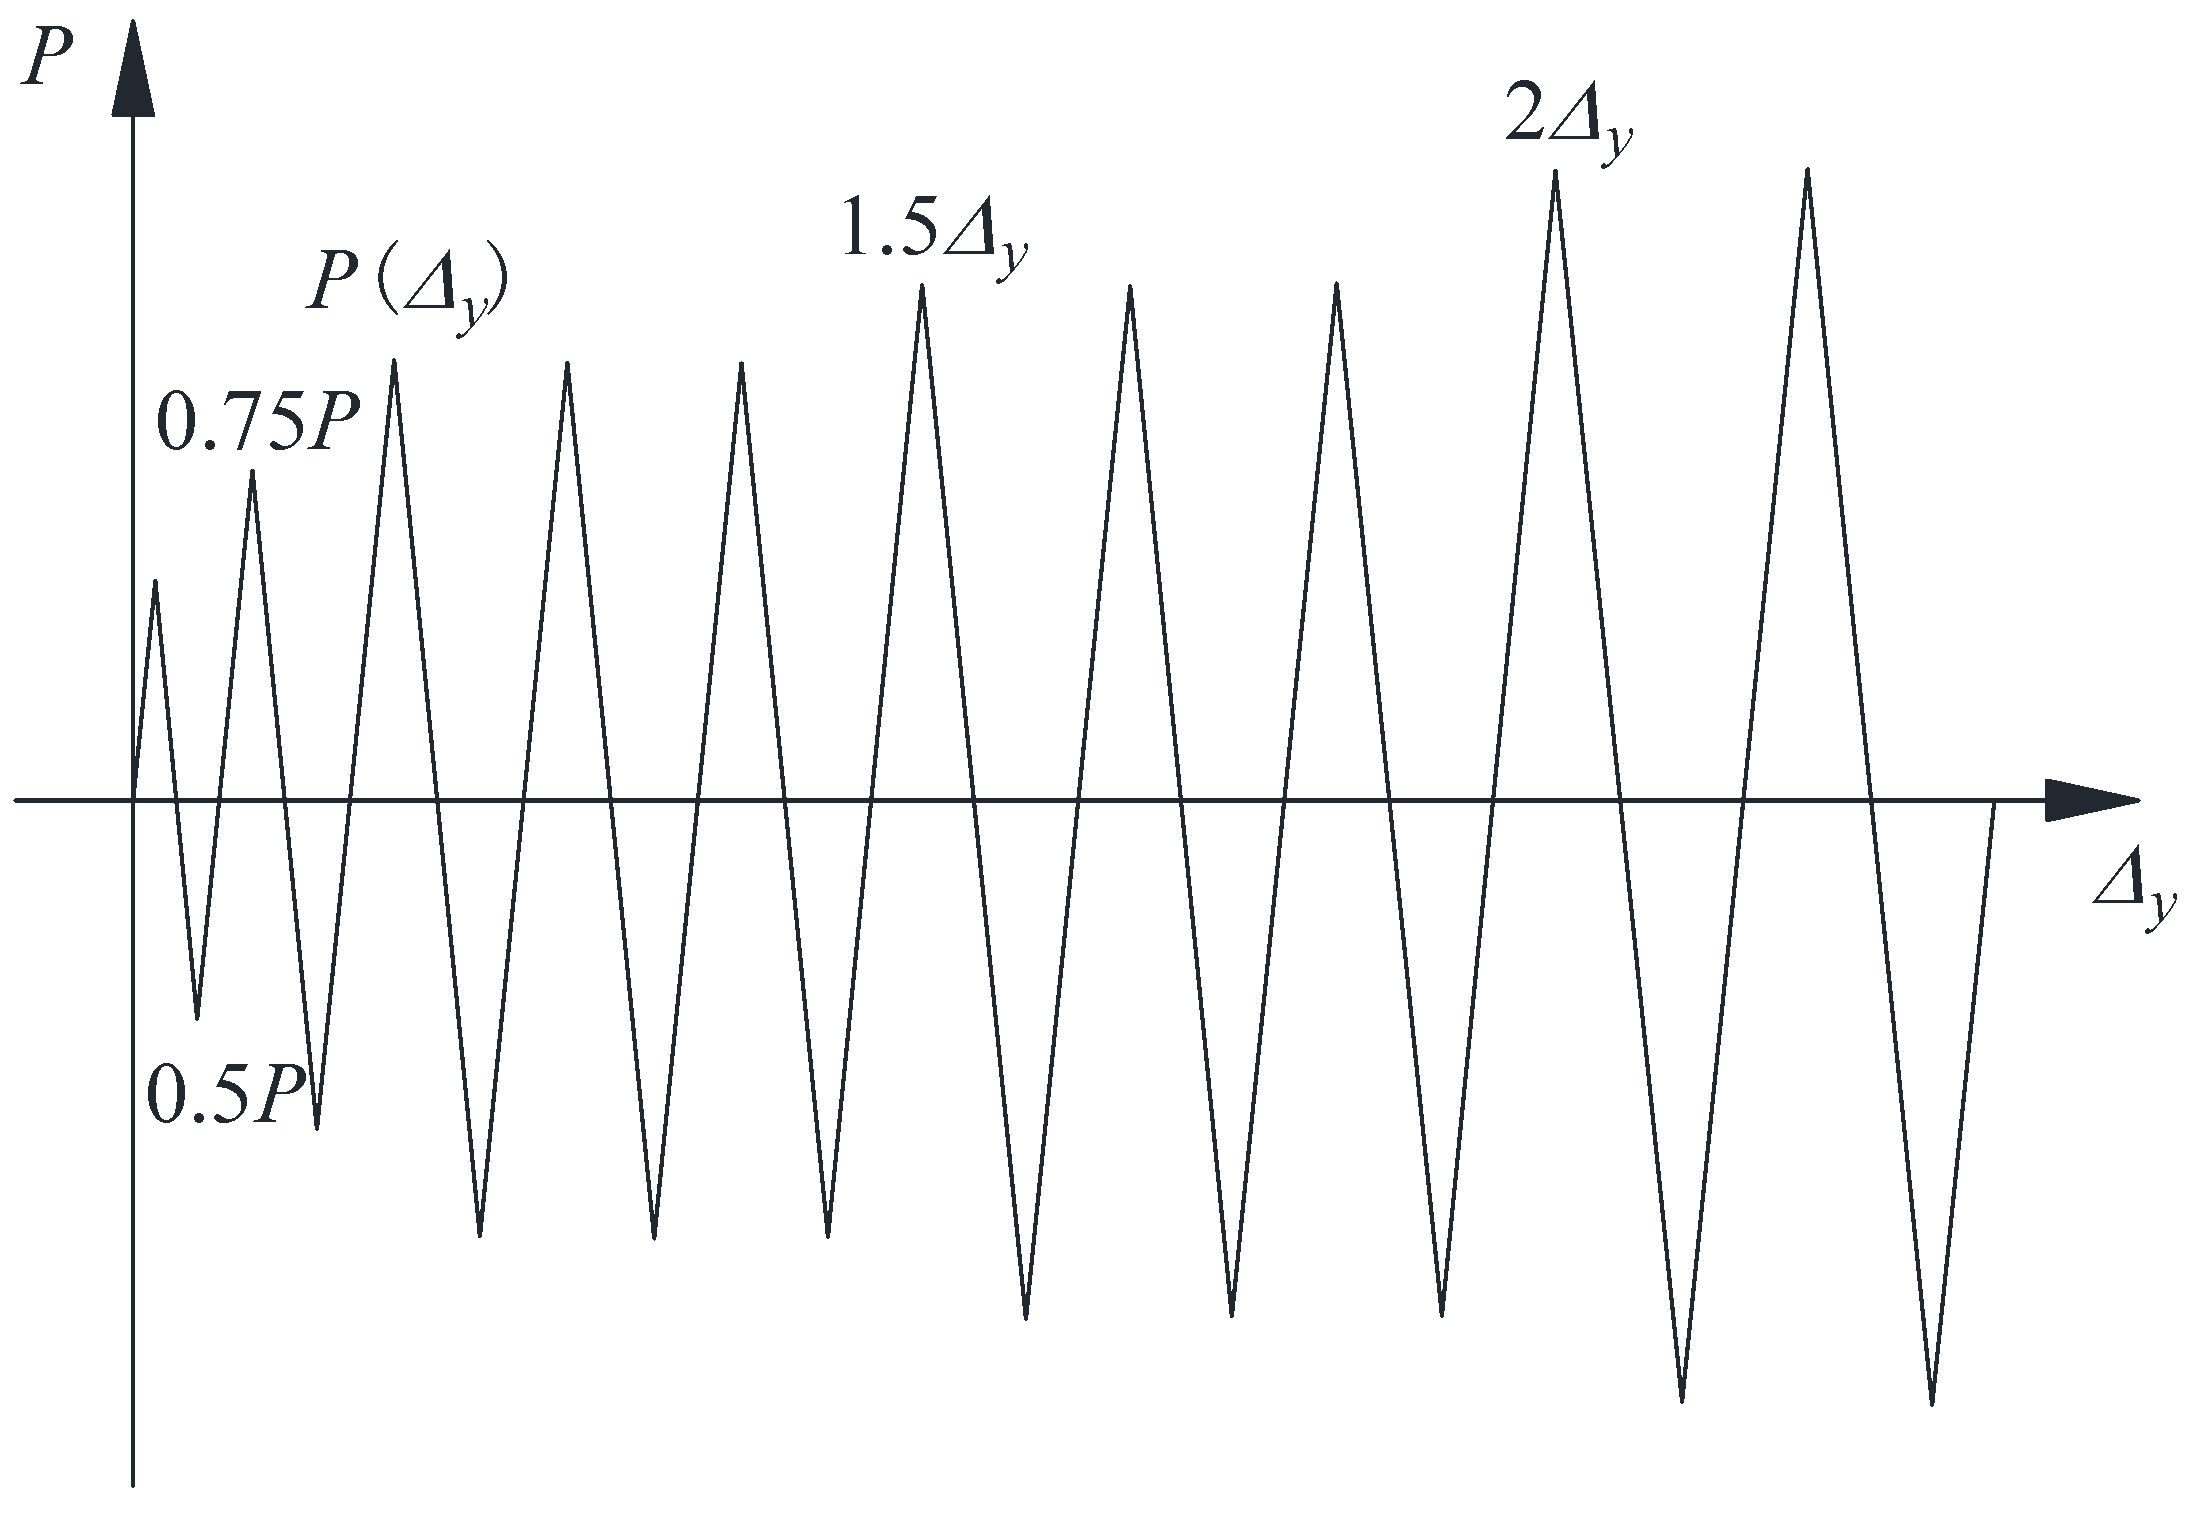
2.2. Test Setup and Loading History

An electrohydraulic servo loading system was adopted in this experiment which was composed of a reaction frame system and a bidirectional lateral loading system. The vertical and horizontal loading capacities of the system were 10,000 kN and ±1500 kN, respectively. The foundation beam of the specimen was fully fixed, whereas the top of the specimen was free to move. During the test, the transverse load was applied at the top of the shear wall, while the axial load was applied all the time on the centroid of the free end section of specimen which was kept constant. The test setup used in this study is shown in Figure 2.
The loading history applied is shown in Figure 3. To check the performance of the electrohydraulic servo loading system, each specimen was preloading twice before the experiment began with a vertical load of 300 kN and a lateral load of 50 kN. The axial load was first applied to the target value and maintained constantly during the whole experiment. The initial applied lateral load was 0.5Vy with the increments of 0.25Vy for each loading step up to the specimen yielding, where Vy is the yield shear force of the specimen. The displacement control loading protocol was applied after the yielding of each specimen. The initially applied horizontal displacement was equal to the measured yield displacement Δy with increments of 0.5Δy for each loading step up to failure, where Δy is the yield deformation of the specimen. All cycles were carried out once in the force control loading procedure, while all cycles were carried out third time in the displacement control loading protocol. The experiment ended when the shear-resisting capacity dropped by more than 20% of the maximum shear force.

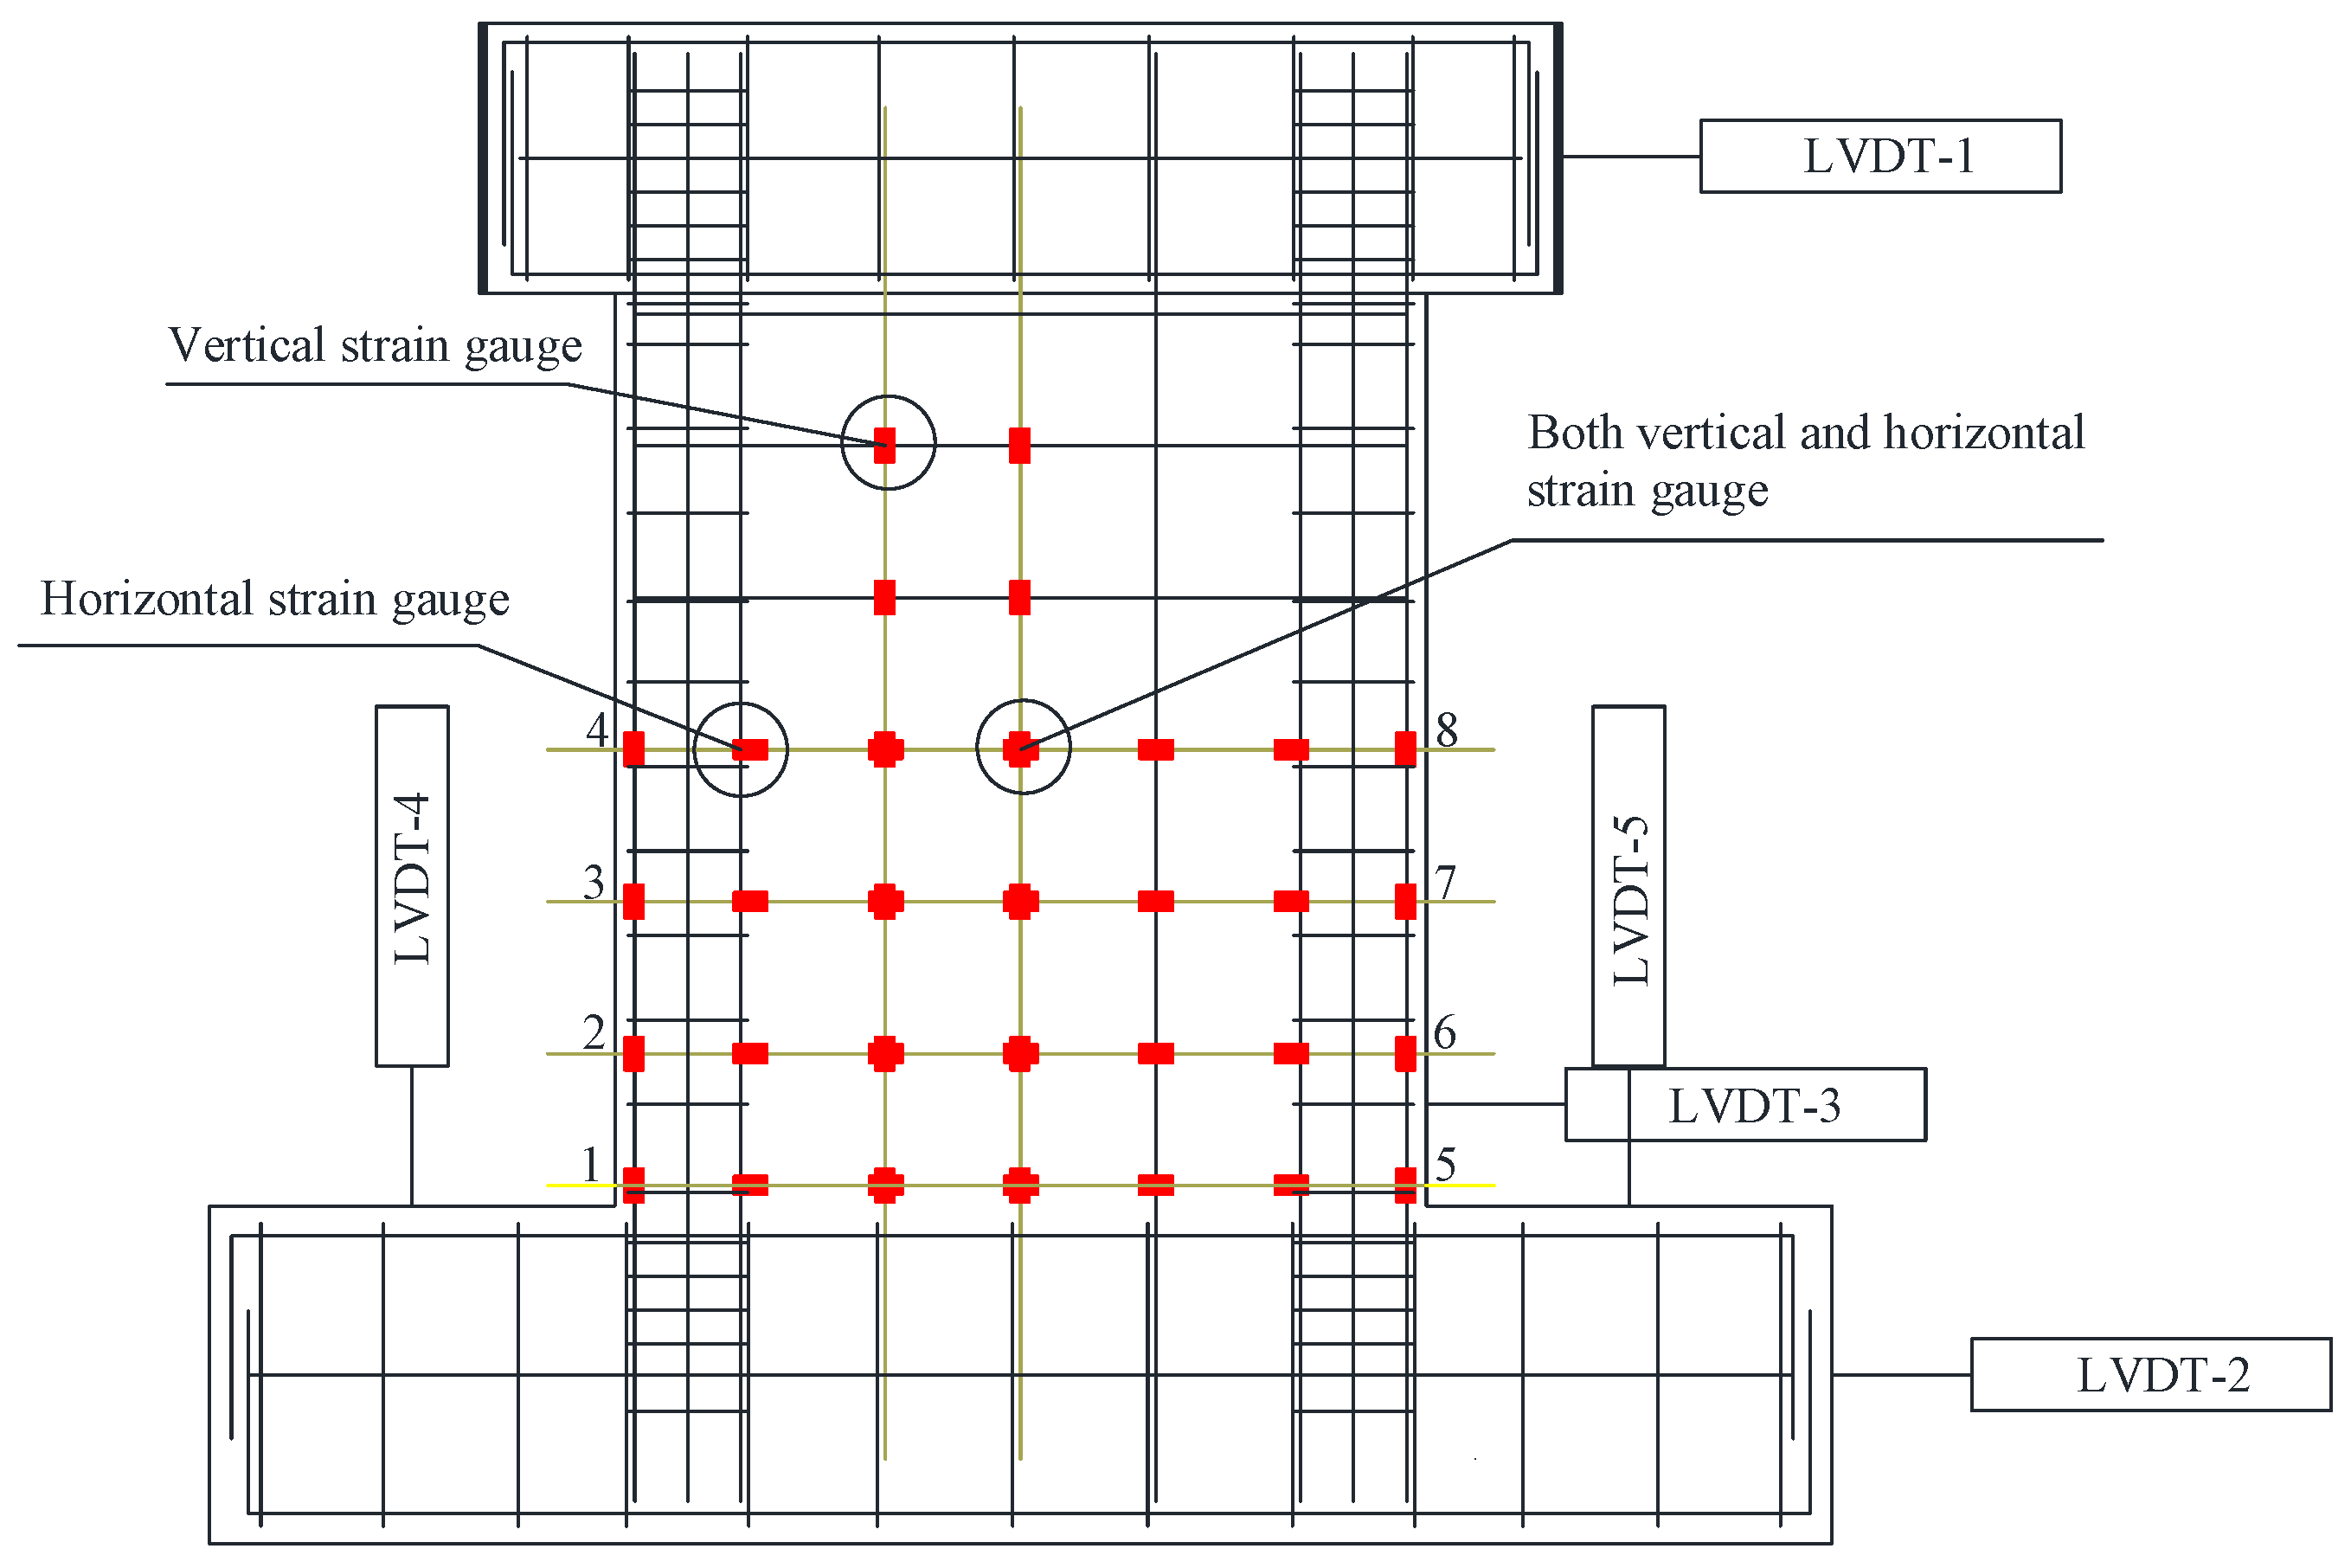
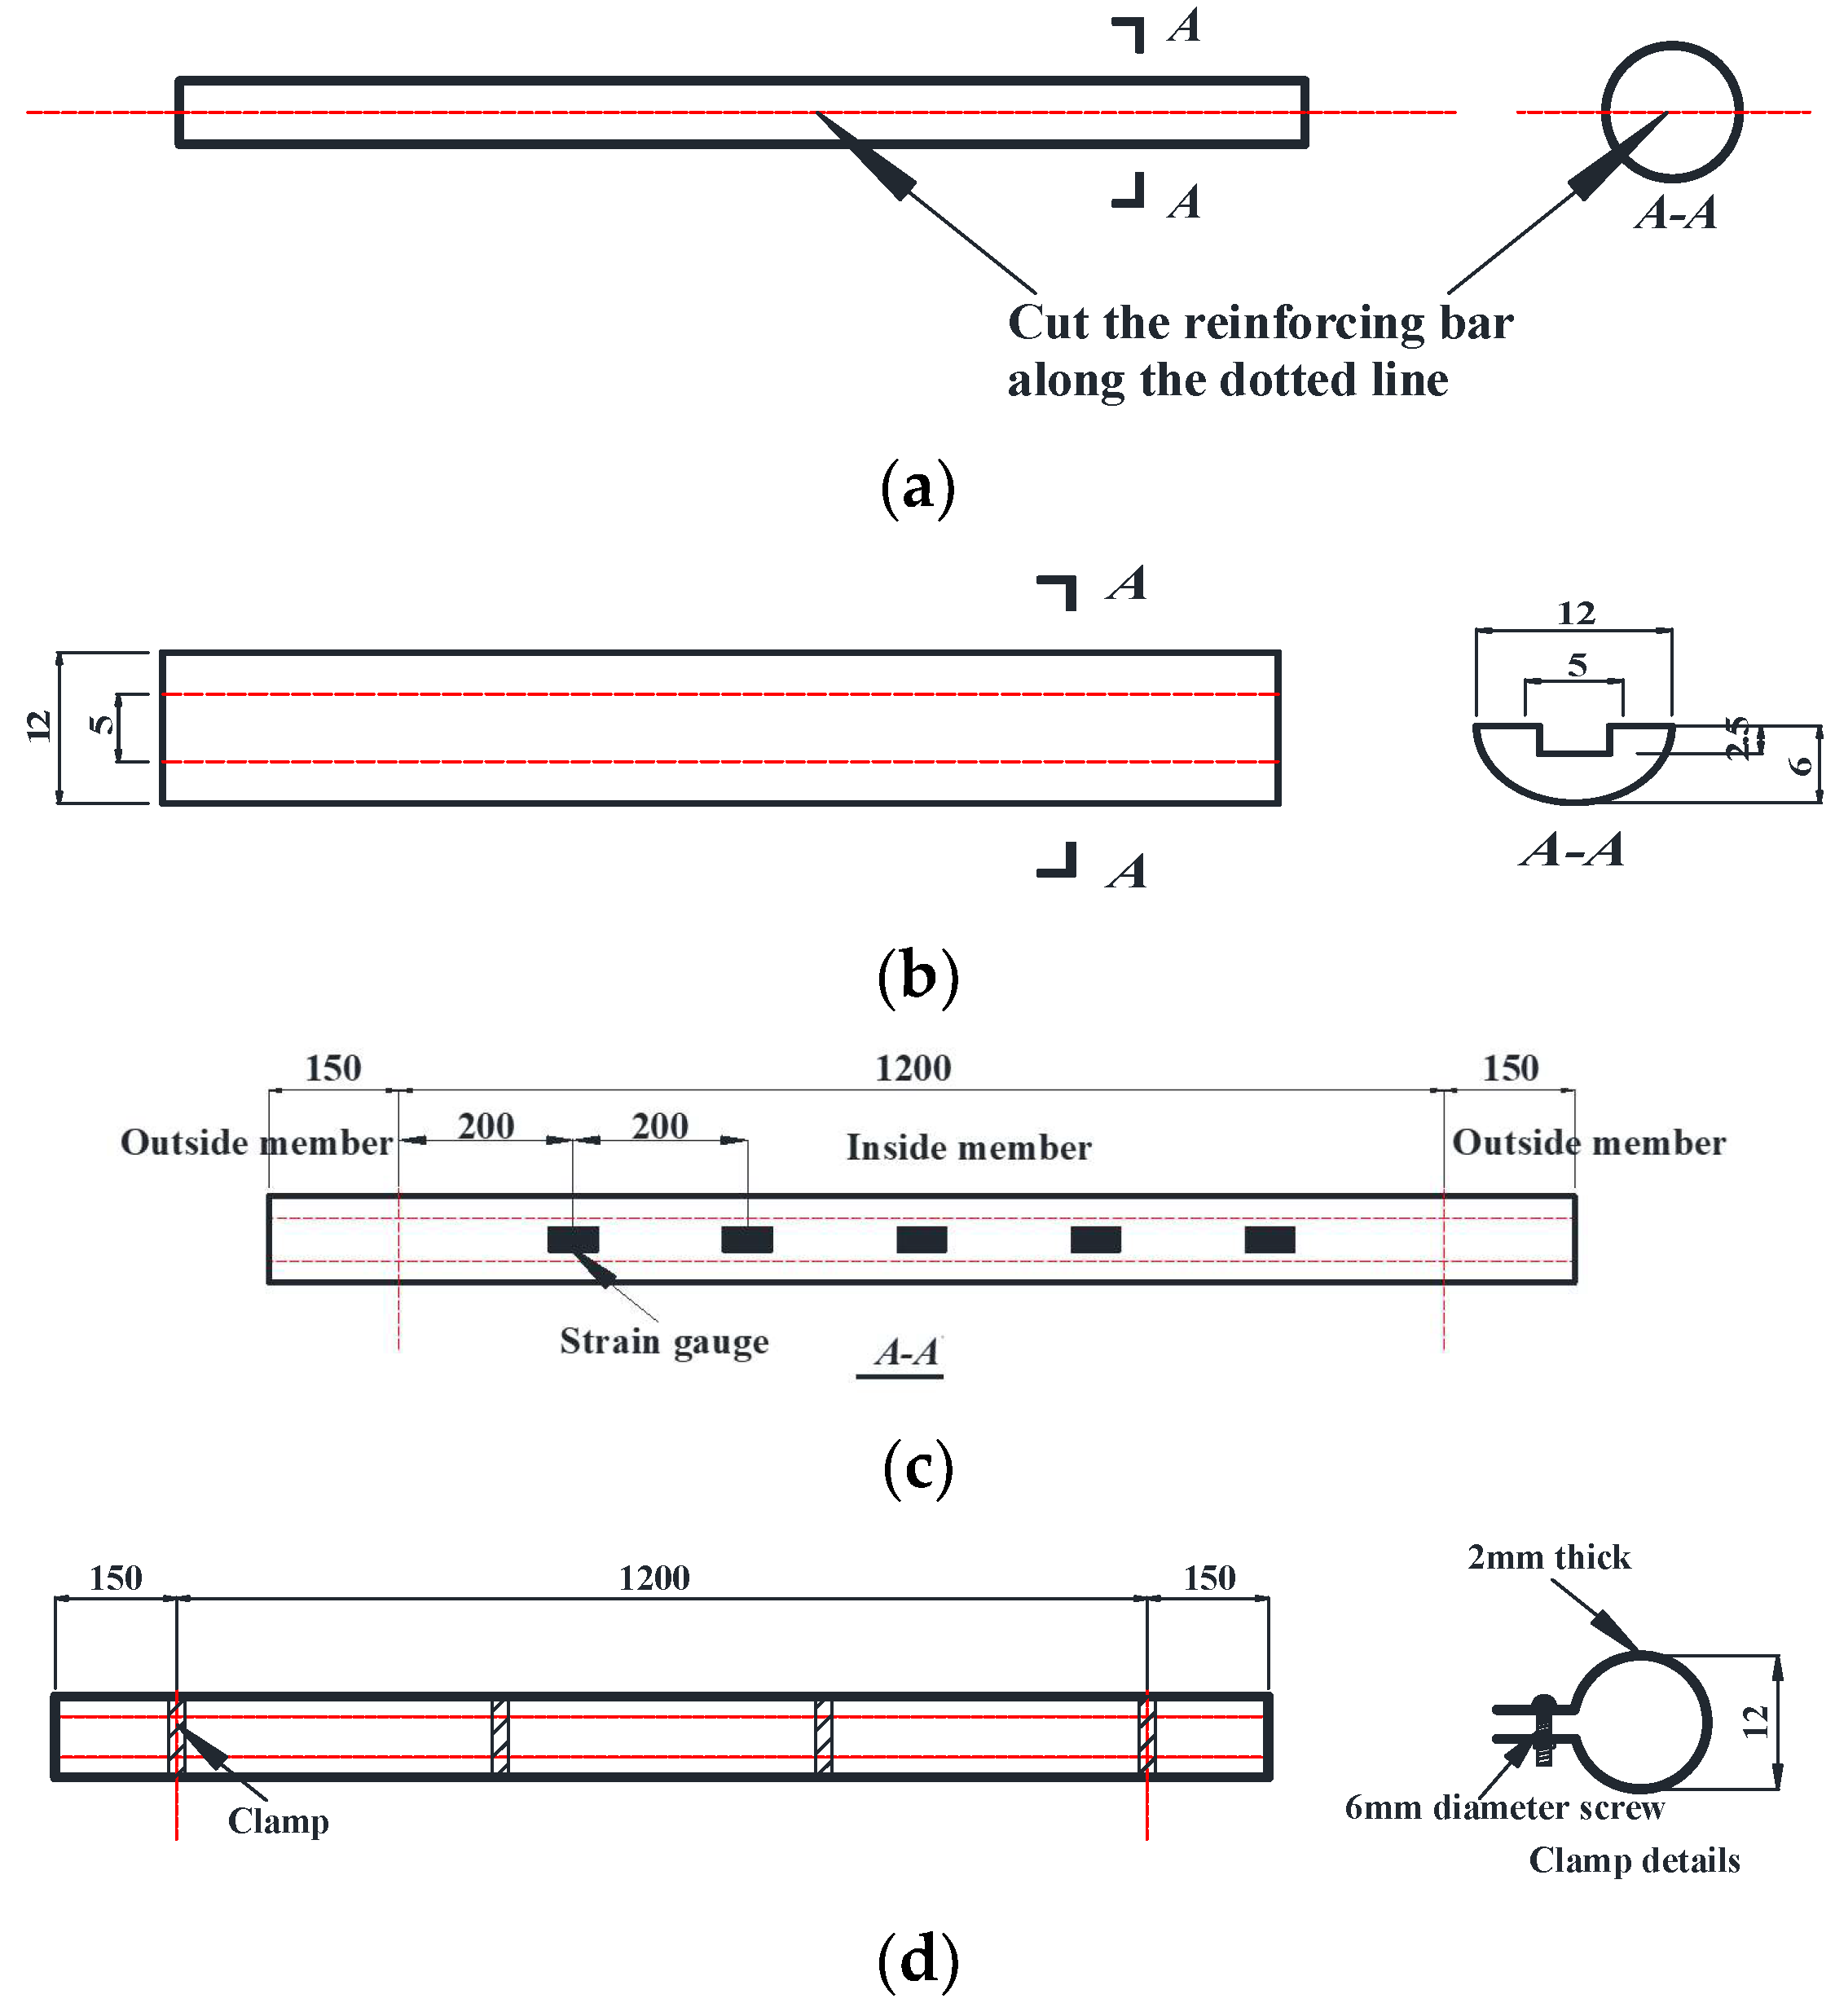
2.3. Instrumentation and Strain Measurement

During the test, displacements were measured by means of linear variable differential transducers (LVDTs), whereas strains of reinforcement were measured by means of strain gauges. The horizontal displacement was measured by two LVDTs with a range of 100 mm placed on the top and bottom of the specimen, respectively. A series of strain gauges were built in the longitudinal and transverse reinforcement. The locations of LVDTs and strain gages are shown in Figure 4. In order to study the contribution of longitudinal and transverse reinforcement to the shear capacity, obtaining the strain of the web reinforcements accurately during the whole loading process become essential important. However, strains are usually influenced by the cracking of concrete and the bonding between the concrete and reinforcement if strain gauges are attached to the surface of the steel bars. Wu et al. [30] has proposed a new strain measurement to solve this problem. In this experiment, a similar method was adopted, and the stain gauges were embedded in the steel bars. The specific method is as follows:
(1)
The steel bar was symmetrically cut along its longitudinal direction into two components and a cavity of 5 mm in width and 2 mm in depth was made at the centre of each half bar, as shown in the Figure 5a,b;
(2)
As depicted in the Figure 5c, 3-mm-width strain gauges were attached in the cavities. The spacing of the strain gauges for the longitudinal and transverse reinforcement were 225 mm and 200 mm, respectively;
(3)
The wires were connected to strain gauges and led out from both end of a bar;
(4)
A thin layer of wax was applied on the surface of the strain gauge to minimize the effects of external factors;
(5)
The two components of the steel bar were glued together by the epoxy resin. Moreover, the cavities were filled by the epoxy resin for the consideration of minimizing effects from external factors;
(6)
As presented in the Figure 5d, before the consolidation of the epoxy resin, four mechanical steel rings were used to fix the component. These rings stayed with the bar permanently to enhance the anchorage.
Figure 4. Locations of LVDTs and strain gauges.
Buildings 13 02104 g004
Figure 5. Manufactural method of built-in strain gauges in the rebars. (a) Step 1. (b) Step 2. (c) Step 3. (d) Step 4.
Buildings 13 02104 g005

3. Experimental Results and Discussion

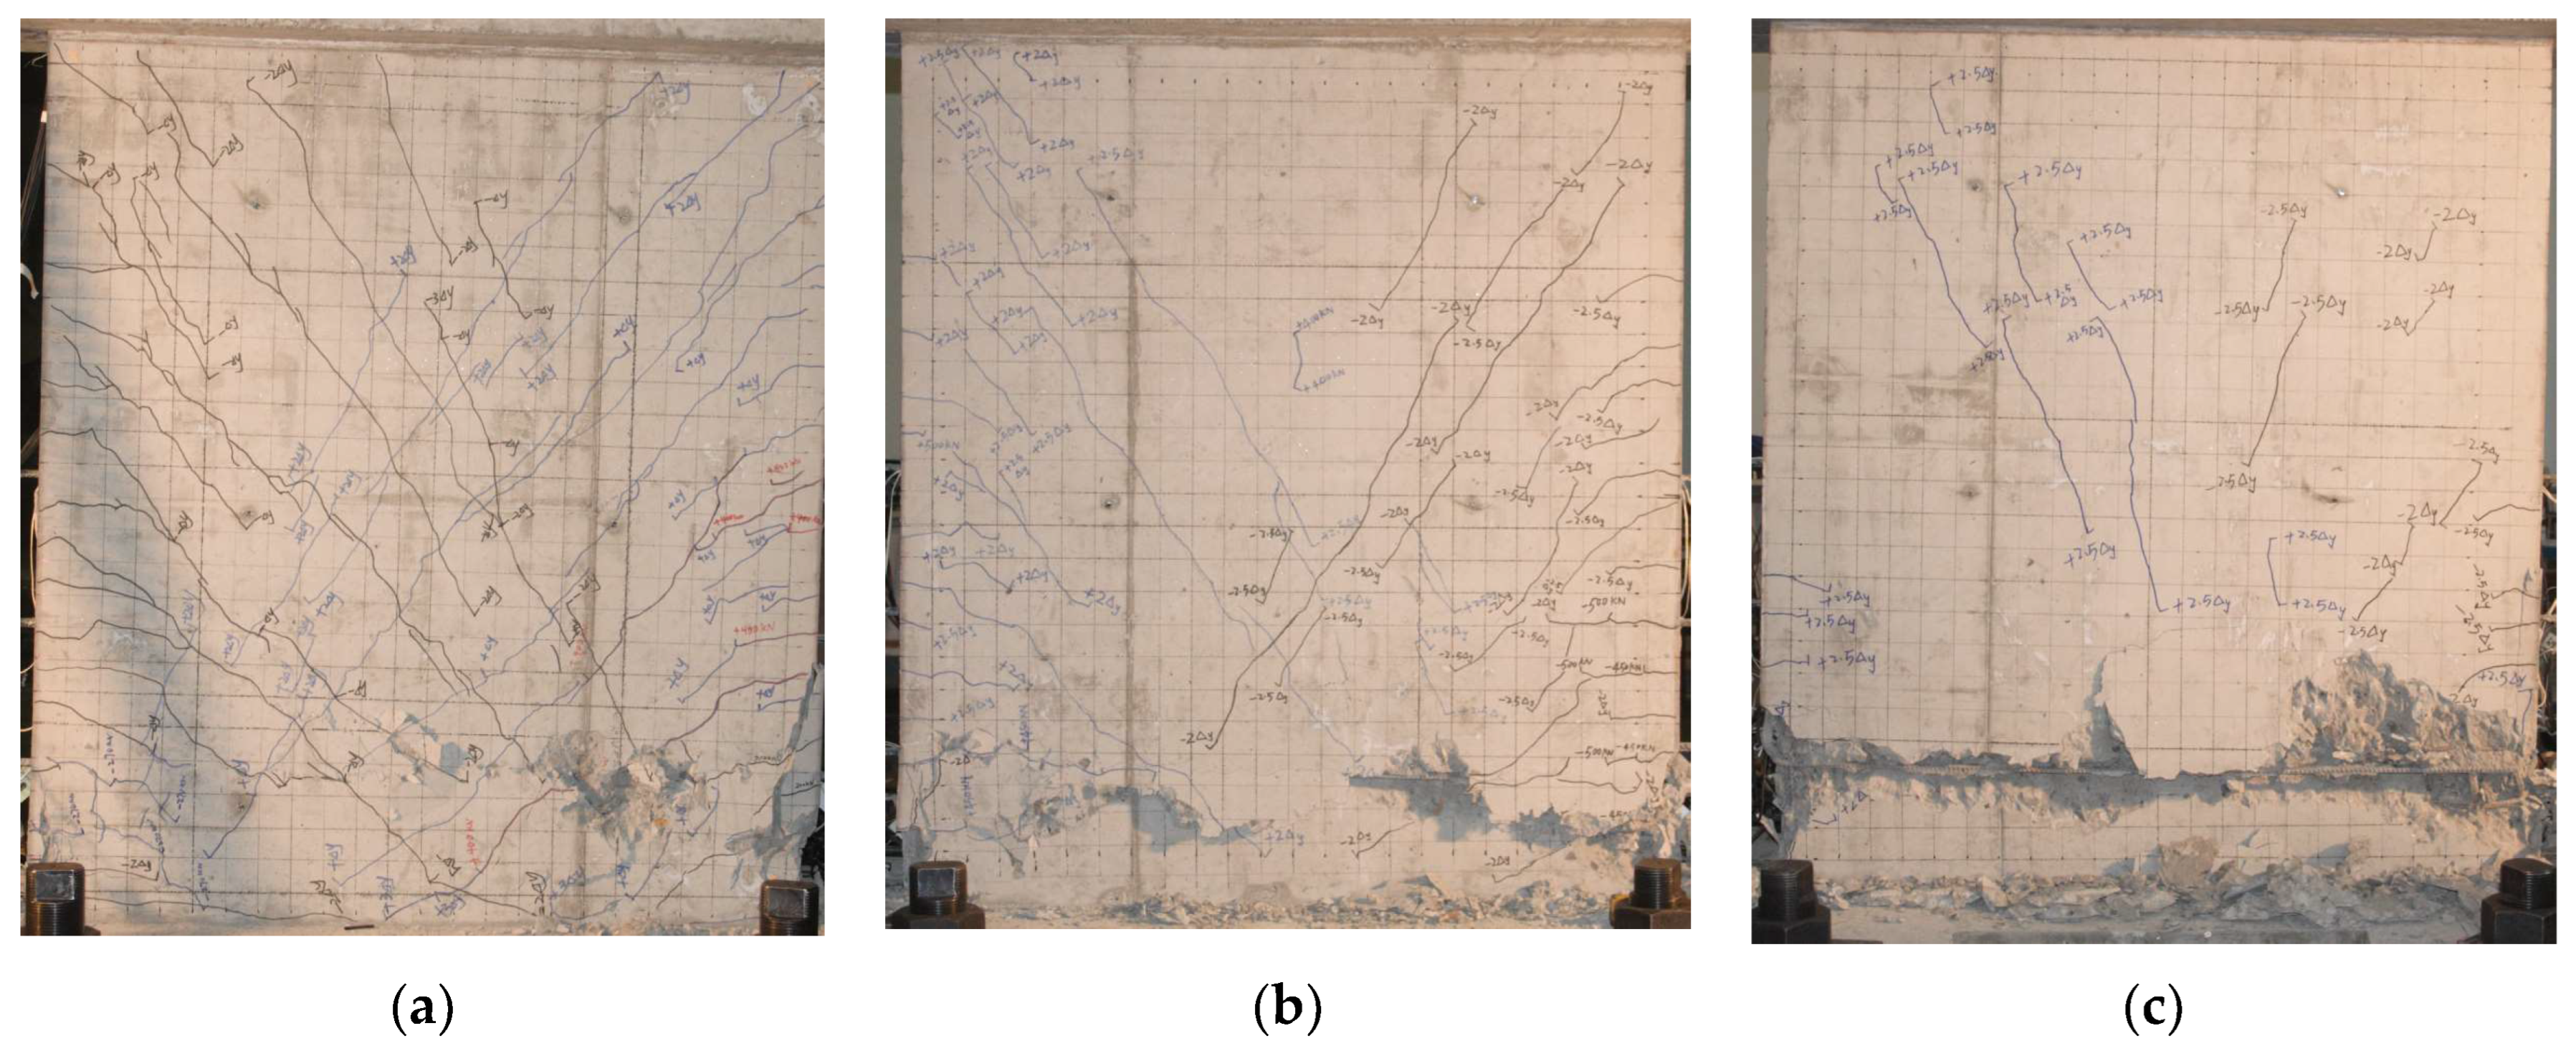
3.1. Crack Patterns and Failure Mode

The specimens were initially in elastic phase and showed a negligible residual deformation. As the lateral force increased, flexural cracks first appeared above the base. The measured shear force leading to initial crack, Vcr, increased with the increment of axial load. The cracking loads were 270 kN, 450 kN and 564 kN for SWC1, SWC2 and SWC3, respectively. The diagonal cracks developed rapidly after the specimen yielded. The critical diagonal crack angles with respect to vertical axis of shear walls were between 25° and 40°, and the angle of the critical diagonal crack became steeper as the ALR increased. With the further increment of lateral displacement, multiple cracks intersected at the neutral axis, which divided the web into several rhombic blocks and formed some compression struts. The number of the cracks decreased with the increase of ALR. The spalling of the concrete cover at the bottom of the shear wall was observed, accompanied by stiffness, gradual degradation and the area loss of the shear compression zone. The shear capacity of the shear wall was mainly provided by concrete before the inclined crack formed, while after the specimen cracked diagonally, both concrete and reinforcement contributed to the shear capacity. The shear capacity increased with the increase of axial compression ratio. The shear bearing capacities of SWC1, SWC2 and SWC3 were 610.2 kN, 676. 1 kN and 690.4 kN, respectively. Concrete crush finally occurred under the combined action of shear and compression. The geometric centre and the stress centre of the section were no longer in the same plane, and out-of-plane buckling occurred due to the high axial load. Figure 6 shows the failure mode for all specimens. Axial load ratio has a significant influence on the failure mode and crack pattern. The horizontal reinforcement reaches the yield strain except the bottom most horizontal reinforcement in SWC1 (n = 0.2), the horizontal reinforcement in the middle part of the web plate reaches the yield strain in SWC2 (n = 0.4) while in SWC3 (n = 0.6) the horizontal reinforcement in the middle of the web did not yield. The increase of ALR delayed the appearance of flexural cracks but made the vertical cracks in the compression zone appear earlier. The smaller the ALR is, the more cracks fully developed. Shear damage occurred in SWC1 and SWC2, due to the high axial compression ratio of SWC2, its shear compression zone damage has a larger area, while the axial compression ratio of 0.6 of the SWC3 member of the full cross-section of the concrete damage is serious, the destruction of the shear wall has occurred in a more serious out-of-plane misalignment sliding for the compression damage. In contrast, as the axial load increased, the concrete crushing became more severe and the failure became more abrupt.

3.2. Hysteresis Loops and Backbone Curves

The hysteresis loops and backbone curves of the three specimens are shown in Figure 7, respectively. Figures show that axial load ratio brought great influences on the hysteresis curves and backbone curves. During the beginning of the test, all the specimens were in elastic stage, and the enveloped area of hysteresis loops almost equalled zero. After the specimen cracked, due to the residual deformation, the hysteresis loops became shuttle shaped. Since high axial load restrained the development of cracks and bond slip between concrete and reinforcements, no significant pinching was observed in the hysteresis loops. By comparing the test results of the specimens with different ALRs, the initial stiffness of SWC2 and SWC3 increased by approximately 12% and 33%, respectively, compared with SWC1, as the ALR increased from 0.2 to 0.4 and 0.6, respectively. There is no obvious yielding point in the backbone curve of all components. The shear strength increased by 11% as the ALR increased from 0.2 to 0.4, whereas the ultimate drift ratio decreased by almost 58%. Meanwhile, the shear strength increased by just 2% and the ultimate drift ratio decreased by 28%, as the ALR increased from 0.4 to 0.6. This indicates that axial load basically improves the shear strength, but extremely high axial load had little influence on the improvement of shear strength. In addition, a higher ALR provided fewer cycles and the failure occurred more suddenly.
The plumpness of hysteretic curve increased as the ALR decreased, which implied that energy dissipation capacity grew with the decrease of ALR. In conclusion, axial load has a positive effect on the shear strength of the shear walls to some extent but a negative effect on the deformation capacity and inelastic properties of the components.

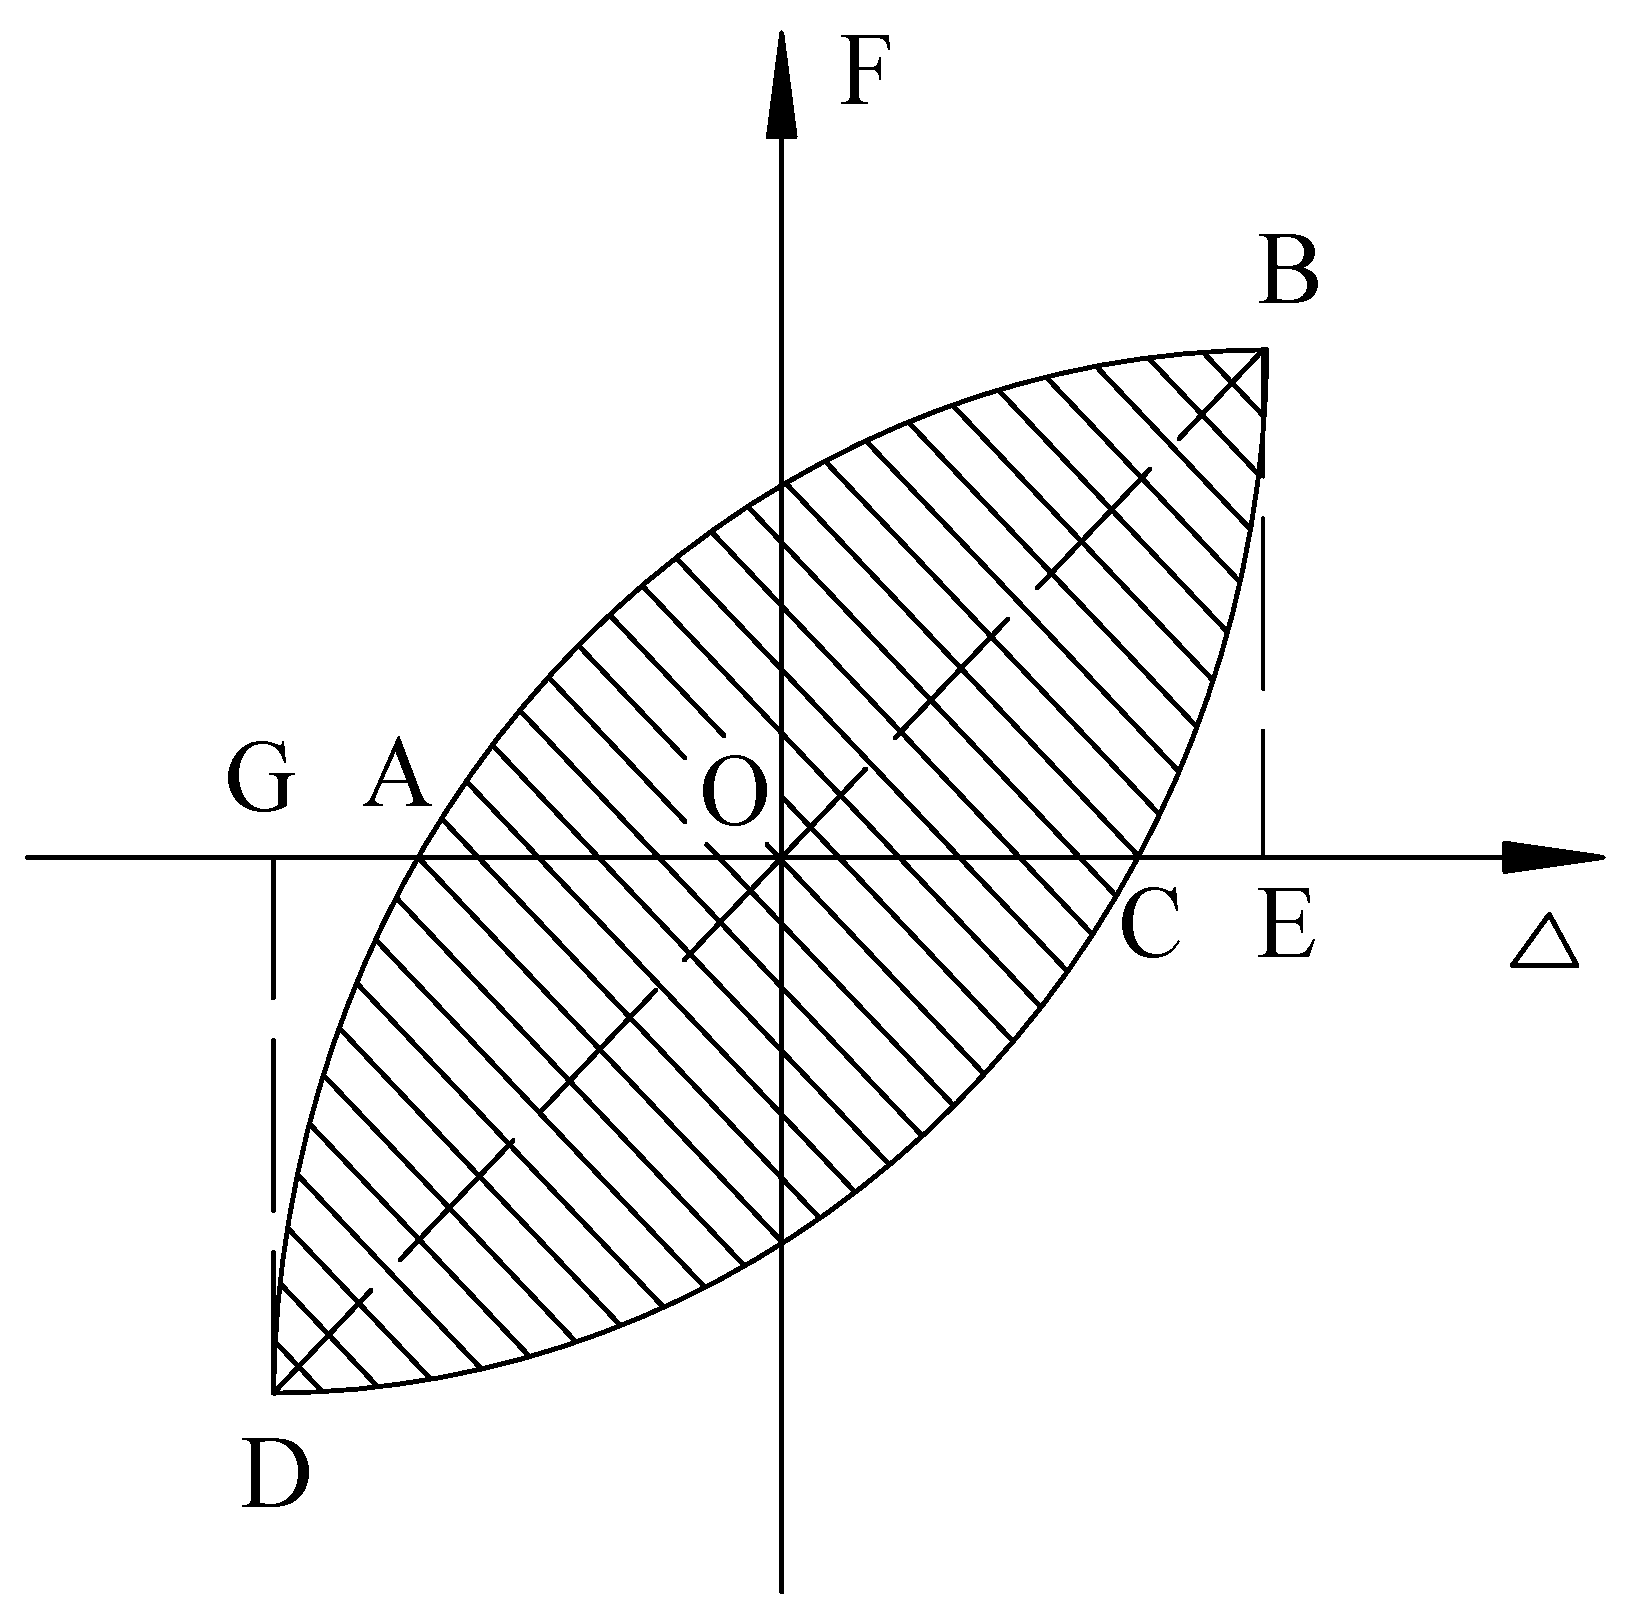
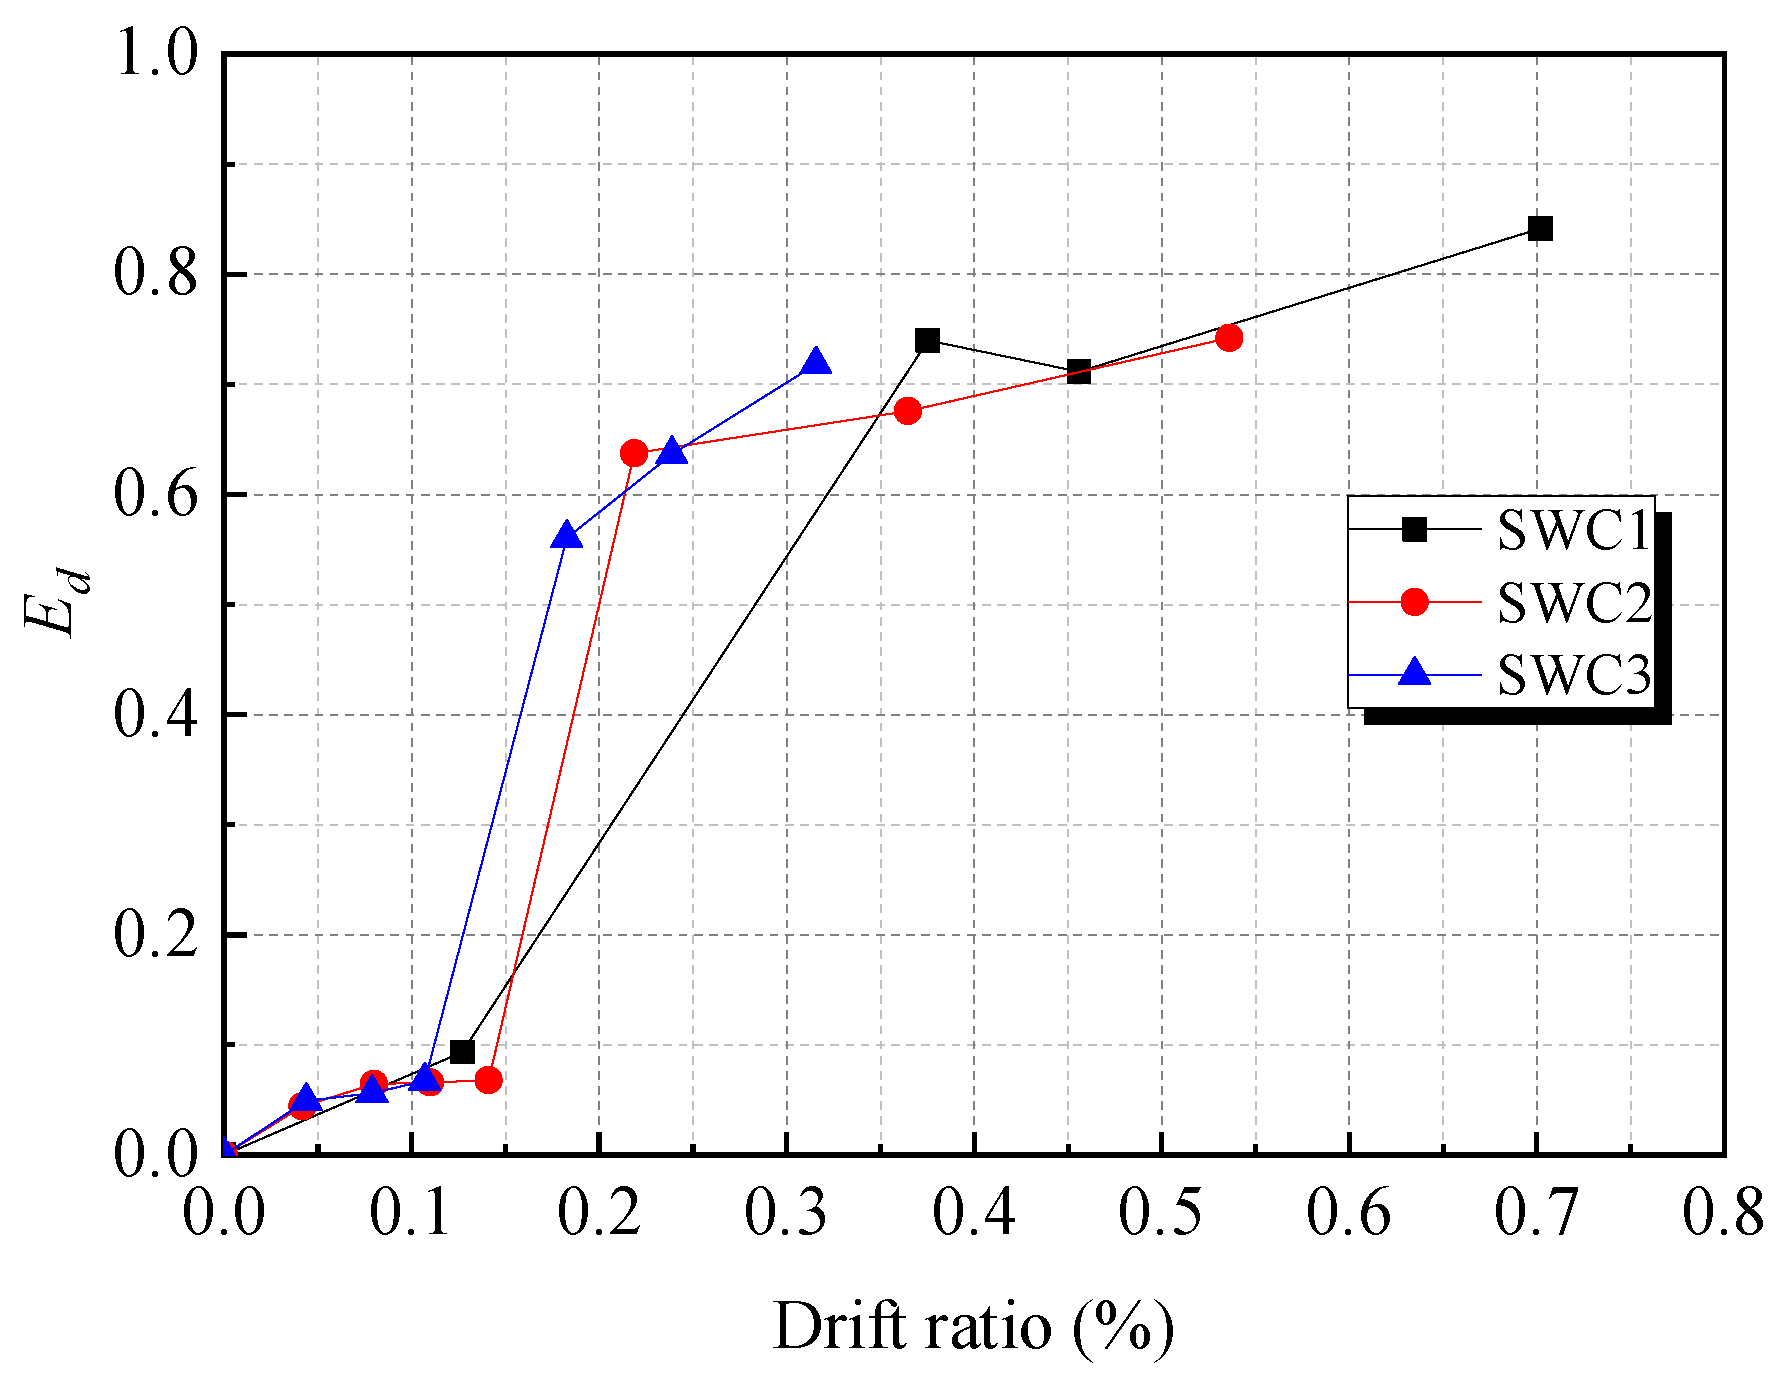
3.3. Ductility and Energy Dissipation

Ductility is an important parameter to measure the plastic deformation capacity of components and structures. To evaluate the ductility of specimens SWC1, SWC2 and SWC3, two main parameters, displacement ductility factor μ and ultimate rotation angle δ, were used in this study.
The displacement ductility factor μ is usually defined as the ratio of the ultimate displacement to yield displacement, while the ultimate rotation angle δ is usually defined as the ratio of the ultimate displacement to the specimen height. The expressions are as follows:
μ Δ = Δ u Δ y
δ u = Δ u H
However, there is no unified definition of yield displacement for shear walls as a result of the inconspicuous yield point. In this experiment, a conventional method proposed by Park et al. [31] was adopted, and the yield displacement Δy was defined as follows: a secant was drawn to intersect the lateral load–displacement curve at 60%Vmax, and this line was extended to the intersection with a horizontal line corresponding to Vmax; then the horizontal ordinate of the intersection was regarded as the yield displacement. For SWC1, the ultimate displacement Δu was taken as the displacement when the remaining capacity dropped to 80% of the maximum applied load, while for other specimens, due to the brittle failure, the ultimate displacement was taken as the displacement corresponding to the maximum applied load. The experiment results are given in Table 2. As presented in Table 2, the SWC1 with ALR = 0.2, exhibited the most ductile behaviour among the specimens tested. The ductility factor decreased from 3.78 to 1.73 as the ALR increased from 0.2 to 0.6. The ultimate rotation angle decreased from 0.013 to 0.005 as the ALR increased from 0.2 to 0.4, and 0.003 as the ALR increased from 0.2 to 0.6.
The energy dissipation of the ith cycle can be assessed by the shaded area (Acun and Sucuoglu 2012) in Figure 8. The plumper the hysteresis loop is, the better the energy dissipation is. Energy dissipation coefficient, Ed, was defined and calculated with the following expression:
E d = S A B C + C D A S O B E + O D G
The Ed of each specimen under different drift ratio is shown in Figure 9. In the case of specimen SWC1, the energy dissipation was neglectable when it stayed in the elastic stage under loading. After cracking (δ = 0.12%), plastic deformation can be observed according to the hysteresis curve, and the energy dissipation increased rapidly. No reduction in Ed was observed, since a pinching effect was avoided under high axial loading. The maximum value of Ed of specimen SWC1 was 13% greater than that of specimen SWC2, and 24% greater than that of specimen SWC3, which indicated that higher energy dissipation was obtained for the specimens with lower axial load ratio, because of the descent of plastic rotation capacity.

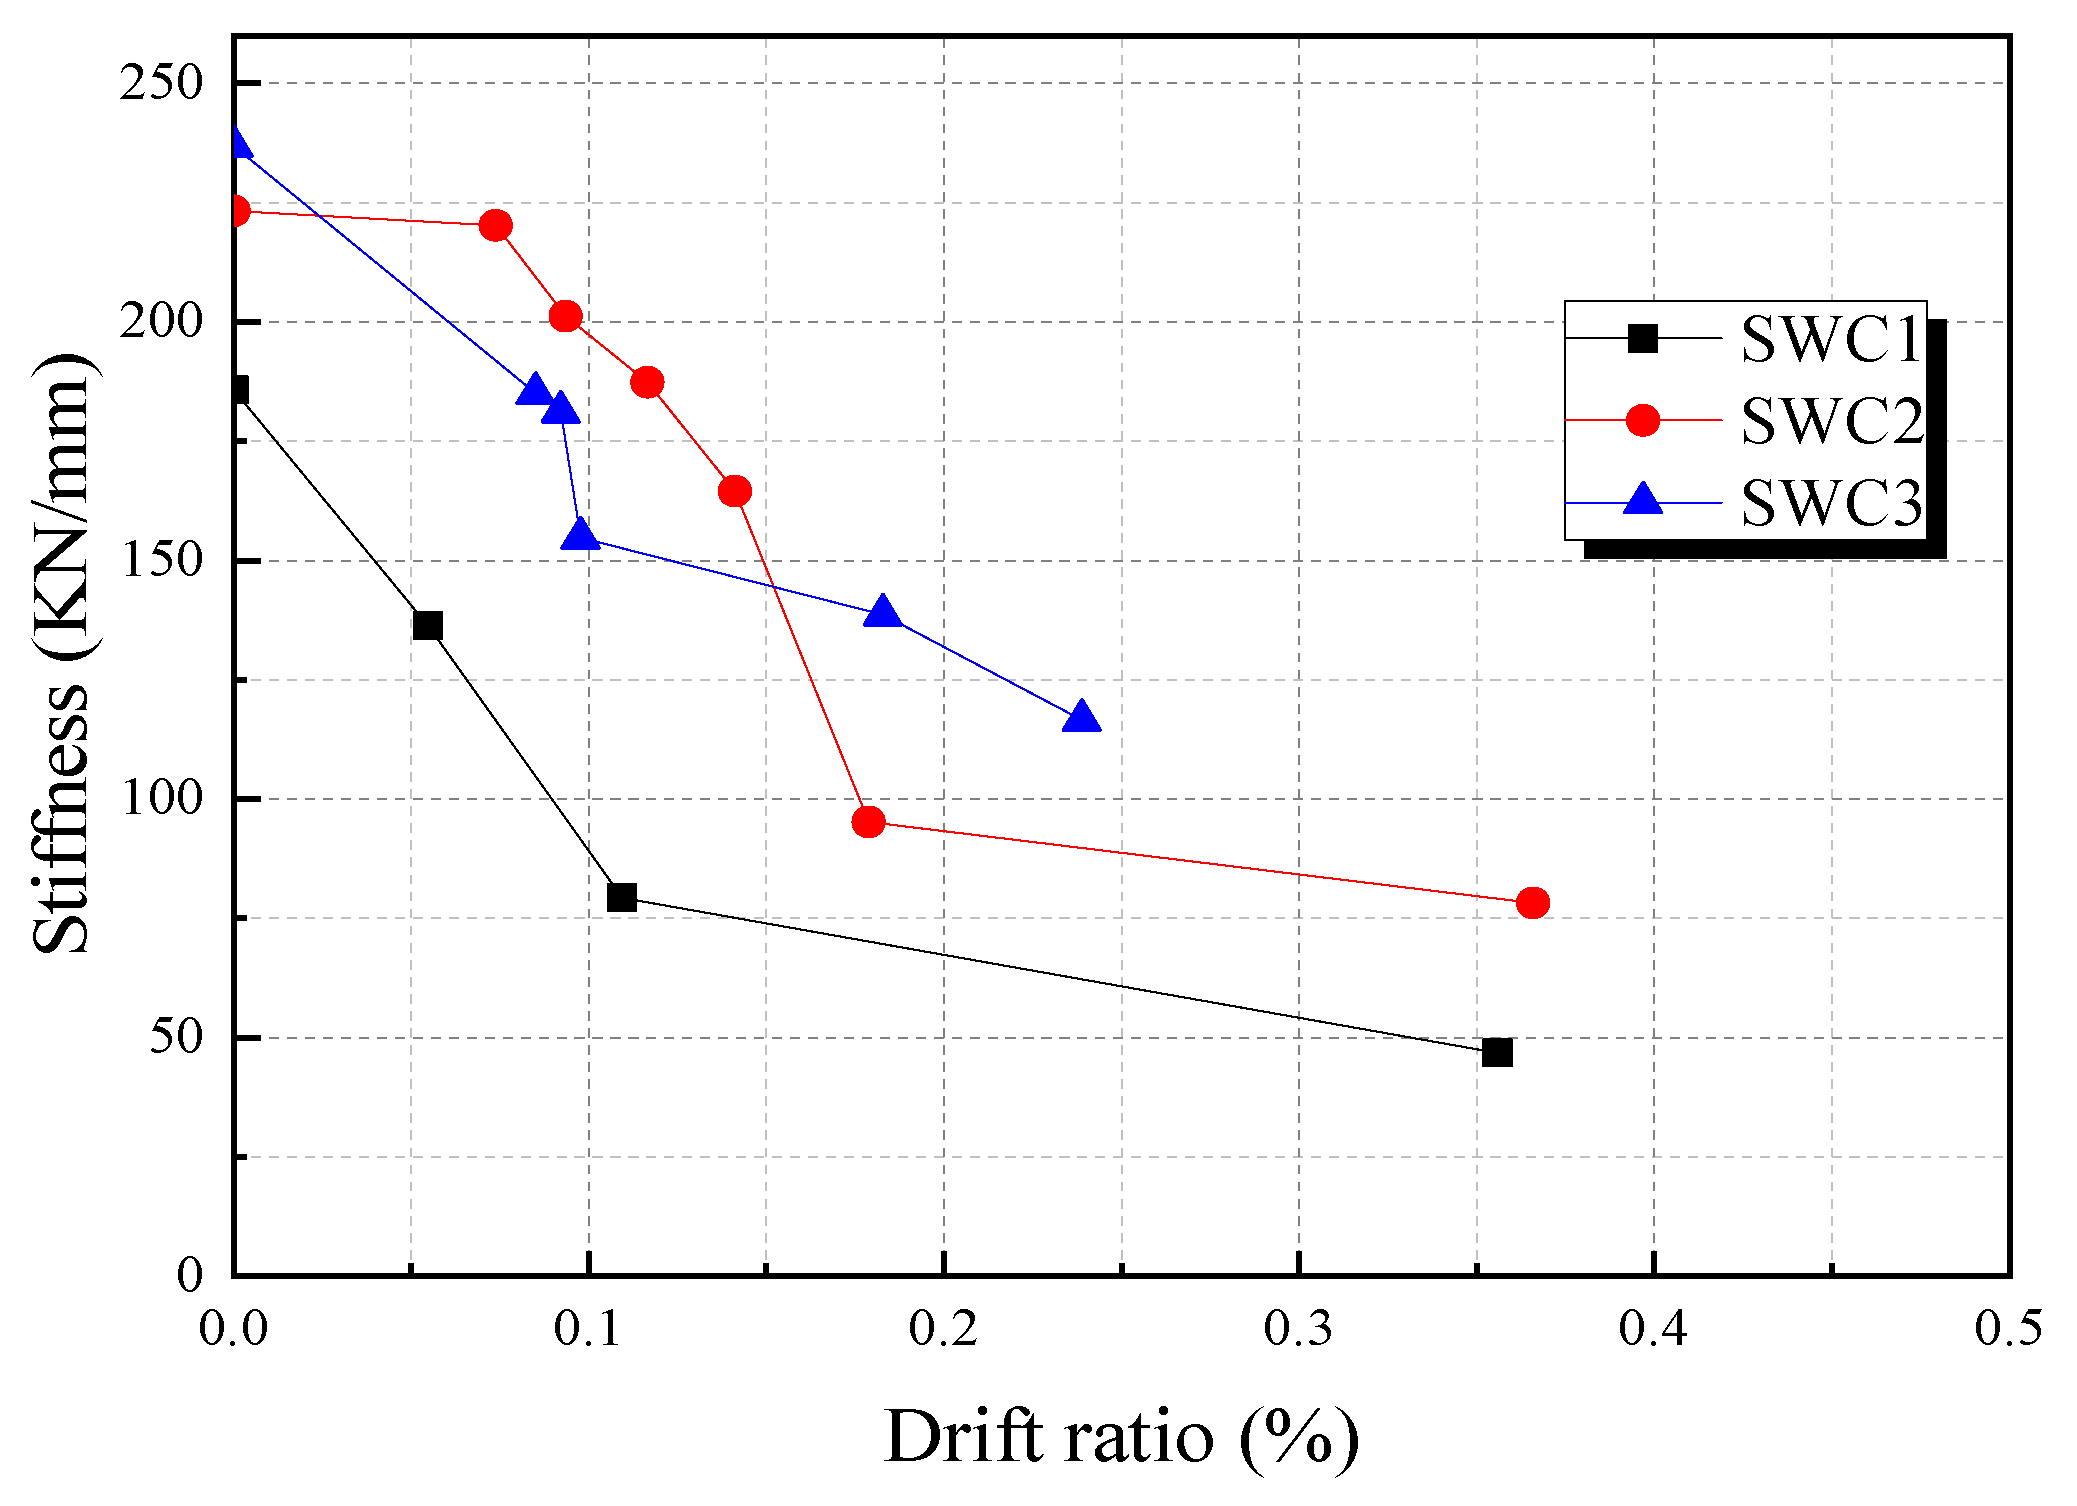
3.4. Stiffness Degradation

Concrete cracking, longitudinal and transverse reinforcement yielding, bond slipping and concrete crushing gradually caused the stiffness degradation of specimens. Stiffness degradation is defined in this paper as the slope of the line joining the peaks of the shear-displacement curve for a given cycle, and can be calculated with the following equation:
K i = ( + V i + V i ) ( + Δ i + Δ i )
The stiffness degradation of each specimen is shown in Figure 10. A higher ALR is associated with higher value of initial stiffness, and the stiffness degradation was little before the specimens cracked. After the specimen yielded, the rate of stiffness degradation increased rapidly. Specimen SWC1 with ALR of 0.2, showed a stable rate of stiffness degradation, while specimen SWC3 with ALR of 0.6, showed a sharp decrease of stiffness, because a high axial load ratio caused a severe spalling of concrete cover, which induced a more abrupt loss in stiffness.

3.5. Strain Analysis

The stress state of specimens can be directly detected by the strain gauges attached to the reinforcement. The strain variation and distribution of longitudinal and transverse reinforcement have been studied, in order to better understand the stress state of the shear wall during the whole loading process.

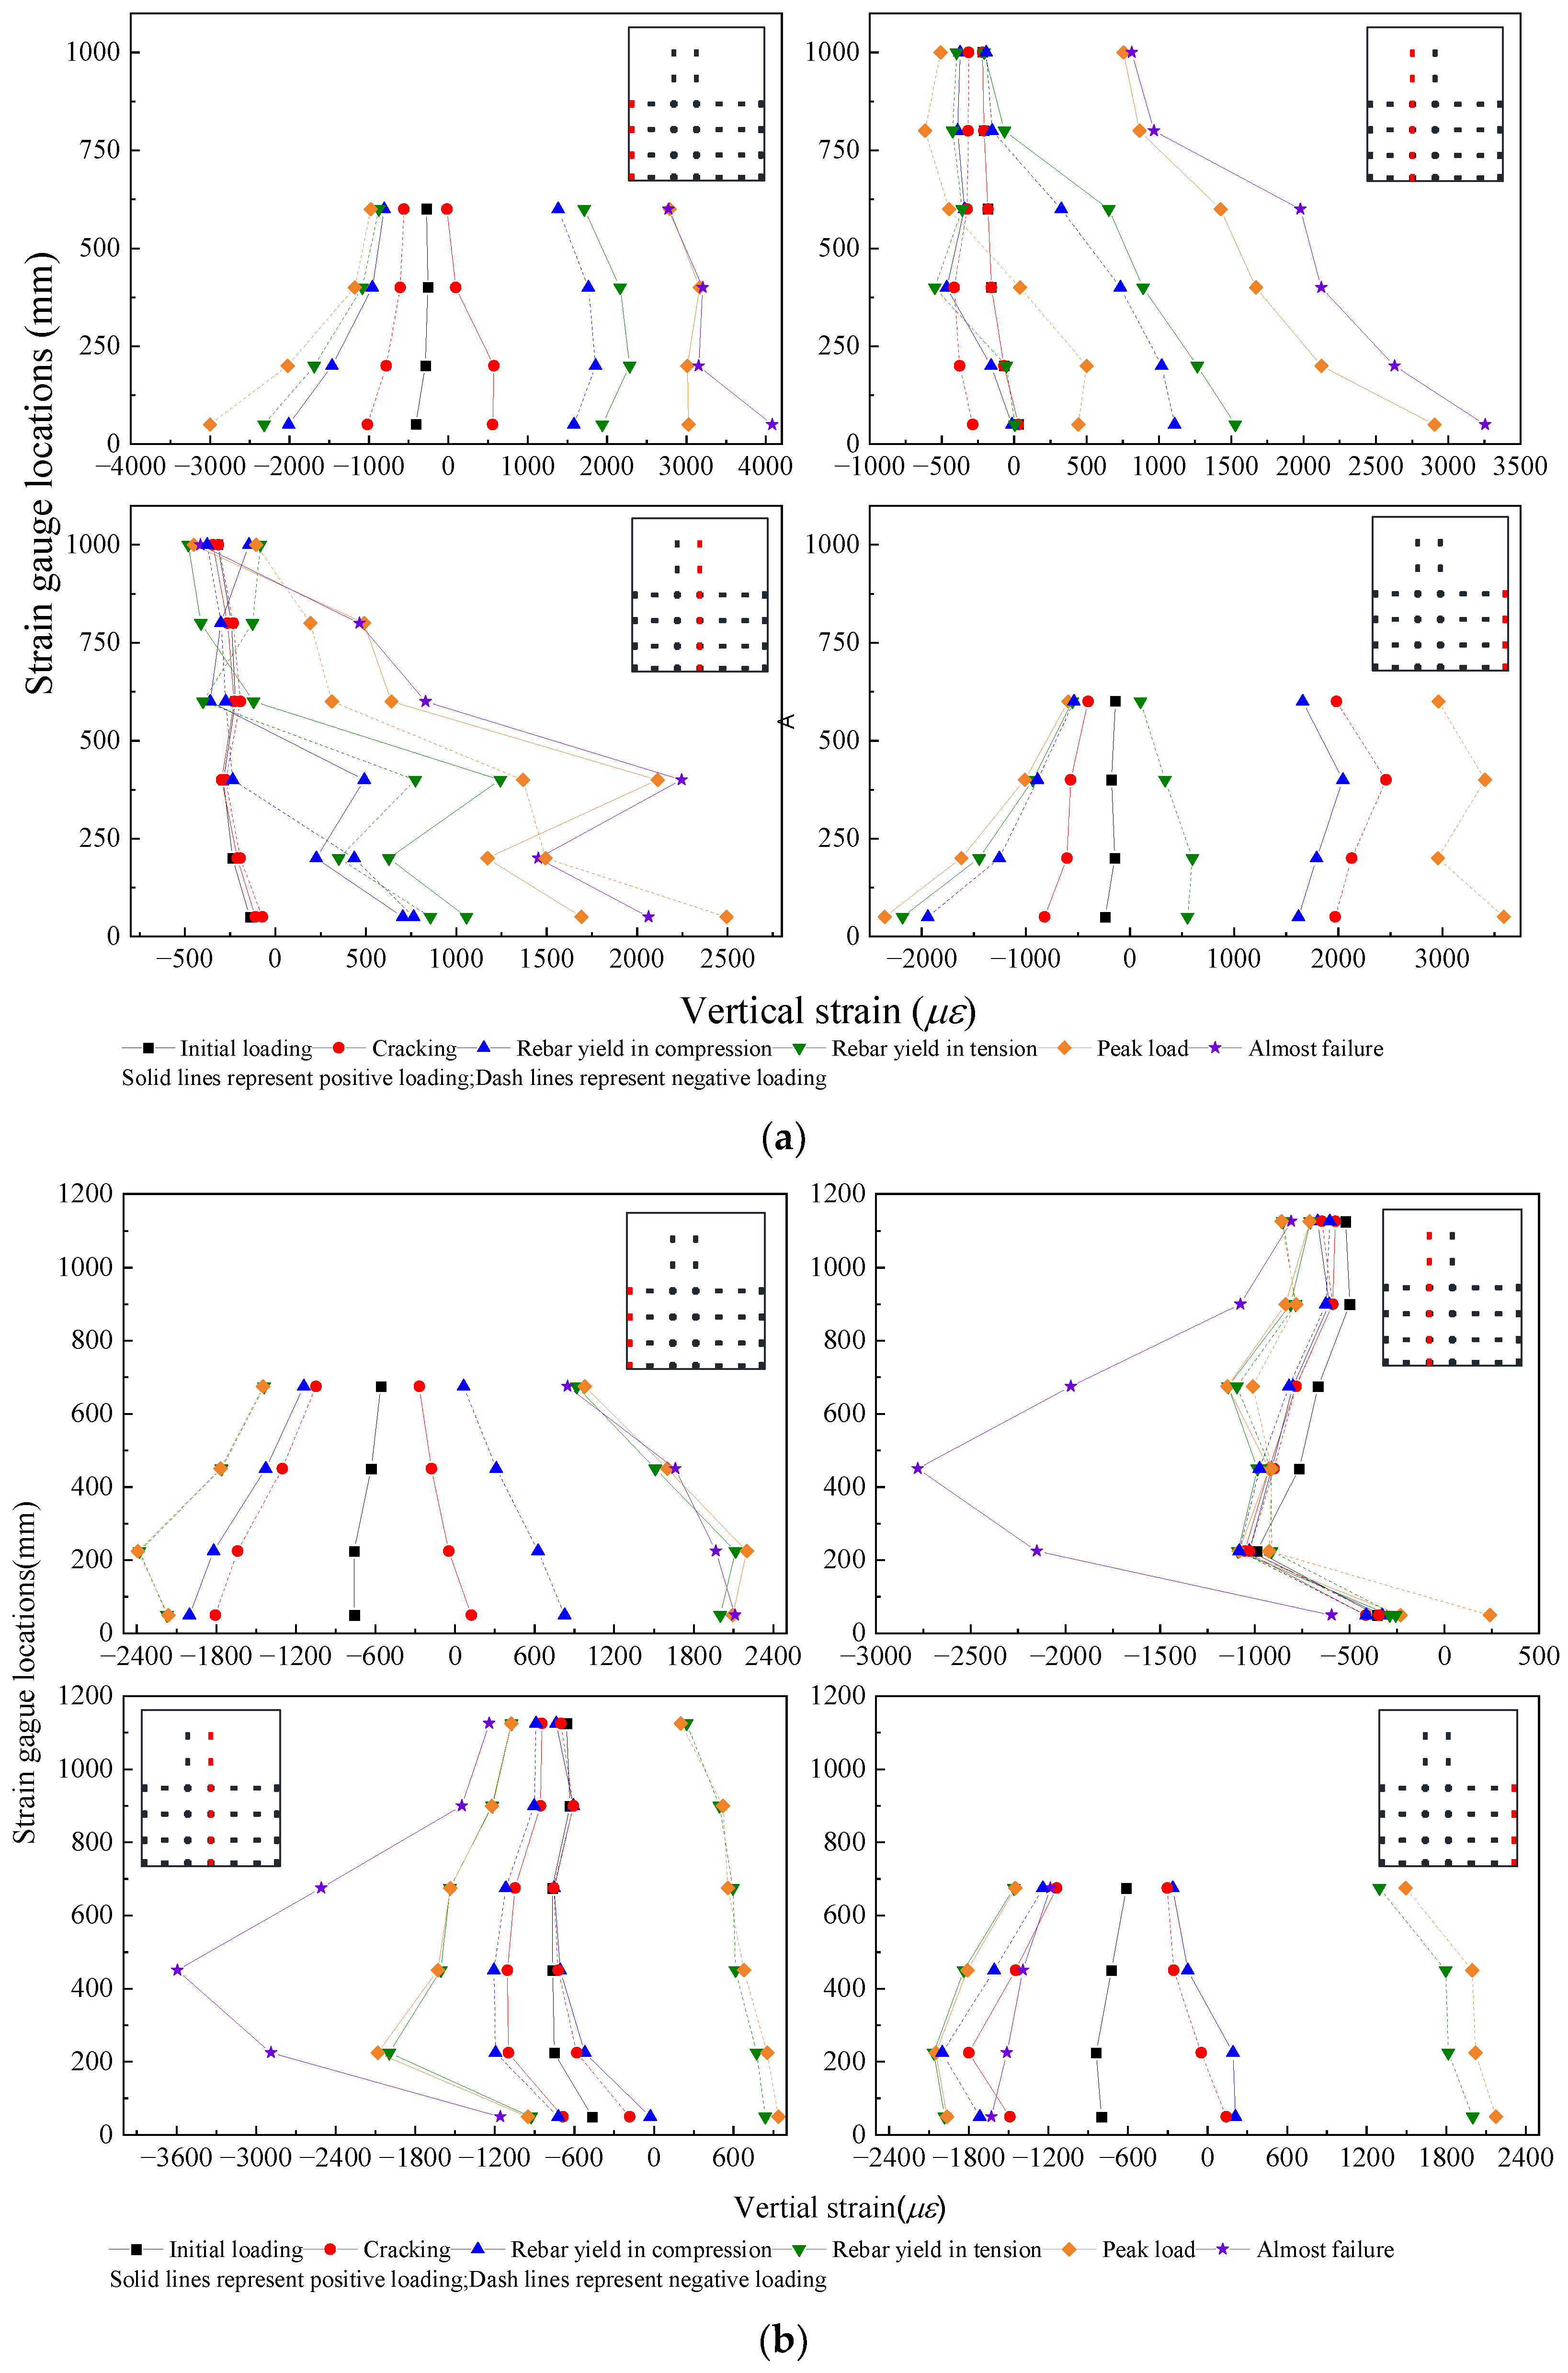
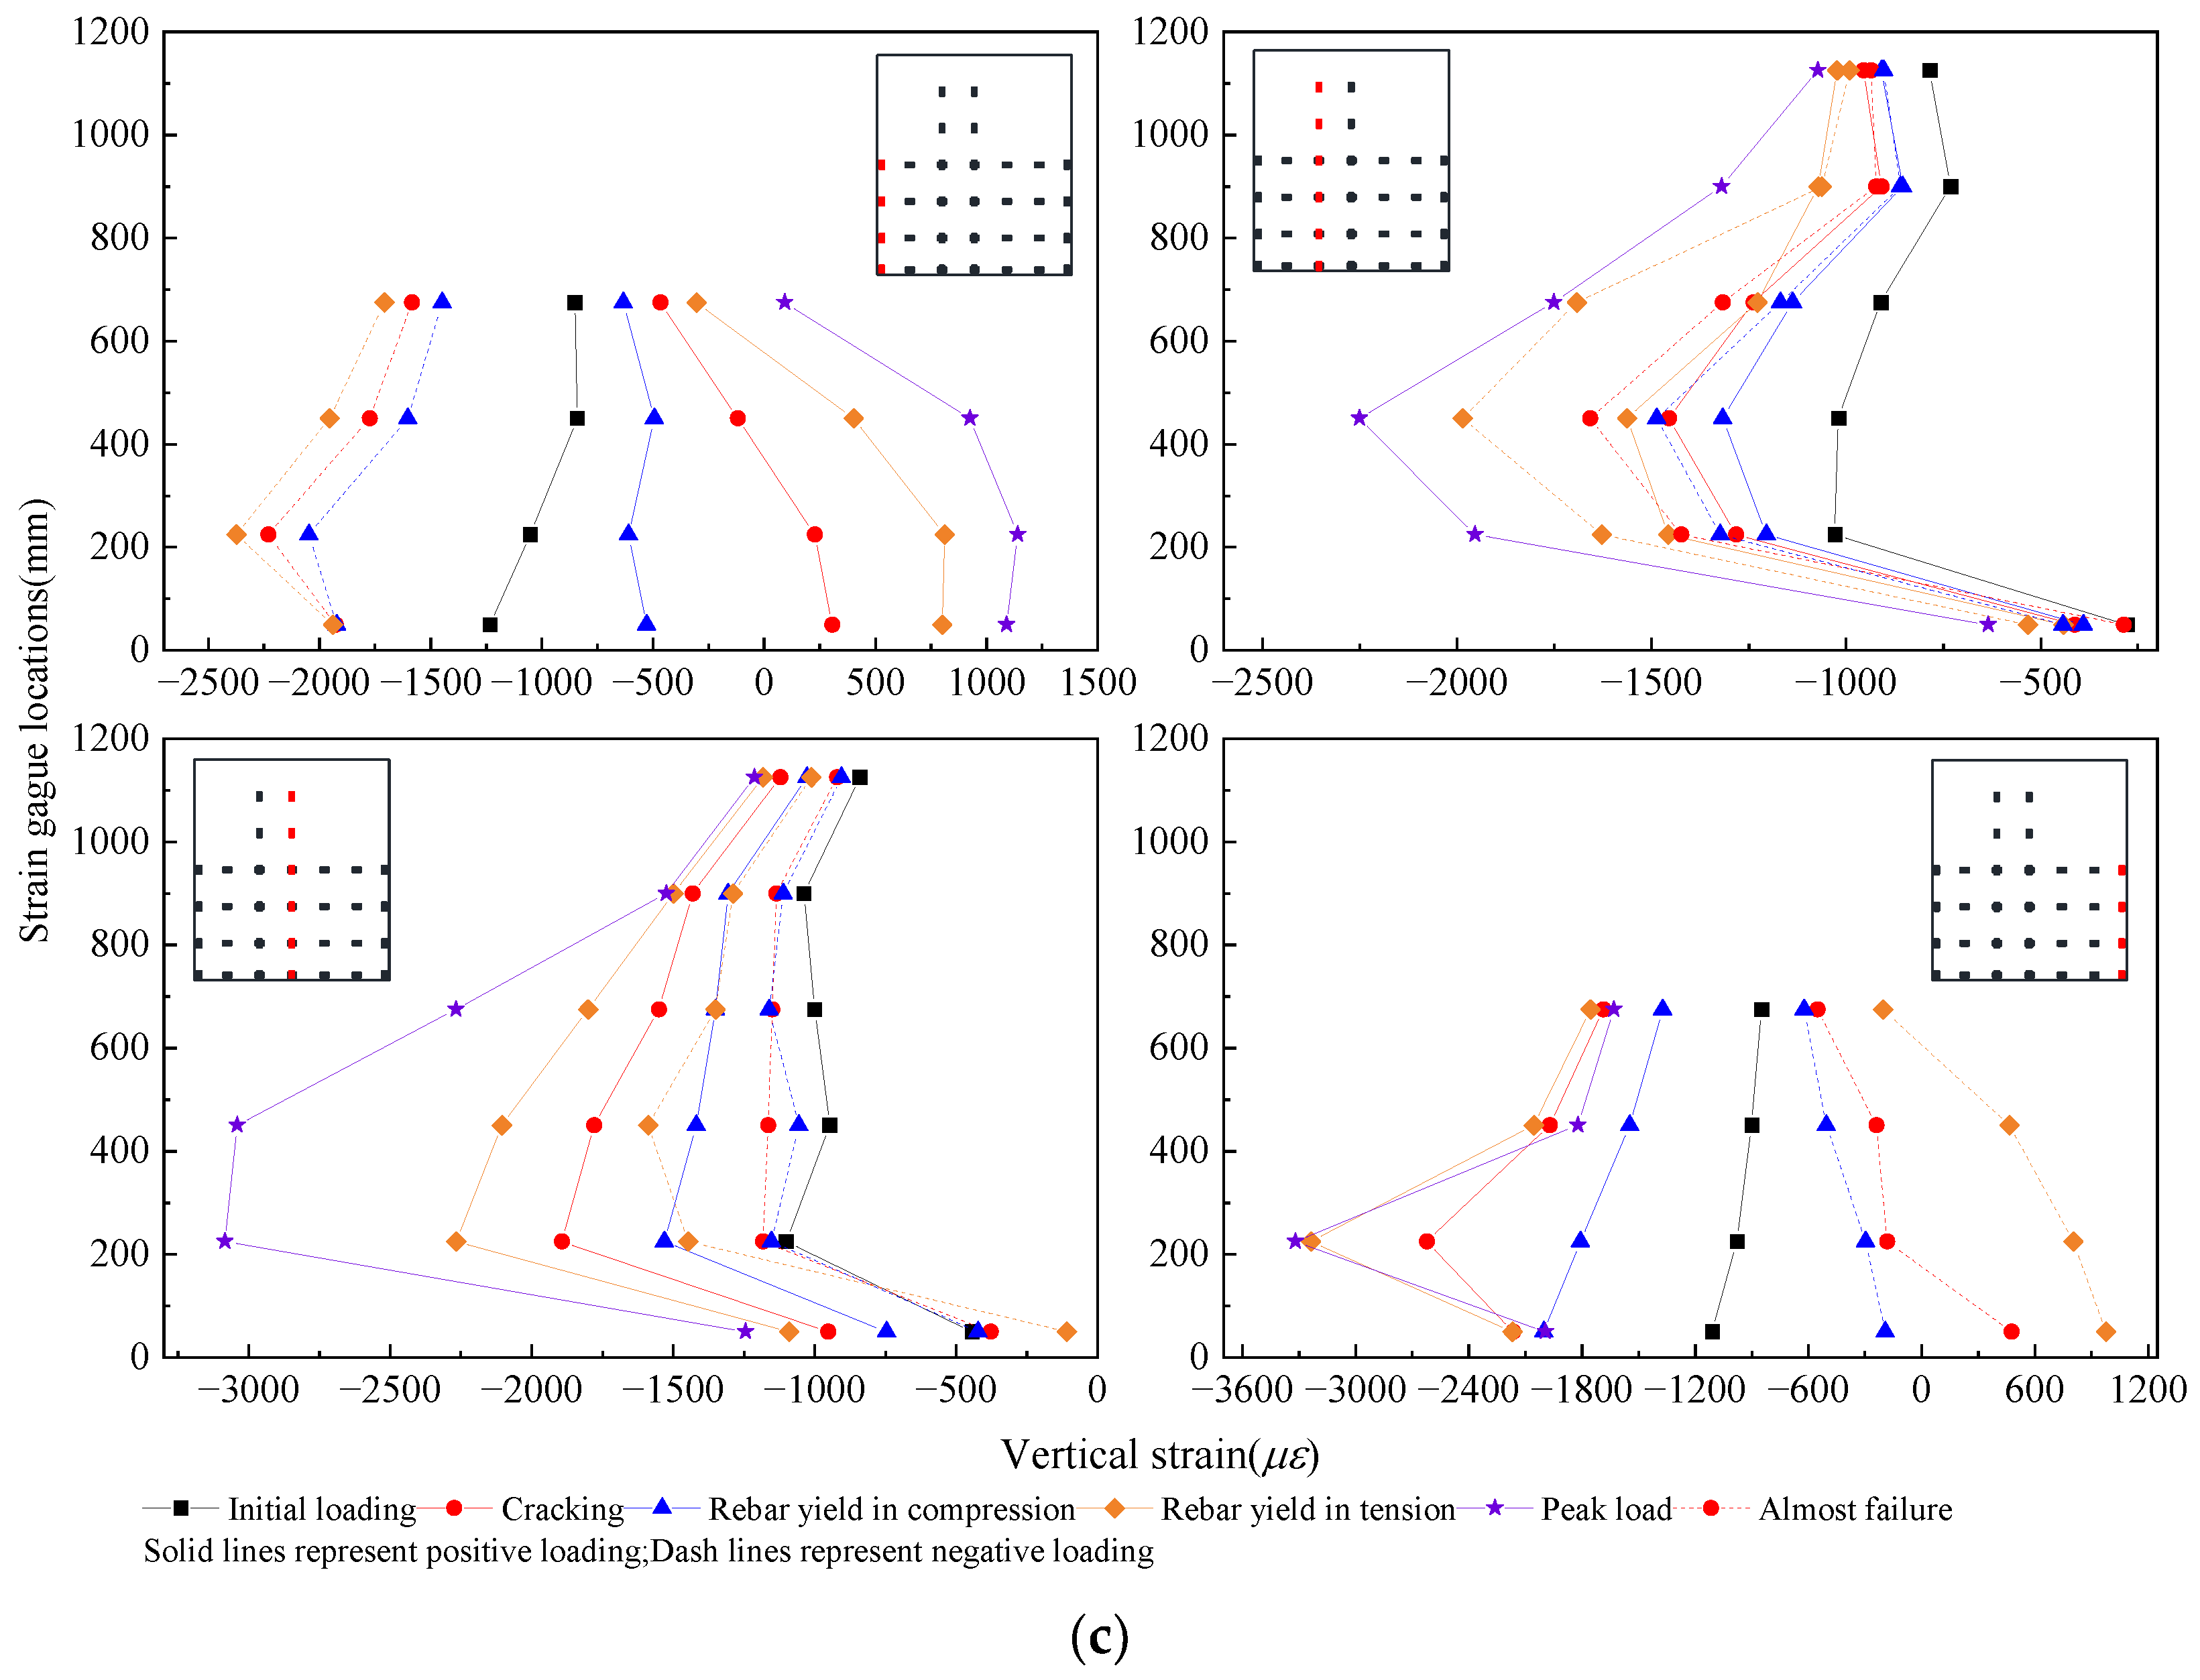
3.5.1. The Strains in Vertical Reinforcements

Figure 11 shows the distribution of vertical strains along the depth of the section at bottom end of the shear walls varying with the loading phases. Due to the axial compression, the whole section of all specimens was under compression at the beginning. The strains in compressive zone increased as the applied shear grew, while the strains in tensile zone decreased and turned from compression to tension. The strain along the sectional depth distributed linearly before yielding. After the specimen yielded, for SWC1, the strain distribution deviated from straight line very slightly, while for SWC2 and SWC3, the strain distribution always kept in a straight line during the whole loading process. Therefore, plane-section assumption was coincident approximately for the shear walls under high ALR during the loading process. The depth of compression zone, when the specimen reached its loading capacity, was larger for specimens with higher axial load. For SWC1, SWC2 and SWC3, the depths of compression zone were about 1/3, 1/2 and 2/3 of the depth of the section, respectively.
Figure 12 shows the variation and distribution of vertical strain along the height of the specimens. Under initial loading, the whole cross-sections of all specimens were in compression. As the applied force rose, the vertical reinforcing bars closest to the edge of specimens began to yield from the bottom. Then, the range of yielded reinforcements expanded continuously. When the specimens reached their loading capacity, for SWC1 and SWC2, the heights of yield reinforcement were about 675 mm and 450 mm away from the bottom of specimens, respectively. However, due to the extremely high axial load, all longitudinal reinforcements in SWC3 did not yield in tension until the specimen failed.

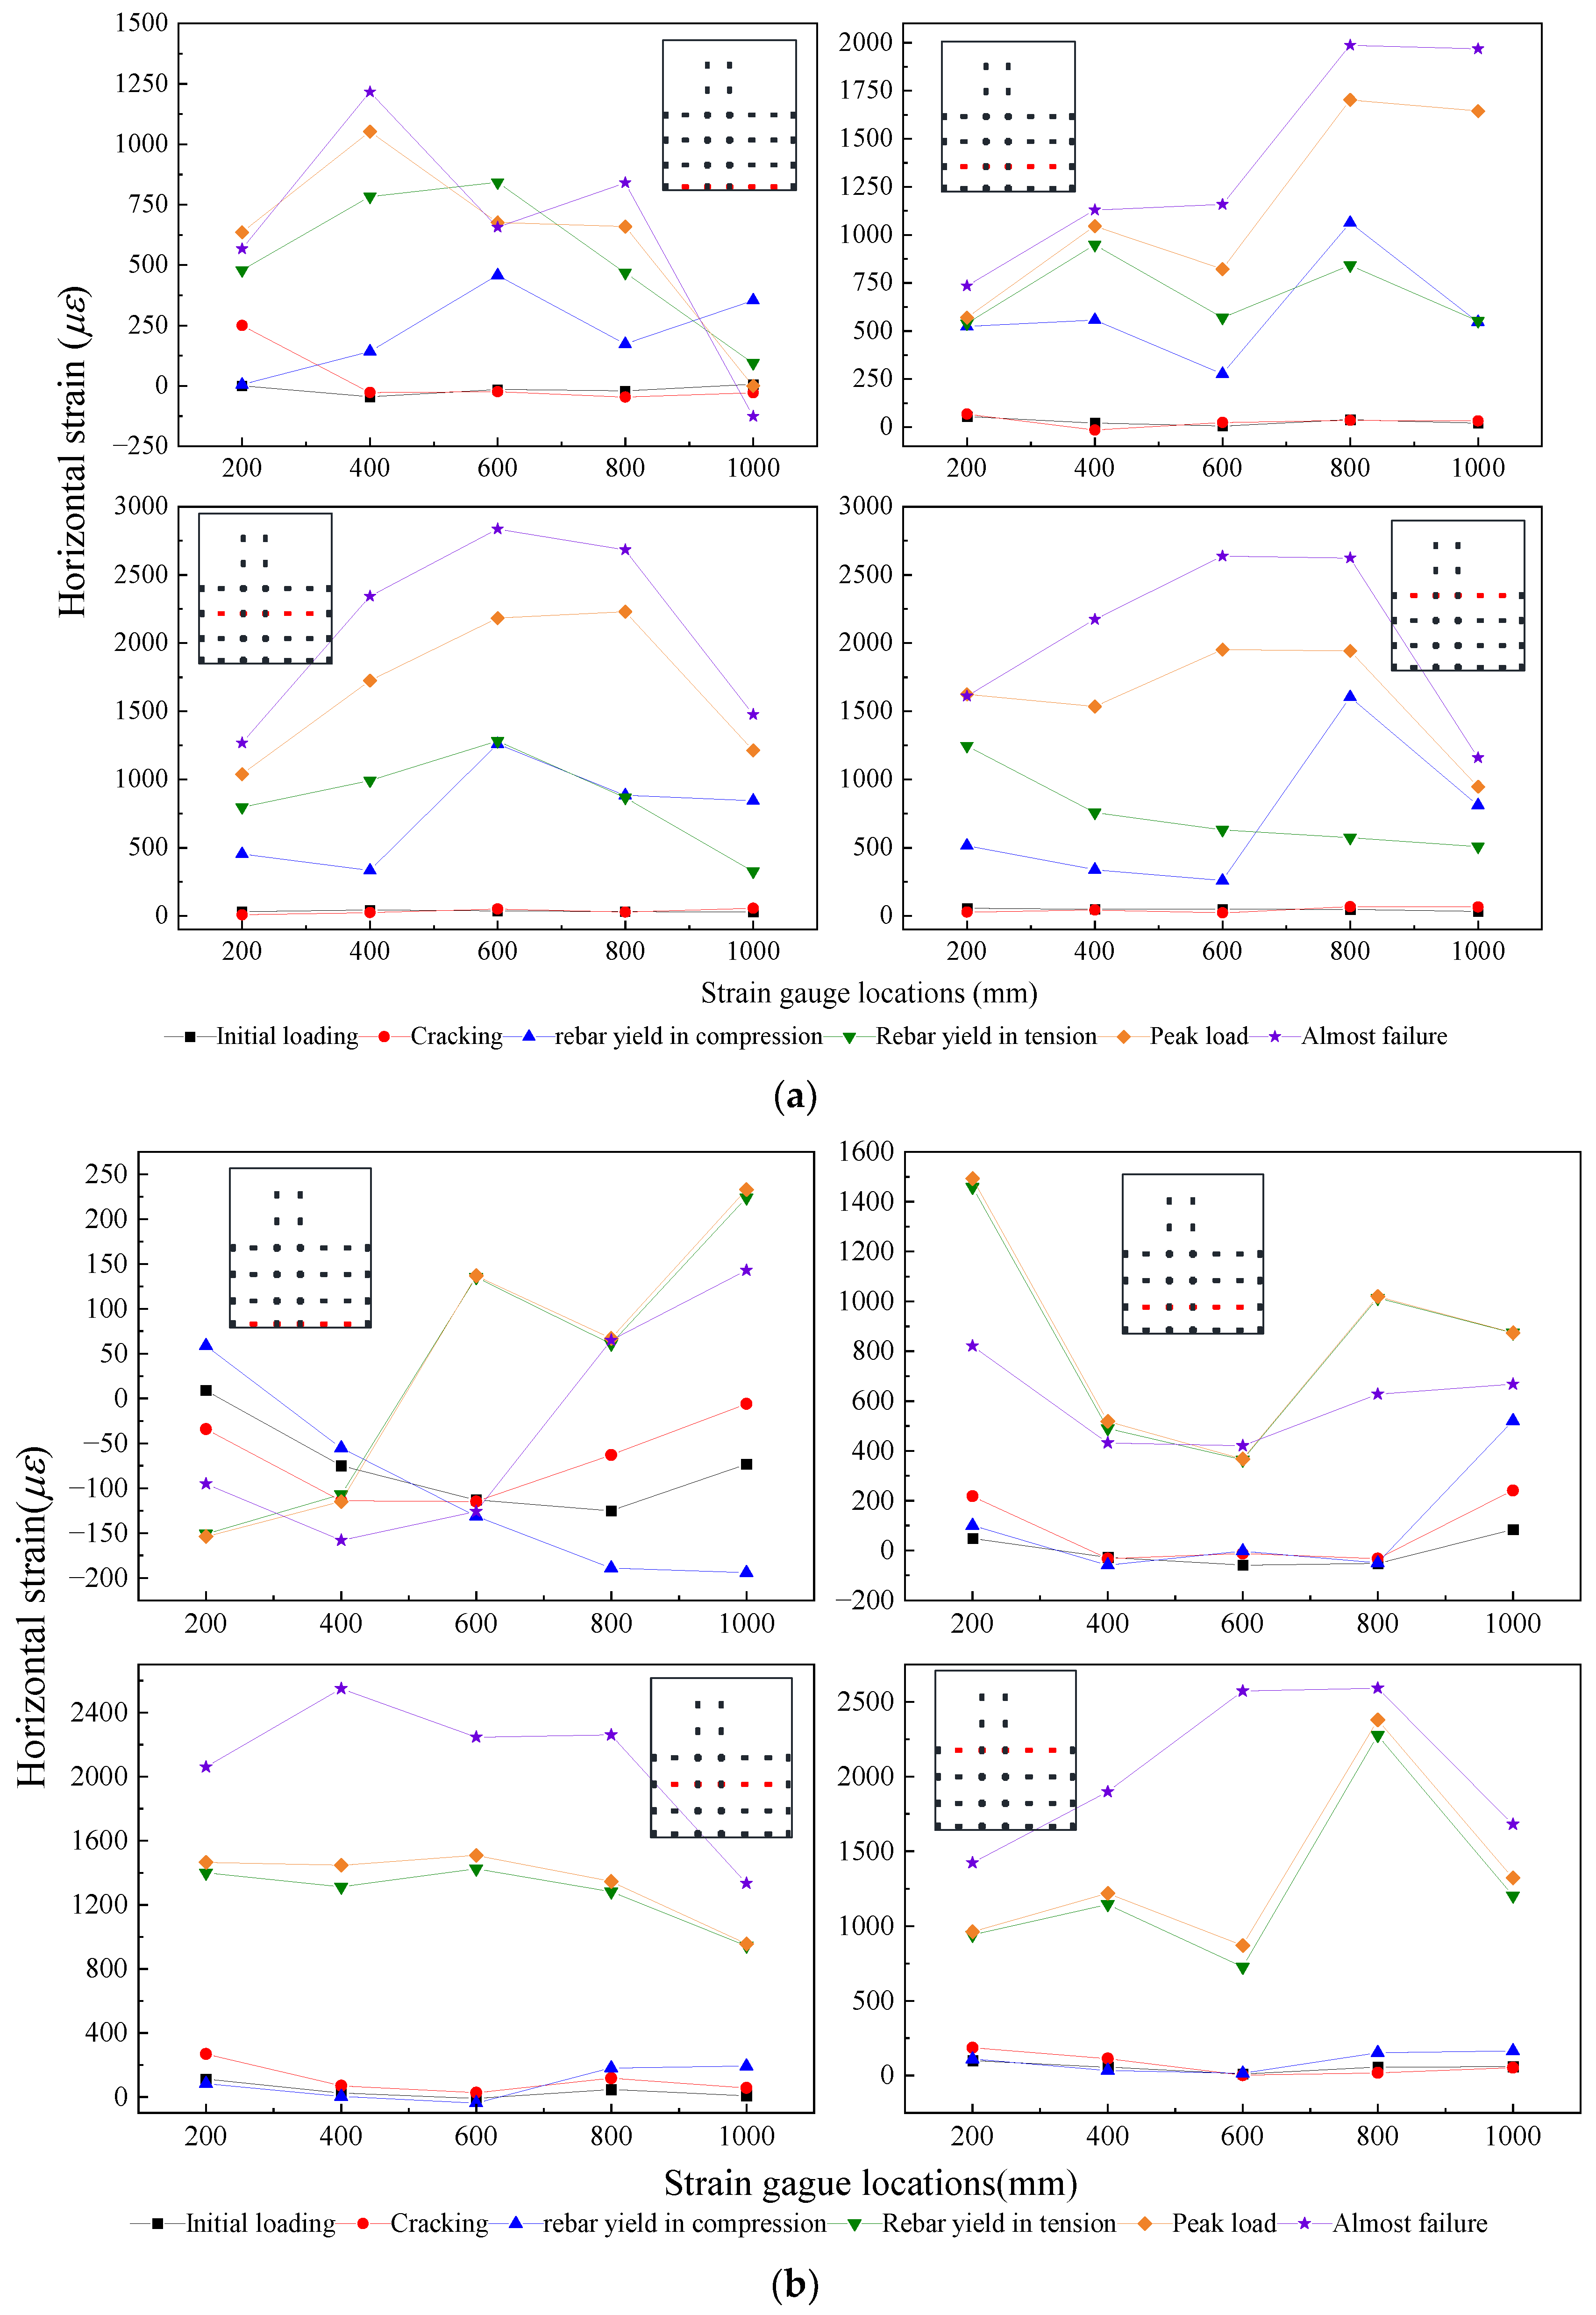
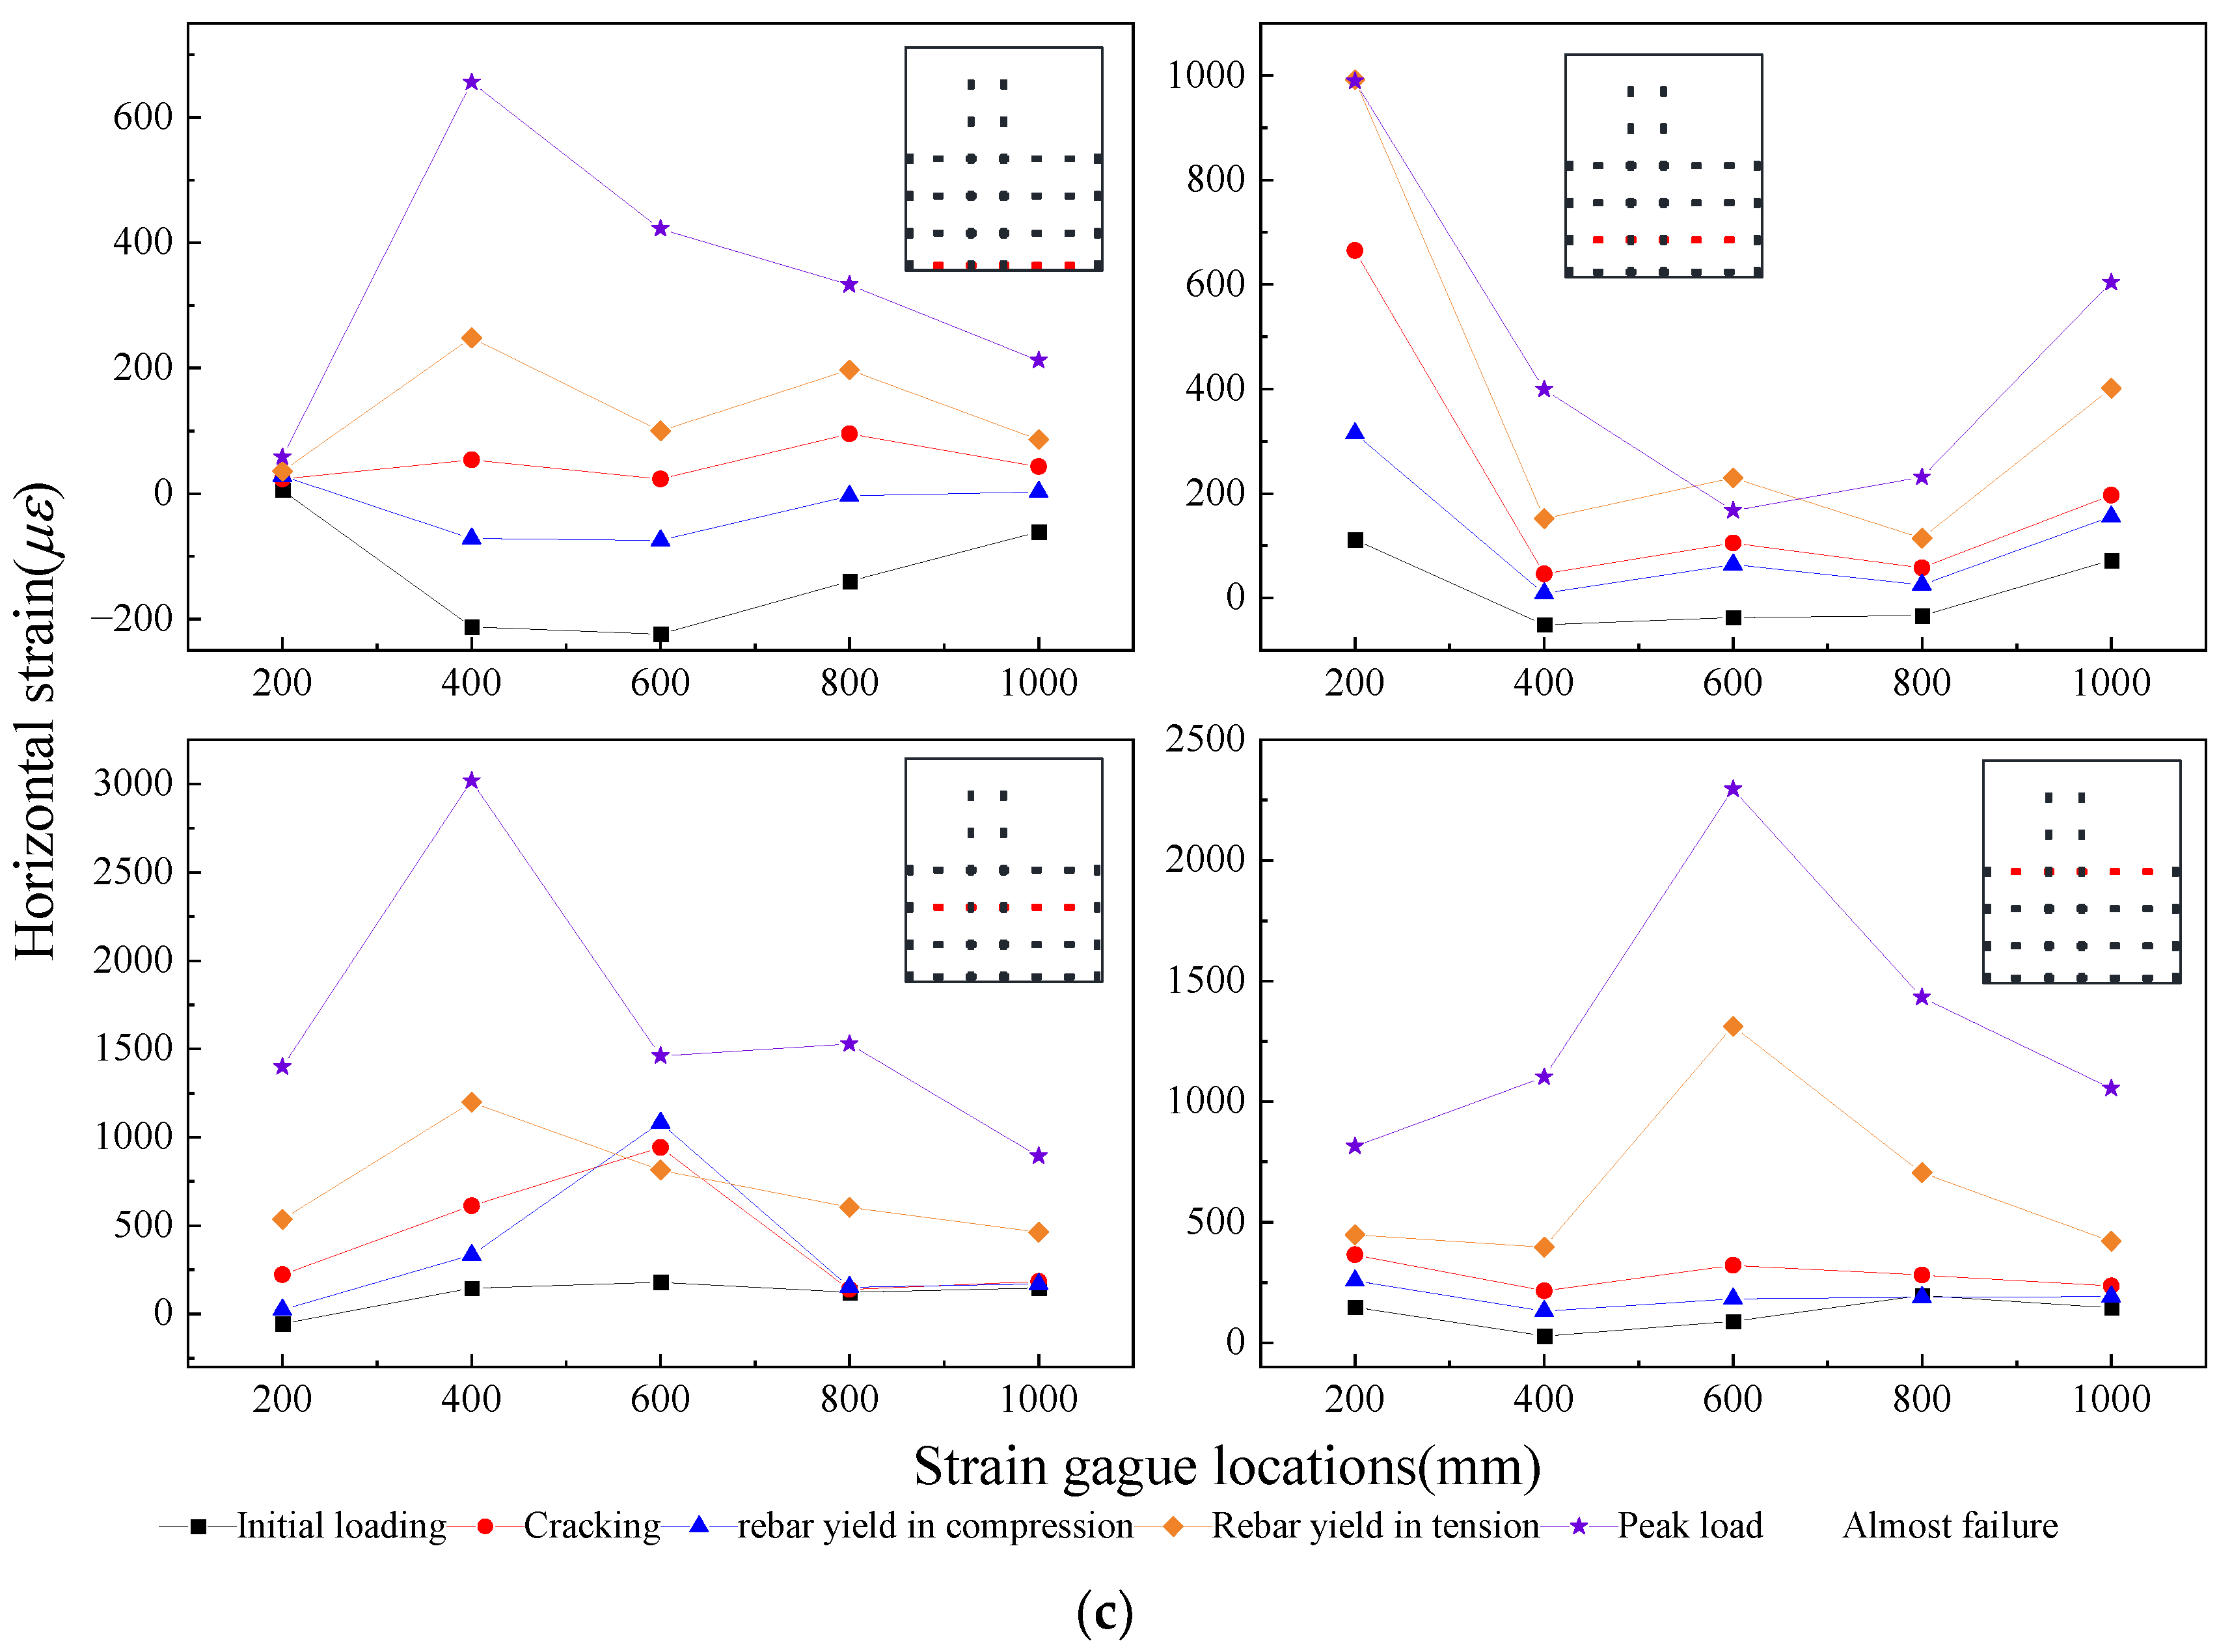
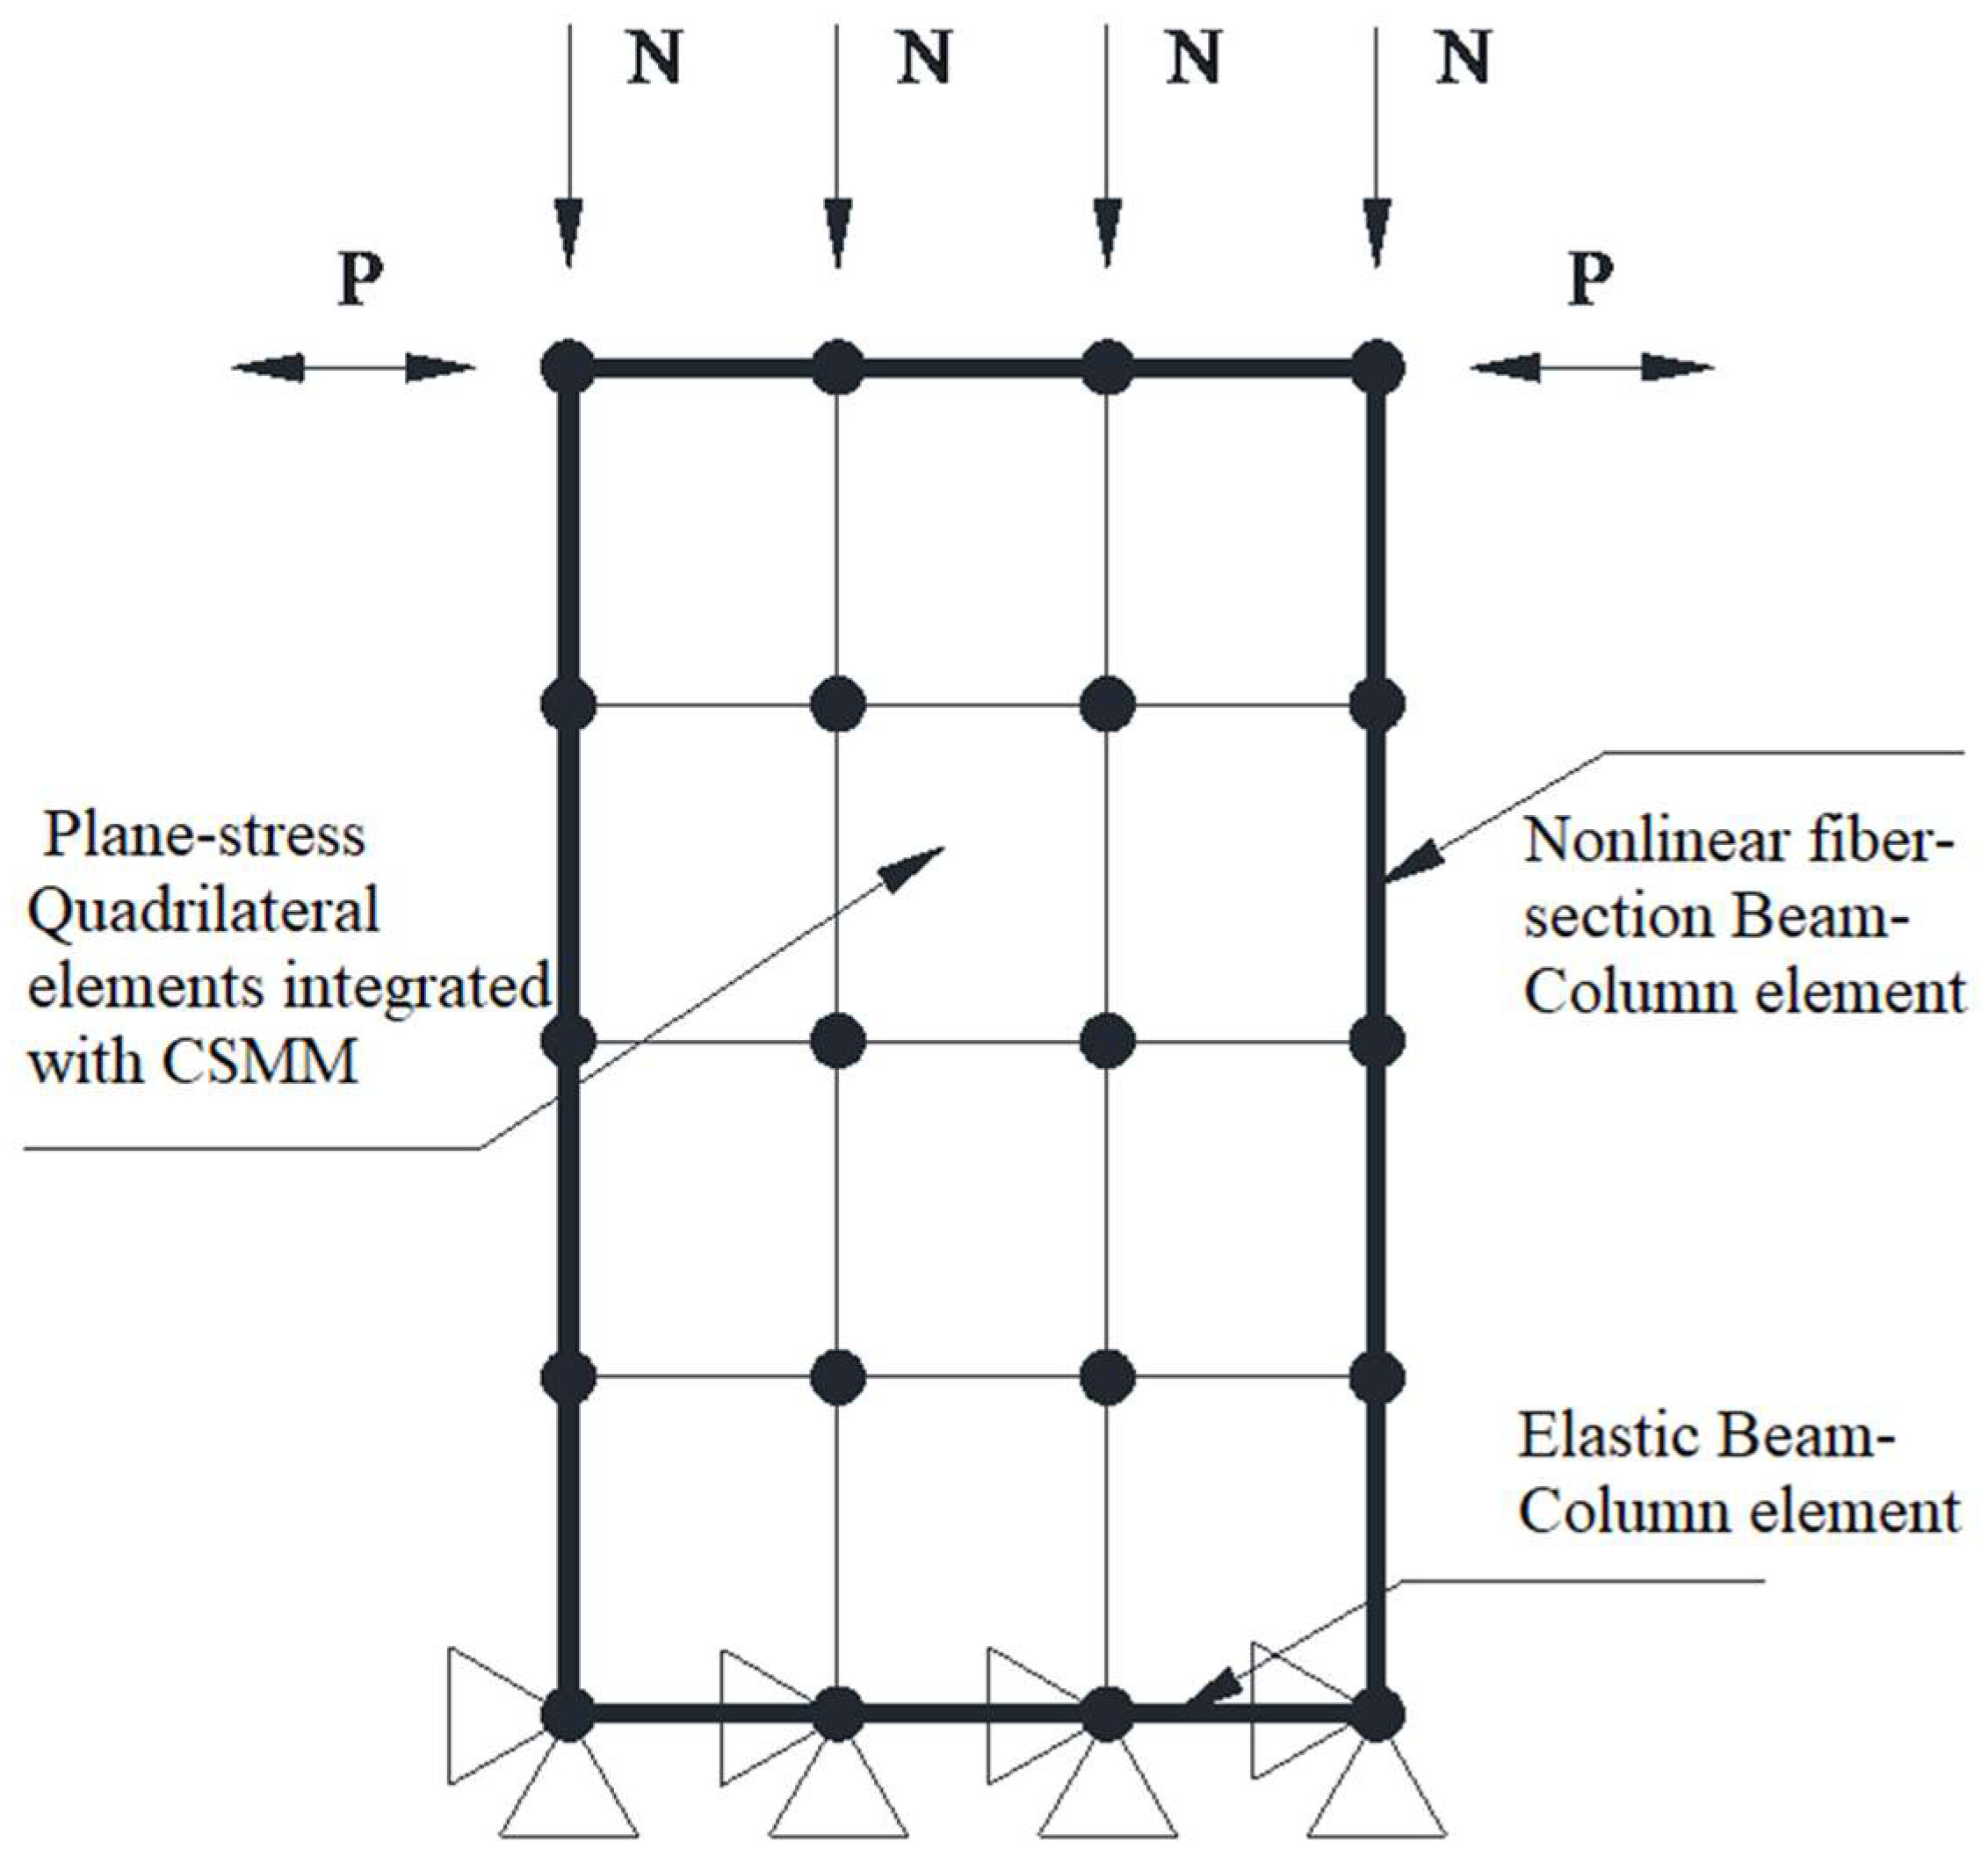
3.5.2. The Strains in Horizontal Reinforcements

Figure 13 shows the variation and distribution of horizontal strain along the length of the shear walls under positive loading, since the results under negative loading showed similar phenomenon. Before the formation of inclined cracks, only small strains were accumulated in the horizontal reinforcements. However, as the inclined cracks passed across the horizontal reinforcement, a sudden increase of strain can be detected. The increasing rates of reinforcement strains were different at different locations. The horizontal strains in the web increased rapidly, while the horizontal strains in the boundary elements increased slowly, since inclined cracks mainly occurred in web rather than boundary elements, where flexural cracks were mainly formed. When the specimens reached their loading capacity, for SWC1, most of the horizontal strain gauges reached the yield strain in tension except for the strain gauges at very bottom of the specimen, while, for SWC3, little measured horizontal strains exceeded the yield strain. It indicates that higher axial compression also inhibits the contribution of transverse reinforcements to shear resistance, resulting in lower ductility of the elements.

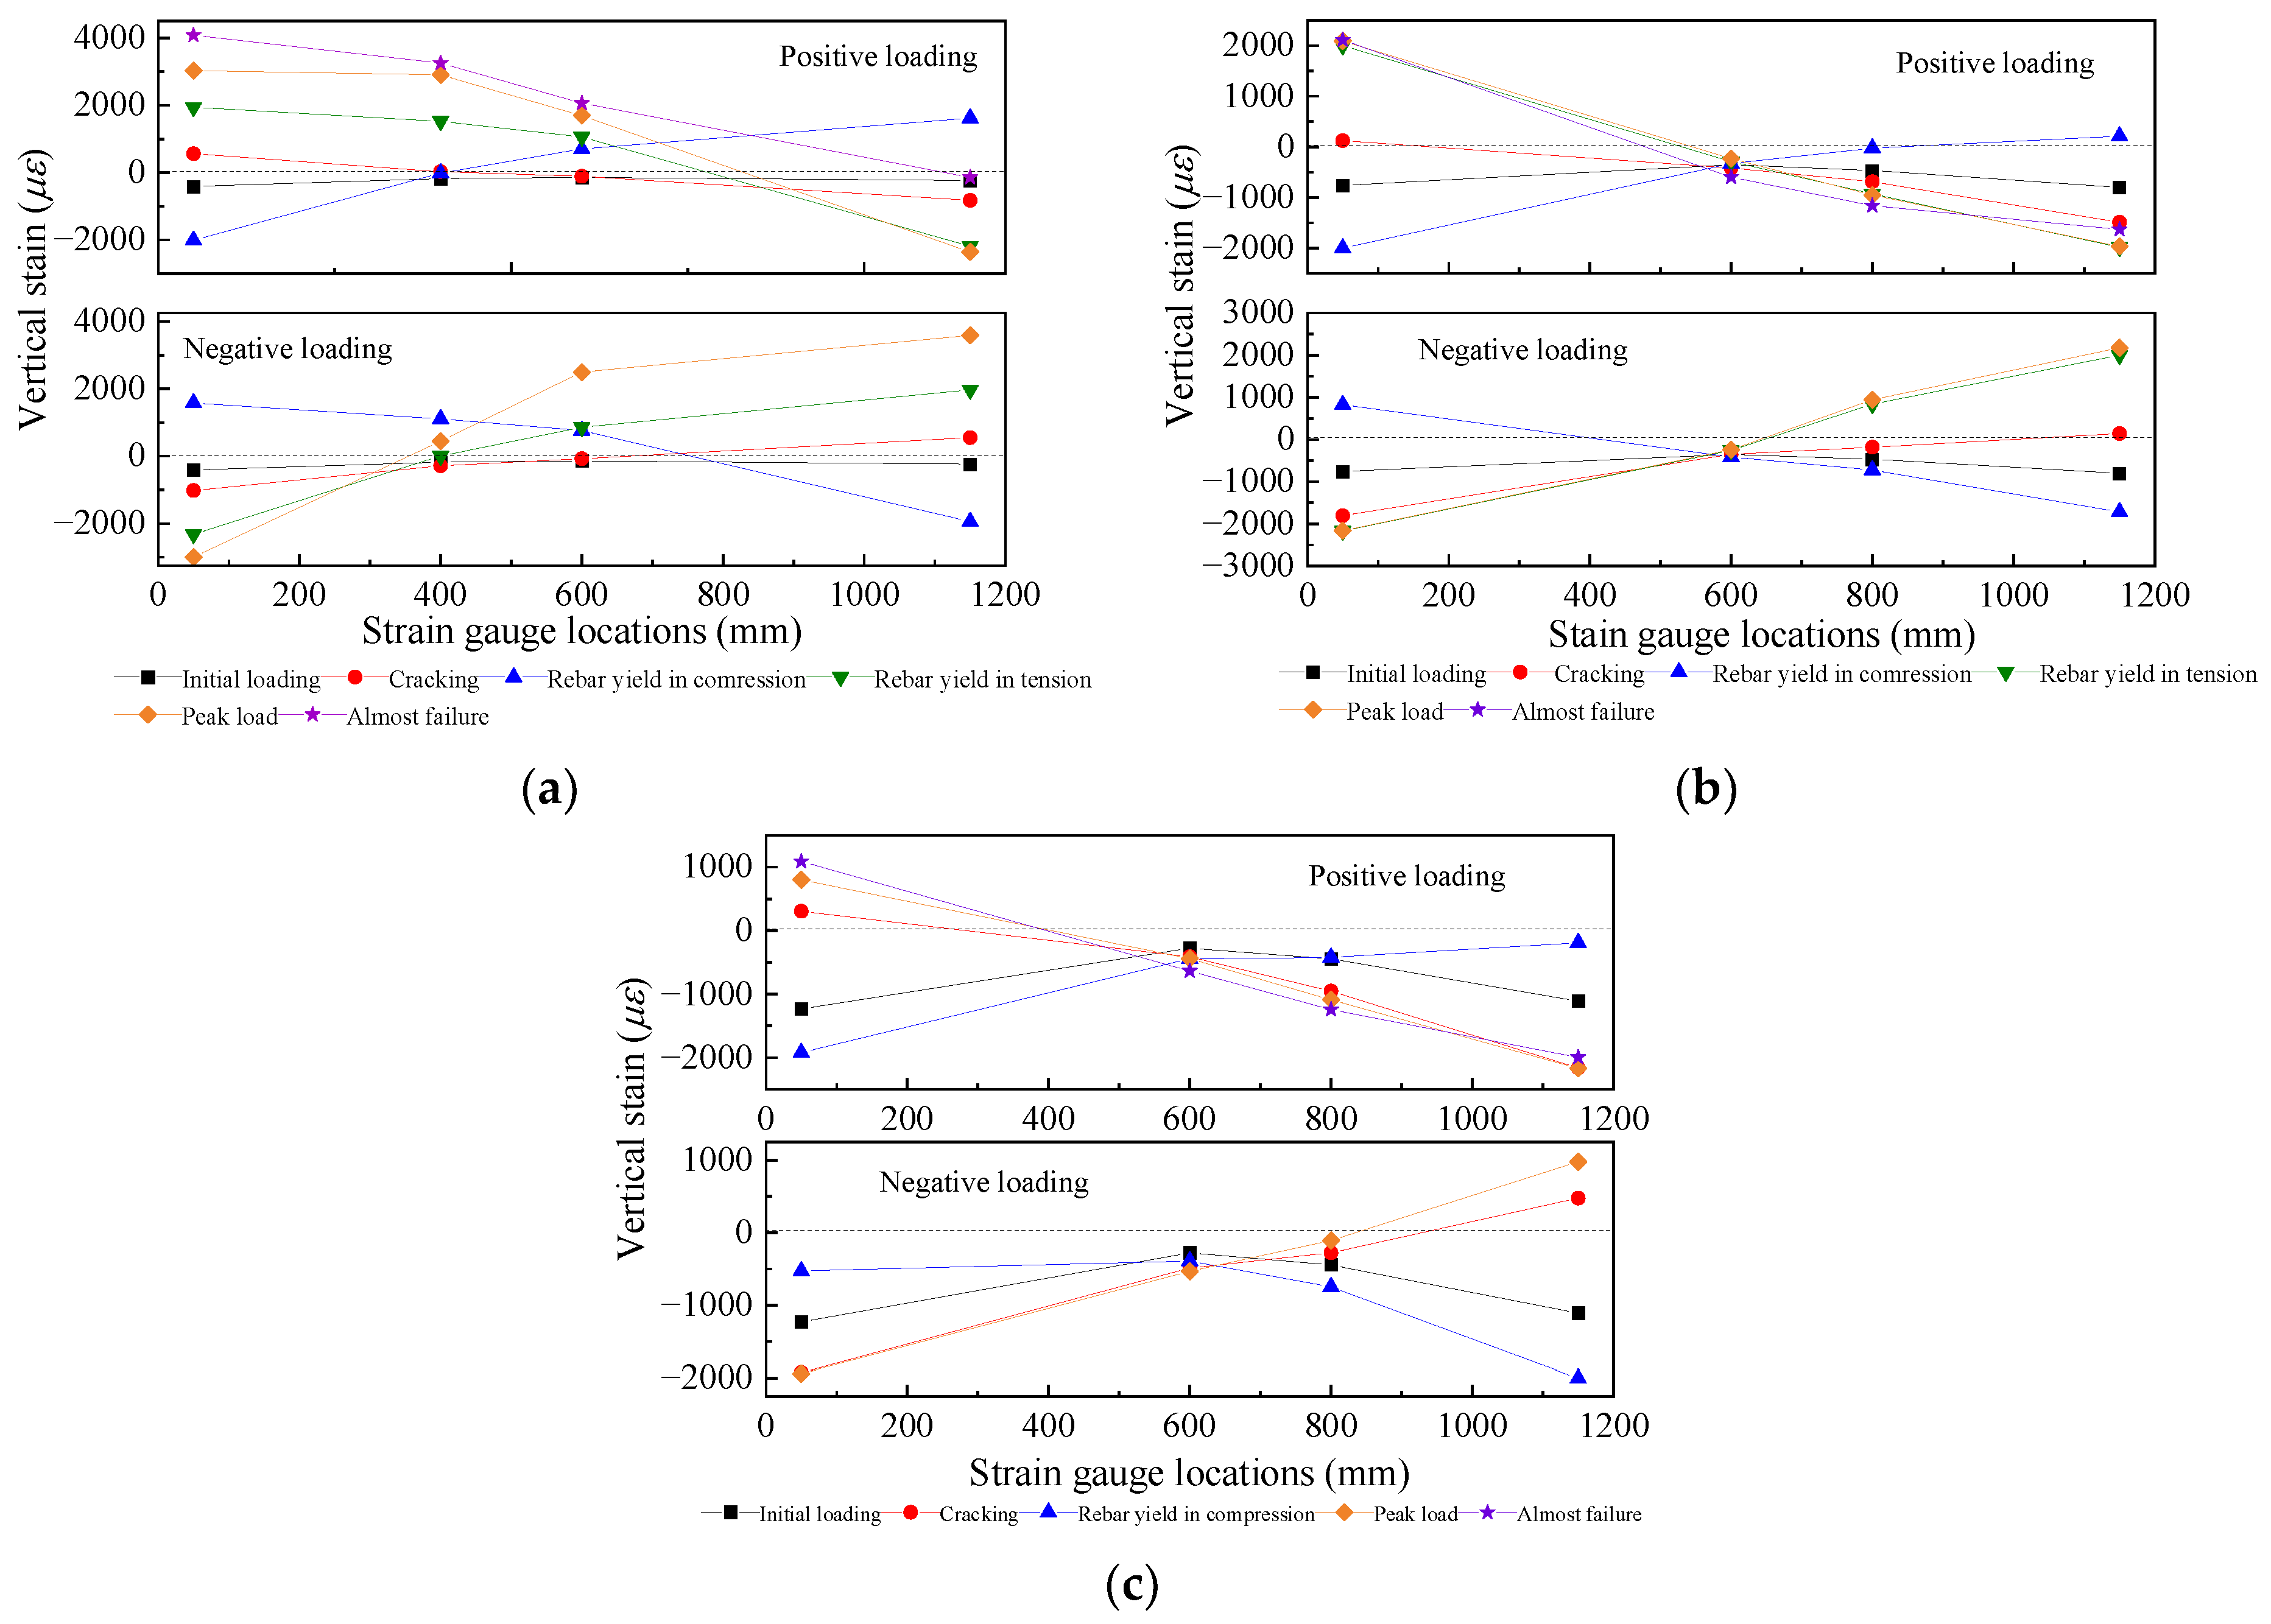
3.5.3. The Strains at Effective Measurement Points

The effective measurement point is defined as the point where the inclined cracks just pass across or close to the strain gauges at the intersection of vertical and horizontal reinforcements simultaneously. The strains of all effective measurement points were listed in Table 3. From Table 3, it can be indicated that the strain in vertical reinforcement increased with the increasing lateral load; however, the accumulated strains in horizontal reinforcement were still small, before the inclined cracks formed around the measuring points. After the inclined cracks formed and crossed the measuring points, for SWC1, the strains in both directions increased rapidly with little difference in value, which means the vertical and horizontal reinforcements provided the equal contribution to the shear capacity of squat shear walls under relatively lower ALR. For SWC2 and SWC3, the increasing rate of strains in horizontal reinforcements was greater than that in vertical reinforcements after the inclined cracks formed. It was because the high axial compression restrained the increase of vertical strains in web. In this case, both vertical and horizontal reinforcements cannot provide full contribution to the shear capacity, since the squat walls are very likely to fail due to concrete crush.

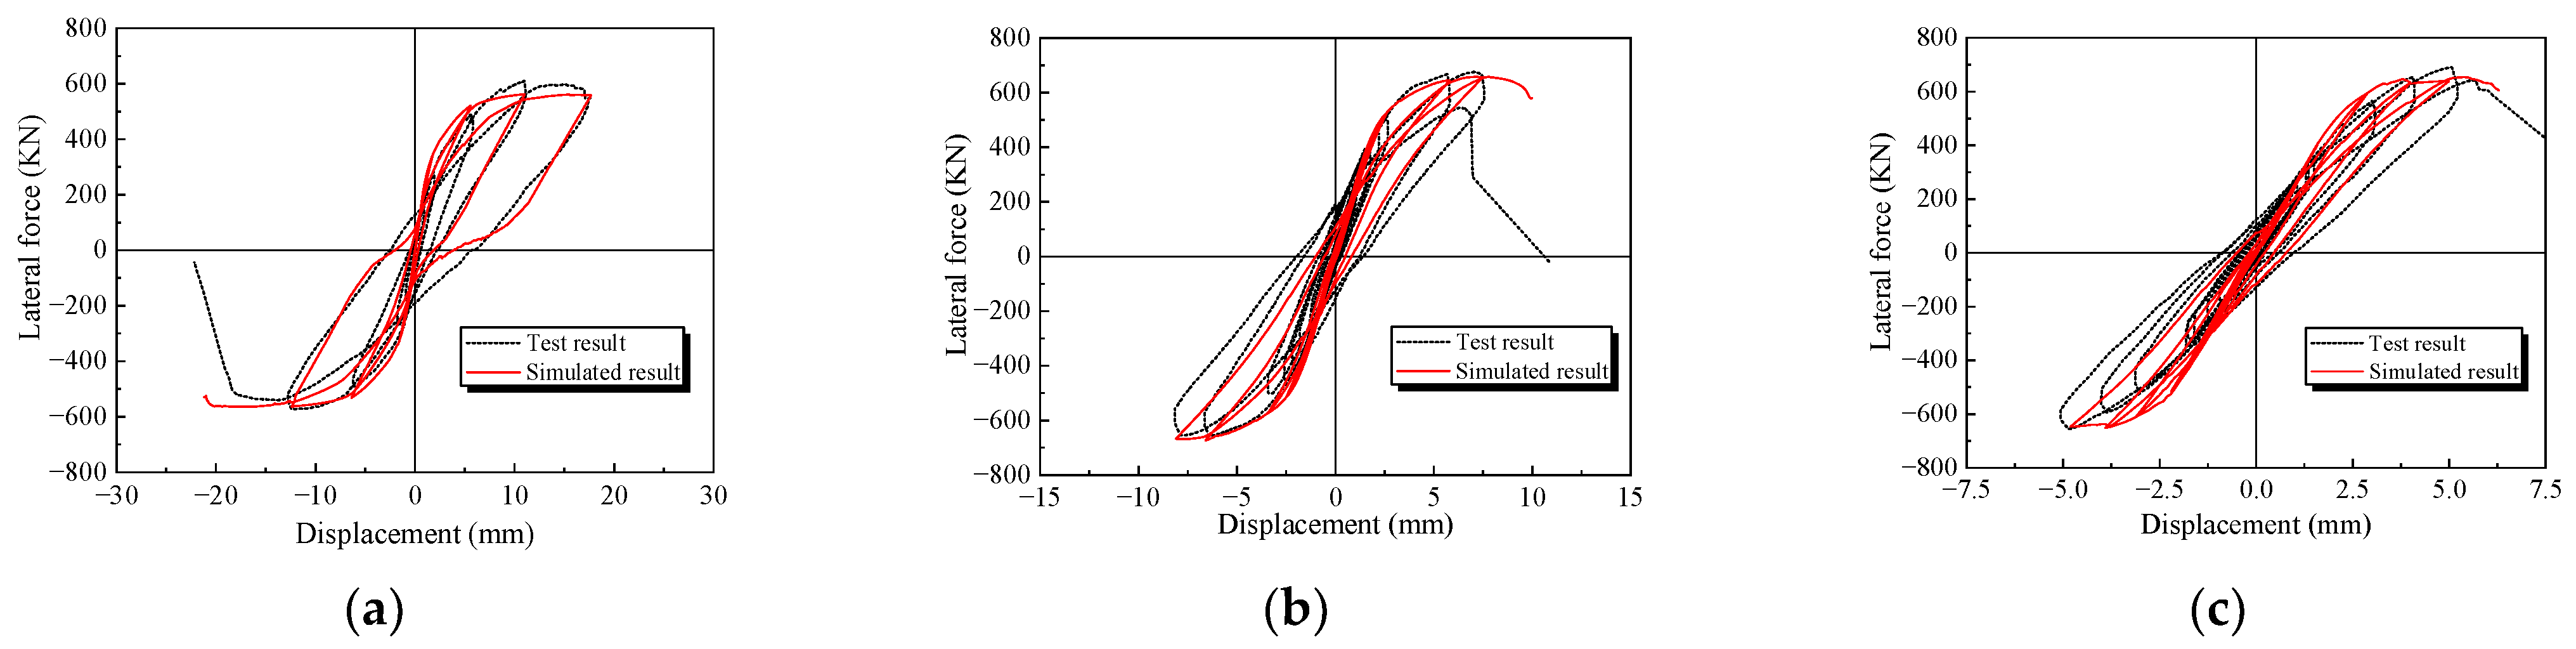
4. Finite Element Modelling

4.1. Introduction to the Softened Membrane Model

The softened membrane model (SMM) is on the basis of fixed angle softening truss model (FA-STM), considering the Poisson’s ratio effect of the cracked concrete. The transformation between uniaxial stress–strain relationship and biaxial stress–strain relationship was achieved by setting two Hsu/Zhu ratios, so that the SMM not only can predict the rising branch of the structural response curve under monotonic loading, but also can capture the descending branch [32]. In order to simulate the structural response of members under cyclic loading. Hsu et al. [33] further developed a cyclic softened membrane model (CSMM), considering the cyclic constitutive model on the basis of the SMM. CSMM can accurately predict the pinching effect, shear ductility and energy dissipation capacity of the in-plane concrete members in shear. A detailed introduction to CSMM can be found in the relevant literatures [32,33,34] and will not be repeated in this study.

4.2. Modelling with OpenSEES

A shear wall is generally divided into boundary elements on both sides and a web in the middle. When using CSMM, the boundary elements are generally simulated by nonlinear fibre-section beam-column elements, and the web is simulated by 12 plane-stress quadrilateral elements integrated with CSMM. The coincided nodes at the same position of beam-column element and plane element are coupled to work together. A schematic diagram of the finite element model of the simulated shear wall is shown in Figure 14. The vertical axial load N was first applied to the top loading beam of the shear wall element in the first load step. And then lateral load P was applied to the top of the shear walls in the second load step using displacement control in order to capture the strain softening of concrete.

4.3. Simulation Results

The comparison of the hysteresis curves obtained by the finite element analysis and by the experiments is shown in Figure 15. The solid line in the figure represents the experimental curve, while the dotted line represents the finite element simulation curve. It can be seen from the figures that the simulation results of specimens SWC1~SWC3 are in agreement with the experimental results. The relative error between the simulated and experimental shear strengths is controlled within 10%. The initial stiffness of the simulation results is generally slightly higher than the experimental results on account of the influence of the gap between the experiment devices and the unevenness of the surface of the specimen during the experiments, which cannot be considered in the finite element modelling. By comparing the shapes of a single hysteresis loop, it is found that the simulated energy dissipation enveloped by the hysteresis curve is lower than the tested data. This is because the applied load leading to the yield of steel bars in tension increased under higher axial loading, meanwhile, the crack development was also restrained. As a result, the hysteresis curve became plumper under high axial loading. This phenomenon can be hardly simulated accurately with CSMM. In addition, since CSMM is an in-plane 2D model, it cannot simulate the out-of-plane buckling of shear walls under high axial loading. Comparing the strains at the effective points in the horizontal and vertical reinforcement, it can be seen that both the calculated and the measured strains exhibit a similar trend. The relative errors are within 20%. In general, CSMM can capture well the nonlinear response of squat shear walls under cyclic loading, in terms of backbone curve, initial stiffness, yield point, peak point and even the descending branch of the load–displacement curve with reasonable accuracy.

5. Conclusions

The behaviour of three squat shear walls under constant high axial load and cyclic lateral load with different ALRs were studied in this paper. Finite element modelling was also conducted and verified with the experimental results. From the experimental observations and the comparison between the tested and simulated results, the following conclusions can be drawn:
(1)
Shear failure was observed in all members. After concrete crush and spalling occurred in the shear-compression zone, the squat walls failed due to the out-of-plane buckling. No obvious pinch effect was observed in the hysteresis curve of specimens, owing to the little bond slip under high axial load;
(2)
Despite the increase of the shear capacity, high axial load provides negative effects on the shear behaviour of the shear walls, including insufficient ductility and energy dissipation capacity, acceleration of the strength and stiffness degradation and decline of ultimate plastic rotation;
(3)
The new strain measuring method can effectively measure the stress of steel reinforcements during the whole loading process, avoiding the influence of concrete cracking, spalling and other factors on the strain gauges;
(4)
Strain analysis shows that under the condition of high ALR, the section of the squat walls coincided well with the assumption of plane section. With the increase of ALR, the depth of compression zone of members increases, while the length of plastic hinge decreases;
(5)
When the axial load is relatively small, the vertical and horizontal reinforcements provided almost equal contribution to the shear capacity of squat shear walls. However, under high axial load, both vertical and horizontal reinforcements cannot provide full contribution to the shear capacity, since the squat walls are very likely to fail due to concrete crush;
(6)
A FA-STM based finite element model, called CSMM, was applied in this study to simulate the shear behaviour of squat shear walls. Simulated results indicate that CSMM can well capture the nonlinear response of the shear walls under combined cyclic loading and axial compression. The model can accurately simulate the backbone curve, initial stiffness, yield point, peak point and even the descending branch of the load displacement curve, but the out-of-plane instability of the shear walls under extremely high ALR at failure is hardly considered.

Author Contributions

Conceptualization, investigation, methodology, writing—original draft preparation, writing—review and editing, funding acquisition, C.J.; investigation, methodology, writing—original draft preparation, Y.S.; writing—review and editing, Z.P.; supervision, S.M. All authors have read and agreed to the published version of the manuscript.

Funding

The research presented in this paper were sponsored by the Natural Science Foundation of the Jiangsu Higher Education Institutions of China (21KJB560005) and Jiangsu Postdoctoral Research Foundation (2021K519C).

Data Availability Statement

The data presented in this study are available on request from the corresponding authors.

Conflicts of Interest

The authors declare that they have no conflicts of interest to the publication of this manuscript.

References

  1. Yin, J.; Song, Z.; Xue, Y.; Liu, J.; Zhang, G.; Zhu, Y. Analysis on global huge earthquake activity. Earthq. Sci. 2012, 34, 191–201. (In Chinese) [Google Scholar]
  2. Lee, J.D.; Mander, J.B. Unified Truss-Arch Model for the Analysis of Bending-Shear Interaction in Reinforced Concrete Members. J. Struct Eng. ASCE 2022, 148, 04022074. [Google Scholar] [CrossRef]
  3. Li, B.; Pan, Z.F.; Xiang, W.Z. Experimental evaluation of seismic performance of squat RC structural walls with limited ductility reinforcing details. J. Earthq. Eng. 2015, 19, 313–331. [Google Scholar] [CrossRef]
  4. Wang, B.; Wu, M.Z.; Zhang, L.P.; Cai, W.Z.; Shi, Q.X. Seismic behavior and shear capacity of shear-dominated T-shaped RC walls under cyclic loading. Structures 2023, 55, 557–569. [Google Scholar] [CrossRef]
  5. Wei, F.; Chen, H.H.; Xie, Y.J. Experimental study on seismic behavior of reinforced concrete shear walls with low shear span ratio. J. Build. Eng. 2022, 45, 103602. [Google Scholar] [CrossRef]
  6. Carrillo, J.; Oyarzo-Vera, C.; Blandón, C. Damage assessment of squat, thin and lightly-reinforced concrete walls by the Park & Ang damage index. J. Build. Eng. 2019, 26, 100921. [Google Scholar]
  7. Looi, D.T.W.; Su, R.K.L.; Cheng, B.; Tsang, H.H. Effects of axial load on seismic performance of reinforced concrete walls with short shear span. Eng. Struct. 2017, 151, 312–326. [Google Scholar] [CrossRef]
  8. Wael, K. Shear strength of squat walls: A strut-and-tie model and closed-form design formula. Eng. Struct. 2015, 84, 430–438. [Google Scholar]
  9. Massone, L.M.; López, C.N.; Kolozvari, K. Formulation of an efficient shear-flexure interaction model for planar reinforced concrete walls. Eng. Struct. 2021, 243, 112680. [Google Scholar] [CrossRef]
  10. López, C.N.; Massone, L.M.; Kolozvari, K. Validation of an efficient shear-flexure interaction model for planar reinforced concrete walls. Eng. Struct. 2022, 252, 113590. [Google Scholar] [CrossRef]
  11. Terzioglu, T.; Orakcal, K.; Massone, L.M. Cyclic lateral load behavior of squat reinforced concrete walls. Eng. Struct. 2018, 160, 147–160. [Google Scholar] [CrossRef]
  12. Baek, J.W.; Park, H.G.; Lee, J.H.; Bang, C.J. Cyclic Loading Test for Walls of Aspect Ratio 1.0 and 0.5 with Grade 550 MPa Shear Reinforcing Bars. ACI Struct. J. 2017, 114, 969–982. [Google Scholar] [CrossRef]
  13. Ma, J.; Li, B. Experimental and Analytical Studies on H-Shaped Reinforced Concrete Squat Walls. ACI Struct. J. 2018, 115, 425–438. [Google Scholar] [CrossRef]
  14. Peng, Y.; Wu, H.; Zhuge, Y. Strength and Drift Capacity of Squat Recycled Concrete Shear Walls under Cyclic Loading. Eng. Struct. 2015, 100, 356–368. [Google Scholar] [CrossRef]
  15. Maier, J.; Thurlimann, B. Bruchversuche an Sahlbetonscheilben; Institue fur Baustatik und Konstruktion ETH: Zurich, Switzerland, 1985. [Google Scholar]
  16. Lefas, I.D.; Kotsovos, M.D.; Ambraseys, N.N. Behavior of reinforced concrete structural walls: Strength, deformation characteristics, and failure mechanism. ACI Struct. J. 1990, 87, 23–31. [Google Scholar]
  17. Hidalgo, P.A.; Ledezma, C.A.; Jordana, R.M. Seismic behavior of squat reinforced concrete shear walls. Earthq. Spectra. 2002, 18, 287–308. [Google Scholar] [CrossRef]
  18. Salonikios, T.; Tegos, I.; Kappos, A.J.; Penelis, G. Squat R/C walls under inelastic shear reversals. In Proceedings of the 11th World Conference on Earthquake Engineering, Acapulco, Mexico, 23–28 June 1996. [Google Scholar]
  19. Oesterle, R.G.; Aristizabai-Ochoa, J.D.; Shiu, K.N.; Corley, W.G. Web Crushing of Reinforced Concrete Structural Walls. ACI Struct. J. 1984, 81, 231–241. [Google Scholar]
  20. Lopes, M.S. Experimental shear-dominated response of RC walls Part I: Objectives, methodology and results. Eng. Struct. 2001, 23, 229–239. [Google Scholar] [CrossRef]
  21. Lopes, M.S. Experimental shear-dominated response of RC walls. Part II: Discussion of results and design implications. Eng. Struct. 2001, 23, 564–574. [Google Scholar] [CrossRef]
  22. Sozen, M.A.; Moehle, J.P. Stiffness of Reinforced Concrete Walls Resisting In-Plane Shear; Electric Power Research Institute: Palo Alto, CA, USA, 1993. [Google Scholar]
  23. Guo, Z.X.; Lv, X.L. Experimental study on the hysteretic model of RC columns with high axial compressive ratio. China Civ. Eng. J. 2004, 37, 32–38. (In Chinese) [Google Scholar]
  24. Su, R.K.L.; Wong, S.M. Seismic behavior of slender reinforced concrete shear walls under high axial load ratio. Eng. Struct. 2007, 29, 1957–1965. [Google Scholar] [CrossRef]
  25. Su, R.K.L.; Wong, S.M. A survey on axial load ratios of structural walls in medium-rise residential buildings in Hong Kong. HKIE Trans. 2007, 14, 40–46. [Google Scholar] [CrossRef]
  26. Zhang, Y.F.; Wang, Z.H. Seismic behavior of reinforced concrete shear walls subjected to high axial loading. ACI Struct. J. 2000, 97, 739–750. [Google Scholar]
  27. GB50010-2010; National Standard of P. R. China. Code for Design of Concrete Structures. Building Industry Press: Beijing, China, 2010. (In Chinese)
  28. GB50011-2001; National Standard of P. R. China. Code of Seismic Design of Buildings. Building Industry Press: Beijing, China, 2014. (In Chinese)
  29. JGJ3-2010; National Standard of P. R. China. Technical Specification for Concrete Structures of Tall Building. Building Industry Press: Beijing, China, 2010. (In Chinese)
  30. Wu, Y.F.; Hu, B. Shear Strength Components in Reinforced Concrete Members. J. Struct. Eng.-ASCE 2017, 143, 174–189. [Google Scholar] [CrossRef]
  31. Park, R.; Paulay, T. Reinforced Concrete Structures; A Wiley-Inerscience Publication: 1975. A Wiley-Inerscience Publication: Hoboken, NJ, USA, 1975. [Google Scholar]
  32. Hsu, T.T.C.; Zhu, R.R.H. Softened Membrane Model for Reinforced Concrete Elements in Shear. ACI Struct. J. 2002, 99, 460–469. [Google Scholar]
  33. Hsu, T.T.C.; Mansour, M.Y.; Mo, Y.L. Cyclic Softened Membrane Model for Nonlinear Finite Element Analysis of Concrete Structures. In Finite Element Analysis of Reinforced Concrete Structures; American Concrete Institute: Farmington, MI, USA, 2006; pp. 71–98. [Google Scholar]
  34. Hsu, T.T.C.; Mo, Y.L. Unified Theory of Concrete Structures; Wiley A John Wiley and Sons, Ltd., Publication: Hoboken, NJ, USA, 2010. [Google Scholar]
Figure 1. Details of the specimens.
Buildings 13 02104 g001
Figure 2. Experimental setup.
Buildings 13 02104 g002
Figure 3. Loading history.
Buildings 13 02104 g003
Figure 6. Crack patterns and failure modes of the specimens. (a) SWC1. (b) SWC2. (c) SWC3.
Buildings 13 02104 g006
Figure 7. Hysteresis loops and backbone curves. (a) SWC1. (b) SWC2. (c) SWC3. (d) Comparison of the backbone curves.
Buildings 13 02104 g007
Figure 8. Determination of Ed.
Buildings 13 02104 g008
Figure 9. Energy dissipation of the tested shear walls.
Buildings 13 02104 g009
Figure 10. Stiffness degradation of tested specimens.
Buildings 13 02104 g010
Figure 11. Variation and distribution of vertical strains along the depth of the section at bottom end of the shear walls. (a) SWC1. (b) SWC2. (c) SWC3.
Buildings 13 02104 g011
Figure 12. Variation and distribution of vertical strains along the height of the shear walls. (a) SWC1. (b) SWC2. (c) SWC3.
Buildings 13 02104 g012aBuildings 13 02104 g012b
Figure 13. Variation and distribution of vertical strains along the height of the shear walls under positive loading. (a) SWC1. (b) SWC2. (c) SWC3.
Buildings 13 02104 g013aBuildings 13 02104 g013b
Figure 14. Finite element model of the shear wall.
Buildings 13 02104 g014
Figure 15. Comparison of CSMM simulation and tested hysteresis curves of shear wall. (a) SWC1. (b) SWC2. (c) SWC3.
Buildings 13 02104 g015
Table 1. Experimental Parameters of Shear Walls.
Specimenfcu/MPafc/MPaALRSDRρv/%fy,v/MPaρh/%fy,h/MPaρcc/%fy,cc/MPaρw/%fy,w/MPa
SWC142.934.90.21.250.654940.584942.824880.92512
SWC242.934.90.41.250.654940.584942.824880.92512
SWC342.934.90.61.250.654940.584942.824880.92512
Table 2. Test results of the shear walls.
SpecimenVy/kNΔy/mmVmax/kNΔmax/mmVu/kNΔu/mmμΔδu
SWC1497.75.73610.210.98
−445.3−4.96−572.1−11.94−457.7−18.773.780.013
SWC2518.22.69676.17.08676.17.082.630.005
−526.3−3.26−658.0−6.4
SWC3553.62.92690.45.07690.45.071.730.003
−557.4−3.48−655.5−4.82
Table 3. The strains of vertical and horizontal reinforcement at effective points.
ALREffective PointsReinforcement YieldPeak LoadAlmost Failure
Strain in Vertical SteelStrain in Horizontal SteelStrain in Vertical SteelStrain in Horizontal SteelStrain in Vertical SteelStrain in Horizontal Steel
0.218929931671172521232343
26547581477153519782174
3124412832113218422462836
0.41175991494181316432537
255212681343183922082022
0.61−1056279−2106603−30411528
Disclaimer/Publisher’s Note: The statements, opinions and data contained in all publications are solely those of the individual author(s) and contributor(s) and not of MDPI and/or the editor(s). MDPI and/or the editor(s) disclaim responsibility for any injury to people or property resulting from any ideas, methods, instructions or products referred to in the content.

