Article

Safety Assessment of the Main Beams of Historical Buildings Based on Multisource Data Fusion

1
College of JangHo Architecture, Northeastern University, Shenyang 110169, China
2
School of Transportation and Geomatics Engineering, Shenyang Jianzhu University, Shenyang 110168, China
3
Dalian Branch of China Railway Ninth Bureau Group Co., Ltd., Dalian 116019, China
*
Author to whom correspondence should be addressed.
Buildings 2023, 13(8), 2022; https://doi.org/10.3390/buildings13082022
Submission received: 11 May 2023 / Revised: 7 July 2023 / Accepted: 17 July 2023 / Published: 8 August 2023
(This article belongs to the Special Issue Sustainable Preservation of Buildings and Infrastructure)

Abstract

:
Taking the main beams of historical buildings as the engineering background, existing theoretical research results related to influencing structural factors were used along with numerical simulation and data fusion methods to examine their integrity. Thus, the application of multifactor data fusion in the safety assessment of the main beams of historical buildings was performed. On the basis of existing structural safety assessment methods, neural networks and rough set theory were combined and applied to the safety assessment of the main beams of historical buildings. The bearing capacity of the main beams was divided into five levels according to the degree to which they met current requirements. The safety assessment database established by a Kohonen neural network was clustered. Thus, the specific evaluation indices corresponding to the five types of safety levels were presented. The rough neural network algorithm, integrating the rough set and neural network, was applied for data fusion with this database. The attribute reduction function of the rough set was used to reduce the input dimension of the neural network, which was trained, underwent a learning process, and then used for predictions. The trained neural network was applied for the safety assessment of the main beams of historical buildings, and six specific attribute index values corresponding to the main beams were directly input to obtain the current safety statuses of the buildings. Corresponding management suggestions were also provided.

1. Introduction

Building structural assessment can be divided into three processes: data collection, data analysis and evaluation, and decision making [1]. The collection of data refers to the process of obtaining as much data as possible to characterize the current state of the building structure, thus laying the foundation for subsequent structural assessment. The analysis and evaluation of data involve the selection of appropriate methods and theories based on the collected data and the determination of the actual working state of the building structure through analysis and processing [2]. Decision making refers to making reasonable suggestions for the maintenance, repair, reinforcement, or replacement of building structures based on evaluation results.
The evaluation of building structures can be regarded as a process that starts shallow and becomes deep. In the initial evaluation, relatively easy-to-obtain data can usually be collected and, thus, a relatively simple and effective evaluation method was selected to obtain preliminary evaluation results [3,4,5]. If one is not satisfied with the initial evaluation results or wants a more accurate assessment, it will be necessary to carry out further work to obtain more detailed data or to consider the numerical calculation model more carefully before once again evaluating the building structure [6,7].
At present, experts, scholars, and engineers in the domestic construction industry have actively researched and explored the performance evaluation of building structures, thus accumulating much experience, achieving extensive research results, and constantly putting forward relevant evaluation theories and methods. At present, comprehensive evaluation methods based on neural networks, fuzzy theory, analytic hierarchy processes, grey theory, reliability, genetic algorithms, and other mathematical methods, as well as integrations of various methods, have become mainstream in research [8,9,10].
Zhang et al. used the analytic hierarchy process to evaluate levels of housing damage [11]. Li Jing et al. discussed the Shanghai housing safety management system framework based on the housing situation in Shanghai and used the fault tree method to find and analyze the hidden dangers of housing safety. Yuan established a hierarchical structure model and used the comprehensive evaluation method of fuzzy integrals to evaluate the safety state of houses. Zhao [12] put forward a basic theory of grey comprehensive evaluation of housing reliability based on grey system theory.
At present, the methods used for building safety assessment based on differences in the size of the assessment target are also different. In general, there are two main methods for evaluating the state of a building. One method focuses on the evaluation of target-bearing capacity and the other focuses on comprehensive evaluation of the target state.
Because of the large number and wide distribution of building structures, it is extremely uneconomical and unrealistic to monitor the health of buildings by installing monitoring sensors on each structural member of each building. The usual practice is to rely on manual combined detection instruments to determine the actual carrying capacity of the target and then to evaluate the state of the building [13]. Commonly used evaluation methods include (1) the appearance survey evaluation method, (2) checking evaluation methods based on design specifications, (3) the load test method, (4) the expert system evaluation method, (5) evaluation methods based on reliability theory [14,15], and (6) evaluation methods of bearing capacity based on numerical simulations [16].
However, building safety assessment is a problem involving many influencing factors. The above theories and methods also have some defects and deficiencies, with their use thus having certain limitations. A single evaluation method for a specific project might not directly obtain accurate evaluation results. Therefore, on one hand, it is the primary task to further improve evaluation theories and actively explore the integrated application of various evaluation theories in the evaluation process. On the other hand, it is also of great significance and value to find new methods that can be used for building structural safety assessments.

2. Material and Methods

Due to limited space, this report only takes main beams as an example for verifying the feasibility of the multisource data fusion method.
In this study, a new ensemble algorithm was selected for the safety assessment of main building beams, namely, a rough neural network algorithm [17,18,19] that links the rough set and neural network. The combination of a neural network and rough set theory was the goal for reducing data through the rough set, and the reduced data set was thus used as the design basis and training data for the neural network [20]. Subsequently, this made the data more representative, the training data were reduced, the training time was reduced, and the efficiency improved. In this study, the rough neural network mainly completed the process of index screening, rough neural network training, and prediction.
(1)
First, as much useful data as possible is collected.
(2)
Data processing: The data to be processed is represented by a decision table, that is, in a two-dimensional table, with each object described by a row and each attribute of the object described by a column. In this process, if the obtained data table is incomplete, the information table must be completed. If the information table has continuous data, it must be discretized.
(3)
Rough set theory is used for data attribute reduction [21]; at the same time, the redundant condition attributes in the table and duplicate samples are removed and contradictory samples are dealt with.
(4)
The basic parameters of the neural network are determined according to the training data samples, that is, the number of hidden layer nodes and the number of input layer units of the neural network are determined according to the reduction results.
(5)
The neural network weights are obtained by training the neural network with the reduced learning samples. Then, the test sample is input into the network for testing.
(6)
The output is the final result.
The flow chart of the rough neural network algorithm is shown in Figure 1.

3. Discussion on the Feasibility of Applying Data Fusion Technology to Structural Safety Assessment Method

At present, the application of data fusion technology to structural safety assessment is still in the exploratory stage, mainly for the following three reasons: (1) Signals of multiple channels come from different sensors; (2) the same signal has different characteristic information; and (3) diagnostic conclusions vary according to different diagnostic approaches. Comprehensive use of building information can yield reasonable and accurate judgment conclusions, which can achieve the ultimate goal of information fusion to be applied to building evaluation.
Although the application of multisource information fusion in structural evaluation is still in the exploratory stage, it is still considered feasible. To begin with, data fusion technology and building safety assessment have the same purpose and requirements. In essence, structural evaluation deals with various information on a structure’s operational states comprehensively and obtains a comprehensive description of structural system operation and damage state based on the existing knowledge. In addition, data fusion technology and structural safety assessment use the same functional model. The information source that provides the original information, that is, the object of diagnosis, is subjected to monitoring diagnosis after various information processing procedures. This technology is applied to fault monitoring, diagnosis, and alarm systems such that the accuracy of obtaining information on the object state can be improved. The two complement each other, and this is actually a good combination using the new technology. Therefore, it is feasible to apply data fusion technology to structural safety assessment.

3.1. Results

Based on the above analysis, the research content of this study was as follows:
(1)
On the basis of studying a large number of relevant studies in the literature, this study summarized the relevant overview, necessity, and research status of structural safety assessment research; pointed out the commonly used structural safety assessment methods; and expounded the basic concept of multisource data fusion and feasibility of its application in structural assessment.
(2)
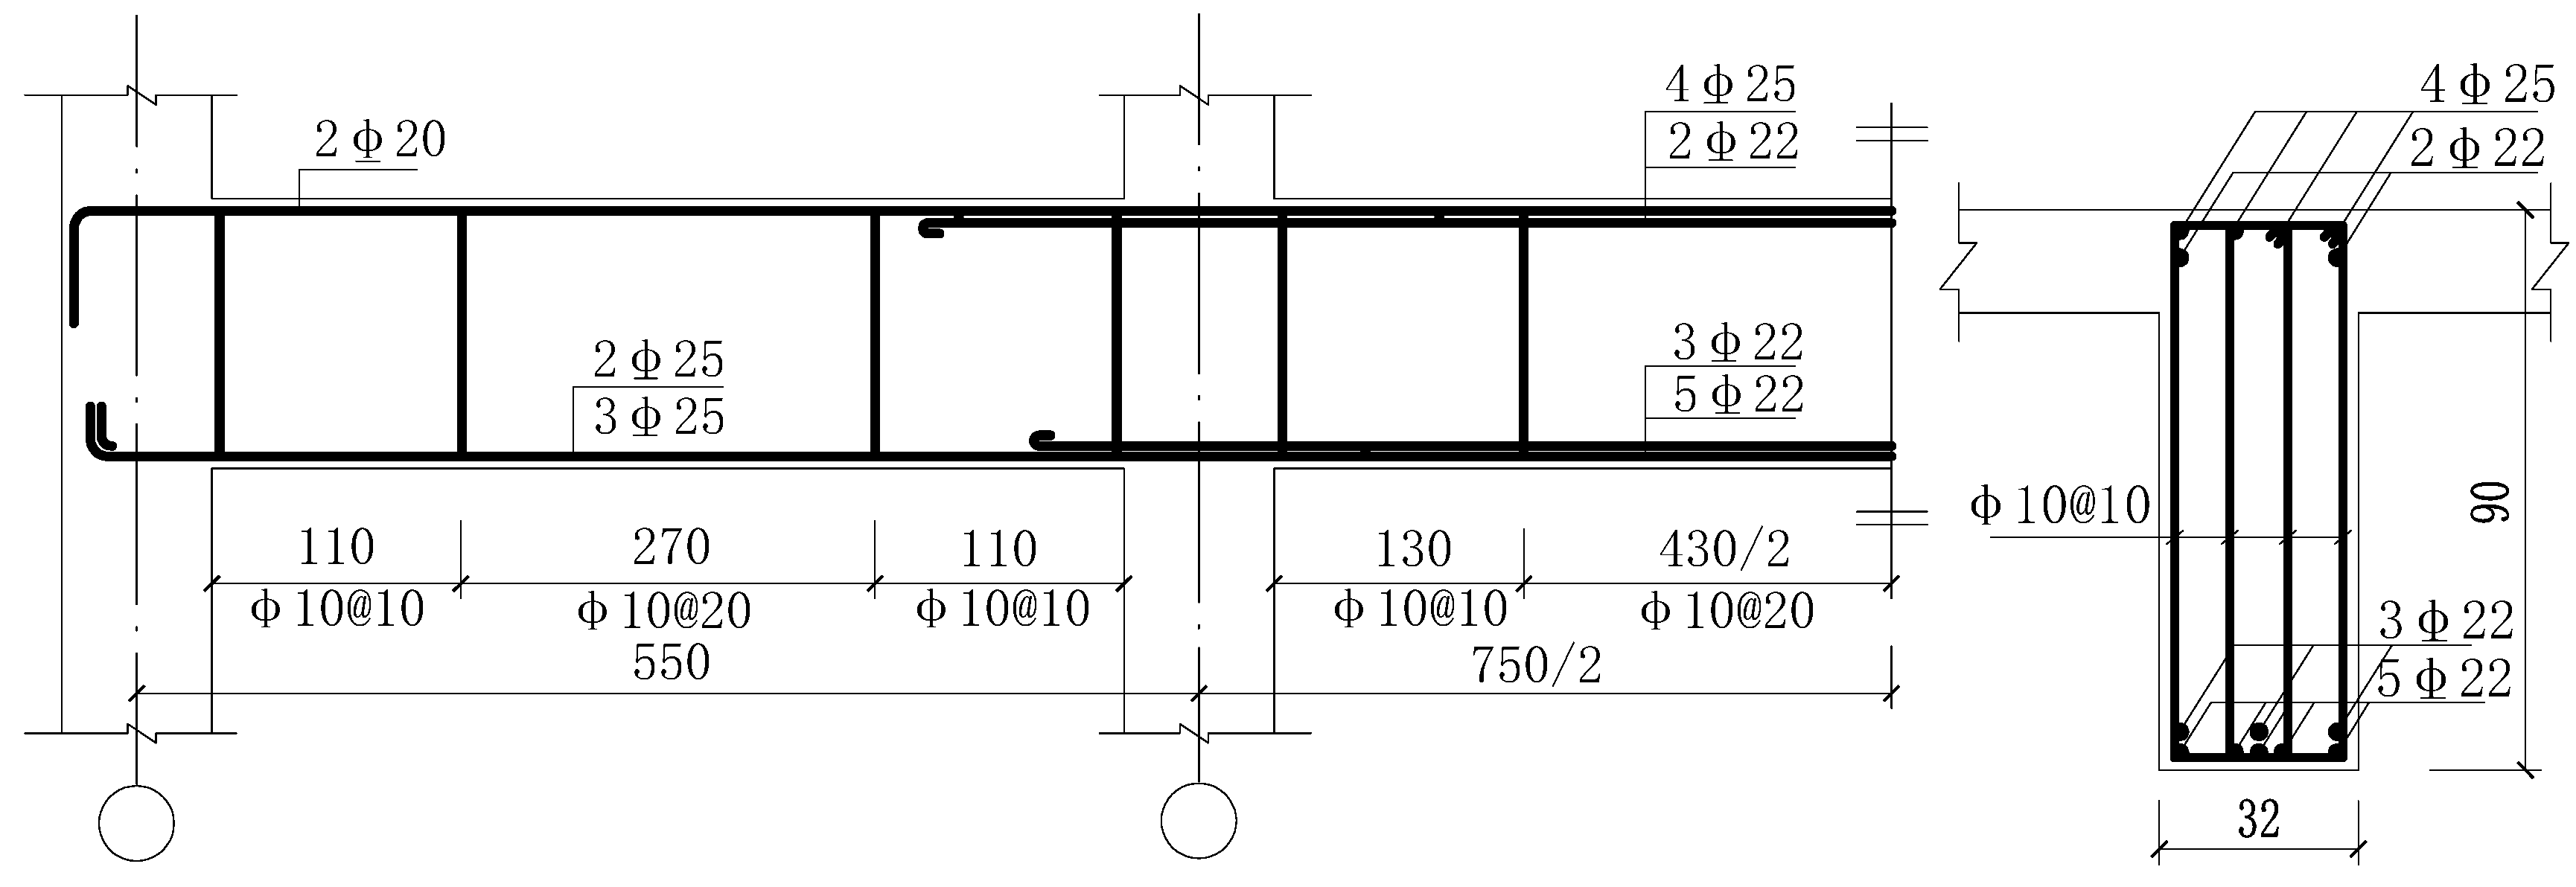
By consulting the relevant design data of a historical building on the campus of Northeastern University, the general situation of the design and construction environment of the project was clarified. Through comparative analysis, the element type and boundary conditions were determined and the parameters of constant and live loads were taken as examples.
(3)
Considering various existing data fusion algorithms and their practicability, the rough set and neural network were integrated to complement each other and a rough neural algorithm was constructed to further improve the accuracy of data fusion and to reduce the time required for fusion.
(4)
On the basis of extensive access to the relevant literature, existing research on the time-variance of structural safety factors, such as concrete carbonization, prestress loss, concrete strength, and steel corrosion, was integrated and combined with the internal force analysis of the main beam structure. From this, the safety assessment database of the main beam structure was established and specific classification standards of the safety assessment grade were obtained by cluster analysis. The rough data set was used to reduce the attribute index of the database, thus producing a simplified database. The designed neural network was then trained using these data.
(5)
The trained neural network was applied here to the evaluation of the main beams of a historical building on the campus of Northeastern University. Based on the predicted results given by the neural network, the corresponding safety level of the main beam structure was accordingly given.

3.2. Discussions Summary

Based on the current research and application status of existing structural safety assessment methods and combined with the feasibility of data fusion application in structural state assessment, this study continued to pursue research in the following four aspects:
(1)
In the existing structural evaluation method used in the process of concrete implementation, human subjective factors have a great impact on the results and the dependence on the engineering experience of experts, which reduces the credibility of the final evaluation results.
(2)
Research on structural safety assessment and early warning are clearly insufficient, being basically in the theoretical research and trial stage, and can be practically ap-plied to structural safety assessment. At the same time, structures are very complex systems with various factors interrelated to, interacting with, and influencing each other. Therefore, it is clearly inappropriate to use single-index assessment for structural safety assessment. How to consider all influencing factors comprehensively and suitable for practical engineering is a problem worth studying.
(3)
The establishment of a finite element model (FEM) can provide reference for theoretical research and analysis to a certain extent, but there are usually some errors in the initially established FEM. Is it possible to better establish the FEM and ensure that the calculation results from the model can truly reflect the actual stress state of the structure, thus laying a good foundation for subsequent research work? This is also an aspect worth considering.
(4)
A data fusion algorithm is the core part of the whole data fusion work. A reasonable fusion algorithm combined with a relatively accurate FEM can ensure the accuracy of structural safety assessment work and make the evaluation work more efficient.
A rough set and neural network data fusion algorithm was applied for information fusion of the database. The rough set was then used to reduce the input dimension of the neural network. On this basis, the neural network was trained to learn and predict. Such research results have the possibility to be applied in practical engineering.
Data fusion technology and structural safety assessment have the same purpose and requirements. In essence, structural evaluation deals with various information of the structural operational state and make extensive decisions on structural system operation and the damage state based on existing knowledge. Second, data fusion technology and structural safety assessment have the same functional model. The information source that provides the original information, that is, the object of diagnosis, yields the monitoring diagnosis results after various information processing procedures. This technology is applied to fault monitoring, diagnosis, and alarm systems such that the accuracy of obtaining information on the state of the object can be improved. The two complement each other, and are actually a good combination under the new technology.

4. The Establishment of Historical Building Safety Assessment Model

In a normal environment, steel corrosion, concrete carbonation, and overload are several important factors that reduce the bearing capacity of main beam structures of a building. Considering that the external environmental conditions rely upon the actual project, this study synthesized the research results of experts and scholars in these aspects. Factors that cause the attenuation of the bearing capacity of concrete beams were focused on, including concrete carbonization, ordinary steel bar corrosion, freeze–thaw, and overload. The goal was to find the evaluation index of the safety assessment of the main girder of the building. Then, the safety assessment standard database was comprehensively established for main girders of the project, and the safety assessment of the main girder was prepared based on multisource data fusion.

4.1. Determination of Influencing Factors on Safety Assessment

To evaluate the safety of the main beams of the established building, it was necessary to clarify the factors affecting the beams’ safety states. However, the beam structure was a complex synthesis of many influencing factors, with factors not acting alone. Therefore, it was necessary to determine the main factors affecting the safety status of the main beams so as to facilitate the analysis and evaluation of the main beam structure from both qualitative and quantitative perspectives.

4.1.1. Concrete Carbonation Time-Varying Model

The carbonation of concrete is due to the fact that carbon dioxide (CO2) in the air penetrates into the interior of the concrete and produces a series of chemical reactions with alkaline substances produced by hydration, which produce calcium carbonate and other substances. The volume of calcium carbonate and other products produced by concrete carbonation is ~1.17 times that of the original hydration products, which reduce original voids inside the concrete, thereby enhancing concrete strength and compactness and indirectly reducing the CO2 diffusion rate inside the concrete. However, CO2 is an acidic gas with water, and the long-term carbonization of concrete will cause its pH value to decrease. When the pH value is <7, a steel bar can be corroded as the protection of the alkaline environment is lost. Due to single- and limited-detection methods, the carbonization of concrete in the general atmospheric environment is the most important manifestation of the deterioration of concrete structure performance. This study considered the influence of concrete carbonization on the bearing performance of the main beams.
Scholars abroad have presented a variety of calculation models for carbonization depth from the perspective of influencing factors of concrete carbonization through actual engineering carbonization investigation statistics, outdoor burst tests, and rapid carbonization tests. This study adopted the practical model of carbonization depth of ordinary concrete given in the literature [23]. The calculation model was as follows:
X t = k t ,   k = 2.56 K m k j k c o 2 k p k s T 4 1 R H · R H 50.7 f cuk 0.76
where K m is the uncertain random variable of the calculation model; K j the correction coefficient, with the diagonal at 1.4 and noncorner 1.0; K C O 2 the influence coefficient of CO2 concentration, which is 1.2–1.8 when the population is dense; K P is the influence coefficient of the pouring surface, with 1.0 taken according to the actual engineering survey; K S is the working stress coefficient, at 1.0 in compression and 1.1 in tension; RH is the annual average relative humidity of the environment where the building is located, taking 70% as the average; and T is the annual temperature of the environment in which the structure is located, taking 20 °C as the average.
Because the main beams in the engineering background were designed according to the old code, it was necessary to convert the concrete and strength grades of the new and old codes, which were converted according to the following formula, expressed as
f c u , k = 1 1.645 δ f 0.95 1 δ f R b
where f c u , k is the concrete strength grade of this specification (MPa); R b is the original concrete grade; and δ f is the coefficient of concrete variation.

4.1.2. Time-Varying Model of Steel Corrosion

Before concrete carbonization, the pH of the environment in which the steel bar is located is >12, and the steel bar is protected from corrosion under the protection of a surface passivation film. However, with the development of carbonization, the pH of concrete continues to decrease, eventually damaging the passive film of the steel bar. Water and air then contact the steel bar and cause corrosion of the steel bar.
In the current durability research, the corrosion of steel bars has mostly been studied for the corrosion of longitudinal bars. In practice, the stirrups often corrode first, and stirrups at the overlap with the longitudinal bars corrode more seriously. When the corrosion rate of longitudinal bars reaches 5–10%, the stirrups can be corroded and broken. The existence of stirrups mainly improves the compressive-bearing capacity and shear-bearing capacity of the structure, and the closer the stirrup spacing is, the greater the effect. Because this study mainly focused on the bending bearing capacity of the main beams, only the corrosion of the longitudinal reinforcement was considered.
The research focus of steel corrosion law is the corrosion rate of steel. Based on a large amount of experimental data, the relationship between the corrosion rate of steel bars over time has been fitted [24], and can be expressed as
i c o r r t = 0.85 i c o r r 0 t 0.29
i c o r r 0 = 37.8 1 w c C o 1.64
where i c o o r is the initial corrosion rate of the steel bar (µA/cm); w/c is the water-binder ratio of concrete; C 0 is the thickness of the protective layer concrete (mm); and t is the corrosion time of the steel bar (s).
Because the corrosion of steel bars produces different forms, it can be divided into two forms: uniform and local corrosion. Uniform corrosion refers to the corrosion degree of each point of the steel bar section being consistent, that is, the speed of corrosion along the outer contour is consistent. Local corrosion occurs in the local area of the steel bar section and often occurs at cracks of the component concrete, resulting in high-density iron dioxide. The corrosion of steel bars is one of the reasons for degradation of the bearing capacity of the main girder of an existing structure. To study the bending concrete girder structure, and based on the principle of least squares method, the time-varying model of the cross-sectional area of corroded steel bars was obtained by the Monte Carlo method [25], expressed as
(1)
Uniform corrosion
μ g t = μ g 0           t < t p μ g 0 1 0.00195 t t p           t t p , and
(2)
Local corrosion
μ g t = μ g 0         t < t p μ g 0 1 0.00193 t t p         t t p
where μ g ( t ) is the average value of the cross-sectional area of the reinforcement after t years (mm2), μ g 0 is the average value of the initial cross-section of the reinforcement (mm2), and t p is the time at which the reinforcement begins to rust (s).
The end time point of concrete carbonation life was taken as the beginning time point of steel corrosion, and the beginning time point of steel corrosion as t i = c x max k 2 50.89 36 4.392 2 11.5.
The steel corrosion rate was expressed as
η t = 1.0   t < t p 1 0.00195 t 4.85   t t p

4.1.3. Concrete Strength Time-Varying Model

In the normal environment, if the main beams is exposed to the air for too long, due to the influence of various loads and environmental conditions, the initial defects and cracks inside the structure will continue to expand, resulting in a decrease in the compressive strength of concrete. Therefore, it is not appropriate to use the design value of concrete when calculating the bearing capacity of the main beams in any service period.
Based on the fact that the strength of concrete obeys normal distribution and, on the basis of the measured compressive strength of concrete in buildings and existing exposure tests, Niu [26] constructed a time-varying model of statistical parameters of compressive strength of concrete under general atmospheric conditions. The time-varying model of average concrete strength was expressed as
μ f t = η t μ f 0   and
η t = 1.4529 e 0.0246 ln t 1.7154 2
where μ f 0 is the average compressive strength of concrete when its age is 28 d (MPa), and η t is the function of average concrete strength changing with time.
The time-varying model of standard deviation of concrete strength is expressed as
σ f t = ξ t σ f 0   and
ξ t = 0.0305 t + 1.2368   ,
where σ f 0 is the strength standard deviation of concrete at 28 d and ξ t is the function of the concrete strength standard deviation changing with time.
In this section, the adoption of the strength degradation formula of structural concrete proposed by Professor Niu is described. The strength of concrete in the early stage (generally within 10 y) was observed to increase with time, and then in the later stage (generally after 10 y), to decrease with time, but the strength reduction was not very large (Figure 2). Even if the concrete age reaches 100 y, its strength can still meet the original design strength requirements.

4.1.4. Freeze–Thaw Action

Freeze–thaw action occurs throughout the service period of the structure. In the early stage, the structural loss caused by freeze–thaw is less, or even nonexistent, due to the continuous hydration of unhydrated cement in high-strength concrete to achieve improvement of the frost resistance of the concrete members, as well as other factors. However, in the later stage, with the accumulation of structural freeze–thaw action, the rate of structural loss accelerates. The research of Zhu [27] from Yangzhou University has shown that, after 125 freeze–thaw cycles, the proportion of structural loss caused by freeze–thaw relative to the total loss is not negligible and the freeze–thaw loss of general components accounts for more than 5% of the total loss.
A large number of practical studies at home and abroad show that the main factors affecting the frost resistance of concrete are the water–cement ratio and gas content, as well as the content; quality; and bubble properties (bubble parameters) of admixtures, such as fly ash. In addition, the total amount of cementing materials also has effects. Through the multiple regression method, the multiple regression equation [28] of the relationship between the number of frost resistance cycles of concrete and water–cement ratio, gas content, and fly ash content was established, and is expressed as
N = A + 1 1.5 e 11.188 W C 0.794 0.01307 f
where N is the maximum number of freeze–thaw (quick freeze) cycles the concrete can stand; A is the air content of concrete (%); W/C is the water–binder ratio; and f is the fly ash content (wt%).
The air content of concrete was ~4%, the water–binder ratio 0.4/1, and the fly ash 11 wt%. Substituting these values into the formula obtains N = 4 + 1 1.5 · e 11.188 0.4 0.794 0.01307 × 11 = 795 times.
Thus, the number of freeze–thaw cycles under natural conditions was 795 × 12 = 9540.

4.2. Selection of Safety Assessment Indicators

According to the results in Section 4.1, the factors affecting the main beams of the structure were generally divided into three categories: environmental, load, and material factors. The environmental factors mainly included high- and low-temperature environments and corrosive gas and liquid. The load factors mainly included high-stress effects, high- and low-cycle fatigue damage, and overload. The material’s own factors mainly included concrete shrinkage and creep effects, reinforcement corrosion, concrete strength time-varying effects, reinforcement strength time-varying effects, concrete carbonization, and alkali aggregate reaction. Combined with practical engineering experiences and operability in northern China, seven indices, including apparent inspection, carbonization depth, concrete strength, steel bar area, freeze–thaw cycle (outdoor components), temperature, and overload conditions, were selected as the attribute indices of the evaluation database.
The established evaluation model is shown in Figure 3 below:
Among the seven evaluation indices in the above model, the apparent inspection score P1 was the value of a random variable, which was mostly related to the engineering experience and knowledge level of inspection technicians and, thus, the great uncertainty. In this section, a group of random numbers between 0 and 1 were generated randomly by MATLAB programming to simulate the apparent inspection score of historical buildings. These numbers were observed to be consistent with the trend that the apparent inspection scores of buildings have been growing lower over time. The carbonization depth P2 was mainly used to determine the corrosion degree of reinforcement. A time-varying model was adopted for concrete strength P3, which generally conformed to the trend that strength first increased and then decreased. The influence of P4 on historical buildings mainly manifested by causing a reduction in the concrete strength and elastic modulus to different degrees. The steel bar area P5 was mainly calculated from the angle of corrosion of steel bars or prestressed tendons according to their respective time-varying rates. In the case of overload P6, the bending moment effect values at 1.0, 1.15, 1.35, and 1.5 times of the standard crowd load values were considered. The temperature effect P7 considered the subsequent overall warming and cooling and used discrete numbers “0” and “1”, respectively, in the safety assessment database of the building’s main beams.

5. Establishment of Evaluation Database

5.1. Determination of Safety Evaluation Index

To judge the bearing capacity of the main beams more objectively, the safety identification coefficient K [29] of the main beam structure was defined as
K = R / γ 0 S
where R is the nominal resistance of the main beam structure (each component); S the nominal load effect of the main beam structure (each component); and γ0 the importance coefficient of the structure, with the safety grade at 1–3 and corresponding coefficients of 1.1, 1.0, and 0.9, respectively.
Taking the continuous main beams, which were the main bearing component in the building, as an example, to reflect the relative importance of the midspan section of the middle and edge spans, the corresponding K value of each section was weighted. The corresponding weighting coefficients of midspan sections of the left, middle, and right spans were 0.3, 0.4, and 0.3, respectively:
K = 0.3 K 1 + 0.4 K 2 + 0.3 K 3
where K1, K2, and K3 represent the corresponding K of the midspan sections of the left, middle, and right spans, respectively.
It can be seen from Equation (13) that the smaller the value of K was, the less the bearing capacity of the structure met the current operational needs and the more the structure was inclined to an unsafe state, and vice versa. However, it should be noted that the K obtained by the above series of calculations only depended on the output of the benchmark finite element model and did not take apparent checks into account. To make the entire safety assessment work more comprehensive and detailed, the above-calculated K and apparent inspection score P1 were weighted to obtain a new value, denoted as K*, expressed as
K = 0.1 P 1 + 0.9 K

5.2. Calculation of Sample Data

To further explain the source of the sample data, this section used a historical building on the campus of Northeastern University as the research object. The building was completed in 1952. The main structure of this building is a frame structure with an asymmetric “L”-shaped layout of and a building area of 10,500 m2 (shown in Figure 4). Using the 71st year of operation of the building and the overload of 1.15-fold the main structural beams as an example, the calculation process of the sample data was given. The method of obtaining sample data of other historical building components (beams, plates, and columns) was the same as that for this example, so it will not be repeated in detail here.
For the sake of safety, the concrete protective layer of the main beams was 20 mm thick. According to the design drawing, the concrete was C25 concrete and the strength grade of the concrete was 24.11 MPa after conversion, according to Equation (2). According to Equation (1), the carbonization depth of the main beams under a standard carbonization environment was 17.65 mm and its carbonization depth did not reach the critical maximum carbonation depth.
This had no effect on the freeze–thaw of the main structure beams, such that the strength and elastic moduli of the concrete were not reduced. After 71 y of operation, buildings have certain apparent damage and, the longer the operation time, the lower the apparent score will be. However, due to the great uncertainty of the apparent inspection score, a set of values was randomly generated to simulate the apparent inspection score, producing a generated score of 0.8021.
According to archived data of architectural drawings, the section of the three-span continuous main beam b × h was 32 × 90 cm, with a span of 5.5 + 7.5 + 5.5 m; lower edge reinforcement of the side span main beam 3Φ25 + 2Φ25; lower edge reinforcement of the middle span main beam 5Φ22 + 3Φ22; and upper edge reinforcement of the middle span main beam 2Φ22 + 4Φ25. The model is shown in Figure 5.
The maximum bending moments of the middle sections of the left, middle, and right spans were calculated to be 462.26, 570.96, and 462.26 kN∙m, respectively, when the building had been operating for 71 y and there was an effective combination of 1.15-fold overload on the main beams. At this time, the maximum bending moment bearing capacities of the middle section of the left, middle, and right spans were 547.31, 586.95, and 547.31 kN∙m, respectively. Therefore, by substituting these values into Equation (1), K1 = 1.184, K2 = 1.028, and K3 = 1.184 were obtained. The K value obtained by weighting the three values according to Equation (2) was equal to 1.122. The obtained K was then weighted with the apparent check score according to Equation (3) and the obtained K* value at 1.090. The sample data obtained thus far corresponding to a building operating for 71 y with 1.15-fold of overload are shown in Table 1.

5.3. Establishment of Security Assessment Database

By analogy, different sample data were obtained, considering the effects of different combinations. Taking the main beams of the historical building component as the evaluation index, a total of 665 groups of data sets were established. The established evaluation data sets are shown in Table 2.

6. Data Fusion Based on Coarse Neural Network Algorithm

6.1. Data Discretization

The method adopted in this section was to discretize the groups of means and standard deviations (SD) in the unguided data box. This method took the mean value of a variable as the center and the value of plus or minus 2 SD as the group limit, then divided the variable values into 5 groups.
Using Clementine 12.0 as a data mining tool, the data flow of sample data was discretized by means of mean–SD grouping (Figure 6).

6.2. Attribute Reduction of Rough Set

Sample data were simplified using the adequacy theory of the rough set, which was divided into two steps: one was to kernel the conditional attribute set of the decision table and the other to reduce the conditional attribute value. The advantage of using rough set theory to preprocess data was that there was no need to predict any additional information, which was conducive to a centralized solution for the problem. Also, the reduction algorithm was simple, which was conducive to automatic operation with the help of a computer or software.
After eliminating the duplicate information from the sample data set, the conditional attribute value became six, which reduced the redundancy of the database and improved the operational efficiency. The attribute list after rough reduction is shown in Table 3, and the complete security evaluation database after reduction is shown in Table 4.

6.3. Determination of Safety Assessment Level

The set of all evaluation levels that the evaluator might make for the evaluation object is called the evaluation set. It is commonly used in the form of V = V 1 , V 2 , V 3 , V 4 , and reflects the degree to which the evaluated factor belongs to each evaluation level.
The reliability of the Industrial Plant Reliability Evaluation Standard (GB 50144, 2019) [31] includes safety and applicability, with the reliability divided into four levels by unit, item, and subitem. For the concrete structure or member, the bearing capacity is assessed by these four aspects of the evaluation rating: crack, deformation, structure, and connection. Among them, the subitem of carrying capacity is divided into four grades: A, B, C, and D; the specific value ranges are shown in Table 5. Among these, (1) Grade A indicates that the current national standards and specifications are met; (2) Grade B denotes a value slightly lower than the current national standard, but not affecting the safety of the structure or normal use; (3) Grade C means that the value not in line with the current national norms and standards and affects the safety or normal use of the structure, but the structure will not collapse immediately, although there is a need to implement reinforcement measures; and (4) Grade D indicates a value seriously not in line with the national standards which endangers the safety of the structure or indicates that it cannot be normally used, such that accidents can happen at any time and measures need to be taken immediately.
Referring to the relevant literature combined with the current codes and standards, and taking into account the attenuation trends of the carrying capacity of buildings and the corresponding maintenance reinforcement work, the carrying capacity levels of historical buildings were divided into five classes. These 1 to 5 classes were determined according to the different use requirements of the present stage. The evaluation set was V = V 1 , V 2 , V 3 , V 4 , V 5 . The specific corresponding situation of each category was described as:
Category 1: Important parts in the process of use, material, and performance are good. The secondary components work normally and function well, and can fully meet the current operation requirements. Category 2: The functions of important parts are good, some materials have slight defects and do not need special repair or strengthening. This kind of structure needs minor repair and maintenance. Category 3: In the materials of important parts, there are a large number of moderate defects or slight functional damages that have occurred. Corresponding technical measures should be taken to inhibit the development of injuries. Such houses are subject to minor or moderate repairs. Category 4: The building exhibits a serious threat to its normal function and constitutes a serious harm risk, resulting in a decline in the carrying capacity of the building. There is a need for maintenance and strengthening. Category 5: The house has major defects and the normal function of the house cannot be maintained. It is no longer suitable for operation or large-scale reinforcement work, such that demolition and reconstruction are required.
To determine the evaluation criteria for the safety level, 20 experts and scholars were asked for suggestions via questionnaires. The statistical results of the questionnaires are shown in Table 6.
It is worth noting that most of the suggestions given by experts and scholars were based on subjective experience and only provide a general range. To make the evaluation criteria more accurate and objective, the Kohonen neural network was used to cluster the evaluation database. In this section, Clementine 12.0 was selected as a data mining tool and a Kohonen neural network was established to perform cluster analysis on the database (Figure 7).
The Kohonen neural network chose an expert mode to train. The width was 5, length 1, number of neurons in the output layer 5, and the Kohonen network clustered the samples into 5 categories, corresponding to the classification of expert evaluation standards. Network learning rate attenuation selected linear attenuation.
Training of the Kohonen network consisted of two stages. Stage 1 was a rough estimation stage to capture the approximate pattern in the data, and stage 2 was the adjustment phase, which was used to adjust the graph to model more detailed features of the data. Each stage had the following three parameters:
(1)
Neighborhood. The nearest neighbor here was the neighborhood mentioned above and the nearest neighbor set to determine the starting size of the neighborhood radius. In this phase, the nearest neighbor in stage 1 was 2 and the nearest neighbor in stage 2 was 1.
(2)
Initial Eta (initial learning rate). In stage 1, the initial Eta was set to 0.3. After training, its value gradually decreased to the initial Eta of stage 2 (set to 0.1 in this section). In stage 2, the initial Eta gradually decreased from 0.1 to 0.
(3)
Cycle. The number of cycles was the number of iterations set for each stage of training. Each stage performed data processing a specified number of times. In this phase, the number of training cycles for stage 1 was 20 and for stage 2 was 150.
After the above parameter settings were completed, the Kohonen neural network was run to cluster the data stream. The clustering results are shown in Figure 8.
After cluster analysis, the entire evaluation database was grouped into five categories, and the specific evaluation criteria are shown in Table 7.
From the above results, the evaluation standard obtained by the Kohonen neural network was seen to be very close to the recommended evaluation standard given by most experts. Thus, it exhibited high credibility and was determined as the safety grade evaluation standard of the main beams of this building.

6.4. Training in Neural Network

To test the performance and correctness of the training model based on the crude neural network, 545 sets of data samples were extracted from the above simplified database as training sets and were input into the neural network for training. The remaining 120 sets of data samples were used as verification data to test the prediction accuracy of the network.
Neural networks are created and trained by neural network nodes and work by simulating a large number of interconnected simple processing units, which are arranged in layers. A neural network is usually composed of three parts: one the input layer, whose unit represents the input field; one or more hidden layers; and one output layer, whose units represent output fields. Cells are connected by varying connection strengths or weights. Clementine provides six training methods: fast, dynamic, multiple, pruning, radial basis function network (RBFN), and thorough pruning, to train neural network models (Figure 9).
The training method selected in this study was the fast mode, the method was the rough estimation method, and the appropriate type of neural network was selected according to data characteristics. Newer methods often produce smaller hidden layers, shorter training times, and better models. Here, the number of neurons in the input layer was n = 7 and the number of neurons in the output layer was m = 1. The neural network had three hidden layers, with numbers of neurons in the 1st, 2nd, and 3rd layers of l = 20, 15, and 10, respectively, and the duration set to 200 cycles. The neural network training error precision was set at k = 0.0001, with neural network accuracy >95%. The learning efficiency of the neural network was set as Alpha at 0.3, initial Eta at 0.3, Eta attenuation at 30, high Eta at 0.1, and low Eta at 0.01.
The prediction accuracy of the output variable by type was the proportion of the model that correctly predicted samples out of the total samples. For output variables of numerical type, the prediction accuracy was calculated as:
1 Y i Y i Y max Y min × 100 %
where Y i Y i is the absolute error between the i t h actual observed value and the predicted value of the model, and Y max and Y min represent the actual maximum and minimum values of the output variables, respectively. After training, the neuron node returned the optimal network to the generated network node; the feedback graph of network accuracy is shown in Figure 10.
The prediction accuracy of the model based on the training sample set was 99.45%. The neural network had high accuracy and thus had a satisfactory estimation.

6.5. Prediction of Neural Networks

After the neural network training was completed, 120 sets of calibration data were input into the neural network to obtain the predicted value based on the rough neural network algorithm. The data flow diagram of the neural network prediction is shown in Figure 11.
The K value of the 120 sets of data in the original security assessment database was taken as the theoretical value; that is, it was considered to be correct and the value output by the neural network was taken as the predicted value. The predicted value was determined on the basis of existing data training and was based on five attribute indices. The relative size between the two was compared and used as the basis for evaluating the prediction accuracy of the established neural network model. The comparison of theoretical and predicted values is shown in Table 8.
The neural network was observed to have high accuracy and a relative error of no more than 1.54%, which fully met the needs of the actual situation and could be applied to practical projects (Table 8).

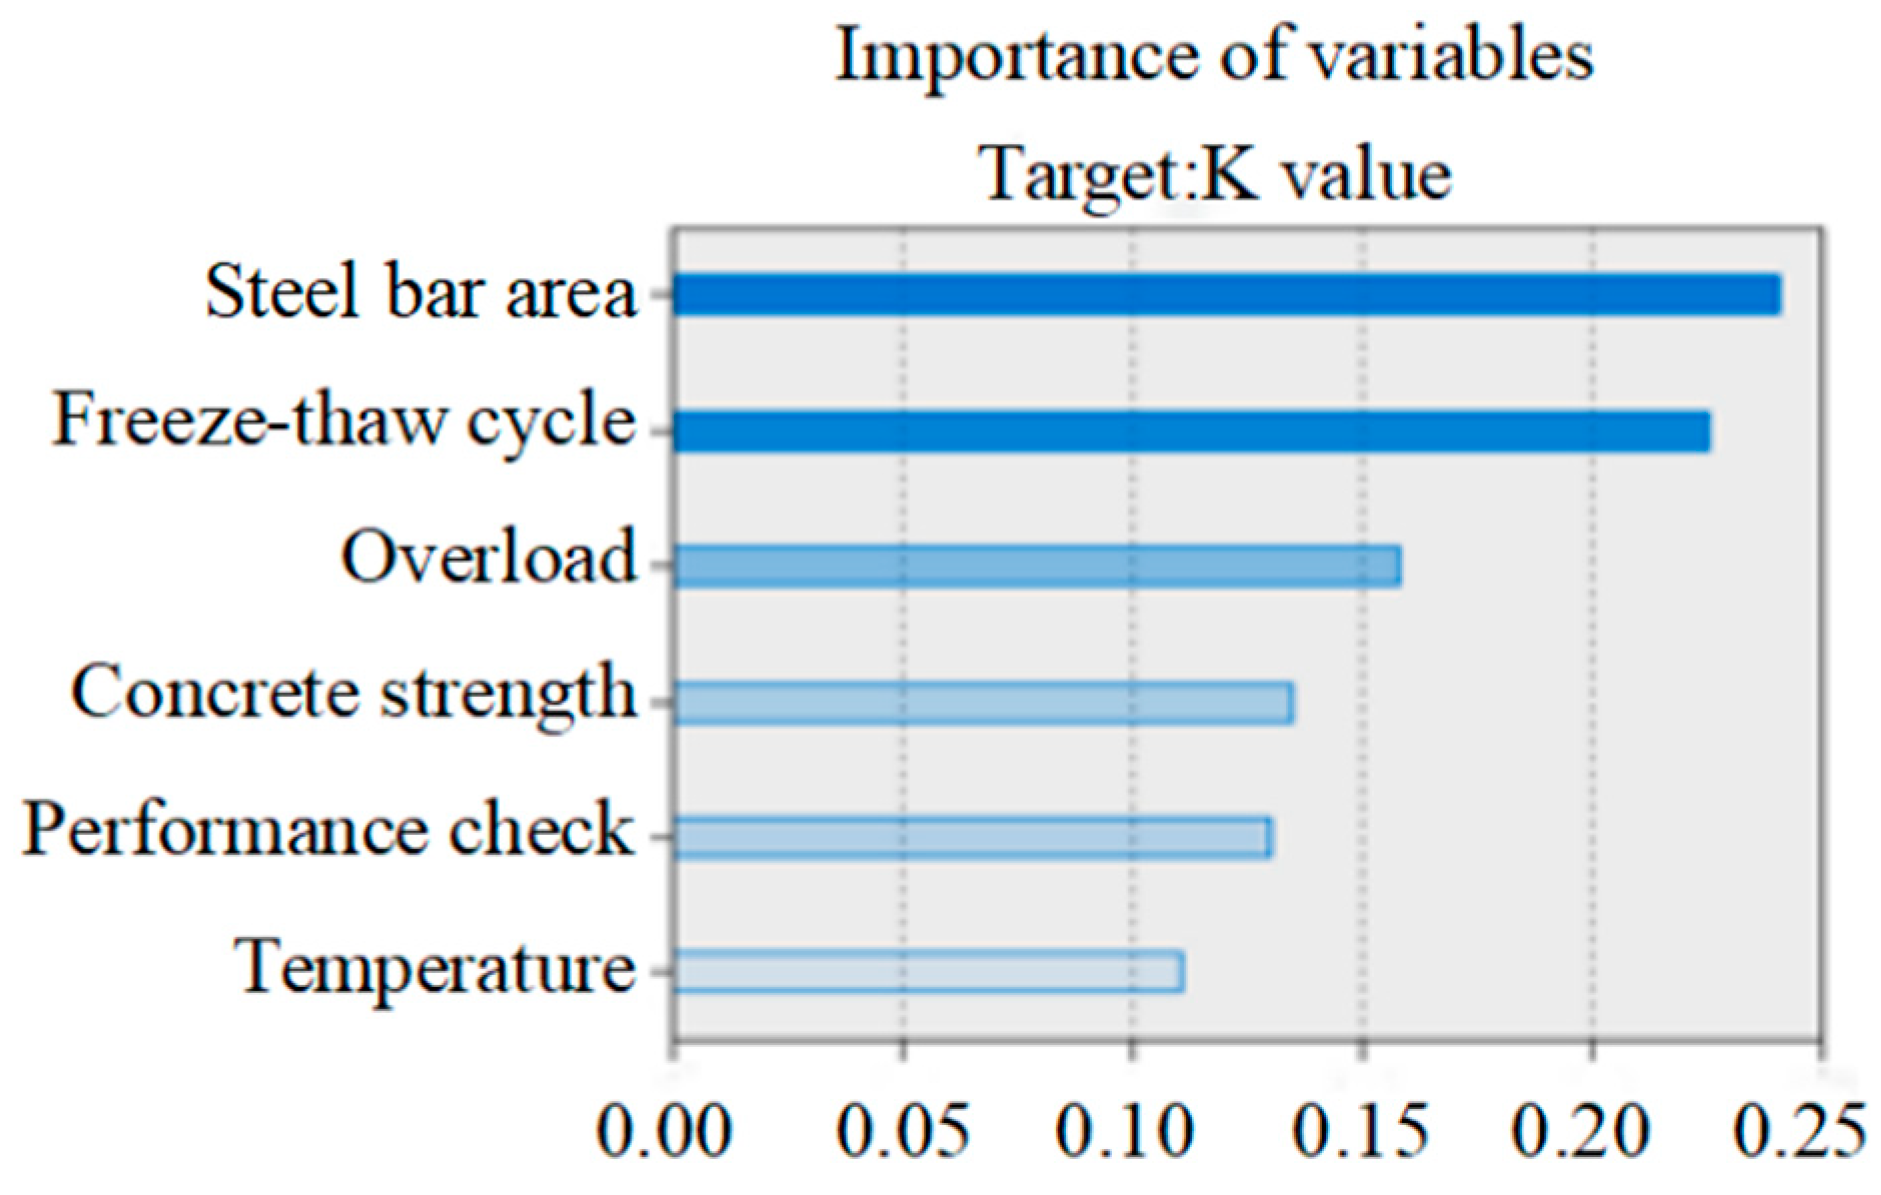
6.6. Sensitivity Analysis of Neural Network

Sensitivity analysis in neural networks is mainly used to analyze the impact of changes to input variables on output variables. The sensitivity coefficient is commonly used to represent the degree of influence. The influence of input variables on output variables increases with an increased sensitivity coefficient, and vice versa. Sensitivity analysis is aimed to obtain the sensitivity coefficient of each input variable to the output variable and its ranking results. On one hand, because the neural network is a direct data-mining algorithm, its internal calculation is a “black box“ for users, which makes people feel less confident in applying the neural network model. The advantage of sensitivity analysis is that it can open the black box to a certain extent so that people can have some intuitive understanding of the analytical results of neural network models. On the other hand, sensitivity analysis can help people to find the input variables that have a great influence on the output variables, remove the input variables that have little influence, and then effectively reduce the number of input variables to improve model accuracy.
Through sensitivity analysis of the neural network, the importance ranking results of the input variables in this study are shown in Figure 12.
The steel bar area was observed to be the most important input variable, and the subsequent order of importance was freeze–thaw cycle, overload, concrete strength, apparent inspection, and temperature (Figure 12).

7. Conclusions

Taking a historical building on the campus of Northeastern University as our engineering background, this study drew reference from existing theoretical research results on structural influencing factors. We adopted the method of combining numerical simulation and data fusion to carry out research on the application of multifactor data fusion in the safety assessment of continuous beams. The main conclusions are as follows:
(1)
Considering the weight of surface inspection P1 of historic buildings and the weight of bearing internal forces of sections of continuous main beams at different positions, the safety appraisal coefficient of historic buildings was defined as K = 0.1 · P 1 + 0.9 · K . Using the 71-year-old building at Northeastern University as the research object, we found that the safety appraisal coefficient of historic buildings was 1.090 and the structural safety grade was 3.
(2)
According to the Reliability Evaluation Standard of Industrial Plants and combined with the suggestions of experts and scholars, the Kohonen neural network was constructed to cluster the database. It was then used to obtain the safety rating standard of historical buildings and verify the results using calculation data from continuous main beams samples in actual engineering. The results were consistent with the actual test results obtained from current buildings.
(3)
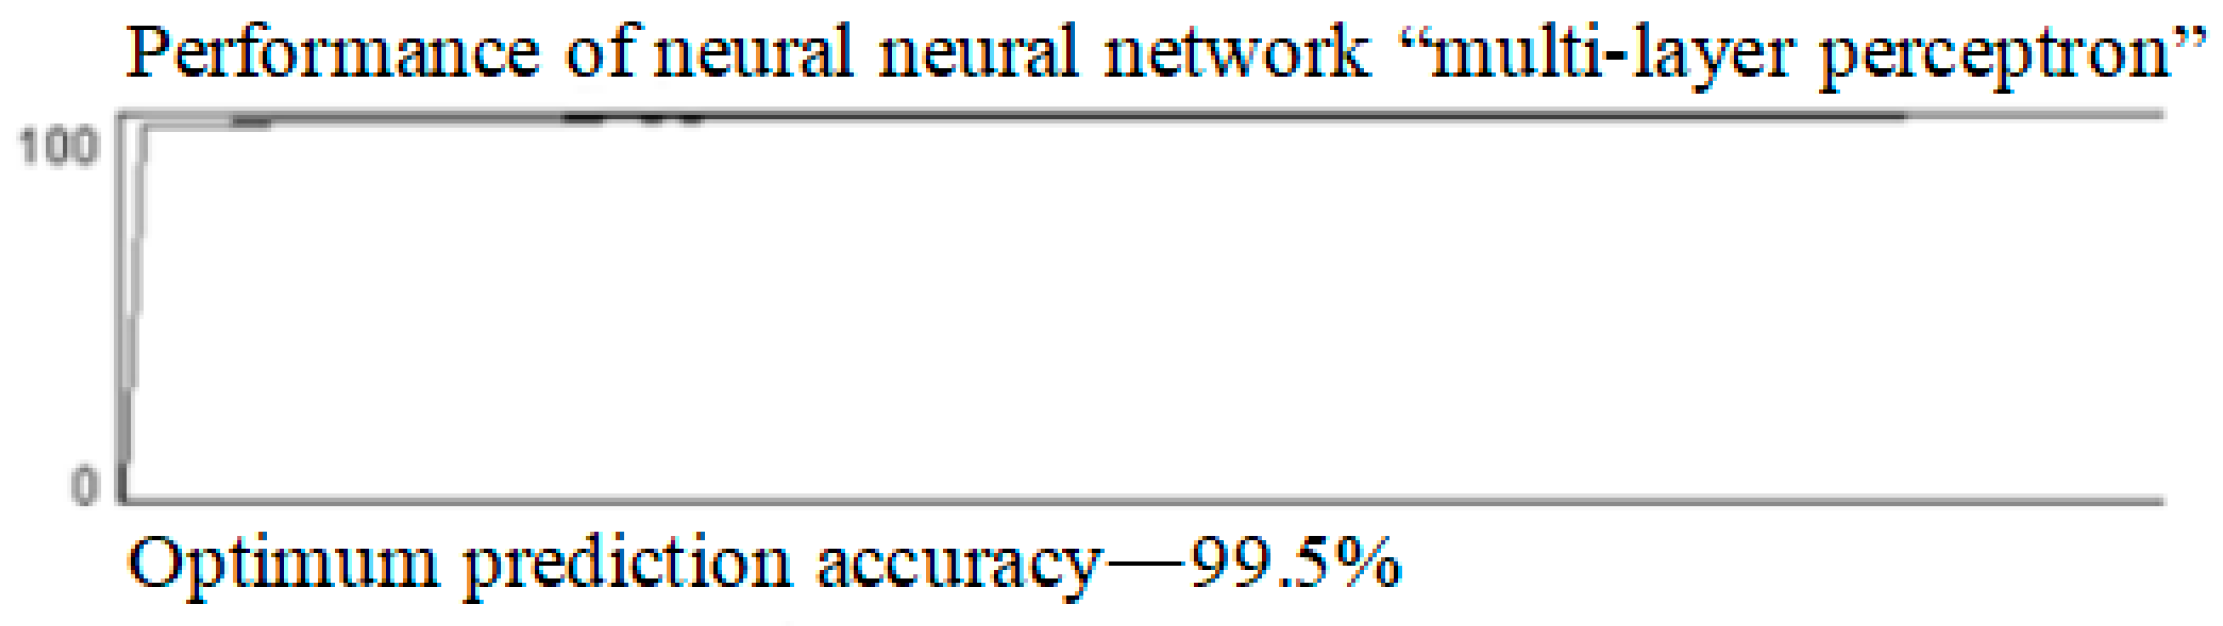
With the K value in the original safety evaluation database as the theoretical value and the output value of the neural network as the predicted value, it was concluded through analysis that the accuracy of the neural network was very high and its relative deviation was <1.54%, which could fully meet practical needs and be applied in practical projects.

Author Contributions

Conceptualization, methodology, software, validation, formal analysis, investigation, resources, and data curation, Y.C. and R.Z.; writing—original draft preparation, writing—review and editing, and visualization, Y.C. and Y.L.; supervision, project administration, and funding acquisition, Y.L., J.X., D.G. and L.S. All authors have read and agreed to the published version of the manuscript.

Funding

This work was supported by the Natural Science Foundation of Liaoning Province (No. 2019-MS-265) and Project of Science and Technology Research, Education Department of Liaoning Province (No. 2021-LJKZ0589).

Data Availability Statement

Data used to support the findings of this study are available from the corresponding author upon request.

Conflicts of Interest

The authors declare that there are no conflict of interest regarding the publication of this paper.

References

  1. Dong, J.; Zhuang, D.; Huang, Y.; Fu, J. Advances in Multi-Sensor Data Fusion: Algorithms and Applications. Sensors 2009, 9, 7771–7784. [Google Scholar] [CrossRef] [PubMed] [Green Version]
  2. Rawat, S.; Rawat, S. Multi-sensor data fusion by a hybrid methodology-A comparative study. Comput. Ind. 2016, 75, 27–34. [Google Scholar] [CrossRef]
  3. Smith, D.; Singh, S. Approaches Multisensor Data Fusion in Target Tracking: A Survey. IEEE Trans. Knowl. Data Eng. 2006, 18, 1696–1710. [Google Scholar] [CrossRef]
  4. Ahmed, N.R.; Sample, E.M.; Campbell, M. Bayesian Multicategorical Soft Data Fusion for Human-Robot Collaboration. IEEE Trans. Robot. 2012, 29, 189–206. [Google Scholar] [CrossRef]
  5. Zhao, G.; Chen, A.; Lu, G.; Liu, W. Data fusion algorithm based on fuzzy sets and DS theory of evidence. Tsinghua Sci. Technol. 2019, 25, 12–19. [Google Scholar] [CrossRef]
  6. Majumder, S.; Pratihar, D.K. Multi-sensors data fusion through fuzzy clustering and predictive tools. Expert Syst. Appl. 2018, 107, 165–172. [Google Scholar] [CrossRef]
  7. Weckenmann, A.; Jiang, X.; Sommer, K.-D.; Neuschaefer-Rube, U.; Seewig, J.; Shaw, L.; Estler, T. Multisensor data fusion in dimensional metrology. CIRP Ann. 2009, 58, 701–721. [Google Scholar] [CrossRef]
  8. Perez-Ramirez, C.A.; Amezquita-Sanchez, J.P.; Valtierra-Rodriguez, M.; Adeli, H.; Dominguez-Gonzalez, A.; Romero-Troncoso, R.J. Recurrent Neural Network Model with Bayesian Training and Mutual Information for Response Prediction of Large Buildings. Eng. Struct. 2019, 178, 603–615. [Google Scholar] [CrossRef]
  9. Xu, Y.; Lu, X.; Cetiner, B.; Taciroglu, E. Real-time Regional Seismic Damage Assessment Framework Based on Long Short-term Memory Neural Network. Comput.-Aided Civ. Infrastruct. Eng. 2021, 36, 504–521. [Google Scholar] [CrossRef]
  10. Bergstra, J.; Bengio, Y. Random Search for Hyper-parameter Optimization. J. Mach. Learn. Res. 2012, 13, 281–305. [Google Scholar]
  11. Ding, D.; Wu, J.; Zhu, S.; Mu, Y.; Li, Y. Research on AHP-based fuzzy evaluation of urban green building planning. Environ. Chall. 2021, 5, 100305. [Google Scholar] [CrossRef]
  12. Zhao, K.J. Study on Reliability Appraisal of the Structures Through Grey System Theory. Master’s Thesis, Tianjin University, Tianjin, China, 2005. [Google Scholar]
  13. Shao, S.; Zhang, K. An Improved Multisensor Self-Adaptive Weighted Fusion Algorithm Based on Discrete Kalman Filtering. Complexity 2020, 2020, 9673764. [Google Scholar] [CrossRef]
  14. Shi, C.; Du, Y. Evaluation of the collapse mode of isolated structures subjected multi-directional dynamic coupling excitation based on reliability theory. Structures 2021, 34, 1261–1275. [Google Scholar] [CrossRef]
  15. Huang, Y.; He, Z.; Yashima, A.; Chen, Z.; Li, C. Multi-objective optimization design of pile-anchor structures for slopes based on reliability theory considering the spatial variability of soil properties. Computers and geotechnics. Comput. Geotech. 2022, 147, 104751. [Google Scholar] [CrossRef]
  16. Liu, J.; Shi, C.; Gong, C.; Lei, M.; Wang, Z.; Peng, Z.; Cao, C. Investigation of ultimate bearing capacity of shield tunnel based on concrete damage model. Tunneling and underground space technology. Tunn. Undergr. Space Technol. 2022, 125, 104510. [Google Scholar] [CrossRef]
  17. Abdulrahman, M.L.; Ibrahim, K.M.; Gital, A.Y.; Zambuk, F.U.; Ja’afaru, B.; Yakubu, Z.I.; Ibrahim, A. A Review on Deep Learning with Focus on Deep Recurrent Neural Network for Electricity Forecasting in Residential Building. Procedia Comput. Sci. 2021, 193, 141–154. [Google Scholar] [CrossRef]
  18. Ferreira, P.; Ruano, A.; Silva, S.; Conceição, E. Neural networks based predictive control for thermal comfort and energy savings in public buildings. Energy Build. 2012, 55, 238–251. [Google Scholar] [CrossRef] [Green Version]
  19. Soleimani-Mohseni, M.; Thomas, B.; Fahlen, P. Estimation of operative temperature in buildings using artificial neural networks. Energy Build. 2006, 38, 635–640. [Google Scholar] [CrossRef]
  20. Shifat, T.A.; Hur, J.W. ANN Assisted Multi Sensor Information Fusion for BLDC Motor Fault Diagnosis. IEEE Access 2021, 9, 9429–9441. [Google Scholar] [CrossRef]
  21. Karaboga, D.; Kaya, E. Adaptive network based fuzzy inference system (ANFIS) training approaches: A comprehensive survey. Artif. Intell. Rev. 2019, 52, 2263–2293. [Google Scholar] [CrossRef]
  22. Ji, W.; Pang, Y.; Jia, X.; Wang, Z.; Hou, F.; Song, B.; Liu, M.; Wang, R. Fuzzy rough sets and fuzzy rough neural networks for feature selection: A review. Wiley Interdiscip. Rev. Data Min. Knowl. Discov. 2021, 11, e1402. [Google Scholar] [CrossRef]
  23. Wang, D.Y.; Ren, Z.J. The Solution of Datamining Based on Clementine. In Advanced Materials Research; Trans. Tech. Publications Ltd.: Stafa-Zurich, Switzerland, 2011; Volume 211, pp. 1082–1086. [Google Scholar]
  24. Straub, D.; Schneider, R.; Bismut, E.; Kim, H.-J. Reliability analysis of deteriorating structural systems. Struct. Saf. 2020, 82, 101877. [Google Scholar] [CrossRef]
  25. Zeng, C.; Zhu, J.-H.; Xiong, C.; Li, Y.; Li, D.; Walraven, J. Analytical model for the prediction of the tensile behaviour of corroded steel bars. Constr. Build. Mater. 2020, 258, 120290. [Google Scholar] [CrossRef]
  26. Niu, D.; Wang, Q.L. Models of Concrete Strength Changing with Time in General Air Environment. Ind. Constr. 1995, 25, 36–38. [Google Scholar]
  27. Zheng, Y.; Yang, L.; Guo, P.; Yang, P. Fatigue characteristics of prestressed concrete beam under freezing and thawing cycles. Adv. Civ. Eng. 2020, 2020, 8821132. [Google Scholar] [CrossRef]
  28. Mata, J. Interpretation of concrete dam behaviour with artificial neural network and multiple linear regression models. Eng. Struct. 2011, 33, 903–910. [Google Scholar] [CrossRef]
  29. Xu, W. Experimental Research and Analysis on Load-Carrying Capacity of the Existing Prestressed Concrete Girder Bridges. Ph.D. Thesis, Southeast University of Civil Engineering, Nanjing, China, 2006. [Google Scholar]
  30. Chen, Y.; Zhang, J.; Li, Y.; Li, J. Analysis of Bridge Health Detection Based on Data Fusion. Adv. Civ. Eng. 2022, 2022, 1–11. [Google Scholar]
  31. GB 50144-2019; Standard for Appraisal of Reliability of Industrial Buildings and Structures. China Architecture and Building Press: Beijing, China, 2019.
Figure 1. Flow chart of rough neural network algorithm [22].
Buildings 13 02022 g001
Figure 2. Time-varying function of the average strength of concrete.
Buildings 13 02022 g002
Figure 3. Safety evaluation model of a historical building.
Buildings 13 02022 g003
Figure 4. Appearance chart of historical building.
Buildings 13 02022 g004
Figure 5. Main beam structure of a historical building.
Buildings 13 02022 g005
Figure 6. Data flow of data discretization [30].
Buildings 13 02022 g006
Figure 7. Data flow of clustering by the Kohonen neural network.
Buildings 13 02022 g007
Figure 8. Bar diagram of clustering results.
Buildings 13 02022 g008
Figure 9. Data flow of training neural network [9].
Buildings 13 02022 g009
Figure 10. Feedback graph of network accuracy.
Buildings 13 02022 g010
Figure 11. Data flow of neural network prediction [30].
Buildings 13 02022 g011
Figure 12. Variable importance ranking results.
Buildings 13 02022 g012
Table 1. Table of sample data.
Apparent Examination, P1Carbonization Depth, P2Concrete Strength (Field Test), P3Area of Reinforcement, P5Overload, P6Temperature, P7K* Value
0.802118.14241.001.1501.090
Table 2. Database of security evaluation.
NumberApparent ExaminationCarbonizationConcrete StrengthFreeze–Thaw CyclesArea of ReinforcementOverloadTemperatureK* Value
10.990611.88 30.81641.00001.0011.2109
20.850816.86 25.139600.99321.0011.2013
30.843517.65 24.4210240.99121.0011.1914
3010.801617.20 24.8233280.92101.0001.0527
3020.721520.63 22.0637760.90741.1511.0519
3030.705428.86 17.4129440.93271.1501.0510
6630.139046.61 11.9758880.84301.5000.6637
6640.128347.82 11.7259520.84111.5000.6576
6650.117549.04 11.4860160.83911.5000.6515
Table 3. Result of attribute reduction by rough set.
Attribute NameApparent ExaminationCarbonizationConcrete StrengthFreeze–Thaw CycleArea of ReinforcementOverloadTemperature
Reduce or not
Table 4. Security evaluation database after attribute reduction
NumberApparent ExaminationCarbonizationConcrete StrengthFreeze–Thaw CycleOverloadTemperatureK* Value
10.990611.88 30.81641.0011.2109
20.850816.86 25.139601.0011.2013
30.843517.65 24.4210241.0011.1914
3010.801617.20 24.8233281.1501.0527
3020.721520.63 22.0637761.1511.0519
3030.705428.86 17.4129441.1501.0510
6630.139046.61 11.9758881.5000.6637
6640.128347.82 11.7259521.5000.6576
6650.117549.04 11.4860161.5000.6515
Table 5. Evaluation of bearing capacity of concrete structures or members.
Type of Structure or ComponentCarrying Capacity R/γ0 S
ABCD
Roof truss, bracket, roof beams, platform main beams, column, and intermediate, heavy-duty crane beamsK ≥ 1.00.92 ≤ K < 1.00.87 ≤ K < 0.92K < 0.87
General components (including floor, cast slab, and beam, etc.)K ≥ 1.00.90 ≤ K < 1.00.85 ≤ K < 0.9K < 0.85
Table 6. Questionnaire result statistics [30].
Proponent (%)SchemeEvaluation Standard
Level 1Level 2Level 3Level 4Level 5
35Plan 1K ≥ 1.301.20 ≤ K < 1.301.10 ≤ K < 1.201.00 ≤ K < 1.10K ≤ 1.00
40Plan 2K ≥ 1.201.10 ≤ K < 1.201.00 ≤ K < 1.100.90 ≤ K < 1.10K ≤ 0.90
25Plan 3K ≥ 1.251.15 ≤ K < 1.251.00 ≤ K < 1.150.95 ≤ K < 1.00K ≤ 0.95
Table 7. Standard for safety ratings.
Evaluation Standard
Level 1Level 2Level 3Level 4Level 5
K ≥ 1.201.10 ≤ K < 1.201.03 ≤ K < 1.100.93 ≤ K < 1.03K ≤ 0.93
Table 8. Comparison of theoretical and predictive values.
NumberTheoretical ValuePredicted ValueRelative Error (%)NumberTheoretical ValuePredicted ValueRelative Error (%)
1 1.501 1.481 1.332 61 1.029 1.028 0.097
2 1.479 1.488 0.609 62 1.021 1.020 0.098
3 1.463 1.441 1.504 63 1.016 1.016 0.000
4 1.447 1.448 0.069 64 1.008 1.004 0.397
5 1.431 1.434 0.210 65 1.006 1.003 0.298
6 1.418 1.426 0.564 66 1.000 1.002 0.200
7 1.400 1.407 0.500 67 0.997 0.997 0.000
8 1.390 1.399 0.647 68 0.993 0.995 0.201
9 1.379 1.389 0.725 69 0.990 0.990 0.000
10 1.377 1.368 0.653 70 0.986 0.986 0.000
11 1.372 1.381 0.656 71 0.982 0.983 0.102
12 1.363 1.370 0.514 72 0.979 0.978 0.102
13 1.355 1.357 0.148 73 0.970 0.970 0.000
14 1.342 1.349 0.522 74 0.966 0.965 0.104
15 1.334 1.340 0.450 75 0.961 0.961 0.000
16 1.331 1.335 0.300 76 0.960 0.958 0.208
17 1.325 1.328 0.226 77 0.954 0.954 0.000
18 1.308 1.315 0.535 78 0.951 0.950 0.105
19 1.298 1.296 0.154 79 0.944 0.944 0.000
20 1.288 1.292 0.311 80 0.940 0.938 0.213
21 1.279 1.284 0.391 81 0.937 0.937 0.000
22 1.269 1.272 0.236 82 0.931 0.931 0.000
23 1.255 1.256 0.080 83 0.927 0.927 0.000
24 1.244 1.245 0.080 84 0.923 0.921 0.217
25 1.231 1.233 0.162 85 0.917 0.915 0.218
26 1.226 1.230 0.326 86 0.913 0.913 0.000
27 1.217 1.220 0.247 87 0.906 0.907 0.110
28 1.210 1.211 0.083 88 0.901 0.900 0.111
29 1.208 1.243 2.897 89 0.899 0.902 0.334
30 1.201 1.202 0.083 90 0.891 0.895 0.449
31 1.193 1.191 0.168 91 0.886 0.888 0.226
32 1.188 1.188 0.000 92 0.880 0.882 0.227
33 1.176 1.175 0.085 93 0.876 0.875 0.114
34 1.172 1.169 0.256 94 0.872 0.871 0.115
35 1.164 1.166 0.172 95 0.868 0.872 0.461
36 1.162 1.165 0.258 96 0.862 0.860 0.232
37 1.154 1.152 0.173 97 0.858 0.858 0.000
38 1.147 1.149 0.17498 0.852 0.854 0.235
39 1.145 1.144 0.087 99 0.846 0.845 0.118
40 1.139 1.137 0.176 100 0.842 0.843 0.119
41 1.130 1.128 0.177 101 0.837 0.838 0.119
42 1.123 1.124 0.089 102 0.831 0.832 0.120
43 1.121 1.121 0.000 103 0.825 0.825 0.000
44 1.117 1.117 0.000 104 0.818 0.820 0.245
45 1.114 1.115 0.090 105 0.813 0.811 0.246
46 1.107 1.109 0.181 106 0.809 0.811 0.247
47 1.103 1.103 0.000 107 0.805 0.804 0.124
48 1.094 1.098 0.366 108 0.799 0.801 0.250
49 1.084 1.084 0.000 109 0.795 0.796 0.126
50 1.075 1.074 0.093 110 0.791 0.789 0.253
51 1.072 1.069 0.280 111 0.781 0.780 0.128
52 1.067 1.069 0.187 112 0.778 0.776 0.257
53 1.064 1.060 0.376 113 0.771 0.769 0.259
54 1.060 1.059 0.094 114 0.767 0.764 0.391
55 1.055 1.055 0.000 115 0.760 0.760 0.000
56 1.050 1.051 0.095 116 0.751 0.748 0.399
57 1.047 1.047 0.000 117 0.744 0.742 0.269
58 1.042 1.042 0.000 118 0.738 0.736 0.271
59 1.040 1.038 0.192 119 0.707 0.707 0.000
60 1.033 1.036 0.290 120 0.688 0.693 0.727
Disclaimer/Publisher’s Note: The statements, opinions and data contained in all publications are solely those of the individual author(s) and contributor(s) and not of MDPI and/or the editor(s). MDPI and/or the editor(s) disclaim responsibility for any injury to people or property resulting from any ideas, methods, instructions or products referred to in the content.

