
Linear and Nonlinear Earthquake Analysis for Strength Evaluation of Masonry Monument of Neoria
 ,
, 
Abstract
:1. Introduction
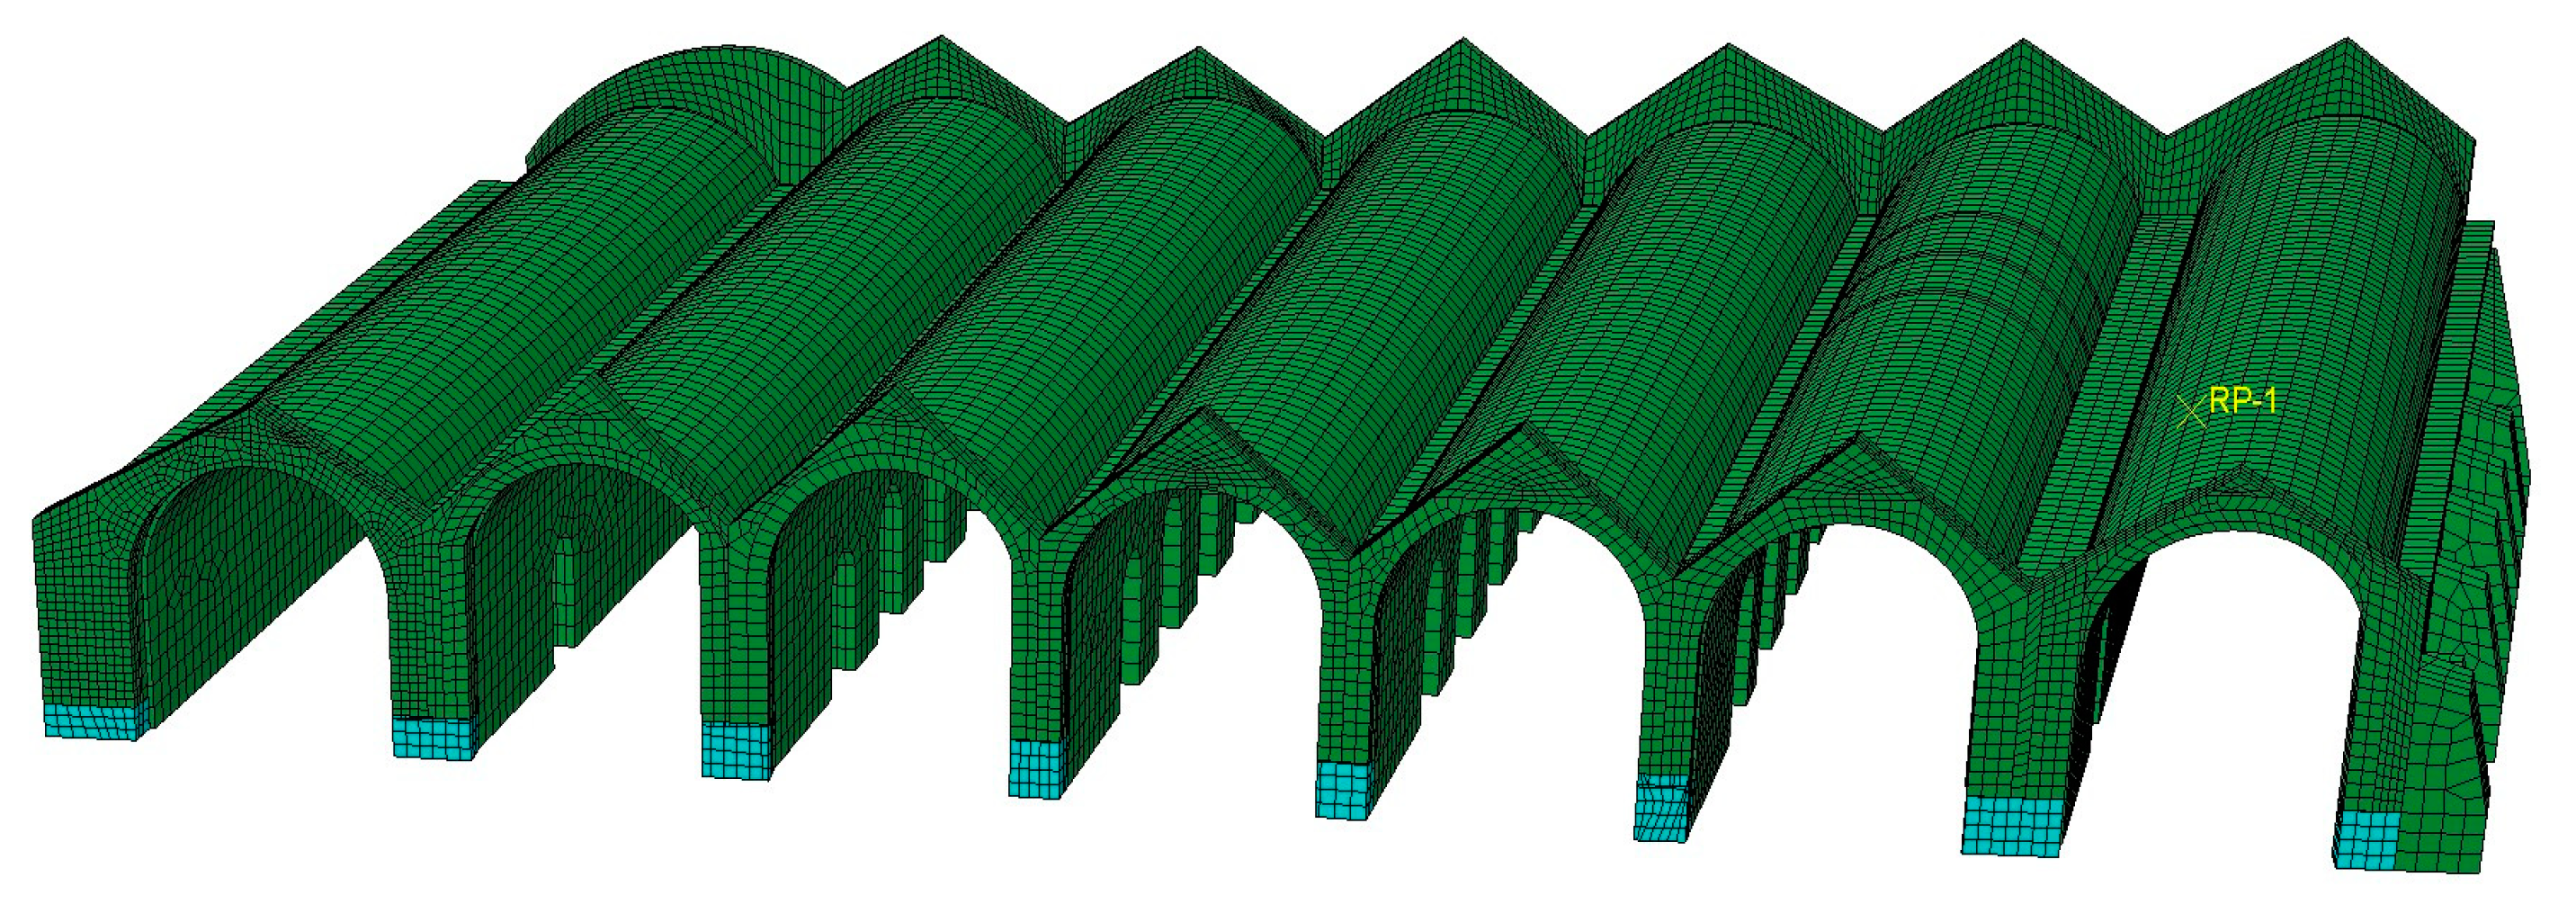
2. Brief Description of Neoria Masonry Monument
2.1. General Description and Material Properties
2.2. Details of the Response Spectrum Analysis
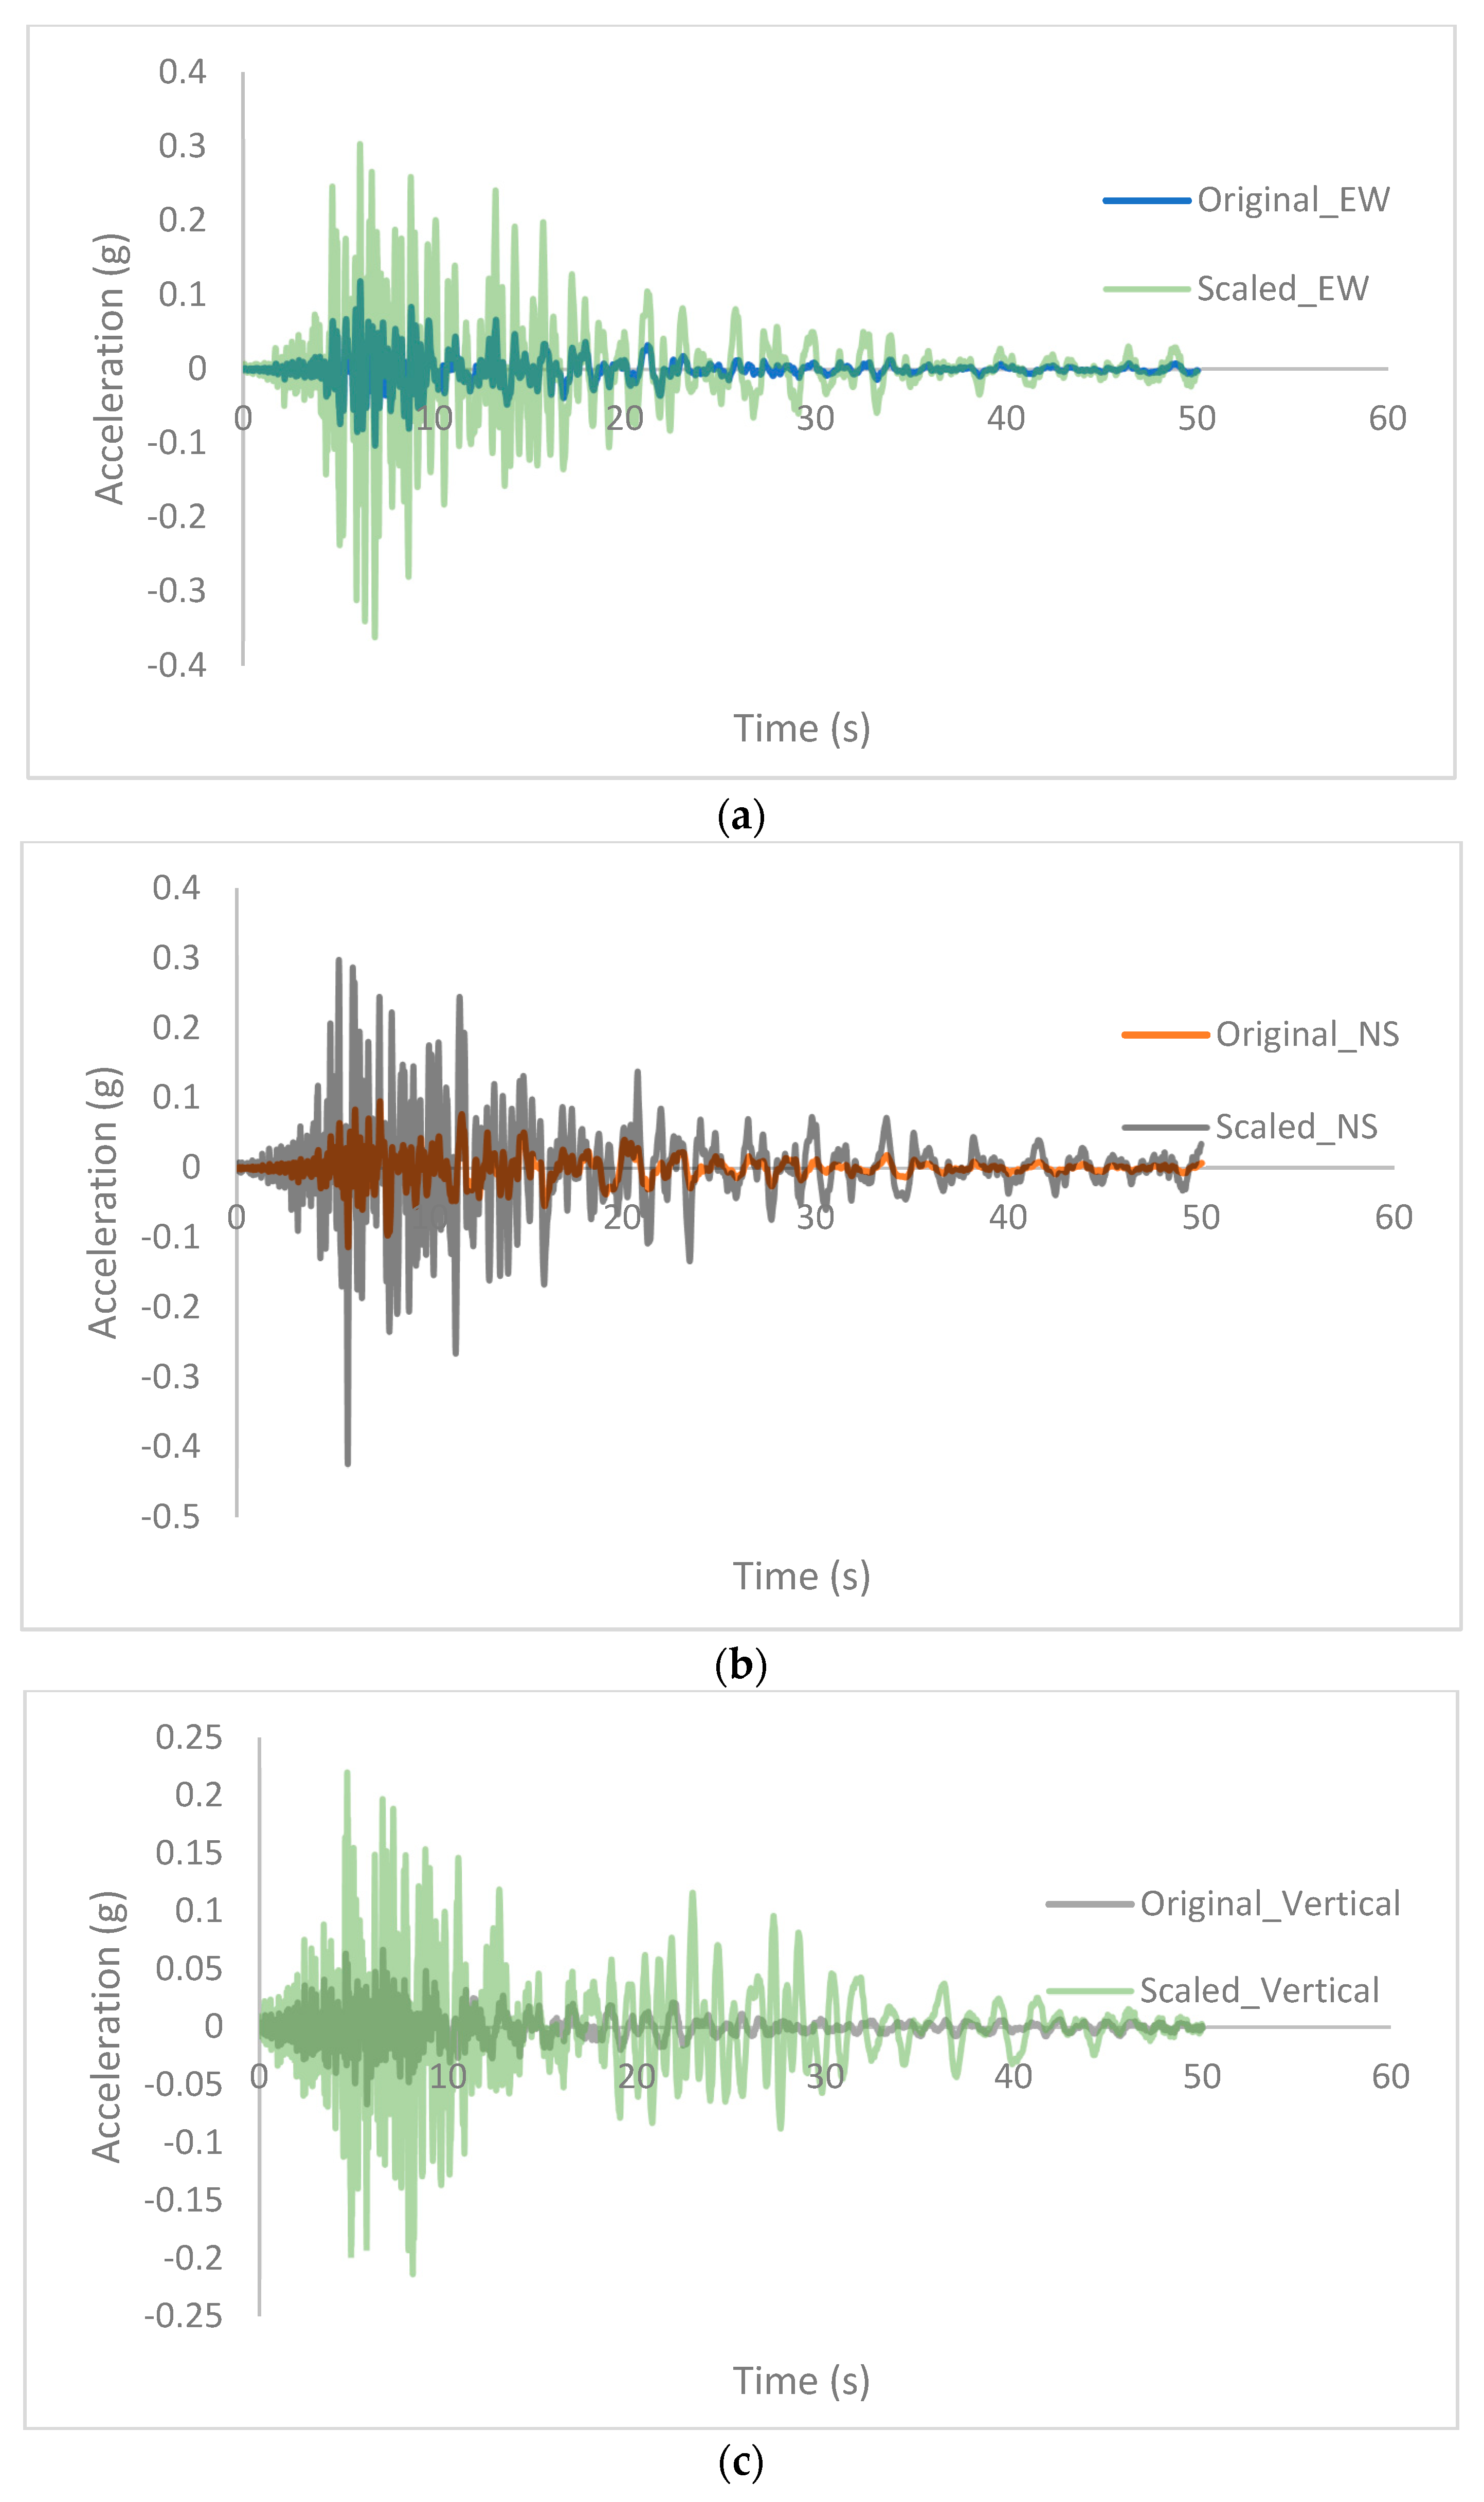
2.3. Time History Analysis
3. Results
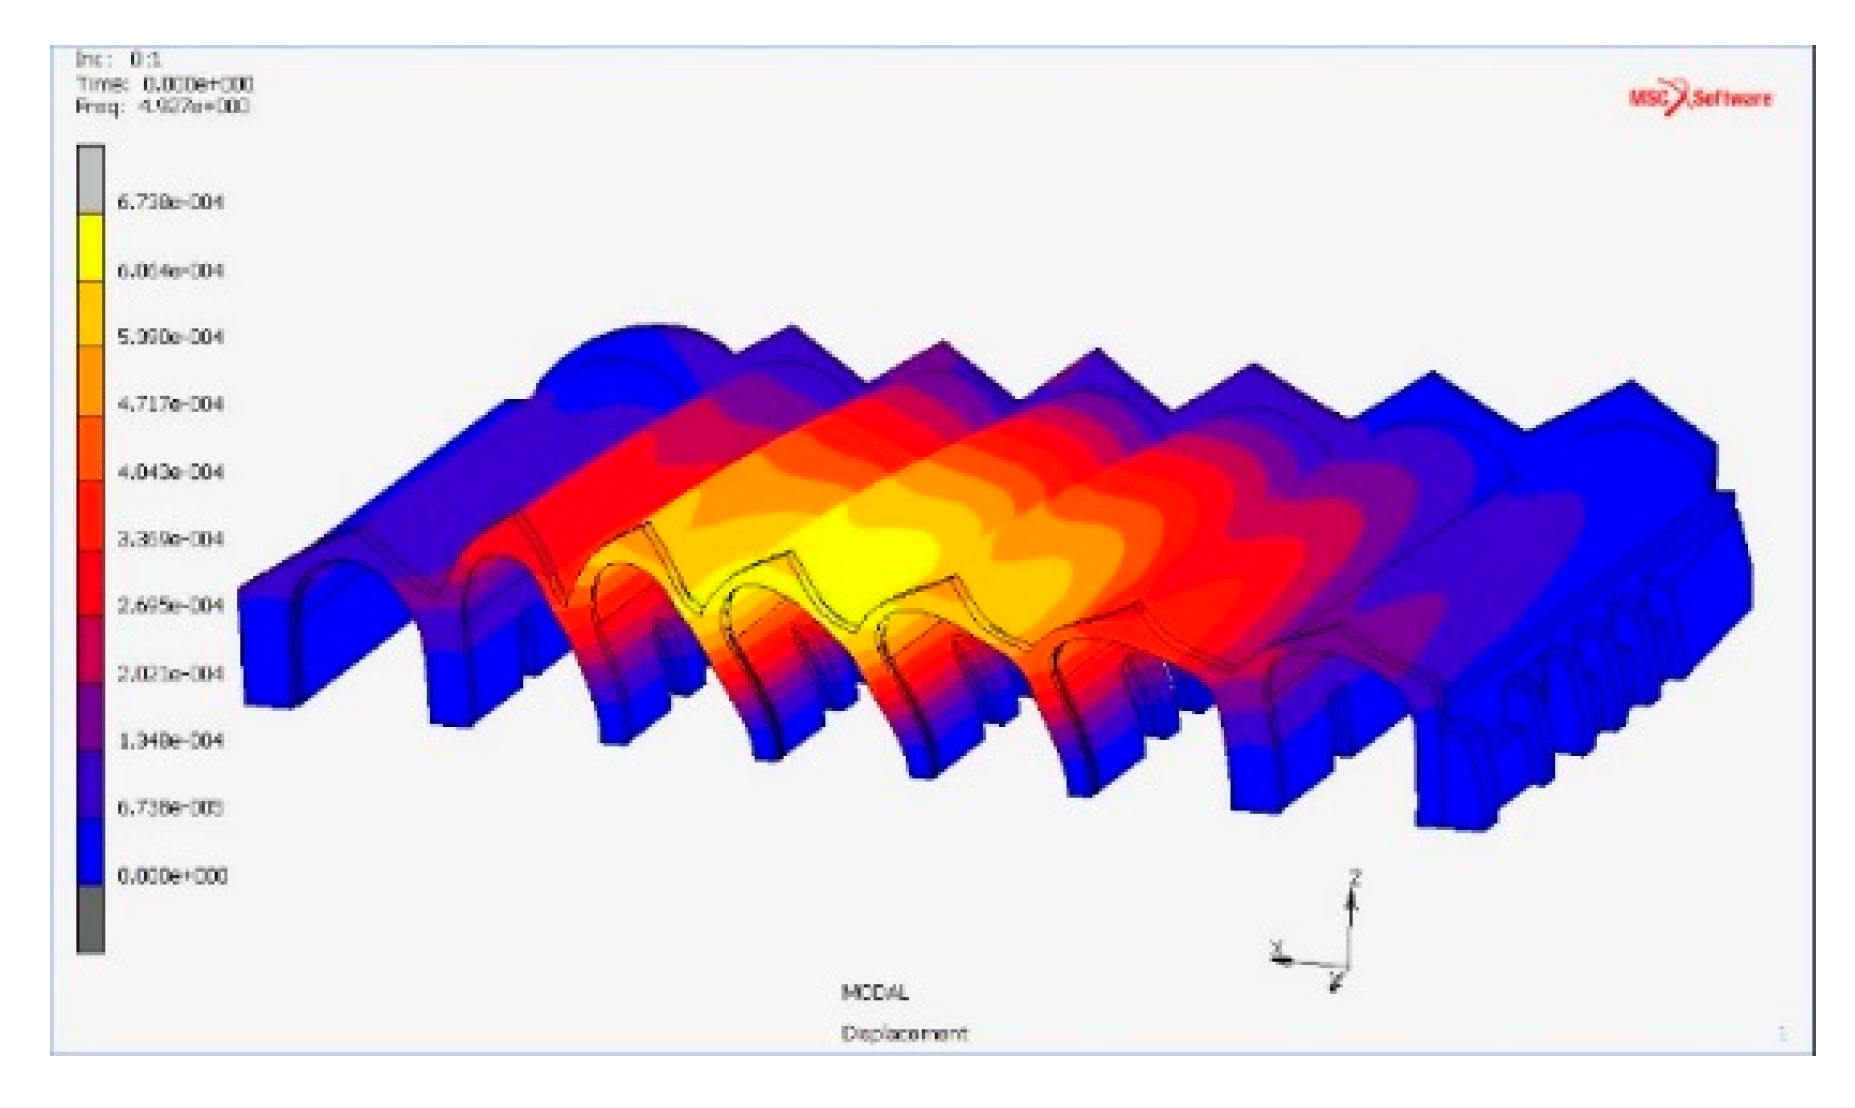
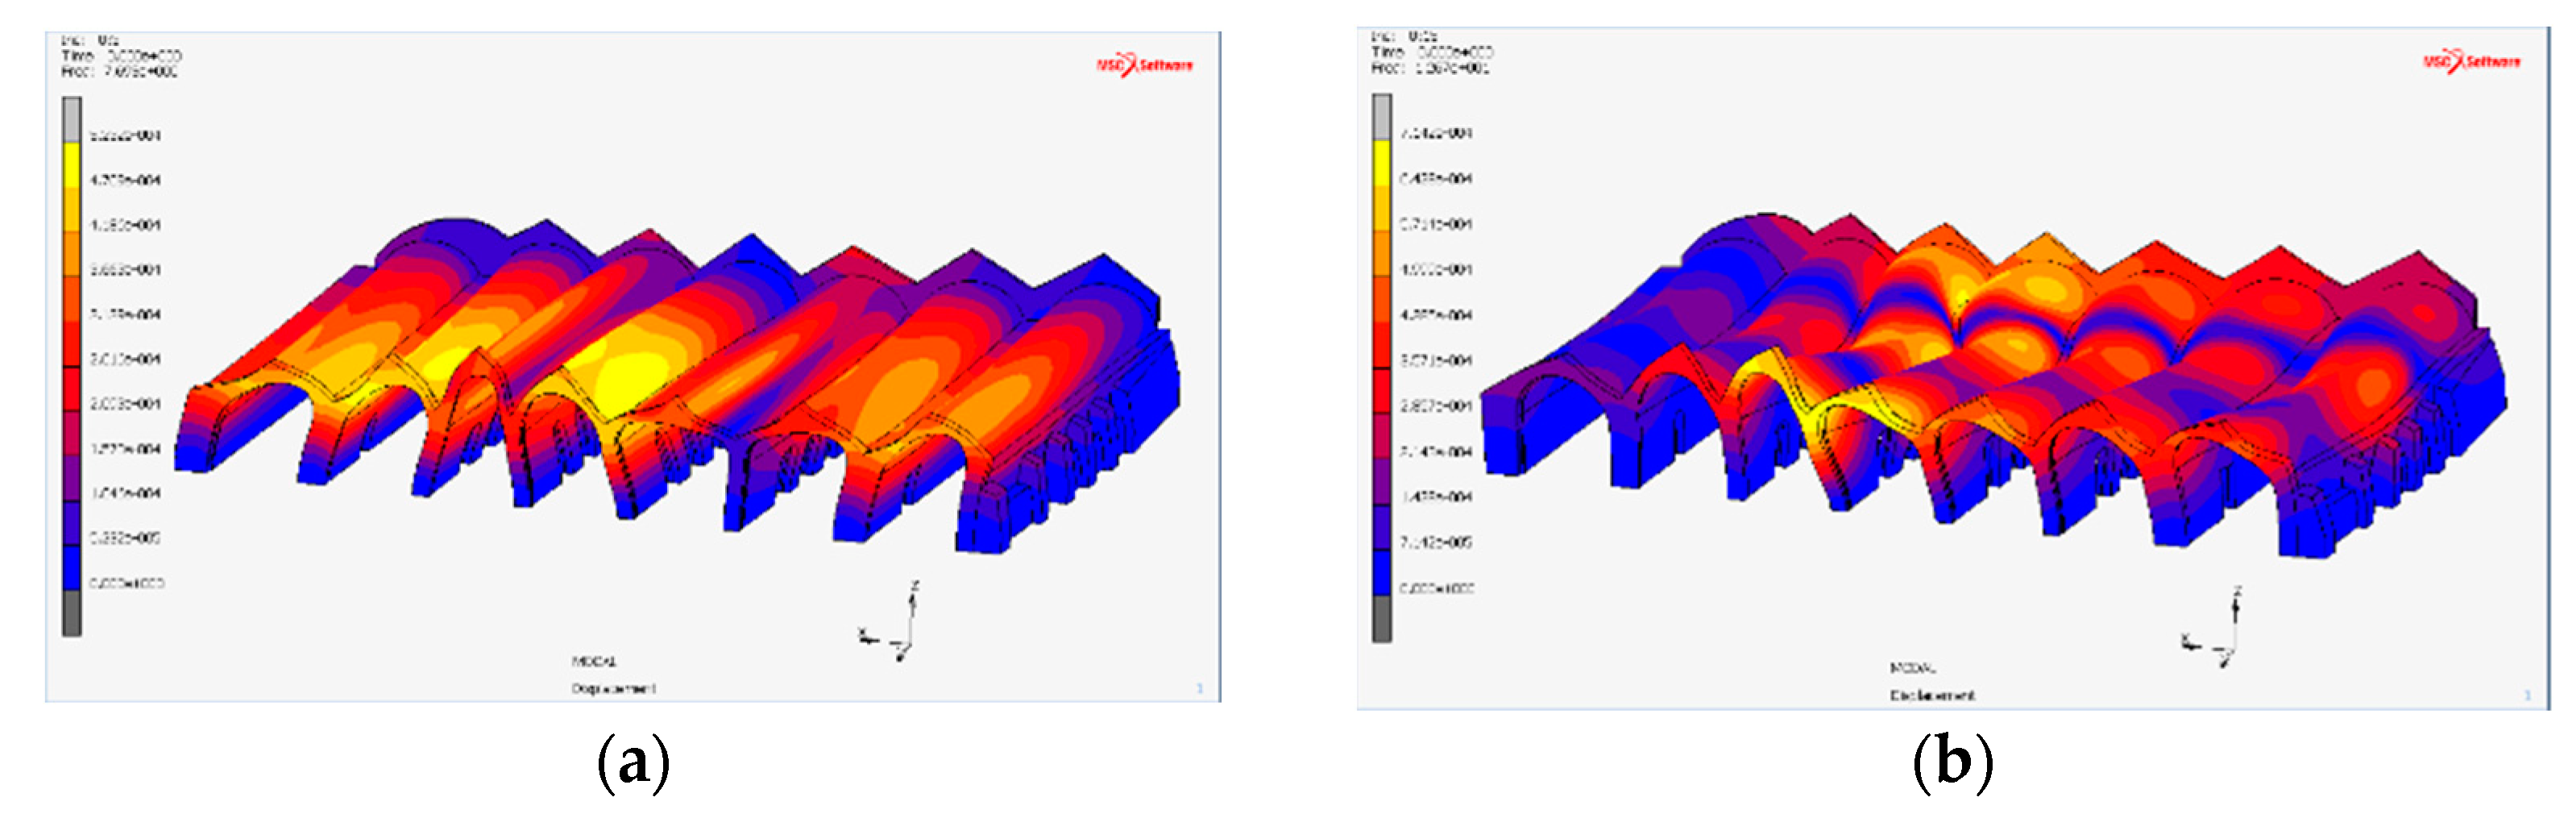
3.1. Modal Analysis
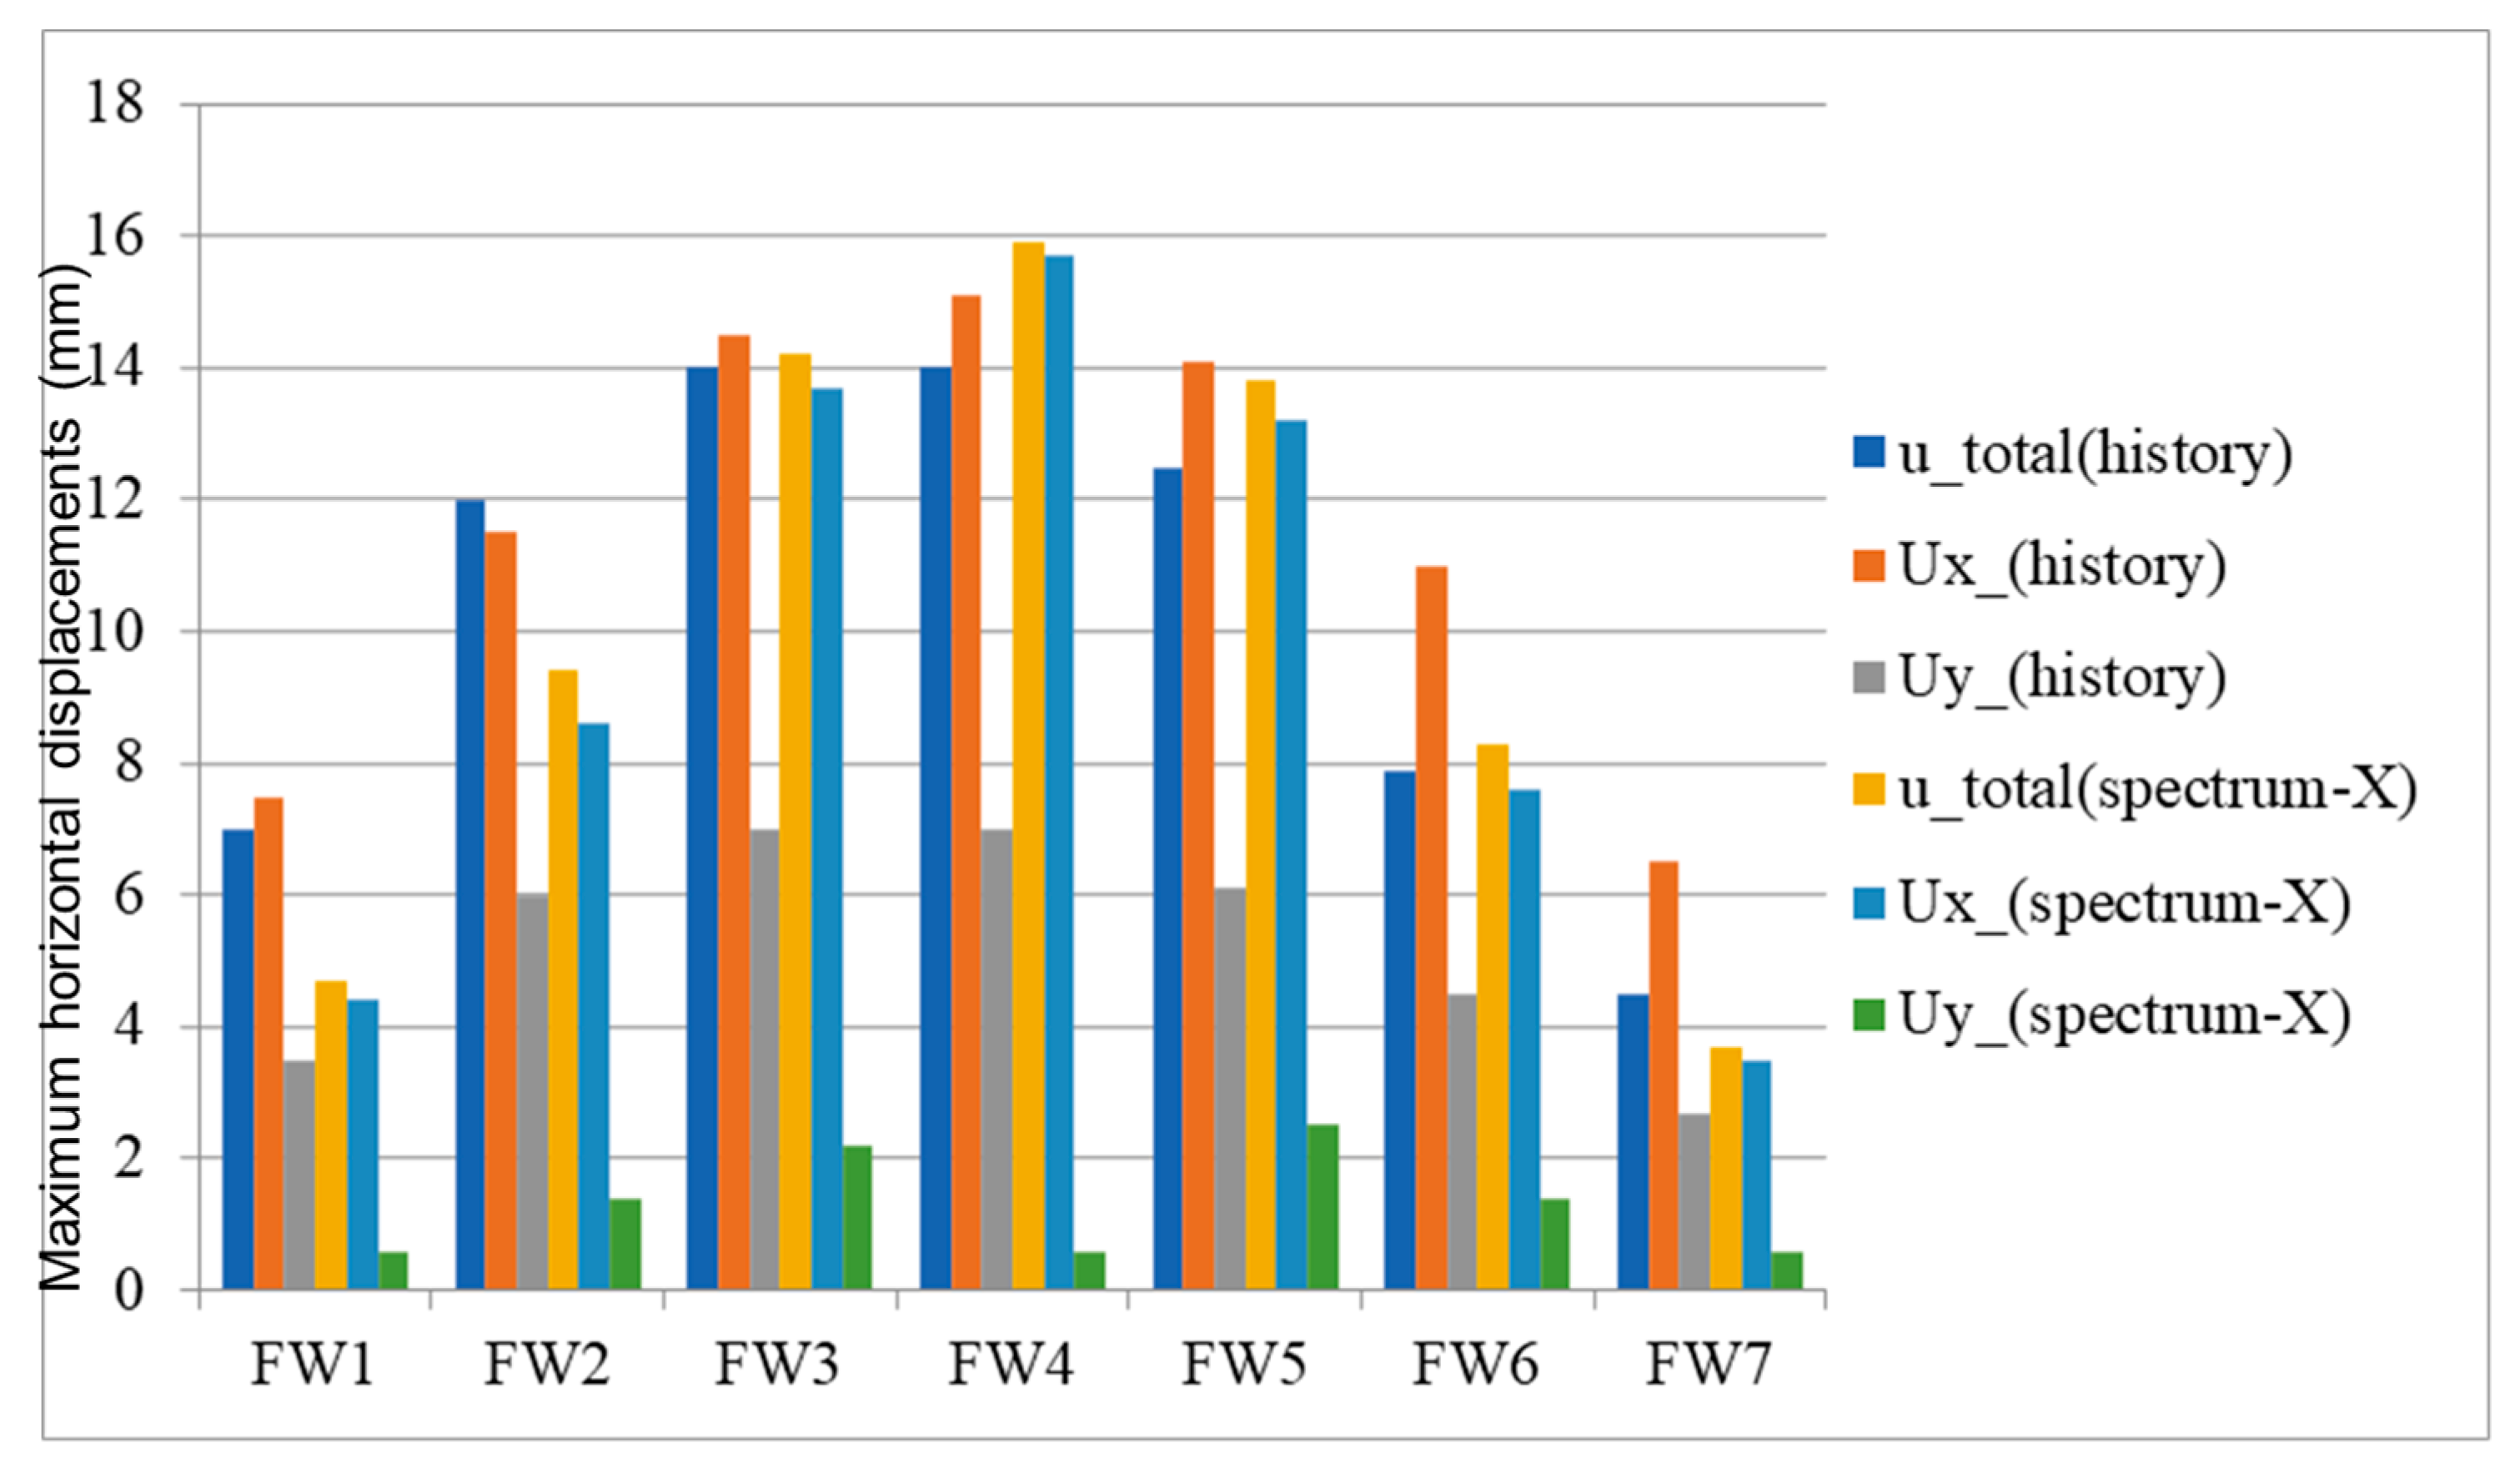
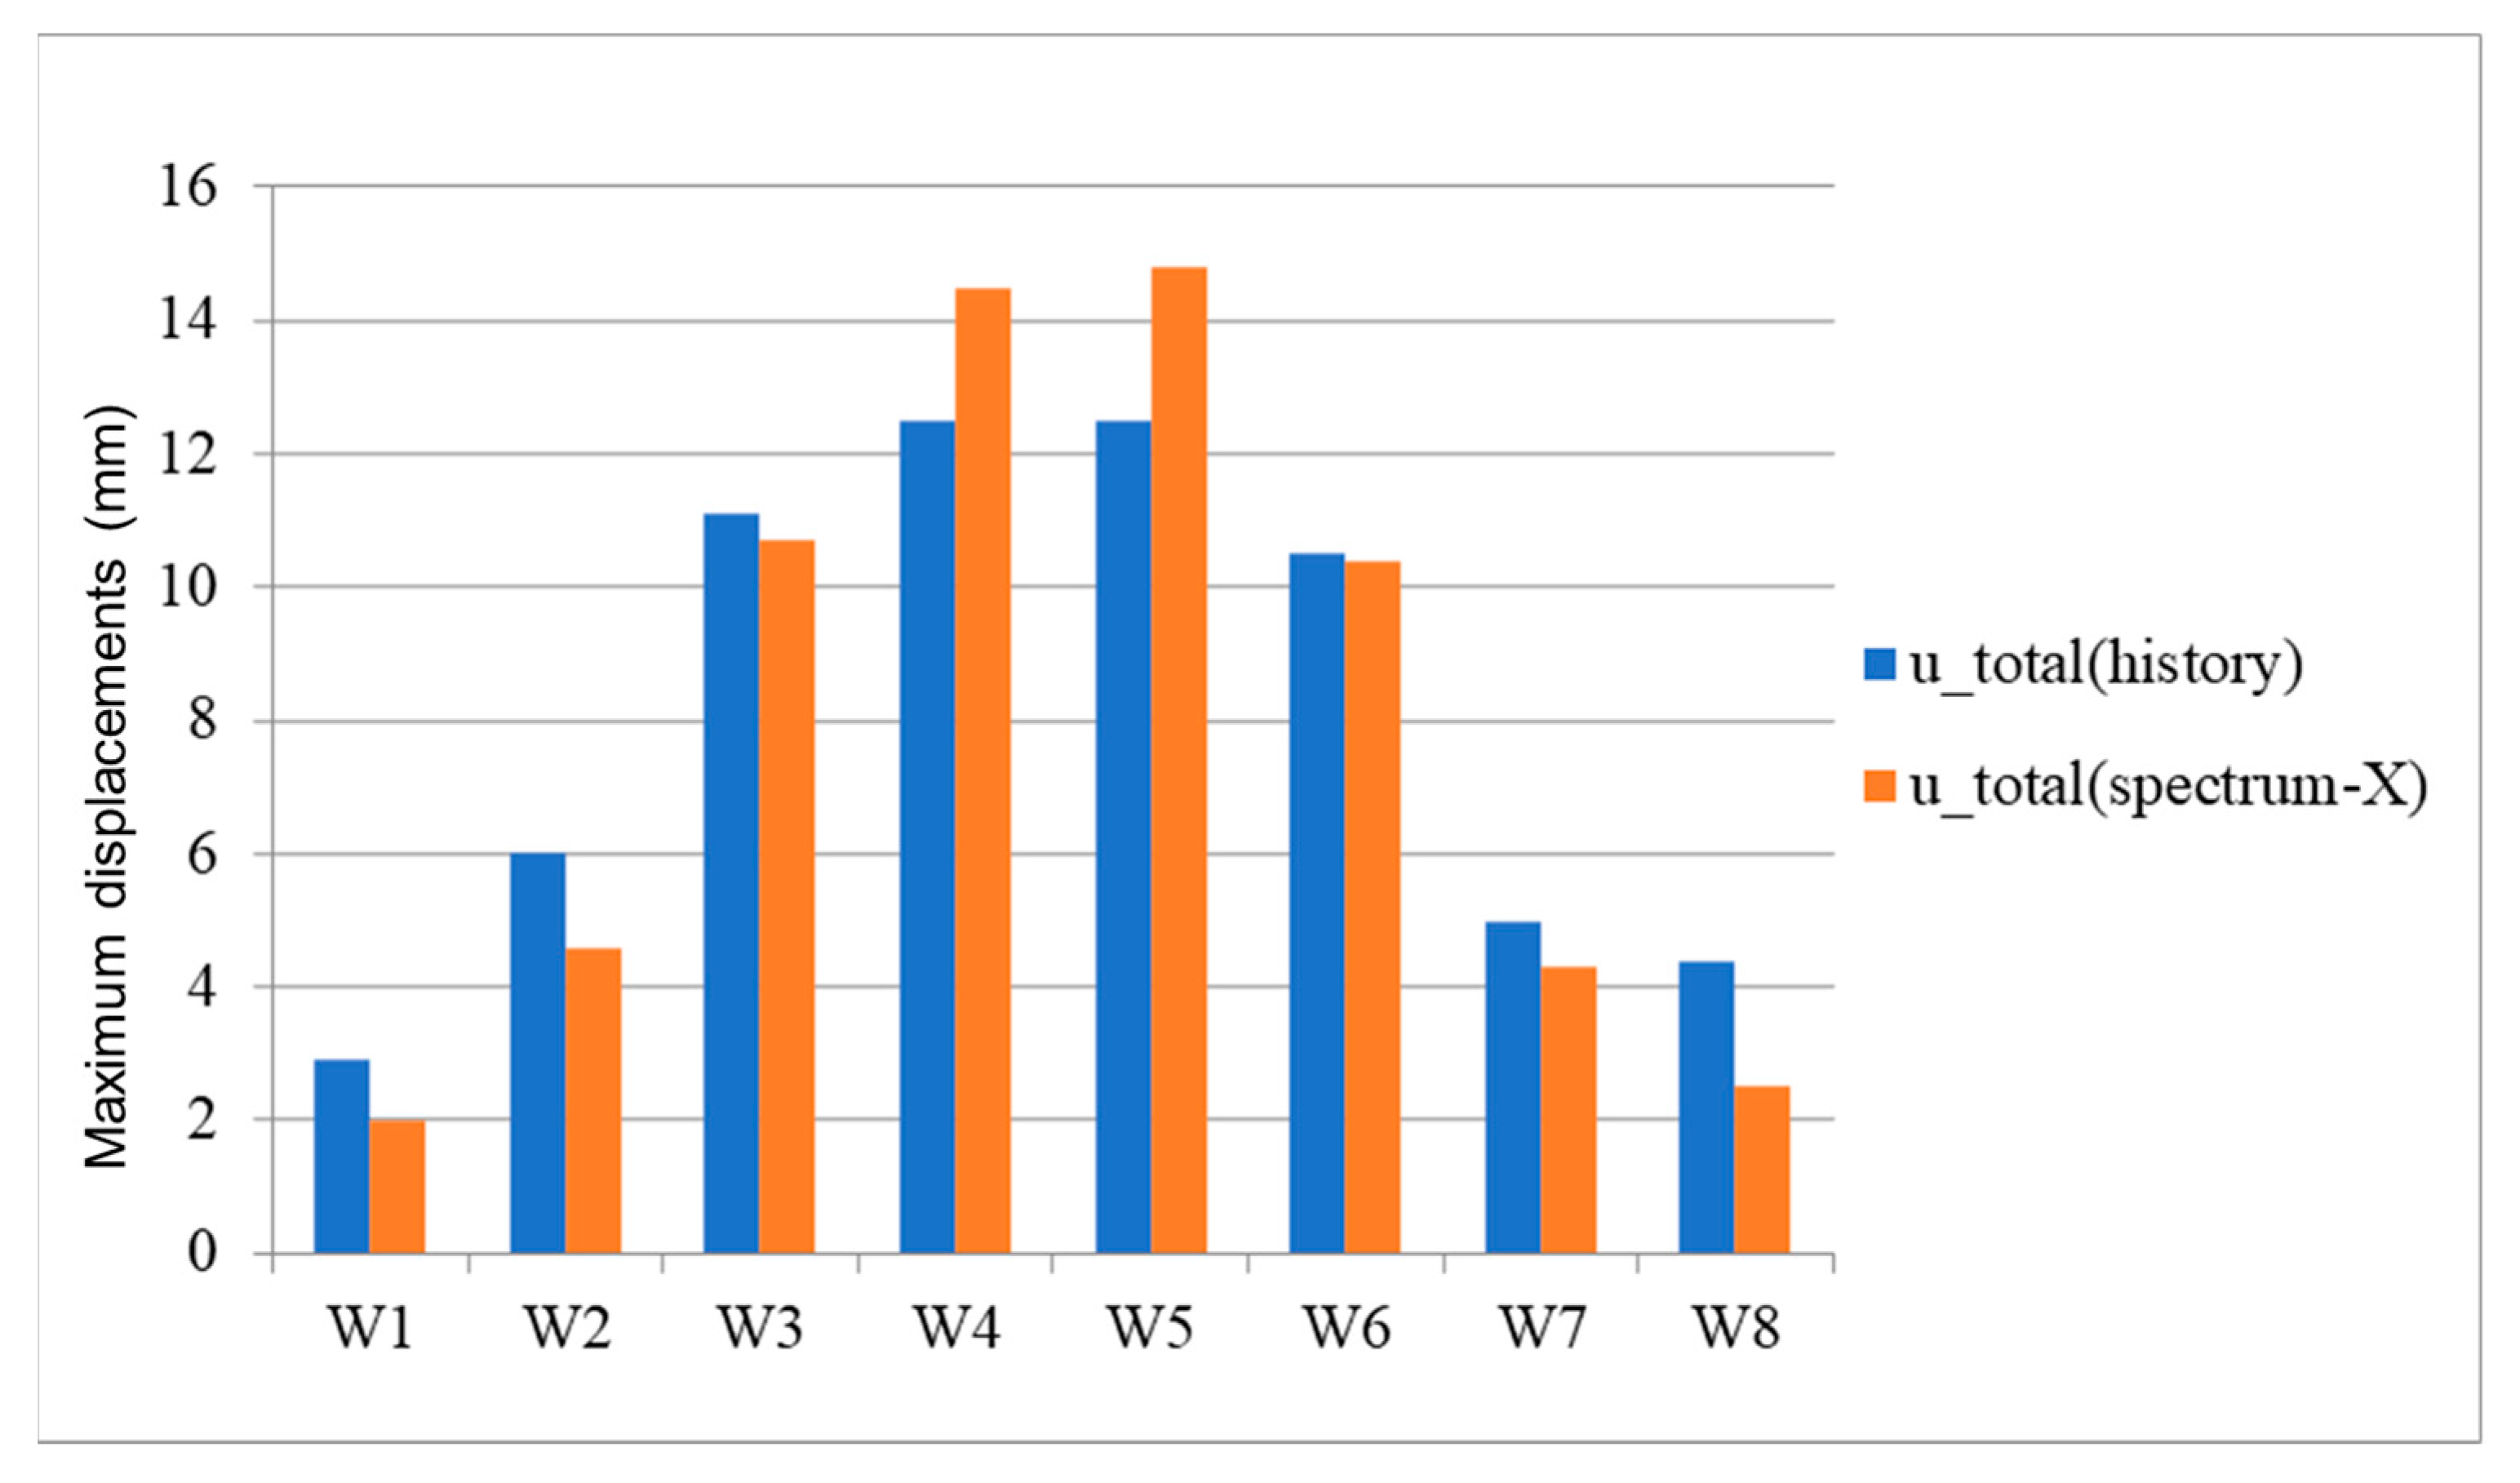
3.2. Response Spectrum Analysis
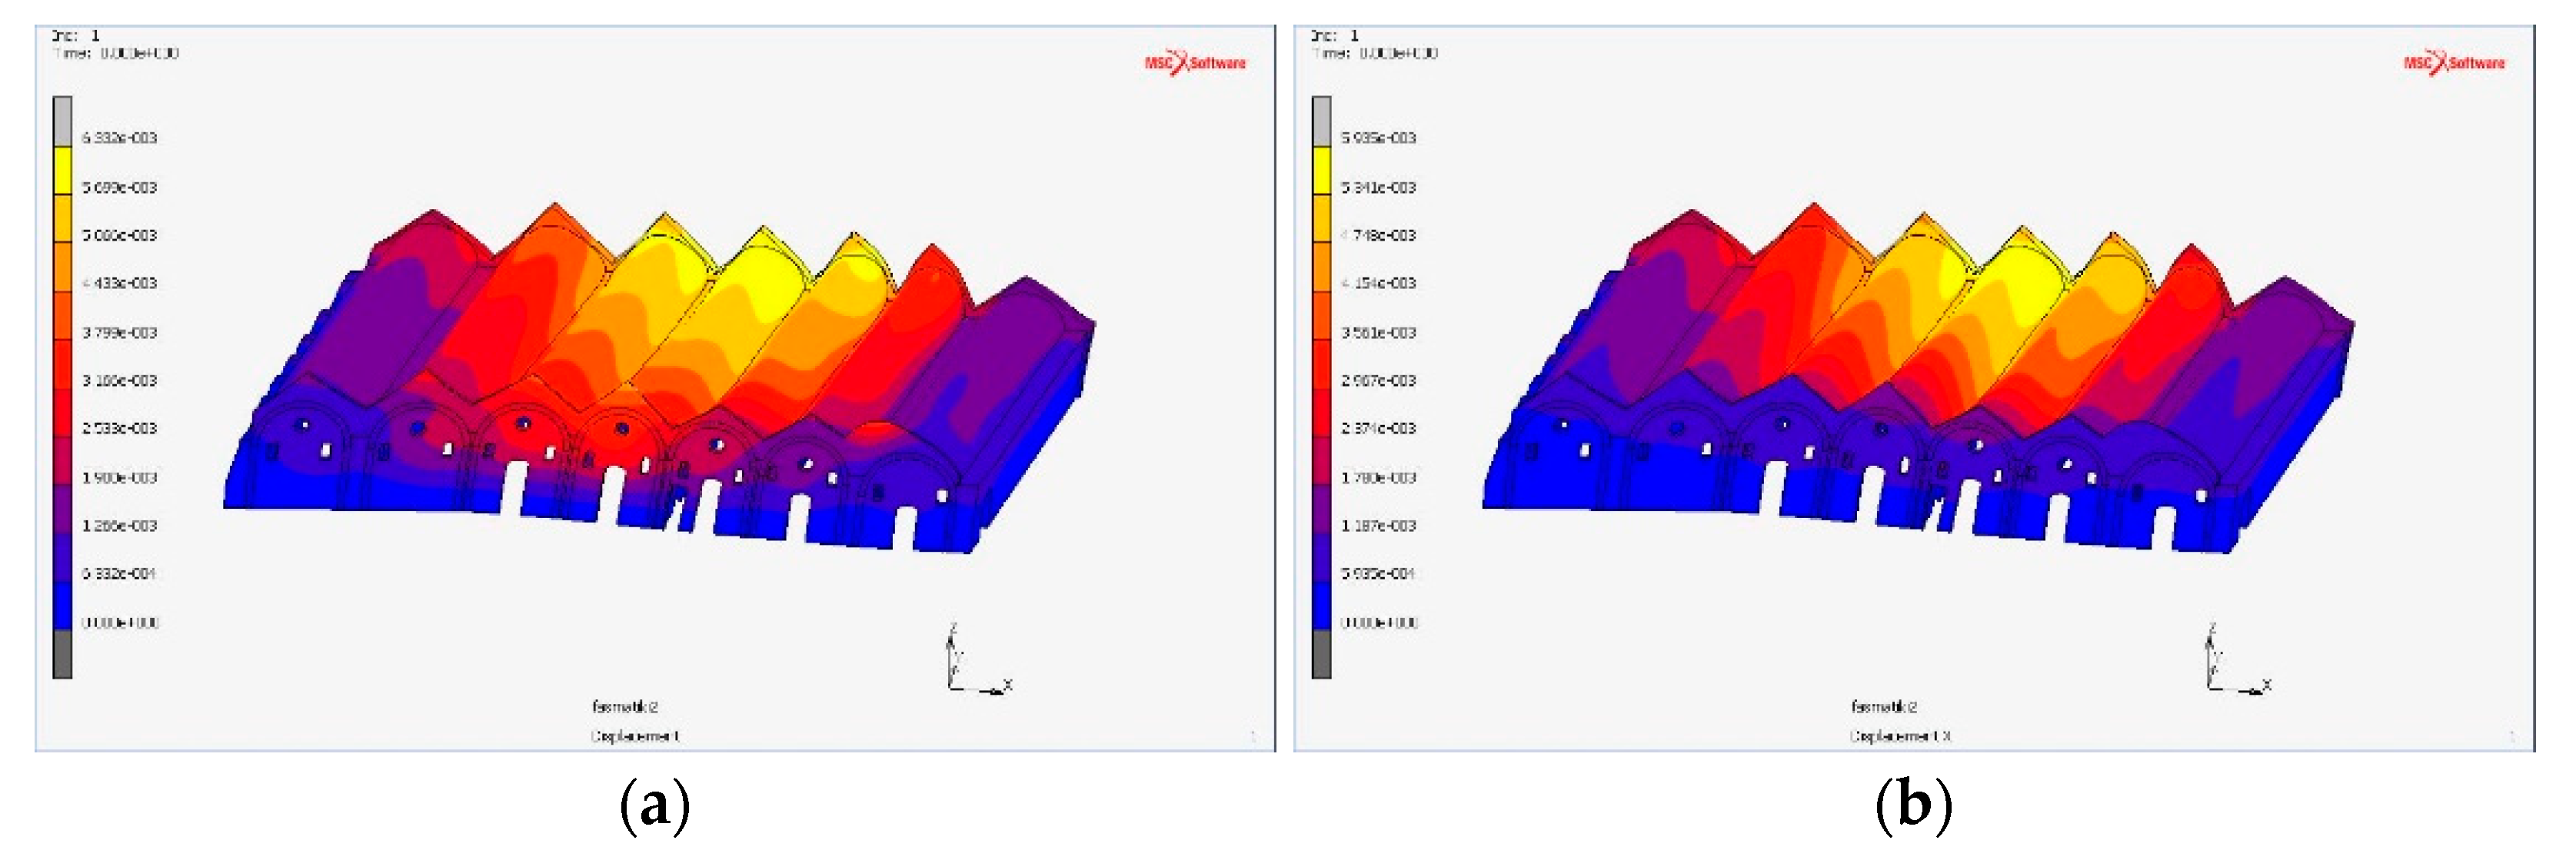
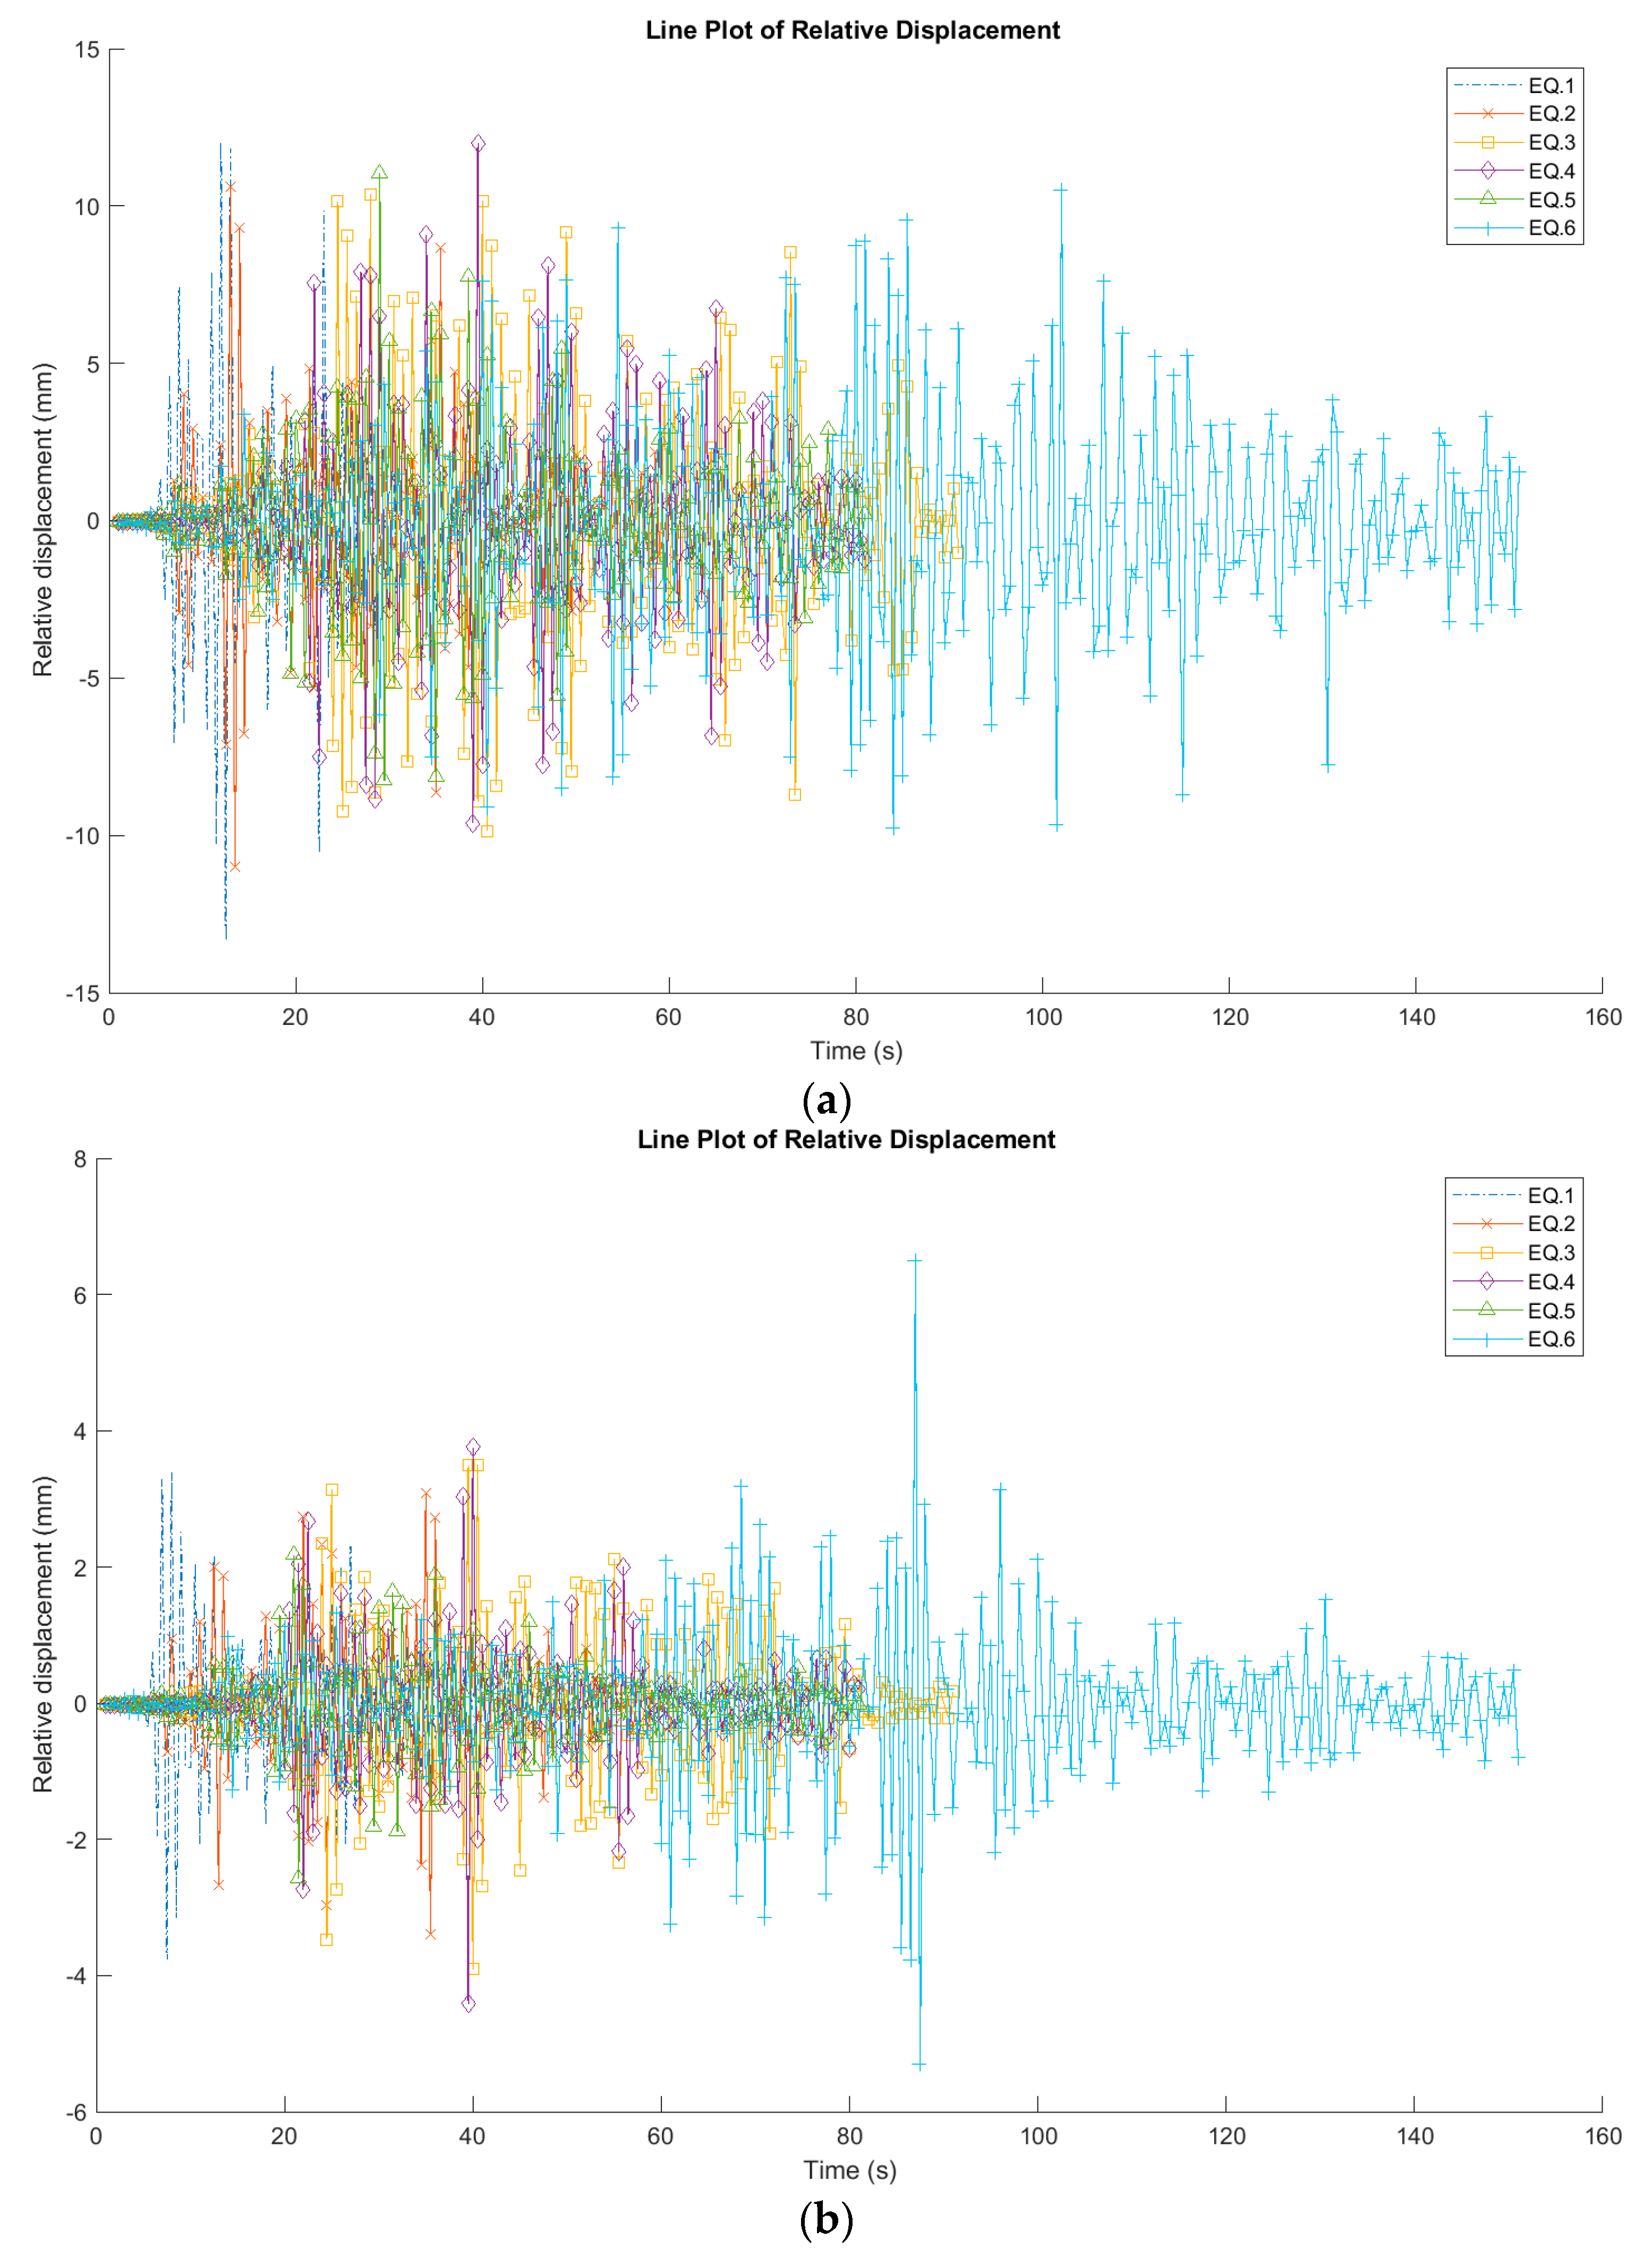
3.3. Linear Time History Analysis
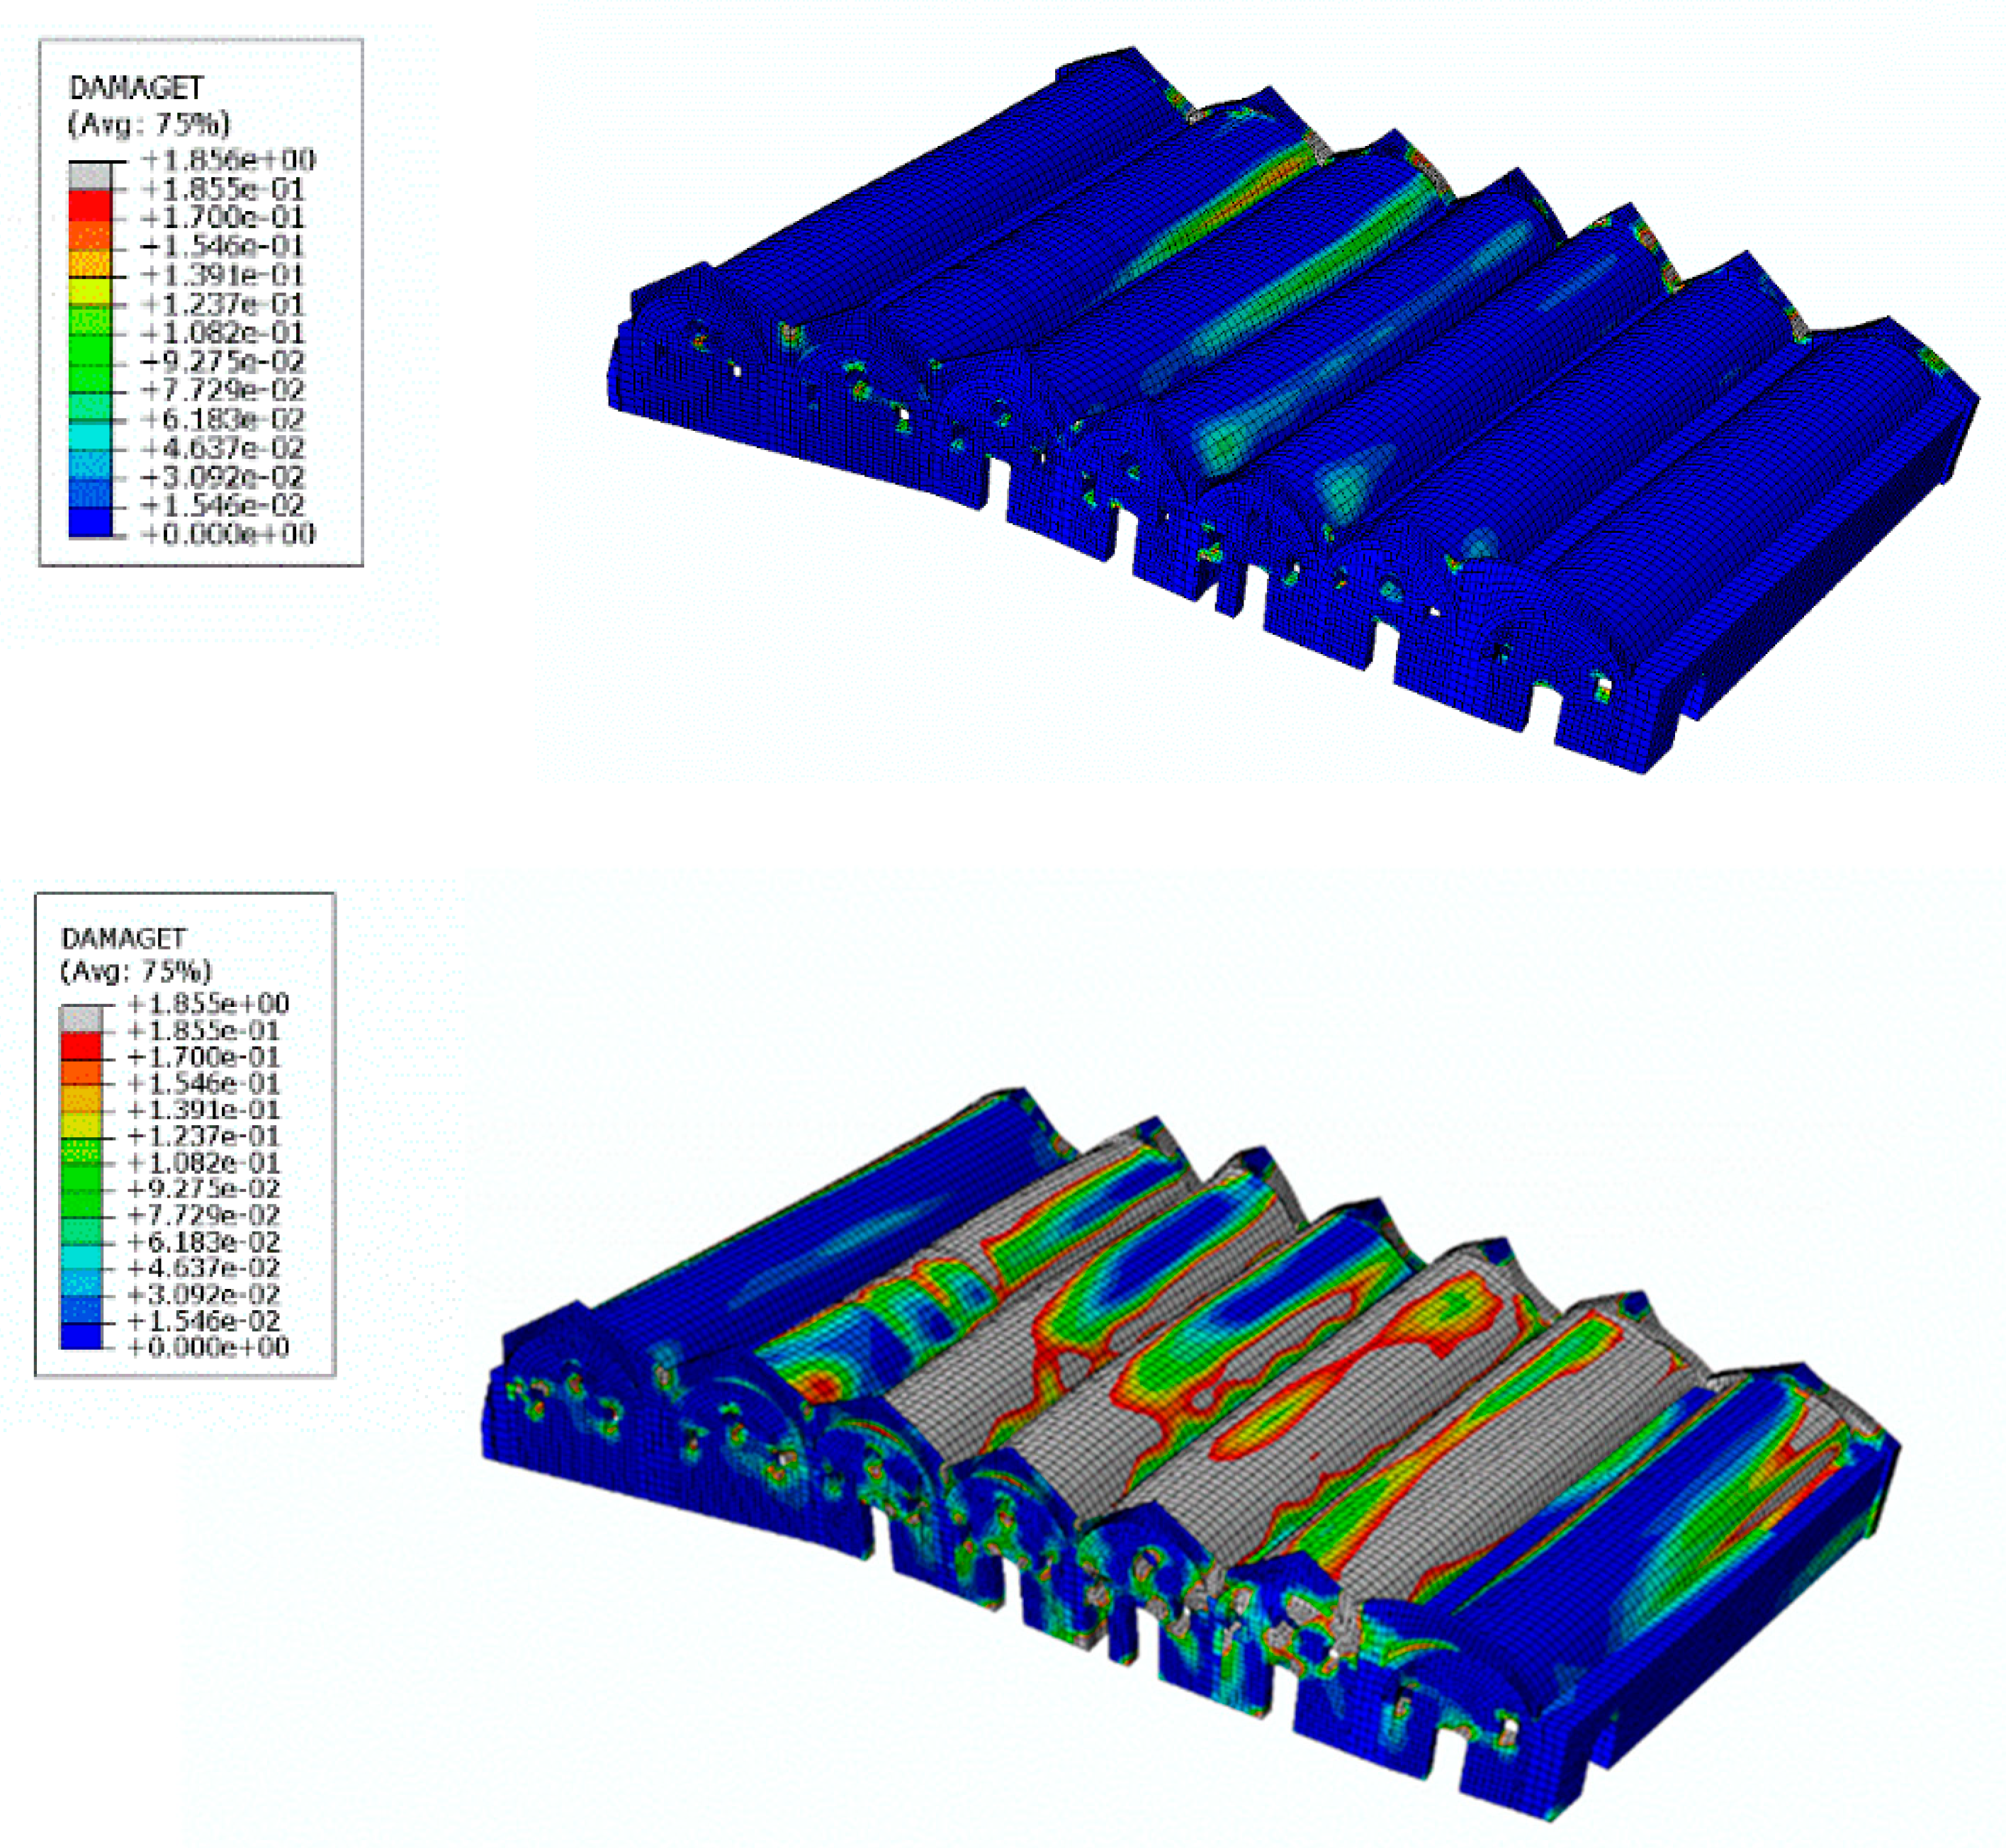
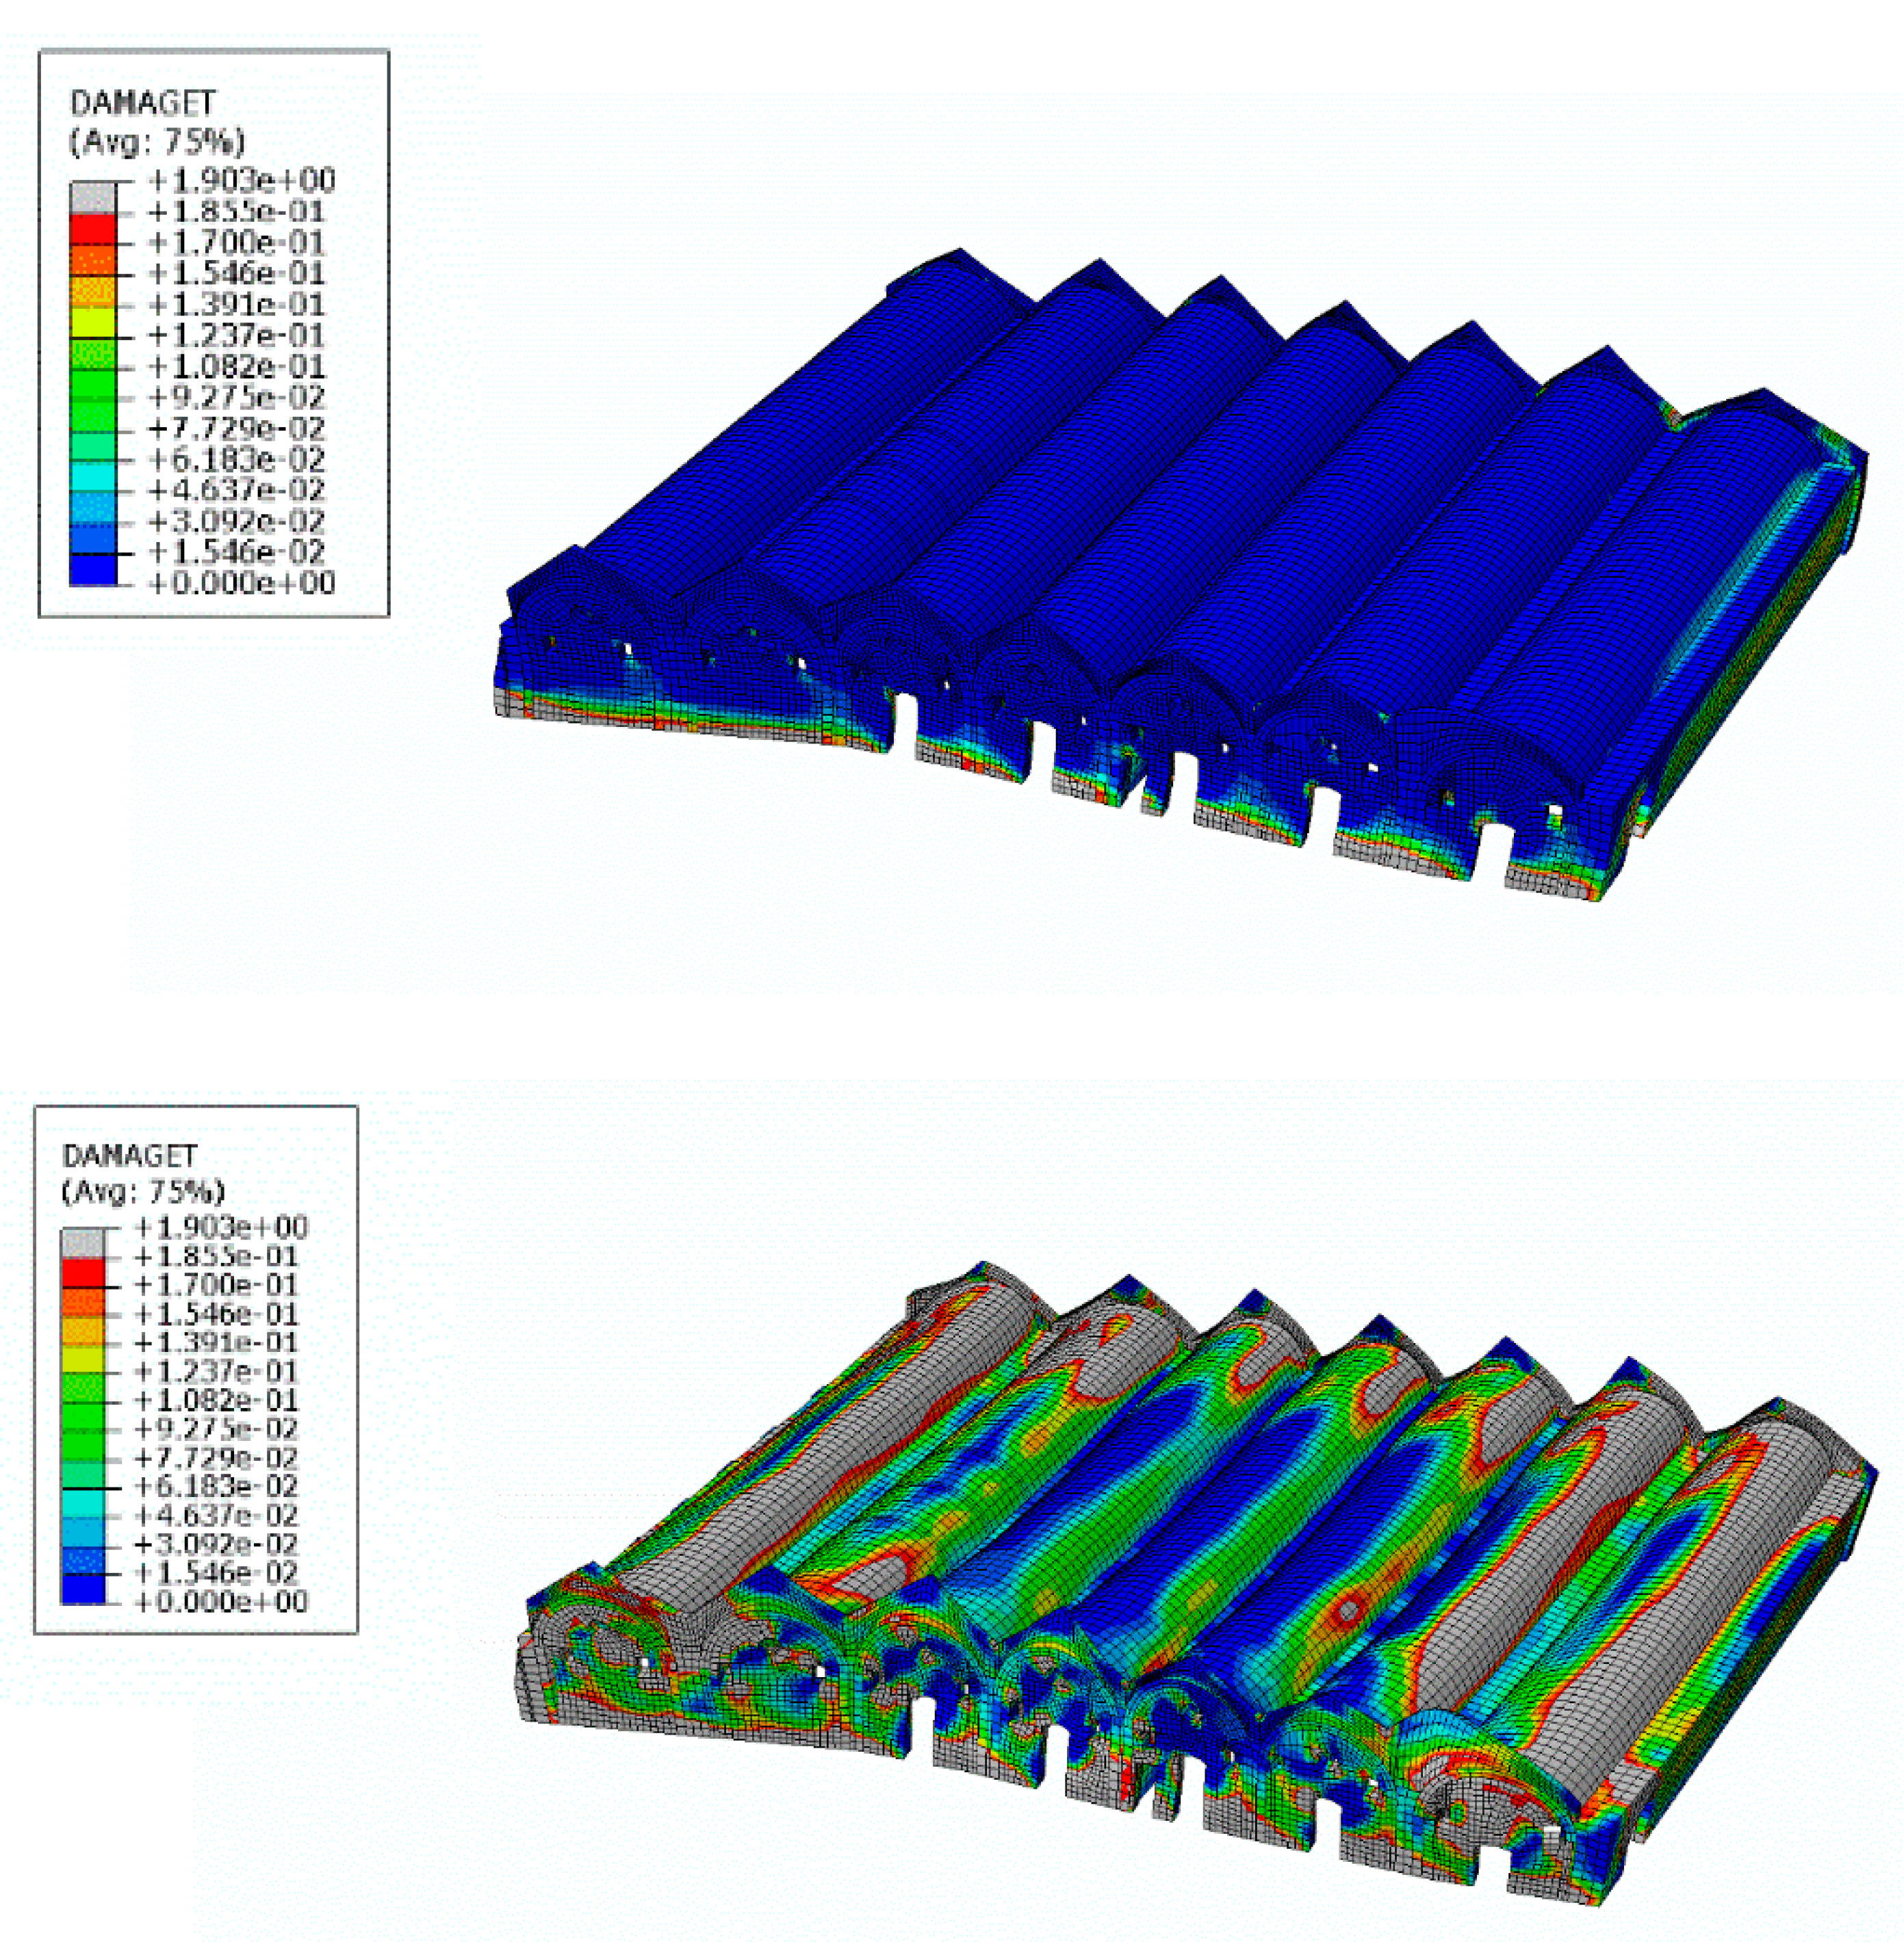
3.4. Nonlinear Time History Analysis
4. Discussion
5. Conclusions
Author Contributions
Funding
Data Availability Statement
Conflicts of Interest
References
- Lourenço, P.B. Computations on historic masonry structures. Prog. Struct. Eng. Mater. 2002, 4, 301–319. [Google Scholar] [CrossRef]
- Tzamtzis, A.D.; Asteris, P.G. Finite Element Analysis of Masonry Structures: Part II—Proposed 3-D Nonlinear Microscopic Model. In Proceedings of the Ninth North American Masonry Conference, Clemson, SC, USA, 1–4 June 2003. [Google Scholar]
- Penelis, G.; Penelis, G. Restoration of the Margirgis Church and Roman Tower in Cairo. Struct. Eng. Int. 2020, 30, 64–73. [Google Scholar] [CrossRef]
- D’Altri, A.M.; Sarhosis, V.; Milani, G.; Rots, J.; Cattari, S.; Lagomarsino, S.; Sacco, E.; Tralli, A.; Castellazzi, G.; de Miranda, S. Modeling Strategies for the Computational Analysis of Unreinforced Masonry Structures: Review and Classification. Arch. Computat. Methods Eng. 2020, 27, 1153–1185. [Google Scholar] [CrossRef]
- Kappos, A.J.; Penelis, G.G.; Drakopoulos, C.G. Evaluation of simplified models for lateral load analysis of unreinforced masonry buildings. ASCE J. Struct. Eng. 2002, 128, 890–897. [Google Scholar] [CrossRef]
- Quagliarini, E.; Maracchini, G.; Clementi, F. Uses and limits of the Equivalent Frame Model on existing unreinforced masonry buildings for assessing their seismic risk: A review. J. Build. Eng. 2017, 10, 166–182. [Google Scholar] [CrossRef]
- Shabani, A.; Kioumarsi, M.; Zucconi, M. State of the art of simplified analytical methods for seismic vulnerability assessment of unreinforced masonry buildings. Eng. Struct. 2021, 239, 112280. [Google Scholar] [CrossRef]
- Leftheris, B.; Sapounaki, A.; Stavroulaki, M.E.; Stavroulakis, G.E. Computational Mechanics for Heritage Structures; WIT-Computational Mechanics Publications: Boston, MA, USA, 2006. [Google Scholar]
- Asteris, P.G.; Chronopoulos, M.P.; Chrysostomou, C.Z.; Varum, H.; Plevris, V.; Kyriakides, N.; Silva, V. Seismic vulnerability assessment of historical masonry structural systems. Eng. Struct. 2014, 62, 118–134. [Google Scholar] [CrossRef]
- Da Silva Luis, C.M.; Milani, G.; Paulo, B. Lourenço: Probabilistic-based discrete model for the seismic fragility assessment of masonry structures. Structures 2023, 52, 506–523. [Google Scholar] [CrossRef]
- Bhattacharya, S.; Nayak, S.; Dutta, S.C. A critical review of retrofitting methods for unreinforced masonry structures, International. J. Disaster Risk Reduct. 2014, 7, 51–67. [Google Scholar] [CrossRef]
- Spyrakos, C.C.; Maniatakis, C.A. Nominal Life of Interventions for Monuments and Historic Structures. In Transdisciplinary Multispectral Modeling and Cooperation for the Preservation of Cultural Heritage. TMM_CH 2018; Moropoulou, A., Ed.; Communications in Computer and Information Science; Springer: Cham, Switzerland, 2019; Volume 962. [Google Scholar]
- Kocaman, İ. Effect of restoration interventions on the seismic behavior of historical masonry buildings: The case of Molla Siyah mosque. Eng. Fail. Anal. 2023, 148, 107206. [Google Scholar] [CrossRef]
- Wu, X.; Lu, J.; Wang, Z.; Yang, W.; Qiao, N. Dynamic characteristics and seismic response analysis of the bottle-shaped masonry ancient pagoda. Structures 2022, 44, 1648–1659. [Google Scholar] [CrossRef]
- Ferrante, A.; Loverdos, D.; Clementi, F.; Milani, G.; Formisano, A.; Lenci, S.; Sarhosis, V. Discontinuous approaches for nonlinear dynamic analyses of an ancient masonry tower. Eng. Struct. 2021, 230, 111626. [Google Scholar] [CrossRef]
- Schiavoni, M.; Giordano, E.; Roscini, F.; Clementi, F. Numerical modeling of a majestic masonry structure: A comparison of advanced techniques. Eng. Fail. Anal. 2023, 149, 107293. [Google Scholar] [CrossRef]
- Sharma, S.; Marasca, A.; Ponte, M.; Bento, R. Modelling the in-plane cyclic behaviour of typical Portuguese rubble stone masonry using the applied element method. Structures 2022, 46, 1224–1242. [Google Scholar]
- Porcu, M.C.; Montis, E.; Saba, M. Role of model identification and analysis method in the seismic assessment of historical masonry towers. J. Build. Eng. 2021, 43, 103114. [Google Scholar] [CrossRef]
- Hoveidae, N.; Fathi, A.; Karimzadeh, S. Seismic damage assessment of a historic masonry building under simulated scenario earthquakes: A case study for Arge-Tabriz. Soil Dyn. Earthq. Eng. 2021, 147, 106732. [Google Scholar] [CrossRef]
- Di Gennaro, L.; Guadagnuolo, M.; Monaco, M. Rocking Analysis of Towers Subjected to Horizontal Forces. Buildings 2023, 13, 762. [Google Scholar] [CrossRef]
- Chácara, C.; Reátegui, R.; Oré, Á.; Suarez, P.; Aguilar, R. Integration of NDT, 3D parametric modelling, and nonlinear numerical analysis for the seismic assessment of a vaulted stone-masonry historical building. J. Build. Eng. 2023, 70, 106347. [Google Scholar] [CrossRef]
- Su, Z.; Zheng, W.; Wang, Y.; Hou, X. Seismic Vulnerability Analysis of Masonry Structures Built with Disassembled Brick Wall Sections. Buildings 2022, 12, 1831. [Google Scholar] [CrossRef]
- Charalambidi, B.; Koutsianitis, P.; Motsa, S.-M.; Tairidis, G.; Kasampali, A.; Drosopoulos, G.; Stavroulaki, M.; Stavroulakis, G.E. Modelling, identification and struc-tural damage investigation of the Neoria monument in Chania. Dev. Built Environ. 2022, 10, 100069. [Google Scholar] [CrossRef]
- Stavroulaki, M.E.; Riveiro, B.; Drosopoulos, G.A.; Solla, M.; Koutsianitis, P.; Stavroulakis, G.E. Modelling and strength evaluation of masonry bridges using terrestrial photogrammetry and finite elements. Adv. Eng. Softw. 2016, 101, 136–148. [Google Scholar] [CrossRef]
- Valente, M. Earthquake response and damage patterns assessment of two historical masonry churches with bell tower. Eng. Fail. Anal. 2023, 151, 107418. [Google Scholar] [CrossRef]
- Greek Anti-Seismic CODE—2000 (EAK 2000), Earthquake Design and Protection Organization and, Association of Civil Engineers of Greece; ATTICA PRINTING SA: Athens, Greece, 2000.
- Valente, M. Seismic behavior and damage assessment of two historical fortified masonry palaces with corner towers. Eng. Fail. Anal. 2022, 134, 106003. [Google Scholar] [CrossRef]
- Tapkın, S.; Tercan, E.; Motsa, S.; Drosopoulos, G.A.; Stavroulaki, M.E.; Maravelakis, M.; Stavroulakis, G.E. Structural Investigation of Masonry Arch Bridges Using Various Nonlinear Finite Element Models. J. Bridge Eng. 2022, 27, 04022053. [Google Scholar] [CrossRef]
- Seismosoft. SeismoMatch 2022—A Computer Program for Spectrum Matching of Earthquake Records. 2022. Available online: https://seismosoft.com/ (accessed on 18 August 2023).
- Al-Atik, L.; Abrahamson, N.A. An improved method for nonstationary spectral matching. Earthq. Spectra 2010, 26, 601–617. [Google Scholar] [CrossRef]
- Rayegani, A.; Nouri, G. Seismic collapse probability and life cycle cost assessment of isolated structures subjected to pounding with smart hybrid isolation system using a modified fuzzy based controller. Structures 2022, 44, 30–41. [Google Scholar] [CrossRef]


| Material | Young’s Modulus E (×109 Pa) | Mass Density (kg/m3) | Poisson’s Ratio ν |
|---|---|---|---|
| Vaults | 3.43 | 1900 | 0.15 |
| South wall | 1.50 | 1500 | 0.25 |
| Weak walls | 3.14 | 1700 | 0.25 |
| Strong walls | 3.29 | 1700 | 0.25 |
| No. | Mw | Event Name | Name of Station | Date of Event |
|---|---|---|---|---|
| EQ.1 | 6.3 | Thessaly Earthquake | Station S5 | 3 March 2021 |
| EQ.2 | 6.3 | Thessaly Earthquake | Station S4 | 3 March 2021 |
| EQ.3 | 6.0 | Arkalochori Earthquake (Main shock) | Station ABEA | 27 September 2021 |
| EQ.4 | 5.3 | Arkalochori Earthquake (Secondary shock) | Station ABEA | 28 September 2021 |
| EQ.5 | 6.1 | Earthquake West of Chania | Station ABEA | 27 November 2019 |
| EQ.6 | 6.7 | Samos Earthquake | Station ABEA | 30 October 2020 |
| EQ.7 | 6.69 | Northridge, California | Griffith Observatory | 17 January 1994 |
| EQ.8 | 6.7 | Northridge, California | MT Wilson-Cit Seis Station (CDMG Station 24399) | 17 January 1994 |
| EQ.9 | 6.9 | Irpinia, Italy | Sturno | 23 November 1980 |
Disclaimer/Publisher’s Note: The statements, opinions and data contained in all publications are solely those of the individual author(s) and contributor(s) and not of MDPI and/or the editor(s). MDPI and/or the editor(s) disclaim responsibility for any injury to people or property resulting from any ideas, methods, instructions or products referred to in the content. |
© 2023 by the authors. Licensee MDPI, Basel, Switzerland. This article is an open access article distributed under the terms and conditions of the Creative Commons Attribution (CC BY) license (https://creativecommons.org/licenses/by/4.0/).
Share and Cite
Stavroulaki, M.E.; Kasampali, A.; Charalambidi, B.; Motsa, S.M.; Drosopoulos, G.A.; Stavroulakis, G.E. Linear and Nonlinear Earthquake Analysis for Strength Evaluation of Masonry Monument of Neoria. Buildings 2023, 13, 2204. https://doi.org/10.3390/buildings13092204
Stavroulaki ME, Kasampali A, Charalambidi B, Motsa SM, Drosopoulos GA, Stavroulakis GE. Linear and Nonlinear Earthquake Analysis for Strength Evaluation of Masonry Monument of Neoria. Buildings. 2023; 13(9):2204. https://doi.org/10.3390/buildings13092204
Chicago/Turabian StyleStavroulaki, Maria E., Amalia Kasampali, Barbara Charalambidi, Siphesihle Mpho Motsa, Georgios A. Drosopoulos, and Georgios E. Stavroulakis. 2023. "Linear and Nonlinear Earthquake Analysis for Strength Evaluation of Masonry Monument of Neoria" Buildings 13, no. 9: 2204. https://doi.org/10.3390/buildings13092204