Article

Residual Properties of Fibre Grids Embedded in Cementitious Matrices after Exposure to Elevated Temperatures

by
Pengliang Yang
and
Theofanis Krevaikas
*
Department of Civil Engineering, Xi’an Jiaotong—Liverpool University (XJTLU), Suzhou 215000, China
*
Author to whom correspondence should be addressed.
Buildings 2023, 13(8), 1900; https://doi.org/10.3390/buildings13081900
Submission received: 11 June 2023 / Revised: 12 July 2023 / Accepted: 21 July 2023 / Published: 26 July 2023

Abstract

:
The use of fabrics in the form of grids embedded in cementitious matrices—usually termed as textile-reinforced mortar, fiber-reinforced cementitious matrix, or textile-reinforced concrete—demonstrate a more stable performance in elevated temperature conditions compared with fiber-reinforced polymers. This study investigated the residual tensile properties of bare yarns and fabrics in the form of grids embedded in a cementitious mortar after exposure to 100 °C, 200 °C, and 300 °C. Three different coated fabric textiles were used as reinforcement: carbon, basalt, and glass. Additionally, scanning electron microscopy (SEM), X-ray diffraction (XRD), and thermos-gravimetric analysis (TGA) were conducted to evaluate potential changes in the internal structure of the fibers and the mortar. The cracking stress, the tensile strength, and the ultimate strain of the composite specimens were increased after exposure to 100 °C, while only carbon and glass fiber grids retained their effectiveness up to 200 °C. At 300 °C, the coupons reinforced with carbon and basalt fibers deteriorated rapidly. Only the glass counterparts showed an improved overall performance due to fiber contraction and the differences in the coating material. The results highlight the differences in the performance of the three fiber types and the important role of the coating material in the overall composite behavior.

1. Introduction

The use of woven fabrics in the form of textiles embedded in inorganic matrices, such as cementitious mortars of various types, has a distinct advantage against fiber-reinforced polymers (FRPs) when exposed to heated environments. The FRP systems start losing adhesive properties between 50 °C to 80 °C [1,2,3,4,5]; hence, the effectiveness of any intervention scheme becomes questionable. On the other hand, since the inorganic matrix is not impacted by high temperatures to the same extent as the polymeric counterpart, employing textiles embedded in mortars offers a possible substitute. The specific type of composite material termed herein textile-reinforced mortar (TRM) consists of high-strength fibers in the form of textiles (e.g., aramid, basalt, carbon, polybenzoxazole (PBO), glass) and inorganic matrices (e.g., cementitious or lime mortars). The open weave architecture of the grid introduces an inherent problem to the method, since only the outer surface of the bundles is in complete contact with the cementitious matrix leaving the internal filaments mostly unbonded. A thin coating layer is implemented on the textiles to improve the adhesion between the fibers and the surrounding matrix. Polymeric agents are the most popular coating materials, but recently, silica-based coatings (inorganic) have also been investigated [6]. Moreover, nanoclay particles were introduced to improve the interaction between the coating and the yarns [6,7]. The overall behavior under heated environments is affected not only by the types of fibers—coated or dry—but also by the type of the coating—liquids or precursors of liquids.
Although the thermal resistance of TRM comprises a significant advantage, it was only a decade ago when the first experimental projects began focusing on its specific behavior (e.g., [8,9]). The performance of reinforced concrete and, to a lesser extent, masonry elements have since been the subject of similar research (for additional references, see [10,11]). The experimental projects may focus on the overall behavior of TRMs during or after exposure to elevated temperatures. In the latter case, the residual mechanical properties of the composite material, owing to alterations of the individual constituents, affect the overall structural behavior and set the limits for any design intervention scheme.

2. Literature Review

The conditioning environments and long-term performance of FRCM and its components (mortar and textile) were systematically reviewed by Al-Lawi et al. [12]. Furthermore, several researchers looked at the residual mechanical characteristics of textiles embedded inorganic matrices after exposure to high temperatures. The most notable results are given and analyzed in the following paragraph.
Colombo et al. conducted one of the earliest experiments to examine the residual tensile strength of AR-glass fiber TRMs following exposure to high temperatures [13]. The specimens were reinforced with two layers of grids before being put through tensile testing after spending two hours in temperatures as high as 600 °C. Similar tests were carried out by Rambo et al. [14] and Rambo et al. [15]. They employed coated basalt fiber grids inserted in refractory concrete made of high alumina cement and calcium–aluminate aggregates. The samples underwent tension testing after exposure to temperatures between 75 °C and 1000 °C. Specifically, at 200 °C, three exposure periods were employed—1 h, 3 h, and 6 h. The effect of the coating on the postheated tensile behavior of carbon FRCM specimens was examined by Donnini et al. [16]. Three groups of specimens reinforced with three types of carbon fabrics (dry, epoxy-coated, and sand-treated) were heated at 120 °C for 60 min and 100 min. The residual strength of textile-reinforced concrete (TRC) exposed for one hour at five target temperatures—75 °C, 150 °C, 300 °C, 400 °C, and 600 °C—was measured by Tlaiji et al. [17]. The specimens were reinforced with AR-glass fiber textiles. Messori et al. [18] investigated the postheated tensile strength of specimens reinforced with epoxy-coated AR-glass grids exposed to 100 °C, 150 °C, 200 °C, and 250 °C for two hours. Truong et al. [19] studied the performance of the lap-splice length and its influence on the residual strength of TRM coupons reinforced with carbon fiber textiles embedded in alumina cement-based mortar. The specimens were subjected to uniaxial tensile tests after exposure to 250 °C and 300 °C. Kapsalis et al. [11] presented results from an extended experimental campaign comprising a wide range of carbon and glass fiber grids—coated or dry—in low- and high-volume fractions embedded in a commercial cementitious matrix reinforced with micropolypropylene fibers. Τhe specimens were fired up to 700 °C using a specially designed furnace. Estevan et al. [20] investigated the tensile behavior of postheated TRM specimens embedded with basalt, carbon, and two types of AR-glass textile grids. The temperature path contained a one-hour maintenance at target elevated temperatures up to 600 °C. Ombres et al. [21] added to the knowledge on the residual characteristics of PBO grids embedded in cement-based mortars following exposure to hot conditions. The authors conducted a series of tensile tests on TRM coupons following five heating cycles at 100 °C and 200 °C as part of an experimental program examining the residual properties of PBO-confined concrete cylinders. Additional details on specimens reinforced with PBO grids subjected to 100 °C while under tensile stresses were published by Calabrese et al. [22]. Five coupons were put through six hours of dry-heat conditioning and tension testing.
The specimens in most studies above the specimens maintained their initial strength up to 200 °C. The authors often pointed to the shrinkage of the mortar and changes in the coating material as the primary causes of that behavior. In particular, the melting and subsequent solidification of the coating agent produced a beneficial interlocking mechanism between the grid and the matrix. Furthermore, failure accelerated above 300 °C due to the coating material deterioration and consequent loss of bonding between the grid bundles and the surrounding matrix. According to some researchers, uncoated fibers perform better in heated environments. In most situations, the length of the exposure was not recognized as important to the overall behavior.
Silva et al. [23] investigated the residual bonding between coated and dry carbon fiber grids embedded in Portland cement inorganic matrices. Liu et al. [24] investigated the pullout behavior of coated AR-glass and basalt fibers in the form of yarns and textiles after exposure to various temperatures; the range was from 100 °C to 600 °C, and both situations lasted two hours. Liu et al. [24] found a considerable decrease in strength due to bond disintegration following exposure to high temperatures. However, Silva et al. (2014) [23] detected an improvement in strength for temperatures up to 150 °C due to enhanced bond conditions.
Xu et al. [25] and Xu et al. [26] studied the flexural performance of TRC thin plates after exposure to four different temperatures for one hour: 200 °C, 400 °C, 600 °C, and 800 °C. Both investigations employed standard Portland cement and high-alumina cement as inorganic matrices. In the first study, the reinforcement comprised three layers of coated and uncoated grids having carbon and E-glass fiber bundles in the warp and the weft direction, respectively. In the second investigation, three layers of textiles made from basalt fibers served as reinforcement. The outcomes demonstrated that up to 600 °C, the matrix type did not affect the general behavior. However, the high-alumina cementitious matrix specimens outperformed their Portland counterparts at 800 °C. The outcomes also showed that specimens reinforced with coated grids reached higher loads than those without coating and displayed brittle behavior regardless of the cementitious matrix. According to the authors, the degradation of the matrix, the deterioration of the fibers, and the decay of the interface between the two materials were the primary causes of the worsening of the mechanical behavior of the TRC sheets.
A finite difference scheme and the Aveston–Cooper–Kelly (ACK) model used by Rambo et al. [27] and Kapsalis et al. [11], respectively, was used to simulate the tension stiffening, predict the crack spacing, and describe the stress–strain relation of the specimens. Donnini et al. [16] also used a variational fracture analytical model to evaluate the bond strength between carbon FRCMs and clay brick substrates subjected to double-shear testing.
The literature review demonstrates that the experimental results are at an early stage and that numerous parameters (such as different materials, load configurations, and experimental set-ups) still need to be studied. The current project seeks to improve the understanding of the residual characteristics of TRM composites when subjected to heated environments by providing information on the development of the residual tensile strength, the deformation behavior, the interaction between the fibers and the surrounding mortar, the changes in the individual components, and the failure modes.

3. Materials and Test Design

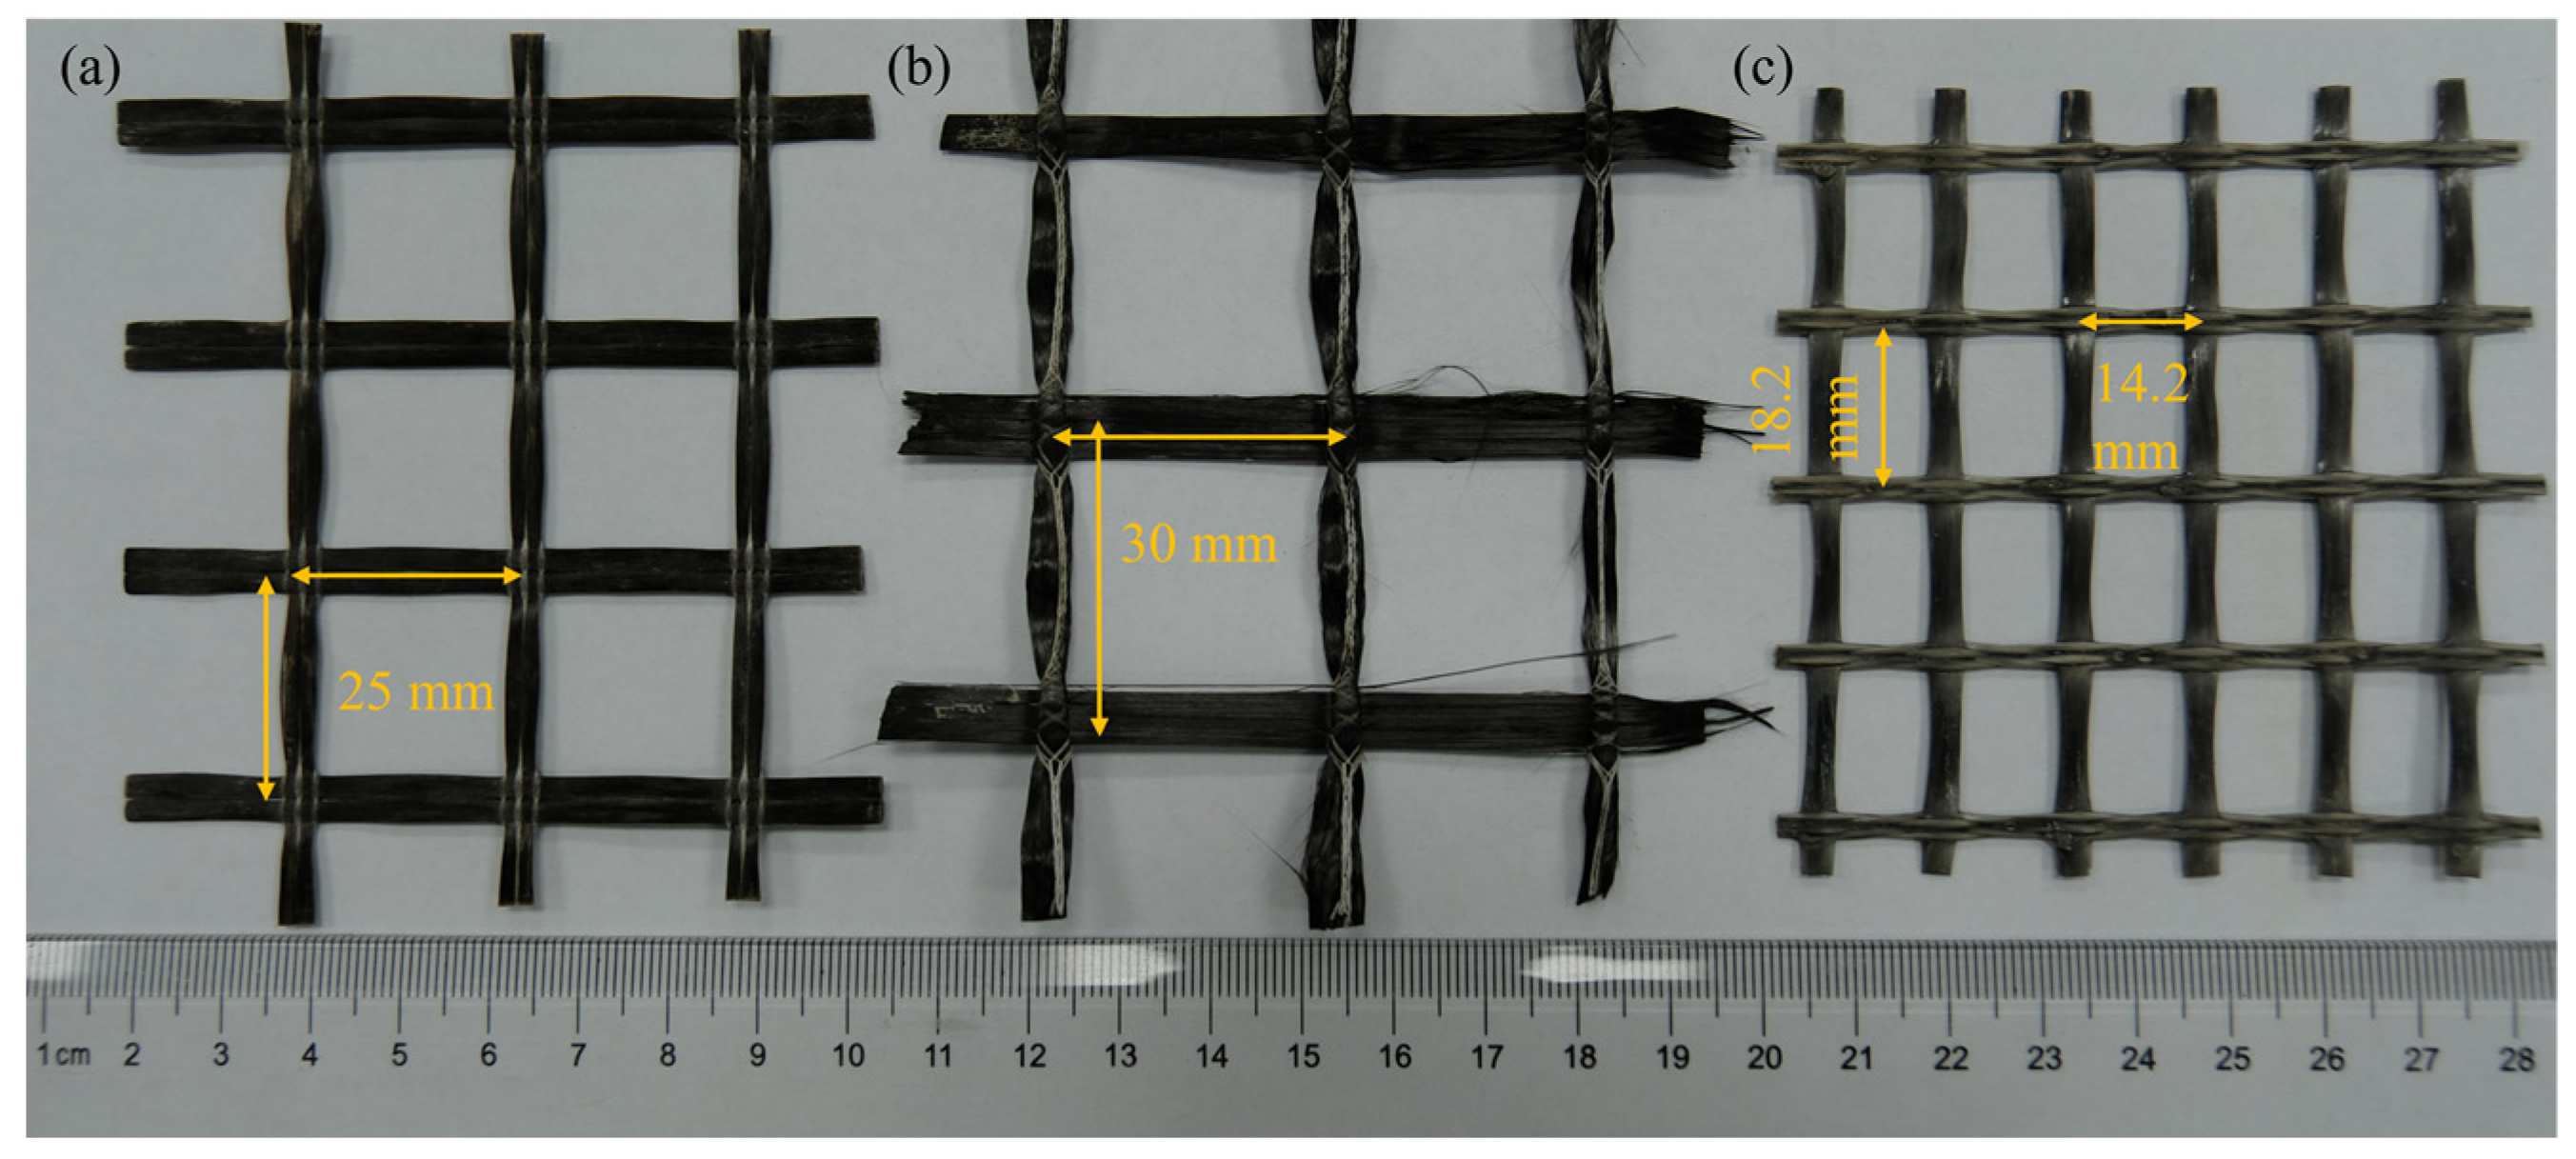
3.1. General Information

Three distinct fibers—carbon, basalt, and E-glass—were set up and used in an experimental campaign to measure the residual tensile strength of textile yarns and composite coupons after exposure to high temperatures. The coupons were made of grid-shaped fibers in a commercial polymer-modified cementitious mortar containing a trace amount of microfibers (the supplier provided no further information). Four target temperatures—20 °C, 100 °C, 200 °C, and 300 °C—were chosen, with specimens tested at room temperature (20 °C) serving as the reference. The mortar preparation’s water-to-binder mass ratio was 0.18. All fabrics were bidirectionally woven with the grid dimensions depicted in Figure 1. The warp and weft yarns were stitched together in the basalt and carbon grids, whereas the glass grid was thermofixed; the basalt yarns comprised two separated bundles. A high-temperature resistive agent was utilized as the carbon and basalt fiber coating material (the provider provided no details). At the same time, styrene–butadiene rubber (SBR) was used for the glass counterparts. The distribution of the glass fibers was 52% for the warp and 48% for the weft, but the reinforcement in two orthogonal directions was the same for the basalt and carbon textiles. The nominal roving area of textiles was estimated according to the area weight, coating substance content, and corresponding fiber density (Table 1).

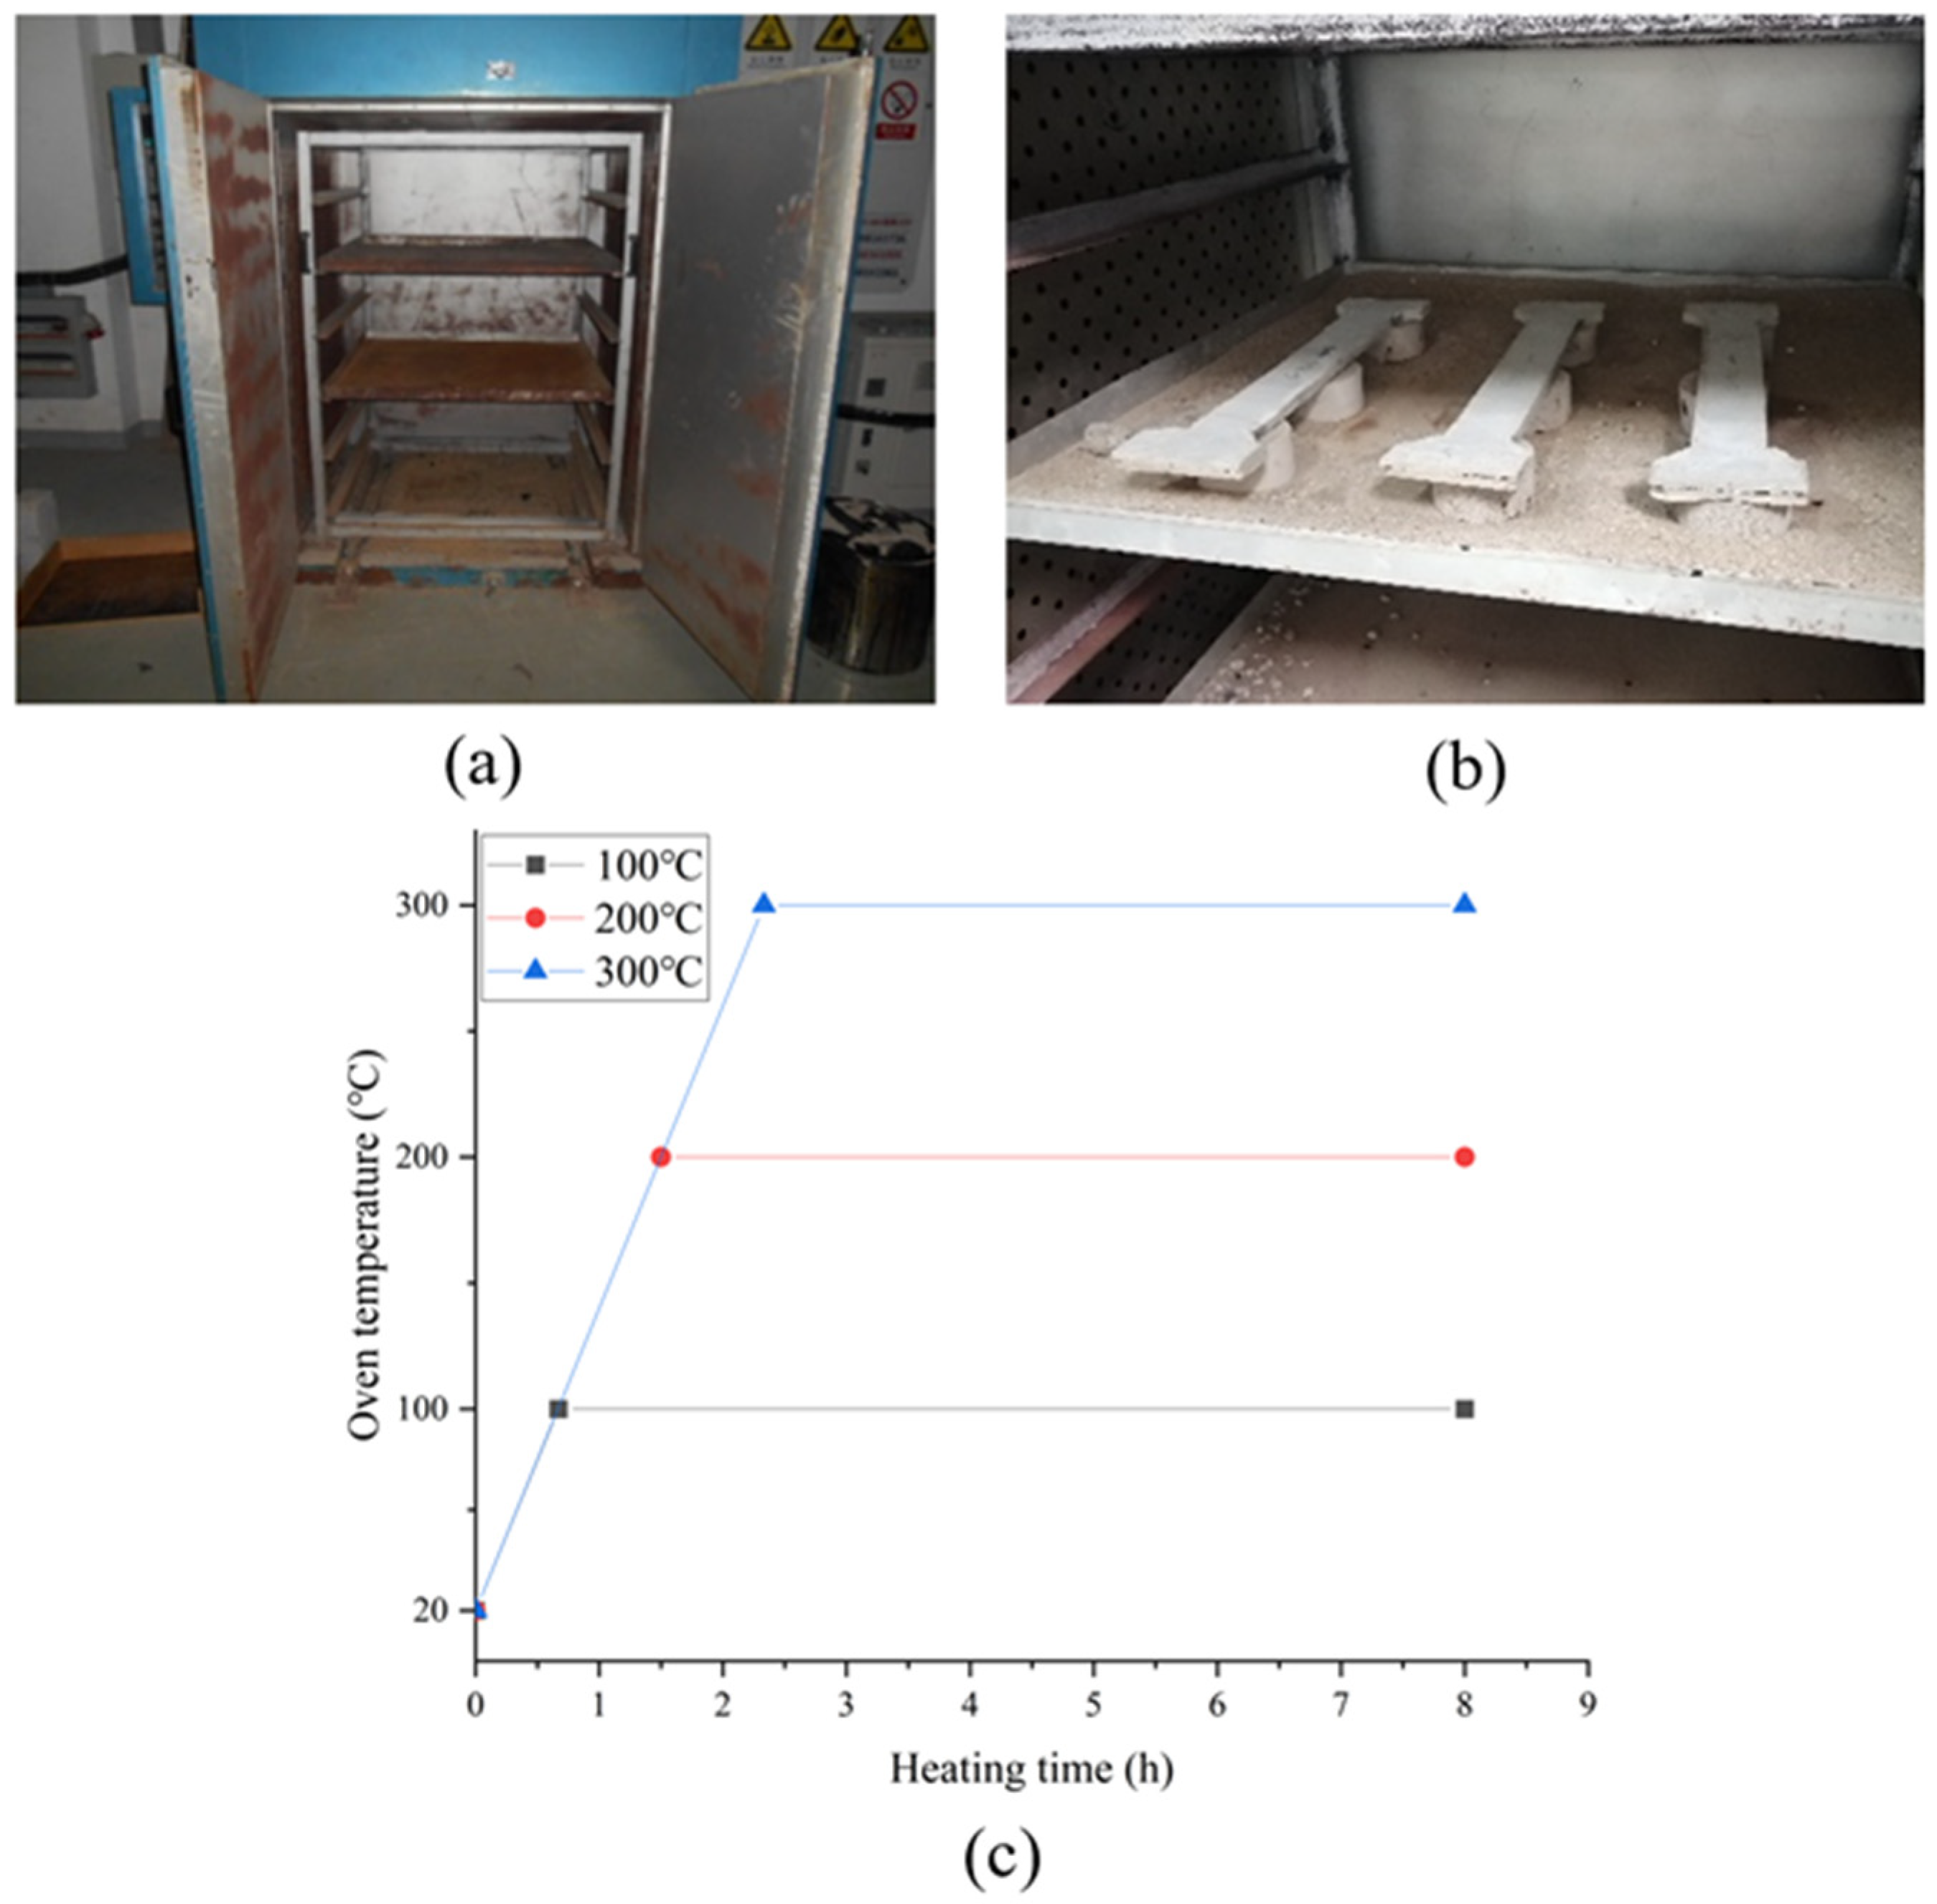
3.2. Specimen Preparation

According to EN 1015-11: 2019 [28], the mechanical characteristics of the mortar were evaluated by prism samples utilizing metallic molds with dimensions of 160 × 40 × 40 mm. For each temperature (the ambient included), three samples were cast and allowed to cure for 28 days in a controlled environment at 20 °C and 95% relative humidity. The dumbbell-shaped composite specimens (coupons) utilized for the tensile testing had a total length of 550 mm and a rectangular gauge area of 390 × 70 mm in the center; the dimensions used were according to De Santis et al. [29] (Figure 2a). The shape of the specimens and the test set-up adopted in this experimental campaign had certain variations compared with guidelines (e.g., AC 434 report [30]). The dumbbell shape was chosen against the rectangular one to accommodate the customized grip presented in the following section. The specimens consisted of a fabric textile laid manually in the middle of two mortar layers having 6 mm thickness each. The ends of the grids were adhered between two aluminum plates by a high-temperature resistive adhesive in an alternate arrangement described in Molter [31], preventing the heads of the dumbbell-shaped coupons from prematurely failing. The TRM specimens were prepared using specially made timber molds (Figure 2b). These specimens had an average thickness of 12 mm. All samples were kept in the laboratory (under indoor, protected conditions) for seven days until the start of the testing. Additionally, at least four separate yarns were extracted from each grid type and put through similar tests to monitor the fibers’ residual properties. The total length of the yarn samples was 300 mm, leaving an effective gauge length of 200 mm.

3.3. Test Set-Up

The three types of textiles were used to categorize the testing on TRM coupons and fabric yarns. According to the target temperature, each group of fibers was further separated into four distinct subcategories; three coupons and four yarns were tested at each temperature. Twelve TRM coupons and sixteen yarns were made for each type of fiber. In this set of tests, 48 samples of fabric yarns and 36 coupons in total were used. Each specimen was labeled using the alphanumeric code X-F-TN, where X designated the type of specimen (coupon or yarn), F the type of fiber, T the target temperature, and N the specimen number. For example, the first basalt yarn tested at 300 °C was called Y-B-3001.
The coupons, yarn samples, and mortar prisms were all heated in an electric furnace. The furnace, the placement of the specimens, and the temperature ramp are shown in Figure 3. The heating process lasted eight hours at a constant rate of 120 °C/hr. Because the mortar has a low thermal conductivity and diffusivity [32], the duration was chosen to ensure uniform temperature distribution and to mimic actual operational conditions. The specimens were positioned within the furnace on top of three concrete blocks to ensure even exposure of all sides (Figure 3b). All specimens were older than 28 days at the time of testing. All specimens were allowed to cool inside the furnace for nearly 24 h after the exposure; the gradual temperature drop was crucial to prevent potential thermal shock [17]. All mortar prisms underwent a three-point bending test to determine the flexural tensile strength. The two separated pieces were then put through a compression test to determine their strength. A 300 kN capacity universal testing machine (UTM) was used to test all TRM coupons. A clevis-style grip made specifically for the test (similar to the one used in [33]) was used for fixing the coupons to the device (Figure 2c). The decision to use the particular type of grip was based on two primary considerations: the avoidance of clamping the specimens directly to the machine due to concerns about damaging the contact area (pressure from the grips was manually controlled) and the observation of the fiber–matrix bond based on the works by Focacci et al. [34,35], hence the adopted shape of the specimens. The load application was in a displacement control mode with an initial speed of 0.05 mm/min up to the formation of the first crack and subsequently changed to 0.5 mm/min up to failure. A UTM with a 100 kN capacity was used to test fabric yarn specimens’ residual tensile characteristics (Figure 2d). After heating, the yarn edges were embedded between two 2 mm thick aluminum plates using an epoxy resin. The glue was allowed to cure for at least 48 h before testing. The load was applied by using displacement control at a 0.5 mm/min speed. As seen in Figure 2c, the deformations were recorded using external LVDTs attached to the coupons and yarns. The TGA, SEM, and XRD were performed on three fragment samples from the tested mortar and yarn specimens. For the TG analysis, a Netzsch STA 449 F3 device was used in a technical air environment with a heating and flow rate of 10 °C/min 60 mL/min, respectively. The surface morphology of the fibers and the inorganic matrix were observed using a HITACHI TM3000 SEM device. XRD measurements were performed with a double light source single-crystal Bruker D8 VENTURE diffractometer and an X-ray wave length λ = 1.5418.

4. Results and Discussion

4.1. Flexural and Compressive Tests on Mortar Specimens

The results obtained from the flexural and compressive tests on mortar specimens exposed to 100 °C, 200 °C, and 300 °C before testing are presented in Table 2. Between 20 °C and 100 °C, the mean flexural strength remained unchanged, whereas the mean compressive strength decreased by 40.6%. As was expected, the temperature of 100 °C was a tipping point since, for higher temperatures, both the flexural and the compressive strength changed their behavior. Between 200 °C and 300 °C, the former decreased—by 7.8% and 35%—while the latter increased—by 5.4% and 11.8%—respectively. However, from the variation of the respective values between 100 °C and 300 °C, it can be speculated that the compressive strength remained unchanged. The bigger scatter of the results at 200 °C was attributed to the nonuniform alterations in the mortar mass. Additionally, the mean tensile strength value was calculated per the FIB Model Code for Concrete Structures [36] and provided in the same table to compare the tensile stress in the mortar σ 1 , m at the first crack.

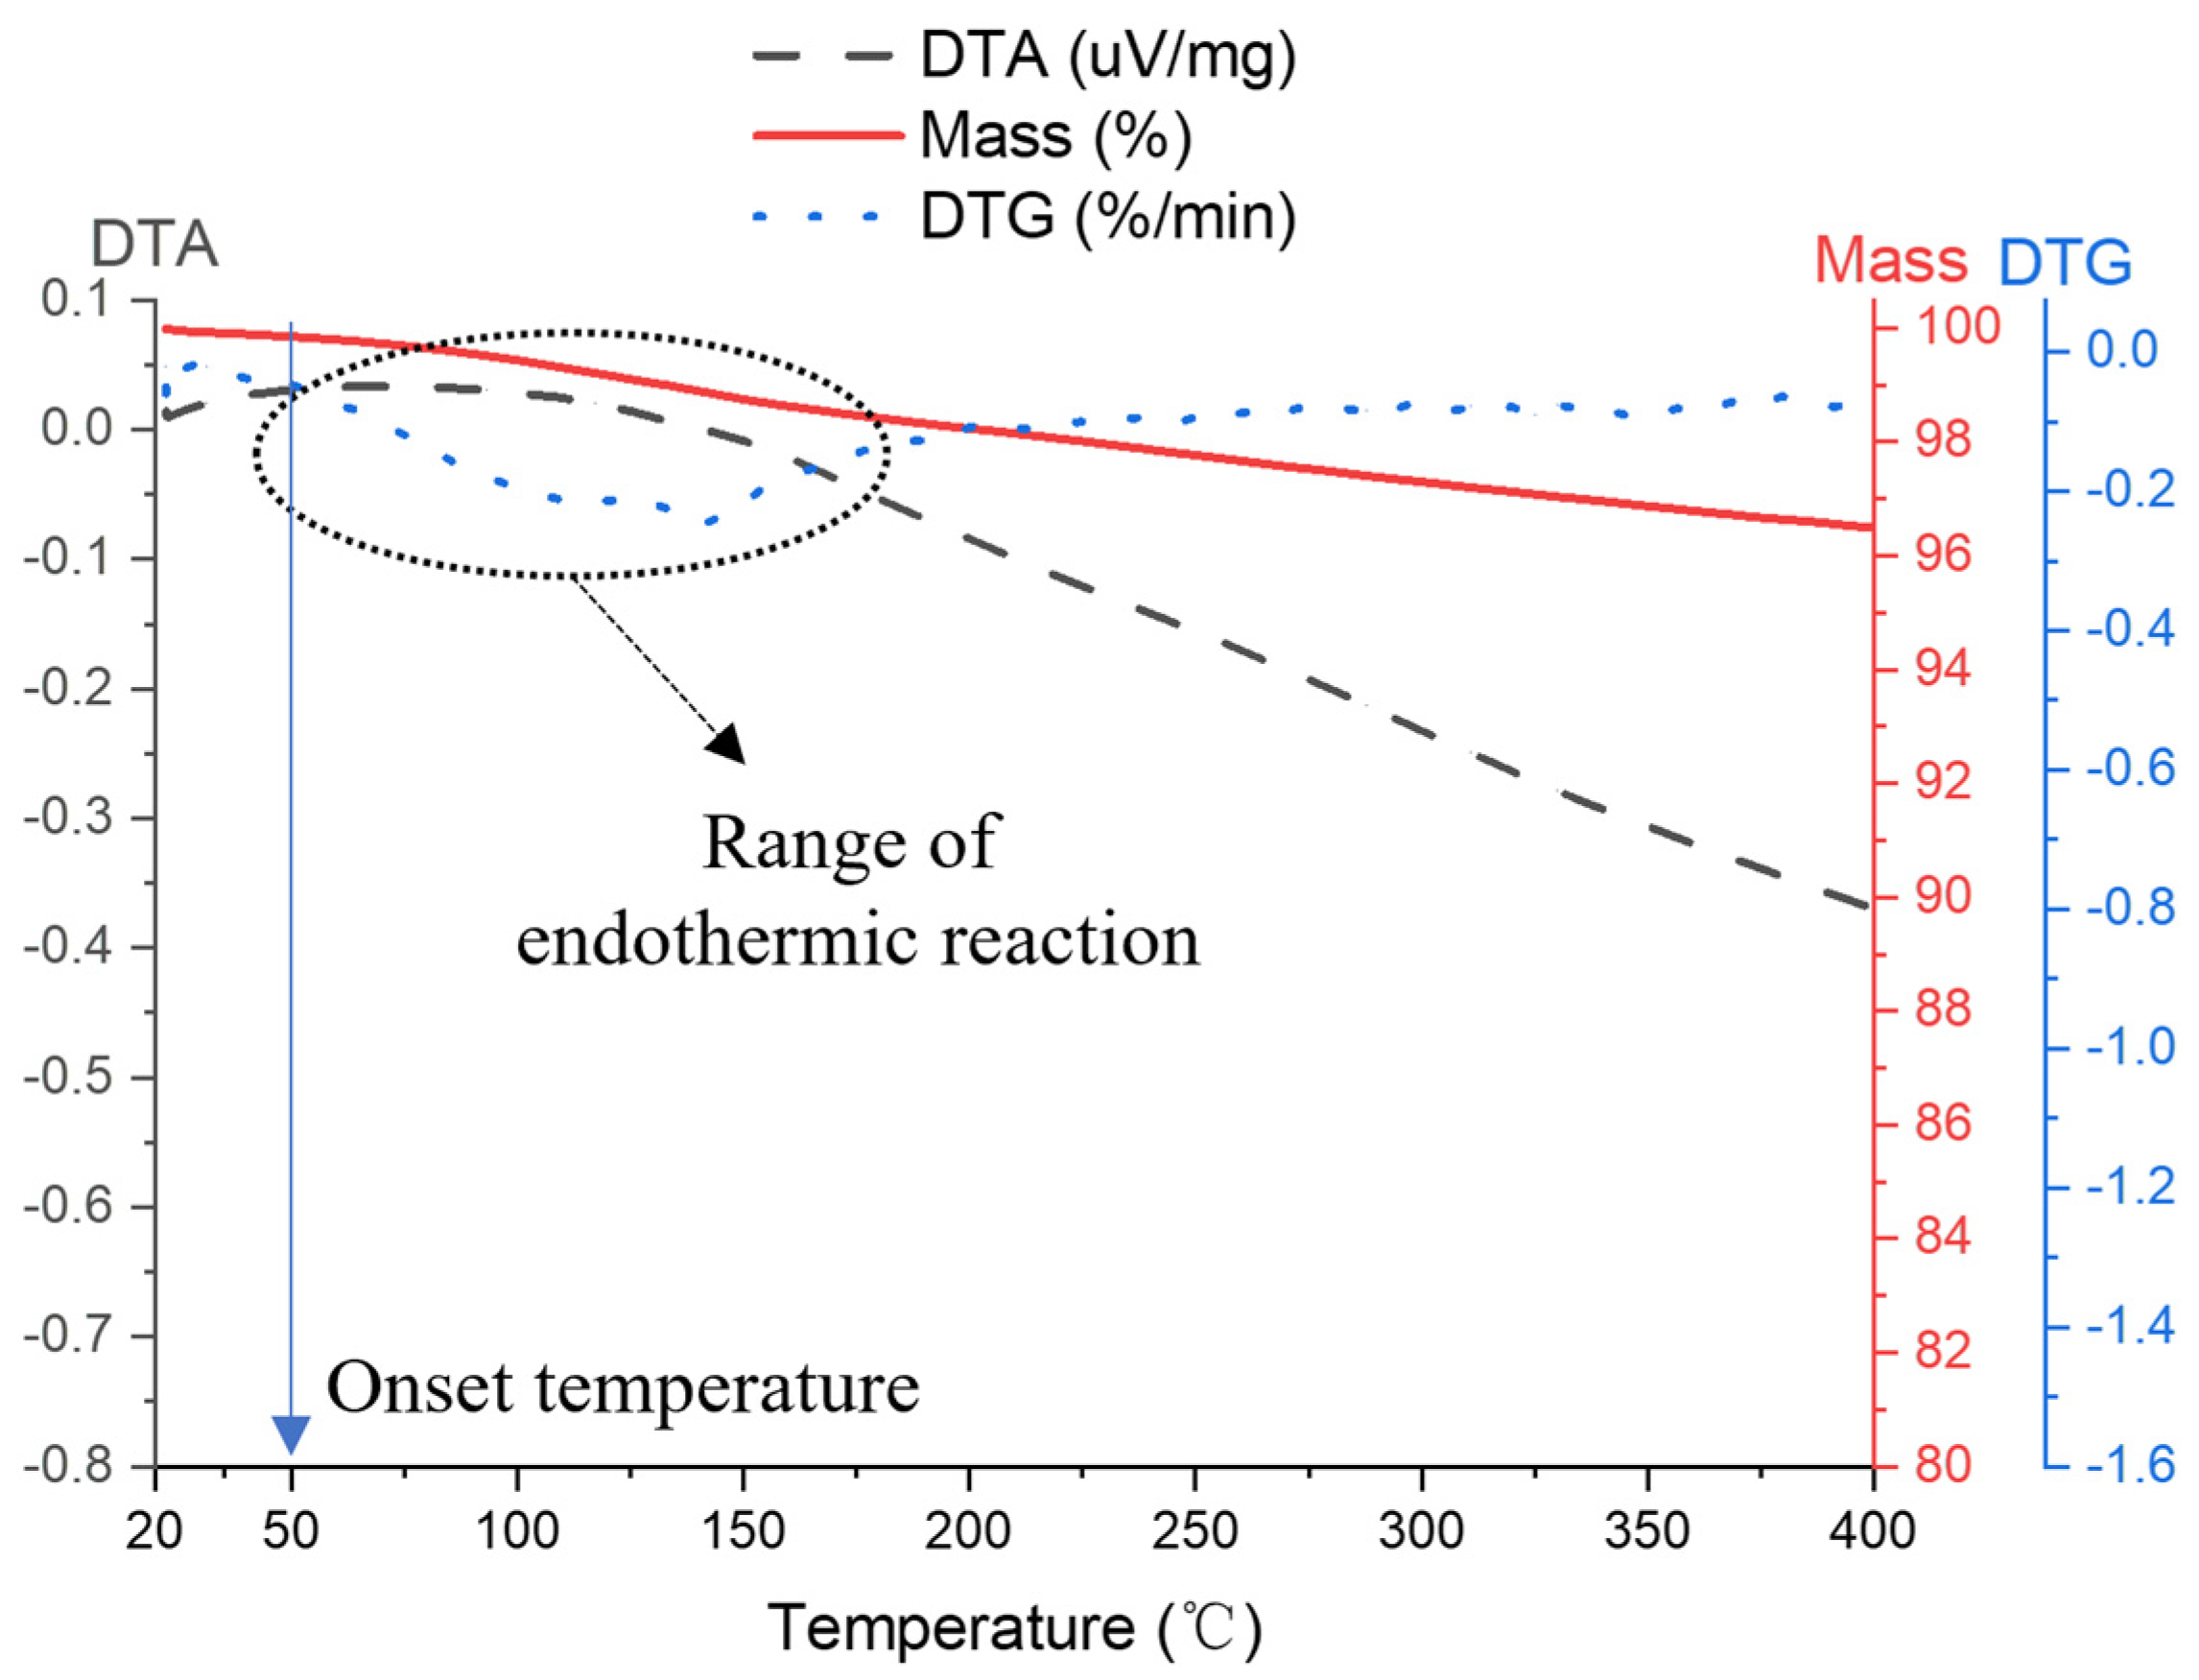
4.2. XRD, SEM, and TGA for the Mortar

The changes that were observed in the mortar’s microstructure are presented in the following section. The results obtained from the XRD analysis are presented in Table 3 and Figure 4. As can be seen, between 20 °C and 100 °C, there was a decrease in the integrated peak intensity (IPI) of calcium hydroxide owing to improved ‘curing’ conditions allowing the polymeric film dispersion. The resiliency of the flexural strength was thought to be caused by this phenomenon, combined with the existing microfibers and the drop in water content from evaporation [5]. Additionally, the IPI of quartz and calcite was relatively high at room temperature. The first indicated that carbonation began during the test, whereas the second correlated to the increase in the elevated silica level of the polymeric component [32]. The delayed ettringite formation (DEF), which occurs between 20 °C and 100 °C, was probably the reason for the increase in the relevant IPI—that extra amount aided in the mortar’s continued degradation [37]. Above 100 °C, the ettringite becomes unstable and starts to decompose. As Table 3 shows, between 100 °C and 200 °C, the polymeric film’s deterioration allowed the release of calcium hydroxide; between 200 °C and 300 °C, the decrease in the latter might be attributed to supplemental carbonization, hence the increase in calcite. Zhou and Glasser [38] and Jeong et al. [39], reported that if the specimens return to environmental conditions after heating, then the C-S-H, the monosulfate and the pore solution can react and produce more ettringite. Therefore, this most likely explains why the IPI for the specimens treated at 300 °C was enhanced; however, a more in-depth investigation of the phenomena is outside the boundaries of this work. Additionally, the TGA test results show that the first stage of mass loss began at 80 °C due to the evaporation of unbounded water, with a starting temperature of 50 °C (the endothermic reaction’s peak is shown in Figure 5). Extra information on the use of the TGA is provided in Appendix A. The decrease in the compressive strength between 20 °C and 100 °C is linked to the procedure above; the water evaporation helps the microcrack formation and weakens the cohesive forces within C-S-H [40]. Above 100 °C, the dehydration of C-S-H and the ettringite decomposition partially restored the compressive strength [38,41,42]. The latter is decomposed at around 120 °C, hence the observed peak of the derivative mass loss (DTG) (Figure 5). Additionally, the SEM pictures demonstrate a gradual deterioration of the mortar’s internal structure. They depict the melting of the microfibers in temperatures above 200 °C, which increased the porosity and further weakened the mortar’s performance (Figure 6).

4.3. Fabric Yarns Tensile Test

Table 4 summarizes the heat-treated basalt, carbon, and glass textile yarn’s residual tensile strength. The maximum load measured over the roving area was the basis for calculating the tensile strength, while ASTM D2256-02 [43] was used to determine the elastic modulus. The relevant strain was determined based on the deformation obtained from the two LVDTs divided by the gauge length. The relative stress–strain curves are shown in Figure 7. The outcomes demonstrated that the three different fibers’ residual strengths were affected by temperature in various ways. Starting from the basalt yarns, the exposure to 100 °C increased the tensile strength by 37%, while at 200 °C, there was an increase of 31%. The residual strength at 300 °C deteriorated fast, exhibiting a drop of 33%.
On the other hand, carbon fibers proved more resilient up to 200 °C, since the residual tensile strength exhibited small fluctuations; at 100 °C, there was a drop of 4.3%, while up to 200 °C, the strength increased by 7%. At 300 °C, the yarns lost 7.2% of their original strength. The glass yarn exhibited a different performance, for which the residual tensile strength remained unaffected up to 100 °C (a slight increase of 2.3%). By contrast, from 100 °C to 200 °C, the residual strength increased by 7%, while an increase of 4% was recorded between 200 °C and 300 °C. Meanwhile, all types of fibers exhibited a consistent increase in the modulus of elasticity after heat treatment in all temperatures.
The failure modes observed during the tensile tests varied according to the fiber type and the temperature level. More accurately, the basalt yarns exposed to environmental conditions failed due to the gradual breakage of individual filaments, unlike the specimens exposed to 100 °C, which failed due to rupture of one of the yarns (Figure 8a,b). Individual filament breakage determined the type of failure at 200 °C and 300 °C (Figure 8c,d). The failure of carbon yarns, up to 200 °C, was characterized by abrupt rupture. The failure was close to the grips or in the middle (Figure 9a–c). At 300 °C, the gradual breakage of filaments was the prominent mode (Figure 9d). The glass fibers showed similar behavior: up to 200 °C failed due to abrupt rupture either in the middle or close to the grips (Figure 10a–c); at 300 °C, failure was characterized by gradual breakage of individual filaments (Figure 10d).
The changes in the coating agent (melting and solidification) explained the relative increase in tensile strength for all types of fibers up to 200 °C due to better impregnation of the filaments in the yarns. Additionally, all specimens became more brittle between 200 °C and 300 °C due to changes in their microstructure and the wear off of the coating (details are discussed in the following section). At 200 °C and 300 °C, in particular, basalt and carbon fiber yarns were difficult to handle (the filaments were easily broken). The specific behavior was not so extensive for the glass fiber grids, implying that SBR performed better. The separation of the filaments observed at 300 °C indicated the deterioration of the coating material for all types of fibers (Figure 8d, Figure 9d and Figure 10d).

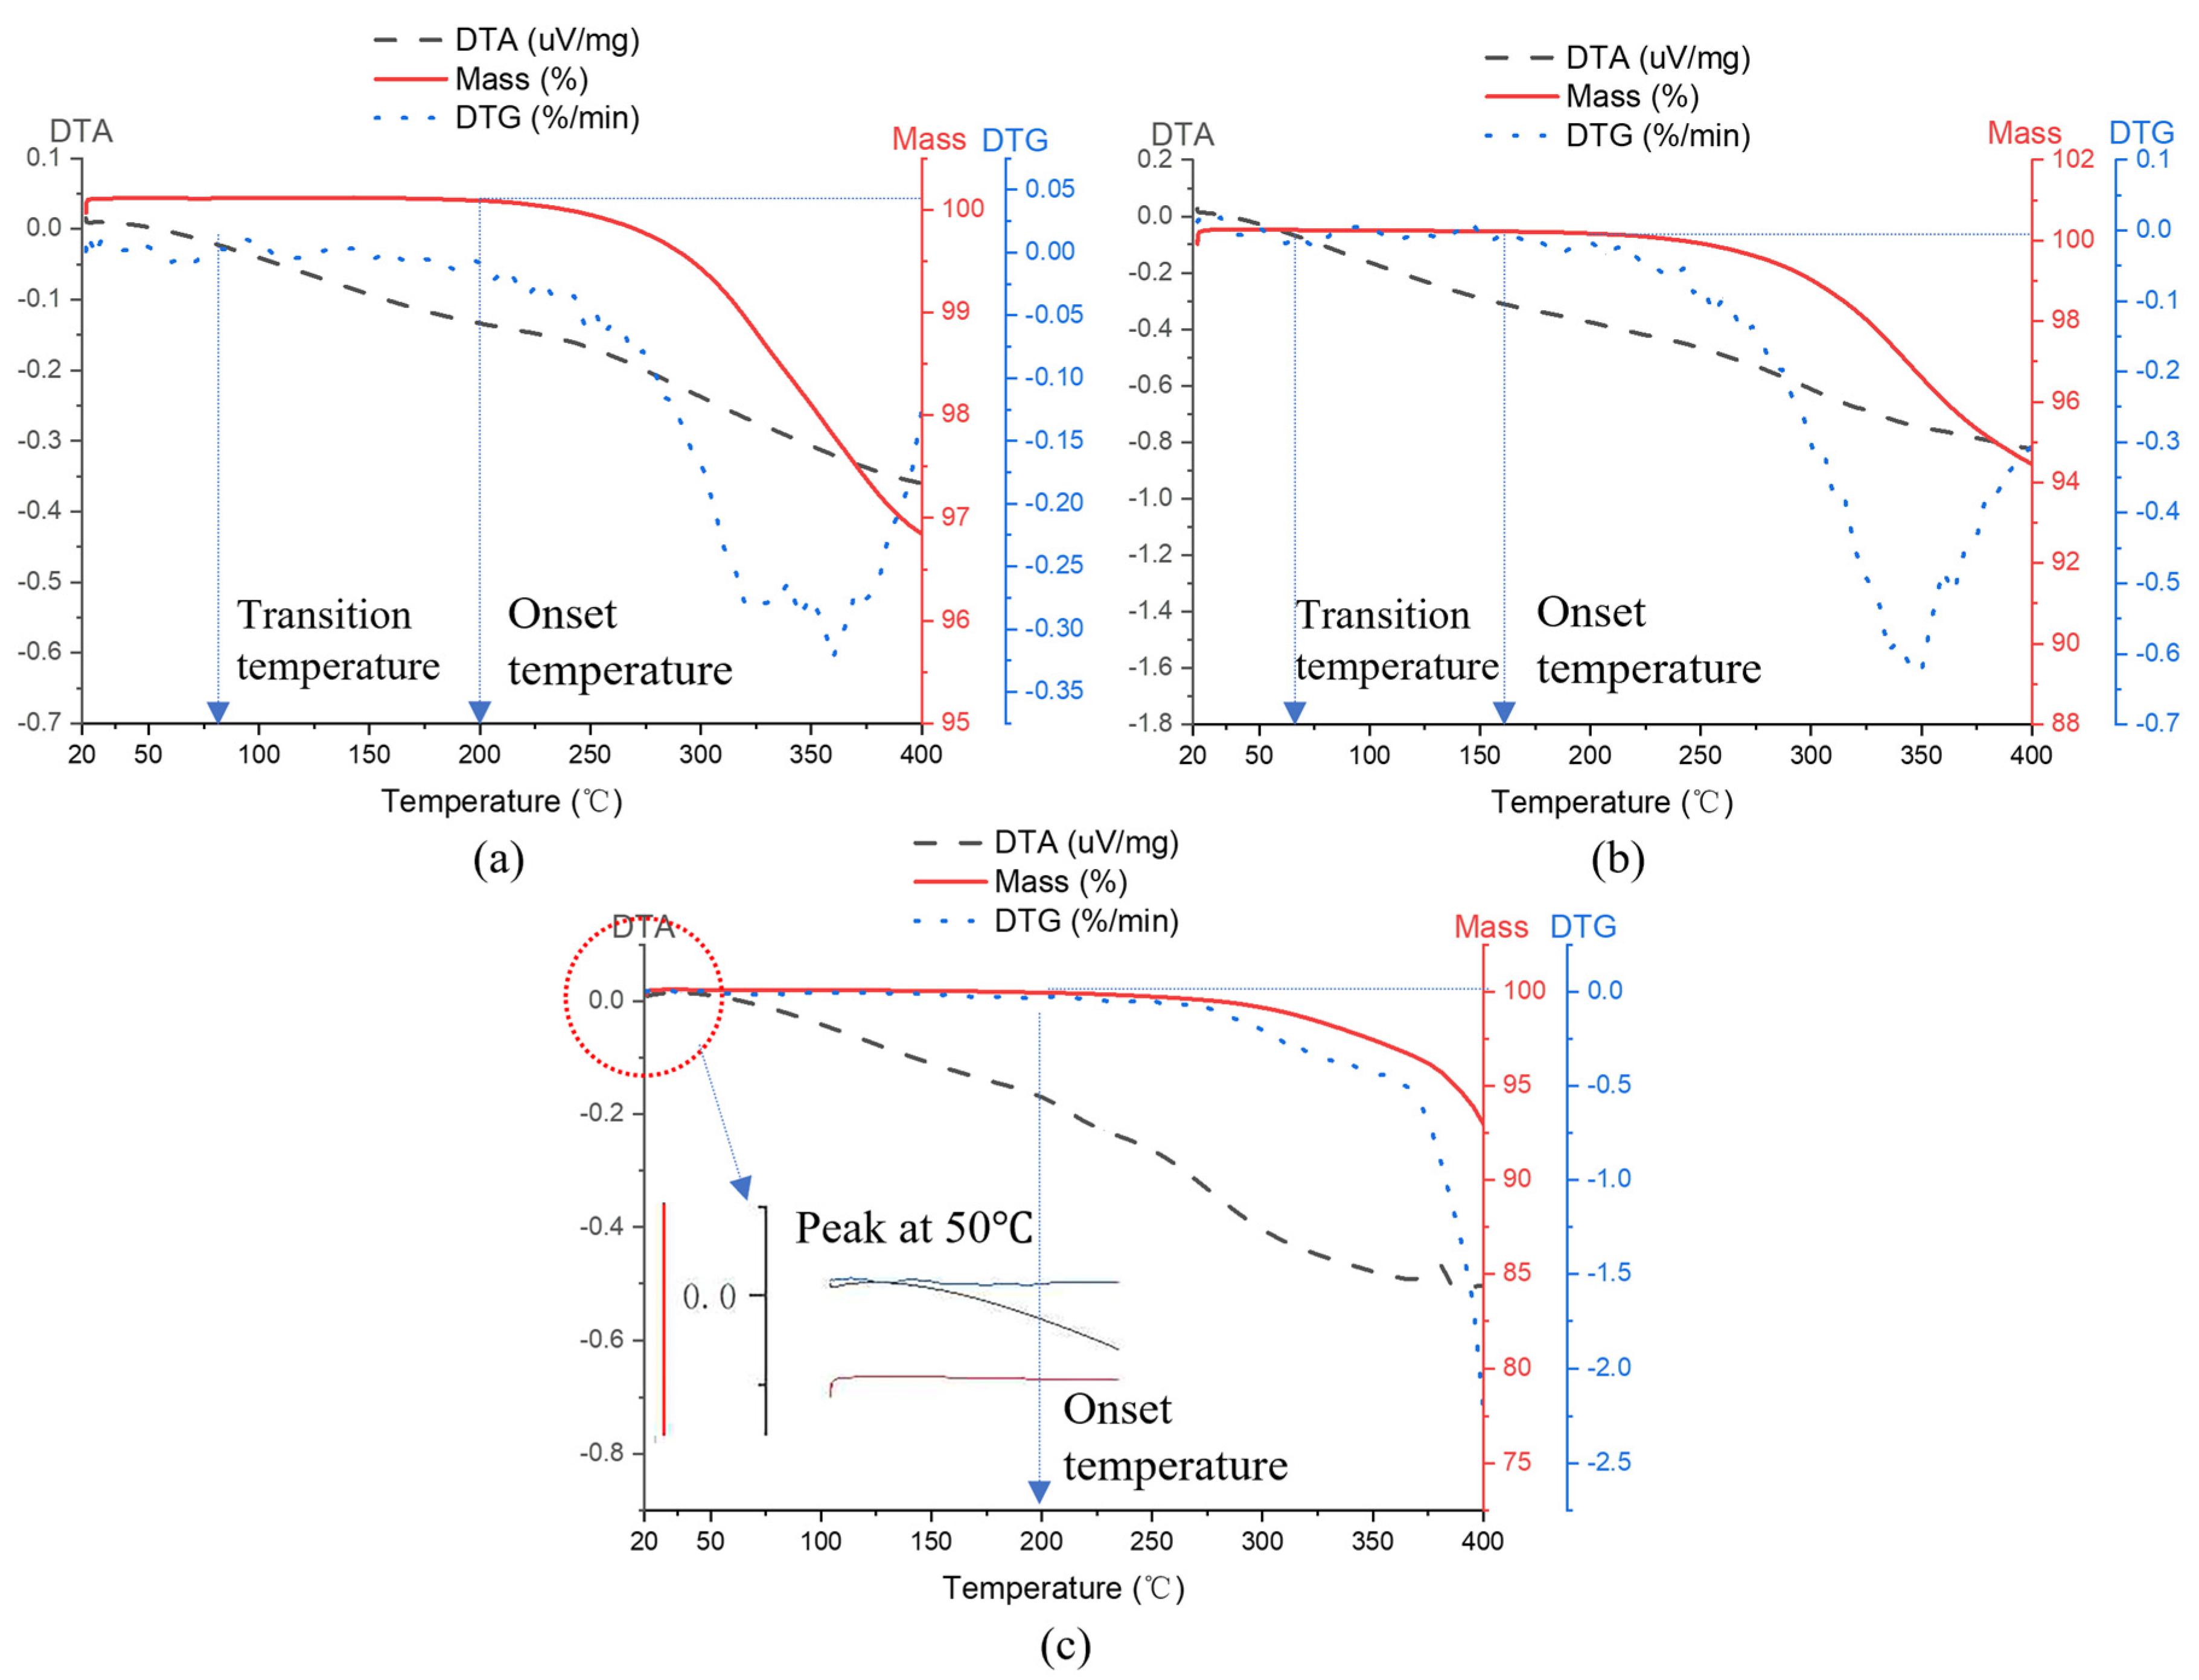
4.4. XRD, SEM, and TGA Tests for the Yarns

Figure 11a–c presents the XRD curves for the three types of fibers subjected to different temperature environments. Changes in the peak intensity demonstrated a dependency on the types of fibers and temperature. As was expected, the basalt and glass fibers had similar curves, whereas the respective carbon exhibited a different XRD pattern. The changes were more evident for the basalt and glass than for carbon fibers throughout the range of temperatures, implying changes in the microstructure. Additionally, their samples heated to 300 °C showed a sizable peak intensity shift to the right. Particularly for the glass fibers, this pattern was more noticeable (Figure 11c). Those changes were attributed to the weakening of the chemical bonds in the basalt structure [44] and the lattice’s compressive stresses caused by the glass fibers’ contraction [45,46]. At the same time, the carbon fibers exhibited a considerable change in the XRD curve between 200 °C and 300 °C (the corresponding peak became broader than in the previous temperatures). The slight alteration in the grain sizes caused by the degree of graphitization of carbon was responsible for that change after exposure to 300 °C.
Table 5 presents the full width of the peaks at half maximum height (FWHM) used to detect potential lattice strains. A similarity between basalt and glass fibers appeared—the carbon, on the contrary, remained almost unchanged. The decrease in the FWHM between 20 °C and 100 °C for the basalt and glass fibers implied tensile stress relaxation in the microstructure [47]. Since the temperatures were low, this relaxation was attributed to modifications in the coating material. Based on evidence obtained from TGA (presented in the subsequent paragraph) and on findings from other researchers (e.g., [48]), the glass transition temperature for the polymeric coating agent was between 75 °C and 100 °C. The specific transition requires the breakage of secondary bonds between the atoms involved in this type of relaxation [49]. At 200 °C, the FWHM values for the basalt and the glass fibers increased, while the carbon remained unchanged. This behavior implied the existence of residual nonuniform strains; a possible partial penetration of the material to the fiber might also have occurred, as other researchers stressed [15,48,50]. Furthermore, the decrease in FWHM at 300 °C for both fibers indicated substantial residual strains (compressive) in the solid structure, implying fiber contraction, hence the XRD peaks shift to the right.
The SEM pictures depict significant alterations of the coating material. Especially for the basalt, and to a lesser extent for the carbon and glass fibers, the transformations of the coating agent were more evident at 100 °C (Figure 12b,f,j). At 200 °C, and especially at 300 °C, the structure of all the grids gave signs of deterioration: multiple fractures of fibers, absence or heavy decomposition of the coating agent (Figure 12c,g,k,d,h,l). The absence of the latter was responsible for the decrease in strength not only because of the uneven distribution of stresses but also because it revealed initial flaws on the surface of the fibers. According to [51,52], the desizing effect—removal of the coating through heating—reveals these flaws and precipitates failure; the spots on the surface of the glass and the basalt fibers at 300 °C were indicative (Figure 12d,l). The same effect can also explain the increase in elastic modulus with temperature. On the other hand, the SEM pictures show that the SBR as a sizing agent was more resistant—it starts to deteriorate above 200 °C [53]—hence the rupture of the fiber yarns up to that temperature. Additionally, the difference in the coefficient of thermal expansion between SBR and glass fibers—the former is higher than the latter—yielded cracking of the surrounding coating material during cooling (Figure 12k,l). An important factor that needs to be further investigated is the duration of the exposure to the elevated temperatures, since it plays an important role in the overall behavior of the fibers [51,54,55,56].
Furthermore, the heating and cooling-off of the samples plays a significant role in the interfacial shear strength (IFSS) developed between the fibers and the coating material. According to Jenkins [46], between 180 °C and 200 °C the IFSS increases, hence the increased tensile strength between 100 °C and 200 °C. Nonetheless, more research is needed on this specific aspect.
The TGA results supported the findings described above (Figure 13). The onset temperature for all fibers ranged between 150 °C and 200 °C. The extrapolated onset temperature ( T o ) for the carbon and basalt fibers was around 270 °C and 360 °C for the glass counterparts, marking the initiation of mass loss related to the volatile behavior of the coating agent. The inflation point for the carbon and basalt fibers was around 360 °C and 400 °C for glass. Additionally, in the differential thermal analysis (DTA) curve for the carbon and the basalt fibers, a slight change occurred at around 70 °C, while a peak occurred close to 50 °C for the glass fibers, signaling the glass transition temperature for the coating agents. Additional information for defining the terms mentioned above is presented in Appendix A.

4.5. TRM Coupons Tensile Test

4.5.1. Stress–Strain Diagrams

Figure 14 illustrates the average stress vs. strain curves for all the types of fibers at different temperature environments. The majority of the coupons responded consistently across all temperatures. A nonlinear transition zone typically followed the first linear section, signifying the start of microcracking before the first significant crack. Most of the time, Stages II and III were difficult to discern from one another. The behavior was slightly different for two basalt specimens tested at ambient temperature, one at 200 °C, and one at 300 °C, since after cracking, slippage of the fibers within the matrix led to failure. The clevis-type grip and the deterioration of the mortar at high temperatures were considered responsible for the absence of stage II (e.g., [57,58,59,60]); in retrospect inspections, it was clear that the embedded aluminum plates did not prevent the slippage of the fibers within the coupons. At the final stage, most specimens failed after displaying an ascending branch or pseudohardening effect. At this point, the graphs had a certain jaggedness from the gradual failure of individual filaments.

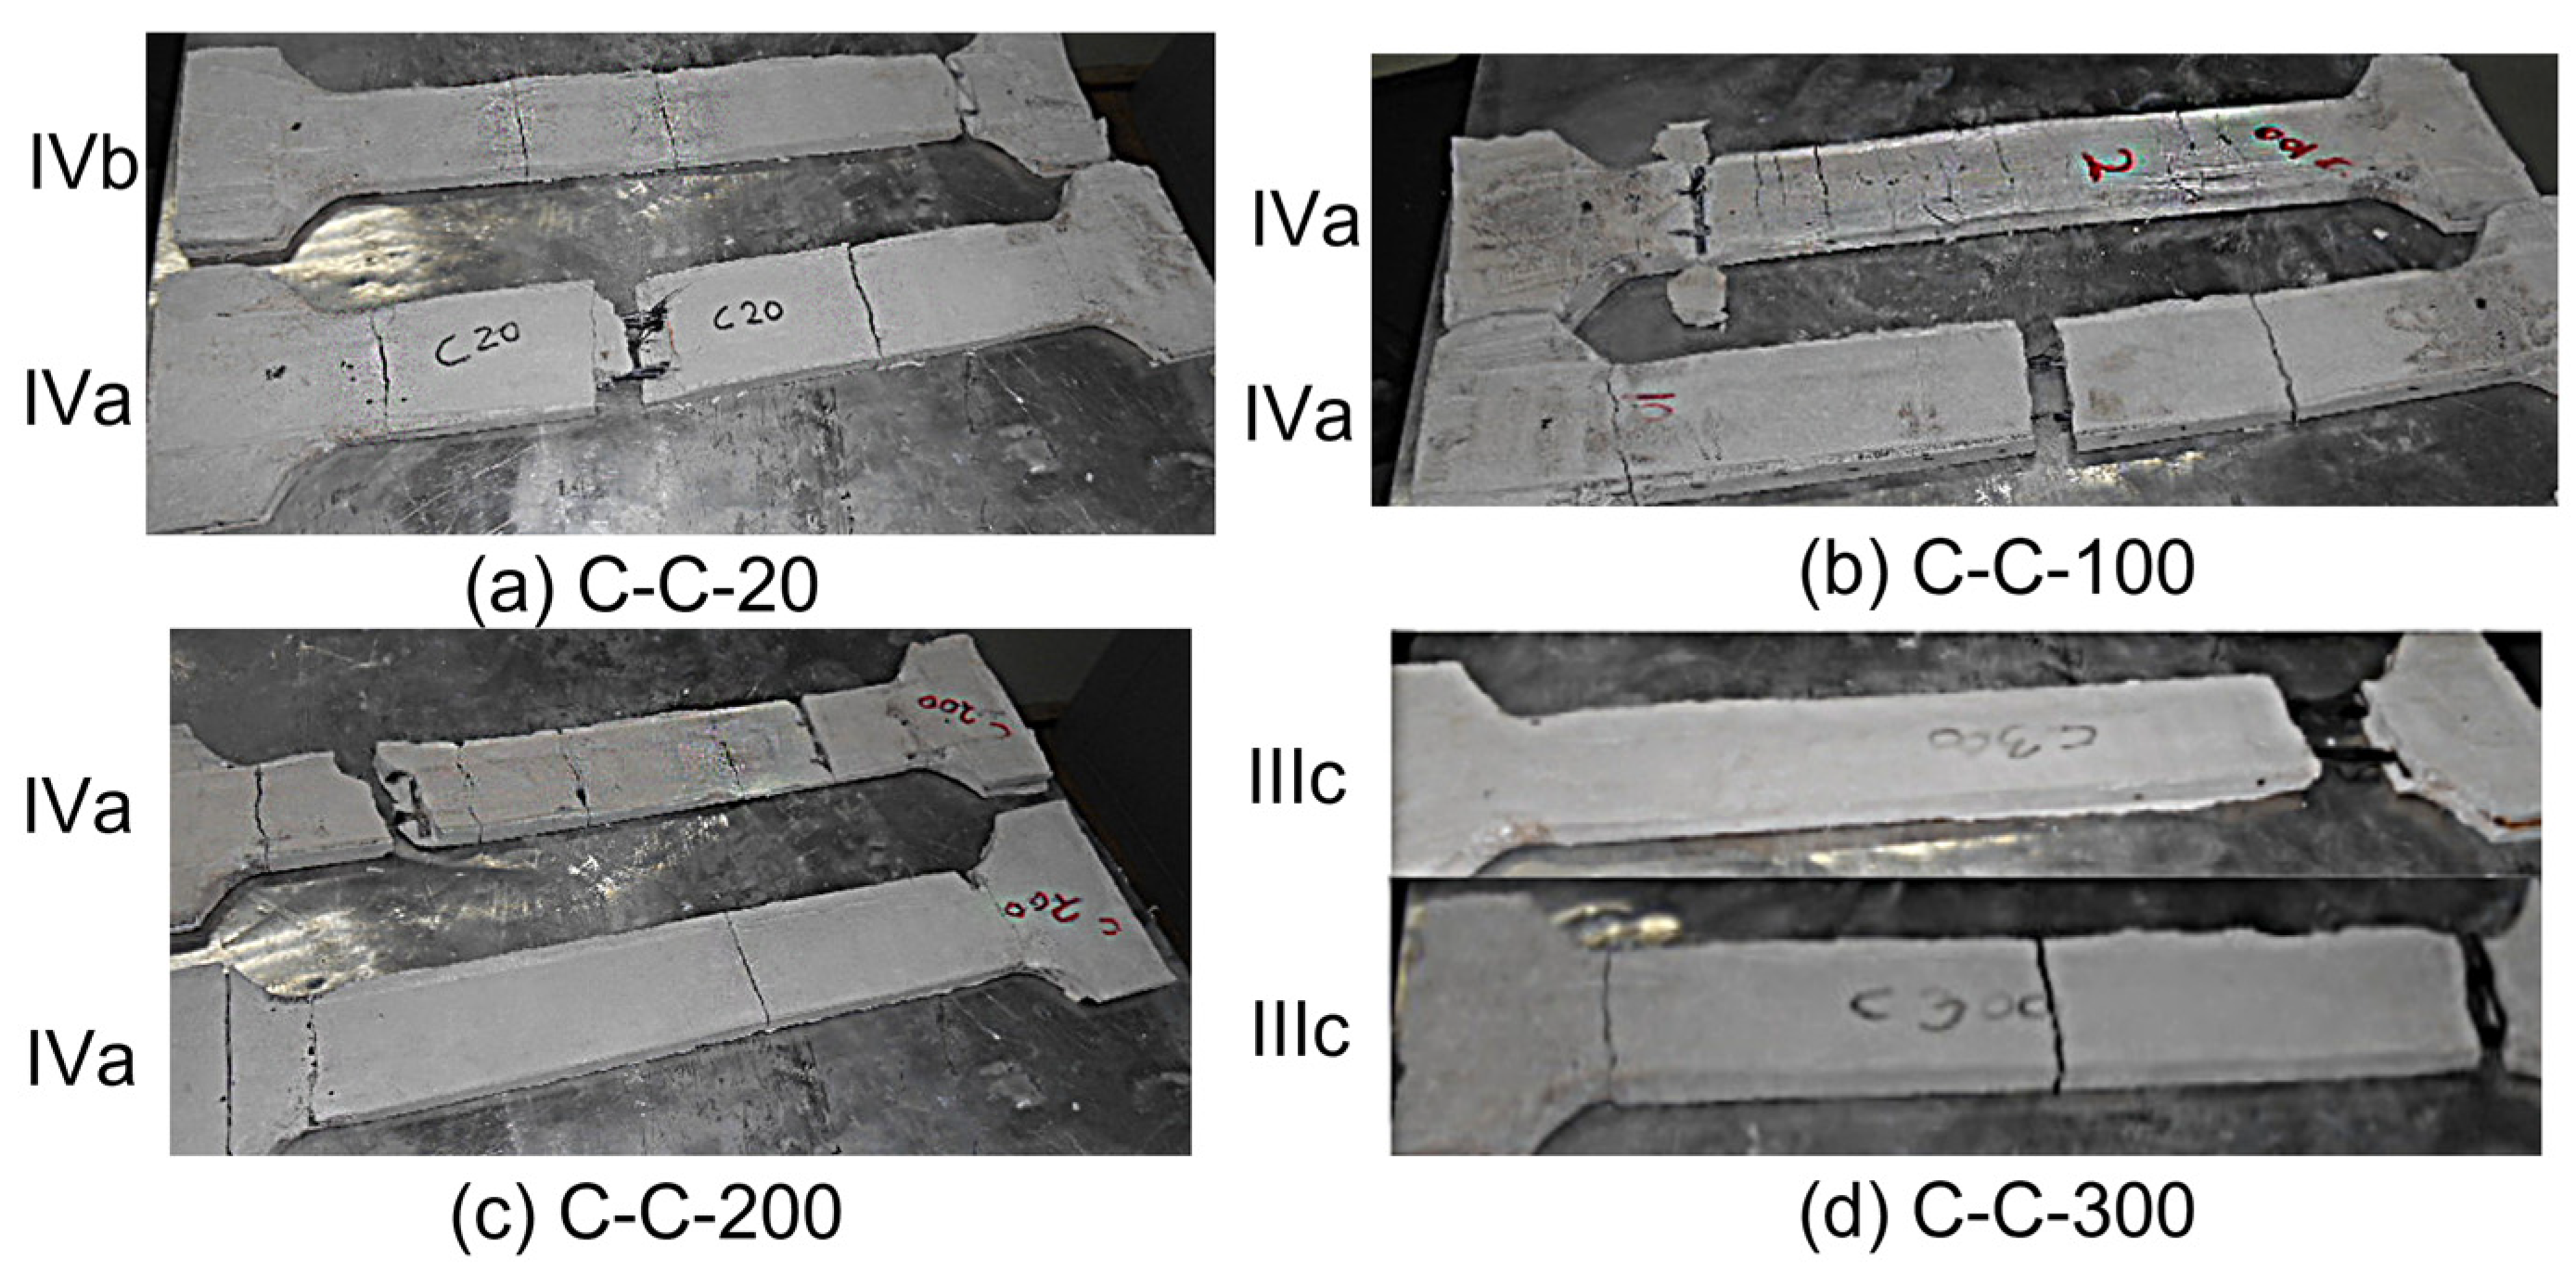
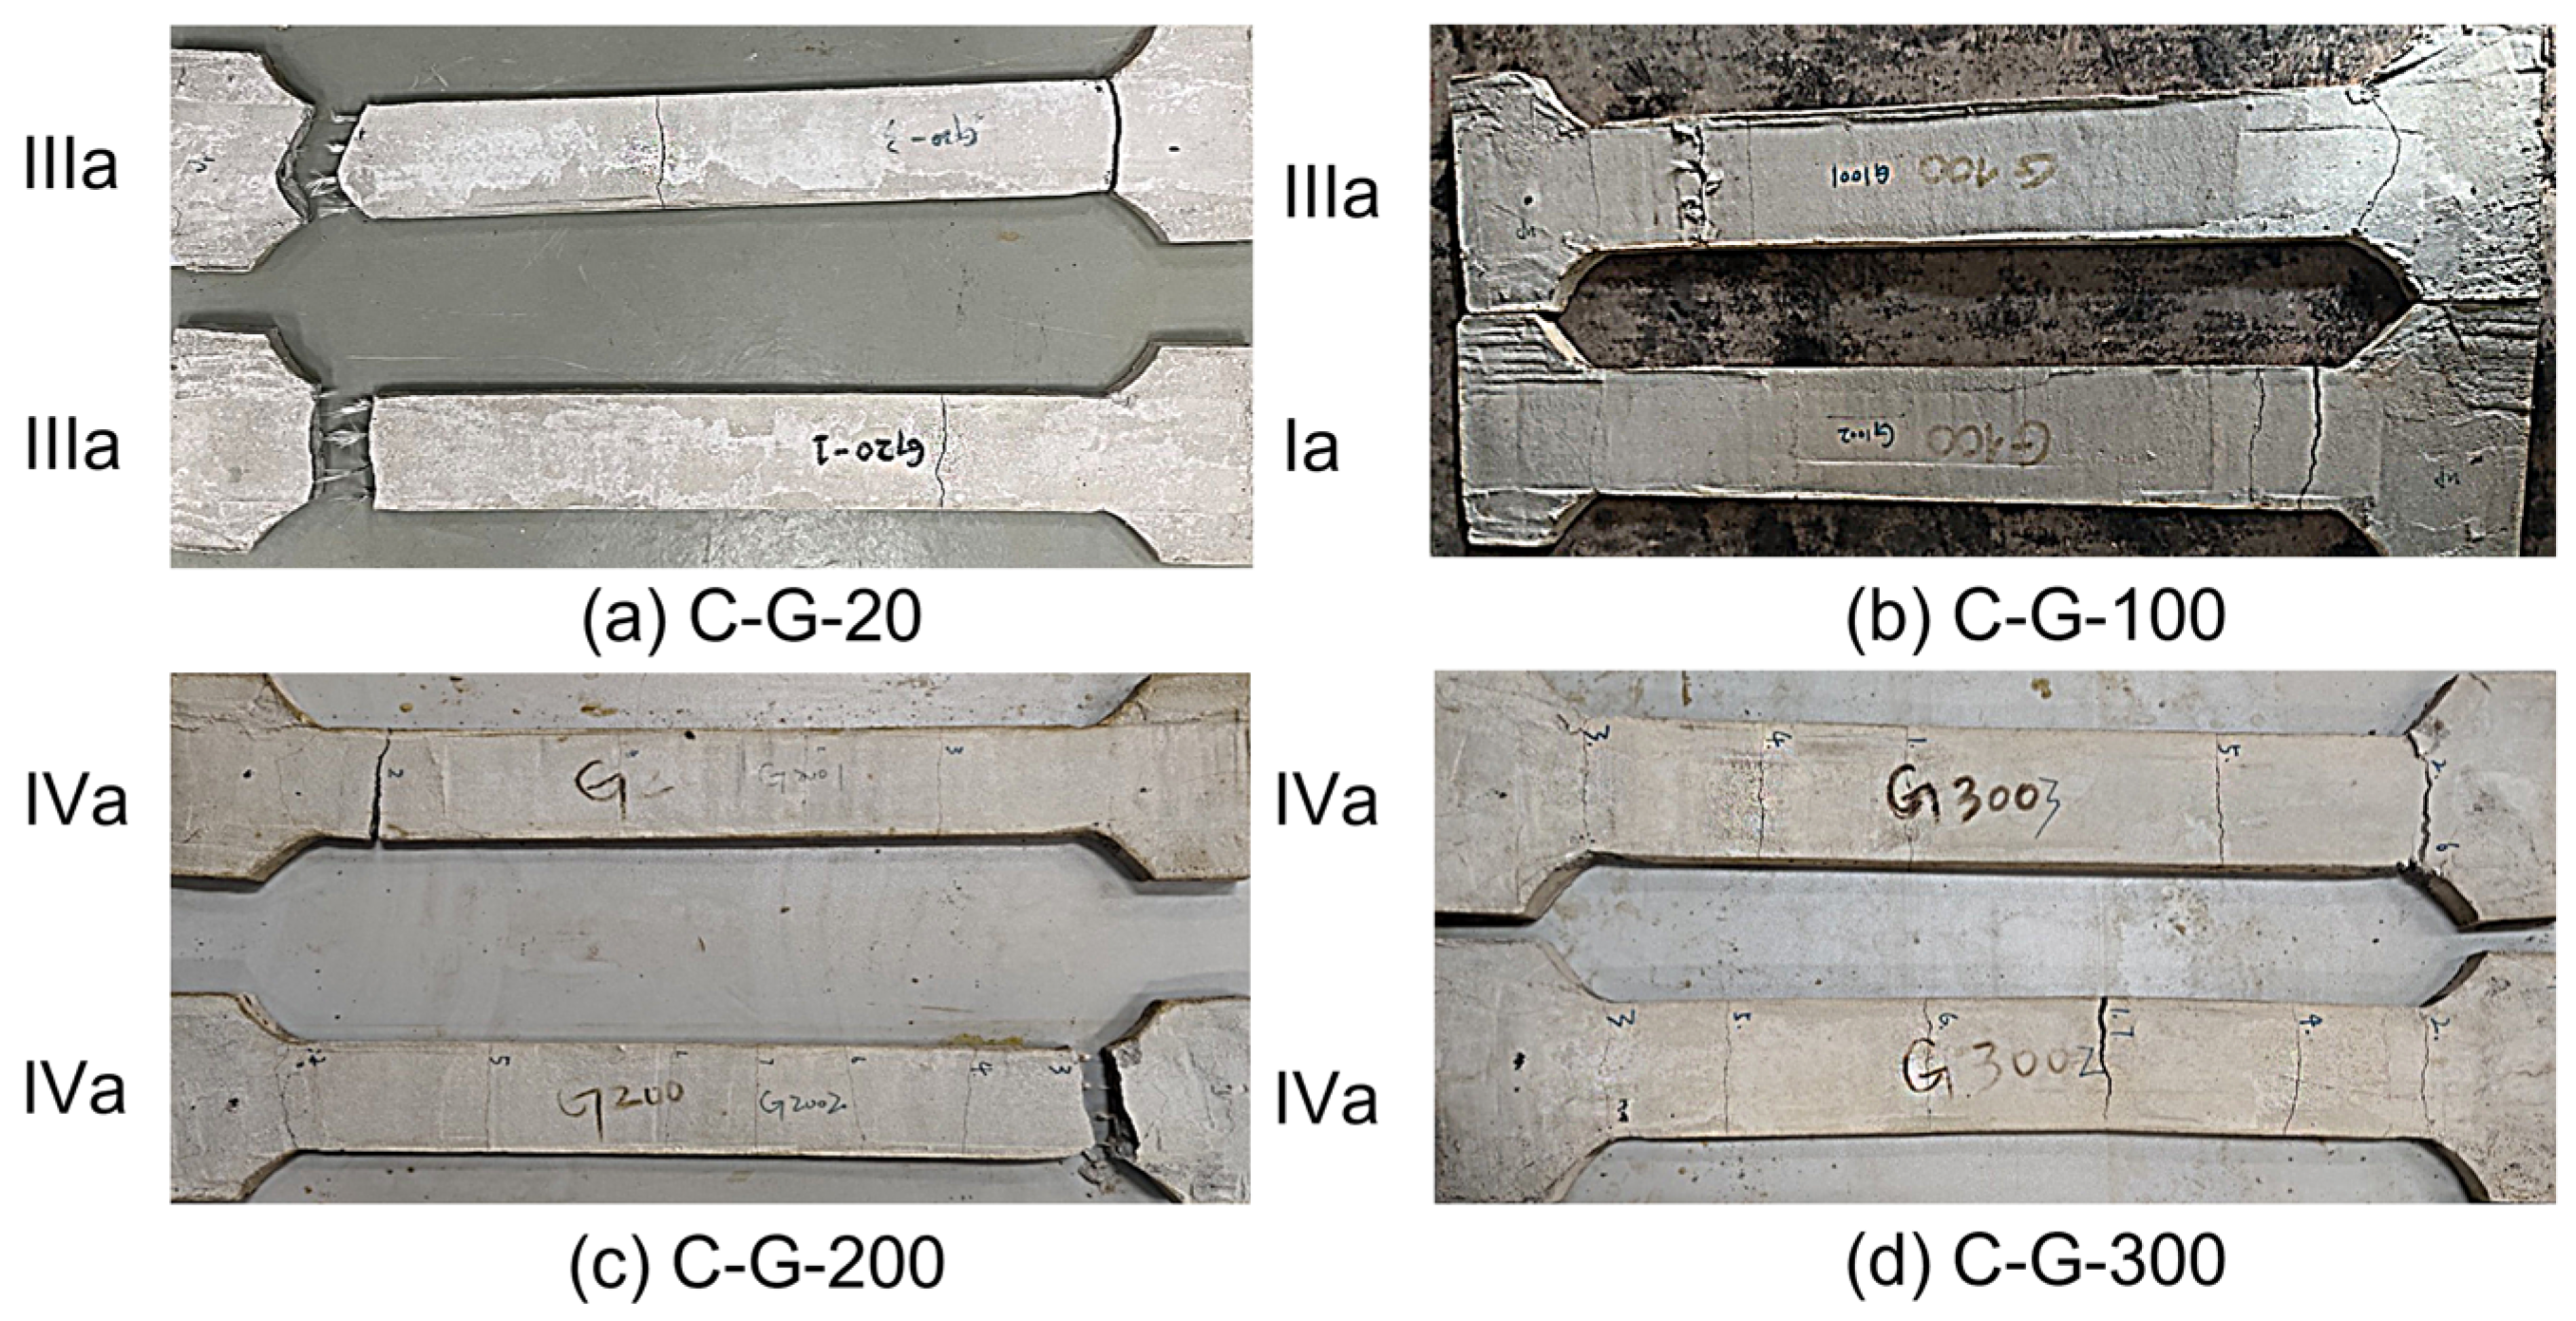
4.5.2. Modes of Failure

After exposure to various temperatures, none of the specimens showed any apparent color change or spalling. A post-test examination of the aluminum plates showed that the adhesive compound was not affected by temperatures up to 100 °C but was entirely burned at temperatures above that point, particularly at 300 °C. The failure mechanisms were divided into four major categories according to the location of the cracks—close to the grips, in the middle of the specimen, a combination of the previous two, and multiple cracking—types, I, II, III, and IV, respectively. Based on how the fibers performed at failure—rupture, slippage of the yarns within the matrix, and a combination of the two—they were further separated into three subcategories, a, b, and c (Table 6 includes detailed description of the modes of failure). The tensile results of coupons are shown in Table 7. The coupons reinforced with basalt fibers at 20 °C failed, exhibiting type Ib failure. One specimen suffered tensile failure of the yarns after cracking—type IIa (Figure 15a). The specimens exposed to 100 °C failed under type Iic mode (Figure 15b). At 200 °C, types Iva and Ivc were the prominent failure modes; all specimens developed secondary cracks in the middle, and one specimen suffered additional cracks at the grips (Figure 15c). At 300 °C, all specimens developed a large crack in the middle, while one had additional cracks at the grips; a sudden rupture of the fibers characterized the failure mode. The degradation of the stitches between the warp and the weft, together with changes in the internal structure of the fibers and the coating agent (implied by the color change), were considered responsible (Figure 15d). According to the evidence, the TRM coupons’ basalt fibers failed like the corresponding fabric yarns.
Up to 200 °C, the carbon fiber-reinforced coupons failed, exhibiting multiple cracks perpendicular to the axis of the specimen; the cracks followed the grid’s dimensions along the weft yarns. Fiber rupture characterized the failure of one coupon at 20 °C, whereas the others failed due to slippage or a combination of slippage and tensile failure. The failure mode was type IVa up to 200 °C, but at 300 °C, the loss of the coating material and the stitch bonding altered the failure mode to type IIIc (Figure 16d).
At 20 °C, the glass counterparts failed, exhibiting both IIIa and IIIb modes, whereas the specimens exposed to 100 °C failed due to Ia and IIIa types (Figure 17a,b). Instead, the 200 °C and 300 °C developed multiple cracks—both failed due to rupture of the glass filaments (Figure 17c,d). The grid behaved at the last stage precisely like the appropriate fabric braids during the tensile testing.
It is clear from the above description that the changes in the coating material and the mortar greatly impacted the failure patterns. More precisely, for all types of reinforcement, the failure modes changed from 100 °C onwards, observed by the SEM, XRD, and TGA, as well as in earlier experiments [14,23]. Furthermore, it was clear from the data above that the two different coating agents further distinguished the specimens’ responses. Further study is necessary, nevertheless, as these findings differ from those published in previous experimental campaigns (e.g., [24]). Additionally, at 300 °C, the changes in the microstructure of the glass fibers detected in the XRD were responsible for producing a low level of prestress caused by the contraction of the fibers [46]. The failure patterns agreed with those of Bernat-Maso et al. [60]. One interesting observation from the experiments was that most specimens exposed to 300 °C did not experience cracks around the grips, which could be explained by the mortar’s higher compressive strength at that temperature.

4.5.3. Stress, Deformability, and Precracked and Postcracking Behavior

The comparisons between the different temperatures and the different types of fibers were made based on seven parameters as follows: (a) the stress σ 1 , (b) the strain ε 1 , (c) the slope E 1 , (d) the stress σ u , € the strain ε u , (f) the slope E 2 , and (g) the stress σ 1 , m . For the calculation of stress σ 1 , the respective load was divided by the total area A n of the yarns included in each coupon— n was the number of yarns—while for σ 1 , m , the same load was divided by the coupon’s gross cross-sectional area. The strains ε 1 and ε u were determined using the average value of two external LVDTs mountain on the two sides of the coupons having a gauge length of 300 mm. The slope E 1 was calculated according to the method provided in Annex A of AC434 [30]. Similarly, the slope E 2 was calculated as the gradient of the line passing through the points ( ε 0.6 f u , 0.6 f u ) and ( ε 0.9 f u , 0.9 f u ), as was recommended in ACI 549.6R-20 [61]. Table 6, Table 7 and Table 8 present the stresses σ 1 , σ u , and σ 1 , m for each group of specimens and temperatures, whereas Table 8 contains the average values of ε 1 ,   ε u , E 1 , and E 2 . Figure 18 presents the values of σ 1 and σ u concerning temperature, while Figure 19 presents the normalized values of ε 1   E 1 and ε u   E 2 for all coupons and temperatures.
The mortar matrix dominated the precracking behavior of coupons. The cracking stress was usually around 1.9 MPa for all fibers and temperatures. At the same time, the values of the calculated mean tensile strength were nearly twice as high as those observed, showing that at this point the grids were not affecting the response. However, by going through the results obtained from the basalt and the carbon fibers, it was obvious that the values of the former were consistently higher than those of the latter up to 200 °C. That performance agreed with the results provided by D’Antino [59] regarding the relevant behavior of stitch-bonded yarns. At 300 °C, the deterioration of the stitches reversed that behavior. The improvement of mortar’s performance brought on by better curing conditions was connected with an increase in the first cracking stress up to 100 °C. At 200 °C, the carbon and basalt specimens exhibited an increase of σ 1 (or σ 1 , m ).
In contrast, the glass counterparts showed a substantial decrease (Figure 18a). Interestingly, although the decline of σ 1 (or σ 1 , m ) was prominent for carbon and basalt fiber coupons exposed to 300 °C, the glass fiber equivalents increased their strength by 31%. From the deformability point of view, all specimens lost their axial stiffness at 100 °C, whereas at 200 °C, the basalt and the glass fabric coupons became more brittle. On the contrary, the carbon counterparts increased their deformability almost linearly at the expense of their stiffness (Figure 19a,b). The improved cracking behavior of carbon and basalt coupons up to 200 °C was ascribed to initial stresses developed during the heating–cooling procedure, owing to the changes in the coating agent [23]; both share the same coating material. However, since the results from the literature are contradictory, e.g., in Colombo et al. [13], the first cracking stress increased at 200 °C, whereas in Rambo et al. [14], it decreased. Further research is needed using different types of mortar combined with different grids and fibers. The improved behavior of the glass coupons at 300 °C was attributed to the prestress effect due to fiber contraction (similar evolution in the cracking stress reported by Bernat-Maso et al. [60]).
In the postcracking stage, the tensile behavior was dominated by the interfacial properties between textiles and the matrix and the tensile properties of textiles. Figure 18b and Figure 19c,d present the development of the ultimate stress σ u and the normalized parameters ε u and E 2 , respectively. The ultimate stress σ u , increased for all specimens up to 100 °C. The coupons reinforced with basalt fibers lost a significant amount of their initial strength above that temperature, 10% and 34% at 200 °C and 300 °C, respectively. The strength of the carbon and glass coupons increased at 200 °C by 20.4% and 4.6%, respectively, but they had already begun to deteriorate (the strength was lower at 200 °C than at 100 °C by 13.9% and 14.5%, respectively). The carbon coupons and the basalt lost about half their initial strength at 300 °C. At the same temperature, the glass coupons gained 13.5% more strength.
Overall, there was a correlation between the ultimate stress, the kind of fiber, and the heating intensity. Moreover, in cases where there was a change in the failure mode from rupture of the fiber tensile to slippage within the matrix, the results show considerable difference, hence the increased variation. The increase in strength up to 100 °C was caused by an interlocking mechanism between the coating agent and the surrounding mortar; symptoms included a change in failure modes and increased number and pace of cracks. The increase in yarn strength and the better bonding conditions were responsible for the improved behavior of the carbon and glass specimens at 200 °C; strains imposed by the mortar’s shrinkage were another potential contributor to further investigation. The low fiber percentage, the deterioration of the coating agent (which was evident in the change in color of the fibers), and the deterioration of the stitches in the nodes of the grid have all been responsible for the different behavior the basalt fibers displayed, which resulted in the coupons losing 10% of their original strength. Contrary to carbon grids, the stitching region was weaker because the warp and weft directions were made of two smaller separated yarns. The increase that the glass fiber coupons demonstrated at 300 °C was consistent with the results obtained from the bare yarns at the same temperature. Combined with the different behavior of the SBR, it explained that difference in performance. However, additional investigation is needed for the overall behavior of the glass fabric grids.
Regarding the deformation characteristics, such as the maximum strain ε u and the slope E 2 , all of the specimens in the postcracked region followed the patterns of the corresponding bare yarns, demonstrating that the performance of the fibers had a substantial influence on the end stage. At 100 °C, a rise in E 2 coincided with an increase in strength. The basalt and glass specimens continued rising in E 2 at 200 °C, whereas the corresponding carbon specimens started to lose stiffness. At 300 °C, all specimens lost stiffness. However, the values of the glass fiber and basalt specimens remained higher than the initial values. The basalt and glass fibers generally maintained their inherent brittleness over 200 °C. When exposed to temperatures up to 300 °C, the carbon and glass fiber grids showed greater strength and resistance. The basalt fibers, in comparison, appeared suitable only up to 100 °C. The pseudohardening behavior and deformability trends appeared consistent with those reported in other experimental studies (e.g., [13,14,15,17]). Before such characteristics can be utilized in design applications, further data are required.

5. Conclusions

A series of tests were conducted on mortar specimens, fabric yarns, and TRM coupons after exposure to 100 °C, 200 °C, and 300 °C for eight hours. Given the specific experimental set-up (i.e., clevis-type grip, dumbbell shape specimens), the focus was to assess the residual tensile strength, the deformation behavior, and potential changes in the internal structure of the constituents. The conclusions drawn can be summarized as follows:
The polymer-modified mortar up to 100 °C retains its flexural strength due to the improved dispersion of the polymeric agent, but the compressive strength drops significantly. Above 100 °C, the increased porosity harms the flexural strength. The compressive strength at the same range of temperatures experiences a marginal increase due to the dehydration of C-S-H and the ettringite.
The behavior of the fiber yarns remains unaffected up to 100 °C. The changes in the coating agent increase the tensile strength up to 200 °C due to better impregnation of the individual filaments. The coating agent starts to deteriorate at around 270 °C, hence the significant decrease in tensile strength at 300 °C; between 200 °C and 300 °C, the tensile strength drops by 48.9%, 13.30%, and 6% for the basalt, carbon, and glass yarns, respectively.
The contribution of the polymer-modified mortar to the overall behavior of the TRMs is not significant.
At 300 °C, the cracking stress σ 1 (or σ 1 , m ), for the glass fabric coupons are increased due to a prestress effect attributed to fiber contraction.
At 100 °C, the coupons’ tensile strength and ultimate strain are increased due to better bonding conditions between the matrix and the grids.
At 200 °C, the carbon fiber coupons and the glass counterparts increase their original strength by 20.4% and 6%, respectively. At the same temperature, the basalt coupons lost 10% of the original strength and became less efficient.
At 300 °C, the basalt and the carbon coupons lost between 34% and 40% of their original strength, while the glass fiber coupons demonstrate an increase of 15% attributed to the coating material and the inherent behavior of glass.
From 200 °C onwards, the composite action gradually shows signs of deterioration due to the decay of the coating agent and the changes within the mortar.
The exposure to different temperatures alters the crack pattern of the different groups of coupons at failure. Moreover, at 300 °C, all types of specimens failed due to slippage of the fibers from the matrix.
In general, carbon and glass fibers are more resilient when exposed to a heated environment.
The grids’ architecture plays a significant role in overall performance, since the stitched-bond type deteriorates faster than the thermofixed type, affecting the bond between the mortar and the grid.
Future experimental projects are needed to investigate the interaction between different matrices, coating agents, and fiber grids—especially the ‘interlocking mechanism’ between the coated fibers and the surrounding mortars. Another aspect that needs additional examination is the prestress effect introduced by the glass fiber contraction.

Author Contributions

P.Y. and T.K. were responsible for the methodology, data curation, formal analysis, and writing of draft, review, and editing. Moreover, T.K. also administrated and supervised this project. All authors have read and agreed to the published version of the manuscript.

Funding

This research received no external funding.

Data Availability Statement

All data, models, and code generated or used during the study appear in the submitted article.

Acknowledgments

The experimental program was funded partially from the SURF Project and the RDF 16-02-30 from Xi’an Jiatong Liverpool University.

Conflicts of Interest

The authors declare no conflict of interest.

Nomenclature

The following symbols are used in this paper:
A n cross-sectional area of the yarns
n number of yarns
E 1 elastic modulus of specimen in uncracked phase
E 2 elastic modulus of TRM specimen in postcracked phase
f c , m compressive strength of mortar prisms
f c t m mean tensile strength of mortar prisms
f u , m flexural strength of mortar prisms
T o extrapolated onset temperature
σ 1 tensile stress of the TRM specimen at the first cracking point
σ 1 , m tensile cracking stress of the TRM matrix
σ u ultimate tensile strength of TRM specimen
ε 1 strain value of TRM specimen at the first cracking point
ε u strain value of TRM specimen at the ultimate tensile stress

Appendix A

The TGA analysis curves for the mortar and the three different fiber grids up to 1300 °C are presented in Figure A1 and Figure A2, respectively. The first point of interest is the onset temperature, which according to ASTM E2550 [62], is the ‘point in the TGA curve where a deflection is first observed from the established baseline prior to the thermal event.’ The temperature at which the weight loss begins is the extrapolated onset temperature. According to CSN EN ISO 11358-1 [63], the specific temperature can be defined as the point of intersection between the horizontal line that passes through the initial mass baseline before heating and the tangent to the mass TGA curve passing through the point of the maximum gradient. For the identification of the mass loss steps, the first derivative of the TG curve is used; the corresponding temperature is called the inflation point. The differential thermal analysis (DTA) curve gives information on potential transformations like glass transition temperatures or melting. The extrapolated onset temperature for the mortar was 80 °C, and the first mass loss step occurred at 125 °C; the second step occurred above 300 °C and therefore was out of the range of the present study. The respective extrapolated onset values for the basalt, carbon, and glass fibers were 275 °C and 365 °C, while the inflation points were 360 °C and 400 °C.
Figure A1. TGA analysis for the mortar (up to 1300 °C).
Buildings 13 01900 g0a1
Figure A2. TGA analysis for the (a) basalt, (b) carbon, and (c) glass fibers (up to 1300 °C).
Buildings 13 01900 g0a2

References

  1. Shenghu, C.; Zhis, W.U.; Xin, W. Tensile Properties of CFRP and Hybrid FRP Composites at Elevated Temperatures. J. Compos. Mater. 2009, 43, 315–330. [Google Scholar] [CrossRef]
  2. Kim, M.T.; Rhee, K.Y.; Lee, B.H.; Kim, C.J. Effect of carbon nanotube addition on the wear behavior of basalt/epoxy woven composites. J. Nanosci. Nanotechnol. 2013, 13, 5631–5635. [Google Scholar] [CrossRef]
  3. Çavdar, A. The effects of high temperature on mechanical properties of cementitious composites reinforced with polymeric fibers. Compos. Part B Eng. 2013, 45, 78–88. [Google Scholar] [CrossRef]
  4. Asadi, A.; Baaij, F.; Mainka, H.; Rademacher, M.; Thompson, J.Y.; Kalaitzidou, K. Basalt fibers as a sustainable and cost-effective alternative to glass fibers in sheet molding compound (SMC). Compos. Part B Eng. 2017, 123, 210–218. [Google Scholar] [CrossRef]
  5. Ahmed, A.; Zillur Rahman, M.; Ou, Y.; Liu, S.; Mobasher, B.; Guo, S.; Zhu, D. A review on the tensile behavior of fiber-reinforced polymer composites under varying strain rates and temperatures. Constr. Build. Mater. 2021, 294, 123565. [Google Scholar] [CrossRef]
  6. Signorini, C.; Sola, A.; Nobili, A.; Siligardi, C. Lime-cement textile reinforced mortar (TRM) with modified interphase. J. Appl. Biomater. Funct. Mater. 2019, 17, 22808000019827823. [Google Scholar] [CrossRef] [PubMed] [Green Version]
  7. Bompadre, F.; Donnini, J. Surface Modification of Glass Textile for the Reinforcement of a Cement-Based Composite: A Review. Appl. Sci. 2021, 11, 2028. [Google Scholar] [CrossRef]
  8. Bisby, L.; Stratford, T.; Smith, J.; Halpin, S. Comparative performance of Fibre Reinforced Polymer and Fibre Reinforced Cementitious Mortar Strengthening Systems in Elevated Temperature Service Environments. In Structural Faults and Repair 2010; Engineering Technics Press: Scotland, UK, 2010. [Google Scholar]
  9. Ehlig, D.; Hothan, S. Reinforced Concrete Slabs Strengthened with Textile Reinforced Concrete Subjected to Fire. In Proceedings of the 2nd International RILEM Workshop on Concrete Spalling Due to Fire Exposure, Delft, The Netherlands, 5–7 October 2011. [Google Scholar]
  10. Papakonstantinou, C.G.; Balaguru, P.; Lyon, R.E. Comparative study of high temperature composites. Compos. Part B Eng. 2001, 32, 637–649. [Google Scholar] [CrossRef]
  11. Kapsalis, P.; Tysmans, T.; Van Hemelrijck, D.; Triantafillou, T.C. State-of-the-Art Review on Experimental Investigations of Textile-Reinforced Concrete Exposed to High Temperatures. J. Compos. Sci. 2021, 5, 290. [Google Scholar] [CrossRef]
  12. Al-Lami, K.; D’Antino, T.; Colombi, P. Durability of Fabric-Reinforced Cementitious Matrix (FRCM) Composites: A Review. Appl. Sci. 2020, 10, 1714. [Google Scholar] [CrossRef] [Green Version]
  13. Colombo, I.; Colombo, M.; Magri, A.; Zani, G.; di Prisco, M. Textile Reinforced Mortar at High Temperatures. Appl. Mech. Mater. 2011, 82, 202–207. [Google Scholar] [CrossRef]
  14. Rambo, D.A.S.; de Andrade Silva, F.; Toledo Filho, R.D.; da Fonseca Martins Gomes, O. Effect of elevated temperatures on the mechanical behavior of basalt textile reinforced refractory concrete. Mater. Des. (1980–2015) 2015, 65, 24–33. [Google Scholar] [CrossRef]
  15. Strauss Rambo, D.A.; de Andrade Silva, F.; Toledo Filho, R.D.; Ukrainczyk, N.; Koenders, E. Tensile strength of a calcium-aluminate cementitious composite reinforced with basalt textile in a high-temperature environment. Cem. Concr. Compos. 2016, 70, 183–193. [Google Scholar] [CrossRef]
  16. Donnini, J.; Basalo, F.D.C.y.; Corinaldesi, V.; Lancioni, G.; Nanni, A. Fabric-reinforced cementitious matrix behavior at high-temperature: Experimental and numerical results. Compos. Part B-Eng. 2017, 108, 108–121. [Google Scholar] [CrossRef] [Green Version]
  17. Tlaiji, T.; Vu, X.H.; Ferrier, E.; Larbi, A.S. Thermomechanical behaviour and residual properties of textile reinforced concrete (TRC) subjected to elevated and high temperature loading: Experimental and comparative study. Compos. Part B Eng. 2018, 144, 99–110. [Google Scholar] [CrossRef]
  18. Messori, M.; Nobili, A.; Signorini, C.; Sola, A. Effect of high temperature exposure on epoxy-coated glass textile reinforced mortar (GTRM) composites. Constr. Build. Mater. 2019, 212, 765–774. [Google Scholar] [CrossRef] [Green Version]
  19. Truong, G.T.; Park, S.-H.; Choi, K.-K. Tensile Behaviors of Lap-Spliced Carbon Fiber-Textile Reinforced Mortar Composites Exposed to High Temperature. Materials 2019, 12, 1512. [Google Scholar] [CrossRef] [Green Version]
  20. Estevan, L.; Varona, F.B.; Baeza, F.J.; Torres, B.; Bru, D. Textile Reinforced Mortars (TRM) tensile behavior after high temperature exposure. Constr. Build. Mater. 2022, 328, 127116. [Google Scholar] [CrossRef]
  21. Ombres, L.; Mazzuca, P.; Verre, S. Effects of Thermal Conditioning at High Temperatures on the Response of Concrete Elements Confined with a PBO-FRCM Composite System. J. Mater. Civ. Eng. 2022, 34, 04021413. [Google Scholar] [CrossRef]
  22. Calabrese, A.S.; D’Antino, T.; Colombi, P.; Poggi, C. Long-Term Behavior of PBO FRCM and Comparison with Other Inorganic-Matrix Composites. Materials 2022, 15, 3281. [Google Scholar] [CrossRef]
  23. Silva, F.d.A.; Butler, M.; Hempel, S.; Filho, R.D.T.; Mechtcherine, V. Effects of elevated temperatures on the interface properties of carbon textile-reinforced concrete. Cem. Concr. Compos. 2014, 48, 26–34. [Google Scholar] [CrossRef]
  24. Liu, S.; Rawat, P.; Chen, Z.; Guo, S.; Shi, C.; Zhu, D. Pullout behaviors of single yarn and textile in cement matrix at elevated temperatures with varying loading speeds. Compos. Part B Eng. 2020, 199, 108251. [Google Scholar] [CrossRef]
  25. Xu, S.; Shen, L.; Wang, J. The high-temperature resistance performance of TRC thin-plates with different cementitious materials: Experimental study. Constr. Build. Mater. 2016, 115, 506–519. [Google Scholar] [CrossRef]
  26. Xu, P.; Cui, Y.; Dai, J.; Zhang, M.; Ding, Y. High-Temperature Deterioration Mechanism of Textile-Reinforced Concrete with Different Cementitious Materials. J. Mater. Civ. Eng. 2022, 34, 04021388. [Google Scholar] [CrossRef]
  27. Rambo, D.A.S.; Yao, Y.; de Andrade Silva, F.; Toledo Filho, R.D.; Mobasher, B. Experimental investigation and modelling of the temperature effects on the tensile behavior of textile reinforced refractory concretes. Cem. Concr. Compos. 2017, 75, 51–61. [Google Scholar] [CrossRef]
  28. EN1015-11:2019; Methods of Test for Mortar for Masonry—Part 11: Determination of Flexural and Compressive Strength of Hardened Mortar. CEN: Brussels, Belgium, 2019.
  29. De Santis, S.; Carozzi, F.G.; de Felice, G.; Poggi, C. Test methods for Textile Reinforced Mortar systems. Compos. Part B Eng. 2017, 127, 121–132. [Google Scholar] [CrossRef]
  30. Ekenel, M.; Nanni, A.; De Caso y Basalo, F. Acceptance Criteria for Concrete and Masonry Strengthening Using Fabric-Reinforced Cementitious Matrix (FRCM) and Steel Reinforced Grout (SRG) Composites. ACI Spec. Publ. 2018, 352, 4. [Google Scholar]
  31. Molter, M. Zum Tragverhalten von textilbewehrtem Beton; Lehrstuhl und Inst. für Massivbau [u.a.]: Aachen, Germany, 2005. [Google Scholar]
  32. Aattache, A.; Mahi, A.; Soltani, R.; Mouli, M.; Benosman, A.S. Experimental study on thermo-mechanical properties of Polymer Modified Mortar. Mater. Des. (1980–2015) 2013, 52, 459–469. [Google Scholar] [CrossRef]
  33. D’Antino, T.; Papanicolaou, C. Comparison between different tensile test set-ups for the mechanical characterization of inorganic-matrix composites. Constr. Build. Mater. 2018, 171, 140–151. [Google Scholar] [CrossRef]
  34. Focacci, F.; D’Antino, T.; Carloni, C. The role of the fiber–matrix interfacial properties on the tensile behavior of FRCM coupons. Constr. Build. Mater. 2020, 265, 120263. [Google Scholar] [CrossRef]
  35. Focacci, F.; D’Antino, T.; Carloni, C. Tensile Testing of FRCM Coupons for Material Characterization: Discussion of Critical Aspects. J. Compos. Constr. 2022, 26, 04022039. [Google Scholar] [CrossRef]
  36. FIB. Fib Model Code for Concrete Structures 2010; Fédération Internationale du Béton Wilhelm Ernst & Sohn, Verlag für Architektur und Technische Wissenschaften GmbH & Co. KG: Berlin, Germany, 2013. [Google Scholar]
  37. Taylor, H.F.W.; Famy, C.; Scrivener, K.L. Delayed ettringite formation. Cem. Concr. Res. 2001, 31, 683–693. [Google Scholar] [CrossRef]
  38. Zhou, Q.; Glasser, F.P. Thermal Stability and Decomposition Mechanisms of Ettringite at <120 °C. Cem. Concr. Res. 2001, 31, 1333–1339. [Google Scholar] [CrossRef]
  39. Jeong, Y.; Hargis, C.W.; Kang, H.; Chun, S.C.; Moon, J. The Effect of Elevated Curing Temperatures on High Ye′elimite Calcium Sulfoaluminate Cement Mortars. Materials 2019, 12, 1072. [Google Scholar] [CrossRef] [Green Version]
  40. Khoury, G.A. Compressive strength of concrete at high temperatures: A reassessment. Mag. Concr. Res. 1992, 44, 291–309. [Google Scholar] [CrossRef]
  41. Hachemi, S.; Ounis, A. Effet de la température sur les propriétés mécaniques du béton ordinaire et de haute performance. In Proceedings of the Séminaire International sur le Bâtiment Intelligent au Cœur du Développement Durable (BATIDEV 2013), Oran, Algeria, 30 April 2013. [Google Scholar]
  42. Kim, H.; Park, J.; Suh, H.; Cho, B.; Park, W.-J.; Bae, S. Mechanical Degradation and Thermal Decomposition of Ethylene-Vinyl Acetate (EVA) Polymer-Modified Cement Mortar (PCM) Exposed to High-Temperature. Sustainability 2019, 11, 500. [Google Scholar] [CrossRef] [Green Version]
  43. ASTM D2256-02; Standard Test Method for Tensile Properties of Yarns by the Single-Strand Method. ASTM: West Conshohocken, PA, USA, 2010.
  44. Gao, Y.; Jia, C.; Meng, L.; Li, X. Heat resistance study of basalt fiber material via mechanical tests. IOP Conf. Ser. Mater. Sci. Eng. 2017, 283, 012016. [Google Scholar] [CrossRef]
  45. Stockhorst, H.; Brückner, R. Structure sensitive measurements on phosphate glass fibers. J. Non. Cryst. Solids 1986, 85, 105–126. [Google Scholar] [CrossRef]
  46. Jenkins, P.G. Understanding physical changes and strength loss of E-glass fibres following exposure to elevated temperatures. Mater. Sci. Technol. 2017, 33, 255–264. [Google Scholar] [CrossRef] [Green Version]
  47. Murugan, S.; Rai, S.K.; Kumar, P.V.; Jayakumar, T.; Raj, B.; Bose, M.S.C. Temperature distribution and residual stresses due to multipass welding in type 304 stainless steel and low carbon steel weld pads. Int. J. Press. Vessel. Pip. 2001, 78, 307–317. [Google Scholar] [CrossRef]
  48. Kapsalis, P.; Triantafillou, T.; Korda, E.; Van Hemelrijck, D.; Tysmans, T. Tensile Performance of Textile-Reinforced Concrete after Fire Exposure: Experimental Investigation and Analytical Approach. J. Compos. Constr. 2022, 26, 04021067. [Google Scholar] [CrossRef]
  49. Mahieux, C.A.; Reifsnider, K.L. Property modeling across transition temperatures in polymers: Application to thermoplastic systems. J. Mater. Sci. 2002, 37, 911–920. [Google Scholar] [CrossRef]
  50. Kockritz, U.O.P.; Jesse, F.; Curbach, M. Influence of textile manufacturing technology on load bearing behavior of textile reinforced concrete. In Proceedings of the 13th International Techtextil-Symposium 2005, Frankfurt, Germany, 6–9 June 2005. [Google Scholar]
  51. Boutenel, F.; Dusserre, G.; Cutard, T. Strength Loss of Basalt-Based Mineral Fibers after Thermal Desizing. Rev. Des Compos. Et Des Matériaux Avancés 2020, 30, 115–122. [Google Scholar] [CrossRef]
  52. Sarasini, F.; Tirillò, J.; Seghini, M.C. Influence of thermal conditioning on tensile behaviour of single basalt fibres. Compos. Part B Eng. 2018, 132, 77–86. [Google Scholar] [CrossRef]
  53. Kim, H.-J.; Park, W.-J. Combustion and Mechanical Properties of Polymer-Modified Cement Mortar at High Temperature. Adv. Mater. Sci. Eng. 2017, 2017, 5853687. [Google Scholar] [CrossRef] [Green Version]
  54. Overkamp, T.; Mahltig, B.; Kyosev, Y. Strength of basalt fibers influenced by thermal and chemical treatments. J. Ind. Text. 2018, 47, 815–833. [Google Scholar] [CrossRef]
  55. Feih, S.; Manatpon, K.; Mathys, Z.; Gibson, A.G.; Mouritz, A.P. Strength degradation of glass fibers at high temperatures. J. Mater. Sci. 2009, 44, 392–400. [Google Scholar] [CrossRef]
  56. Feih, S.; Boiocchi, E.; Kandare, E.; Mathys, Z.; Gibson, A.G.; Mouritz, A.P. Strength Degradation of Glass and Carbon Fibres at High Temperature. 2009. Available online: https://iccm-central.org/Proceedings/ICCM17proceedings/Themes/Behaviour/COMPOSITES%20IN%20FIRE/F4.6%20Feih.pdf (accessed on 11 June 2023).
  57. Bianchi, G.; Arboleda, D.; Carozzi, F.G.; Poggi, C.; and Nanni, A. Fabric Reinforced Cementitious Matrix (FRCM) Materials For Structural Rehabilitation. In Proceedings of the IAHS 2013: 39th World Congress on Housing Science, Milan, Italy, 17–20 September 2013. [Google Scholar]
  58. Arboleda, D.; Carozzi, F.G.; Nanni, A.; Poggi, C. Testing Procedures for the Uniaxial Tensile Characterization of Fabric-Reinforced Cementitious Matrix Composites. J. Compos. Constr. 2016, 20, 04015063. [Google Scholar] [CrossRef]
  59. D′Antino, T.; Papanicolaou, C. Mechanical characterization of textile reinforced inorganic-matrix composites. Compos. Part B Eng. 2017, 127, 78–91. [Google Scholar] [CrossRef]
  60. Bernat-Maso, E.; Gil, L.; Mercedes, L.; Escrig, C. Mechanical properties of pre-stressed fabric-reinforced cementitious matrix composite (PFRCM). Constr. Build. Mater. 2018, 191, 228–241. [Google Scholar] [CrossRef]
  61. ACI 549.3R-20; Guide to Design and Construction of Externally Bonded Fabric-Reinforced Cementitious Matrix (FRCM) and Steel-Reinforced Grout (SRG) Systems for Repair and Strengthening Masonry Structures. ACI: Geneva, Switzerland, 2020.
  62. ASTM E2550-21; Standard Test Method for Thermal Stability by Thermogravimetry. ASTM: West Conshohocken, PA, USA, 2021.
  63. CSN EN ISO 11358-1:2022; Plastics-Thermogravimetry (TG) of Polymers—Part 1: General Principles. CEN: Brussels, Belgium, 2022.
Figure 1. (a) Basalt, (b) carbon, and (c) glass fabric textile materials.
Buildings 13 01900 g001
Figure 2. (a) Coupon specimen dimensions, (b) coupon casting details, and test set-up for (c) coupon and (d) yarn specimens.
Buildings 13 01900 g002
Figure 3. Test set-up for tempering: (a) electric furnace, (b) position of the coupons, and (c) thermal ramp.
Buildings 13 01900 g003
Figure 4. XRD analysis on mortar samples preheated to different target temperatures.
Buildings 13 01900 g004
Figure 5. TGA results of mortar samples.
Buildings 13 01900 g005
Figure 6. SEM pictures for mortar at (a) 20 °C, (b) 100 °C, (c) 200 °C, and (d) 300 °C.
Buildings 13 01900 g006
Figure 7. Stress–strain relationship of (a) basalt, (b) carbon, and (c) glass fiber yarns.
Buildings 13 01900 g007
Figure 8. Failure modes of basalt fabric yarns at (a) 20 °C, (b) 100 °C, (c) 200 °C, and (d) 300 °C.
Buildings 13 01900 g008
Figure 9. Failure modes of carbon fabric yarns at (a) 20 °C, (b) 100 °C, (c) 200 °C, and (d) 300 °C.
Buildings 13 01900 g009
Figure 10. Failure modes of glass fabric yarns at (a) 20 °C, (b) 100 °C, (c) 200 °C, and (d) 300 °C.
Buildings 13 01900 g010
Figure 11. XRD curves for (a) basalt fibers, (b) carbon fibers, and (c) glass fibers.
Buildings 13 01900 g011
Figure 12. SEM analysis for (ad) basalt, (eh) carbon, and (il) glass fibers preheated to different target temperatures.
Buildings 13 01900 g012
Figure 13. TGA results of (a) basalt, (b) carbon, and (c) glass fibers.
Buildings 13 01900 g013
Figure 14. Stress–strain relationship of (a) basalt, (b) carbon, and (c) glass fabric coupons.
Buildings 13 01900 g014
Figure 15. Failure modes of basalt coupons at (a) 20 °C, (b) 100 °C, (c) 200 °C, and (d) 300 °C.
Buildings 13 01900 g015
Figure 16. Failure modes of carbon coupons at (a) 20 °C, (b) 100 °C, (c) 200 °C, and (d) 300 °C.
Buildings 13 01900 g016
Figure 17. Failure modes of glass coupons at (a) 20 °C, (b) 100 °C, (c) 200 °C, and (d) 300 °C.
Buildings 13 01900 g017
Figure 18. Tendency of (a) cracking stress σ 1 and (b) ultimate stress σ u after preheated to different temperatures.
Buildings 13 01900 g018
Figure 19. Normalized (a) ε 1 and (b) E 1 and (c) ε u and (d) E 2 values for all types of fibers and temperatures.
Buildings 13 01900 g019
Table 1. Mechanical Characteristics and dimensions of three kinds of fabric textiles.
Fabric TextileBasalt Fabric TextileCarbon Fabric TextileGlass Fabric Textile
Area density ( gr / m 2 ) 220/170 *270/220360/280
Yarn area ( mm 2 ) 0.811.611.015
Nominal thickness (mm)0.0320.0540.011
Number of yarns per coupon324
Coating materialHigh-temperature resistive coatingHigh-temperature resistive coatingSBR coating
Note: * refers to ‘coated/dry fiber’.
Table 2. Mechanical properties of the mortar in ambient temperature and after exposure to elevated temperatures.
20 °C100 °C200 °C300 °C
Flexural strength, f u , m (MPa)7.5 (0.016)7.6 (0.065)7.1 (0.140)5.0 (0.015)
Mean tensile strength f c t m (MPa)3.02.02.22.4
Compressive strength, f c , m (MPa)34.2 (0.045)20.3 (0.070)21.4 (0.140)22.7 (0.090)
Table 3. Integrated Peak Intensity of the various constituents in different temperatures.
ComponentsIntegrated Peak Intensity (in Counts)
2 θ   ( deg . ) 20 °C100 °C200 °C300 °C
Portlandite18571513688
Quartz2619,47817,02220,95525,099
Calcite2921,18715,27914,56615,328
Ettringite503018410217192836
C-S-H473618429042613366
Table 4. Ultimate tensile stress of the fabric yarns for different preheating temperatures.
Group of SpecimensY-B-20Y-B-100Y-B-200Y-B-300
Tensile strength (MPa)1983.1 (0.2) *2718.5 (0.16)2591.4 (0.02)1325.3 (0.04)
Ultimate strain0.0239 (0.17)0.0332 (0.14)0.0273 (0.07)0.0132 (0.05)
Elastic modulus (GPa)87.9 (0.01)95.7 (0.02)101.2 (0.04)109.8(0.01)
Y-C-20Y-C-100Y-C-200Y-C-300
Tensile strength (MPa)1317.1 (0.09)1260.8 (0.05)1411.1 (0.03)1222.9 (0.02)
Ultimate strain 0.0067 (0.05)0.0062 (0.03)0.0074 (0.01)0.0061 (0.04)
Elastic modulus (GPa)204.6 (0.03)215.7 (0.02)217.6 (0.03)220.0 (0.03)
Y-G-20Y-G-100Y-G-200Y-G-300
Tensile strength (MPa)996.9 (0.06)1019.6 (0.06)1067.1 (0.07)1037.3 (0.05)
Ultimate strain 0.0208 (0.13)0.0178 (0.07)0.0180 (0.12)0.0159 (0.07)
Elastic modulus (GPa)57.9 (0.06)65.9 (0.01)65.4 (0.05)69.6 (0.01)
Note: * refers to the coefficient of variation value.
Table 5. Full Width of the peaks at Half Maximum height (FWHM).
Types of FibersFWHM
20 °C100 °C200 °C300 °C
Basalt10.517.69.067.06
Carbon2.643.632.602.56
Glass9.37.758.767.33
Table 6. Description of the failure mode of coupons.
Cracking ConditionFibers’ Performance
IClose to the gripsaRupture
IIIn the middle of the specimenbSlippage of the yarns within the matrix
IIIA combination of I and IIcCombination of the a and b
IVMultiple cracking
Table 7. Results of the basalt, carbon, and glass textile-reinforced coupons’ tensile test for all temperatures.
Specimen Type σ 1   ( MPa ) σ u   ( MPa ) σ 1 , m   ( MPa ) Failure ModeSpecimen Type σ 1   ( MPa ) σ u   ( MPa ) σ 1 , m   ( MPa ) Failure Mode
C-B-201135.8411.30.39IIaC-C-201317.9963.01.43IVa
C-B-202785.9 *785.92.24IbC-C-202444.3527.22.00IVc
C-B-203607.1 *607.11.73IbC-C-203296.1539.51.33IVb
Average509.6601.21.46 Average352.8676.51.6
CoV0.530.250.53 CoV0.180.300.18
C-B-1001257.3545.40.86IIcC-C-1001115.0796.30.52IVa
C-B-1002364.9897.51.22IIcC-C-1002244.61047.81.10IVa
C-B-1003--- C-C-1003346.6993.51.56IVa
Average311.1721.51.04 Average235.4945.91.06
CoV0.170.240.17 CoV0.400.110.40
C-B-2001499.2 *499.21.66IVaC-C-2001210.3764.20.95IVa
C-B-2002306.8623.31.02IVcC-C-2002244.4643.21.10IVa
C-B-2003300.9512.11.00IVaC-C-2003419.41036.71.89IVa
Average368.9540.71.23 Average291.4814.71.31
CoV0.250.110.25 CoV0.310.200.31
C-B-3001306.5537.51.02ΙΙaC-C-3001244.6478.71.10IIIc
C-B-3002254.5 *254.20.85IIaC-C-3002389.8387.71.75IIIc
C-B-3003137.8399.00.46IIIaC-C-3003180.6364.50.81IIIc
Average232.9396.90.78 Average271.7410.51.22
CoV0.300.290.30 CoV0.320.120.32
Specimen Type σ 1  (MPa) σ u  (MPa) σ 1 , m  (MPa)Failure modeSpecimen Type σ 1  (MPa) σ u  (MPa) σ 1 , m  (MPa)Failure mode
C-G-201191.2681.80.78IIIaC-G-2001140.1749.70.57IVa
C-G-202276.5737.81.13IIIbC-G-2002258.3112.91.06IVa
C-G-203255.2770.71.04IIIaC-G-2003144.6433.5 *0.59IVa
Average240.9730.10.98 Average181.0765.40.74
CoV0.150.050.15 CoV0.300.360.31
C-G-1001257.4901.11.05IIIaC-G-3001260.8785.31.07IVa
C-G-1002224.0880.60.92IaC-G-3002333.4768.31.36IVc
C-G-1003253.0902.61.04IIIaC-G-3003353.5940.01.45IVa
Average244.8895.11.00 Average315.9831.21.29
CoV0.060.010.06 CoV0.130.090.13
Note: * the maximum value coincides with the cracking stress.
Table 8. Averaged value of ε 1 , ε u , E 1 , and E 2 of coupons for all temperatures.
Type of Specimens ε 1 ε u E 1   ( GPa ) E 2   ( GPa )
C-B-200.0037 (0.58) *0.0115 (0.29)180.19 (0.26)35.5 (0.47)
C-B-1000.0072 (0.36)0.0204 (0.24)95.05 (0.22)38.4 (0.07)
C-B-2000.0028 (0.32)0.0112 (0.32)217.12 (0.25)96.4 (0.61)
C-B-3000.0028 (0.18)0.0102 (0.54)155.90 (0.39)55.5 (0.38)
C-C-200.0024 (0.51)0.0244 (0.41)214.40 (0.25)14.4 (0.49)
C-C-1000.0057 (0.71)0.0371 (0.07)139.9 (0.21)28.0 (0.21)
C-C-2000.0063 (0.36)0.0306 (0.14)90.6 (0.35)21.2 (0.42)
C-C-3000.0083 (0.50)0.0190 (0.23)97.1 (0.44)12.8 (0.08)
C-G-200.0059 (0.34)0.0296 (0.30)73.0 (0.38)19.8 (0.39)
C-G-1000.0071 (0.18)0.0331 (0.09)67.4 (0.22)20.5 (0.19)
C-G-2000.0033 (0.39)0.0212 (0.46)69.9 (0.25)41.2 (0.28)
C-G-3000.0052 (0.25)0.0279 (0.03)68.9 (0.23)26.9 (0.17)
Note: * refers to the coefficient of variation value.
Disclaimer/Publisher’s Note: The statements, opinions and data contained in all publications are solely those of the individual author(s) and contributor(s) and not of MDPI and/or the editor(s). MDPI and/or the editor(s) disclaim responsibility for any injury to people or property resulting from any ideas, methods, instructions or products referred to in the content.

