
Effects of Superplasticizer and Water–Binder Ratio on Mechanical Properties of One-Part Alkali-Activated Geopolymer Concrete
 ,
,
Abstract
:
1. Introduction
2. Experimental Program
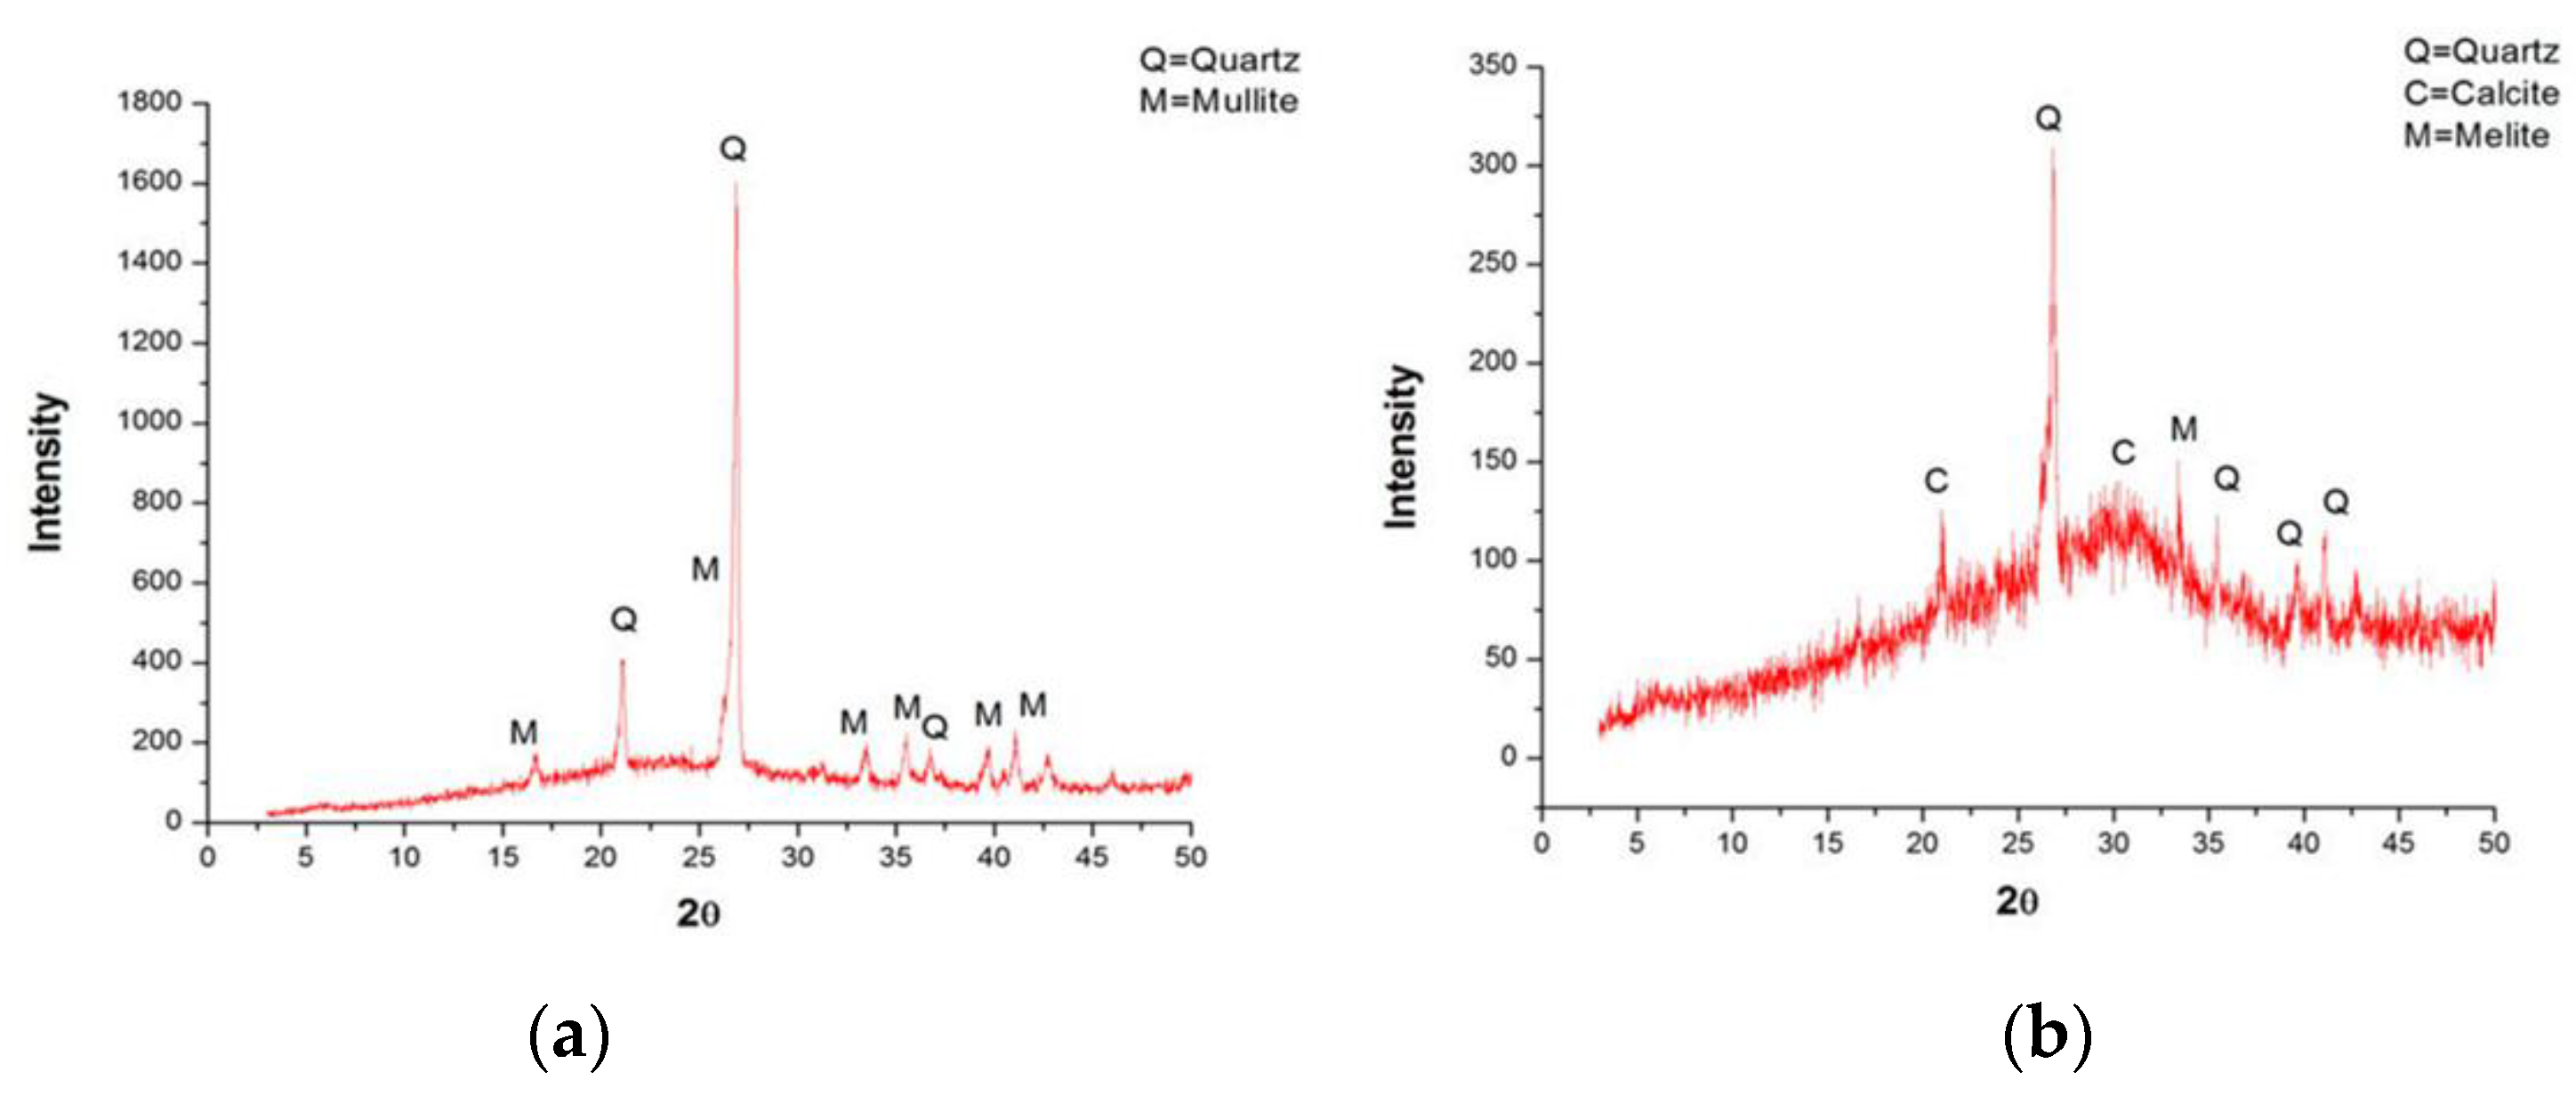
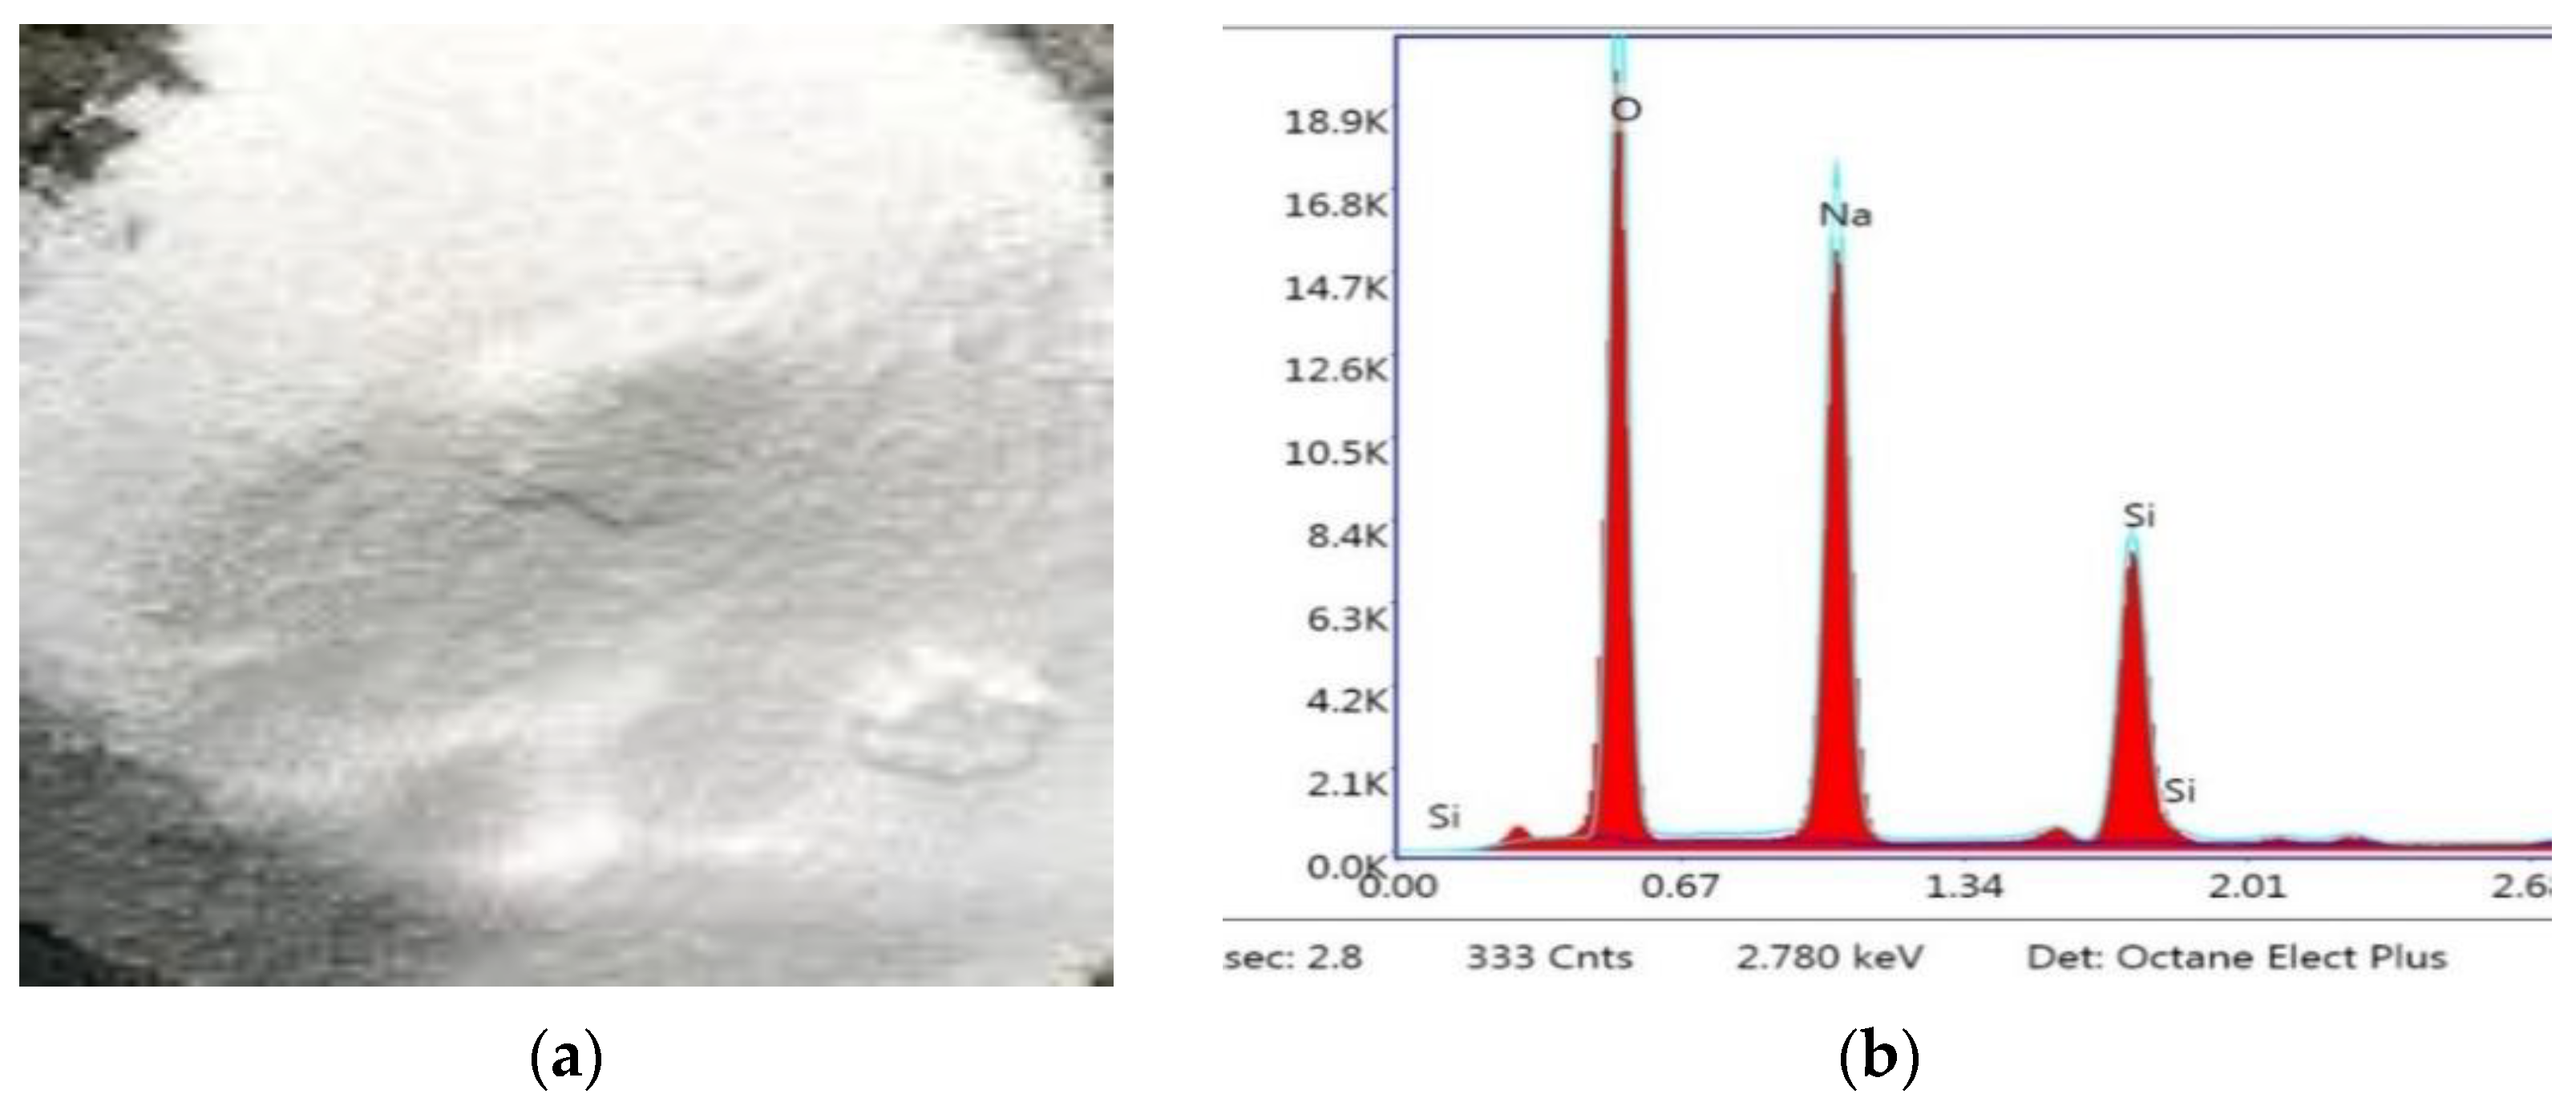
2.1. Materials
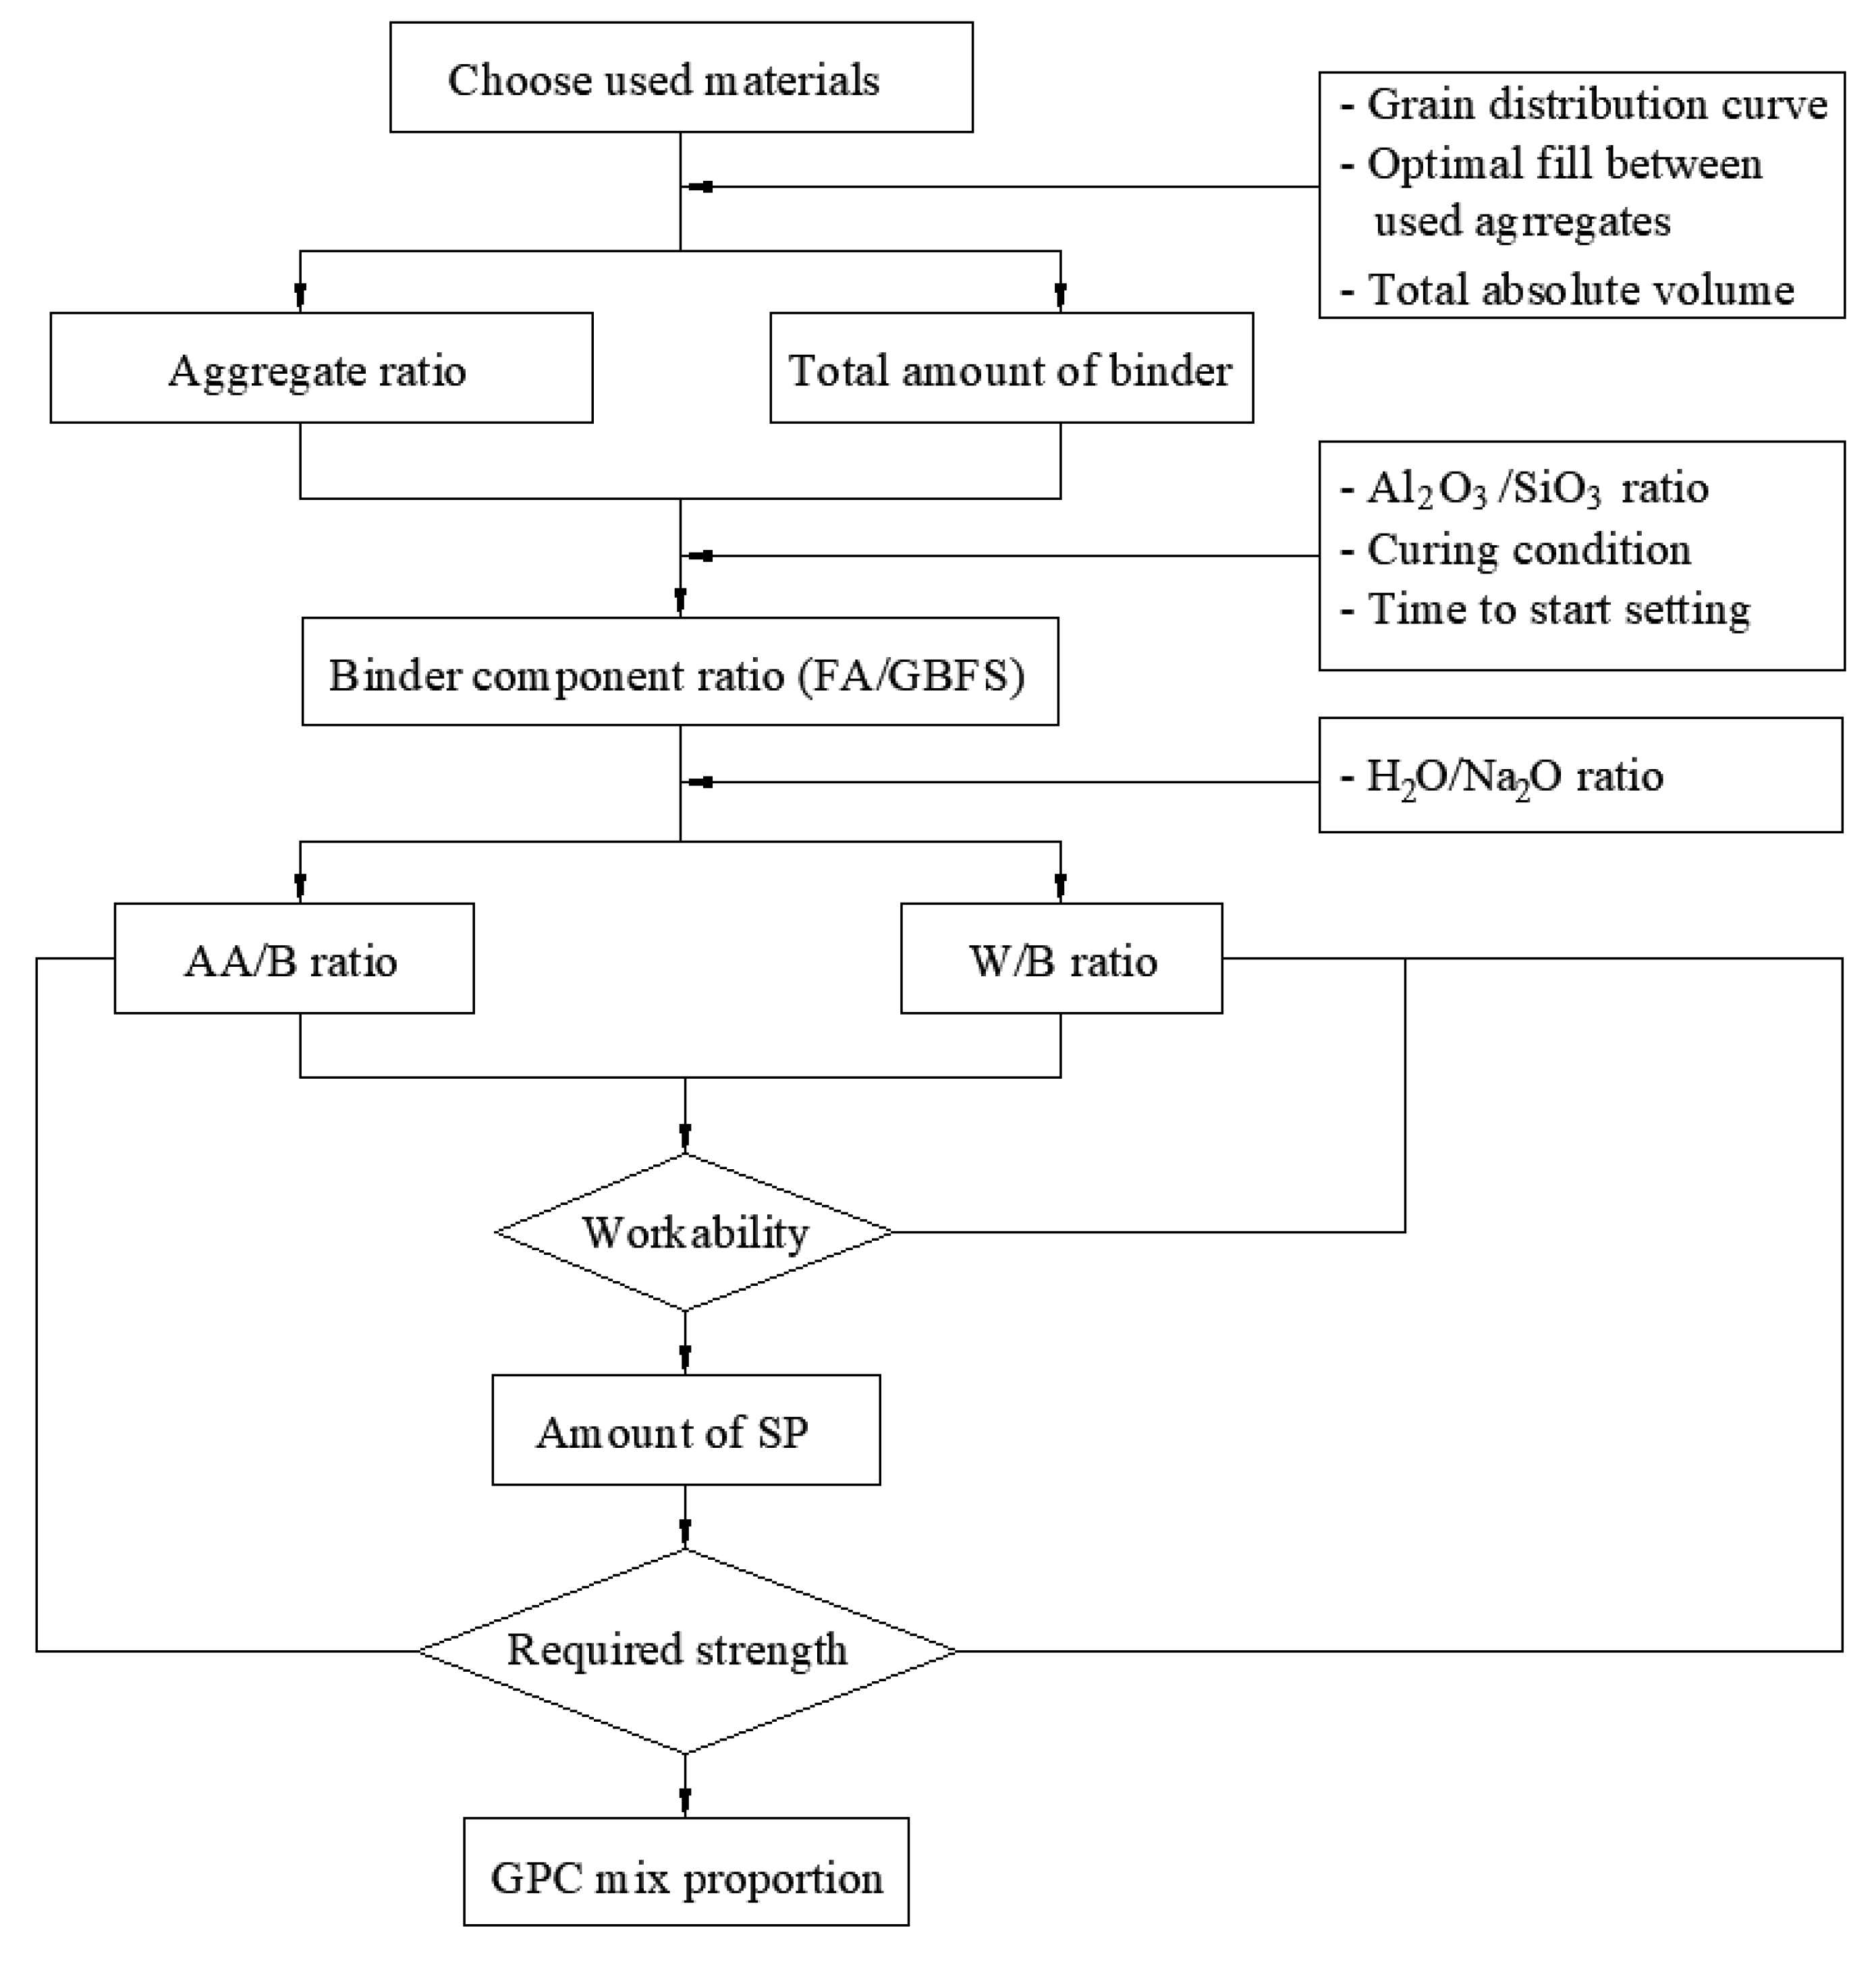
2.2. Mix Proportion
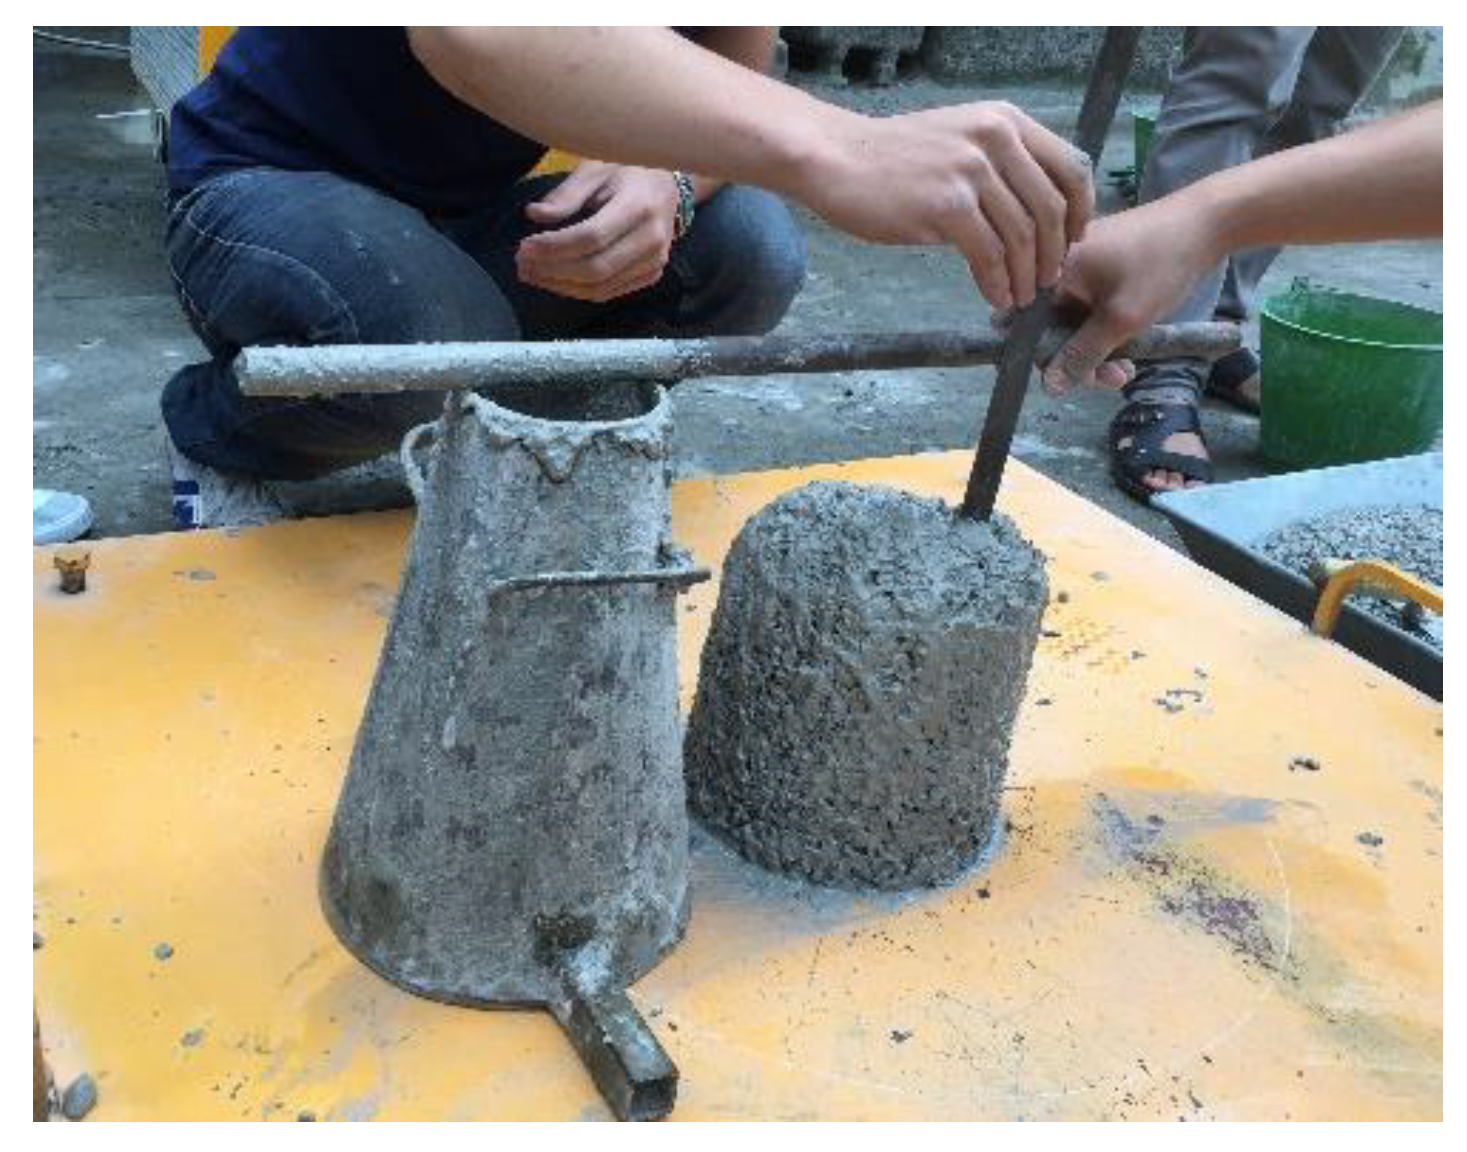
2.3. Experimental Details
3. Experimental Results and Discussions
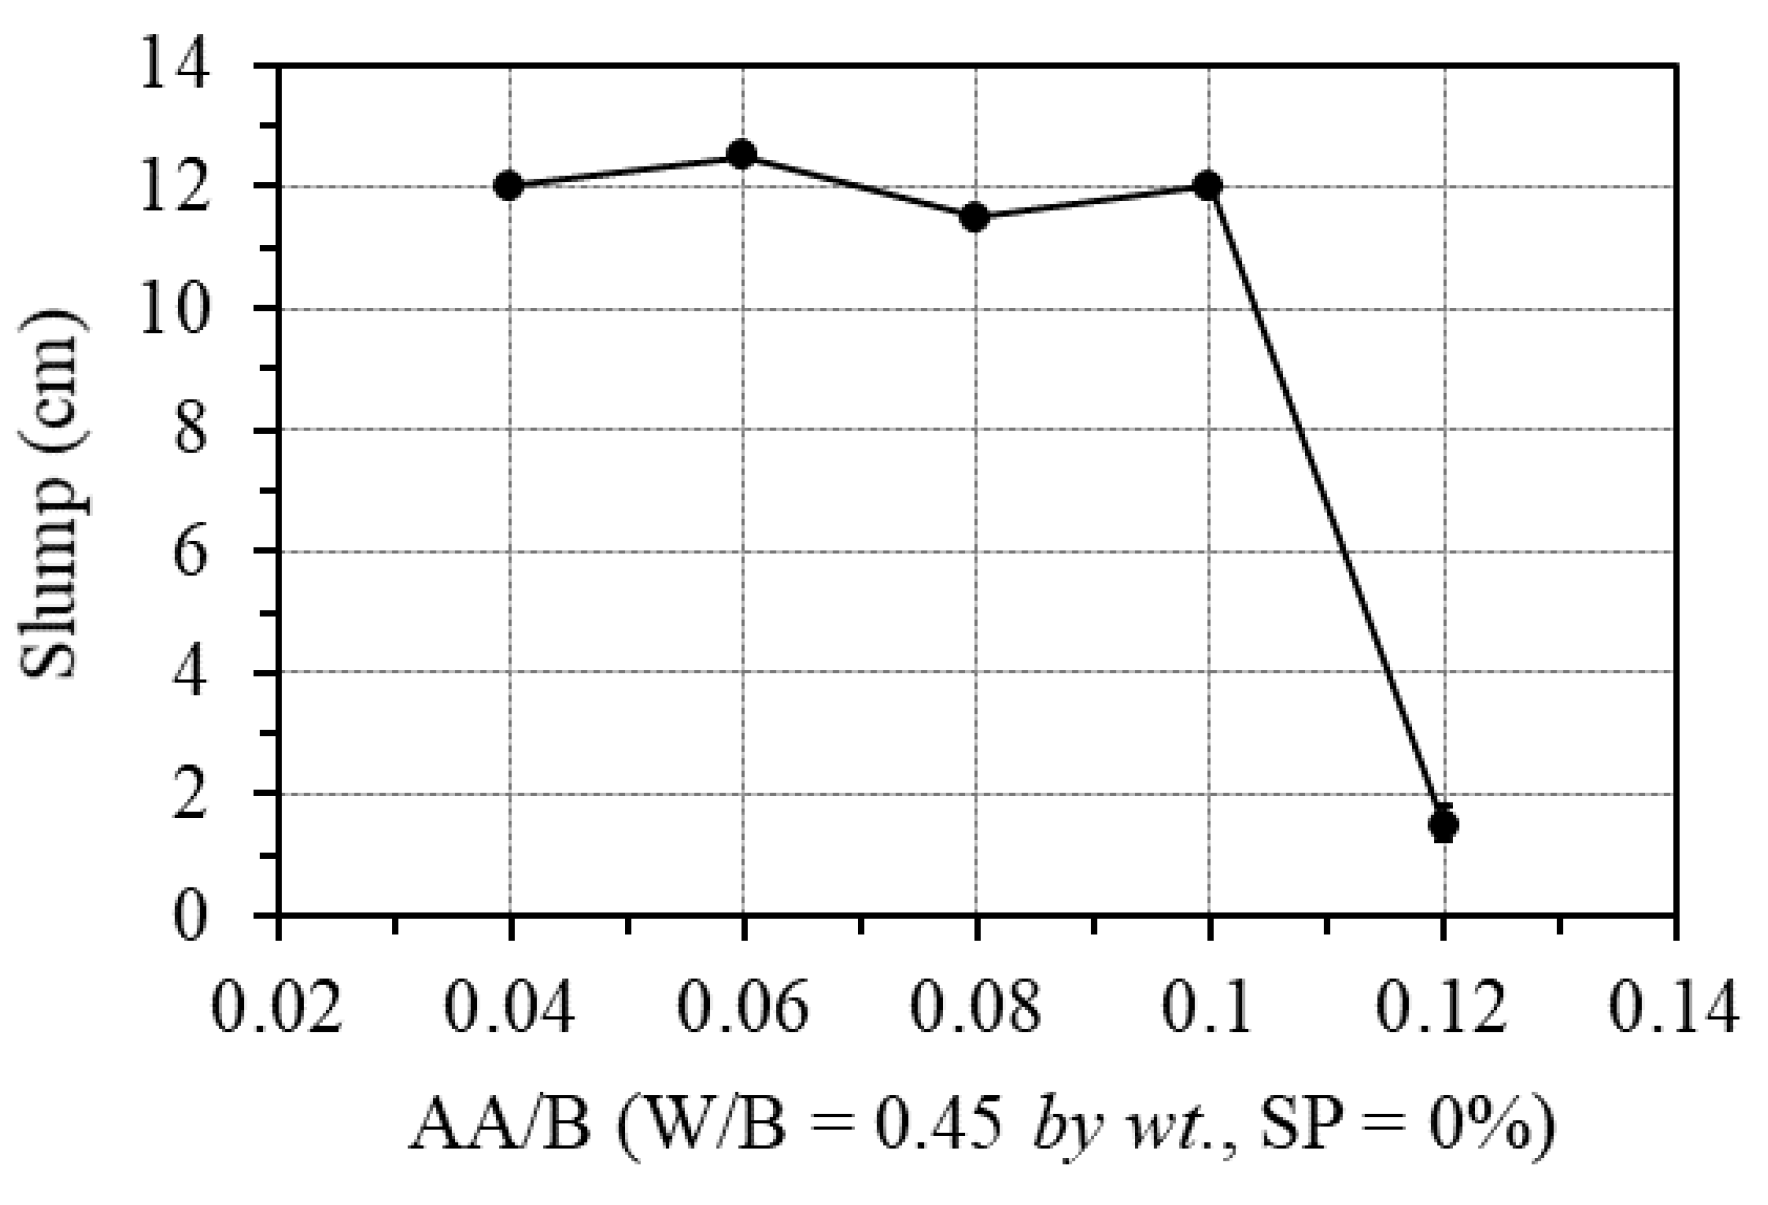
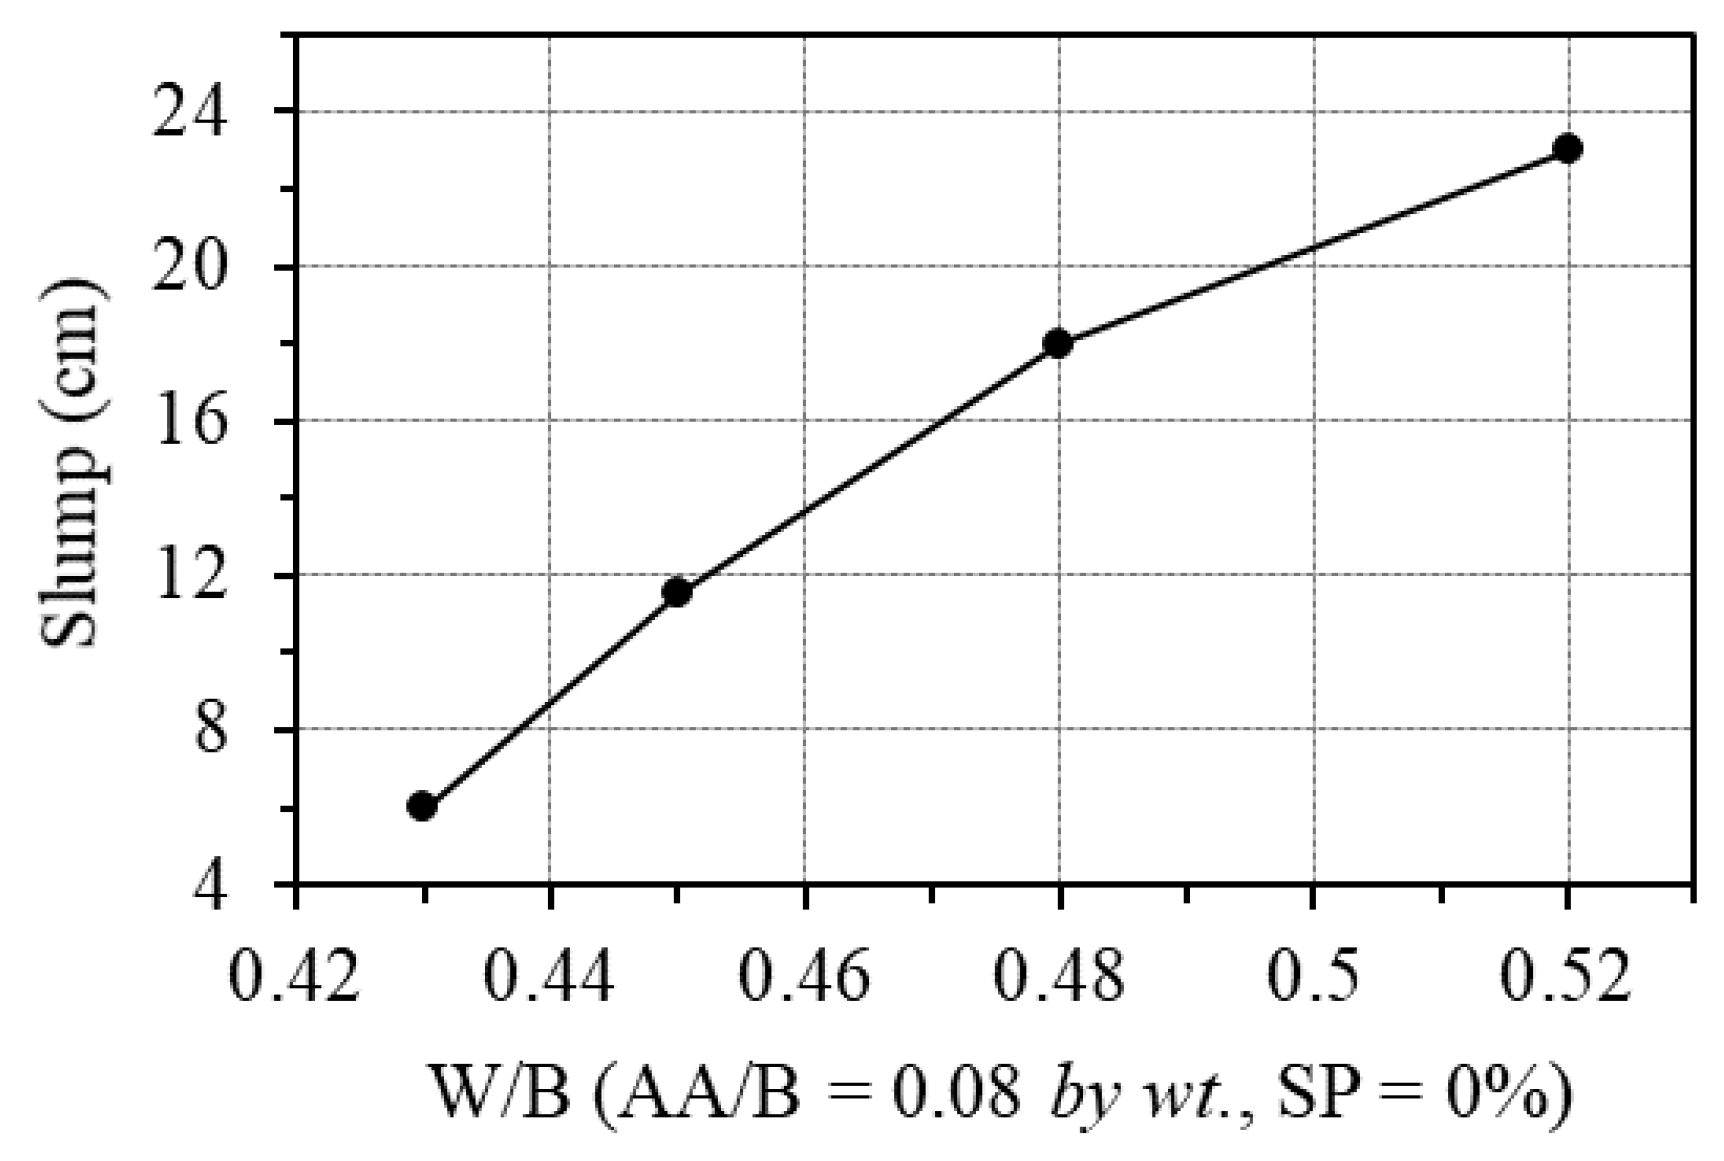
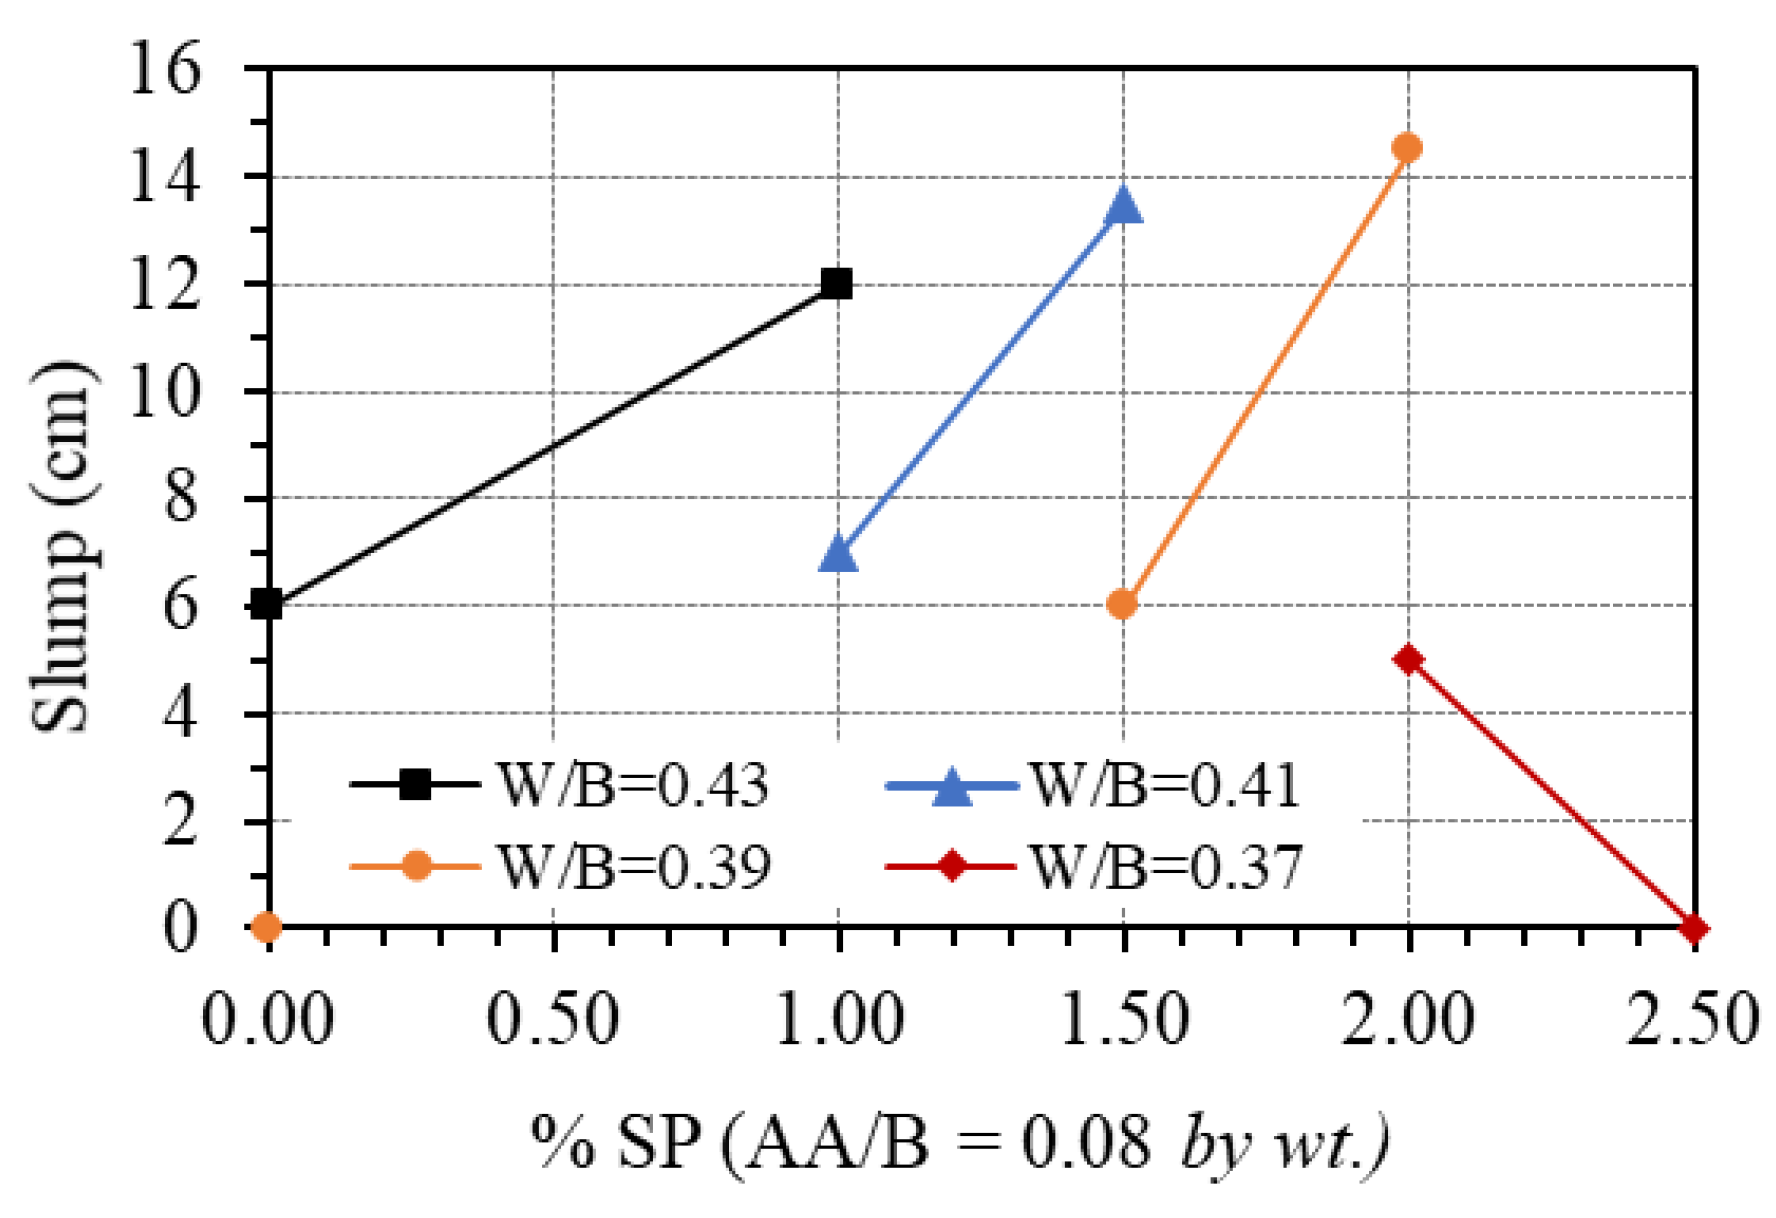
3.1. Effects of Alkali-Activator, Water, and Superplasticizer on Workability of One-Part Alkali-Activated GPC Paste
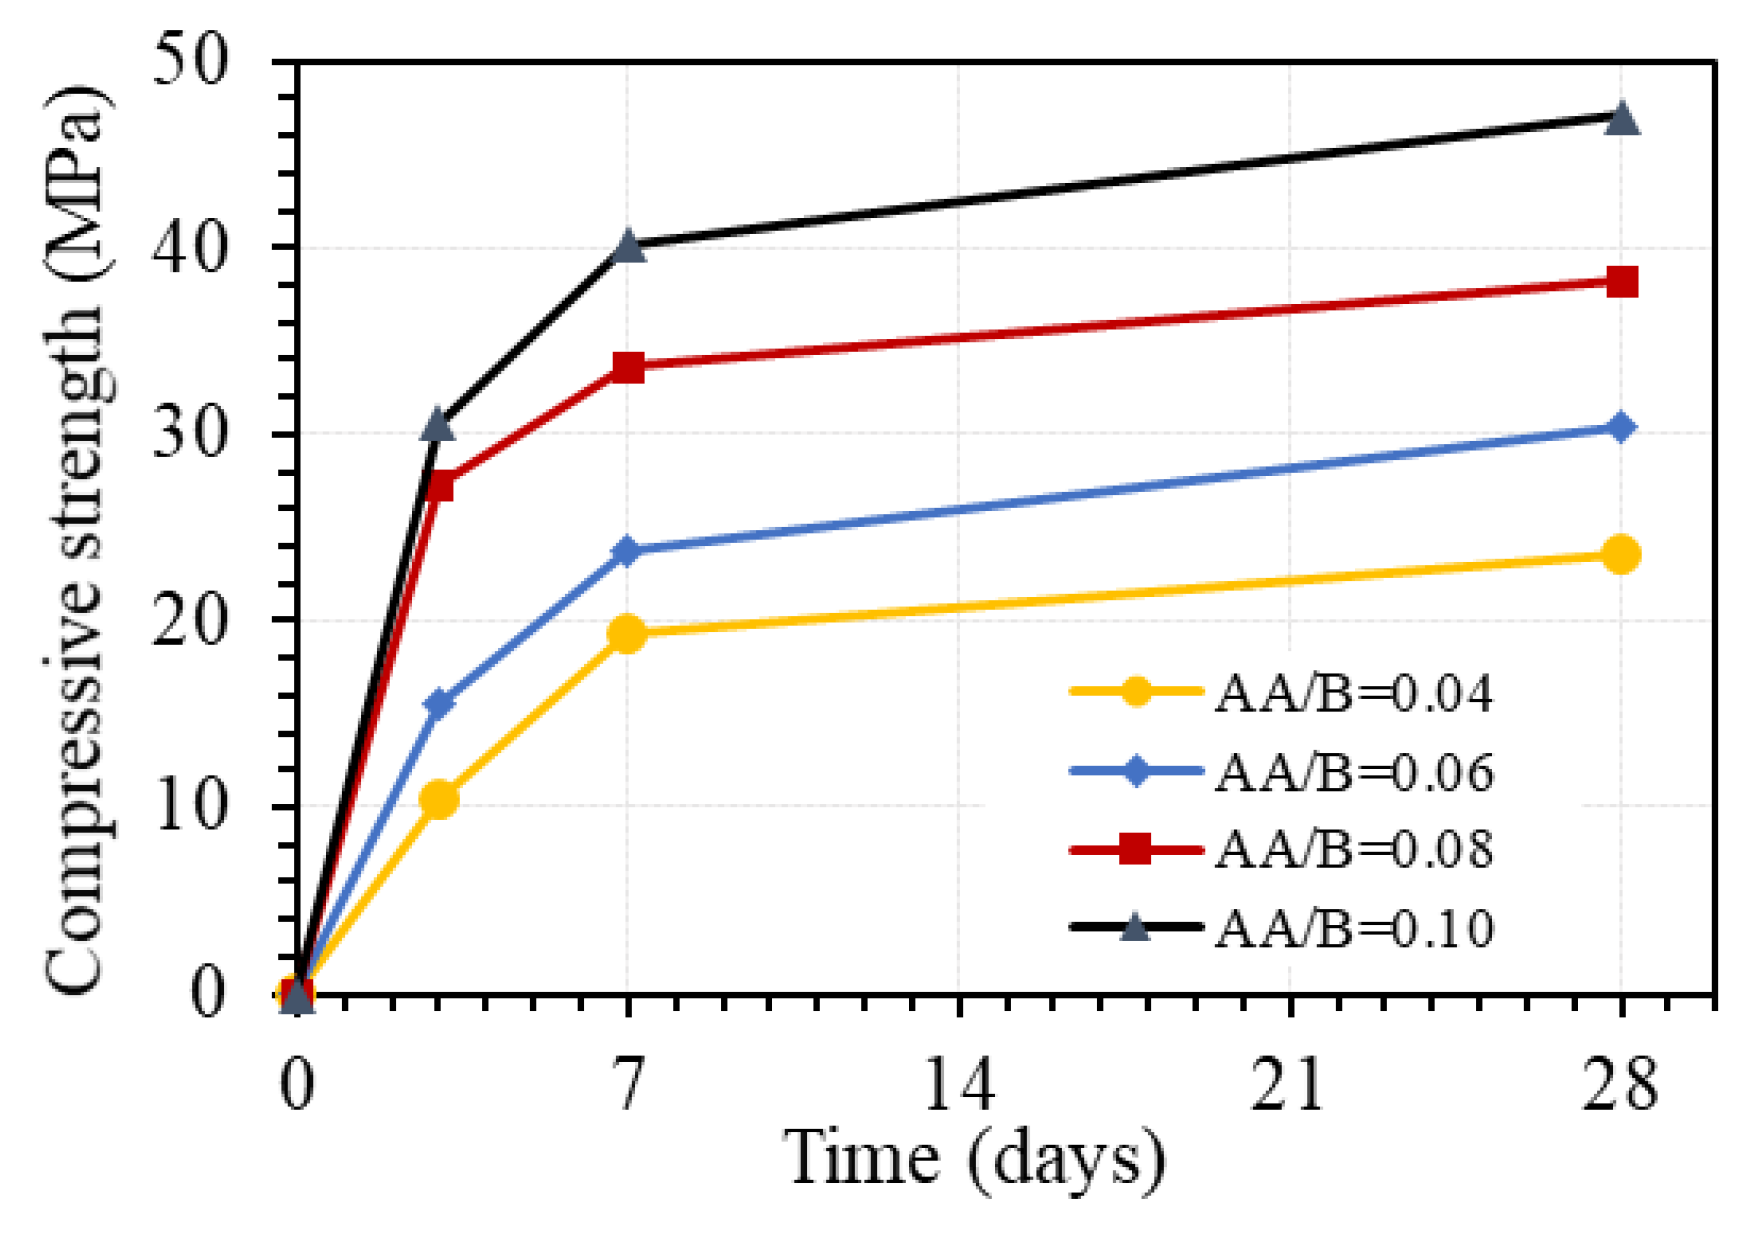
3.2. Effects of Alkali-Activator and Water on Compressive Strength of GPC
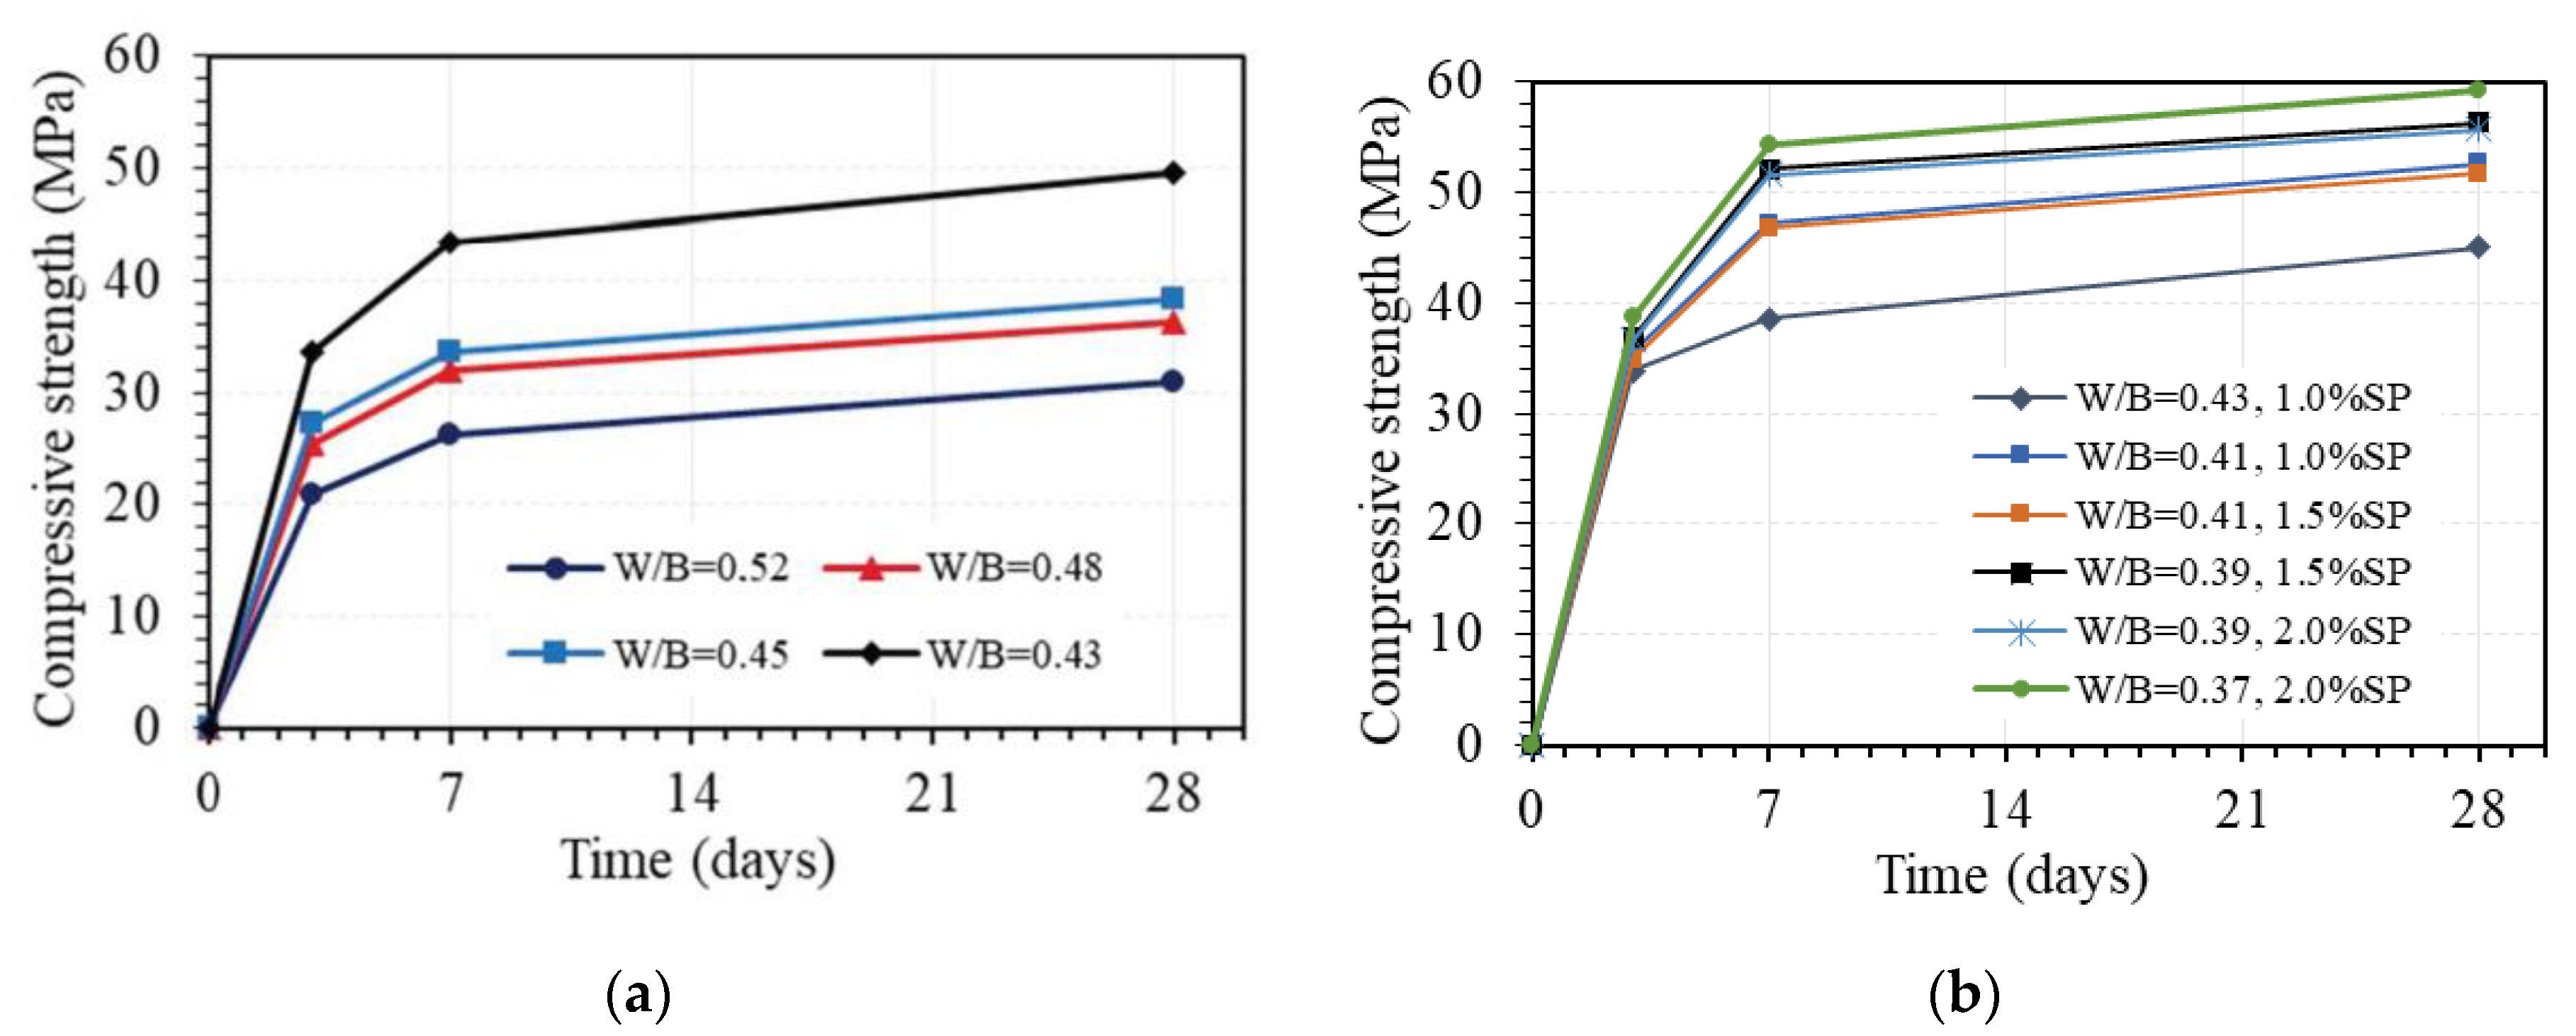
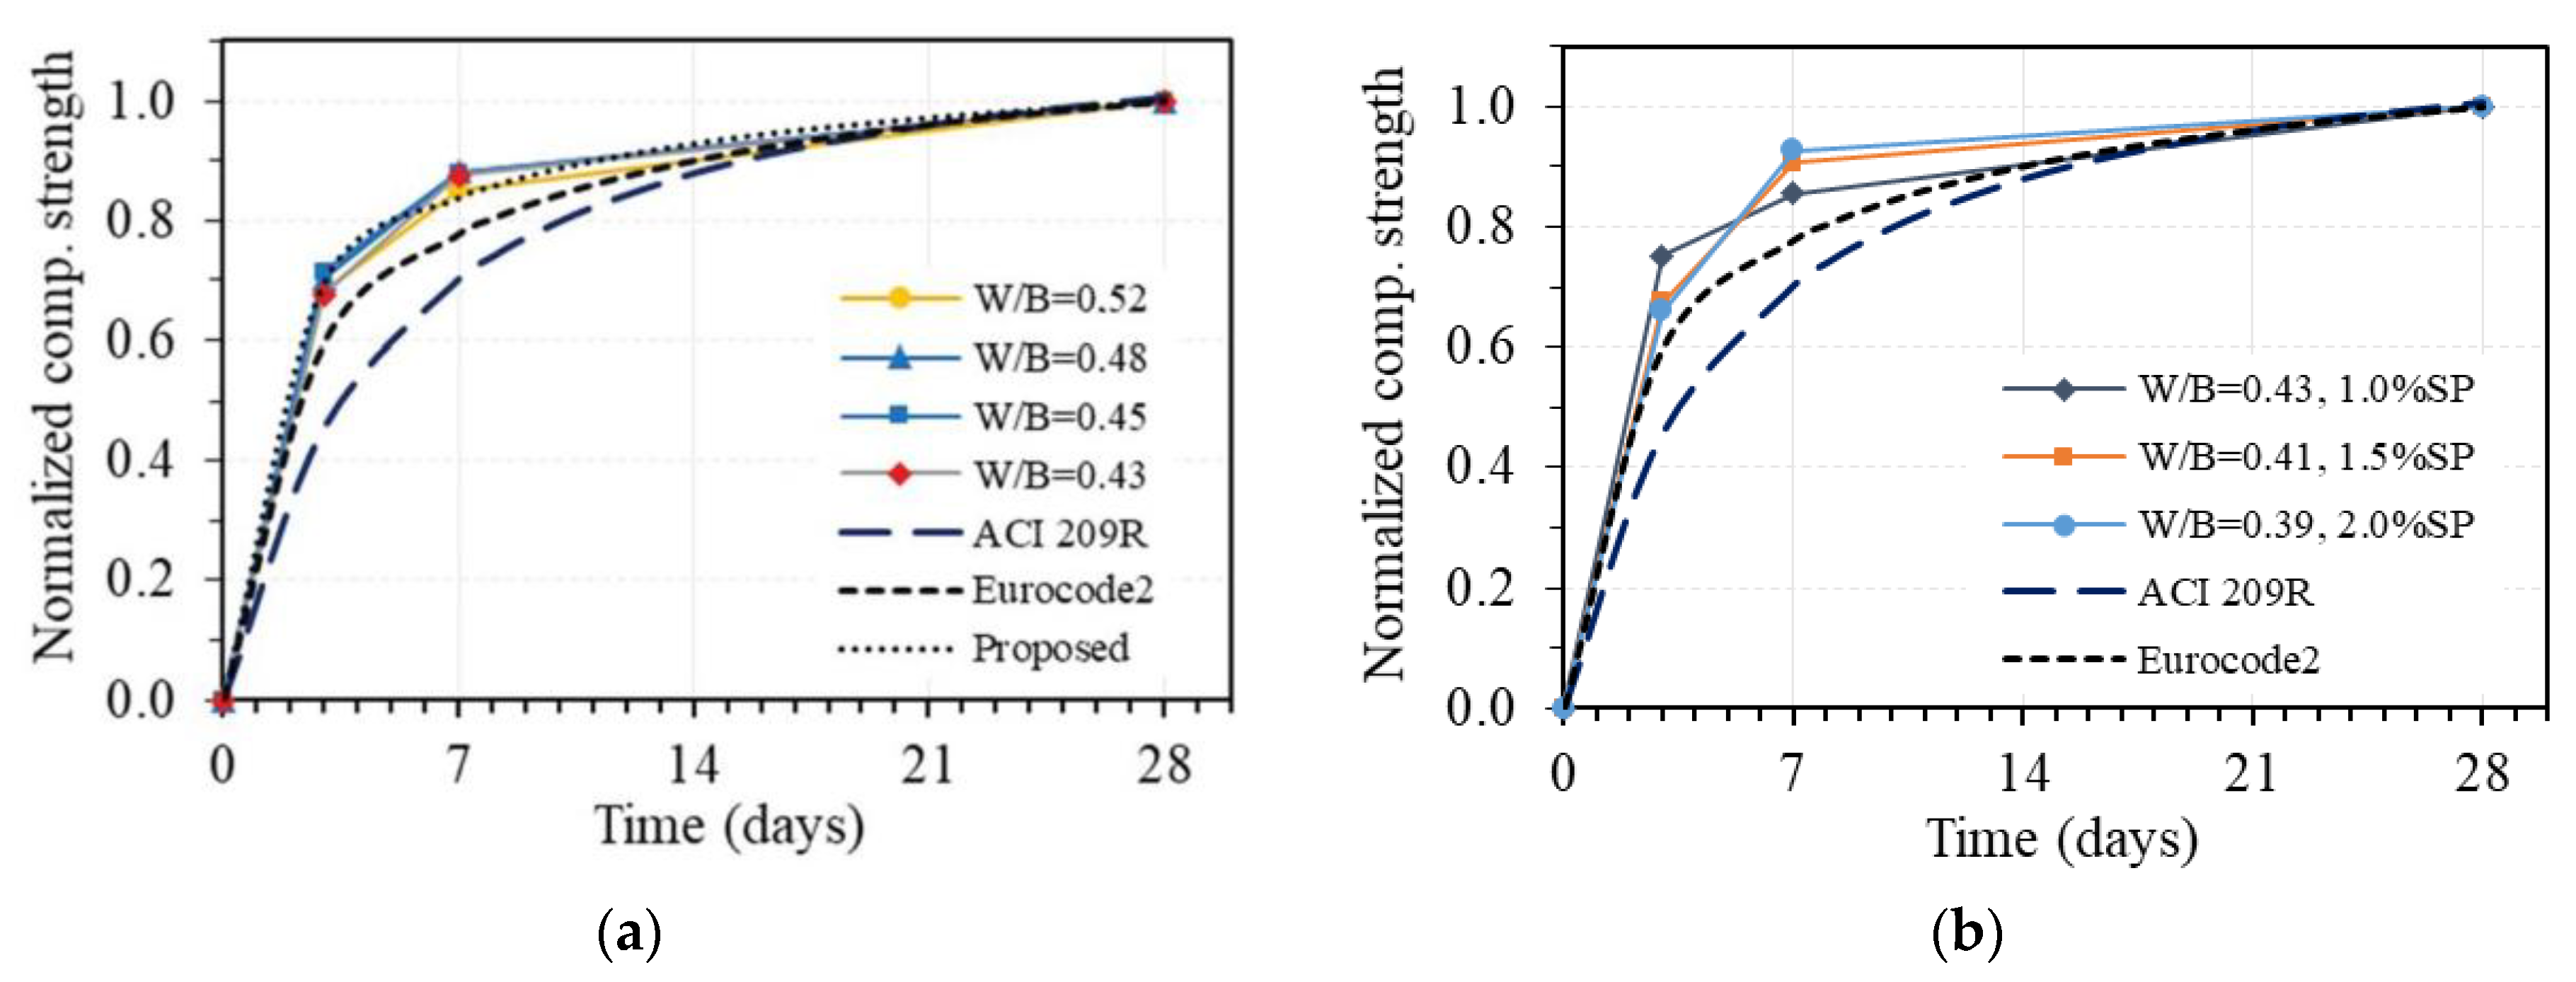
3.3. Compressive Strength Development under the Time of One-Part Alkali-Activated GPC in Comparison with OPC Concrete
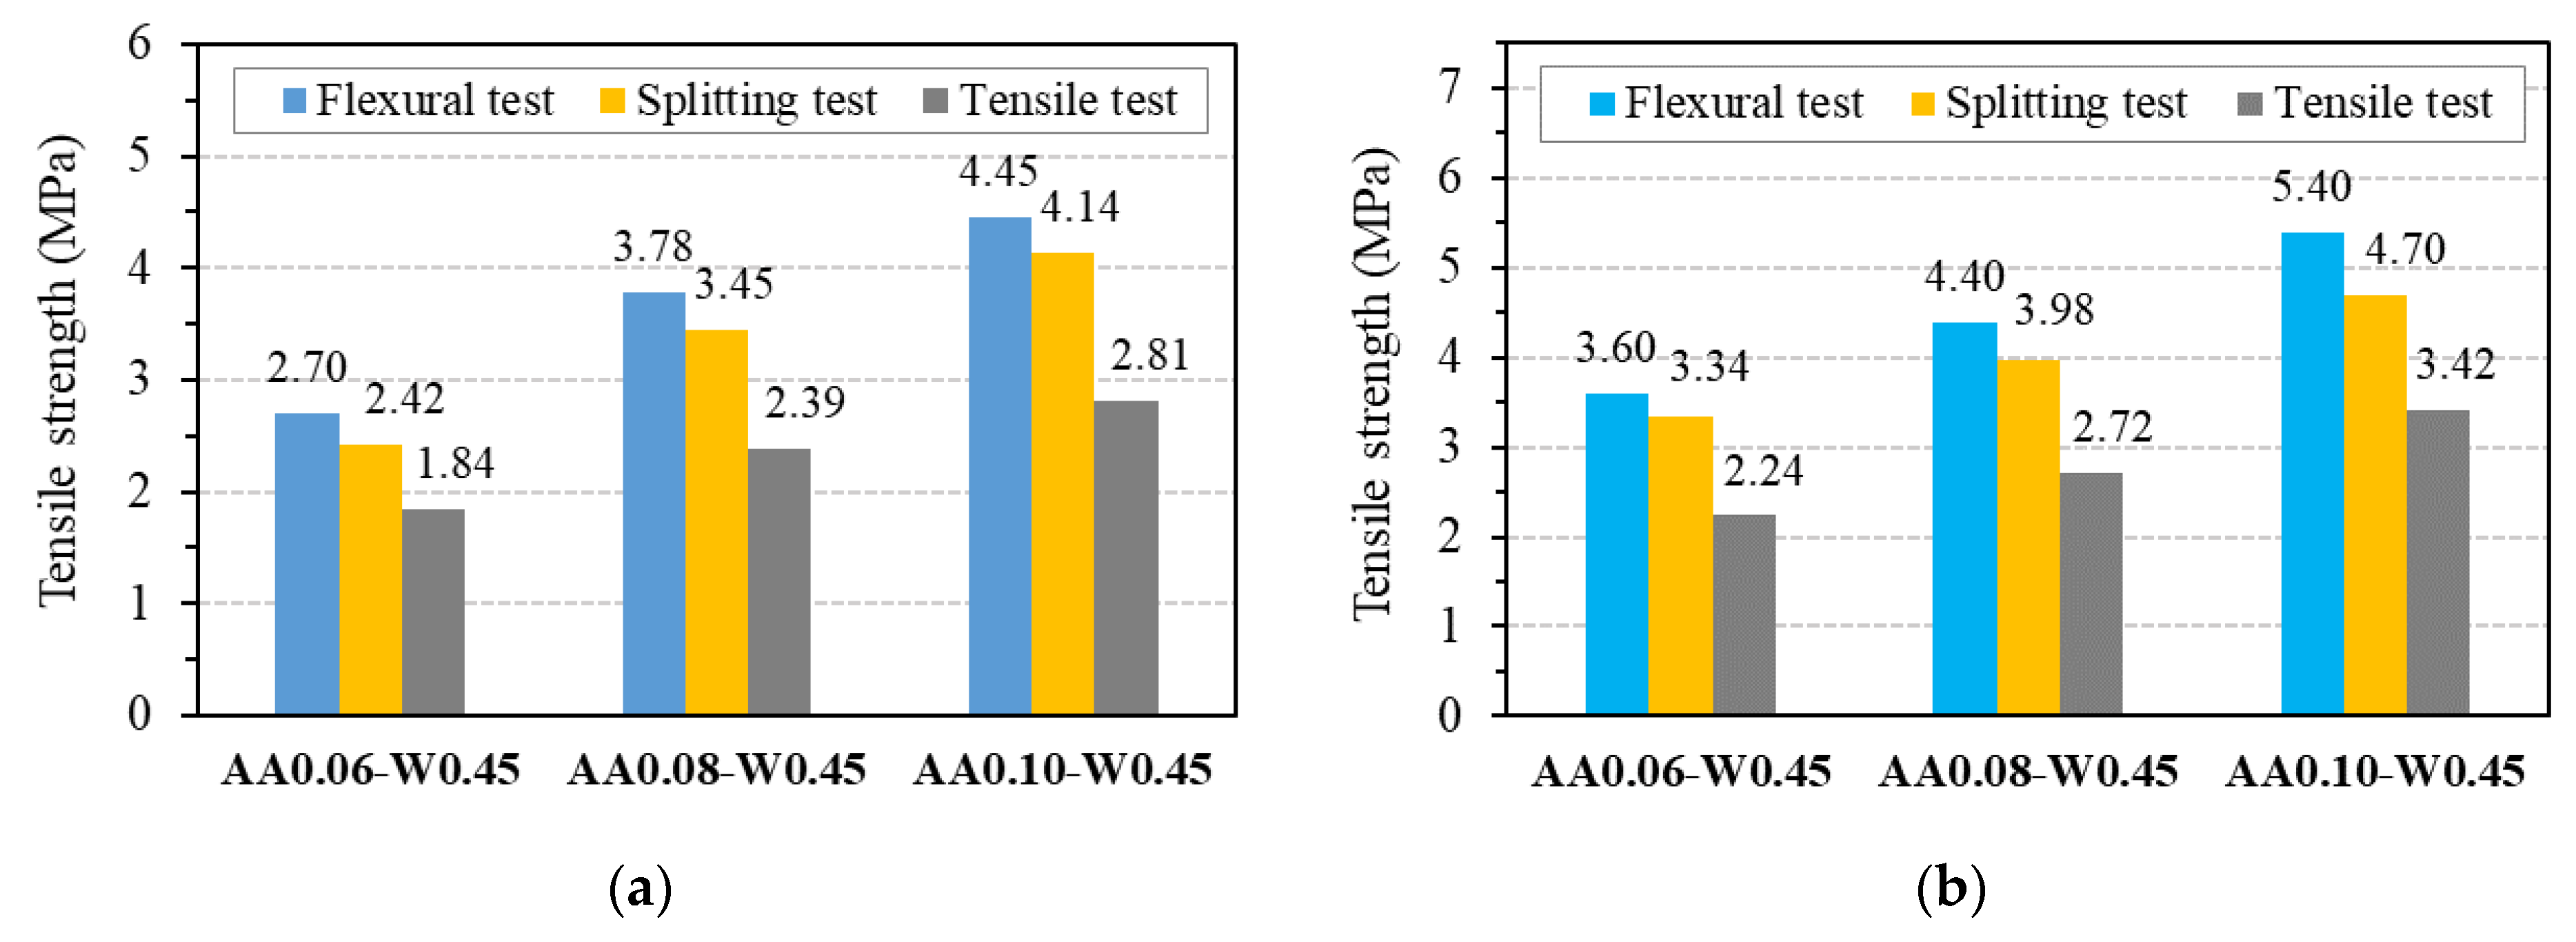
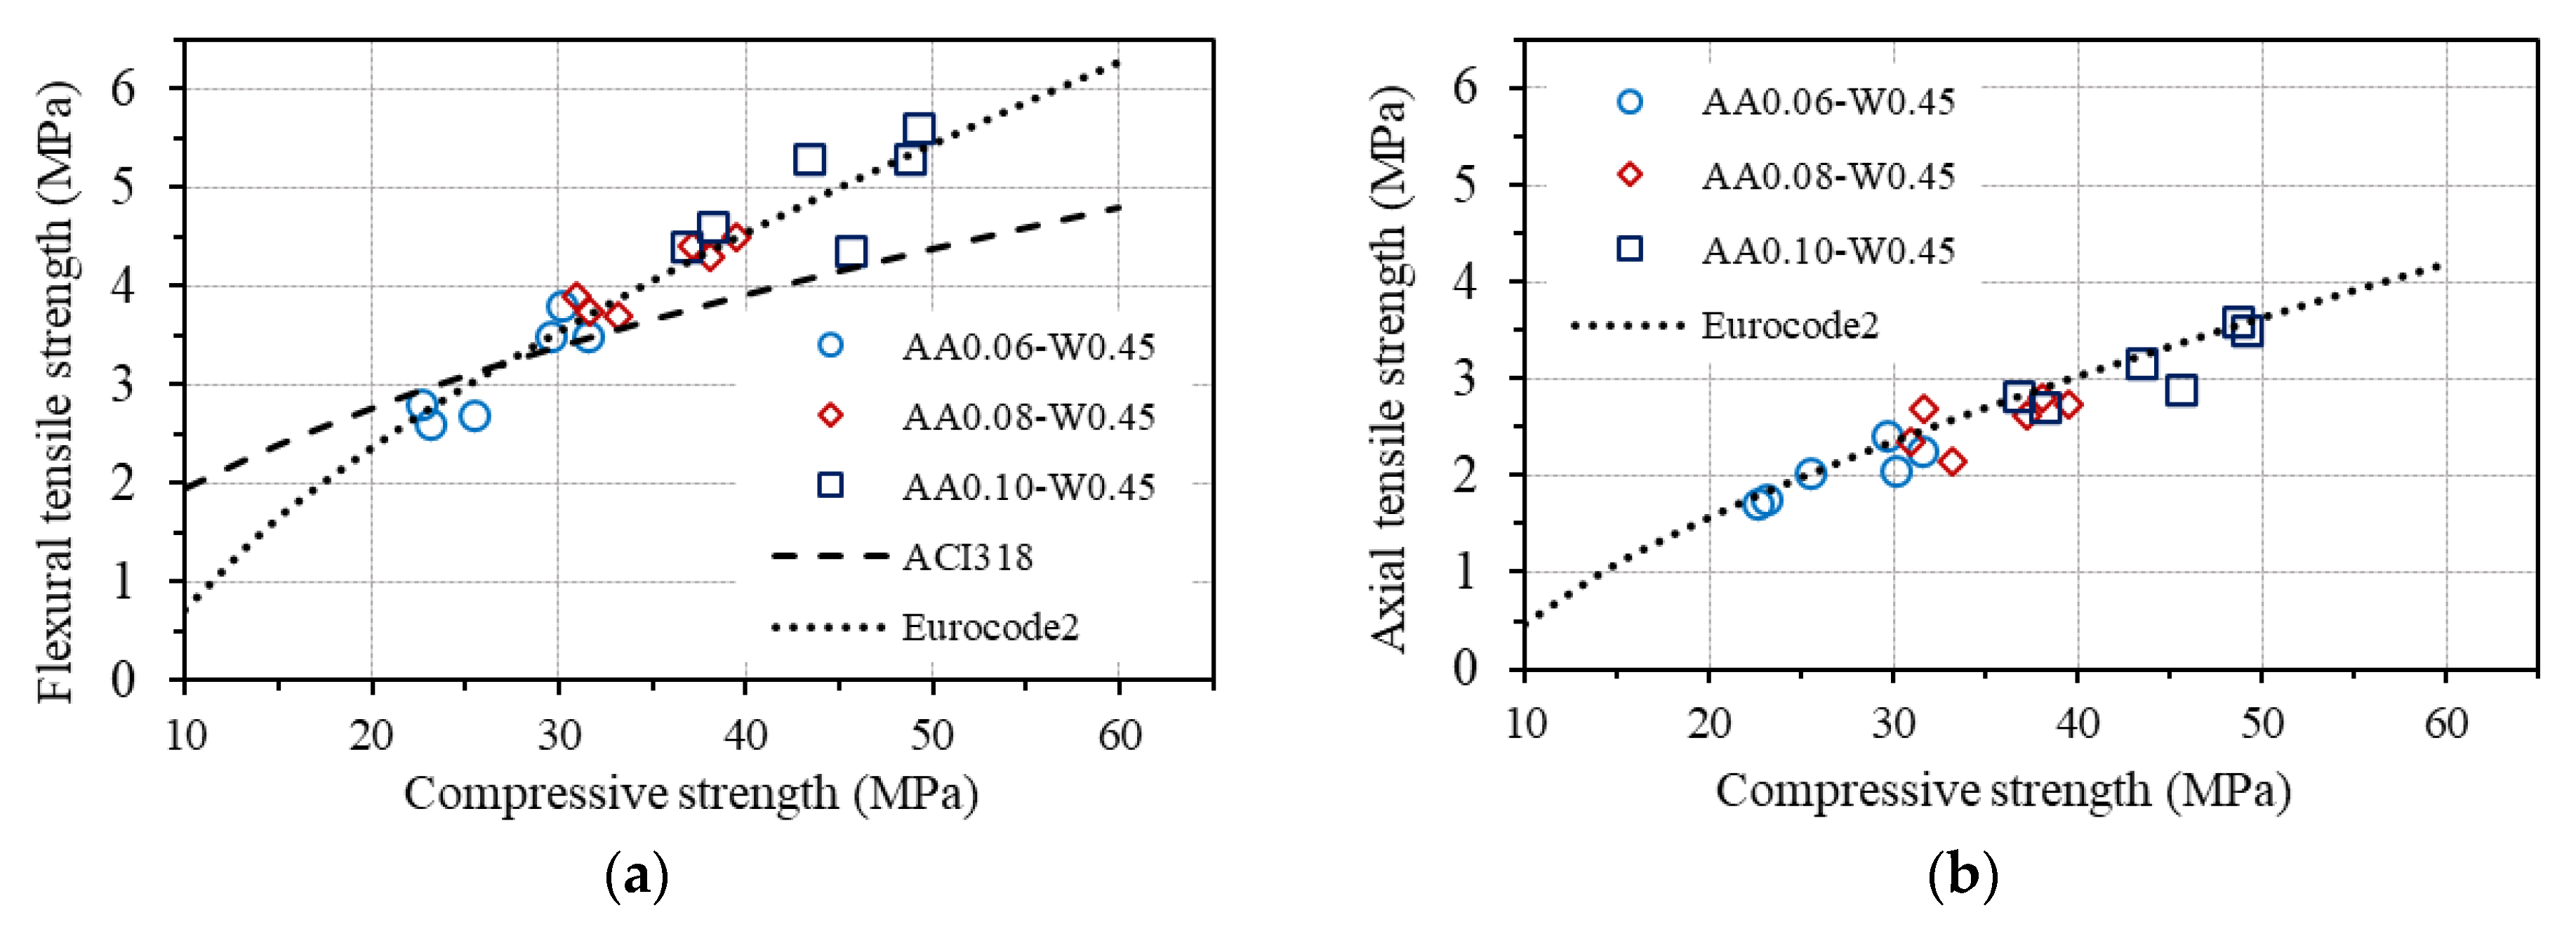
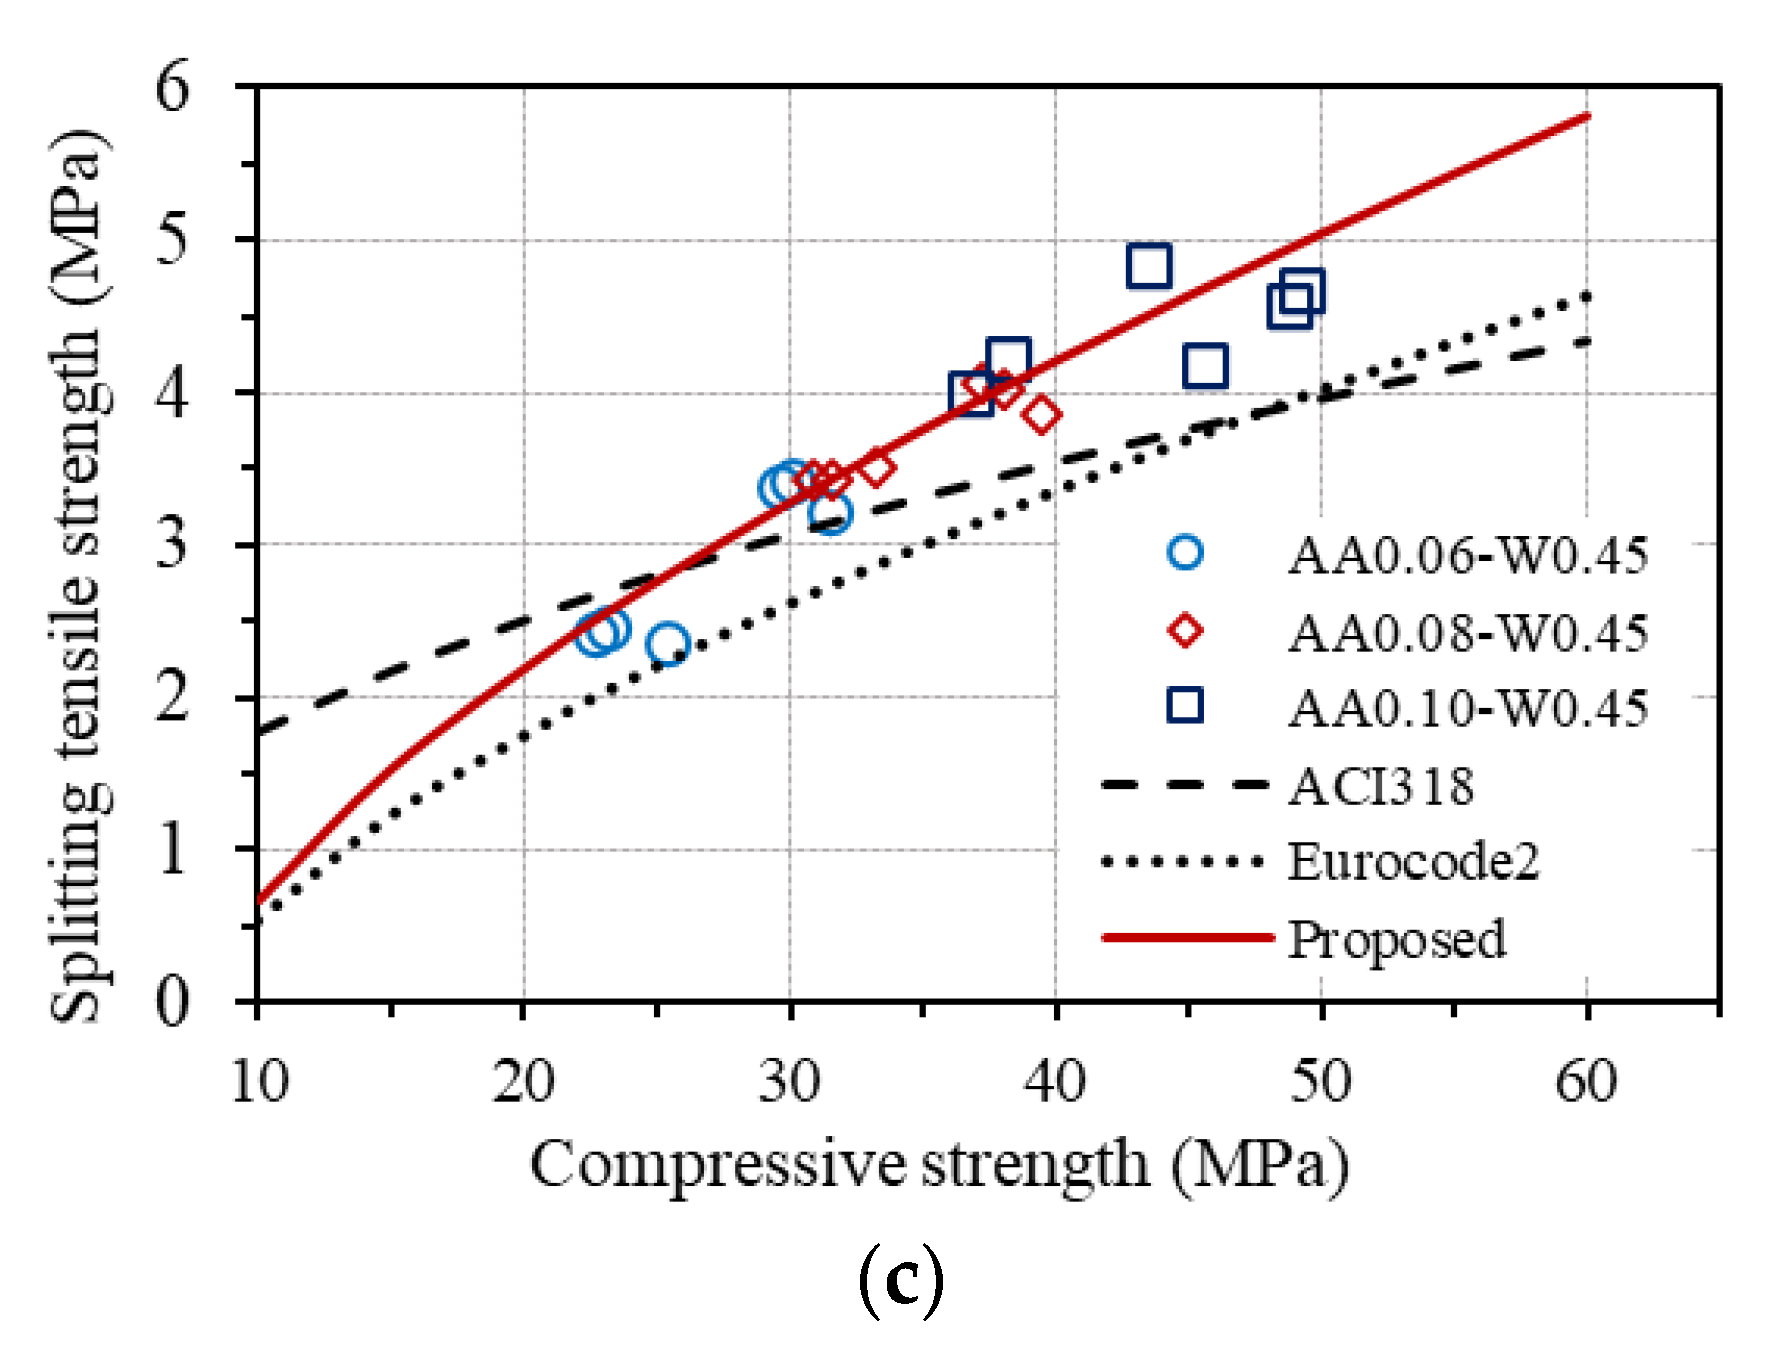
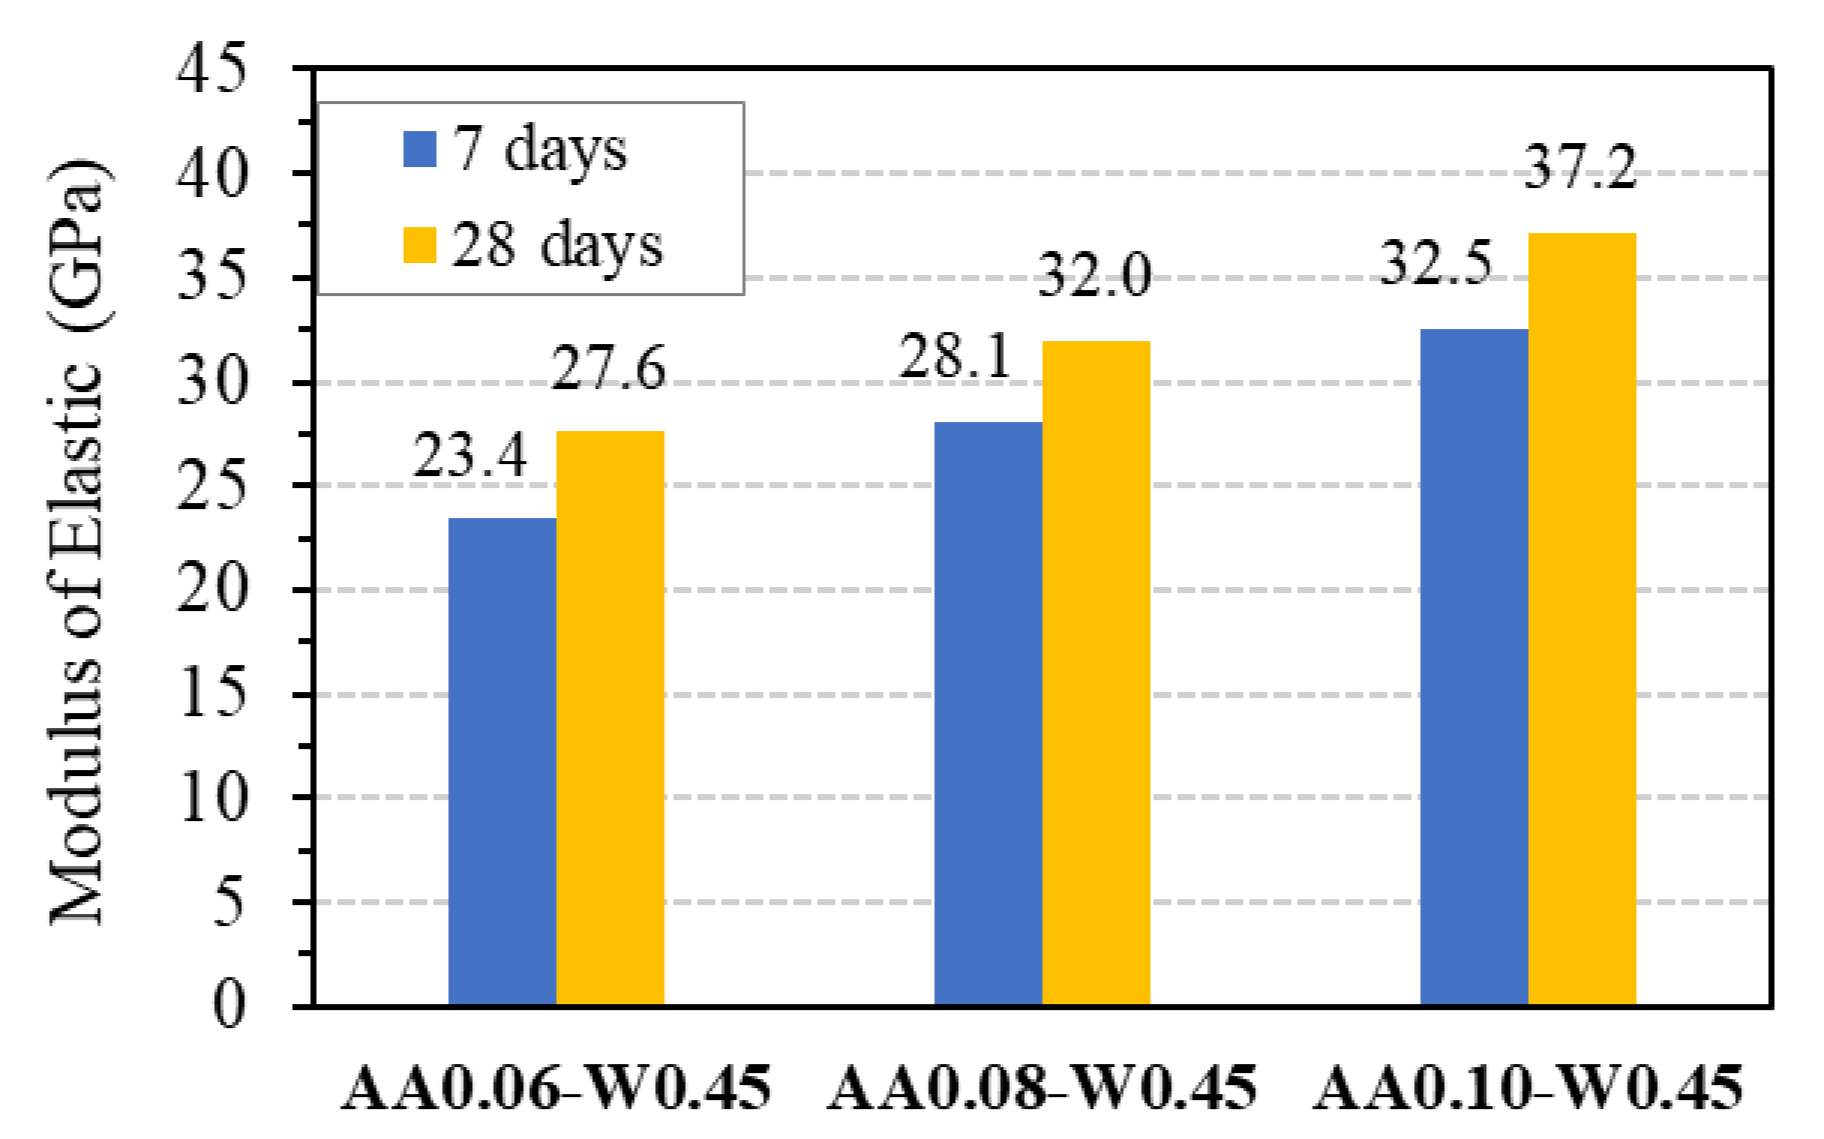
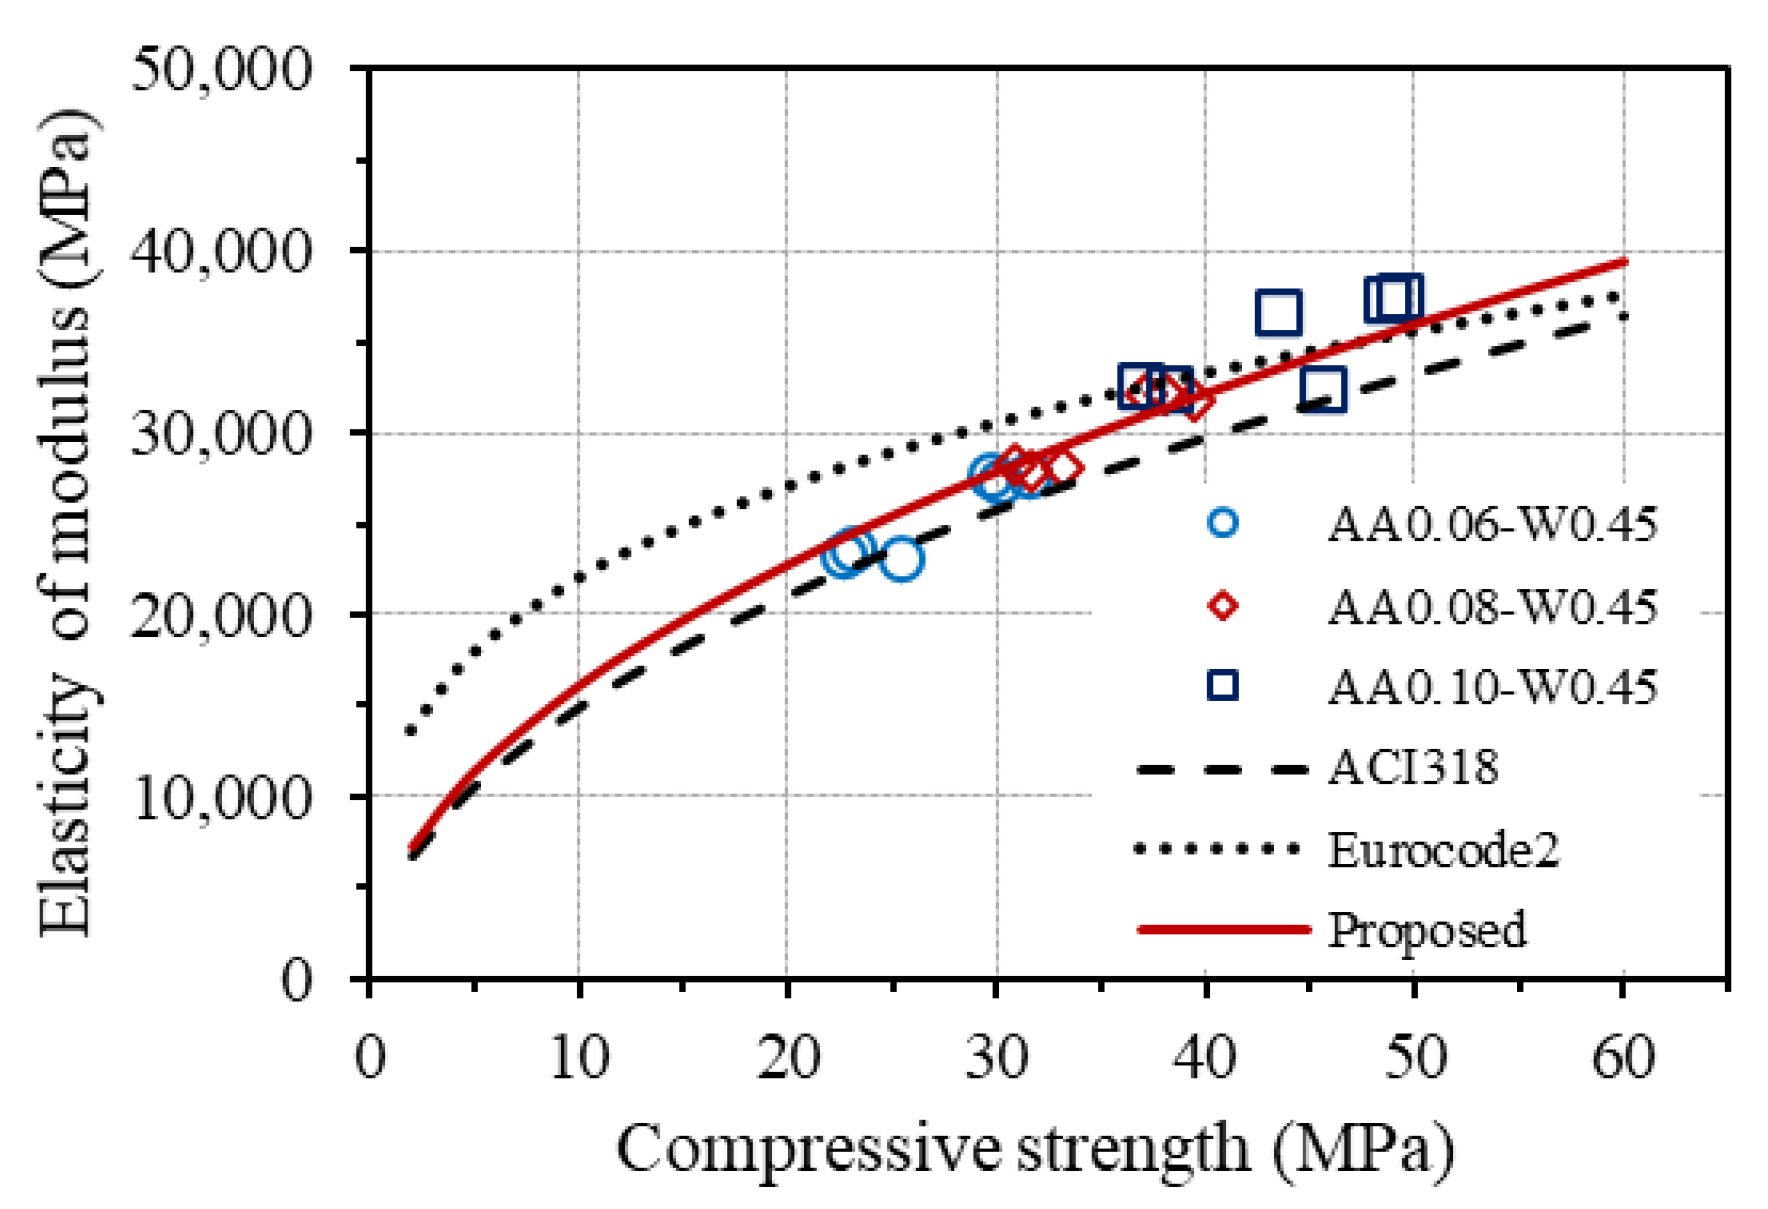
3.4. Tensile Strengths, Modulus Elasticity, and Their Relations with Compressive Strength of One-Part Alkali-Activated GPC
4. Conclusions
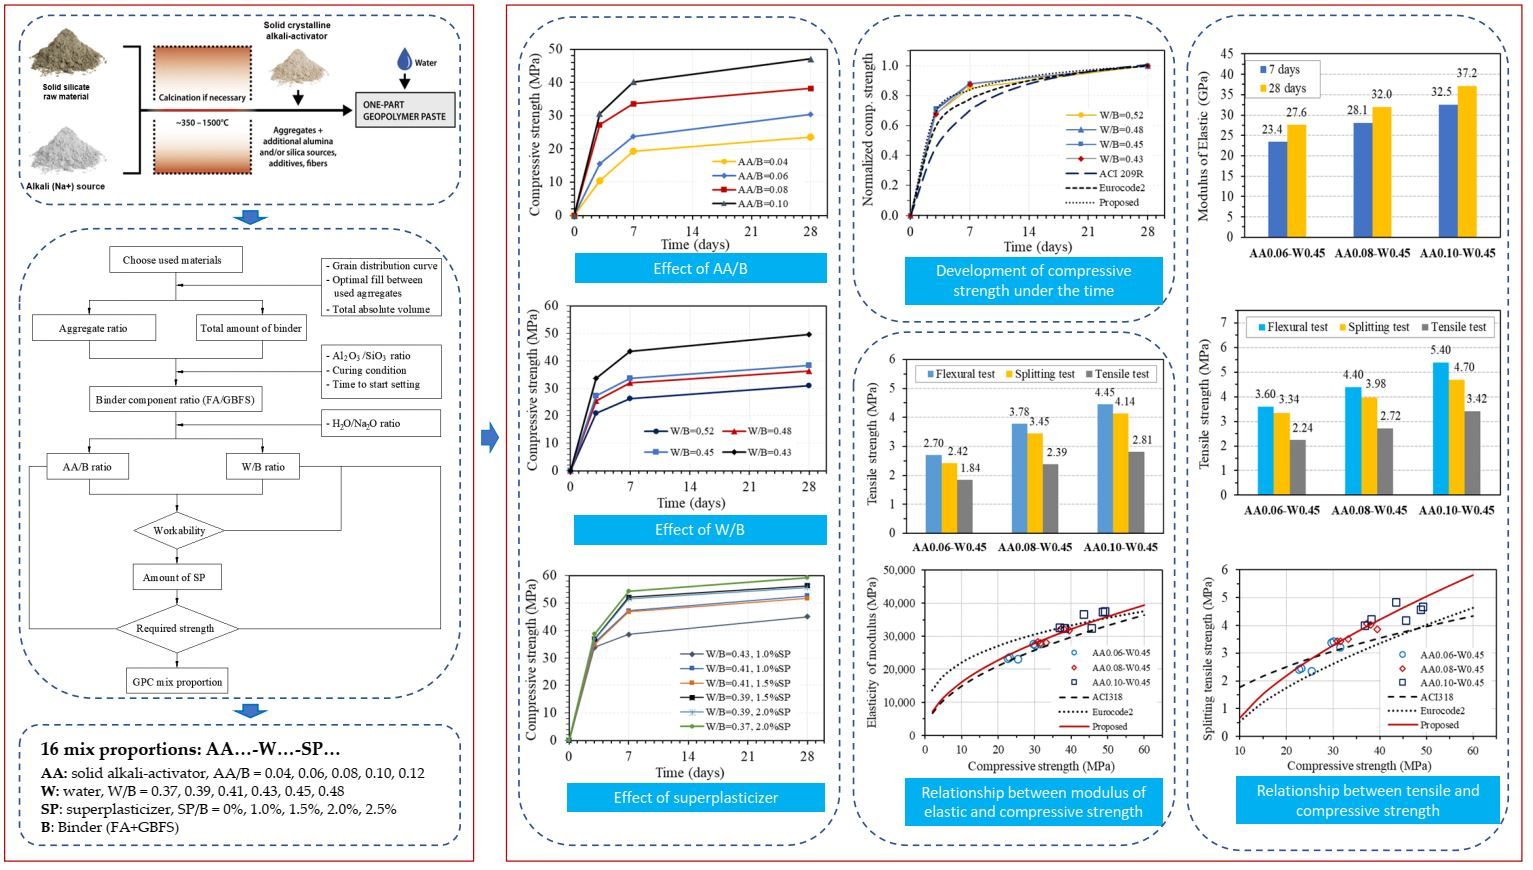
- The amount of one-part alkali-activator less than 10.0% of the total binder amount by weight has no influence on the workability but has a strong effect on the compressive strength of GPC. The one-part alkali-activator should not exceed 12.0% of the total binder amount by weight (AA/B = 0.12) in order not to lose the workability of GPC. The effect of the one-part alkali-activator on the compressive strength of GPC at 28 days was slightly decreased with the higher amount of the alkali-activator, whereas the amount of the alkali-activator corresponding to AA/B ratio from 0.06 to 0.08 exhibited the highest effect on the strength at 3 and 7 days.
- W/B ratio by weight has a significant influence on both the workability and compressive strength of GPC. The workability of GPC paste reduced as the W/B ratio increased. The compressive strength of GPC without superplasticizer decreased when the W/B ratio increased, and this effect of the W/B ratio was quite similar for compressive strength values at 3, 7, and 28 days but much different from different ranges of W/B ratio. The change of the W/B ratio from 0.43 to 0.45 has the greatest influence on compressive strength, and the minimum W/B ratio should be at least 0.43 to ensure workability and sample-making when no superplasticizer is added.
- Adding superplasticizers can greatly improve the workability of GPC but reduce the strength of GPC. Increasing the superplasticizer up to 2.5% does not improve the workability, and this amount can be considered as the upper bound when using superplasticizer-based polyciliate for one-part alkali-activated GPC.
- Compressive strengths at an early age of GPC are slightly higher than the predicted values based on Eurocode2, while they are quite much higher than the ones obtained from ACI 209R. The constant s that depends on the cement type should be taken as 0.175 for cement class N in the prediction equation for the compressive strength development under the time of one-part alkali-activated GPC according to the original equation for OPC concrete given by Eurocode2.
- The relationship between flexural tensile strength and compressive strength, as well as between axial tensile strength and compressive strength provided by Eurocode2 for OPC concrete, fits well with one-part alkali-activated GPC, whereas the ratio between axial tensile strength and splitting tensile strength is found to be about 0.72 for GPC instead of 0.9 as given by Eurocode2 for OPC concrete.
- The relationship between elastic modulus and compressive strength of one-part alkali-activated GPC is found to follow the trend given by ACI 318 for OPC concrete, but a higher coefficient of 5090 should be used instead of 4700 in order to accurately predict elastic modulus from compressive strength of GPC.
Author Contributions
Funding
Data Availability Statement
Conflicts of Interest
References
- McLellan, B.C.; Williams, R.P.; Lay, J.; van Riessen, A.; Corder, G.D. Costs and Carbon Emissions for Geopolymer Pastes in Comparison to Ordinary Portland Cement. J. Clean. Prod. 2011, 19, 1080–1090. [Google Scholar] [CrossRef] [Green Version]
- Bernal, S.A.; Mejía de Gutiérrez, R.; Provis, J.L. Engineering and Durability Properties of Concretes Based on Alkali-Activated Granulated Blast Furnace Slag/Metakaolin Blends. Constr. Build. Mater. 2012, 33, 99–108. [Google Scholar] [CrossRef]
- Glukhovsky, V.D. Soil Silicates. Gosstroyizdat Kiev. 1959, 154. Available online: https://scholar.google.com/scholar_lookup?title=Gruntosilikaty+(Soil+Silicates)&author=Glukhovsky,+V.D.&publication_year=1959 (accessed on 15 July 2023).
- Krivenko, P. Synthesis of Cementitious Materials of the Me2O-MeO-Me2O3-SiO2-H2O System with Required Properties. 1986. Available online: https://scholar.google.com/scholar?cluster=2495372416308018022&hl=vi&as_sdt=2005&sciodt=0,5 (accessed on 15 July 2023).
- Davidovits, J. Geopolymers: Inorganic Polymeric New Materials. J. Therm. Anal. Calorim. 1991, 37, 1633–1656. [Google Scholar] [CrossRef]
- Komljenović, M.; Baščarević, Z.; Bradić, V. Mechanical and Microstructural Properties of Alkali-Activated Fly Ash Geopolymers. J. Hazard. Mater. 2010, 181, 35–42. [Google Scholar] [CrossRef]
- Kim, Y.Y.; Lee, B.-J.; Saraswathy, V.; Kwon, S.-J. Strength and Durability Performance of Alkali-Activated Rice Husk Ash Geopolymer Mortar. Sci. World J. 2014, 2014, 209584. [Google Scholar] [CrossRef] [PubMed] [Green Version]
- Aiken, T.A.; Sha, W.; Kwasny, J.; Soutsos, M.N. Resistance of Geopolymer and Portland Cement Based Systems to Silage Effluent Attack. Cem. Concr. Res. 2017, 92, 56–65. [Google Scholar] [CrossRef] [Green Version]
- Albitar, M.; Mohamed Ali, M.S.; Visintin, P.; Drechsler, M. Durability Evaluation of Geopolymer and Conventional Concretes. Constr. Build. Mater. 2017, 136, 374–385. [Google Scholar] [CrossRef]
- Bakharev, T. Resistance of Geopolymer Materials to Acid Attack. Cem. Concr. Res. 2005, 35, 658–670. [Google Scholar] [CrossRef]
- Sagoe-Crentsil, K.; Brown, T.; Taylor, A. Drying Shrinkage and Creep Performance of Geopolymer Concrete. J. Sustain. Cem. Mater. 2013, 2, 35–42. [Google Scholar] [CrossRef]
- Kong, D.L.Y.; Sanjayan, J.G. Effect of Elevated Temperatures on Geopolymer Paste, Mortar and Concrete. Cem. Concr. Res. 2010, 40, 334–339. [Google Scholar] [CrossRef]
- Sarker, P.K.; Kelly, S.; Yao, Z. Effect of Fire Exposure on Cracking, Spalling and Residual Strength of Fly Ash Geopolymer Concrete. Mater. Des. 2014, 63, 584–592. [Google Scholar] [CrossRef] [Green Version]
- Almutairi, A.L.; Tayeh, B.A.; Adesina, A.; Isleem, H.F.; Zeyad, A.M. Potential Applications of Geopolymer Concrete in Construction: A Review. Case Stud. Constr. Mater. 2021, 15, e00733. [Google Scholar] [CrossRef]
- Davidovits, J. Properties of Geopolymer Cements. In Proceedings of the First International Conference on Alkaline Cements and Concretes, Scientific Research Institute on Binders and Materials; Kiev State Technical University: Kiev, Ukraine, 1994; pp. 131–149. Available online: http://www.geopolymer.org/wp-content/uploads/KIEV.pdf (accessed on 15 July 2023).
- Hajjaji, W.; Andrejkovičová, S.; Zanelli, C.; Alshaaer, M.; Dondi, M.; Labrincha, J.A.; Rocha, F. Composition and Technological Properties of Geopolymers Based on Metakaolin and Red Mud. Mater. Des. 2013, 52, 648–654. [Google Scholar] [CrossRef]
- Rao, F.; Liu, Q. Geopolymerization and Its Potential Application in Mine Tailings Consolidation: A Review. Miner. Process. Extr. Metall. Rev. 2015, 36, 399–409. [Google Scholar] [CrossRef]
- Yang, K.-H.; Song, J.-K.; Ashour, A.F.; Lee, E.-T. Properties of Cementless Mortars Activated by Sodium Silicate. Constr. Build. Mater. 2008, 22, 1981–1989. [Google Scholar] [CrossRef] [Green Version]
- Nath, P.; Sarker, P.K. Effect of GGBFS on Setting, Workability and Early Strength Properties of Fly Ash Geopolymer Concrete Cured in Ambient Condition. Constr. Build. Mater. 2014, 66, 163–171. [Google Scholar] [CrossRef] [Green Version]
- Hadi, M.N.S.; Farhan, N.A.; Sheikh, M.N. Design of Geopolymer Concrete with GGBFS at Ambient Curing Condition Using Taguchi Method. Constr. Build. Mater. 2017, 140, 424–431. [Google Scholar] [CrossRef] [Green Version]
- Davidovits, P.J. 30 Years of Successes and Failures in Geopolymer Applications. Market Trends and Potential Breakthroughs. In Proceedings of the Geopolymer 2002 Conference, Melbourne, Australia, 28–29 October 2002; pp. 1–16. [Google Scholar]
- Poloju, K.K.; Annadurai, S.; Manchiryal, R.K.; Goriparthi, M.R.; Baskar, P.; Prabakaran, M.; Kim, J. Analysis of Rheological Characteristic Studies of Fly-Ash-Based Geopolymer Concrete. Buildings 2023, 13, 811. [Google Scholar] [CrossRef]
- Shen, Q.; Li, B.; He, W.; Meng, X.; Shen, Y. Associated Effects of Sodium Chloride and Dihydrate Gypsum on the Mechanical Performance and Hydration Properties of Slag-Based Geopolymer. Buildings 2023, 13, 1285. [Google Scholar] [CrossRef]
- Malkawi, A.B. Effect of Aggregate on the Performance of Fly-Ash-Based Geopolymer Concrete. Buildings 2023, 13, 769. [Google Scholar] [CrossRef]
- Matalkah, F.; Xu, L.; Wu, W.; Soroushian, P. Mechanochemical Synthesis of One-Part Alkali Aluminosilicate Hydraulic Cement. Mater. Struct. 2016, 50, 97. [Google Scholar] [CrossRef]
- Hardjito, D.; Wallah, S.E.; Sumajouw, D.M.J.; Rangan, B. V Fly Ash-Based Geopolymer Concrete. Aust. J. Struct. Eng. 2005, 6, 77–86. [Google Scholar] [CrossRef] [Green Version]
- Hardjito, D.; Rangan, B.V. Development and Properties of Low-Calcium Fly Ash-Based Geopolymer Concrete. Res. Rep. GC 2005, 94. Available online: https://espace.curtin.edu.au/handle/20.500.11937/5594 (accessed on 15 July 2023).
- Luukkonen, T.; Abdollahnejad, Z.; Yliniemi, J.; Kinnunen, P.; Illikainen, M. One-Part Alkali-Activated Materials: A Review. Cem. Concr. Res. 2018, 103, 21–34. [Google Scholar] [CrossRef]
- Hajimohammadi, A.; van Deventer, J.S.J. Characterisation of One-Part Geopolymer Binders Made from Fly Ash. Waste Biomass Valorization 2017, 8, 225–233. [Google Scholar] [CrossRef]
- Nematollahi, B.; Sanjayan, J. Effect of Superplasticizers on Workability of Fly Ash Based Geopolymer. In InCIEC 2013: Proceedings of the International Civil and Infrastructure Engineering Conference 2013; Hassan, R., Yusoff, M., Ismail, Z., Amin, N.M., Fadzil, M.A., Eds.; Springer: Singapore, 2014; pp. 713–719. [Google Scholar]
- EN 196-1; Methods of Testing Cement-Part 1: Determination of Strength. TS En-CEN: Brussel, Belgium, 2016.
- ASTM C494/C494M; Standard Specification for Chemical Admixtures for Concrete, Type D-Water-Reducing and Retarding Admixtures and Type G-Water-Reducing, High Range, and Retarding Admixtures. ASTM International: West Conshohocken, PA, USA, 2019.
- Keke, S.; Xiaoqin, P.; Shuping, W.; Lu, Z. Design Method for the Mix Proportion of Geopolymer Concrete Based on the Paste Thickness of Coated Aggregate. J. Clean. Prod. 2019, 232, 508–517. [Google Scholar] [CrossRef]
- ASTM C29/C29M; Standard Test Method for Bulk Density (“Unit Weight”) and Voids in Aggregate. ASTM International: West Conshohocken, PA, USA, 2017.
- ASTM C143-78; Standard Test Method for Slump Of Portland Cement Concrete. ASTM International: West Conshohocken, PA, USA, 2017.
- ASTM C39; Concrete Cylinder Compression Testing. ASTM International: West Conshohocken, PA, USA, 2021.
- ASTM C469/C469M-10; Standard Test Method for Static Modulus of Elasticity and Poisson’s Ratio of Concrete in Compression. ASTM International: West Conshohocken, PA, USA, 2014.
- ASTM C78/C78M; Standard Test Method for Flexural Strength of Concrete. ASTM International: West Conshohocken, PA, USA, 2018.
- ASTM C496/C496M-04; Standard Test Method for Splitting Tensile Strength of Cylindrical Concrete Specimens. ASTM International: West Conshohocken, PA, USA, 2017.
- Hardjito, D. Studies on Fly Ash-Based Geopolymer Concrete. Ph.D Thesis, Curtin University of Technology, Bentley, WA, Australia, 2005. [Google Scholar]
- Nuruddin, M.F.; Demie, S.; Shafiq, N. Effect of Mix Composition on Workability and Compressive Strength of Self-Compacting Geopolymer Concrete. Can. J. Civ. Eng. 2011, 38, 1196–1203. [Google Scholar] [CrossRef]
- Nematollahi, B.; Sanjayan, J. Effect of Different Superplasticizers and Activator Combinations on Workability and Strength of Fly Ash Based Geopolymer. Mater. Des. 2014, 57, 667–672. [Google Scholar] [CrossRef]
- Lee, N.K.; Lee, H.K. Setting and Mechanical Properties of Alkali-Activated Fly Ash/Slag Concrete Manufactured at Room Temperature. Constr. Build. Mater. 2013, 47, 1201–1209. [Google Scholar] [CrossRef]
- Criado, M.; Fernández-Jiménez, A.; de la Torre, A.G.; Aranda, M.A.G.; Palomo, A. An XRD Study of the Effect of the SiO2/Na2O Ratio on the Alkali Activation of Fly Ash. Cem. Concr. Res. 2007, 37, 671–679. [Google Scholar] [CrossRef]
- Lloyd, R.R.; Provis, J.L.; van Deventer, J.S.J. Microscopy and Microanalysis of Inorganic Polymer Cements. 1: Remnant Fly Ash Particles. J. Mater. Sci. 2009, 44, 608–619. [Google Scholar] [CrossRef]
- EN 1992-1-1; Eurocode 2 Design of Concrete Structures Part 1: General Rules and Rules for Buildings. British Standard Institution: London, UK, 2004.
- ACI 209R; Prediction of Creep, Shrinkage, and Temperature Effects in Concrete Structures. In ACI Manual of Concrete. Practice Part 1: Materials and General Properties of Concrete. American Concrete Institute: Farmington Hills, MI, USA, 1992.
- Collins, F.; Sanjayan, J.G. Early Age Strength and Workability of Slag Pastes Activated by NaOH and Na2CO3. Cem. Concr. Res. 1998, 28, 655–664. [Google Scholar] [CrossRef]
- Collins, F.; Sanjayan, J.G. Early Age Strength and Workability of Slag Pastes Activated by Sodium Silicates. Mag. Concr. Res. 2001, 53, 321–326. [Google Scholar] [CrossRef]
- Fernández-Jiménez, A.; Puertas, F. Setting of Alkali-Activated Slag Cement. Influence of Activator Nature. Adv. Cem. Res. 2001, 13, 115–121. [Google Scholar] [CrossRef]
- ACI CODE-318-19; Building Code Requirements for Structural Concrete and Commentary. American Concrete Institute: Farmington Hills, MI, USA, 2019.


| FA | GBFS | |
|---|---|---|
| Physical properties | ||
| Density (kg/m3) | 2240 | 2910 |
| Surface area (cm2/g) | 3400 (Blaine) | 5220 (Blaine) |
| Chemical composition (%) | ||
| SiO2 | 58.70 | 35.02 |
| Al2O3 | 22.87 | 13.56 |
| Fe2O3 | 7.31 | 1.41 |
| CaO | 0.98 | 38.6 |
| MgO | 0.85 | 8.18 |
| Na2O | 0.33 | 0.31 |
| K2O | 3.6 | 0.80 |
| TiO2 | 1.35 | 0.23 |
| MKN | 3.53 | 1.89 |
| Stone | Sand | |
|---|---|---|
| Density in dry condition (kg/m3) | 2730 | 2630 |
| Density at surface dry saturation (kg/m3) | 2760 | 2650 |
| Volumetric mass in the compacted state (kg/m3) | 1586 | 1700 |
| Porosity in compacted state (%) | 42.9 | 35.0 |
| Surface dry saturated water absorption (%) | 0.84 | 0.75 |
| Group | Specimens | FA (kg) | GBFS (kg) | Sand (kg) | Stone (kg) | AA (kg) | W (l) | Ratio | |||
|---|---|---|---|---|---|---|---|---|---|---|---|
| AA/B | W/B | H2O/Na2O | SP | ||||||||
| A | AA0.04-W0.45 | 100 | 300 | 640 | 1220 | 16 | 180 | 0.04 | 0.45 | 27.90 | 0 |
| AA0.06-W0.45 | 100 | 300 | 640 | 1220 | 24 | 180 | 0.06 | 0.45 | 19.90 | 0 | |
| AA0.08-W0.45 | 100 | 300 | 640 | 1220 | 32 | 180 | 0.08 | 0.45 | 17.44 | 0 | |
| AA0.10-W0.45 | 100 | 300 | 640 | 1220 | 40 | 180 | 0.10 | 0.45 | 12.60 | 0 | |
| AA0.12-W0.45 | 100 | 300 | 640 | 1220 | 48 | 180 | 0.12 | 0.45 | 10.80 | 0 | |
| B | AA0.08-W0.52 | 100 | 300 | 640 | 1220 | 32 | 208 | 0.08 | 0.52 | 23.09 | 0 |
| AA0.08-W0.48 | 100 | 300 | 640 | 1220 | 32 | 192 | 0.08 | 0.48 | 21.31 | 0 | |
| AA0.08-W0.45 | 100 | 300 | 640 | 1220 | 32 | 180 | 0.08 | 0.45 | 17.44 | 0 | |
| AA0.08-W0.43 | 100 | 300 | 640 | 1220 | 32 | 172 | 0.08 | 0.43 | 16.66 | 0 | |
| AA0.08-W0.43-SP1.0 | 100 | 300 | 640 | 1220 | 32 | 172 | 0.08 | 0.43 | 16.66 | 1.0 | |
| AA0.08-W0.41-SP1.0 | 100 | 300 | 640 | 1220 | 32 | 164 | 0.08 | 0.41 | 15.12 | 1.0 | |
| AA0.08-W0.41-SP1.5 | 100 | 300 | 640 | 1220 | 32 | 164 | 0.08 | 0.41 | 15.12 | 1.5 | |
| AA0.08-W0.39-SP1.5 | 100 | 300 | 640 | 1220 | 32 | 156 | 0.08 | 0.39 | 13.96 | 1.5 | |
| AA0.08-W0.39-SP2.0 | 100 | 300 | 640 | 1220 | 32 | 156 | 0.08 | 0.39 | 13.96 | 2.0 | |
| AA0.08-W0.37-SP2.0 | 100 | 300 | 640 | 1220 | 32 | 148 | 0.08 | 0.37 | 12.15 | 2.0 | |
| AA0.08-W0.37-SP2.5 | 100 | 300 | 640 | 1220 | 32 | 148 | 0.08 | 0.37 | 12.15 | 2.5 | |
| Testing Type | Specimen Shape and Size (mm) | Day of Testing | Illustration |
|---|---|---|---|
| Compressive strength | Cylinder 150 × 300 | 3, 7, 28 |  |
| Flexural tensile strength | Prism 100 × 100 × 400 | 7, 28 |  |
| Splitting tensile strength | Cylinder 150 × 300 | 7, 28 |  |
| Axial tensile strength | Prism 60 × 100 × 400 | 7, 28 |  |
| Modulus of elasticity | Cylinder 150 × 300 | 7, 28 |  |
| Group | Specimens | Ratio | Slump (cm) | COV | 3 Days | 7 Days | 28 Days | |||||||
|---|---|---|---|---|---|---|---|---|---|---|---|---|---|---|
| AA/B | W/B | H2O/ Na2O | SP (%) | f’c (MPa) | COV | f’c (MPa) | COV | f’c (MPa) | COV | |||||
| A | AA0.04-W0.45 | 0.04 | 0.45 | 27.90 | 0 | 12.0 | 4.4% | 10.5 | 7.2% | 19.3 | 3.6% | 23.6 | 5.7% | |
| AA0.06-W0.45 | 0.06 | 0.45 | 19.90 | 0 | 12.5 | 6.9% | 15.6 | 5.1% | 23.7 | 2.6% | 30.4 | 3.2% | ||
| AA0.08-W0.45 | 0.08 | 0.45 | 17.44 | 0 | 11.5 | 3.8% | 27.3 | 6.4% | 33.6 | 3.9% | 38.3 | 2.6% | ||
| AA0.10-W0.45 | 0.10 | 0.45 | 12.60 | 0 | 12.0 | 5.0% | 30.6 | 4.4% | 40.2 | 4.4% | 47.1 | 3.7% | ||
| AA0.12-W0.45 | 0.12 | 0.45 | 10.80 | 0 | 1.5 | 6.7% | N/A | |||||||
| B | AA0.08-W0.52 | 0.08 | 0.52 | 23.09 | 0 | 23.0 | 3.9% | 21 | 4.7% | 26.3 | 2.4% | 30.9 | 4.4% | |
| AA0.08-W0.48 | 0.08 | 0.48 | 21.31 | 0 | 18.0 | 1.7% | 25.4 | 6.6% | 31.9 | 5.2% | 36.2 | 4.8% | ||
| AA0.08-W0.45 | 0.08 | 0.45 | 17.44 | 0 | 11.5 | 4.0% | 27.3 | 3.1% | 33.6 | 4.3% | 38.3 | 1.8% | ||
| AA0.08-W0.43 | 0.08 | 0.43 | 16.66 | 0 | 6.0 | 4.4% | 33.6 | 3.9% | 43.5 | 3.4% | 49.7 | 3.1% | ||
| AA0.08-W0.43-SP1.0 | 0.08 | 0.43 | 16.66 | 1.0 | 12.0 | 2.2% | 33.9 | 3.9% | 38.6 | 3.9% | 45.1 | 5.7% | ||
| AA0.08-W0.41-SP1.0 | 0.08 | 0.41 | 15.12 | 1.0 | 7.0 | 4.3% | 35.6 | 1.3% | 47.2 | 2.6% | 52.6 | 2.7% | ||
| AA0.08-W0.41-SP1.5 | 0.08 | 0.41 | 15.12 | 1.5 | 13.5 | 3.7% | 34.9 | 4.2% | 46.8 | 4.3% | 51.7 | 3.0% | ||
| AA0.08-W0.39-SP1.5 | 0.08 | 0.39 | 13.96 | 1.5 | 6.0 | 2.9% | 36.9 | 4.0% | 52.1 | 3.2% | 56.3 | 3.1% | ||
| AA0.08-W0.39-SP2.0 | 0.08 | 0.39 | 13.96 | 2.0 | 14.5 | 4.8% | 36.7 | 5.7% | 51.6 | 4.3% | 55.7 | 2.8% | ||
| AA0.08-W0.37-SP2.0 | 0.08 | 0.37 | 12.15 | 2.0 | 5.0 | 2.0% | 38.7 | 3.9% | 54.3 | 1.4% | 59.2 | 1.5% | ||
| AA0.08-W0.37-SP2.5 | 0.08 | 0.37 | 12.15 | 2.5 | 0.0 | N/A | N/A | |||||||
| Specimens | Testing Type | 7 Days | 28 Days | ||
|---|---|---|---|---|---|
| Value (MPa) | COV | Value (MPa) | COV | ||
| AA0.06-W0.45 | Flexural test | 2.70 | 3.7% | 3.60 | 4.8% |
| Splitting test | 2.42 | 1.9% | 3.34 | 3.2% | |
| Tensile test | 1.84 | 9.5% | 2.24 | 8.1% | |
| AA0.08-W0.45 | Flexural test | 3.78 | 2.8% | 4.40 | 2.3% |
| Splitting test | 3.45 | 1.5% | 3.98 | 2.7% | |
| Tensile test | 2.39 | 11.6% | 2.72 | 3.5% | |
| AA0.10-W0.45 | Flexural test | 4.45 | 3.0% | 5.40 | 3.2% |
| Splitting test | 4.14 | 2.8% | 4.70 | 2.8% | |
| Tensile test | 2.81 | 3.4% | 3.42 | 6.7% | |
| Specimens | 7 Days | 28 Days | ||
|---|---|---|---|---|
| E (GPa) | COV | E (GPa) | COV | |
| AA0.06-W0.45 | 23.4 | 1.0% | 27.6 | 0.5% |
| AA0.08-W0.45 | 28.1 | 0.7% | 32.0 | 0.8% |
| AA0.10-W0.45 | 32.5 | 0.4% | 37.2 | 1.4% |
Disclaimer/Publisher’s Note: The statements, opinions and data contained in all publications are solely those of the individual author(s) and contributor(s) and not of MDPI and/or the editor(s). MDPI and/or the editor(s) disclaim responsibility for any injury to people or property resulting from any ideas, methods, instructions or products referred to in the content. |
© 2023 by the authors. Licensee MDPI, Basel, Switzerland. This article is an open access article distributed under the terms and conditions of the Creative Commons Attribution (CC BY) license (https://creativecommons.org/licenses/by/4.0/).
Share and Cite
Pham, T.-T.; Nguyen, N.-L.; Nguyen, T.-T.; Nguyen, T.-T.; Pham, T.-H. Effects of Superplasticizer and Water–Binder Ratio on Mechanical Properties of One-Part Alkali-Activated Geopolymer Concrete. Buildings 2023, 13, 1835. https://doi.org/10.3390/buildings13071835
Pham T-T, Nguyen N-L, Nguyen T-T, Nguyen T-T, Pham T-H. Effects of Superplasticizer and Water–Binder Ratio on Mechanical Properties of One-Part Alkali-Activated Geopolymer Concrete. Buildings. 2023; 13(7):1835. https://doi.org/10.3390/buildings13071835
Chicago/Turabian StylePham, Thanh-Tung, Ngoc-Linh Nguyen, Tuan-Trung Nguyen, Trung-Tu Nguyen, and Thai-Hoan Pham. 2023. "Effects of Superplasticizer and Water–Binder Ratio on Mechanical Properties of One-Part Alkali-Activated Geopolymer Concrete" Buildings 13, no. 7: 1835. https://doi.org/10.3390/buildings13071835