Article

Resuspension of Seeded Particles Containing Live Influenza A Virus in a Full-Scale Laboratory

by
Mahender Singh Rawat
1,
Alan D. Roberts
2,
Deborah M. Brown
2 and
Andrea R. Ferro
1,*
1
Department of Civil and Environmental Engineering, Clarkson University, Potsdam, NY 13699, USA
2
Trudeau Institute, 154 Algonquin Avenue, Saranac Lake, NY 12983, USA
*
Author to whom correspondence should be addressed.
Buildings 2023, 13(7), 1734; https://doi.org/10.3390/buildings13071734
Submission received: 8 April 2023 / Revised: 4 July 2023 / Accepted: 5 July 2023 / Published: 8 July 2023
(This article belongs to the Special Issue Advances in the Indoor Environments and Respiratory Health)

Abstract

:
Many respiratory viruses, including influenza and SARS-CoV-2, are transmitted via the emission and inhalation of infectious respiratory aerosols in indoor environments. Resuspended particles from indoor surfaces and clothing can be a major source of airborne microbiological contaminants in indoor environments; however, it is unknown whether resuspended viruses contribute substantially to disease transmission. In this study, we investigated the resuspension via human walking activity of influenza A virus H3N2 laboratory strain, which was generated through a nebulizer into a sealed, unventilated biosafety level 2 (BSL-2) laboratory. The mean airborne viral concentrations following the resuspension events ( 3.7 × 10 3 viral RNA copies m 3 ) were two orders of magnitude lower than those following direct emission via the nebulizer ( 1.1 × 10 5 viral RNA copies m 3 ). The calculated resuspension emission factor (normalized ratio of the airborne mass to mass available for resuspension on the surface) of 10 3 was similar to reported values for 1–2 μ m particles. Thus, depending on the infectious dose and viability of the virus, resuspension of settled respiratory viruses could lead to transmission, but the risk appears to be much lower than for direct respiratory emissions. To our knowledge, this is the first full-scale experimental study designed to quantify virus resuspension.

Graphical Abstract

1. Introduction

Epidemics caused by viral infections, such as the ongoing COVID-19 pandemic and previous outbreaks of the severe acute respiratory syndrome (SARS) in 2003, H1N1 influenza in 2009, and Middle East respiratory syndrome (MERS) in 2014, have highlighted the significance of airborne transmission of contagious diseases through respiratory droplets and aerosols. This mode of transmission is particularly important for indoor settings with limited ventilation in which respiratory aerosol concentrations can build up [1,2]. Exposure to biological aerosols may result in detrimental health outcomes, such as respiratory, neurological, and cardiovascular ailments [3]. According to the World Health Organization (WHO), COVID-19 had resulted in approximately 6.87 million fatalities and around 761 million recorded cases of infection as of March 2023 [4]. To understand the impact of the disease and infection caused by inhaled pathogens, it is important to understand the emission source, the survival rate of the pathogen in the environment, the mode of transmission, as well as the dose, duration, and route of exposure. While many studies have investigated the transmission risk from respiratory virus emissions [5], the transmission risk from direct resuspension of infectious viruses that have previously settled onto surfaces is unknown.
Once emitted into the indoor air, respiratory aerosols undergo evaporation, reducing their size, and are removed from the air over minutes to hours via ventilation, filtration, and deposition onto surfaces [5]. Human activities such as walking, sitting on furniture, and cleaning can resuspend settled particles back into the air [6]. Many studies have been conducted to characterize particle resuspension from human activity [7]. Summarizing the resuspension emission rates reported by previous studies, Ferro (2022) [7] showed that emission rates vary over several orders of magnitude, even for the same size particles. For example, the reported resuspension emission rates for 1 μ m particles range from 10 2 to 10 2   mg min 1 for full-scale studies.
Resuspension is a major source of airborne bacteria and fungi in classrooms and other indoor microenvironments [8,9]. Similar to other indoor aerosol sources, the concentrations are the highest closest to the source. Khare and Marr (2015) [10] simulated the resuspension of influenza virus in dust via human walking and estimated that the concentration of the resuspended virus would be higher closer to the floor than at breathing height. Hyytiainen et al. (2018) [11] reported that bacteria and fungal levels were 8 to 21 fold higher in the breathing zone of a crawling infant robot compared to those measured in the breathing zone of an adult. Numerous other investigations on the resuspension of bioaerosols, primarily bacteria and fungi, have been conducted within the last two decades [9,12,13,14,15,16,17,18]. However, the resuspension of viruses or particles containing viruses via human activity has not been studied experimentally.
Particle size is a primary factor for determining particle resuspension from human activity [6]. Within the particle size range most relevant to human health (particle diameter, or Dp, 10 μ m and smaller), larger particles resuspend more easily from surfaces than smaller particles. This is because of their smaller ratio of the adhesive force to the detachment force when an external detachment force, such as the squeezed flow beneath a footstep, is applied [6,19]. Therefore, due to the relatively small size of viruses (Dp 20–200 nm), we expect the resuspension fraction (fraction of particles on the surface that are resuspended) for viruses to be less than that for larger bioaerosols, such as bacteria and fungi. However, the viral particles are associated with larger carrier particles due to the initial emission of liquid respiratory aerosol as well as the interaction of the liquid aerosol with other existing indoor particles. Therefore, the transport, deposition, and resuspension dynamics of viruses are governed by the properties of the carrier particles. The size distribution and composition of respiratory viral aerosol emissions have been well characterized [5,20,21,22,23], but characterization of the carrier particles for resuspended viruses has not been reported in the literature.
The survival rate of different viruses in aerosols and on different surfaces is also an important factor for assessing the importance of virus resuspension, with inactivation dependent on temperature, relative humidity (RH), and ultraviolet radiation [24,25]. Yang and Marr (2011) [26] developed a material balance model with inactivation as an additional loss term to predict infectious influenza resuspension due to human walking. Using a mechanistic biochemical model of virus inactivation kinetics, Morris et al. (2021) [24] demonstrated that viral inactivation rates for SARS-CoV-2, influenza, and other enveloped viruses are dependent on both temperature and RH, with shorter survival times for enveloped viruses at higher temperatures and RH above a threshold relative humidity. Van Doremalen et al. (2020) [27] studied the stability of SARS-CoV-1 and SARS-CoV-2 in the laboratory and concluded that these viruses can remain viable and infectious for hours in aerosols and up to days on surfaces. Although determining the infectivity of viruses in aerosols in the field is challenging due to the sensitivity of the viruses to the collection and analysis methods, several studies have found infectious SARS-CoV-2 in aerosols in environments with infected patients [28,29,30,31].
There is additional evidence that viral resuspension could be an important exposure pathway. A study by Asadi et al. (2020) [32] found that influenza-spiked dust on the fur of guinea pigs was resuspended by the movement of the guinea pigs and the resuspended virus was transmitted to guinea pigs in adjacent cages. Furthermore, Liu et al. (2020) [33] found relatively high virus concentrations in hospital staff changing rooms and bathrooms compared with patient rooms, suggesting that some resuspension due to human activity occurred. Thus, further investigation of viral resuspension is important to quantify this exposure pathway for humans.
The present study addresses the need for experimental investigation into virus resuspension. In this study, we nebulized a buffer solution containing live influenza A virus into a full-scale laboratory. After allowing the particles to settle onto indoor surfaces, one person entered the room to resuspend the particles. We measured the airborne concentrations of viruses during the initial emission period and the resuspension activity periods to quantify and determine the relative importance of the resuspension source as compared with direct emission.

2. Materials and Methods

We conducted this study during July–August 2021 in a biosafety level 2 (BSL-2) laboratory at Trudeau Institute, Saranac Lake, NY. The study protocol was approved for BSL-2, which was required due to the use of a live infectious virus (Approval number B-384-21, Trudeau Institute). The experimental setup consisted of nebulizing liquid phosphate bovine serum (PBS) particles containing live virions of influenza A virus x31 H3N2 strain into a 70 m 3 laboratory room. After the nebulized virus-laden particles were allowed to settle for 5.0 ± 0.2 h, an investigator entered, carefully conducted sampling activities for approximately 10 min to collect the pre-resuspension samples and initiate the resuspension samples, and then walked continuously in the room for 20 min to resuspend the particles. We collected the viral particles in impingers and on deposition plates at multiple locations inside the room (Figure 1 and Figure 2) during and for approximately 5 h after the virus emission period as well as during and for approximately 5 h 
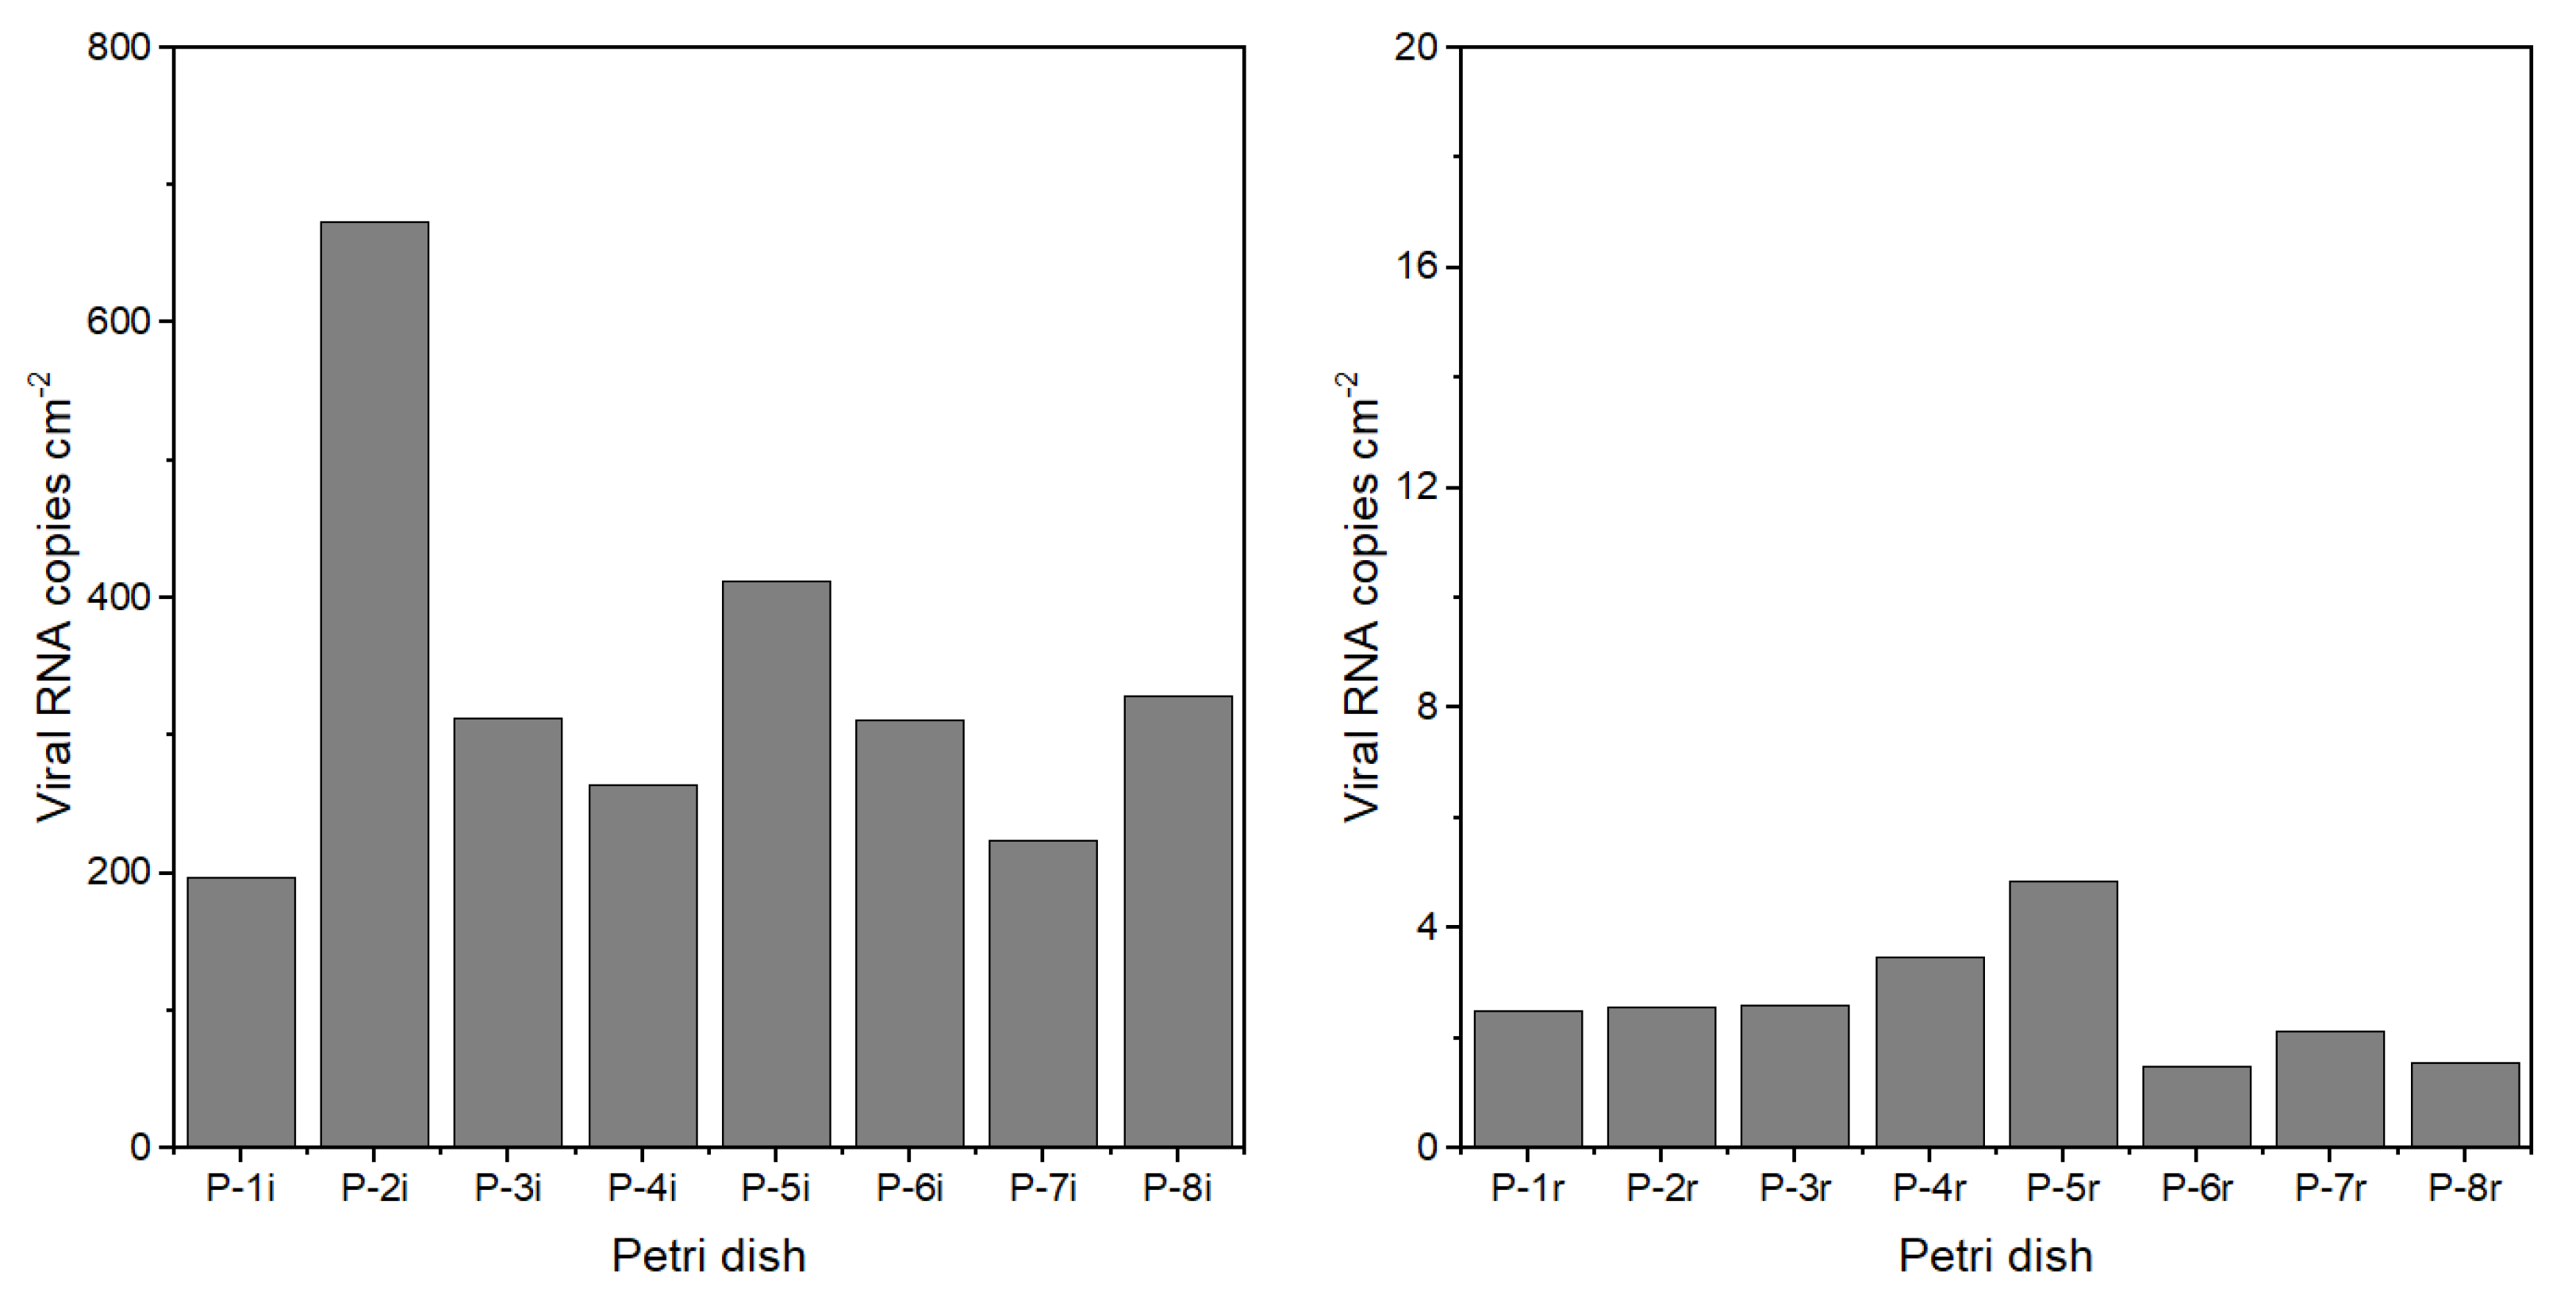
after the resuspension activity and compared the results. The experiments were conducted first with clean surfaces such that the nebulized viral aerosol would deposit directly onto the surfaces (clean surface condition). The experiments were also conducted after the emission and deposition of inorganic test dust such that some of the nebulized aerosols would deposit onto the settled dust before the resuspension activity (dusty surface condition). Prior to the clean surface condition and dusty surface condition experiments, an initial experiment was performed that included only the nebulized aerosol emission and no resuspension activity (no resuspension condition).

2.1. Room Preparation and Decontamination

Figure 2 provides a schematic of the 7.1 m (L) × 3.5 m (W) × 2.8 m (H) room with vinyl tile flooring used for the study. In accordance with the biosafety protocol, the room ventilation system was turned off and covered with plastic sheeting. Before starting the experiments, we removed all portable laboratory equipment and covered the walls, cabinets lining the wall, and non-portable laboratory equipment with plastic sheeting to avoid viral contamination of the non-target surfaces. We expect there were additional particle losses to the plastic sheeting compared with a more conductive material such as aluminum foil [34]. The particle deposition rate, which accounts for the deposition on all surfaces in the room, was estimated from the particle concentration time series and incorporated in the resuspension modeling, as described below in Section 2.10.
Using additional plastic sheeting, we created an ante-chamber inside the laboratory by the door to the hallway. The ante-chamber was used as a doffing area for personal protective equipment (PPE) worn inside the experimental area and as a staging area for the air sampling. Accounting for the benches, cabinets, large equipment, and volume separated by sheeting, the mixing volume of the room was estimated to be 46 m 3 . Before the experiments, all the surfaces in the room were wiped down using a mop (floor) and sponge (benchtop) with 70 % lab-prepared ethanol solution. Following the experiments, all the surfaces inside the room were thoroughly cleaned with disinfectant (Quatricide PV-15, Pharmacal, Waterbury, CT, USA).

2.2. Virus Generation and Sampling

Liquid aerosol containing influenza A x31 H3N2 strain was generated at a height of 1.3 m using a 0.28 L stainless steel nebulizer. We placed 7 mL of virus stock in the nebulizer, which had a concentration of 1.43  ×  10 8   50 % egg infectious dose EID 50   mL 1 for a total of 1 ×  10 9   EID 50 . Approximately 3 mL of the stock solution was nebulized, resulting in a maximum nebulized amount of 4.3  ×  10 8   EID 50 . Pressurized air at 137.9 kPa was provided to the nebulizer by a compressed air cylinder stored in the adjacent room and connected to the nebulizer via tubing. The nebulizer was run for 30 min, resulting in an emission rate of 1.4  ×  10 7 viral RNA copies min 1 . To deposit a sufficient number of viruses on the flooring such that virus resuspension from human walking could be quantified, the emission rate is approximately 100 times higher than estimates for respiratory viral emissions for a single, infected person. As a comparison, Stadnytskyi et al. (2020) [35] estimated the viral emission rate for a person speaking who is infected with SARS-CoV-2 to be 10 5 copies min 1 based on respiratory aerosol emissions and viral content in the sputum; Ma et al. (2021) [36] estimated SARS-CoV-2 viral emission to be 2 ×  10 3 –4 ×  10 5 copies min 1 from 52 exhaled breath condensate samples collected from 49 patients; and Wang et al. (2020) [37] estimated the SARS-CoV-2 emissions from a single cough to be 10 5 copies.
The particle volume (and mass) size distribution measured in the laboratory during the virus emission period ranged from 0.5 to 5 μ m, a mean particle volume diameter of 2 μ m, and a mean particle number diameter of 0.5   μ m. The influenza A virus, contained within the nebulized PBS, is 80–120 μ m [38]. Supplementary Information Figure S1A,B provides detailed information regarding the particle size distributions of the nebulized aerosol without dust. Additionally, Supplementary Information Figure S2B,E presents the particle size distributions for the nebulized aerosol and dust.
The viral aerosol was collected by 3 Glass Midget Impingers (SKC Inc., Eighty Four, PA, USA) containing 7 mL PBS. The impingers were placed along the center aisle of the room 0.79 m behind the nebulizer and 1.6 m and 3.4 m in front of the nebulizer, all at a height of 1.5 m . The impinger pumps were calibrated to the target flow rate of 3 L m 1 prior to each experiment with a DryCal DC-Lite primary flow meter (BIOS International Corporation, NJ, USA), and the pump flow rates were checked at the beginning and end of each experiment. The impinger pumps for the initial virus emission samples were turned on prior to the nebulizer and turned off at the beginning of the resuspension activity. The impinger pumps for the resuspension activity samples were turned on at the beginning of the resuspension activity and turned off after approximately 5.5 h. The individual pump flow rates and sampling times are provided in Supplementary Information Tables S1–S3.
Deposition samples were collected with 60 mm diameter Petri dishes (Falcon standard tissue culture dishes) containing 2 mL of PBS placed in 8 different locations throughout the room (Figure 2). The viral RNA copies per mL were multiplied by 2 mL and divided by the area of the Petri dish to determine the viral loading (viral RNA copies cm 2 ).

2.3. Test Dust Generation

Most indoor surfaces have a layer of dust on them. Based on particle adhesion theory and results from previous experimental studies, resuspension can be enhanced for multilayer deposits compared with monolayer deposits [39,40]. Thus, for the current study, we simulated a dusty surface condition and compared the results with those for the clean surface condition. A solid aerosol generator model 410 by TOPAS GmbH was used to introduce a total of 6 g of ISO 12103-1 A1 ultrafine test dust into the room at a feed rate of 2.5 and pressure level set at 137.9 kPa for 40 min. Assuming approximately 55% of the emitted dust deposited on the indoor surfaces versus removal via air exchange, and 80% of the deposited dust settled on horizontal surfaces, the estimated dust loading was 0.2 g m 2 . This is within the range of typical dust loading values reported in the literature for hard flooring in real environments of 0.1–1 g m 2 [39,41,42].
The dust has a volume particle size range of 0.1 to 10 μ m in diameter, with a mean volume (and mass) particle diameter of 5 μ m and a mean particle number diameter of 0.5   μ m. Following the emission, we allowed the generated dust to mix in the room air and settle for 1.5 h before generating the virus (as described in the previous section). During the 1.5 h decay period, most of the test dust particles had settled onto surfaces or were removed via the air exchange. As measured by a TSI (Shoreline, MN, USA) Model 3321 aerodynamic particle sizer (APS), the mass concentration of PM 20 had decreased by 97%, PM 10 had decreased by 88%, and PM 1 had decreased by 86% when the virus was emitted. The particle size distribution plot for the generated dust aerosol is provided in the Supplementary Information Figure S2A,D.

2.4. Aerosol Monitoring

An array of aerosol monitors was placed in the room, including the TSI APS and five PurpleAir (Draper, UT, USA) Model PA-II low-cost particle monitors (LCPMs). The APS uses time-of-flight technology to count and size particles aerodynamically from 0.5–20 μ m as well as a light scattering to estimate the particle concentration from 0.37–20 μ m. The APS sample time was set to 1 min. Given the experimental conditions, the liquid particles would be expected to reach equilibrium by the time they are measured by the APS [20]. The PurpleAir LCPMs use optical sensors to estimate PM 1 , PM 2.5 , and PM 10 with a sampling time of approximately 1 min. The values included in our analyses are for PM 2.5 . The APS and LCPMs were turned on two hours before the release of aerosol into the room and turned off the morning after the experiment.
The APS and LCPMs were used to determine the aerosol concentration throughout the room during the different phases of the experiment. A collocation experiment was conducted with the APS and the LCPMs placed together to compare and adjust the calibration of the LCPMs so that they could be directly compared during the experiments to assess the mixing conditions of the room (see Supplementary Information Figures S3 and S4).

2.5. Relative Humidity, Temperature, and Carbon Dioxide Measurement

Relative humidity and temperature were measured using Onset (Bourne, MA, USA) HOBO Model X 100 011 temperature/RH data loggers. During the experiments, the temperature (30 ± 1.5 ° C) and RH ( 45.6 ± 2.5 %) remained relatively constant. The laboratory was on the north side of the building and there was no direct sunlight coming into the room. Carbon dioxide (CO2) was measured in two locations in the room using Telaire (Amphenol Advanced Sensors, St. Marys, PA, USA) Model T7000 Series handheld indoor air quality (IAQ) monitors. CO2 was used to determine the air change rate in the room. We emitted CO2 into the room by opening a container of dry ice for 5–10 min to increase the CO2 levels. We turned on a fan during the emission period to improve mixing conditions in the room. After the emission, we let the concentration decay for 1 h. We performed this experiment 3 times on three different days. We estimated the air change rate in the room to be 0.38 ± 0.11 h−1 using the slope of the natural log of the CO2 concentration decay. The air change rate was also determined during the resuspension experiments using the decay of the CO2 increase from the human occupant respiratory emissions.

2.6. Experimental Protocol for Initial Virus Emission and Resuspension Activity

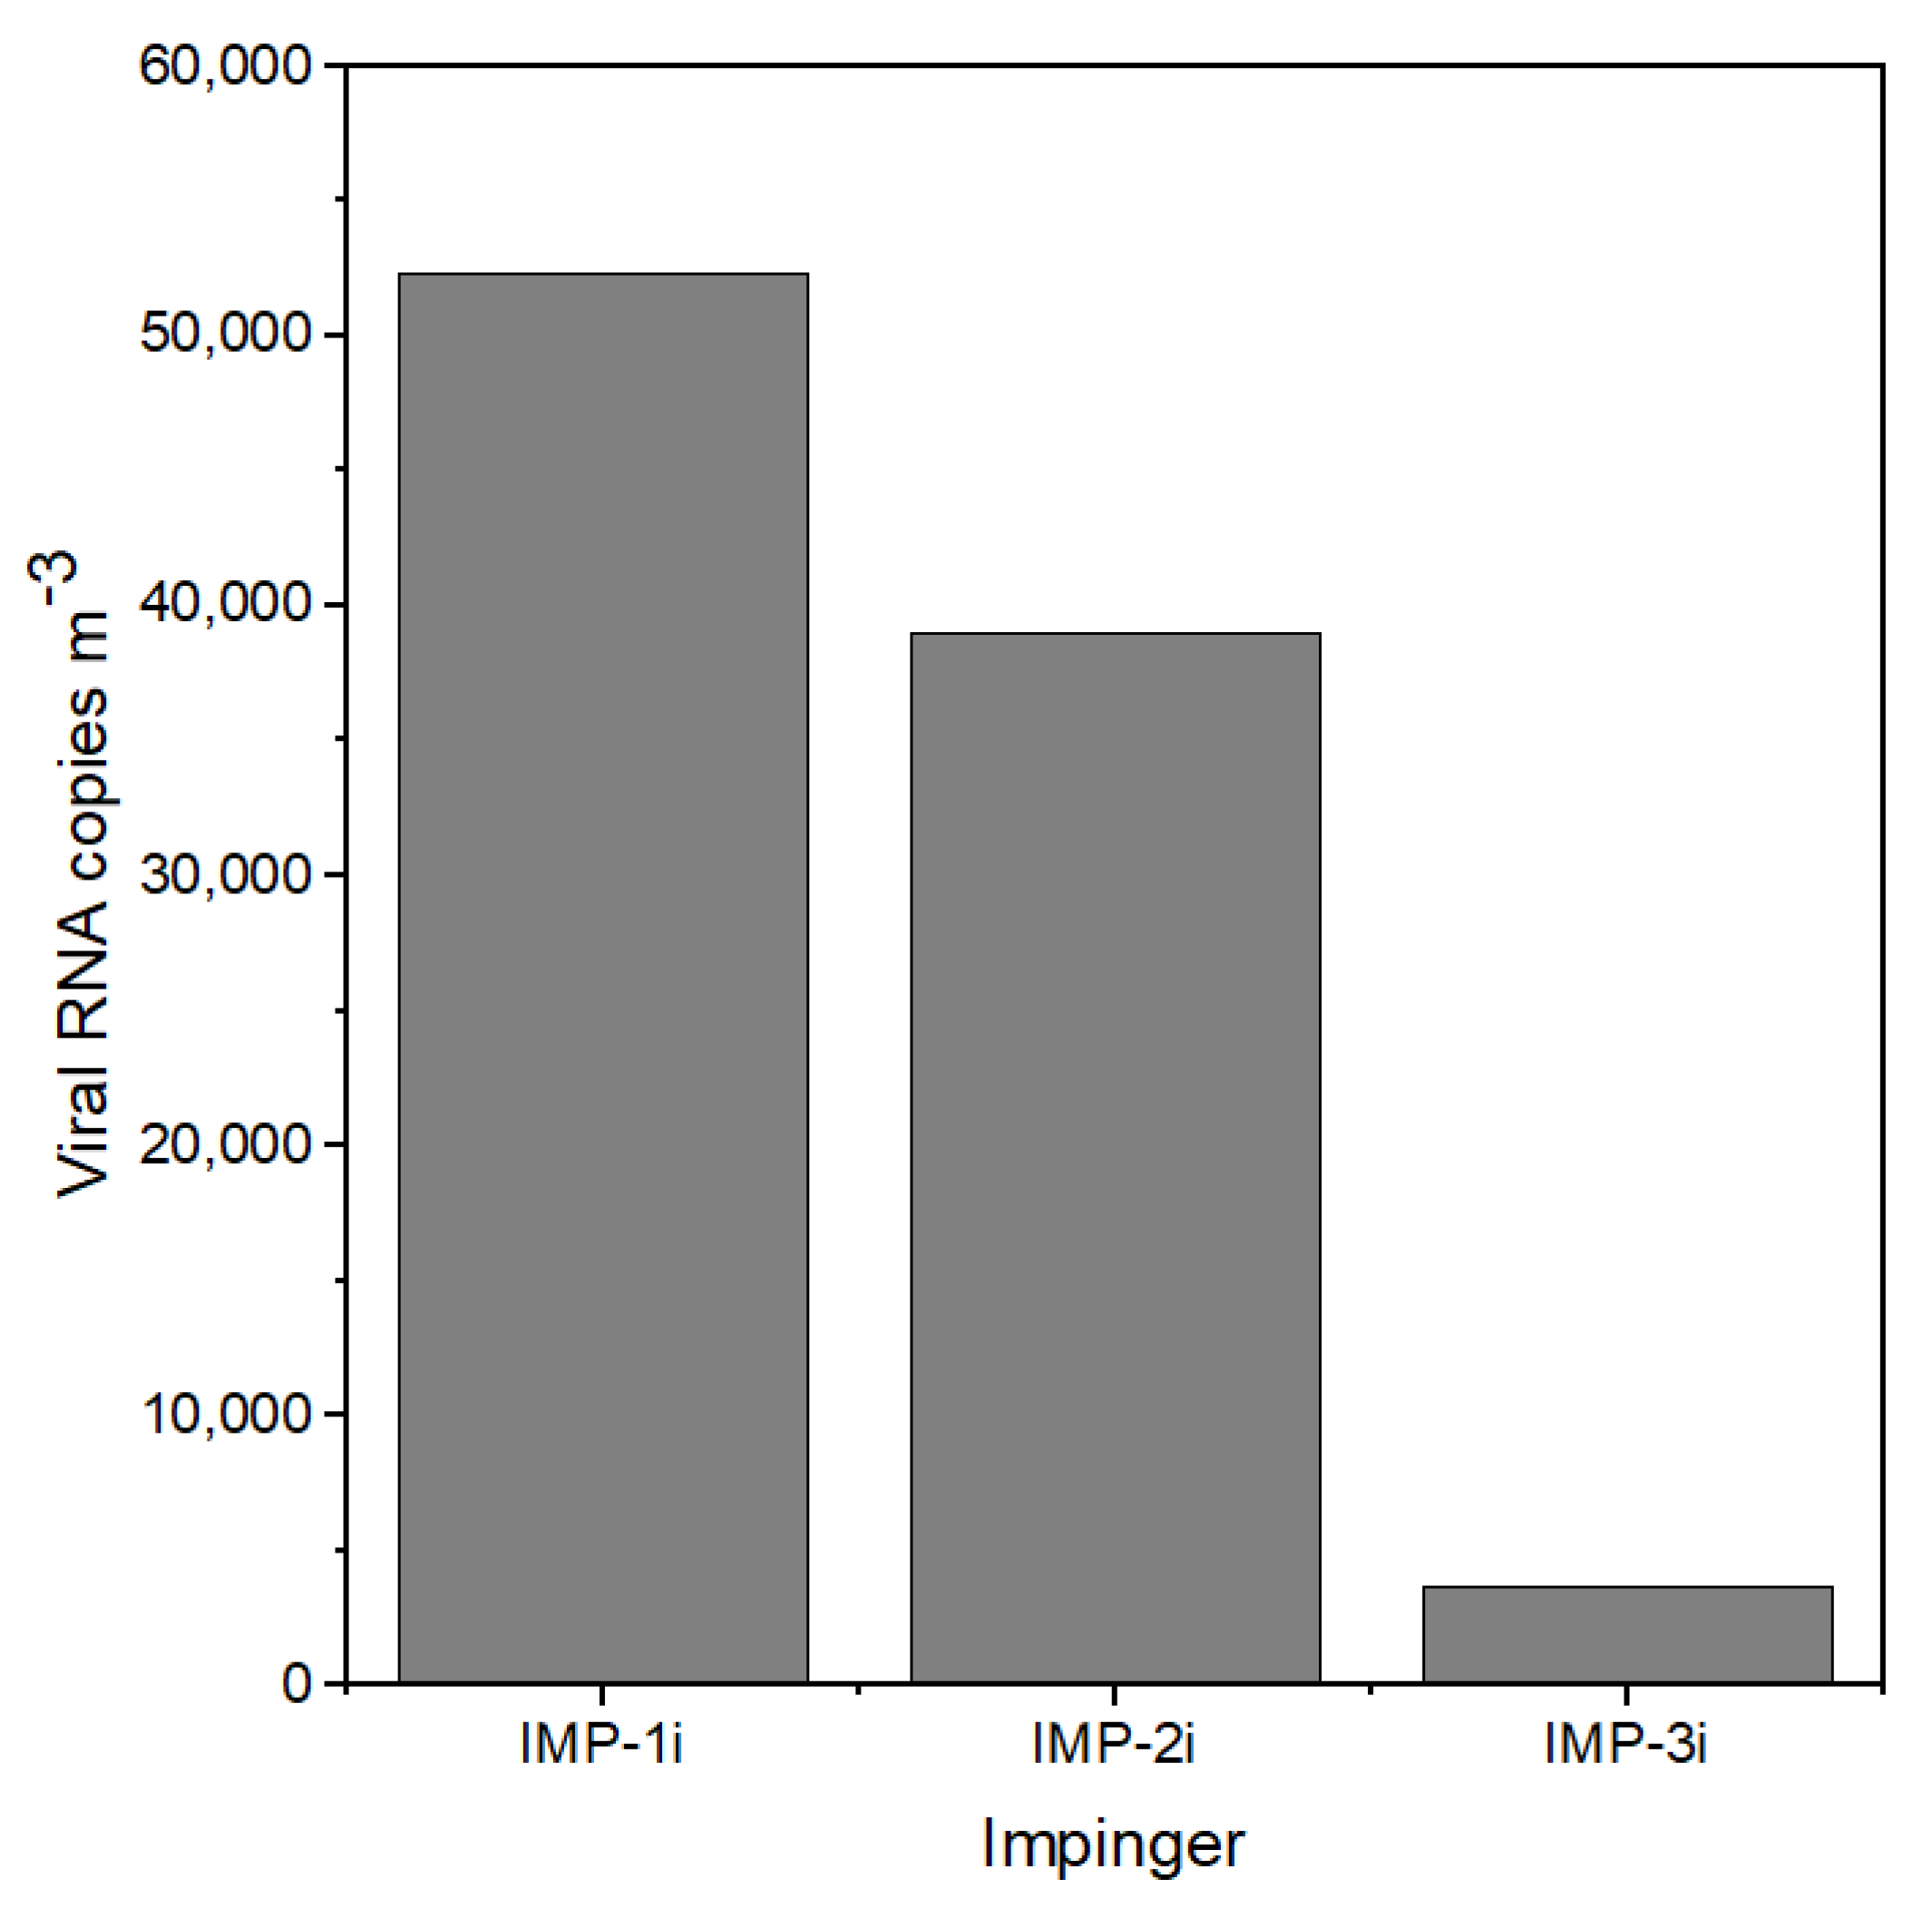
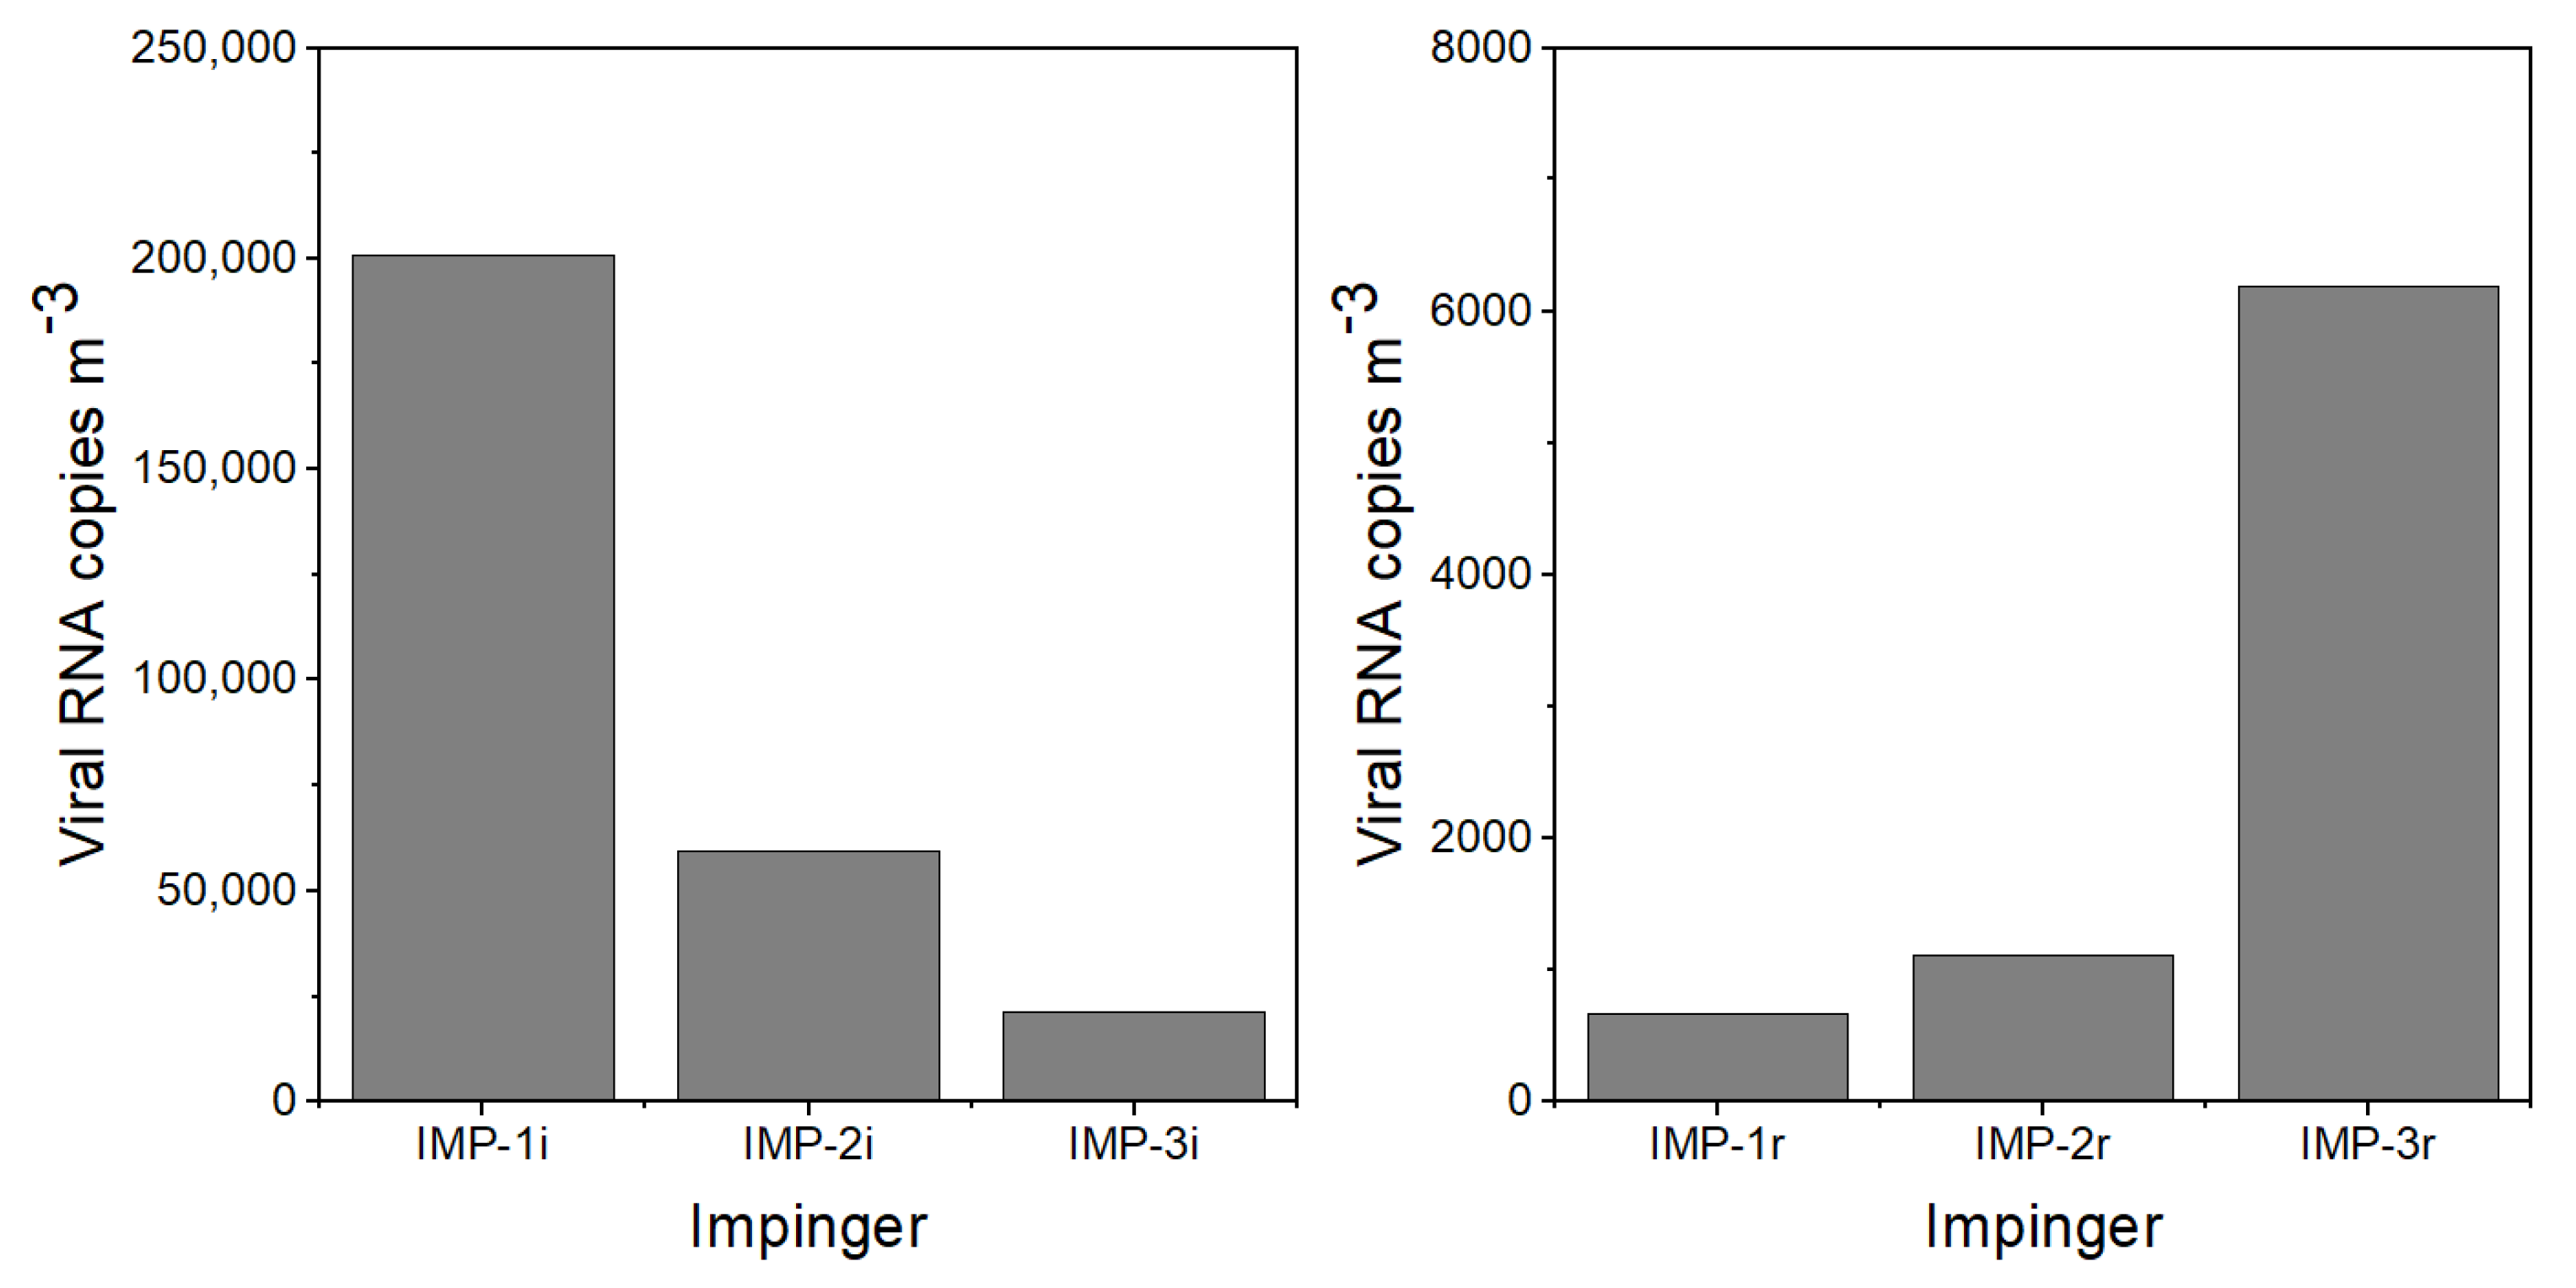
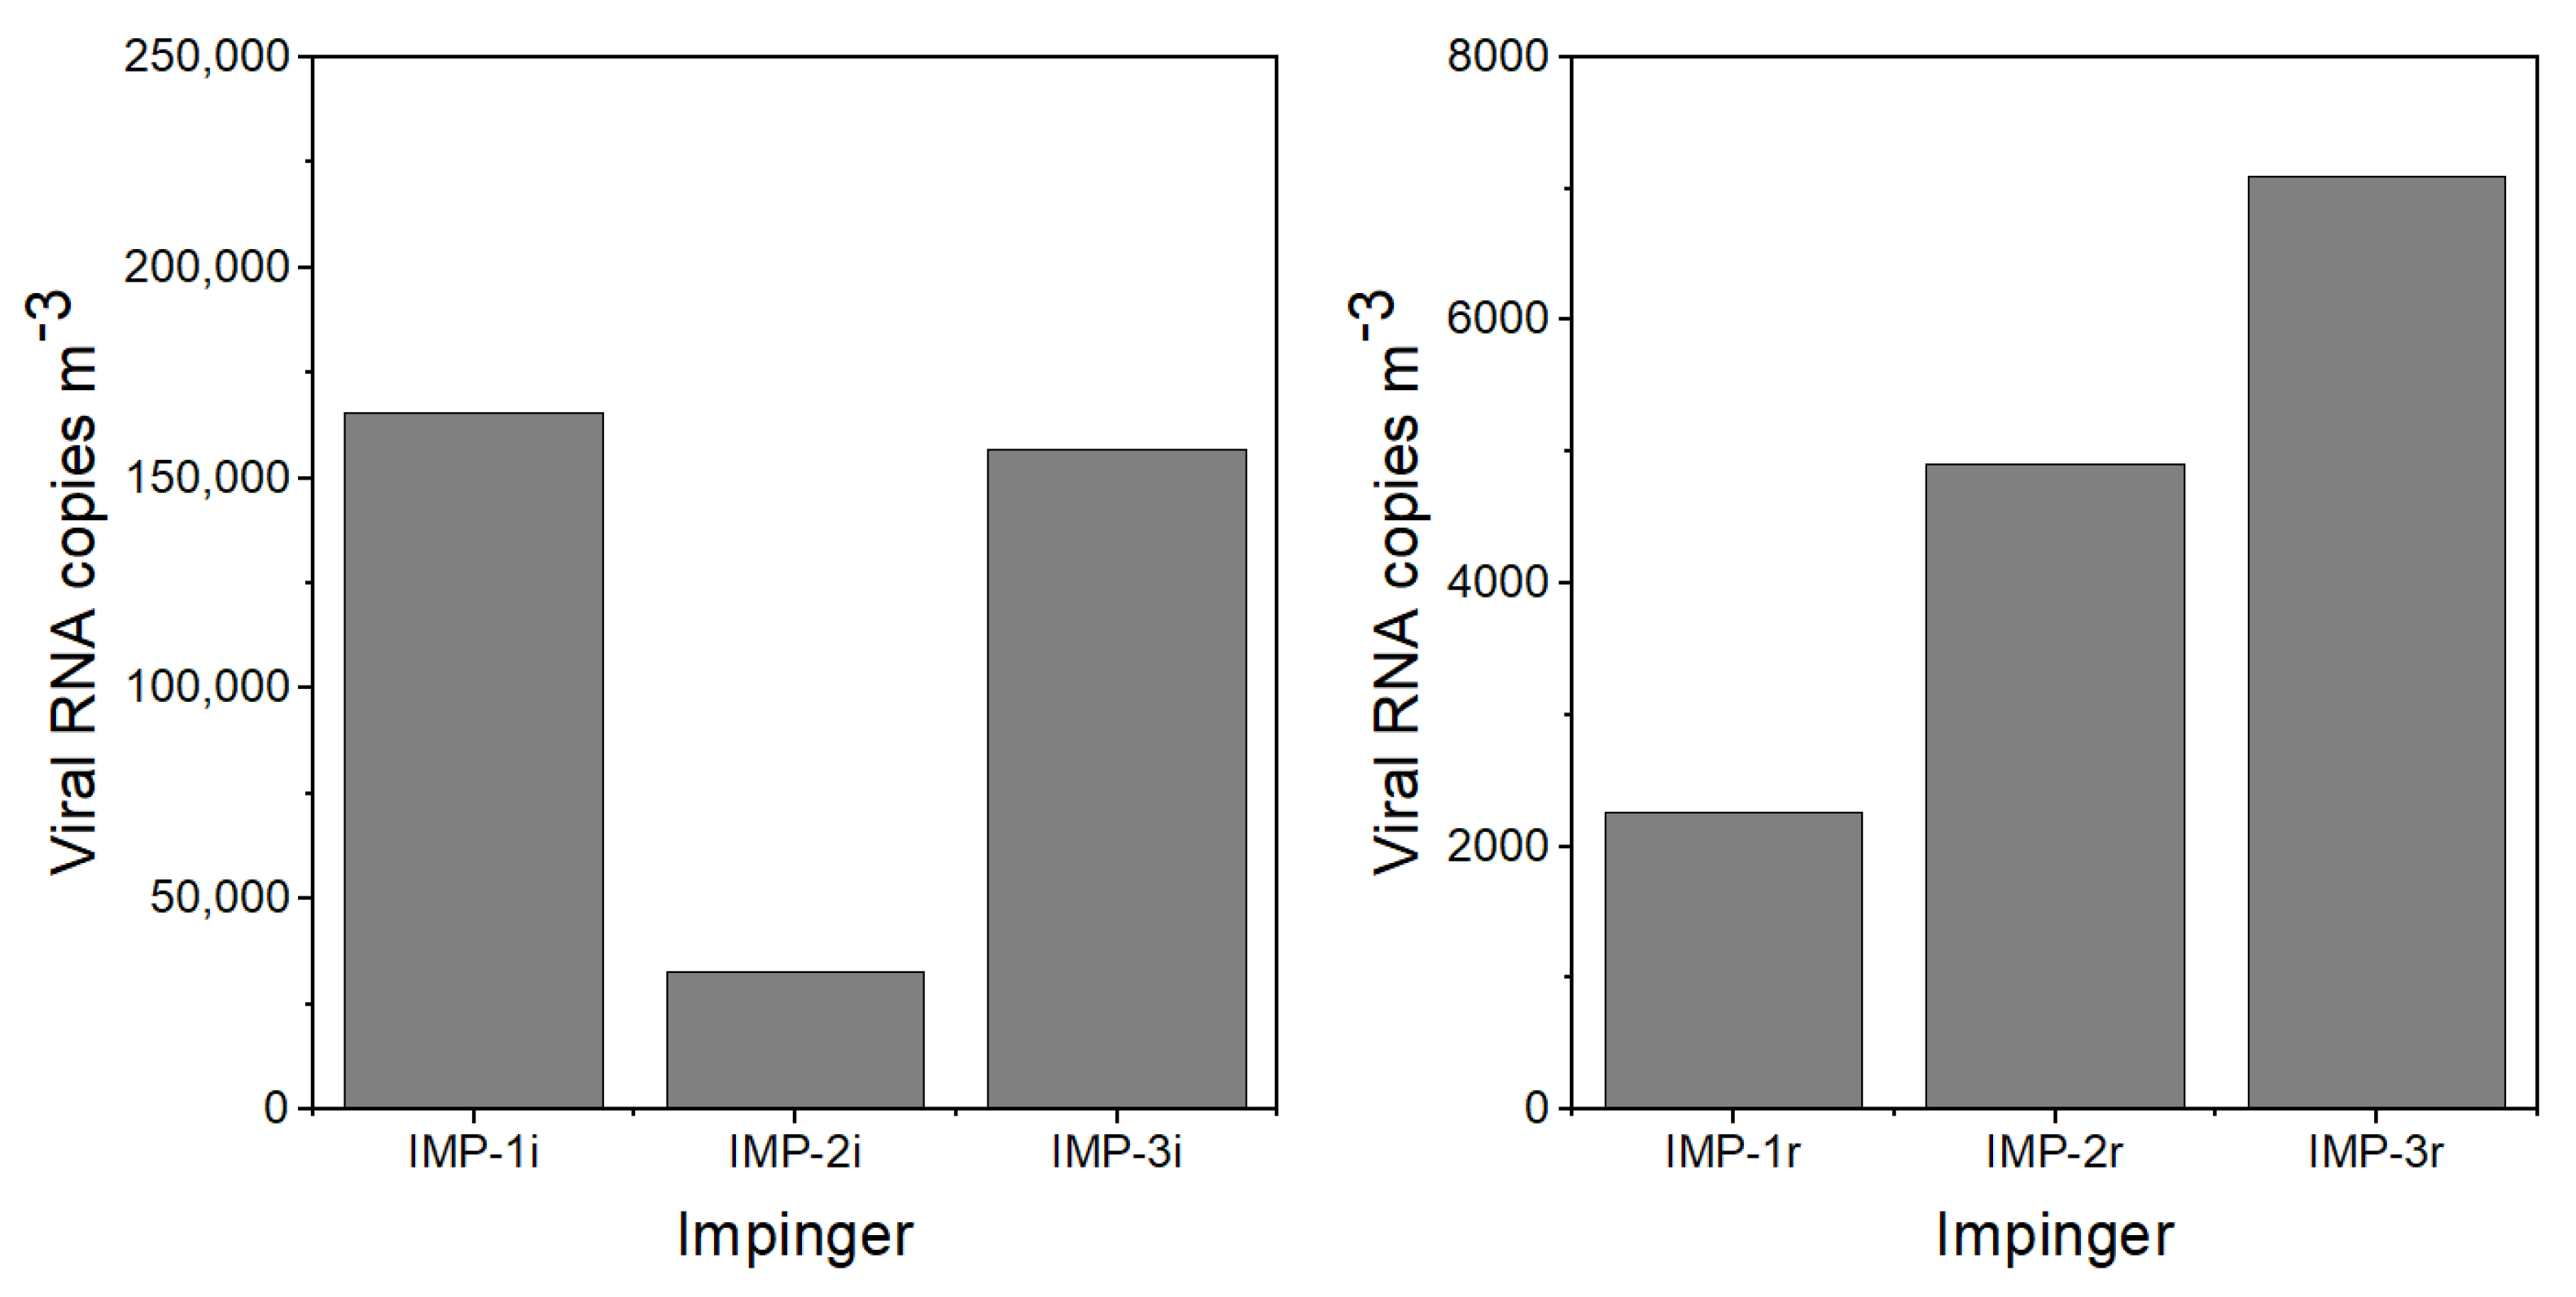
The experimental protocol for the experiments was as follows: (1) Two hours before the virus emission, the APS and LCPMs were turned on to record the background particle concentration and size distribution. (2) A few minutes before the nebulizer was turned on to initiate the virus emission, impingers IMP-1i, IMP-2i, and IMP-3i were turned on and Petri dishes P-1i–P-8i were uncovered. (3) The nebulizer containing virus-laden PBS was turned on for 30 min. (4) Following the emission, the room was left empty and quiescent to allow the particles to settle. (5) After 5 h, an investigator entered the room wearing PPE kit, including an N95 mask and Tyvek coveralls with a hood and booties, to collect the initial emission impingers and Petri dish samples, start impingers IMP-1r, IMP-2r, and IMP-3r, and uncover Petri dishes P-1r–P-8r. This activity took approximately 10 min. (6) The investigator performed a walking activity across the room for 20 min to resuspend the particles from the floor. (7) The investigator left the room and the room was left untouched overnight. (8) Impingers IMP-1r, IMP-2r, and IMP-3r were turned off after approximately 5.5 h and remained undisturbed for approximately 10 h. (9) Resuspension activity samples were collected and transferred the following morning to perform the viral RNA extraction and PCR analysis.
For the dusty surface condition experiment, the test dust was released 1.5 h prior to the emission of the nebulized viral aerosol. For the no resuspension condition experiment, steps 5 through 9 were omitted.

2.7. PCR Analysis

After collection, the impinger and Petri dish samples were immediately transferred and stored at 80 ° C. The viral RNA was extracted from sample material and collected in an elution buffer using QIAamp viral RNA mini kits (QIAGEN, Germantown, MD, USA) prior to RT-PCR. PCR amplification of the Influenza A polymerase (PA) gene was performed using the SuperScript™ III Platinum™ One-Step qRT-PCR kit (Invitrogen, Waltham, MA, USA). The primers used were as shown: 5′ -/56-FAM/CCA AGT CAT/ ZEN/ GAA GGA GAG GGA ATA CCG CT/3 IAB kFQ/-3′ (probe), 5′ -CGG TCC AAA TTC CTG CTG AT-3′ (forward), 5′ -CAT TGG GTT CCT TCC ATC CA-3′ (reverse). A known concentration of PA-containing plasmid was used to generate a standard curve in all reactions [43]. The prepared reactions were run with a standard cycling program of 50 ° C for 15 h min, 95 ° C for 2 s, followed by 44 cycles of 95 ° C for 15 s, and 60 ° C for 30 s.
The number of viral RNA copies mL 1 was calculated using Equation (1):
Viral RNA copies mL = ( 10 ( Ct - Intercept ) slope ) / mL
where the viral RNA copies mL 1 was determined from 1 mL of the impinger sample collected during the experiment, Ct is the cycle threshold value that was estimated using RT-PCR, and the slope and intercept were from the RNA copies dilution standard curve with dilutions ( 10 1 to 10 7 ) prepared from the 10 9 EID 50   mL 1 viral stock (the assay was capable of detecting as low as 10 viral RNA copies mL 1 ).
The number of viral RNA copies m 3 of air was calculated using Equation (2):
Viral RNA copies m 3 = Viral RNA copies mL 1 × V i × 1000 ( L m 3 ) Q × t
where viral RNA copies mL 1 is calculated using Equation (1), V i is the total volume in the impinger (mL) at the end of the sampling period, Q is the flow rate of the impinger pump (L m 1 ), and t is the sampling time (min).
The number of viral RNA copies cm 2 for the deposition samples was calculated using Equation (3):
Viral RNA copies cm 2 = Viral RNA copies mL 1 × V p A p
where viral RNA copies mL 1 is calculated using Equation (1), V p is the total volume in the Petri dish (mL), and A p is the surface area of the Petri dish ( cm 2 ).

2.8. Viability Analysis

We attempted to determine the viability of the collected samples using a Madin–Darby canine kidney assay (MDCK). MDCK cells were seeded in complete minimal essential media (MEM, Corning, Glendale, AZ) supplemented with 10 % fetal bovine serum (FBS) in a 96-well plate at a density of 5 × 10 4 cells per well. After 24 h, complete MEM was removed and replaced with Trypsin-Zero-Serum Refeed Medium ( 2.5   mg mL 1 trypsin/EDTA in Zero-Serum Refeed Medium, Diagnostic Hybrids, Athens, OH, USA). The virus was diluted in a separate plate from 1 × 10 7 EID 50   mL 1 to 1 × 10 3 EID 50   mL 1 as a control and added to the MDCK monolayer while samples obtained from the experiments were added neat and diluted 2-fold. The plate was spun to allow the virus to adhere and the media was replaced with fresh Trypsin-Zero-Serum Refeed Medium, and the plate was incubated at 37 ° C for 24 h. After incubation, the cells were fixed in 80 % acetone and stained for viral replication using a biotinylated mouse anti-nucleoprotein antibody (Millipore Sigma, Burlington, MA) followed by streptavidin-phycoerythrin (BD Biosciences, San Jose, CA, USA). We visualized the viral foci using an Immunospot Plate Reader (CTL, Shaker Heights, OH, USA) at 580 nm and/or 625 nm. During one of our reduced-scale pilot studies, we were able to detect viable viruses for a nebulization experiment conducted in a small (<1 m3) chamber and relatively short time period (≈1 h). However, we did not achieve positive results for the room-scale experiments. This may be due to the degradation of x31 virus over the longer period of time as well as from the nebulizer emission and sampling protocols.

2.9. Modeling the Contribution of Initial Emission to Resuspension Activity Measurements

A limitation of these findings is a result of the sampling time associated with the approved BSL-2 protocol. Because investigators could not be in the facility after working hours, the resuspension activity needed to be initiated before the particle concentration returned completely to the background concentration following the initial nebulized virus emission. Therefore, some of the viruses that were collected during the resuspension activity sampling period may have been viruses remaining in the air from the initial emission or may have come from surfaces other than the flooring. However, we expect that this contribution was minimal. The investigator conducted the resuspension activity wearing clean PPE, limiting the contribution of resuspended viral particles from the clothing. Furthermore, the activity was focused on the flooring, not on the other surfaces. A previous study conducted by Bhangar et al. (2016) [44], found that the flooring was responsible for ≈ 2 3 of the resuspension emissions during a chamber study that included human activity.
To estimate the relative contribution of the initial virus emission and the resuspension activity to the measured concentration, we applied a one-compartment material balance model for indoor particle dynamics [45] to the APS PM 20 particle concentration time series. In addition to the assumptions required for applying the material balance model, we assumed that the ratio of viral concentration to the airborne particle concentration remained constant throughout the decay of the initial emission source. This ratio was then applied to the modeled concentration decay of the initial emission source after the resuspension activity had begun (Supplementary Figures S5 and S6). The approach for estimating the contribution of a previous particle source to the increase in concentration from a current particle source using a concentration time series is described in detail in Ferro et al. (2004) [46].

2.10. Resuspension Modeling

A basic resuspension model was applied to estimate the expected resuspension of the settled viral particles due to human walking, as shown in Equation (4) and described in Tian et al. (2014) [40].
S j = f s × A s × L j × r a j
where S j is the resuspension emission rate for particle size j (RNA copies s 1 ), f s is the stepping rate (steps s 1 ), A s is the contact area of the shoe with the flooring ( m 2 ), L j is the floor loading for particle size j (RNA copies m 2 ), and r a j is the resuspension fraction per footstep for particle size j. The resuspension emission rate is then applied to a material balance model to estimate the concentration of resuspended particles in the air during the resuspension activity sampling period, as shown in Equation (5).
C j = C j , + ( C j , o C j , ) e ( k j + a ) t
where C j is the viral concentration for particle size j at time t (RNA copies m 3 ), C j , is the steady-state concentration for particle size j (copies m 3 ), C j , o is the initial concentration for particle size j (RNA copies m 3 ), a is the air change rate ( h 1 ), and k j is the deposition rate for particle size j ( h 1 ). C j , is calculated as per Equation (6).
C j , = S j / V a + k j
where S j is calculated as per Equation (4) and V is the mixing volume of the room ( m 3 ).
The inputs to the model are provided in Supplementary Information Table S4 and the results from this analysis are provided in Supplementary Information Table S5. For the present study, the stepping rate and contact area of the shoe were determined for the investigator performing the resuspension activity and the floor loading was estimated from the deposition samples. We selected parameter values based on estimates from the scientific literature and did not conduct further parameter fitting. Because resuspension is strongly dependent on particle size and the viral surface loading estimates are not size-resolved, we used the size distribution for the initial nebulized virus emission (Figures S1 and S2) to divide the measured viral surface loading results into different size bins (nominal particle diameters of 0.8 , 1.8 , 3.5 , and 5.5   μ m). We selected resuspension fraction values toward the center of the range for non-biological particles, as summarized by Ferro (2022) [7]. These were 5.0 × 10 5 , 1.0 × 10 4 , 5.0 × 10 4 , and 1.0 × 10 3 for nominal particle diameters of 0.8 , 1.8 , 3.5 , and 5.5   μ m, respectively. The viral resuspension was estimated for the four size bins and then totaled.

3. Results

3.1. Particle Concentration Measurements

Figure 3 provides the PM 20 particle concentration time series for the clean surface condition experiment as measured by the APS for the background period, virus emission period and decay, and resuspension activity period and decay. PM 20 , which is the sum of the mass concentration for all the channels, was selected to include all particle sizes in the particle size distributions for the initial virus emission and resuspension activity. The decay, or decrease, in the particle mass concentration is due primarily to the air change rate, particle deposition onto surfaces, and losses due to the sampling equipment intake pumps. Here, we separate the decay rate into the air change rate a and the combined decay rate of the other decay processes k. The first peak shown in Figure 3 is the initial emission of virus particles followed by the decay of the particle concentration in the room. The second, smaller peak shown in Figure 3 is due to the resuspension activity followed by the decay of the particle concentration in the room. The estimated air change rate during this period was 0.27 h 1 . The PM 20 decay rate k was determined to be 0.61 h 1 following the initial emission and 0.32 h 1 following the resuspension.

3.2. Comparison of Airborne Virus Concentration

The airborne virus concentrations averaged over the sampling period for each of the impingers are provided in Figure 4, Figure 5 and Figure 6. Figure 4 provides the average viral RNA copies ( m 3 ) collected by the impingers during the no resuspension condition experiment. The results demonstrate that IMP-1i, which was closest to the nebulizer, collected the most viral particles over the sampling period and IMP-3i, which was furthest from the nebulizer, collected the smallest number of viral particles over the sampling period. These results were expected because there was no fan operating during the experiment and the air was not uniformly mixed during the source periods.
Figure 5 provides a comparison of the viral RNA copies m 3 collected by the impingers during the clean surface condition experiment for the initial emission and resuspension activity sampling periods. The spatial concentration pattern for the initial emission sampling period is similar to that of the no resuspension condition experiment shown in Figure 4, with IMP-1i, the closest impinger to the nebulizer, measuring the highest concentration and IMP-3i, the furthest impinger from the nebulizer, measuring the lowest concentration. The concentration measured for sample IMP-1i ( 2.0 × 10 5 viral RNA copies m 3 ), collected during the initial emission sampling period, was 300 times as high as that for IMP1r ( 6.6 × 10 2 viral RNA copies m 3 ), collected in the same location during the resuspension activity sampling period. The concentrations measured at the other locations did not differ as much between the two sampling periods. The concentration measured for sample IMP-2i ( 6.0 × 10 4 viral RNA copies m 3 ) was 54 times as high as that for IMP-2r ( 1.1 × 10 3 viral RNA copies m 3 ), and the concentration measured for sample IMP-3i ( 2.1 × 10 4 viral RNA copies m 3 ) was only 3.4 times as high as that for IMP3r ( 6.2 × 10 3 viral RNA copies m 3 ). These differences in the pre- and post-resuspension concentrations were likely due to spatial differences during the initial emission period (higher concentrations closer to the nebulizer) and resuspension activity period (higher concentrations closer to the resuspension activity). When the samples were averaged together, the average viral concentration measured during the resuspension activity sampling period was 2.8 % of the concentration measured during the initial emission sampling period.
The results for the average viral RNA copies m 3 collected by the impingers for the dusty surface condition experiment are provided in Figure 6. The viral concentrations during the initial emission sampling period were similar to those measured for the clean surface condition experiment. However, the resuspension period samples (IMP-1r, IMP-2r, and IMP-3r) had higher viral concentrations for the dusty surface condition than for the clean surface condition. The ratio of the average concentration during the resuspension activity sampling period to that during the initial emission sampling period was 0.04 ( 4.0 % ). These results suggest that the addition of the test dust may have enhanced resuspension.
Comparing the viral concentrations by location for the initial emission period and resuspension period, the concentration measured during the initial emission sampling period by impinger IMP-1i ( 1.7 × 10 5 viral RNA copies m 3 ) was 73 times as high as that measured during the resuspension activity sampling period by IMP-1r ( 2.3 × 10 3 viral RNA copies m 3 ). Similar to the clean surface experiment, the concentrations measured at the other locations did not differ as much between the two sampling periods, and the concentrations measured by IMP-2i and IMP-3i were closer to an order of magnitude higher than those measured by IMP-2r and IMP-3r. The spatial pattern during the initial emission was different from that for the other two experiments, which could be due to the mixing conditions in the room during this particular experiment or possible errors with the sampling and analysis. For the resuspension activity sampling period, the results for IMP-1r, IMP-2r, and IMP-3r show a similar pattern as for the clean surface condition experiment, with the highest concentration toward the back of the room, where more of the resuspension activity took place.
Although the impinger results indicate high spatial variability in the viral concentration over the initial emission and resuspension activity sampling periods, the results from the LCPMs suggest that the particle concentration in the room was reasonably uniform for most of the experimental period (Supplementary Information Figure S5). Because the LCPM monitoring data had many missing data points, the data shown are 10 min averages. Therefore, the difference between the impinger and LCPMs could be that the LCPM data do not capture the spatial non-uniformity during the emission and activity periods. Therefore, the differences in the impinger results may be primarily due to spatial differences during these source periods, before the concentration becomes uniformly mixed. Interestingly, the LCPM concentrations at locations D and E were higher than the other locations during and after the initial virus emission, potentially due to being within the plume of the nebulizer. However, the differences among the LCPMs may also be due to the differences in calibration of the individual monitors more than actual spatial differences in the room. To address potential calibration issues, the LCPMs were adjusted based on data from a collocation experiment using a nebulized buffer as a particle source, but the corrections may not be sufficient to allow a detailed spatial comparison.

3.3. Comparison of Particle Deposition Samples

Viral particle deposition samples, open Petri dishes containing PBS, were collected during the initial emission and resuspension activity sampling periods. Figure 7 provides the results for viral surface loading for the no resuspension experiment. The surface loading in viral RNA copies cm 2 was relatively consistent across the room, with an average viral surface loading of 1.0 ± 0.2 × 10 2 viral RNA copies cm 2 . The lowest concentration was measured by the P6 sample, which was on the floor immediately in front of the nebulizer, well below the emission plume.
Figure 8 provides the results for viral surface loading for the clean surface condition experiment. There was more variation in the viral surface loading for this experiment than for the no resuspension experiment. The average viral surface loading for the initial emission sampling period was 3.4 ± 1.5 × 10 2 viral RNA copies cm 2 . For the resuspension activity sampling period, the average viral surface loading was 2.6 ± 1.1 viral RNA copies cm 2 . Thus, the viral surface loading from the initial emission sampling period was approximately two orders of magnitude (factor of 130) higher than that during the resuspension activity sampling period. These results are consistent with the average viral airborne concentration results.
Figure 9 provides the results for viral surface loading for the dusty surface condition experiment. The average viral surface loading for the initial emission sampling period was 3.6 ± 0.8 × 10 2 viral RNA copies cm 2 , similar to the clean surface condition. The average viral surface loading for the resuspension activity sampling period was 5.0 ± 4.1 viral RNA copies cm 2 , which is approximately double that for the clean surface condition experiment. Therefore, it is possible that the dusty surface increased the viral resuspension by providing carrier particles for the viruses. The viral surface loading that occurred during the initial emission sampling period was almost two orders of magnitude higher (factor of 70) than that during the resuspension activity sampling period. For all three experiments, location 2 showed the highest surface loading during the initial emission sampling period. This result may be because the emission nozzle was tilted slightly toward that side of the room and also because the APS, which has a sampling flow rate of 5 L min and was located close to location 2, caused the direction of the airflow to be toward location 2. For both the clean surface condition and the dusty surface condition experiments, location 5, which is in the center of the room on the floor, showed the highest surface loading for the resuspension activity sampling periods.

3.4. Comparison of the Resuspension Emission Factor

The resuspension emission factor, which is the normalized ratio of the airborne mass concentration (for the present study, viral concentration/room volume) to the mass available for resuspension on the surface (for the present study, viral surface loading/floor area) [47], was calculated for the clean surface condition and dusty surface condition experiments. The airborne concentrations used were the average results from impingers IMP-1r, IMP-2r, and IMP-3r. The floor loading values used were the average results from deposition samples P-1i–P-8i. The resuspension emission factor for the clean surface condition experiment was 1.4 × 10 3 , and the resuspension emission factor for the dusty surface condition experiment was 2.4 × 10 3 . These values are similar to those reported by Rosati et al. (2008) for 1–2 μ m particles resuspended by human activity indoors [47], and approximately 10-fold higher than those reported by Yang et al. (2023) [13] for resuspension of bacteria using a single human step.

3.5. Contribution of Initial Emission to Resuspension Activity Measurements

By modeling the continued particle concentration decay of the initial emission source after the resuspension activity began, we estimated the fraction of viral-laden particles that were collected during the resuspension activity period that could be attributed to the initial virus emission. The modeling, described in Section 2.9, was conducted using the PM 20 data from the APS and the sampling results from the impingers in location 2, which were located adjacent to the APS inlet. Based on the modeling results for the clean surface condition experiment, we estimated that approximately 80 % of the virus collected by IMP-2r was due to the resuspension and 20 % due to the initial virus emission. For the dusty surface condition experiment, we estimated that 96 % of the virus collected by IMP-2r was due to the resuspension and 4 % due to the initial emission. The figures for this analysis are provided in the Supplementary Information (Figures S6 and S7).

3.6. Comparison of Experimental Results to Resuspension Modeling Results

A basic resuspension model can be applied to compare the modeled concentrations with the experimental results from this study. By using the viral surface loading results to estimate the amount of viruses on the floor (average of values from sample P-1i through P-8i for both resuspension experiments), we applied Equations (4)–(6) to obtain the expected concentration in the air during the resuspension activity sampling period and compared the estimated value to the measured value. A time series of the modeled concentration for the resuspension activity period and decay period is provided in Figure S8. The modeled estimate for the average virus concentration during the resuspension activity period (30 min of resuspension followed by 270 min of decay) is 3.5 × 10 2 viral RNA copies m 3 . This result is a factor of 10 lower than most of the measured values presented in Figure 5 and Figure 6 (the average measured concentration is closer to 3.7 × 10 3 viral RNA copies m 3 ), although similar to the values measured in impingers IMP-1r and IMP-2r for the clean surface condition experiment. The assumptions we made for the parameter values greatly affect the modeled estimate. In particular, the published values for resuspension fraction range by orders of magnitude even for the same particle size. Selecting resuspension fractions 10 times higher, still well within the range of the reported values, would have resulted in concentrations much closer to those measured with the impinger samples in this study.

4. Discussion

The findings from this study support the hypothesis that the influenza virus can be resuspended via human activity. For our experiments, the concentration of the resuspended, airborne virus was approximately two orders of magnitude lower than the concentration during the initial emission of the virus into the room. Different scenarios, such as changes in viral loading, air change rate, volume of the room, type and length of the resuspension activity, shoe type, surface types, temperature and RH, etc., would adjust the ratio of resuspension versus initial emission source. In the present study, the air change rate was lower than the particle deposition rate. Therefore, more than half of the nebulized viral particle mass settled on room surfaces and was available for resuspension. In real environments, with more complex human emissions, activities, and cleaning patterns, the viral loading on surfaces would not be as directly linked to the initial viral emissions and would be more difficult to predict.
Previous research has investigated the influence of environmental and other parameters on resuspension phenomena (Qian et al. (2014)) [6]. For most studies, higher RH levels have led to reduced resuspension rates. However, the relationship between RH and resuspension is complex due to the competing effects of capillary forces and electrostatic forces. While our study did not report infectivity, RH, temperature, lighting, and surface type would also impact the infectivity of the virus [5].
Existing resuspension models can be applied to determine the resuspension rate of settled particles due to human walking. However, the parameter values for the models vary widely [6,7] and parameter values specifically for viruses have not been determined [48]. Our model using parameter values from the literature resulted in lower resuspension rates than what we observed. The resulting resuspension emission factor was similar to that reported in a previous study for 1–2 μ m [47] non-biological particles.
In this study, we did not determine the particle size range associated with the resuspensed virus. We expect that the resuspended virus is associated with larger particles than the virus (≈0.1 μ m) due to the size distribution of the nebulized aerosol ( 0.5 to 5 μ m) and generated test dust ( 0.1 to 10 μ m). Based on theory, the larger particles would be easier to resuspend than smaller particles for the particle size range relevant to this study due to their higher ratio of the applied external detachment force to the adhesive force. Furthermore, mineral particles, such as those comprising the test dust, would be easier to resuspend than the liquid aerosol particles generated by the nebulizer due to the higher surface roughness, smaller contact area with the surface, and lack of a meniscus between the particle and the surface [19]. Accordingly, the study results indicate increased viral resuspension for the dusty surface condition compared to the clean surface condition, although these results should be considered preliminary.
Currently, there is a large scientific knowledge gap concerning the resuspension of viral particles as well as non-biological particles smaller than 0.3   μ m. Most previous experimental resuspension studies have focused on particles larger than 0.3   μ m in diameter due to the aerosol instrumentation typically applied in these studies, which use either optical or time-of-flight measurement principles [6,40,46,49]. Only one study to date has experimentally determined resuspension rates for particles smaller than 0.3   μ m [50]. It is unknown which size fraction the resuspended viral particles are most associated with given that the virus particles are contained within liquid respiratory aerosols and the deposited particles may land on existing surface dust. Viral resuspension studies that include size-resolved collection are recommended to address this knowledge gap.
Unfortunately, we were not able to determine the viability of the virus for this study. Various factors influence the recovery of viable viruses, including collection methods, flow rates, sampling times, and sampling media [51,52]. At the time we designed the study, the viral resuspension rates were unknown, but expected to be low. Therefore, to ensure that we had sufficient viral load to quantify the resuspended virus using qPCR analysis, we ran the impinger samplers for the full 5 h decay period. With the long sampling time and relatively high flow rate, none of the collected virus was viable. However, given the resuspension estimates obtained from this study and improved methods for collecting and measuring viral infectivity [53,54], one could reduce the viral sampling time to a fraction of the decay period and obtain estimates for the viable resuspended viruses.
Previous work has shown that viruses can survive in aerosols for as long as three hours. A study conducted by Bean et al. (1982) [55] reported that influenza A and B viruses survived longer on hard surfaces such as stainless steel and plastic (24–48 h) compared to cloth, paper, and tissues (<8–12 h), whereas influenza A virus was detected on hands from contact with stainless steel for 24 h and tissue for up to 15 min. A laboratory study conducted with SARS-CoV-2 found that the virus could stay viable in aerosols for as long as 3 h, on plastic and stainless steel surfaces for up to 3 days, on copper surfaces for up to 4 h, and on cardboard surfaces for up to a day [27]. Similarly, Fears et al. (2020) [56] presented a study that highlighted that laboratory conditions had enabled SARS-CoV-2 to remain viable and infectious within aerosols for up to 16 h. Riddle et al. (2020) [57] found viable SARS-CoV-2 virus 28 days after inoculation on glass, polymer, stainless steel, vinyl, and paper (all non-porous surfaces stored in the dark at 20 °C). These results suggest that the SARS-CoV-2 virus could be stable enough for resuspension to be a viable exposure pathway.
During the resuspension activity, some of the resuspended viruses may have originated from clothing and surfaces other than the flooring. However, we anticipate that the contribution of these sources was minimal. The investigator wore clean Tyvek coveralls and booties to minimize contributions from clothing, and the human activity (walking) specifically targeted the flooring. In a previous chamber study with human participants, Bhangar et al. (2016) [44] reported that flooring accounted for two-thirds or more of the resuspended bioaerosol emissions.
Resuspension of viral particles from clothing could be a more important exposure pathway than resuspension from flooring during human activity due to a higher intake fraction (fraction of emitted particles that are inhaled). There is evidence from a study in a hospital environment that resuspension of SARS-CoV-2 from indoor surfaces and clothing may be an important exposure pathway due to the relatively high virus concentrations found in the hospital changing rooms and bathrooms [33]. Ren et al. (2022) [58] demonstrated that clothing effectively transports and resuspends bioaerosols. In an experimental study using fluorescent particles as tracers, they found almost 50 % of the fluorescent particles deposited on clothing resuspended into the room. Licina et al. (2017) [59] found that the emission rate is lower but the intake fraction is substantially higher for particles resuspended from seated movements than from walking indoors. This makes sense given the closer proximity of the breathing zone to the clothing. Furthermore, viruses on the clothing may be fresher and more viable than those on indoor surfaces, although this has not been studied. The issue of viral resuspension from both indoor surfaces and clothing requires further study.

5. Conclusions

This is the first full-scale experimental study to measure the resuspension of seeded live viruses due to human activity. We found that the airborne concentration of the virus following the resuspension events was approximately two orders of magnitude lower than that following direct emission via the nebulizer. Thus, depending on the infectious dose and viability of a particular virus, resuspension of settled respiratory viruses could lead to disease transmission, but the risk is substantially lower than for direct emissions. These results do not include the inactivation of the virus, which would reduce the risk further. The findings for this study, although using a small data set, are consistent with previous resuspension measurements and models for human activity. Improvements in experimental protocols including viral collection techniques to allow determination of viability, size resolution of the resuspended particles, and viral resuspension studies in real environments with infected occupants are recommended.

Supplementary Materials

The following supporting information can be downloaded at: https://www.mdpi.com/article/10.3390/buildings13071734/s1, Figure S1: Particle mass size distributions (A&C) and particle number size distributions (B&D) for nebulized viral aerosol (A&B), and resuspension activity (C&D) during the Clean Surface Condition experiment. Figure S2: Particle mass size distributions (A–C) and particle number size distributions (D–F) for the generated test dust (A&D), nebulized viral aerosol (B&E), and resuspension activity (C&F) during the Dusty Surface Condition experiment. Figure S3: Comparison of the LCPMs during a collocation experiment using nebulized viral aerosol as a particle source for uncorrected data (A) and corrected data (B). Figure S4: Comparison of the LCPMs B, C, D and E to monitor A during a collocation experiment using nebulized viral aerosol as a particle source. The linear least squares regression equations used to adjust the monitors for the experimental data are shown. Figure S5: Concentration times series for adjusted LCPM data for the Clean Surface Condition experiment. Figure S6: Measured (APS PM 20 ) and modeled concentration time series for the Clean Surface Condition experiment. Both the initial virus emission period (i, shown in blue) and the resuspension activity (r, shown in red) were conducted for 30 min. Figure S7: Measured (APS PM 20 ) and modeled concentration time series for the Dusty Surface Condition experiment. Both the initial virus emission period (i, shown in blue) and the resuspension activity (r, shown in red) were conducted for 30 min. Figure S8: Resuspension modeling for 30 min walking activity using four size bins. Table S1: Detailed information of impingers running during the No Resuspension experiment. Table S2: Detailed information of impingers running during the Clean Surface Condition experiment. Table S3: Detailed information of impingers running during the Dusty Surface Condition experiment. Table S4: Inputs for modeled resuspension estimate. Table S5: Modeled resuspension estimate using four size bins.

Author Contributions

All authors contributed to the article and approved the submitted version. M.S.R.: Writing—original draft, data curation, formal analysis, visualization, coding. A.D.R.: Data curation, formal analysis, visualization. D.M.B.: Supervision, conceptualization, validation, editing, and project administration. A.R.F.: Writing—original draft, supervision, conceptualization, validation, editing, and project administration. All authors have read and agreed to the published version of the manuscript.

Funding

This research was funded by the Clarkson University COVID-19 special solicitation.

Institutional Review Board Statement

The study did not require Institutional Review Board approval. The protocol was approved for Biosafety Level 2 due to the use of live infectious virus (Approval number B-384-21, Trudeau Institute).

Data Availability Statement

Data will be made available on request.

Acknowledgments

The author would like to thank Lynn Ryan and Stanzin Idga for their invaluable support and guidance in the completion of this project.

Conflicts of Interest

The authors declare no conflict of interest. The funders had no role in the design of the study; in the collection, analyses, or interpretation of data; in the writing of the manuscript; or in the decision to publish the results.

References

  1. Wei, J.; Li, Y. Airborne spread of infectious agents in the indoor environment. Am. J. Infect. Control. 2016, 44, S102–S108. [Google Scholar] [CrossRef] [PubMed]
  2. Miller, S.L.; Nazaroff, W.W.; Jimenez, J.L.; Boerstra, A.; Buonanno, G.; Dancer, S.J.; Kurnitski, J.; Marr, L.C.; Morawska, L.; Noakes, C. Transmission of SARS-CoV-2 by inhalation of respiratory aerosol in the Skagit Valley Chorale superspreading event. Indoor Air 2021, 31, 314–323. [Google Scholar] [CrossRef] [PubMed]
  3. Douwes, J.; Thorne, P.; Pearce, N.; Heederik, D. Bioaerosol health effects and exposure assessment: Progress and prospects. Ann. Occup. Hyg. 2003, 47, 187–200. [Google Scholar]
  4. World Health Organization. COVID-19 Dashboard. n.d. Available online: https://covid19.who.int/ (accessed on 26 March 2023).
  5. Wang, C.C.; Prather, K.A.; Sznitman, J.; Jimenez, J.L.; Lakdawala, S.S.; Tufekci, Z.; Marr, L.C. Airborne transmission of respiratory viruses. Science 2021, 373, eabd9149. [Google Scholar] [CrossRef]
  6. Qian, J.; Peccia, J.; Ferro, A.R. Walking-induced particle resuspension in indoor environments. Atmos. Environ. 2014, 89, 464–481. [Google Scholar] [CrossRef]
  7. Ferro, A.R. Resuspension. In Handbook of Indoor Air Quality; Springer Nature: Singapore, 2022; pp. 1–18. [Google Scholar]
  8. Hospodsky, D.; Qian, J.; Nazaroff, W.W.; Yamamoto, N.; Bibby, K.; Rismani-Yazdi, H.; Peccia, J. Human occupancy as a source of indoor airborne bacteria. PloS ONE 2012, 7, e34867. [Google Scholar] [CrossRef] [Green Version]
  9. Yamamoto, N.; Hospodsky, D.; Dannemiller, K.C.; Nazaroff, W.W.; Peccia, J. Indoor emissions as a primary source of airborne allergenic fungal particles in classrooms. Environ. Sci. Technol. 2015, 49, 5098–5106. [Google Scholar] [CrossRef] [Green Version]
  10. Khare, P.; Marr, L. Simulation of vertical concentration gradient of influenza viruses in dust resuspended by walking. Indoor Air 2015, 25, 428–440. [Google Scholar] [CrossRef]
  11. Hyytiäinen, H.K.; Jayaprakash, B.; Kirjavainen, P.V.; Saari, S.E.; Holopainen, R.; Keskinen, J.; Hämeri, K.; Hyvärinen, A.; Boor, B.E.; Täubel, M. Crawling-induced floor dust resuspension affects the microbiota of the infant breathing zone. Microbiome 2018, 6, 1–12. [Google Scholar] [CrossRef] [PubMed] [Green Version]
  12. Joseph, J.; Baby, H.M.; Zhao, S.; Li, X.L.; Cheung, K.C.; Swain, K.; Agus, E.; Ranganathan, S.; Gao, J.; Luo, J.N.; et al. Role of bioaerosol in virus transmission and material-based countermeasures. Exploration 2022, 2, 20210038. [Google Scholar] [CrossRef]
  13. Yang, S.; Zhang, H.; Hsiao, T.; Ferro, A.; Lai, A. Evaluation of human walking-induced resuspension of bacteria on different flooring materials. Build. Environ. 2023, 235, 110218. [Google Scholar] [CrossRef]
  14. Kunkel, S.; Azimi, P.; Zhao, H.; Stark, B.; Stephens, B. Quantifying the size-resolved dynamics of indoor bioaerosol transport and control. Indoor Air 2017, 27, 977–987. [Google Scholar] [CrossRef]
  15. Qian, J.; Hospodsky, D.; Yamamoto, N.; Nazaroff, W.W.; Peccia, J. Size-resolved emission rates of airborne bacteria and fungi in an occupied classroom. Indoor Air 2012, 22, 339–351. [Google Scholar] [CrossRef] [Green Version]
  16. Igarashi, Y.; Kita, K.; Maki, T.; Kinase, T.; Hayashi, N.; Hosaka, K.; Adachi, K.; Kajino, M.; Ishizuka, M.; Sekiyama, T.T.; et al. Fungal spore involvement in the resuspension of radiocaesium in summer. Sci. Rep. 2019, 9, 1954. [Google Scholar] [CrossRef] [Green Version]
  17. Salimifard, P.; Rim, D.; Gomes, C.; Kremer, P.; Freihaut, J.D. Resuspension of biological particles from indoor surfaces: Effects of humidity and air swirl. Sci. Total. Environ. 2017, 583, 241–247. [Google Scholar] [CrossRef]
  18. Salimifard, P.; Kremer, P.; Rim, D.; Freihaut, J.D. Resuspension of Bacterial Spore Particles from Duct Surfaces. In Proceedings of the Healthy Buildings 2015 America Conference: Innovation in a Time of Energy Uncertainty and Climate Adaptation, HB 2015, Boulder, CO, USA, 19–22 July 2015; pp. 513–517. [Google Scholar]
  19. Hinds, W.C.; Zhu, Y. Aerosol Technology: Properties, Behavior, and Measurement of Airborne Particles; John Wiley & Sons: Hoboken, NJ, USA, 2022. [Google Scholar]
  20. Morawska, L.; Johnson, G.; Ristovski, Z.; Hargreaves, M.; Mengersen, K.; Corbett, S.; Chao, C.Y.H.; Li, Y.; Katoshevski, D. Size distribution and sites of origin of droplets expelled from the human respiratory tract during expiratory activities. J. Aerosol Sci. 2009, 40, 256–269. [Google Scholar] [CrossRef] [Green Version]
  21. Ahmed, T.; Rawat, M.S.; Ferro, A.R.; Mofakham, A.A.; Helenbrook, B.T.; Ahmadi, G.; Senarathna, D.; Mondal, S.; Brown, D.; Erath, B.D. Characterizing respiratory aerosol emissions during sustained phonation. J. Expo. Sci. Environ. Epidemiol. 2022, 32, 689–696. [Google Scholar] [CrossRef]
  22. Asadi, S.; Wexler, A.S.; Cappa, C.D.; Barreda, S.; Bouvier, N.M.; Ristenpart, W.D. Aerosol emission and superemission during human speech increase with voice loudness. Sci. Rep. 2019, 9, 2348. [Google Scholar] [CrossRef] [PubMed] [Green Version]
  23. Gregson, F.K.; Watson, N.A.; Orton, C.M.; Haddrell, A.E.; McCarthy, L.P.; Finnie, T.J.; Gent, N.; Donaldson, G.C.; Shah, P.L.; Calder, J.D.; et al. Comparing aerosol concentrations and particle size distributions generated by singing, speaking and breathing. Aerosol Sci. Technol. 2021, 55, 681–691. [Google Scholar] [CrossRef]
  24. Morris, D.H.; Yinda, K.C.; Gamble, A.; Rossine, F.W.; Huang, Q.; Bushmaker, T.; Fischer, R.J.; Matson, M.J.; Van Doremalen, N.; Vikesland, P.J.; et al. Mechanistic theory predicts the effects of temperature and humidity on inactivation of SARS-CoV-2 and other enveloped viruses. eLife 2021, 10, e65902. [Google Scholar] [CrossRef]
  25. Jensen, M.M. Inactivation of airborne viruses by ultraviolet irradiation. Appl. Microbiol. 1964, 12, 418–420. [Google Scholar] [CrossRef]
  26. Yang, W.; Marr, L.C. Dynamics of airborne influenza A viruses indoors and dependence on humidity. PloS ONE 2011, 6, e21481. [Google Scholar] [CrossRef] [PubMed] [Green Version]
  27. Van Doremalen, N.; Bushmaker, T.; Morris, D.H.; Holbrook, M.G.; Gamble, A.; Williamson, B.N.; Tamin, A.; Harcourt, J.L.; Thornburg, N.J.; Gerber, S.I.; et al. Aerosol and surface stability of SARS-CoV-2 as compared with SARS-CoV-1. N. Engl. J. Med. 2020, 382, 1564–1567. [Google Scholar] [CrossRef] [PubMed]
  28. Lednicky, J.A.; Lauzardo, M.; Fan, Z.H.; Jutla, A.; Tilly, T.B.; Gangwar, M.; Usmani, M.; Shankar, S.N.; Mohamed, K.; Eiguren-Fernandez, A.; et al. Viable SARS-CoV-2 in the air of a hospital room with COVID-19 patients. Int. J. Infect. Dis. 2020, 100, 476–482. [Google Scholar] [CrossRef] [PubMed]
  29. Santarpia, J.L.; Herrera, V.L.; Rivera, D.N.; Ratnesar-Shumate, S.; Reid, S.P.; Ackerman, D.N.; Denton, P.W.; Martens, J.W.; Fang, Y.; Conoan, N.; et al. The size and culturability of patient-generated SARS-CoV-2 aerosol. J. Expo. Sci. Environ. Epidemiol. 2022, 32, 706–711. [Google Scholar] [CrossRef]
  30. Vass, W.B.; Lednicky, J.A.; Shankar, S.N.; Fan, Z.H.; Eiguren-Fernandez, A.; Wu, C.Y. Viable SARS-CoV-2 Delta variant detected in aerosols in a residential setting with a self-isolating college student with COVID-19. J. Aerosol Sci. 2022, 165, 106038. [Google Scholar] [CrossRef]
  31. Fortin, A.; Veillette, M.; Larrotta, A.; Longtin, Y.; Duchaine, C.; Grandvaux, N. Detection of viable SARS-CoV-2 in retrospective analysis of aerosol samples collected from hospital rooms of patients with COVID-19. Clin. Microbiol. Infect. 2023. [Google Scholar] [CrossRef]
  32. Asadi, S.; Gaaloul ben Hnia, N.; Barre, R.S.; Wexler, A.S.; Ristenpart, W.D.; Bouvier, N.M. Influenza A virus is transmissible via aerosolized fomites. Nat. Commun. 2020, 11, 4062. [Google Scholar] [CrossRef] [PubMed]
  33. Liu, Y.; Ning, Z.; Chen, Y.; Guo, M.; Liu, Y.; Gali, N.K.; Sun, L.; Duan, Y.; Cai, J.; Westerdahl, D.; et al. Aerodynamic analysis of SARS-CoV-2 in two Wuhan hospitals. Nature 2020, 582, 557–560. [Google Scholar] [CrossRef]
  34. Hammad Ud Din, T.M.; McGrath, J.A.; Byrne, M.A. A Test Chamber Investigation of the Effect of Charging on Aerosol Deposition on Indoor Surfaces. Aerosol Air Qual. Res. 2020, 20, 2669–2680. [Google Scholar]
  35. Stadnytskyi, V.; Bax, C.E.; Bax, A.; Anfinrud, P. The airborne lifetime of small speech droplets and their potential importance in SARS-CoV-2 transmission. Proc. Natl. Acad. Sci. USA 2020, 117, 11875–11877. [Google Scholar] [CrossRef]
  36. Ma, J.; Qi, X.; Chen, H.; Li, X.; Zhang, Z.; Wang, H.; Sun, L.; Zhang, L.; Guo, J.; Morawska, L.; et al. Coronavirus disease 2019 patients in earlier stages exhaled millions of severe acute respiratory syndrome coronavirus 2 per hour. Clin. Infect. Dis. 2021, 72, e652–e654. [Google Scholar] [CrossRef] [PubMed]
  37. Wang, Y.; Xu, G.; Huang, Y.W. Modeling the load of SARS-CoV-2 virus in human expelled particles during coughing and speaking. PLoS ONE 2020, 15, e0241539. [Google Scholar] [CrossRef] [PubMed]
  38. Stanley, W. The size of influenza virus. J. Exp. Med. 1944, 79, 267–283. [Google Scholar] [CrossRef] [Green Version]
  39. Boor, B.E.; Siegel, J.A.; Novoselac, A. Monolayer and multilayer particle deposits on hard surfaces: Literature review and implications for particle resuspension in the indoor environment. Aerosol Sci. Technol. 2013, 47, 831–847. [Google Scholar] [CrossRef]
  40. Tian, Y.; Sul, K.; Qian, J.; Mondal, S.; Ferro, A.R. A comparative study of walking-induced dust resuspension using a consistent test mechanism. Indoor Air 2014, 24, 592–603. [Google Scholar] [CrossRef] [PubMed]
  41. Adgate, J.; Weisel, C.; Wang, Y.; Rhoads, G.; Lioy, P. Lead in house dust: Relationships between exposure metrics. Environ. Res. 1995, 70, 134–147. [Google Scholar] [CrossRef]
  42. Hoh, E.; Hunt, R.N.; Quintana, P.J.; Zakarian, J.M.; Chatfield, D.A.; Wittry, B.C.; Rodriguez, E.; Matt, G.E. Environmental tobacco smoke as a source of polycyclic aromatic hydrocarbons in settled household dust. Environ. Sci. Technol. 2012, 46, 4174–4183. [Google Scholar] [CrossRef]
  43. Vogel, A.J.; Harris, S.; Marsteller, N.; Condon, S.A.; Brown, D.M. Early cytokine dysregulation and viral replication are associated with mortality during lethal influenza infection. Viral Immunol. 2014, 27, 214–224. [Google Scholar] [CrossRef] [Green Version]
  44. Bhangar, S.; Adams, R.I.; Pasut, W.; Huffman, J.A.; Arens, E.A.; Taylor, J.W.; Bruns, T.D.; Nazaroff, W.W. Chamber bioaerosol study: Human emissions of size-resolved fluorescent biological aerosol particles. Indoor Air 2016, 26, 193–206. [Google Scholar] [CrossRef] [Green Version]
  45. Nazaroff, W.W. Indoor particle dynamics. Indoor Air 2004, 14, 175–183. [Google Scholar] [CrossRef] [Green Version]
  46. Ferro, A.R.; Kopperud, R.J.; Hildemann, L.M. Source strengths for indoor human activities that resuspend particulate matter. Environ. Sci. Technol. 2004, 38, 1759–1764. [Google Scholar] [CrossRef]
  47. Rosati, J.A.; Thornburg, J.; Rodes, C. Resuspension of particulate matter from carpet due to human activity. Aerosol Sci. Technol. 2008, 42, 472–482. [Google Scholar] [CrossRef]
  48. Rawat, M.S.; Ferro, A.R. Respiratory Virus Deposition and Resuspension from Indoor Surfaces. In Studies to Combat COVID-19 using Science and Engineering; Springer: Berlin, Germany, 2022; pp. 107–118. [Google Scholar]
  49. Thatcher, T.L.; Layton, D.W. Deposition, resuspension, and penetration of particles within a residence. Atmos. Environ. 1995, 29, 1487–1497. [Google Scholar] [CrossRef]
  50. Benabed, A.; Boulbair, A.; Limam, K. Experimental study of the human walking-induced fine and ultrafine particle resuspension in a test chamber. Build. Environ. 2020, 171, 106655. [Google Scholar] [CrossRef]
  51. Kesavan, J.; Schepers, D.; McFarland, A.R. Sampling and retention efficiencies of batch-type liquid-based bioaerosol samplers. Aerosol Sci. Technol. 2010, 44, 817–829. [Google Scholar] [CrossRef]
  52. Chen, Y.C.; Wang, I.J.; Cheng, C.C.; Wu, Y.C.; Bai, C.H.; Yu, K.P. Effect of selected sampling media, flow rate, and time on the sampling efficiency of a liquid impinger packed with glass beads for the collection of airborne viruses. Aerobiologia 2021, 37, 243–252. [Google Scholar] [CrossRef]
  53. Stein, S.J.; Ravnholdt, A.R.; Herrera, V.L.; Rivera, D.N.; Williams, P.T.; Santarpia, J.L. SARS-CoV-2 Aerosol and Surface Detections in COVID-19 Testing Centers and Implications for Transmission Risk in Public Facing Workers. Int. J. Environ. Res. Public Health 2023, 20, 976. [Google Scholar] [CrossRef]
  54. Cao, G.; Noti, J.; Blachere, F.; Lindsley, W.; Beezhold, D. Development of an improved methodology to detect infectious airborne influenza virus using the NIOSH bioaerosol sampler. J. Environ. Monit. 2011, 13, 3321–3328. [Google Scholar] [CrossRef] [Green Version]
  55. Bean, B.; Moore, B.; Sterner, B.; Peterson, L.; Gerding, D.; Balfour Jr, H. Survival of influenza viruses on environmental surfaces. J. Infect. Dis. 1982, 146, 47–51. [Google Scholar] [CrossRef]
  56. Fears, A.C.; Klimstra, W.B.; Duprex, P.; Hartman, A.; Weaver, S.C.; Plante, K.S.; Mirchandani, D.; Plante, J.A.; Aguilar, P.V.; Fernández, D.; et al. Persistence of severe acute respiratory syndrome coronavirus 2 in aerosol suspensions. Emerg. Infect. Dis. 2020, 26, 2168. [Google Scholar] [CrossRef] [PubMed]
  57. Riddell, S.; Goldie, S.; Hill, A.; Eagles, D.; Drew, T.W. The effect of temperature on persistence of SARS-CoV-2 on common surfaces. Virol. J. 2020, 17, 145. [Google Scholar] [CrossRef] [PubMed]
  58. Ren, J.; Tang, M.; Novoselac, A. Experimental study to quantify airborne particle deposition onto and resuspension from clothing using a fluorescent-tracking method. Build. Environ. 2022, 209, 108580. [Google Scholar] [CrossRef] [PubMed]
  59. Licina, D.; Tian, Y.; Nazaroff, W.W. Emission rates and the personal cloud effect associated with particle release from the perihuman environment. Indoor Air 2017, 27, 791–802. [Google Scholar] [CrossRef] [PubMed] [Green Version]
Figure 1. Views of the laboratory used for experiments taken from the ante-chamber (left image) and the opposite end (right image) of the room.
Buildings 13 01734 g001
Figure 2. Plan-view schematic of the experimental setup in the laboratory.
Buildings 13 01734 g002
Figure 3. Concentration time series showing the total particle mass PM 20 in the room. The initial virus emission period was 30 min and the resuspension activity period was 10 min of sample preparation followed by 20 min of walking.
Buildings 13 01734 g003
Figure 4. Average viral RNA copies m 3 collected by impingers at different locations in the room for the no resuspension condition experiment. IMP- 1 i is located behind the nebulizer at a distance of 0.8 m; IMP- 2 i is located in front of the nebulizer at a distance of 1.6 m; IMP- 3 i is located in front of the nebulizer at a distance of 3.5 m. (Note: i = initial emission).
Buildings 13 01734 g004
Figure 5. Comparison of time-averaged viral RNA copies m 3 of air collected by impingers at different locations in the room for the clean surface condition experiment. IMP-1i and IMP-1r are located behind the nebulizer at a distance of 0.8 m; IMP-2i and IMP-2r are located in front of the nebulizer at a distance of 1.6 m; IMP-3i and IMP-3r are located in front of the nebulizer at a distance of 3.5 m. (Note: i = initial emission; r = resuspension).
Buildings 13 01734 g005
Figure 6. Comparison of time-averaged viral RNA copies m 3 of air collected by impingers at different locations in the room for the dusty surface condition experiment. IMP-1i and IMP-1r are located behind the nebulizer at a distance of 0.8 m; IMP-2i and IMP-2r are located in front of the nebulizer at a distance of 1.6 m; IMP-3i and IMP-3r are located in front of the nebulizer at a distance of 3.5 m. (Note: i = initial emission; r = resuspension).
Buildings 13 01734 g006
Figure 7. Viral surface loading at different locations in the room for the no resuspension experiment. (Note: i = initial emission).
Buildings 13 01734 g007
Figure 8. Viral surface loading at different locations in the room for the clean surface condition experiment. (Note: i = initial emission; r = resuspension).
Buildings 13 01734 g008
Figure 9. Viral surface loading at different locations in the room for the dusty surface condition experiment. (Note: i = initial emission; r = resuspension).
Buildings 13 01734 g009
Disclaimer/Publisher’s Note: The statements, opinions and data contained in all publications are solely those of the individual author(s) and contributor(s) and not of MDPI and/or the editor(s). MDPI and/or the editor(s) disclaim responsibility for any injury to people or property resulting from any ideas, methods, instructions or products referred to in the content.

