1. Introduction
The advent of COVID-19 led to a surge in interest in the method of virus transmission, with a particular interest in respiratory droplet transmission. Possible transfer through contaminated hands has been widely reported [
1]. This study is an attempt to identify the surfaces that humans come into contact with daily and may contain a higher density of microorganisms transferred through human expiratory droplets. These droplets have been recognized by the medical community as one of the means by which several respiratory viral infections, including COVID-19, are transmitted [
2]. When individuals touch their eyes, nose, or mouth after coming into contact with these surfaces, they could contract the illness [
1]. Continuous sanitization of these surfaces is necessary, especially following contact with outside parties.
The methodology does not utilize an exact replica of human breath droplets. The main controlling factor in the simulation is the size of the droplets. They needed to be of sufficient size to register on the recording material so that it may be scanned and recognized but small enough to behave in a manner relatively similar to breath droplets when released into the interior environment.
As expected, many researchers are presently studying all aspects of the transmission mechanism. Hosseini et al. studied the viability of the SARS-COVID virus on different surfaces. He mentions that “the half-life of SARS-CoV-2 was strongly dependent on the material, 1 h for copper and 7 h for plastic” [
3].
Cheng YH et al. sought to create a methodology for estimating influenza infection risk in a ventilated airspace based on correlations between inhaled/exhaled respiratory droplets and airborne transmission dynamics. He stated that transmission via “respiratory droplets and aerosols is the main route for efficient transmission” between humans indoors [
2]. Past research on airborne transmission between occupants in indoor spaces was reviewed by Ai ZT et al., emphasizing the spread of expiratory droplet nuclei from mouth to mouth for non-specific illnesses. Summarizing what is known about the influential factors, improper simplifications of the thermofluidic boundary conditions of thermal manikins, issues facing experimental procedures, and limits of available evaluation methods received special emphasis. [
4]. Hartmann A et al. studied emission rates of particles that are emitted from the mouth and nose during different activities, such as breathing, speaking, and coughing [
5], while Gao studied how the drops in the air are affected by the actual standards of transport, with bead size being the main element influencing the travel distance of drops following age, scatter, and duration on surfaces. Bead size is likewise a key element in deciding the endurance of microorganisms inside the drops. Notwithstanding the beads’ actual properties, the attributes of the indoor environment, such as temperature, moistness, and ventilation, are also contributing factors [
6].
Papineni RS et al. attempted to quantify the size and distribution of droplets exhaled by healthy people in a study. An Optical Particle Counter (OPC) plus an Analytical Transmission Electron Microscope “were used to measure exhaled droplets from human participants performing four respiratory actions: mouth breathing, nose breathing, coughing, and talking (AEM)”. The OPC revealed a majority of particles with a diameter of less than one μm; however, larger particles were also discovered. The presence of bigger-sized droplets in the exhaled air was confirmed by AEM measurements. Coughing produced the highest droplet concentrations, while nose breathing produced the lowest. However, there was considerable intersubjective heterogeneity [
7]. The size distribution of droplet nuclei and aspirated droplets by test subjects was also investigated in a study by Yang S et al. An Aerodynamic Particle Sizer (APS) and a Scanning Mobility Particle Sizer were used to assess the size distributions of droplet nuclei aspirated by test subjects (SMPS). To determine the impact of age and gender on droplet size distribution, researchers looked at the size distribution of coughed droplets from people of various ages and genders. Male subjects’ droplet nuclei concentrations were much higher than the females’. When the droplet concentrations of subjects in various age groups were compared, it was shown that those in the 30–50 year age range had the highest droplet concentrations [
8]. Mahjoub Mohammed et al. compared the obtained parameters, advantages, and limits in a study on the characterization of exhaled airflow and droplets. She also documented the mechanics of the droplet dispersion [
9]. Under varied workout situations, Fairchild CI et al. examined the number and concentration of particles in exhaled breath [
10]. The number of particles found in exhaled air varied depending on the test subject and his activity. At rest, subjects breathed the least amount of particles, whereas exercises that increased the rate of respiration caused more particles to be expelled. A computational model of sneezing and coughing droplets was developed by Pendar MR et al. This study makes a significant contribution by presenting a correlation between the length and width of the total direct maximum reach of micro-droplets, which is driven by a wide spectrum of coughs and sneezes. This investigation “can be used to calculate the “social distance” between individuals in order to avoid contamination by inhaling or touching their bodies due to saliva-disease-carrier droplets in sneezing, at various social distance positions, such as face-to-face meetings, standing, and so on” [
11]. Nazarof also studied the size of exhalation droplets. His study suggests that emissions are usefully clustered into three groups: small particles (diameter 0.1–5 µm), large particles (5–100 µm), and ballistic drops (>100 µm) [
12]. Comparing the results of these studies on droplet size seem inconsistent—the different means of measurement and investigation methodology produce slightly varying results.
Most studies of airborne droplets concentrate on dispersion rather than deposition. Sze To, G. N. et al. studied deposition in aircraft cabins [
13], while Jinliang Wang and Tin-Tai Chow studied deposition in isolation rooms [
14]. The deposition on interior surfaces of droplets in a hospital ward was studied by Chao et al. [
15]. He used a numerical model to simulate the transport and airflow. He mentioned that large droplets whose initial sizes were larger than 87.5 μm settled on the interior surfaces but were affected by the airflow. Smaller droplets whose initial size was less than 45 μm exhibited airborne behavior.
Bahl P et al. conducted an experiment to establish the safe distance between a patient and a healthcare provider by measuring the distribution of sneeze droplets. The authors demonstrated how to use light-sheet illumination to view the droplets ejected by a sneeze. This visualization method produces images that clearly resolve the velocities of droplets with minimum overlapping trajectories, allowing researchers to better comprehend their flow dynamics. Furthermore, image processing techniques were required to perform precise Particle Tracking Velocimetry in order to understand the motion of discharged droplets. Some droplets are produced by ligament breakage outside the mouth, while others are produced within the respiratory tracts, according to the study [
16]. Fontes D. et al. looked into human sneezing as well. They demonstrated a series of computer simulations to explore droplet dispersion from a sneeze while adjusting a number of human physiological parameters, such as sickness, anatomy, stress level, and gender. The “model calculates the transmission risk using an approximated upper respiratory tract geometry: (1) the influence of saliva characteristics; and (2) the influence of geometric features within the buccal/nasal channels”. These impacts are linked to typical human physiological responses to sickness, stress, and sex, as well as characteristics associated with poor tooth health [
17].
Zhao B et al. presented a numerical investigation of the droplet or particle travel and distribution inside. The “drift flux model” is used to mimic droplet movement and distribution indoors during respiration by considering the settling of particles or droplets under the effect of gravitational sedimentation from sneezing or coughing, while the simplified model for solving continuous fluid flow is combined. The findings show that droplets or particles produced during normal breathing travel a short distance, whereas droplets or particles produced during coughing or sneezing move at a higher velocity and contain a more significant percentage of larger droplets; they may travel longer distances, potentially posing a threat to human bodies’ ability to defend against SARS or other infectious diseases [
18].
The temperature influence of the human body on the time-dependent dispersion of cough droplets with the evaporation process was numerically examined by Yan Y et al. A 3D thermal manikin with genuine body features was used to model the thermal flow of the human body. By comparing the data obtained without and with human body heat, it was discovered that human body heat has a significant impact on the droplets’ mass fraction and local air velocity distributions. With evaporation reducing droplet size and human heat impact lifting droplets into the breathing zone, cough droplet inhalability and infection risks would be significantly higher in real populated indoor environments [
19]. To explore the transport, dispersion, and evaporation of saliva particles produced by a human cough, heat transfer and computational multiphase fluid dynamics were used by Dbouk T. et al. Saliva droplets were ejected into the air to replicate the actual incidence. Given the circumstances, their findings show that a 2 m social distance may not be sufficient. [
20]. While coughing and exhalation both produce droplets, this study’s scope is concerned with the latter.
Specifically, it is an attempt to show a comparison of expiratory droplet deposition density on the hard non-porous surfaces of interior residential spaces during normal daily activities using graphic evidence and image analysis.
2. Materials and Methods
This research was designed to use graphical techniques that record the amount of splatter falling on interior surfaces. To do that, the plan was to use a tool that simulated droplet spray from the nose and mouth. The original tools in mind were a small duster and colored powder. The powder would be dispensed manually. A pilot test was conducted and failed. That initiated a process of searching for the proper dispersion, media, spray mechanism, and spray recording medium. The expiratory exhale airflow dynamics from the nose and mouth, direction, strength, and bloom shape during normal daily movement and activities were also studied.
2.1. Dispersion Mechanism Tests
Several mechanisms for droplet dispersion and recording mediums were tested. The objective was to achieve the best simulation means that could match the mechanics of human exhaling of breath and still be suitable for the investigation. Droplet signatures on the interior surfaces of the room had to be of appropriate size and recognizable, i.e., on the larger scale of human droplets.
2.2. Means of Dispersal
Powder dusters were tested first. They were one of the reasons this research was undertaken as it seemed to be an ideal simulation system since it was thought that powder with fine consistency could be found that leaves a recognizable imprint on surfaces and could also be easily cleaned from the room. None of the above proved to be true. As mentioned in the literature survey, the size of droplets from human exhalation is not uniform [
7,
8]. The dispensing mechanism proved challenging to control; the output spray was highly inconsistent, sometimes producing none of the droplets, in others, too many. Worst still, the powder coagulated with humidity after a few minutes. Although a solution to the coagulation was found in using ground coffee, the remaining problems precluded this system.
After the failure of the dust dispenser, other means of dispersion were tested, and all used liquid pigment. These included simple bottle sprays, pressurized crop spray bottles, electric spray bottles, and small “mist” 50 mL spray bottles. The latter were found to be the best as they were easy to control, and the droplet size and variation seemed suitable. The size of droplets expected from the mist spray bottle should mainly be between 24–100 [
21], which is in the upper range of human exhalation droplet size [
12], and precisely what this experiment required.
Several types of pigment were tested, including watercolors, gauche, and glitter. All had deficiencies. They were inconsistent, settled at the bottom, and clogged the nozzle. Fountain pen ink and food coloring behaved well and were easily distinguishable on the recording surface. Food coloring was eventually chosen due to its availability and ease of cleaning on the room surfaces after testing.
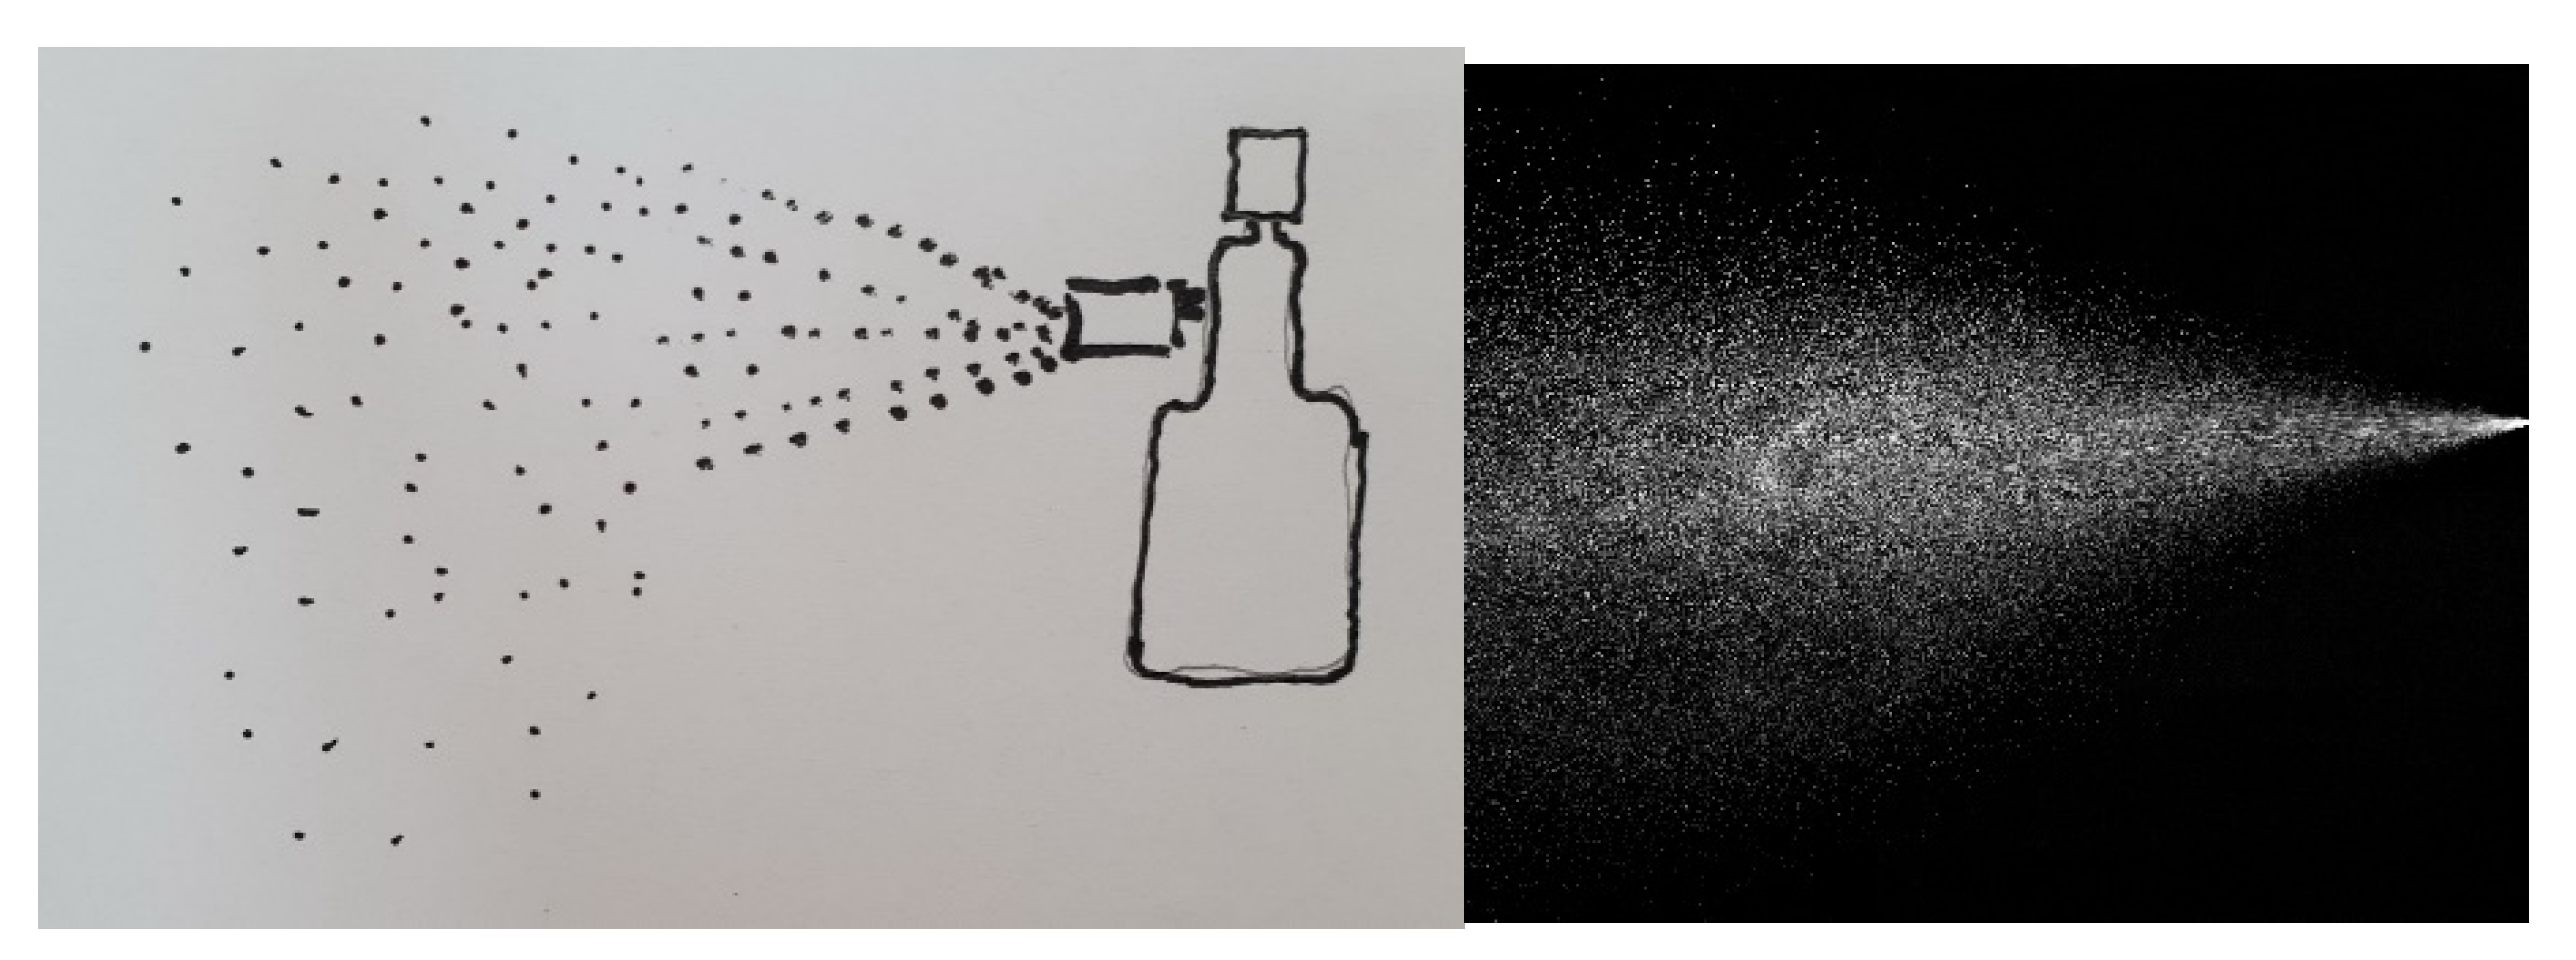
The spray behavior from these bottles was observed in low light conditions with a single light beam directed at a horizontal spray. The droplets sped forward upon leaving the nozzle. The speed and size of the droplets decreased almost immediately after, then gravitated slowly downward with decreasing size and speed. The pattern of the spray is shown in
Figure 1. This behavior matches the literature’s description of the human exhalation droplet dispersion [
15,
18].
2.3. Spray Recording Medium
Several types and sizes of paper were tested to collect and record the spray pattern and droplet deposition. The requirement was for one that did not spread the liquid droplets and, at the same time, absorbed enough and at a rate that preserved the color and size of the pigment. The paper also had to be as white as could be found to keep the contrast between the colored pigment and the background as distinct as possible, as that would aid the image processing. Eventually, an A3 paper size was chosen from ATK International’s “Color Card Book”, which was made in China.
2.4. Breath Exhale Bloom
Four tests were conducted to estimate the size, shape, and direction of the exhaled breath bloom—strong exhale from nose and mouth and slow exhale from both as well. The photographic results can be seen in
Figure 2,
Figure 3 and
Figure 4.
- 1 .
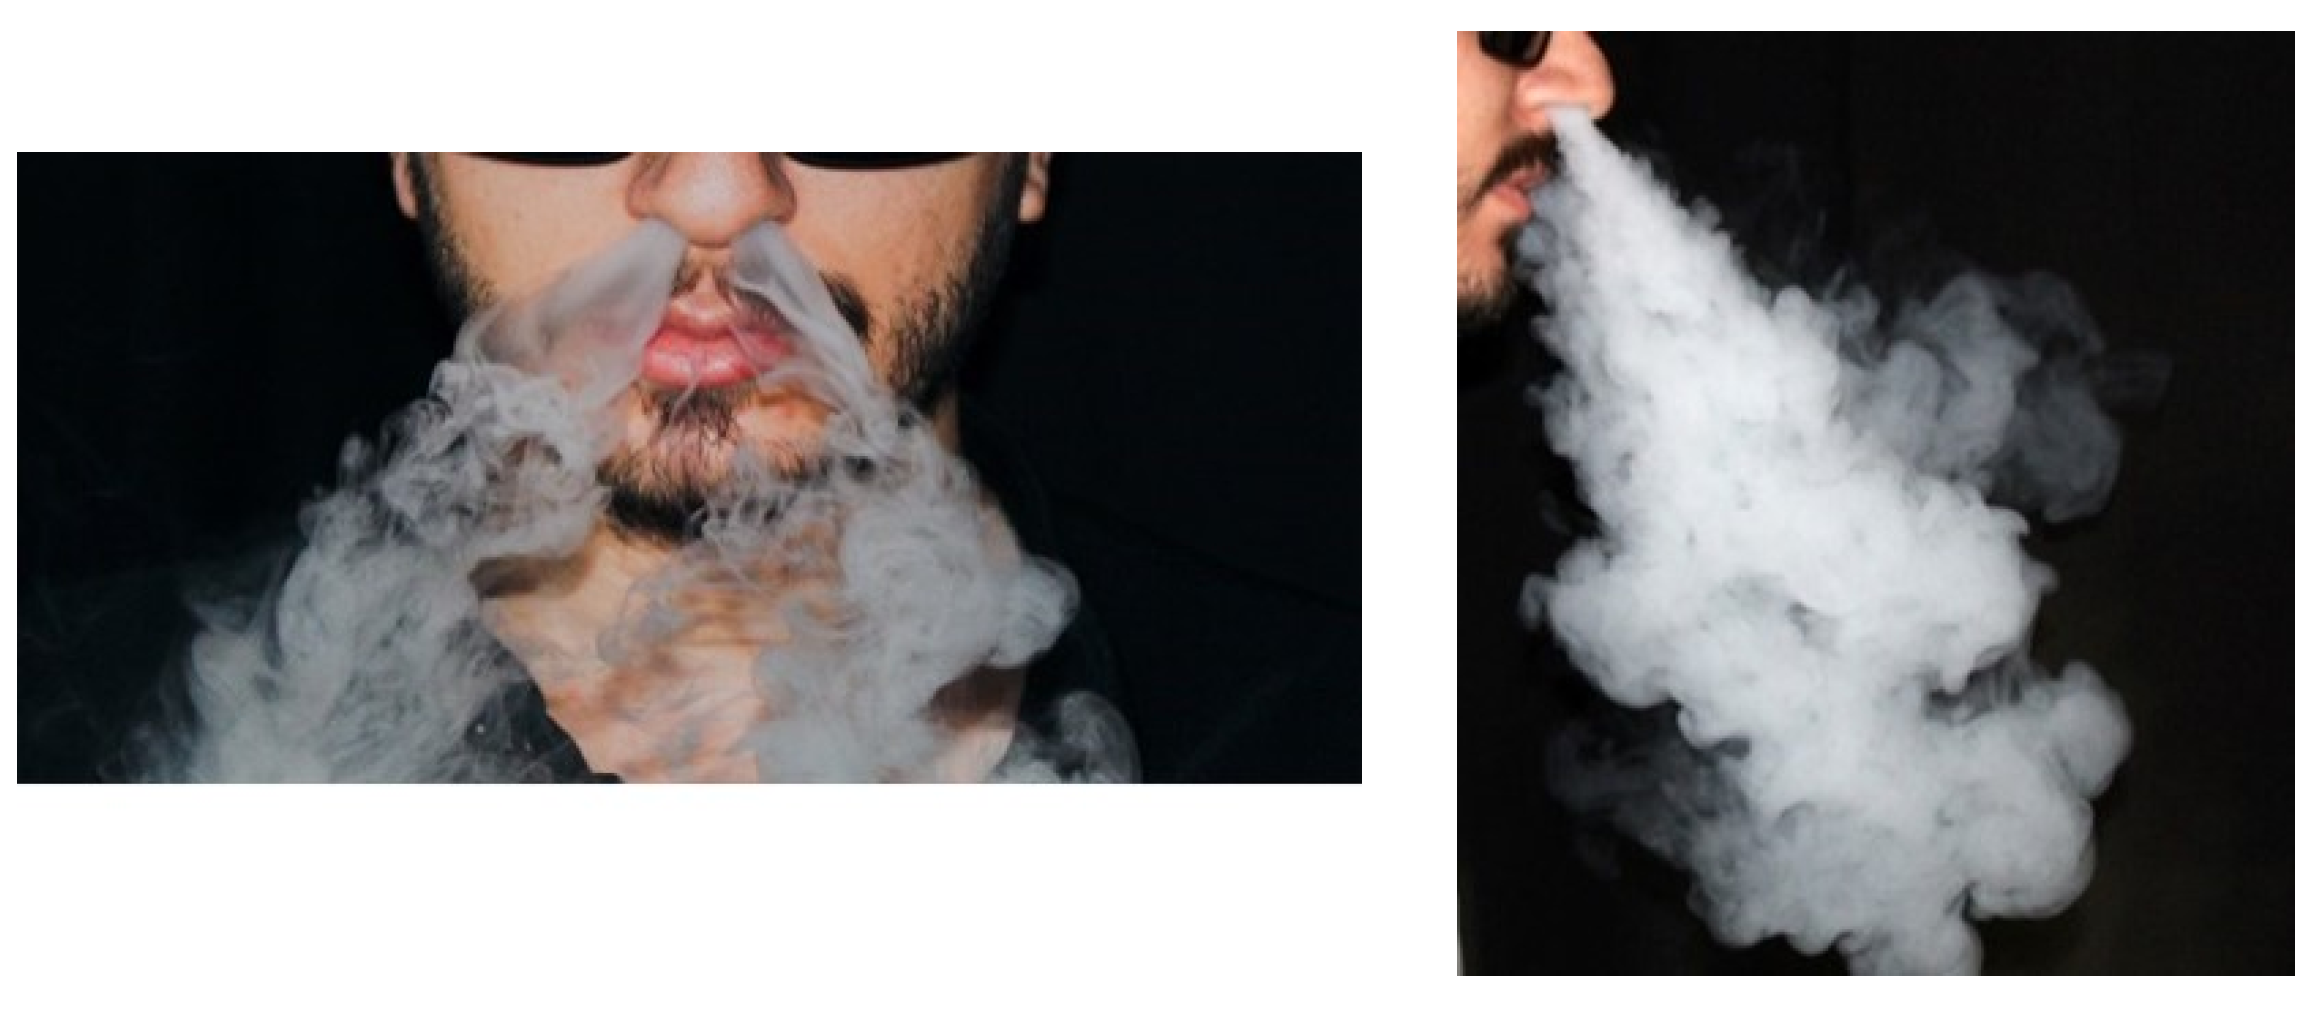
Strong exhale from the nose
Figure 2.
Strong exhale blooms from the nose (images by author).
Figure 2.
Strong exhale blooms from the nose (images by author).
- 2 .
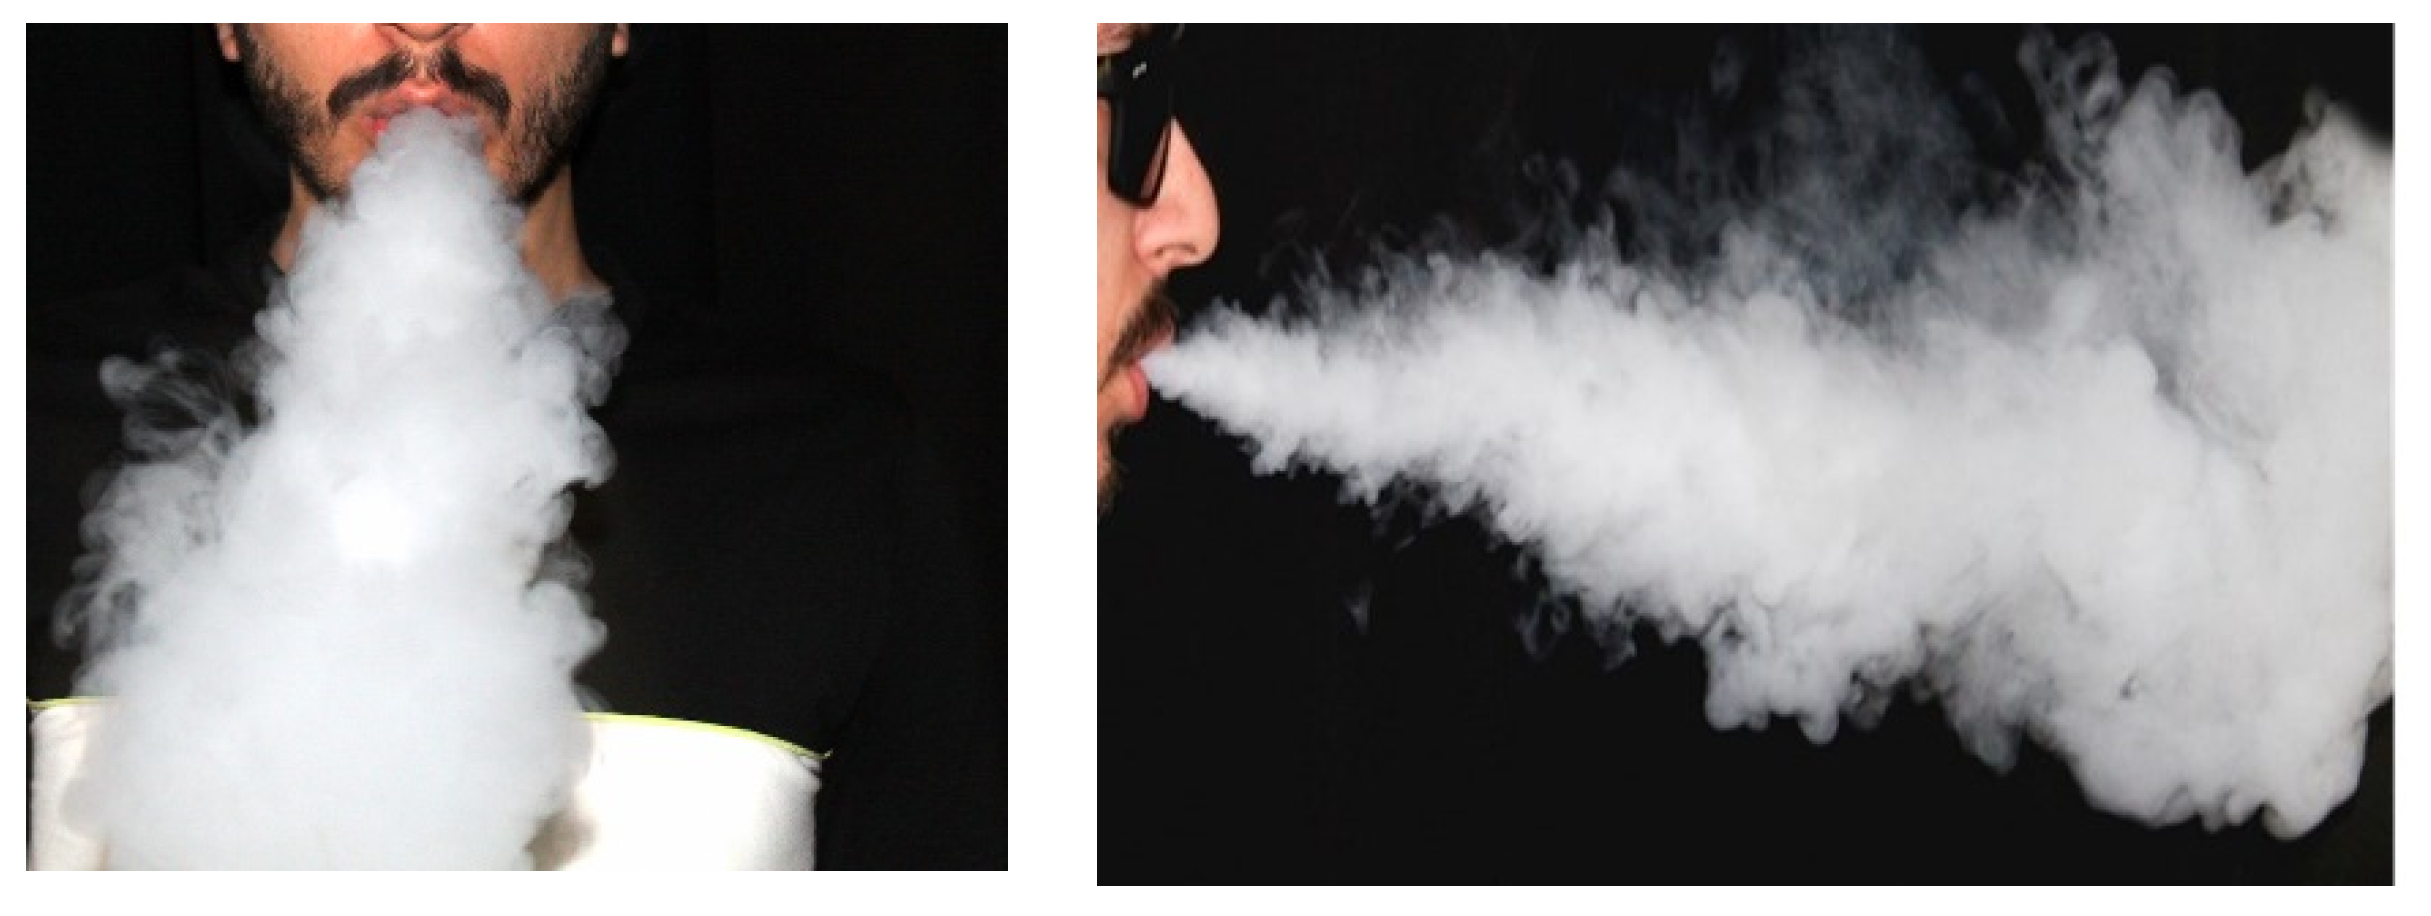
Strong exhale from the mouth
Figure 3.
Strong exhale from the mouth (images by author).
Figure 3.
Strong exhale from the mouth (images by author).
- 3 .
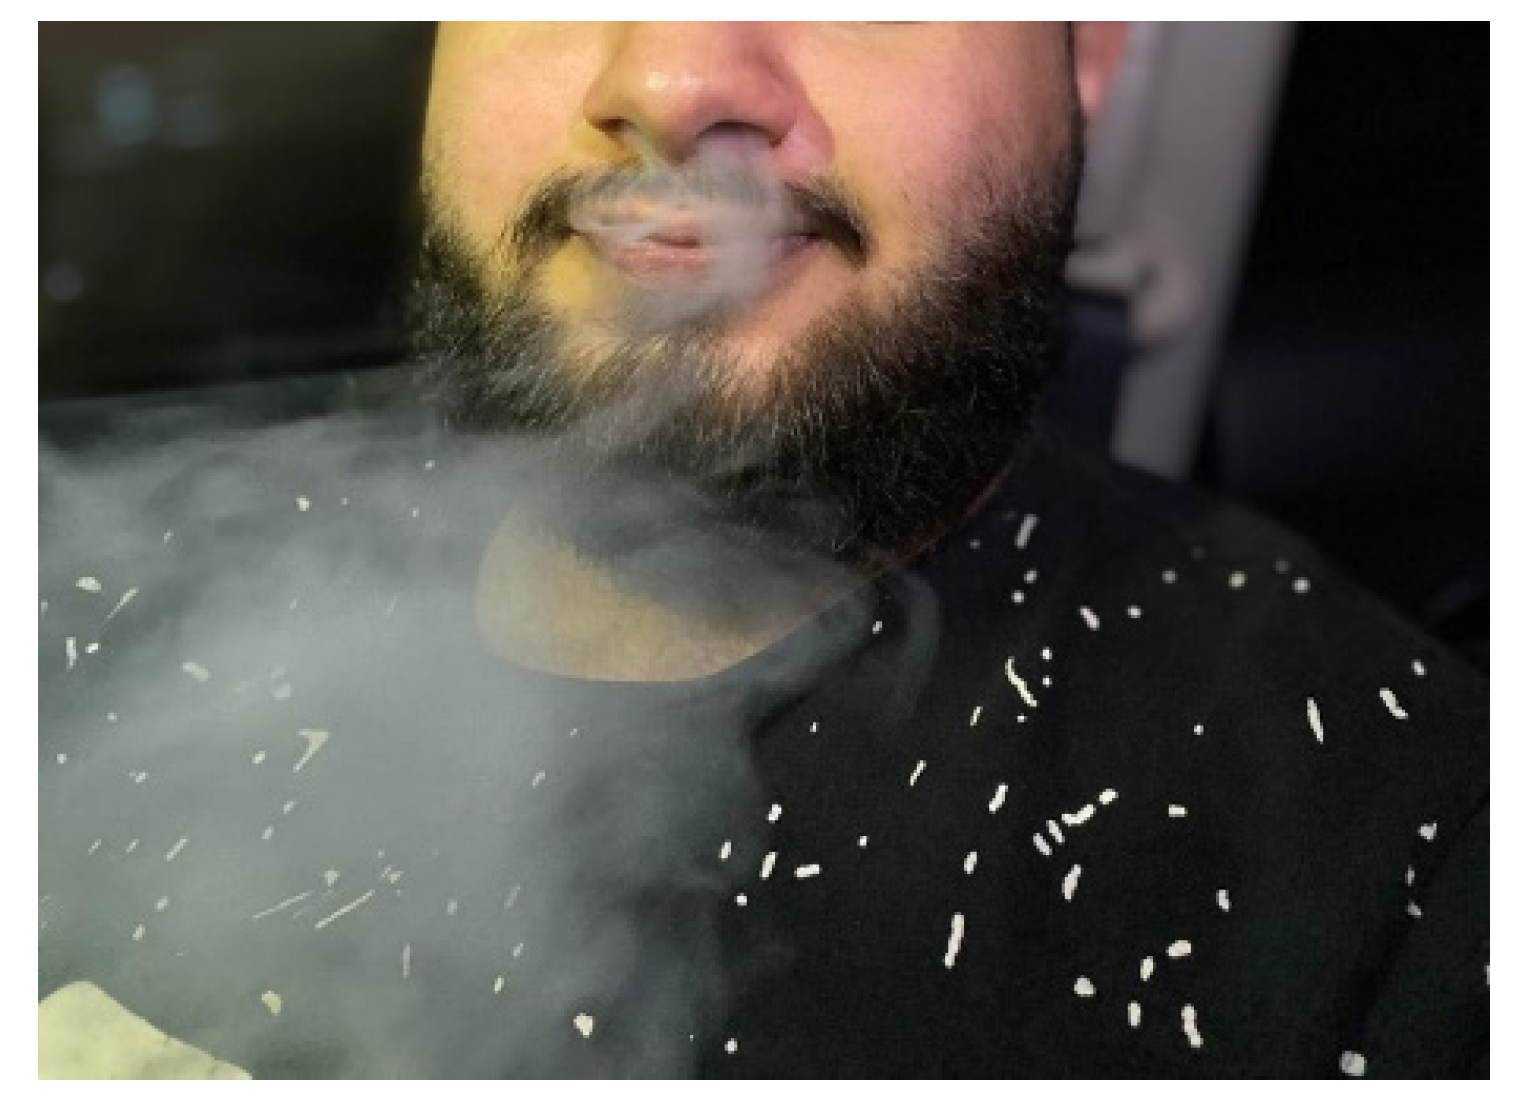
Slow exhale
Figure 4.
Front image of slow exhale from the nose (image by author).
Figure 4.
Front image of slow exhale from the nose (image by author).
The strong exhale was largely uniform and extended to a distance of around 60 cm from the mouth and 40 cm from the nose. The direction of each was different, as seen in the figures. The slow exhale had an indeterminate shape with a wide spread and short throw, as can be seen in
Figure 4.
The results of these tests were used to simulate dispersion in the following experiments by manipulating the spray bottle to mimic the exhale directions.
2.5. Selection of Activities
A survey was conducted on the residents of the building that contained the test room. Questions were asked as to which activities were performed in the flat, where they were performed, and for how long. Sixteen occupants were polled.
Variations were quite noticeable between the residents. The area in which most activities were performed, and for the longest periods, was the bed. Other popular areas included the sofa, table, and kitchen. Nevertheless, for the purposes of this paper, the bed was excluded. Even without any daily activities, the bed is certain to receive a heavy load of exorbitant breath droplets during nighttime sleep. However, any microbial or virus deposits will be trapped in the fibers. Only hard surfaces that might facilitate the transfer of microbes were chosen for testing.
The preliminary list of activities and their locations were:
To this list were added activities that resulted from visiting friends since they would be the target and the means of transfer of the microbes.
3. Results
3.1. The Dispersion Simulations
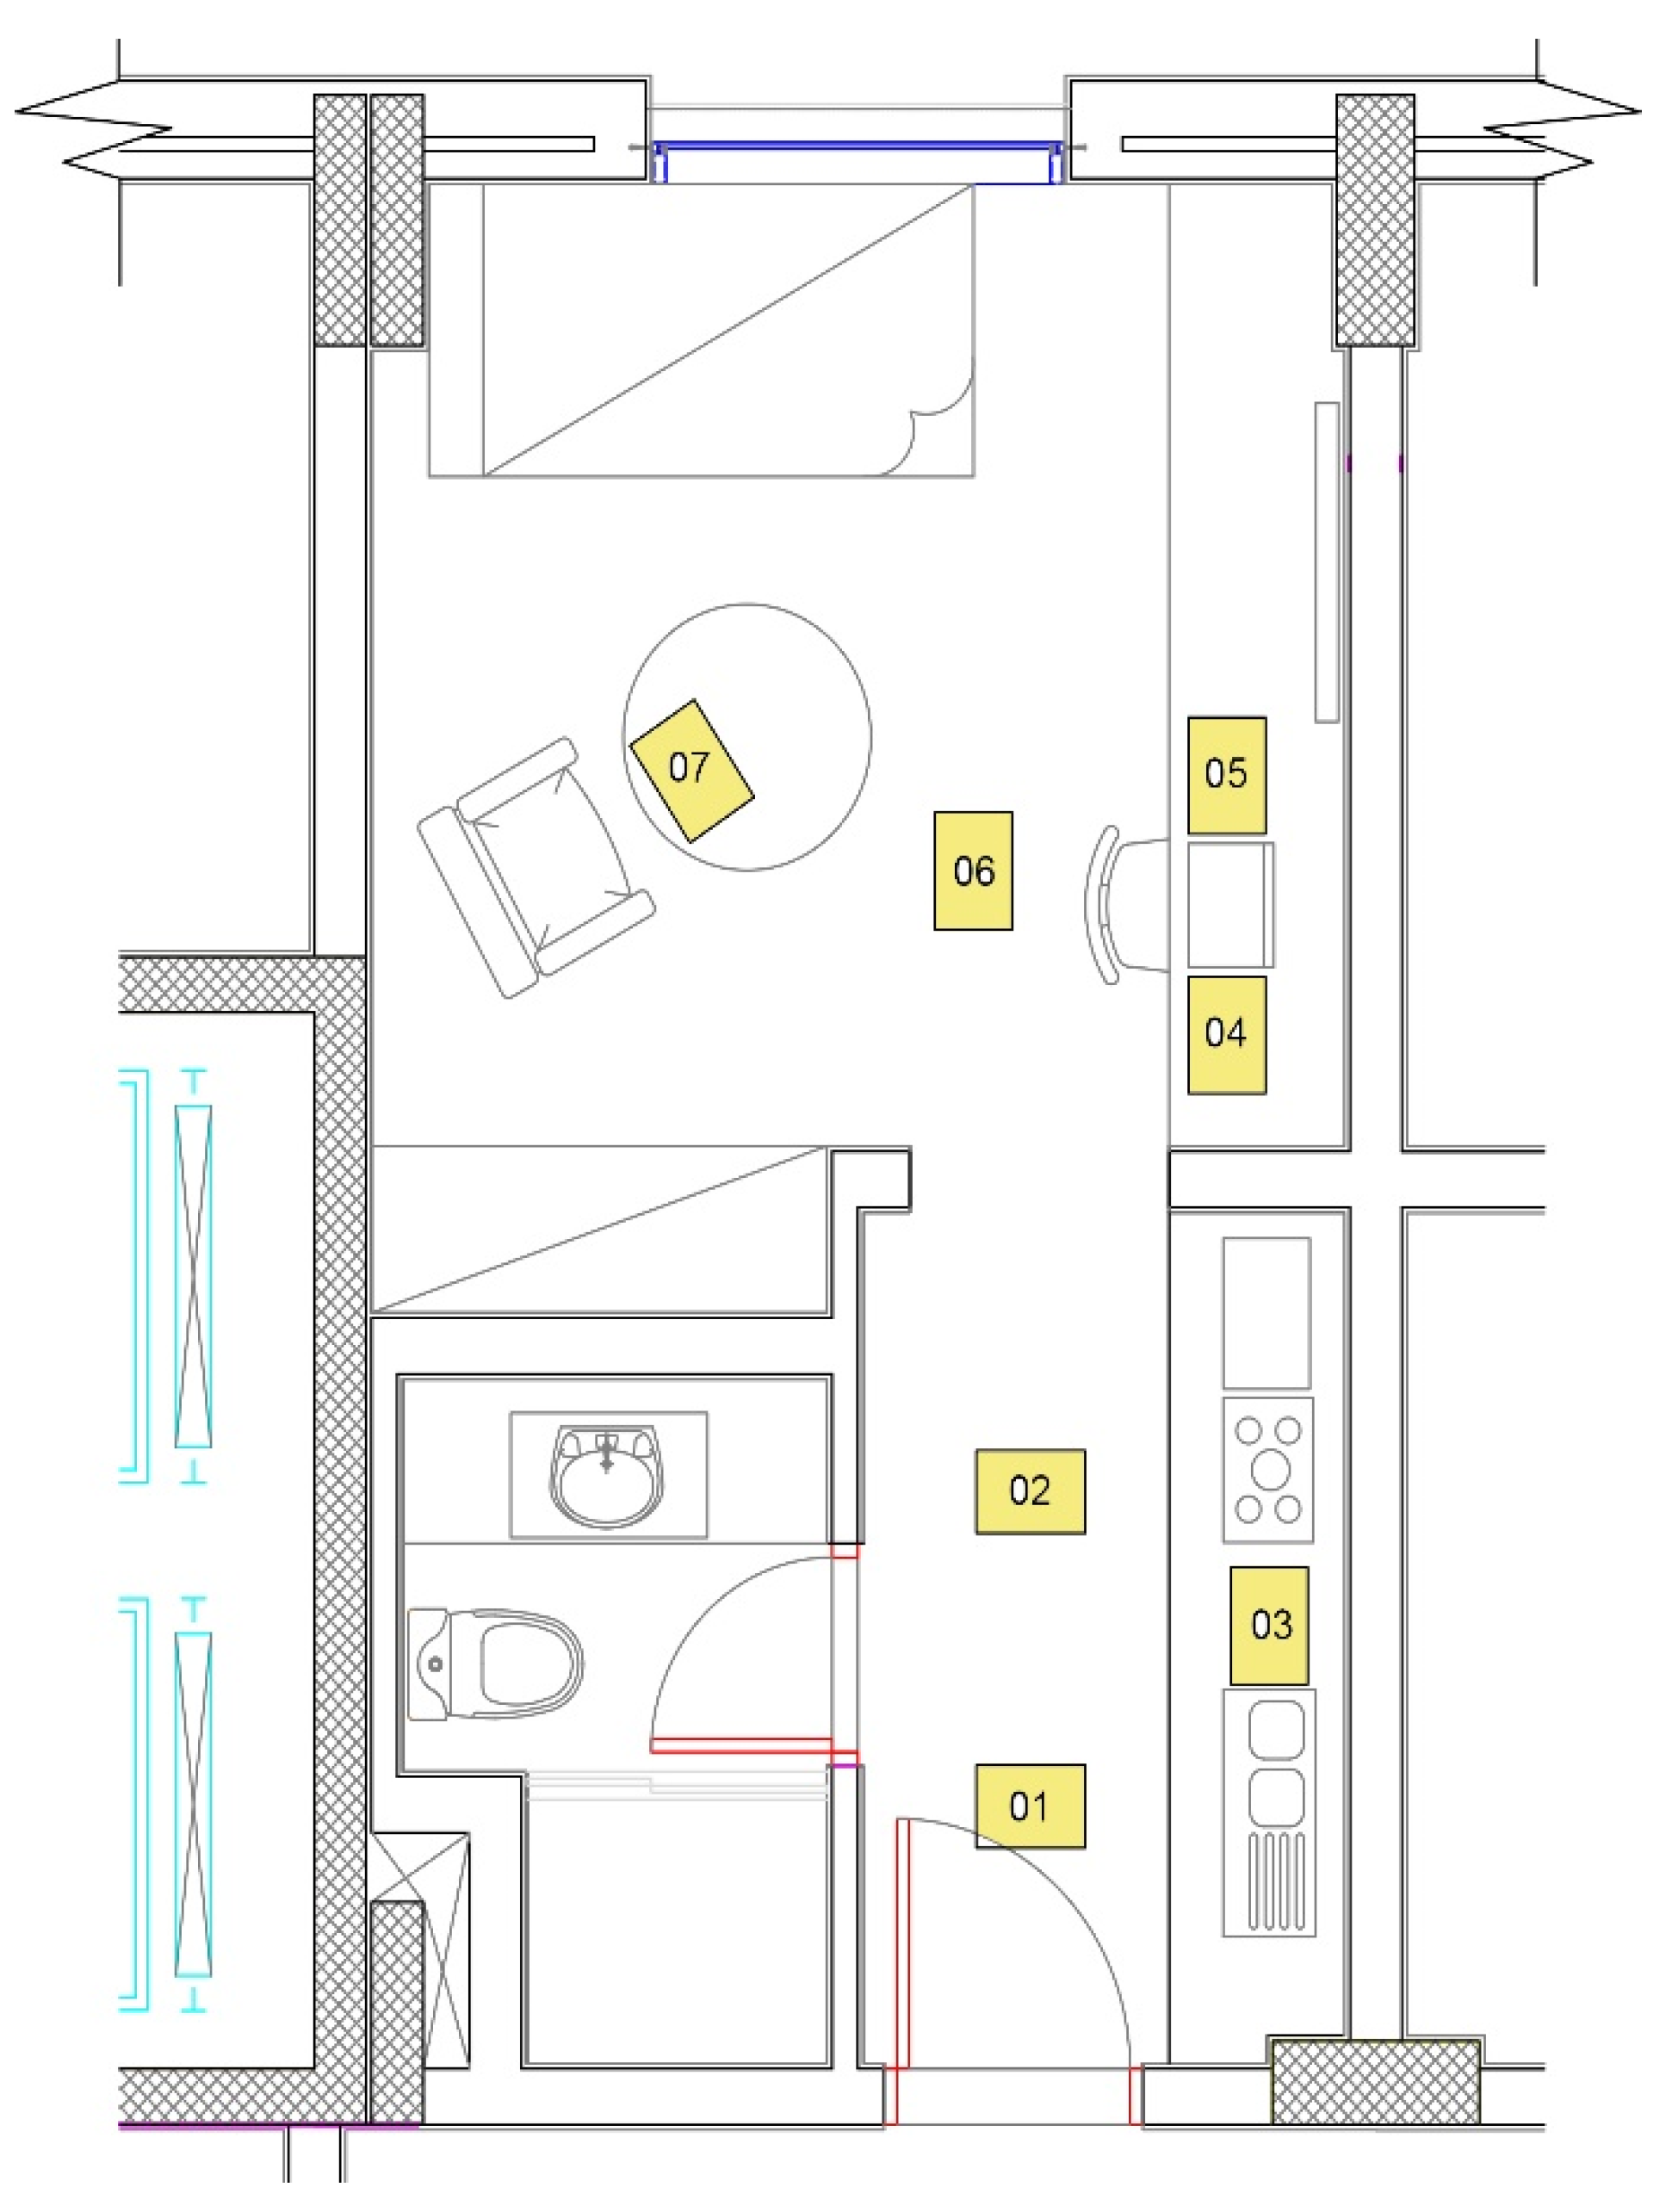
A student hostel room was reserved for the tests. An architectural plan may be seen in
Figure 5, which also shows the data collection points. The flat is 3.4 × 7.2 m wall to wall, including the kitchen and bathroom. The height in the latter two spaces is 2.2 m, while in the living room, it is 4 m. The air conditioning output fluctuated between 2.5 and 3.5 m/s at full capacity. At that rate, the air change in the flat would be around 10 times per hour. The ventilation rate is constant based on the air conditioning setting. There is one window with only a small part that can only be partially opened due to municipality safety restrictions.
A pilot simulation was run first. A total of seven persons were required to perform the simulation run. Three served as actors. One performed the activities, another sprayed the mist, and a third acted as a visitor. The fourth person timed each activity, the fifth pictured the process, the sixth took videos, and a controller directed and documented the simulations.
White A3 size sheet of paper was used to collect the spray at pre-designated locations in the room. These were named or numbered on the back, and a key was included to show each paper and its location. This can be seen in
Figure 5. The papers in the plan are numbered 1–7. A further set was used for the mobile, a magazine, a face mask for the visitor, and a remote control, which raised the count to 18.
3.2. The First Test—Pilot Test
A pilot test was conducted to assess the data collection methodology. Each activity was predetermined between 1–3 min, as shown in
Table 1. A stopwatch was used, and a controller ensured that the timings were as accurate as possible. The activities started on his count and stopped immediately at his signal.
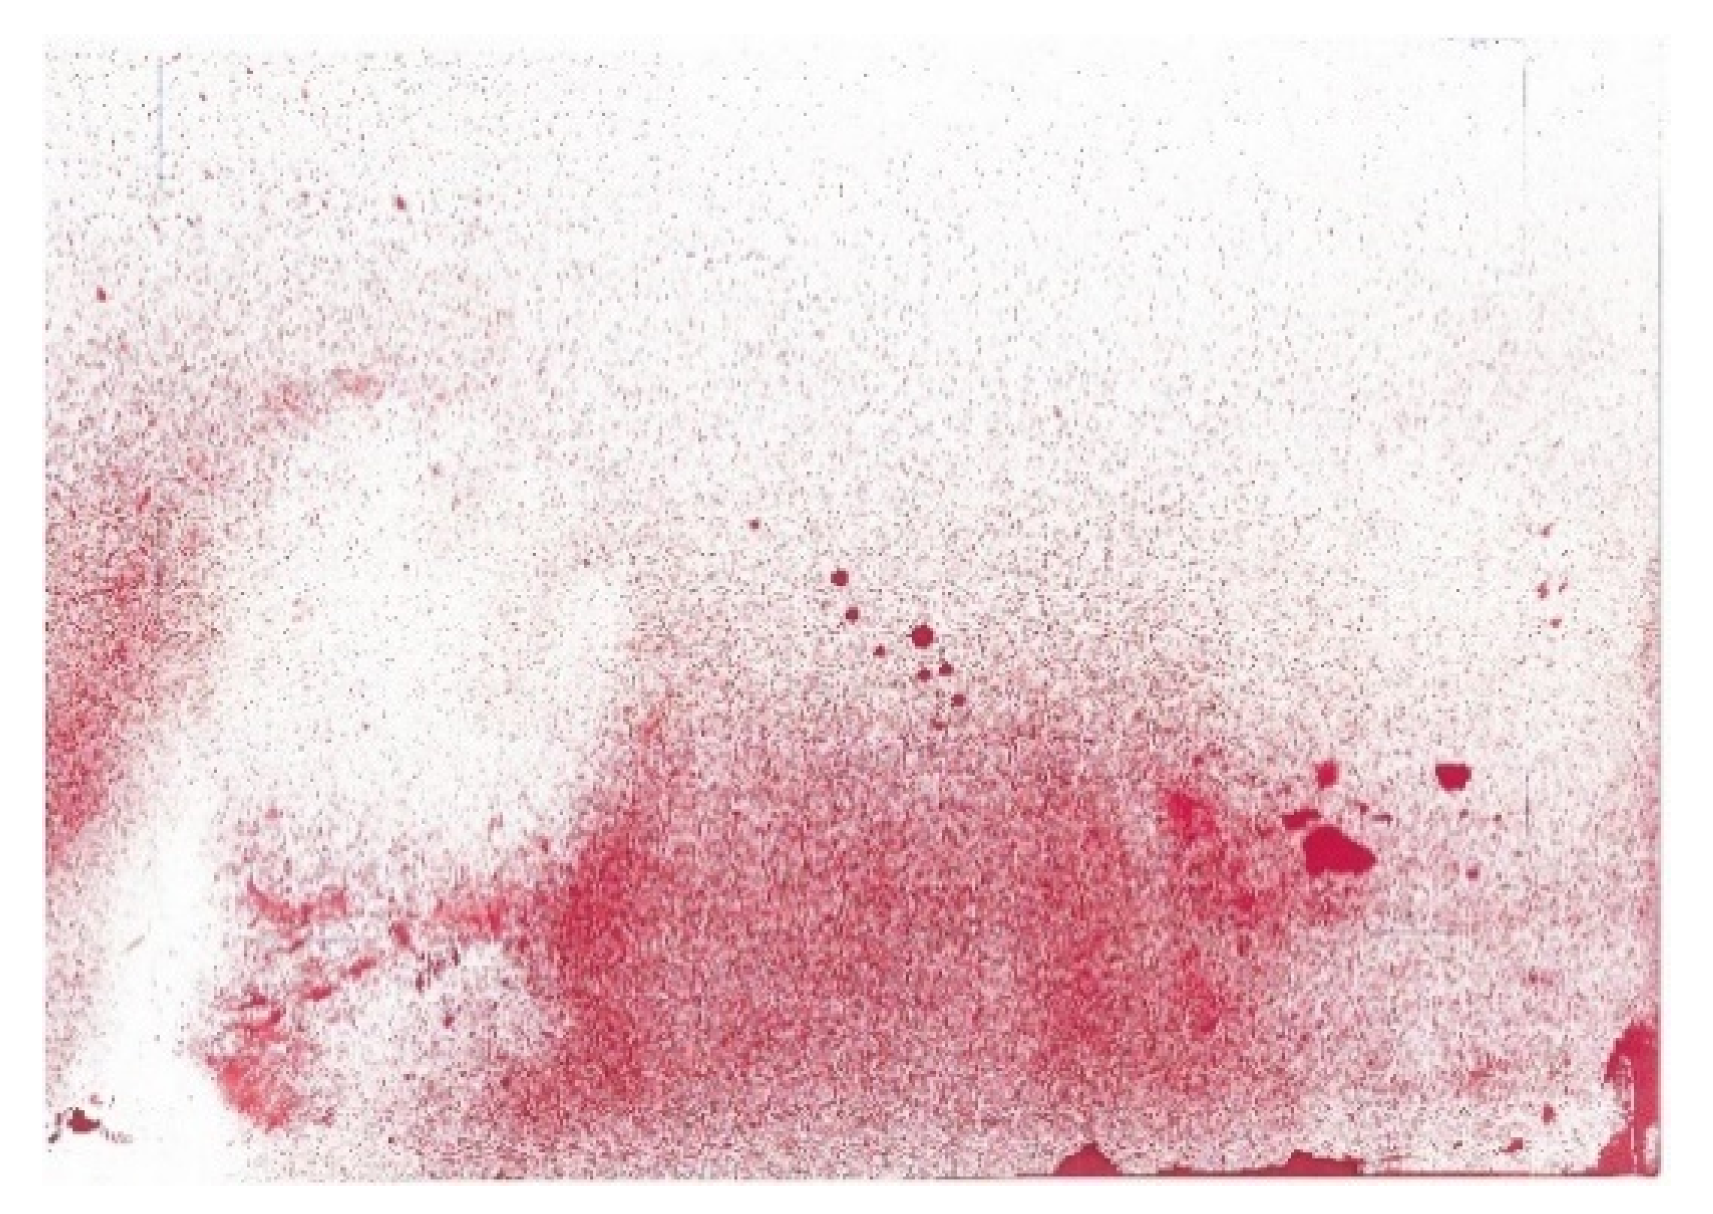
At the conclusion of the test, it was noticed that too much spray had gathered on the most susceptible surfaces, as can be seen in
Figure 6, which was the paper that was covering the laptop keyboard. That led to the liquid coalescing into blobs which can be clearly seen in the image. These can reduce the accuracy of the test. It was necessary to perform the simulations for a period that showed enough droplets on the recording paper medium to see results visibly but, at the same time, not to overspray so that the droplets coalesce.
It was also noticed that the person spraying the medium needed two bottles and some training to distinguish nose versus mouth exhale, as well as speech. The latter requires the spray to be directed forward, as seen in
Figure 3. Furthermore, the actor performing the activities needed to move in sync with him.
3.3. The Test Proper
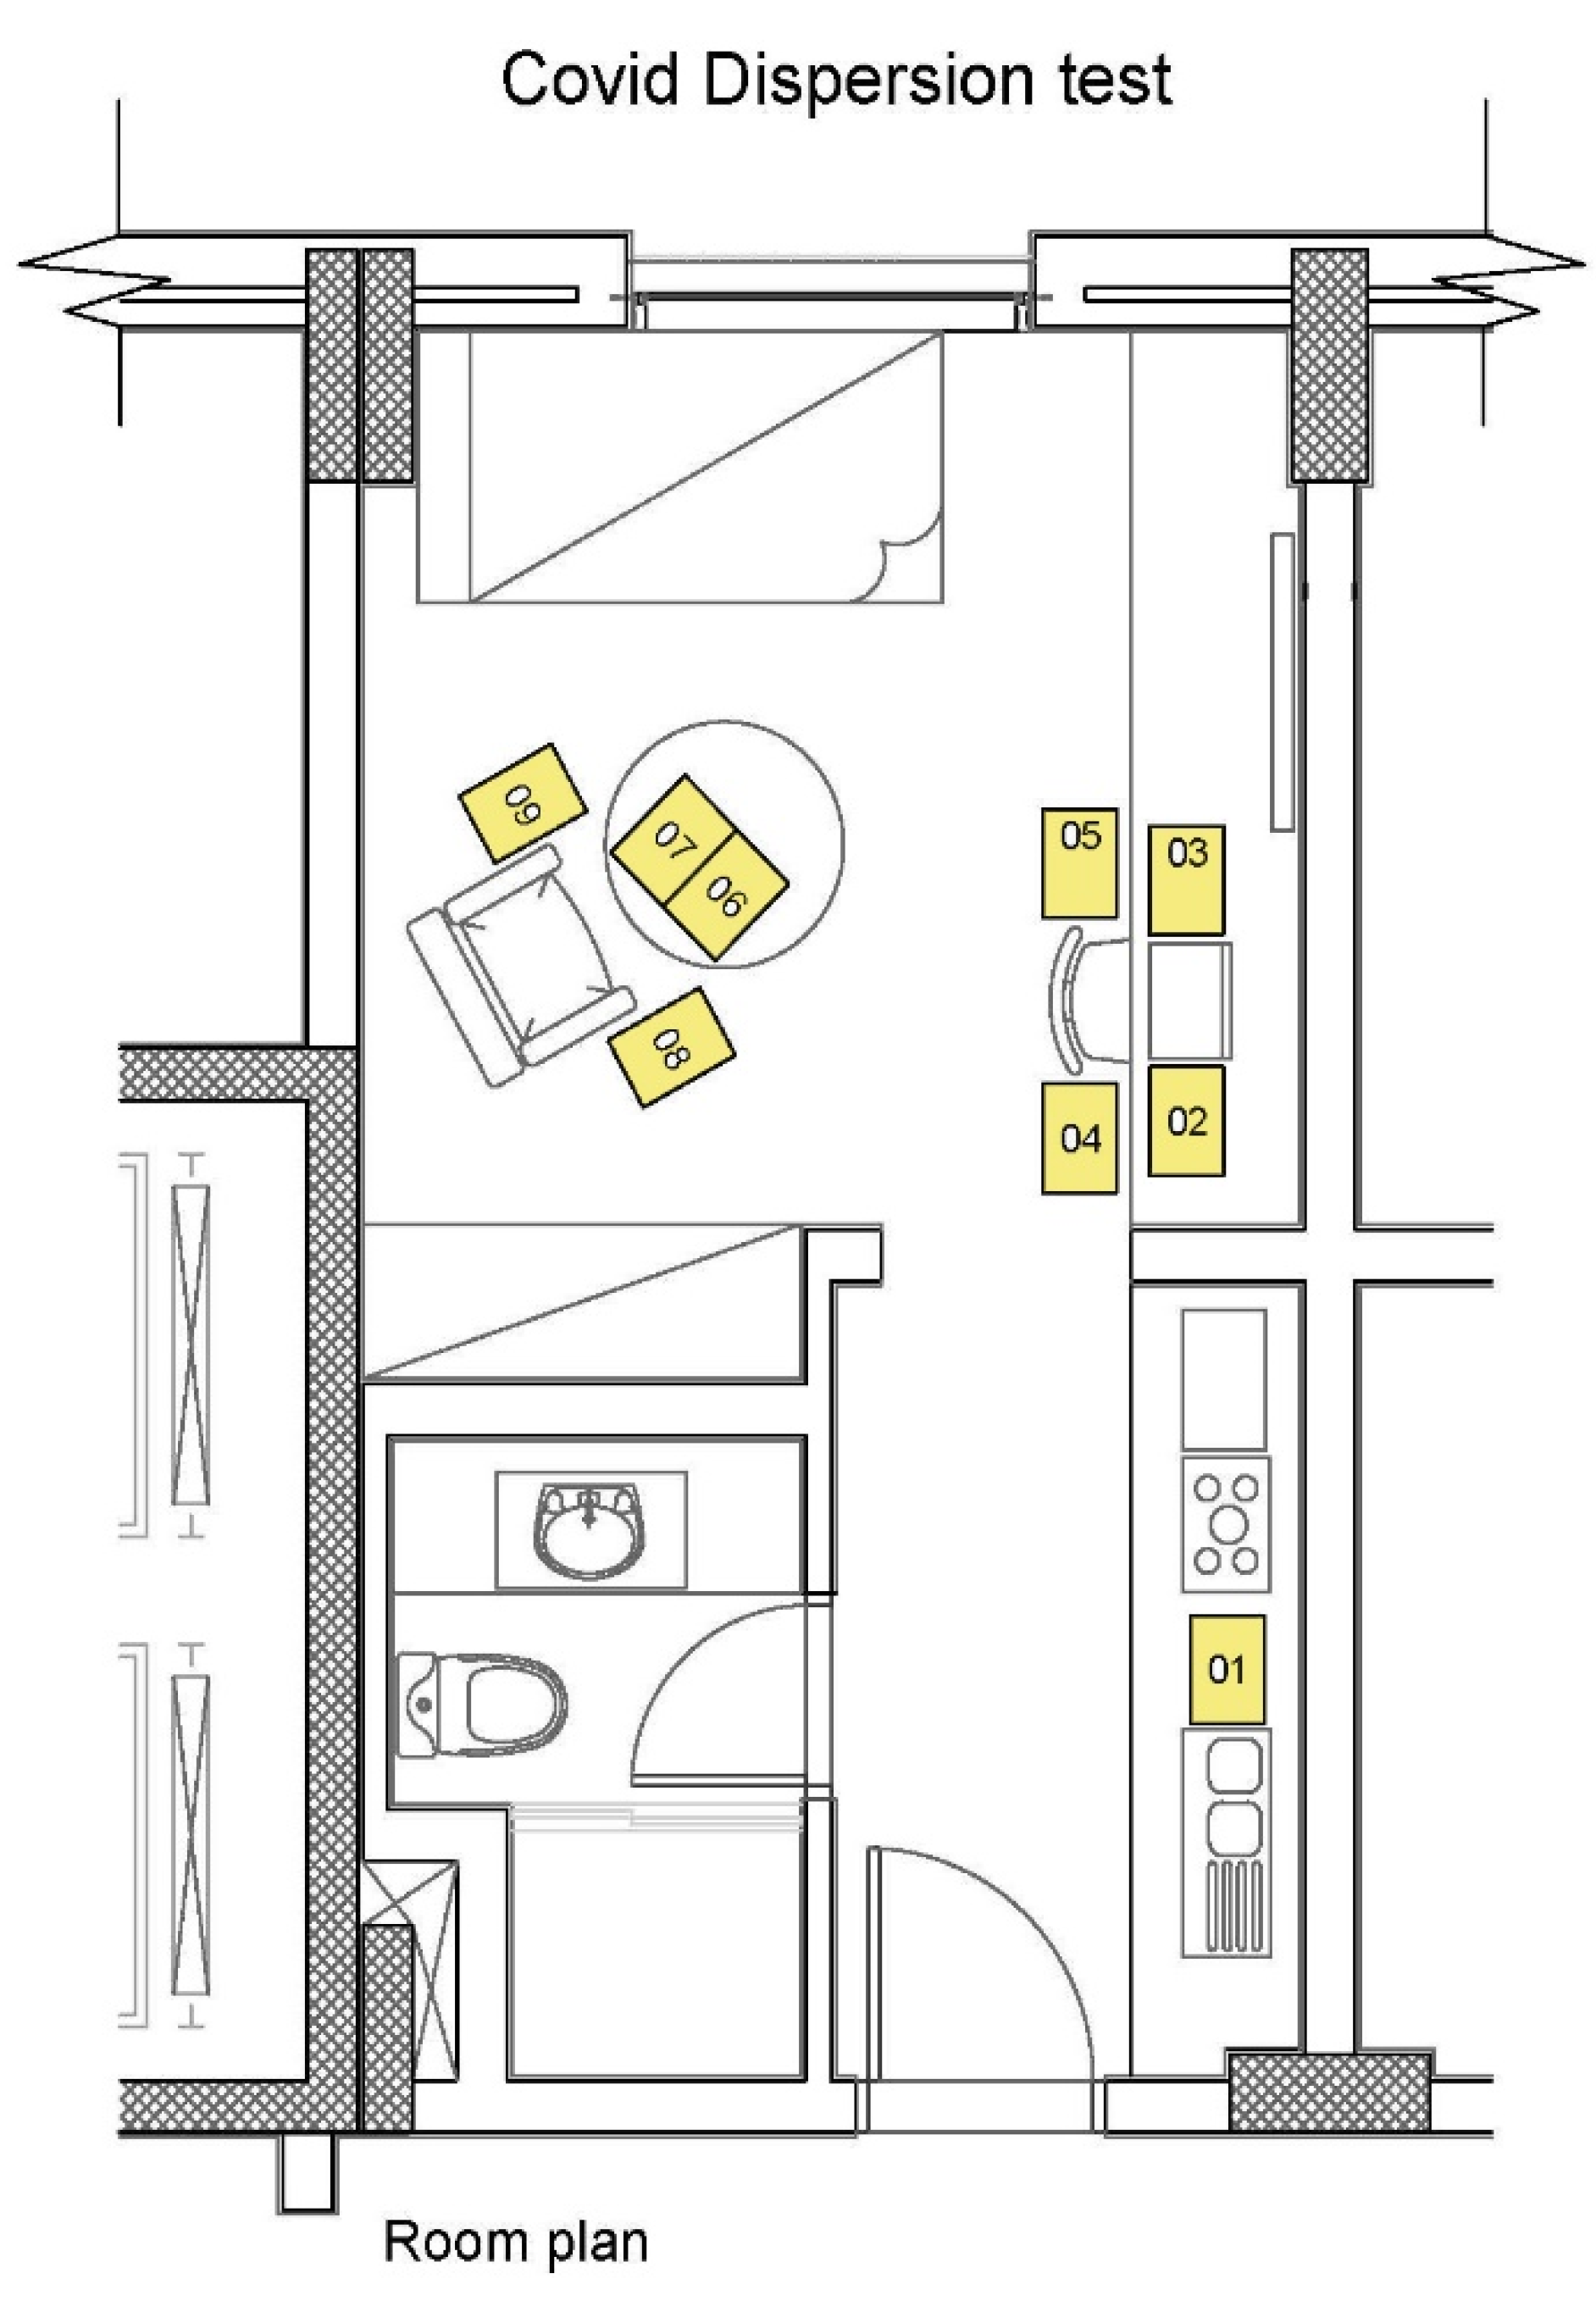
The second and final test was conducted using more recording surfaces and a smaller duration of 1 min for all the activities. The new recording paper locations can be seen in
Figure 7. Some spray that was noticed on the floor during the pilot 3–5-min test was not so visible in 1-min runs, although the computer scans were able to detect them.
Two runs were made during this test—the one with no ventilation, when the window was closed, and the air conditioning was off; the second run was made with the window open and the air conditioning on to increase air movement.
The temperature was 24 °C, and the relative humidity was 58%.
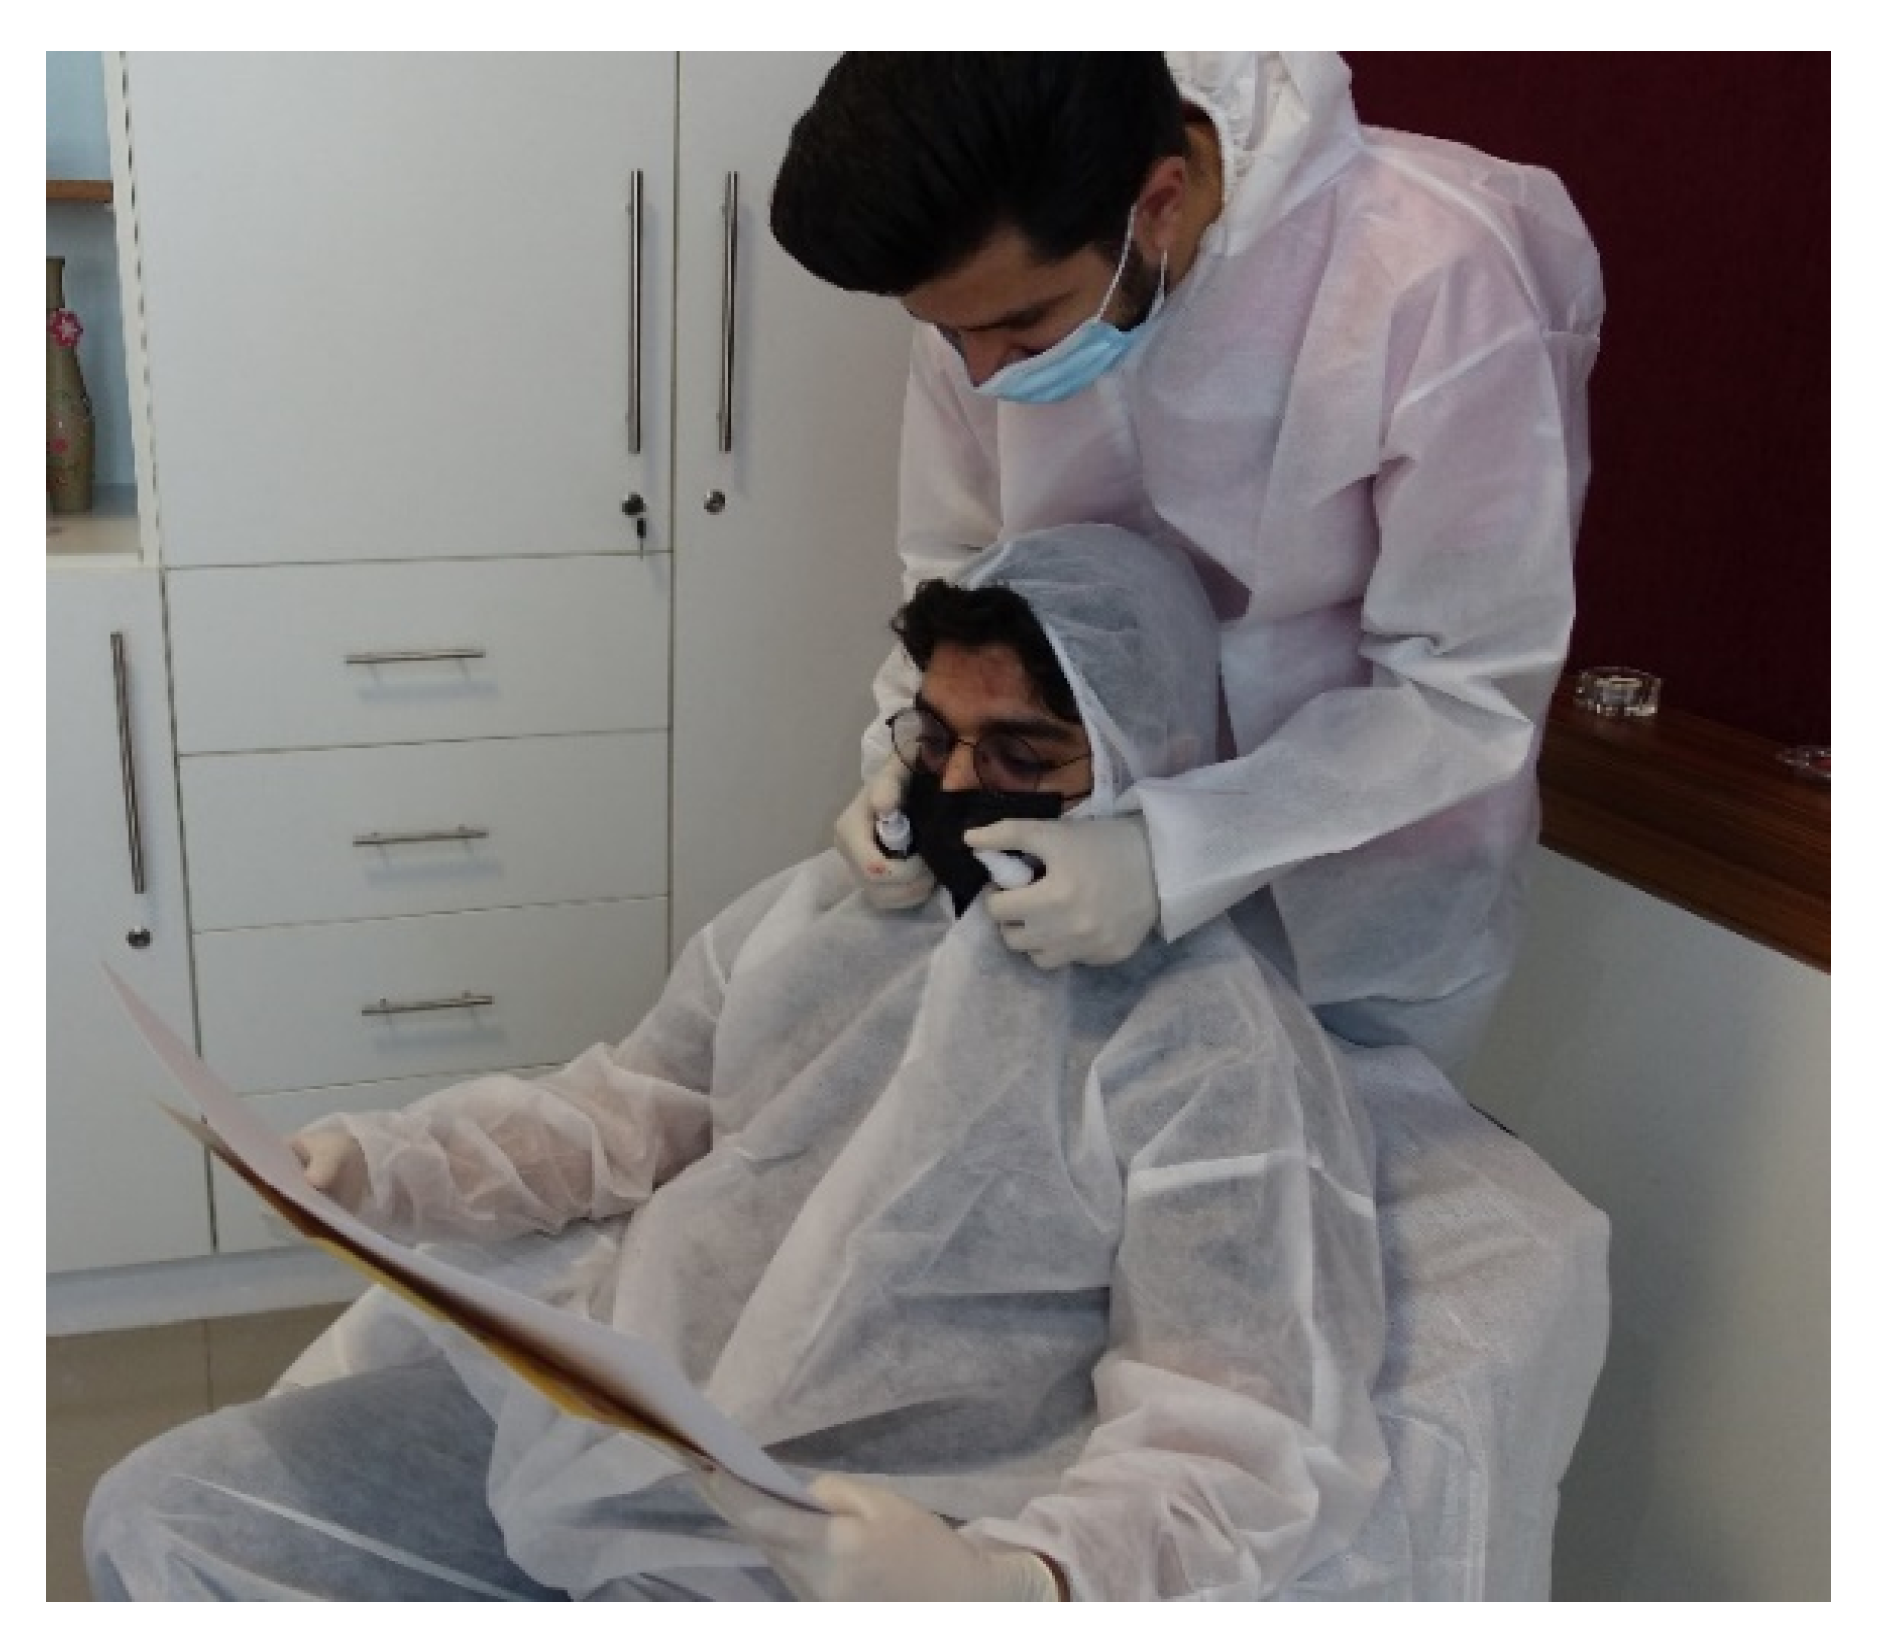
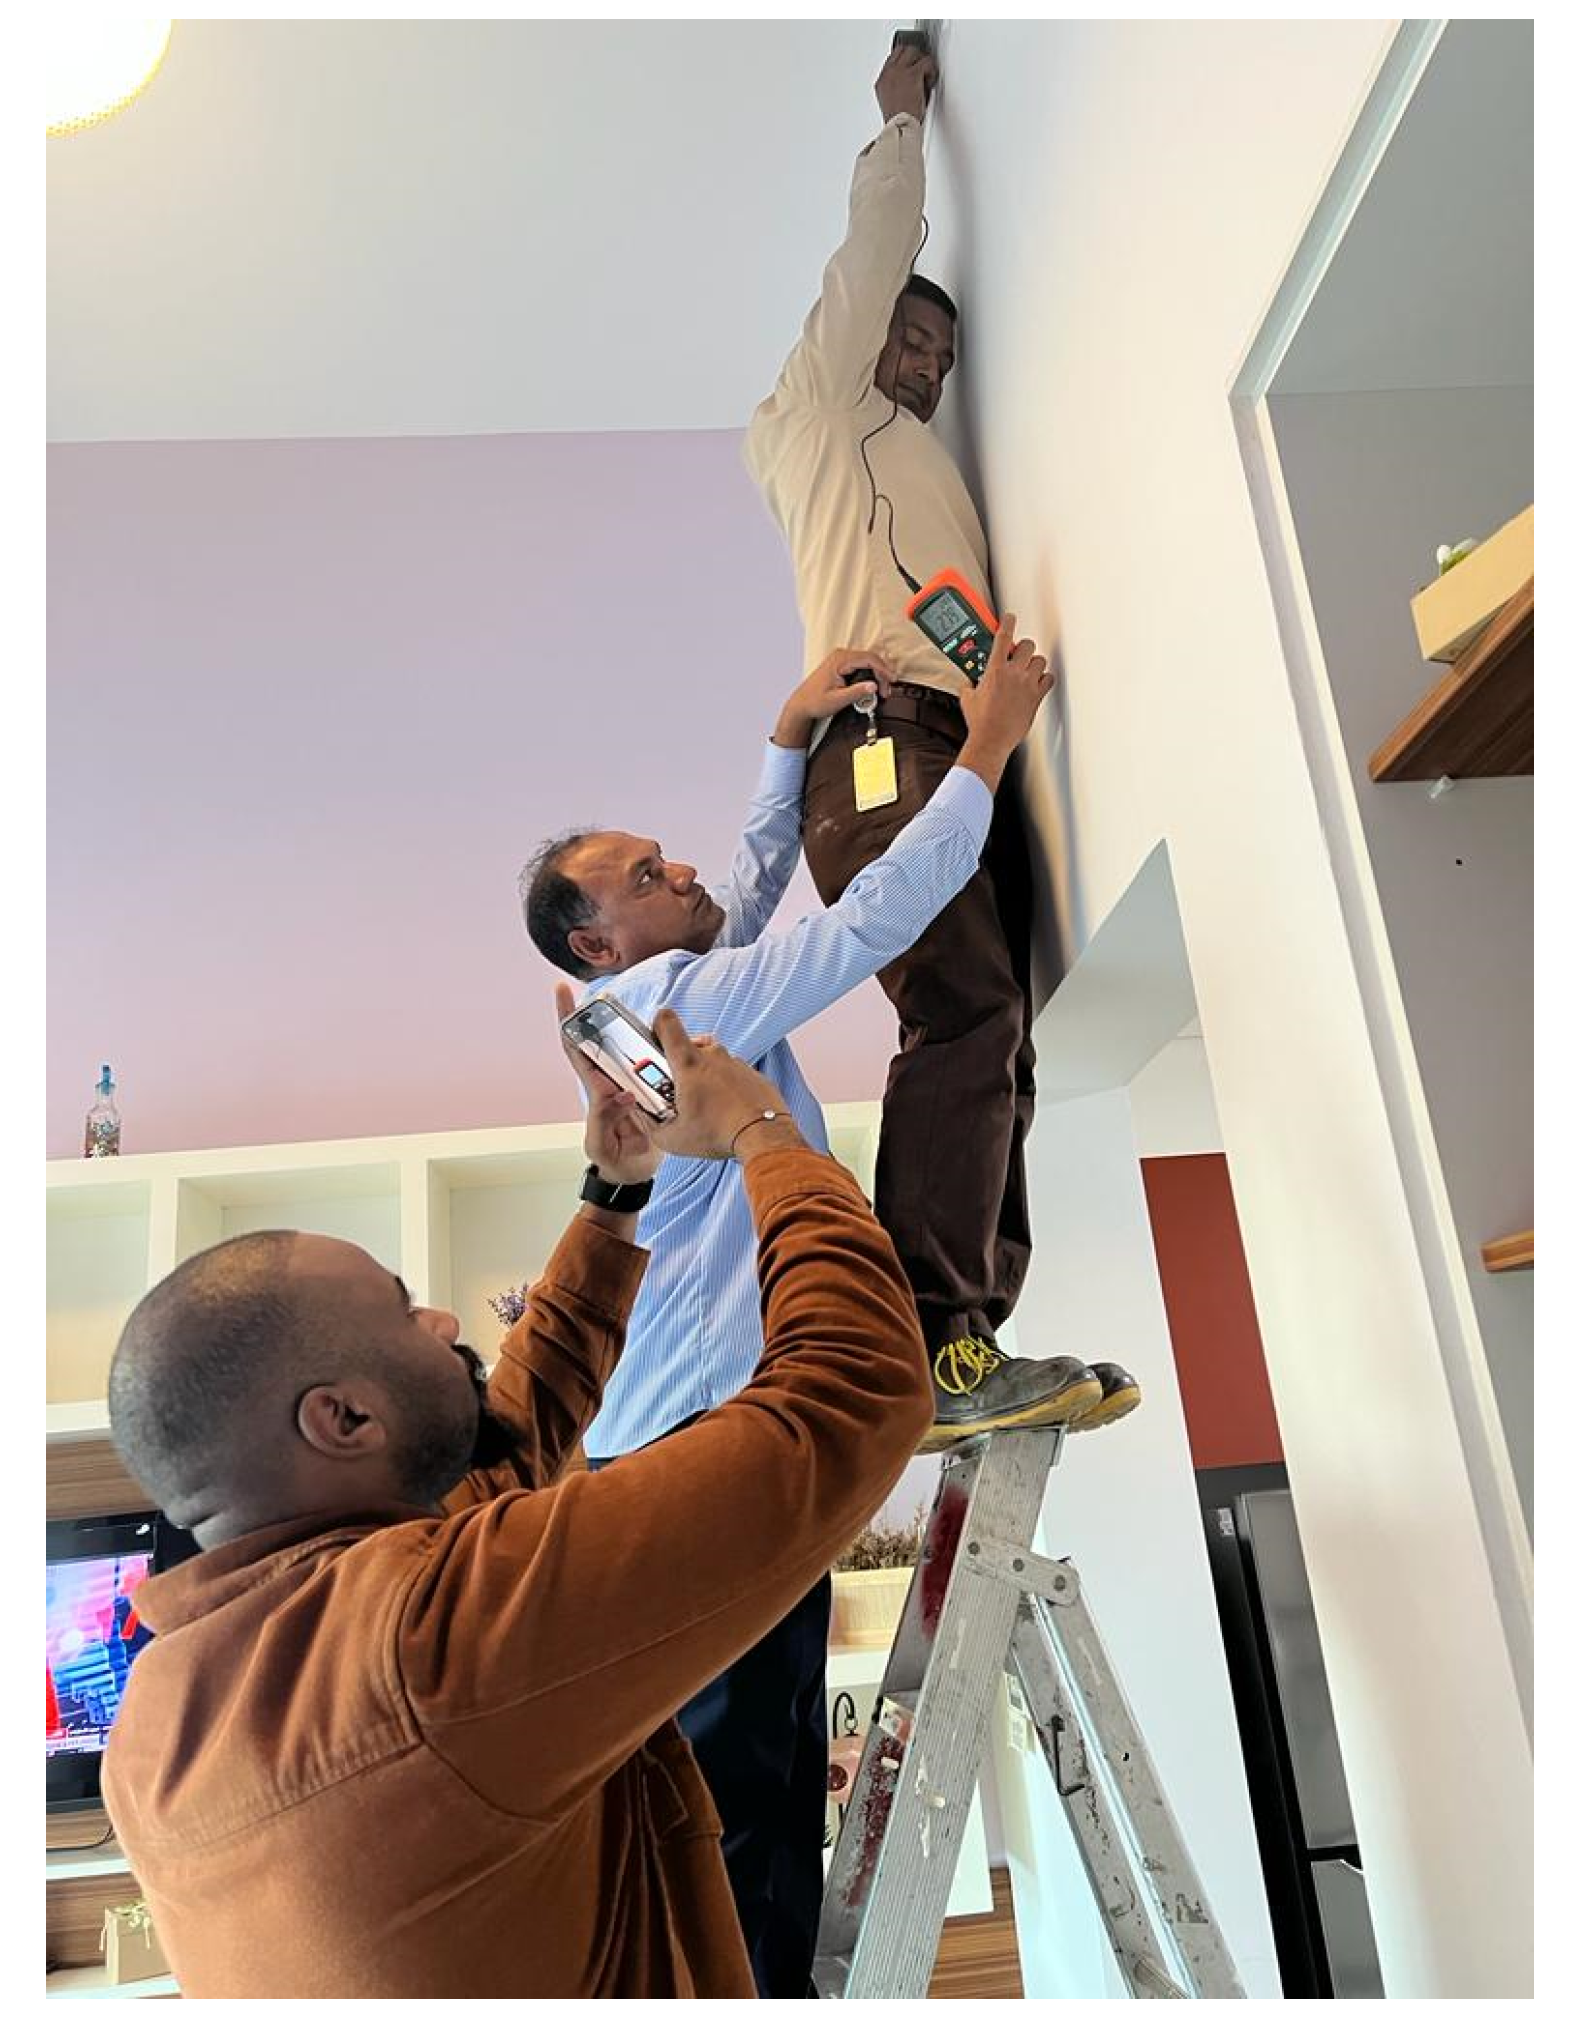
The entire process was documented in detail in writing and accompanied by video as well as still images. The simulations were run in segments, this time with breaks in between to prepare for the next run. During the break, the evidence was commented on by text and photographed. The activities and performance of the following run were also rehearsed. The spray was directed forward during speech and downwards during regular breathing in the direction shown in
Figure 2 and
Figure 3. The imitation of nose exhalation was achieved by a spray on each side directed at the angle at which the nostril is supposed to exhale. The procedure can be seen in
Figure 8.
In the second part of this simulation run, the ventilated test, the window was open, and the air conditioning was turned on at the maximum capacity. Air movement outside was noticeable, but it was not windy. However, the window design only allowed for a small opening. No discernable air movement was felt by the team during the survey.
The air movement speed was measured at the duct outlet grill (see
Figure 9) and the survey surface locations. The measuring instrument was an Extech CFM/CMM anemometer model number AN200. The outlet speed at the grill opening was measured at an average of around 3.0 m/s. All the other areas at table level measured 0.0 m/s confirming the survey team’s initial impressions. The duct openings for the supply and return air are at a height of 3.7 m; they are vertical, not horizontal, and are on opposite sides of the room. Consequently, the air movement was mainly out from one side and into the other resulting in minimum movement at the lower part of the space. The cold air gravitated slowly downwards from being heavier than the hotter interior rather than from the force of speed from the air ducts.
3.4. Image Processing
After the tests were completed and recorded, the paper images were color scanned into JPG computer graphics format. All the scanning was performed using the same scanner to ensure conformity. They were then digitally analyzed using a computer program written explicitly for this purpose.
3.5. Computer Program and Verification
The computer program was written using the Python programming language utilizing the KMeans clustering unsupervised machine learning technique. Its purpose was to calculate the percentage and count of red pigment pixels in each sample. The program was verified by submitting images using predefined ratios of red pixels in each, with ratios of 0, 25, 50, and 75%. Producing these verification images with accurate numbers proved to be surprisingly problematic. The first verification samples consisted of 160 × 160 pixels drawn manually using Adobe Photoshop. During the program, the results were off by 2–4%; although the full red and white images were accurate, a colored border skewed the results. It was deemed that the issue was not with the program but with the verification images and how they were produced. A second set of images was provided, drawn using AutoCAD. AutoCAD can draw very accurate vector drawings; however, converting them to similarly accurate bitmapped images proved difficult. The drawings consisted of 100 × 100 unit squares filled with red rectangles of 0, 25, 50, and 75 units × 100. These were then printed into jpg images. The final set had to be cropped manually since AutoCad added a small border to the printout. Manual cropping depends on the resolution and screen size to manage accurate framing, which was not easy.
Using the AutoCad jpg file printouts cropped as 300 × 300 pixels, the scanning program delivered much better results, as can be seen in
Table 2. A third set was similarly produced with a higher resolution of 700 × 700 pixels, and these had an even lower average error of 0.01%. At this point, it was clear that the error was in the input, not the program, which was deemed to be accurate. The final test scanned images were of a much higher resolution of 4960 × 3507 for the A3 paper samples and had an even smaller error rate.
3.6. Test Results
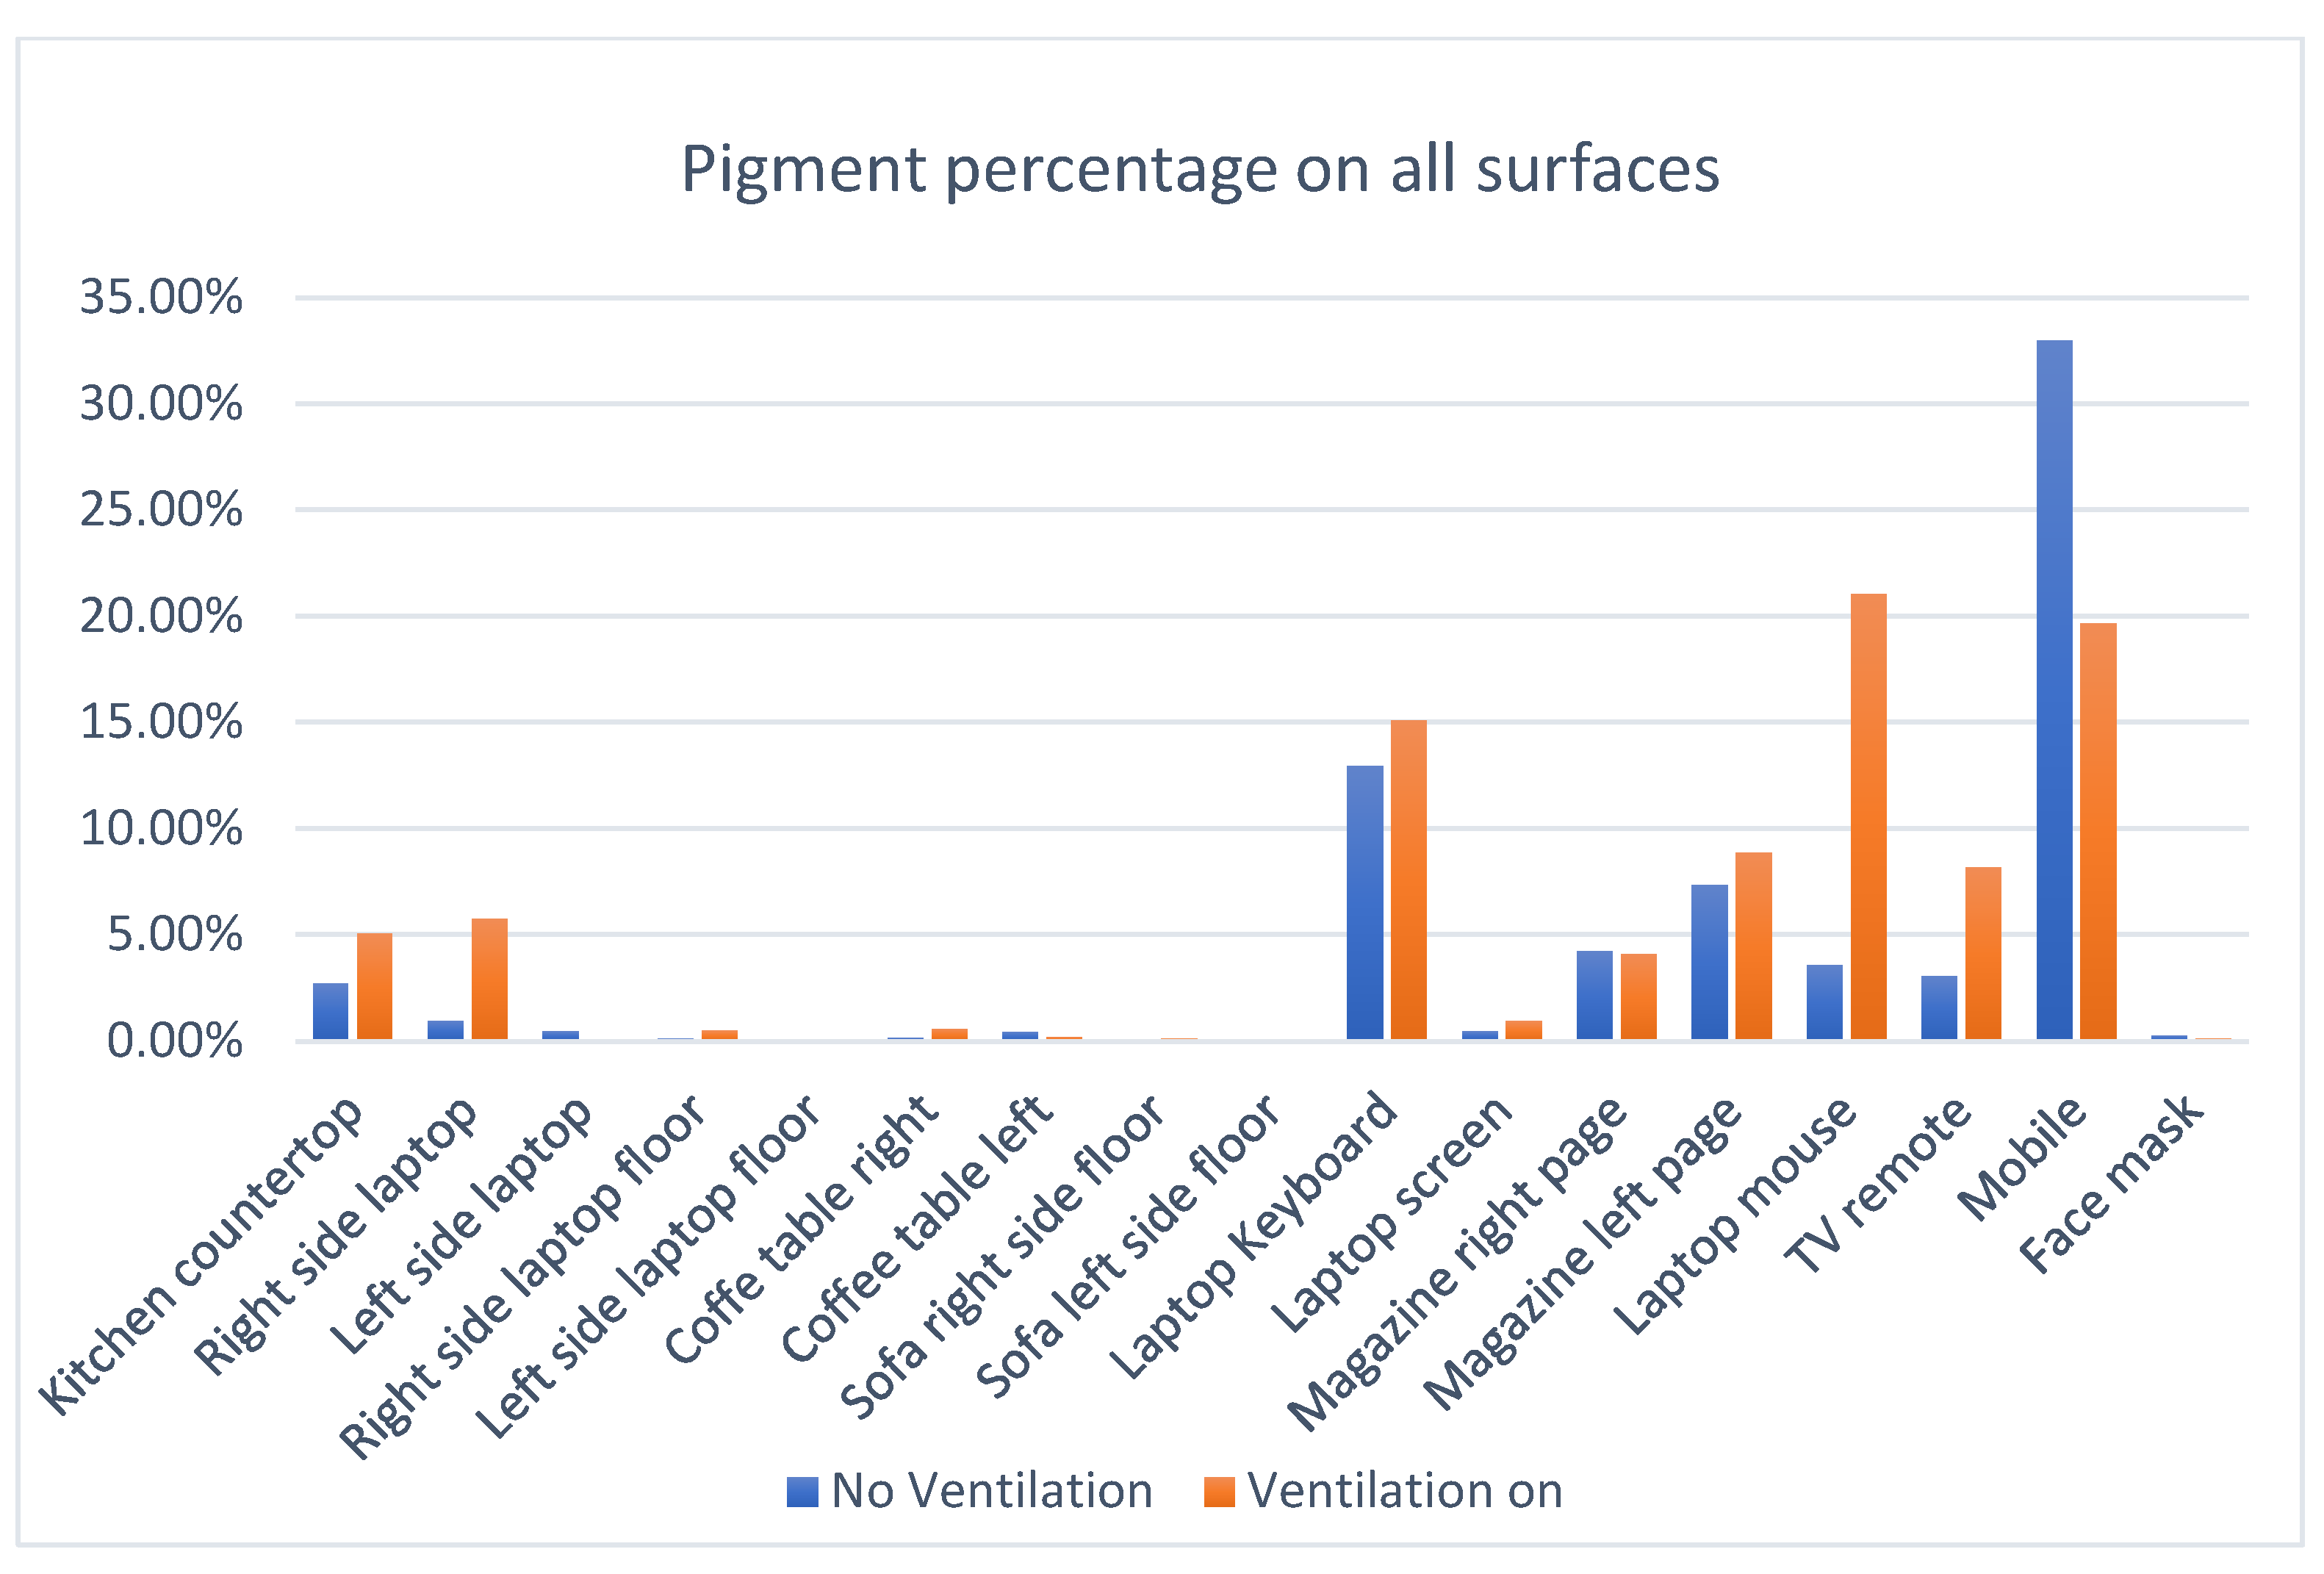
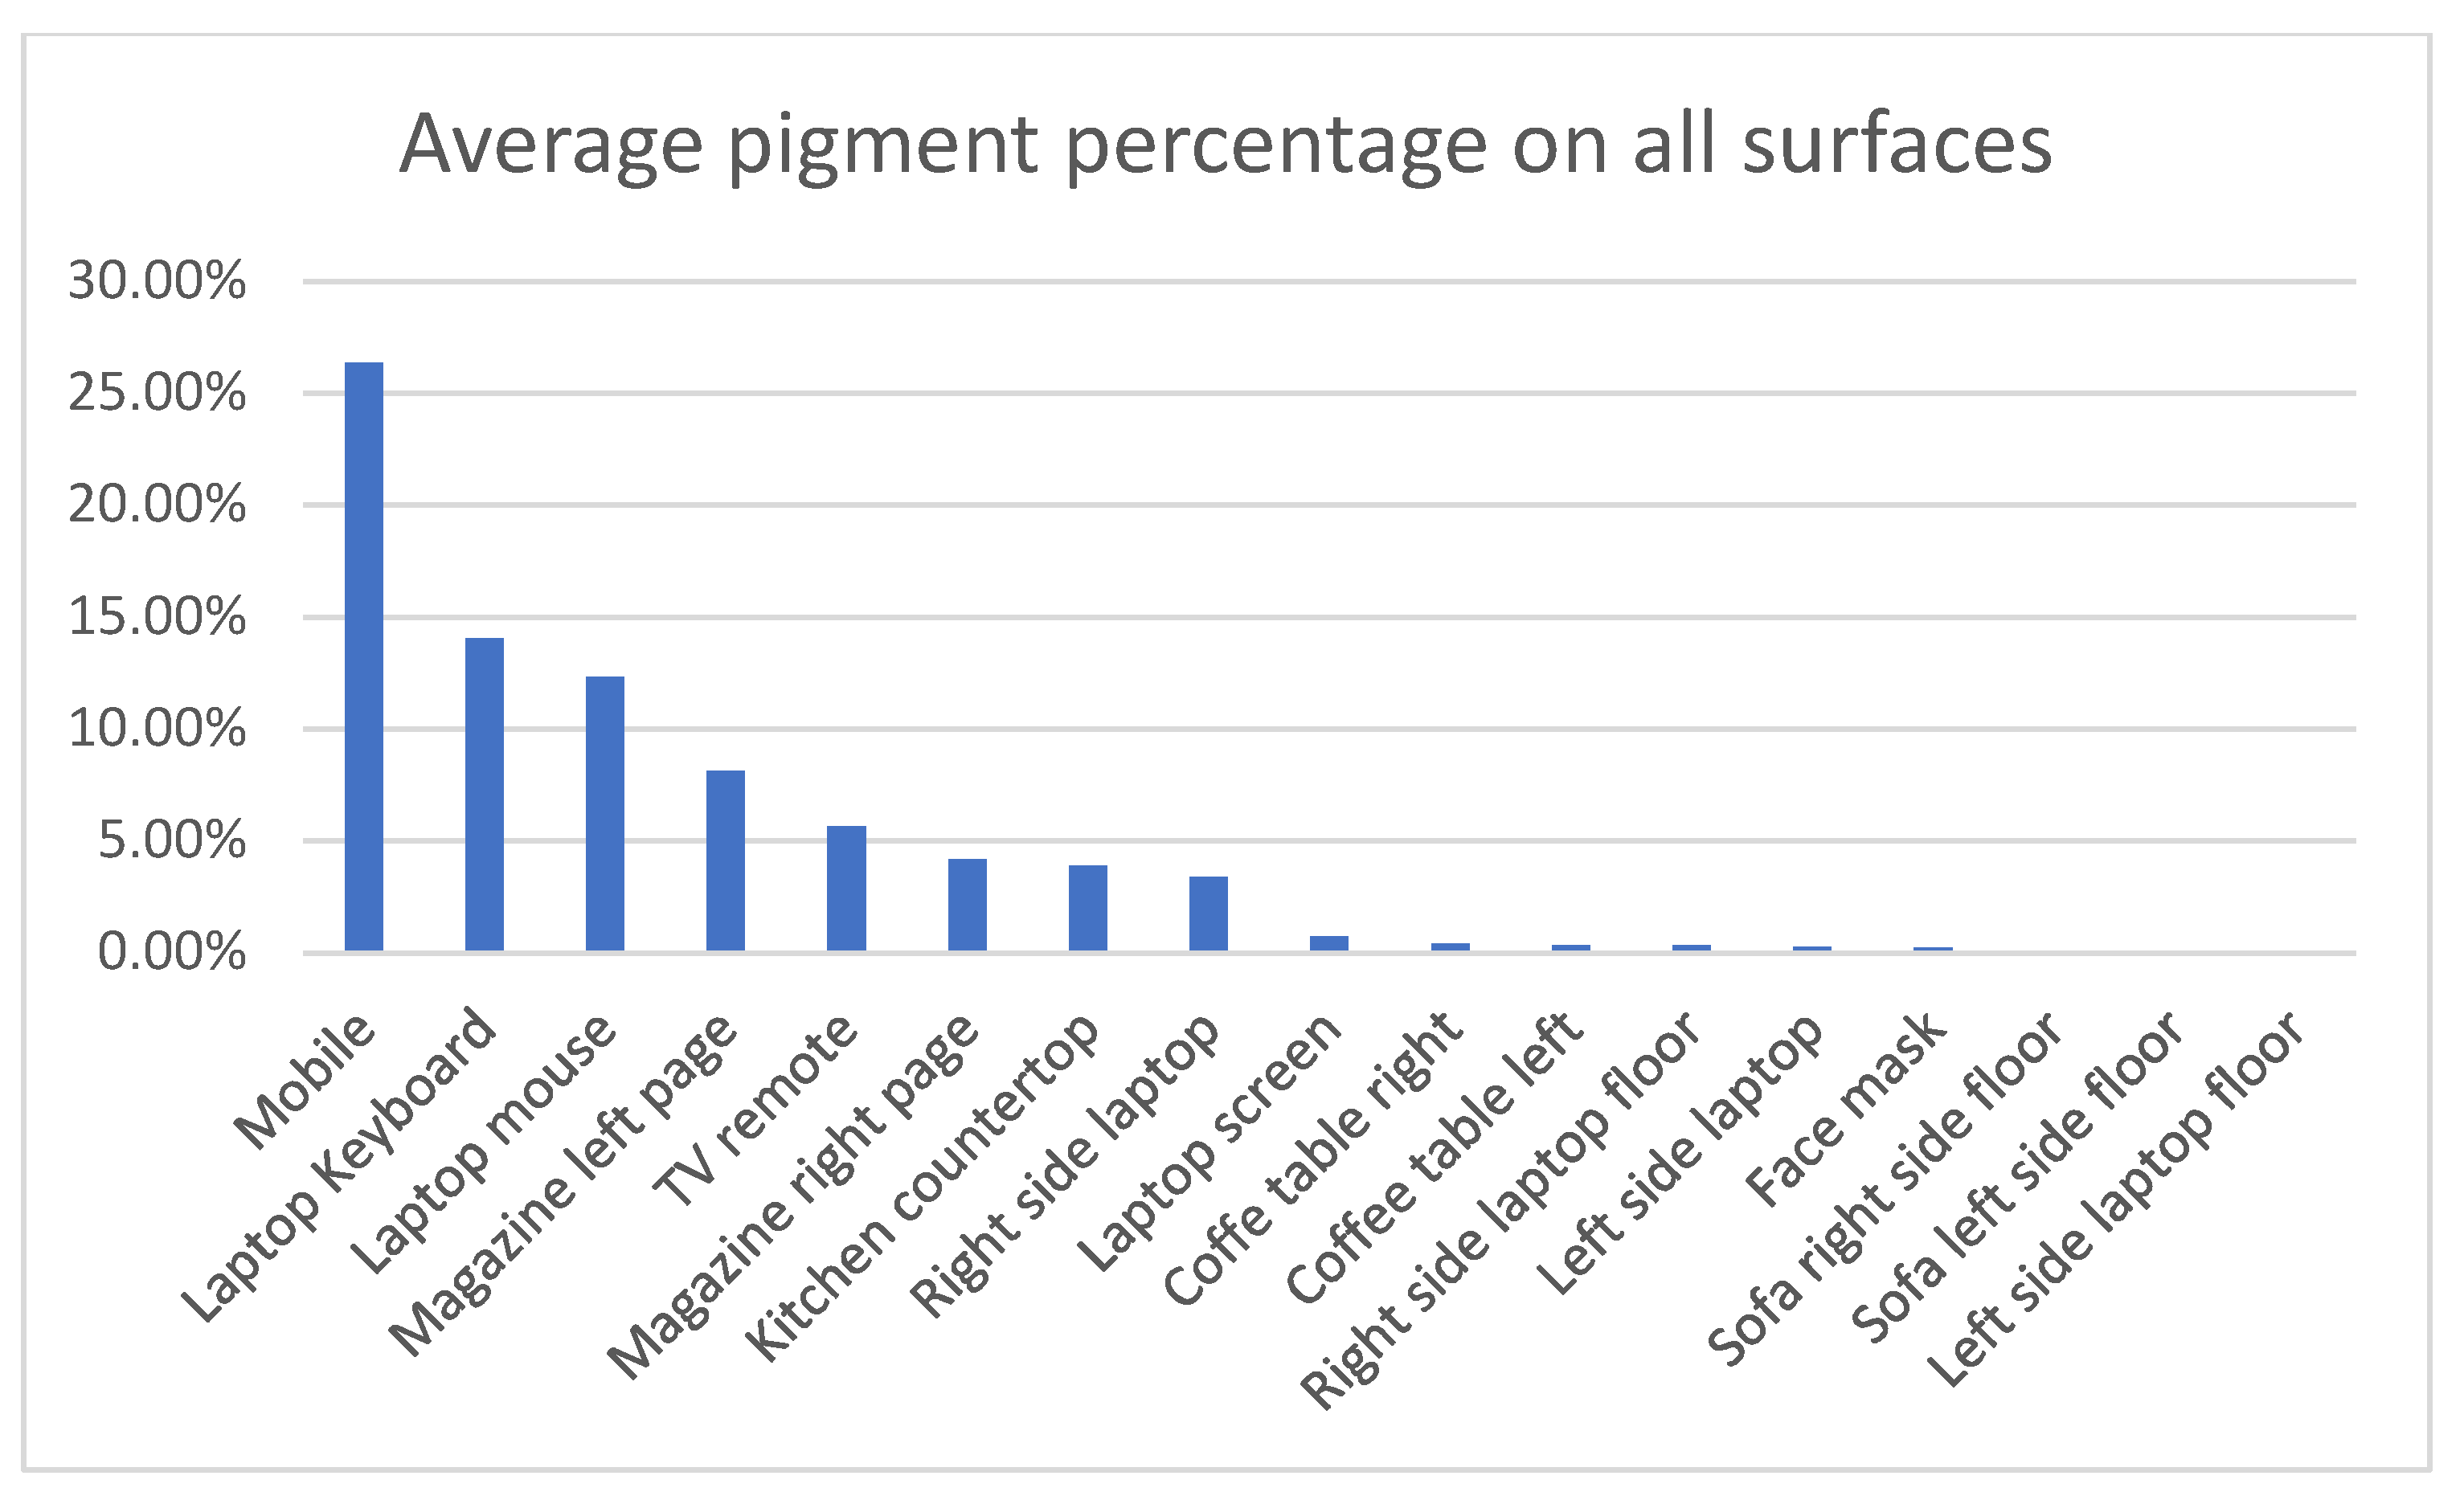
The chart in
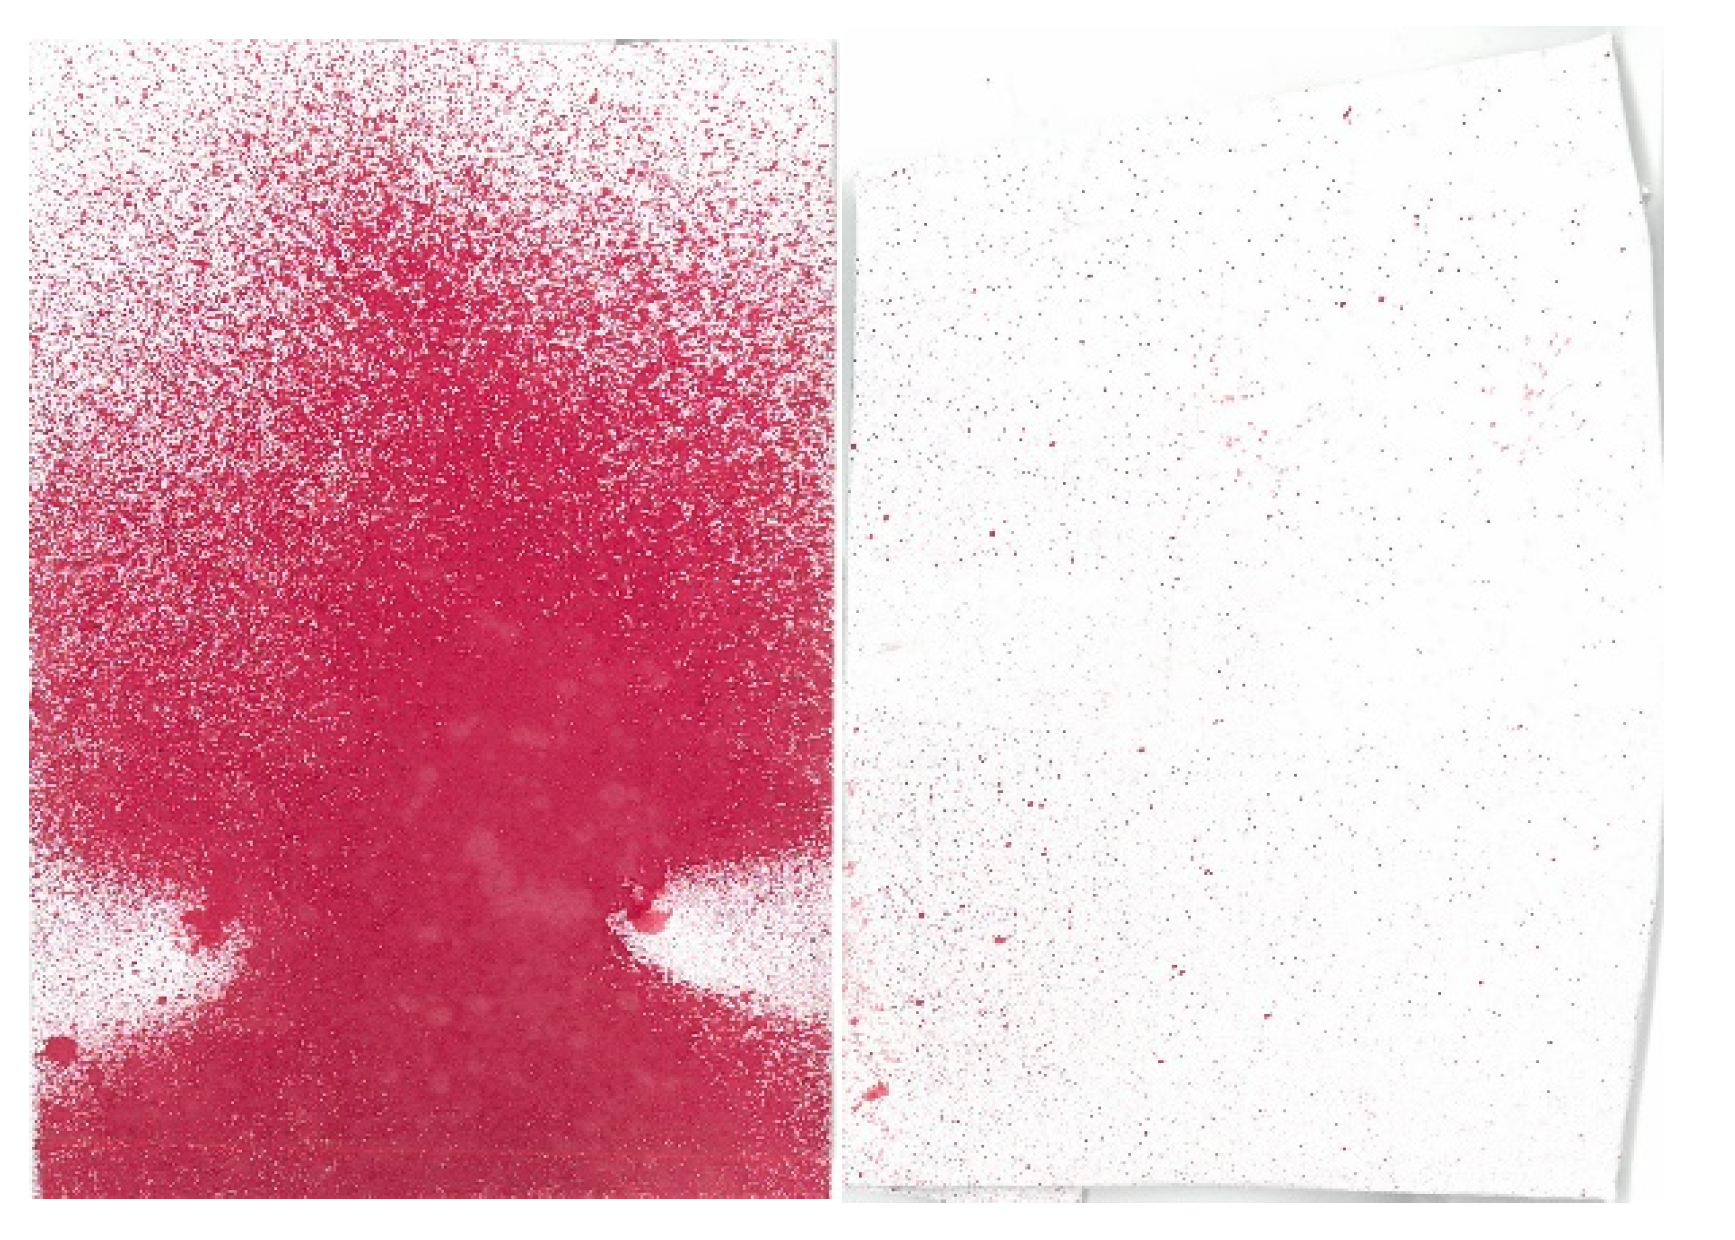
Figure 10 summarizes the test results and shows the percentage of pigments on each surface. It clearly shows that the surfaces that are liable to be closer to the face and for longer times are more subject to breath droplets. This is especially true of the mobile. The image in
Figure 11 shows the spray pattern on the mobile surface after only one minute compared to the laptop mouse.
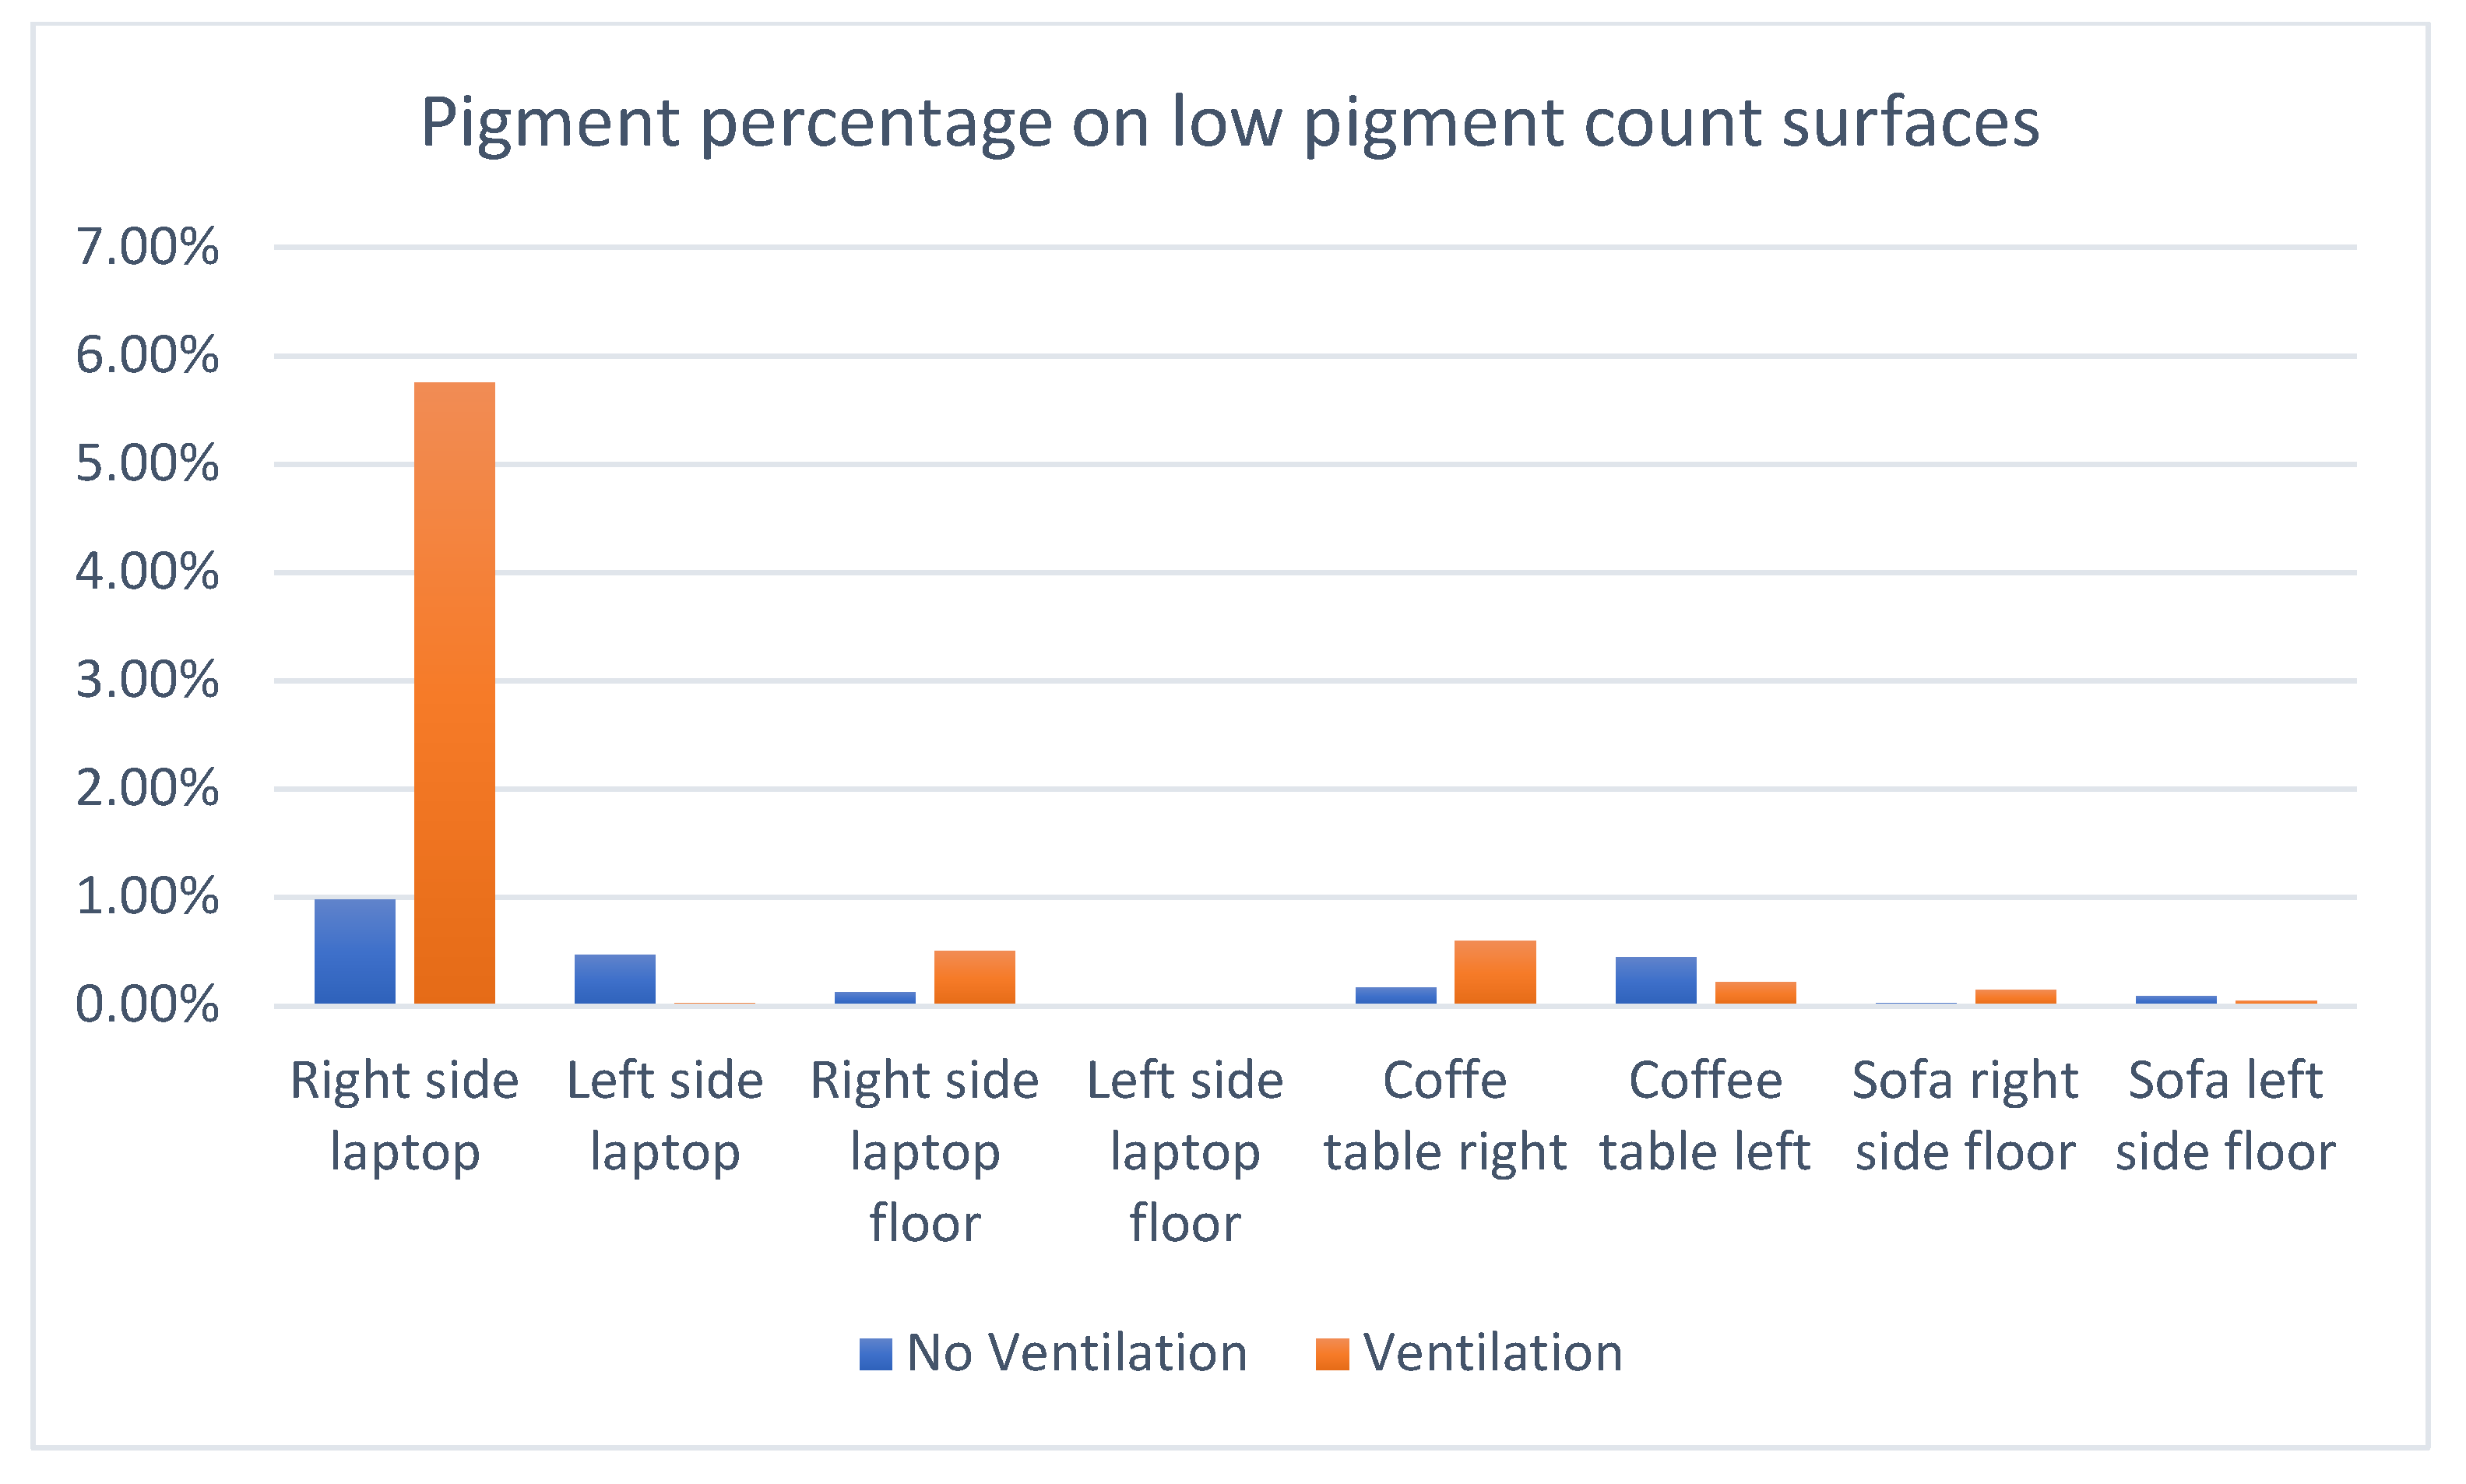
The second notable observation from the graph is that ventilating the room led to no discernable reduction in the spray pattern. Many surfaces actually suffered an increase in spray density. The conclusion is that in lightly ventilated rooms, the variation in human movement and behavior outstrips the effect of air movement for large droplets. This aligns with Chao’s study, which confirmed the difference in the behavior of small vs. large droplets [
15]. It can also be noticed from the surface to the right of the laptop in the test from the chart in
Figure 10 and the first two bars of
Figure 12, “right-side laptop”. In the ventilated room, the actor used the mouse, which was on the right, significantly more. That led to a sharp increase in spray on both the mouse and the surface surrounding it. Consequently, the results of both tests, ventilated and non-ventilated, were combined for an average that is shown in
Figure 13.
Figure 13 shows the average percentage of pigment on each of the scanned surfaces in sequence, from the highest to the lowest. It is clear that the surfaces that are liable to be closer to the face and nose collect more spray.
Table 3 shows the pixel count on each surface in the same order. The percentage is more relevant due to the variation in size of some of the test surfaces. The mobile phone, for instance, received a high density of spray but a low count due to its small area.
3.7. Non-Scanned Surfaces
The pigment on some surfaces could not be collected using paper. These were the clothes, sofa, and hands. Pictorial evidence was used to record the results.
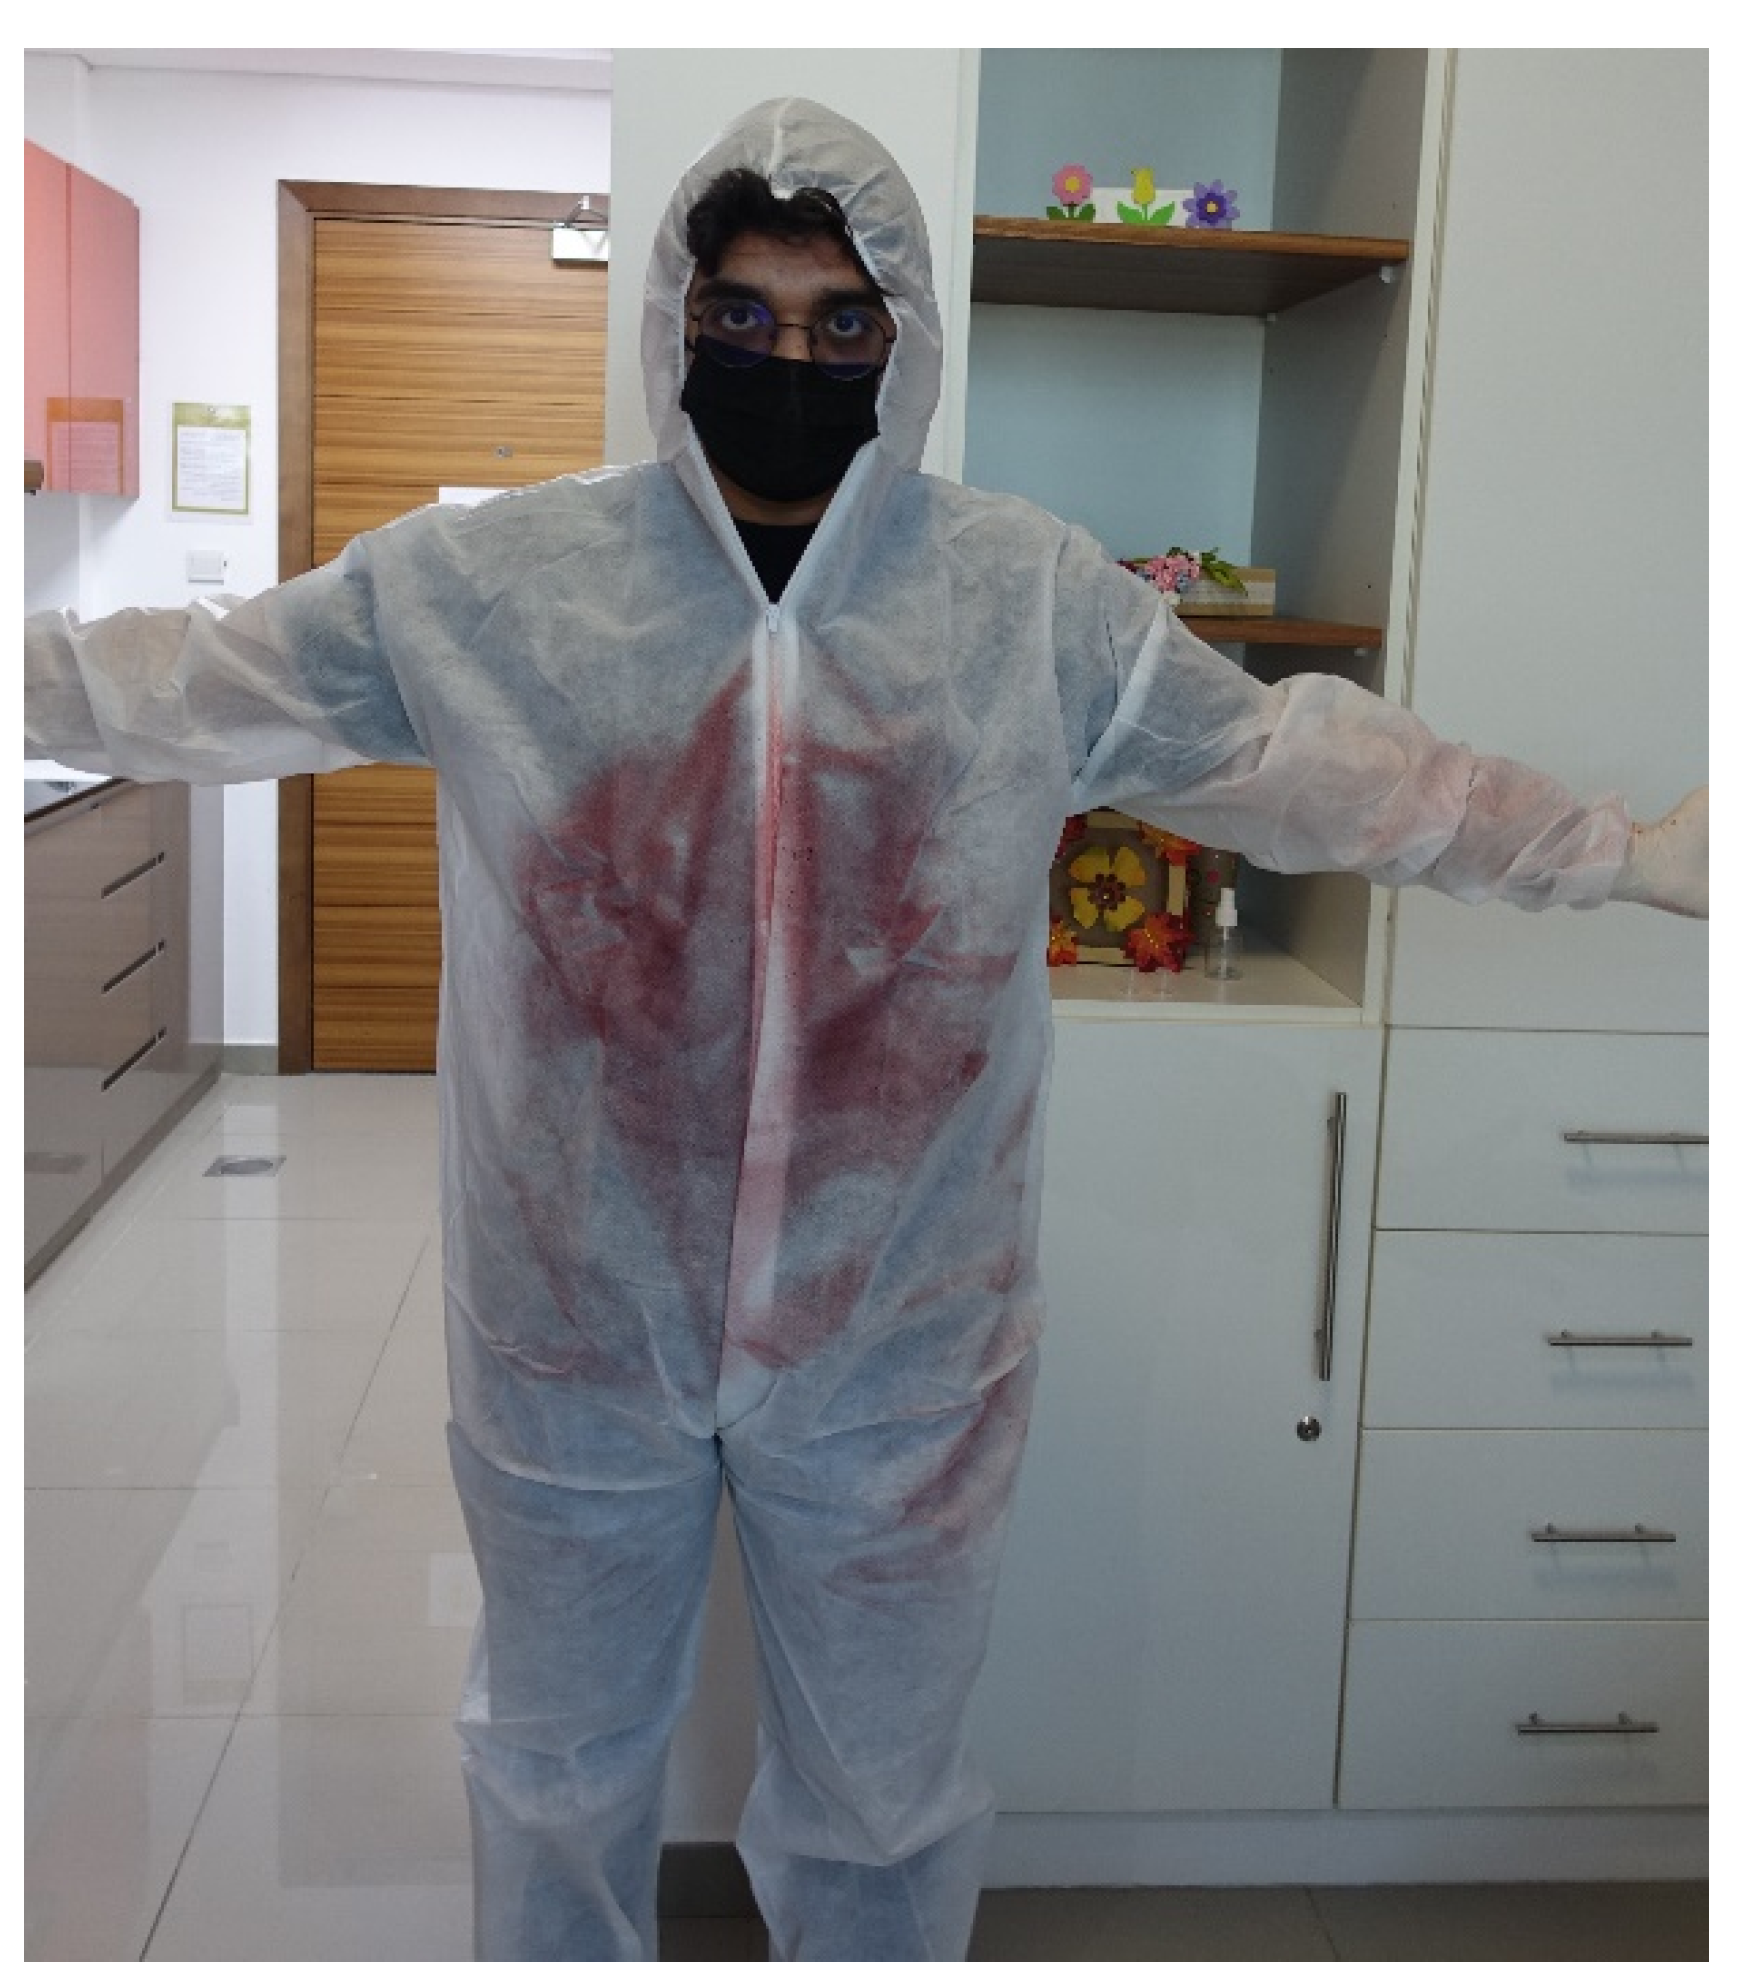
A medical hazmat suit was used to receive the spray on the actor’s clothes. An image of the actor after watching TV for one minute can be seen in
Figure 14. The area below the face received the most spray in almost every activity. More pigment can be seen on the left arm than on the right. This was because the TV was slightly to the left of the sofa. The variation of spray and asymmetry between the left and right sides was observed in every activity. Human movement follows ever-changing patterns and, thus, does the exhalation spray. There were always significant changes in the patterns between all three tests, the pilot, non-ventilated, and ventilated. Nevertheless, the relative density of pigment on most surfaces was essentially similar. Regrettably, it is not possible to scan the suits in a manner that can be compared to paper collectors.
The sofa was another surface that could not be covered with paper. The spray can be seen in
Figure 15. Significantly more pigment spray is evident on the left arm of the sofa (right side in the photo) that was facing the television compared to the right.
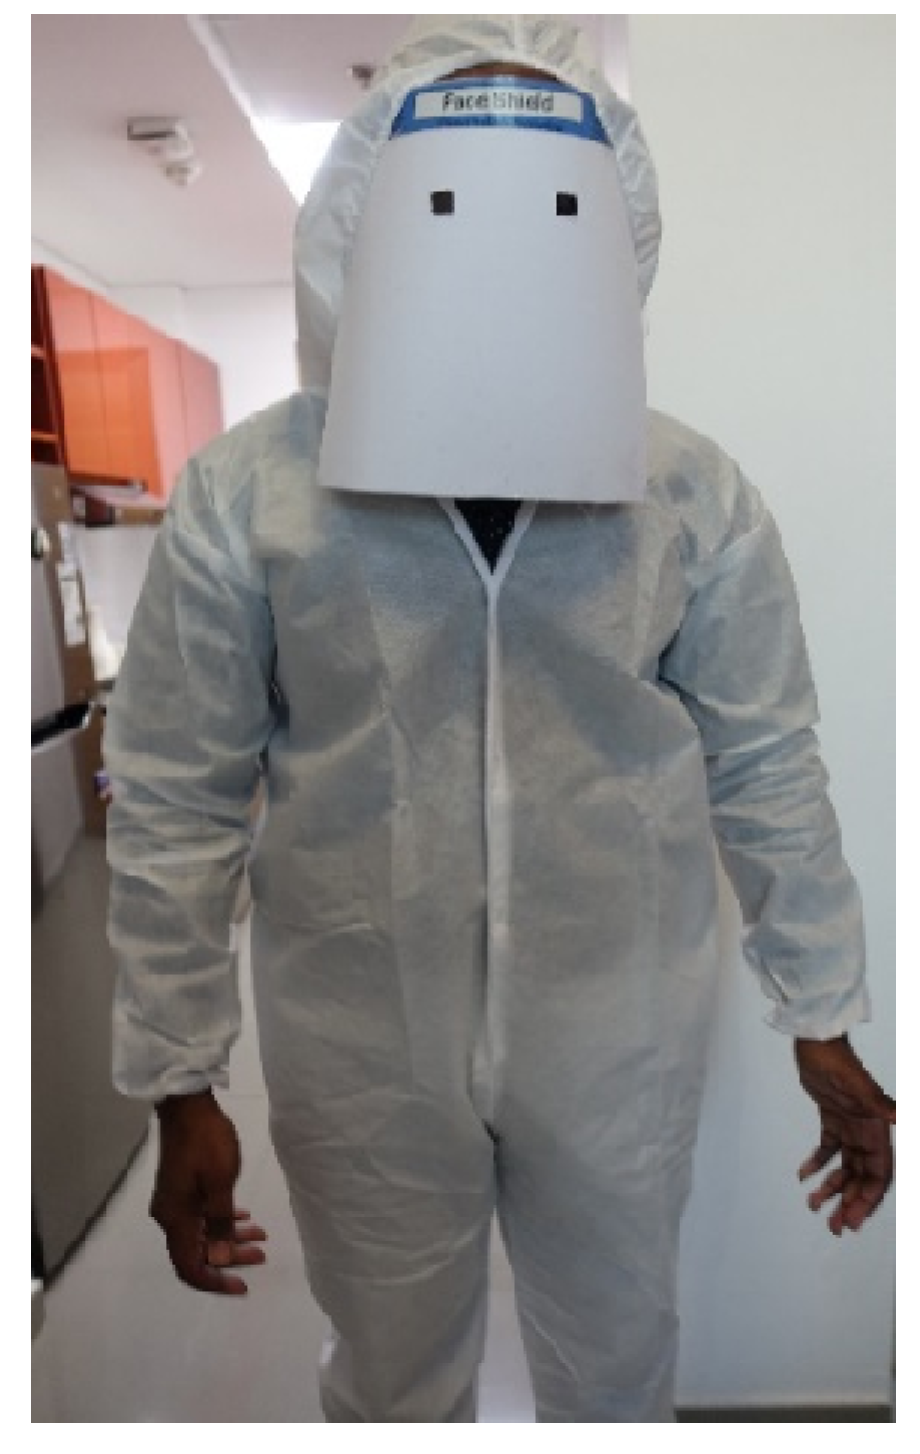
Almost no notable pigment was observed on the visitor’s clothing or face, even after close inspection. An image of the suit can be seen in
Figure 16. This was taken after entering and engaging the host in the conversation for one minute. However, image scans of the face cover did find some residue, as seen in
Table 3. The distance between both during the discussion was around 1.7 m.
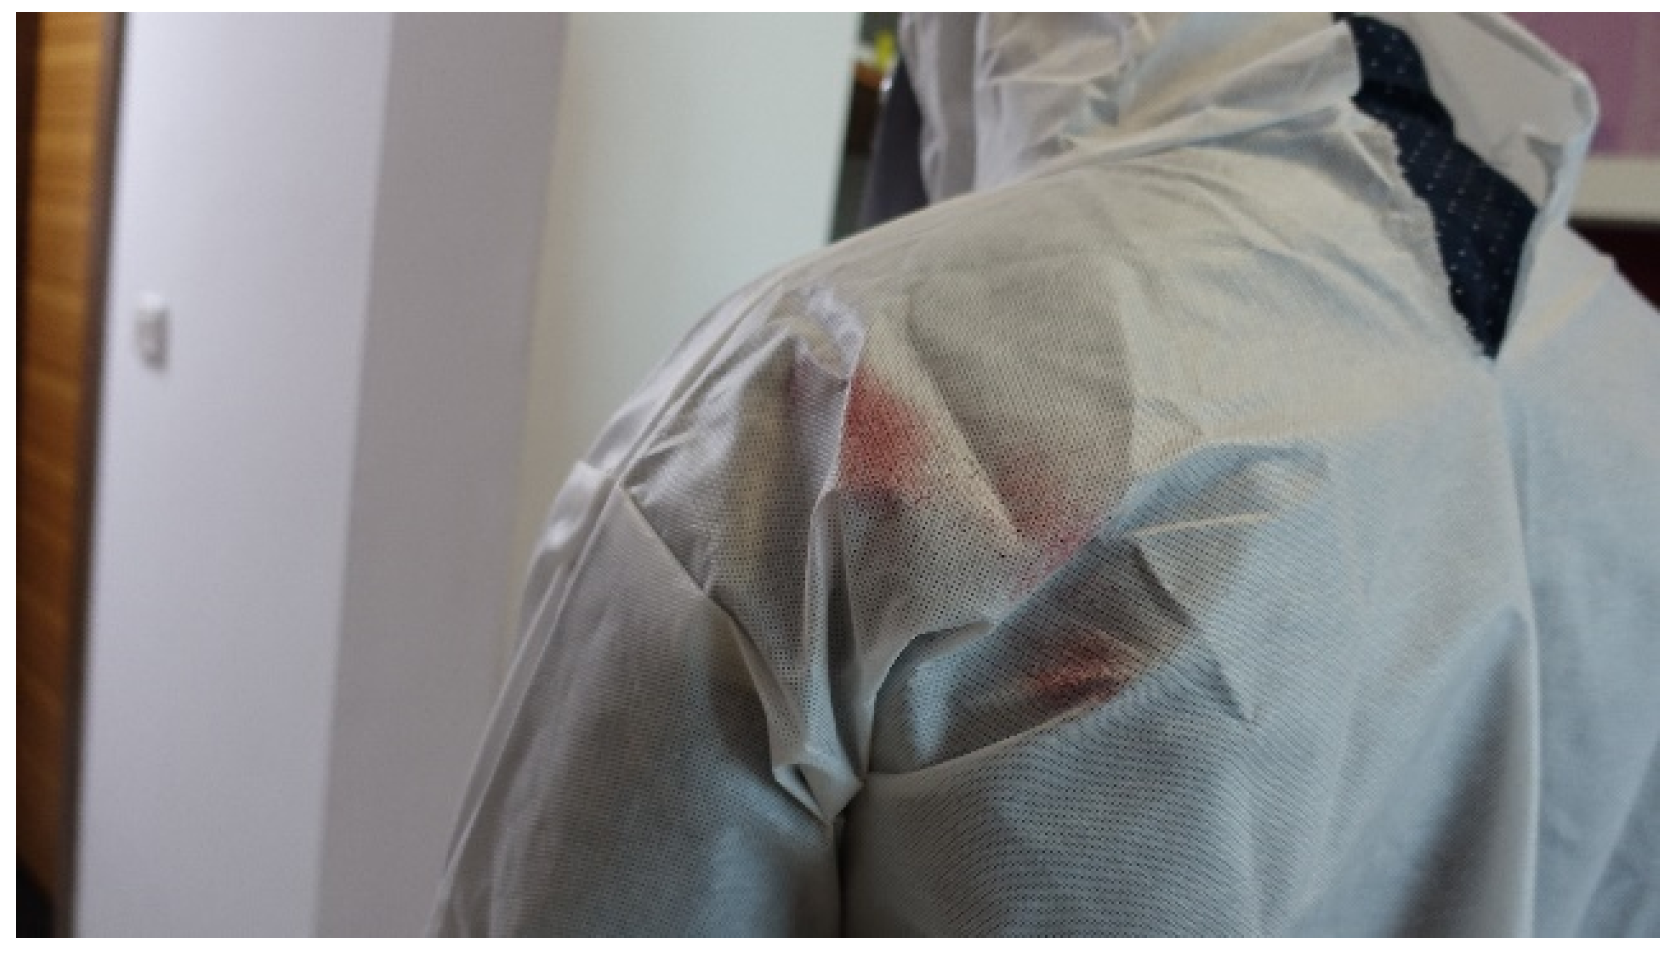
The only visible spray was on the left back shoulder, which collected the spray as the visitor passed by the host on his way in, as seen in
Figure 17.
The surfaces on the front of the visitor collected no visible traces of pigment. However, the face, which was covered with a paper mask, as seen in
Figure 16, collected 0.21% pigment when analyzed by the computer program, so it must be assumed that a small amount was deposited on the rest of him as well.
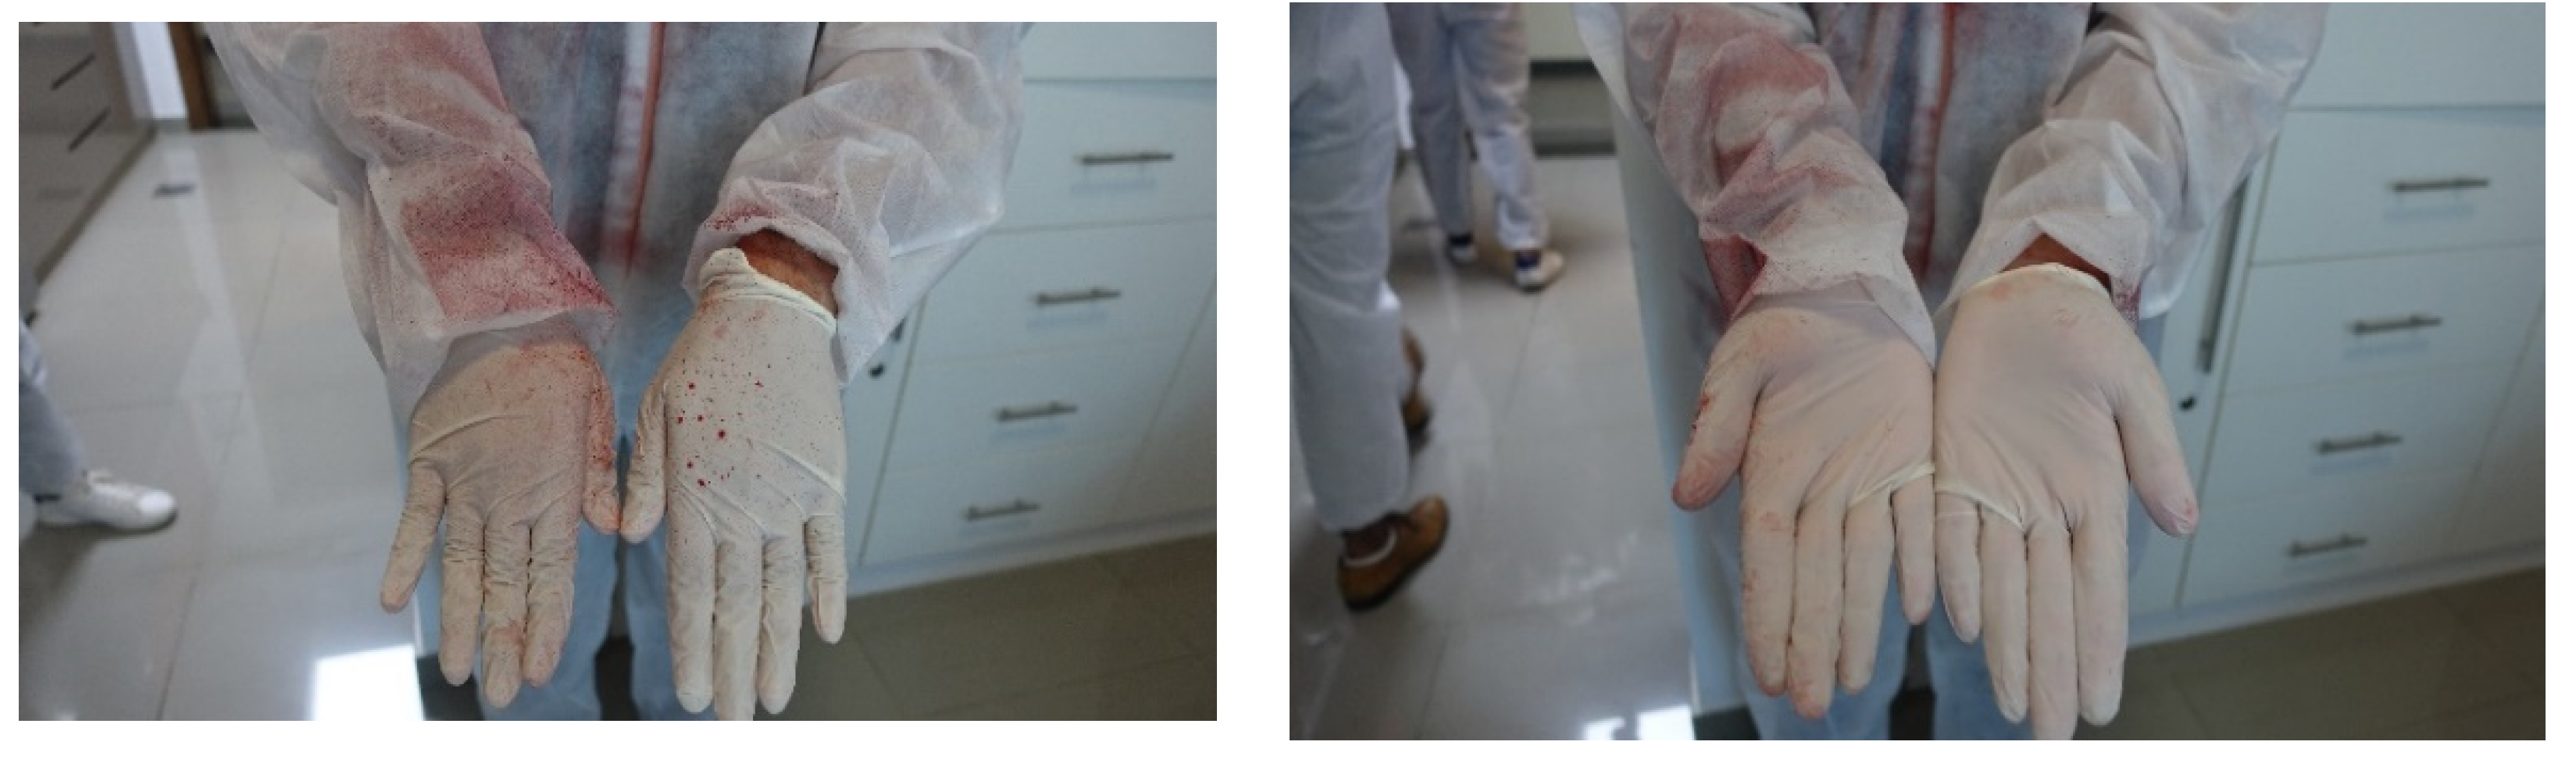
The hands received a significant amount of spray during almost every activity. Consequently, the gloves were changed and examined after each one. The backside collected significantly more than the front in most activities except while preparing tea in the kitchen. In all the activities, the thumbs contained the most pigment. An image can be seen in
Figure 18, which shows the hands after working on the laptop for one minute. The right hand and arm received more because the user was sometimes looking at it while searching for the mouse.
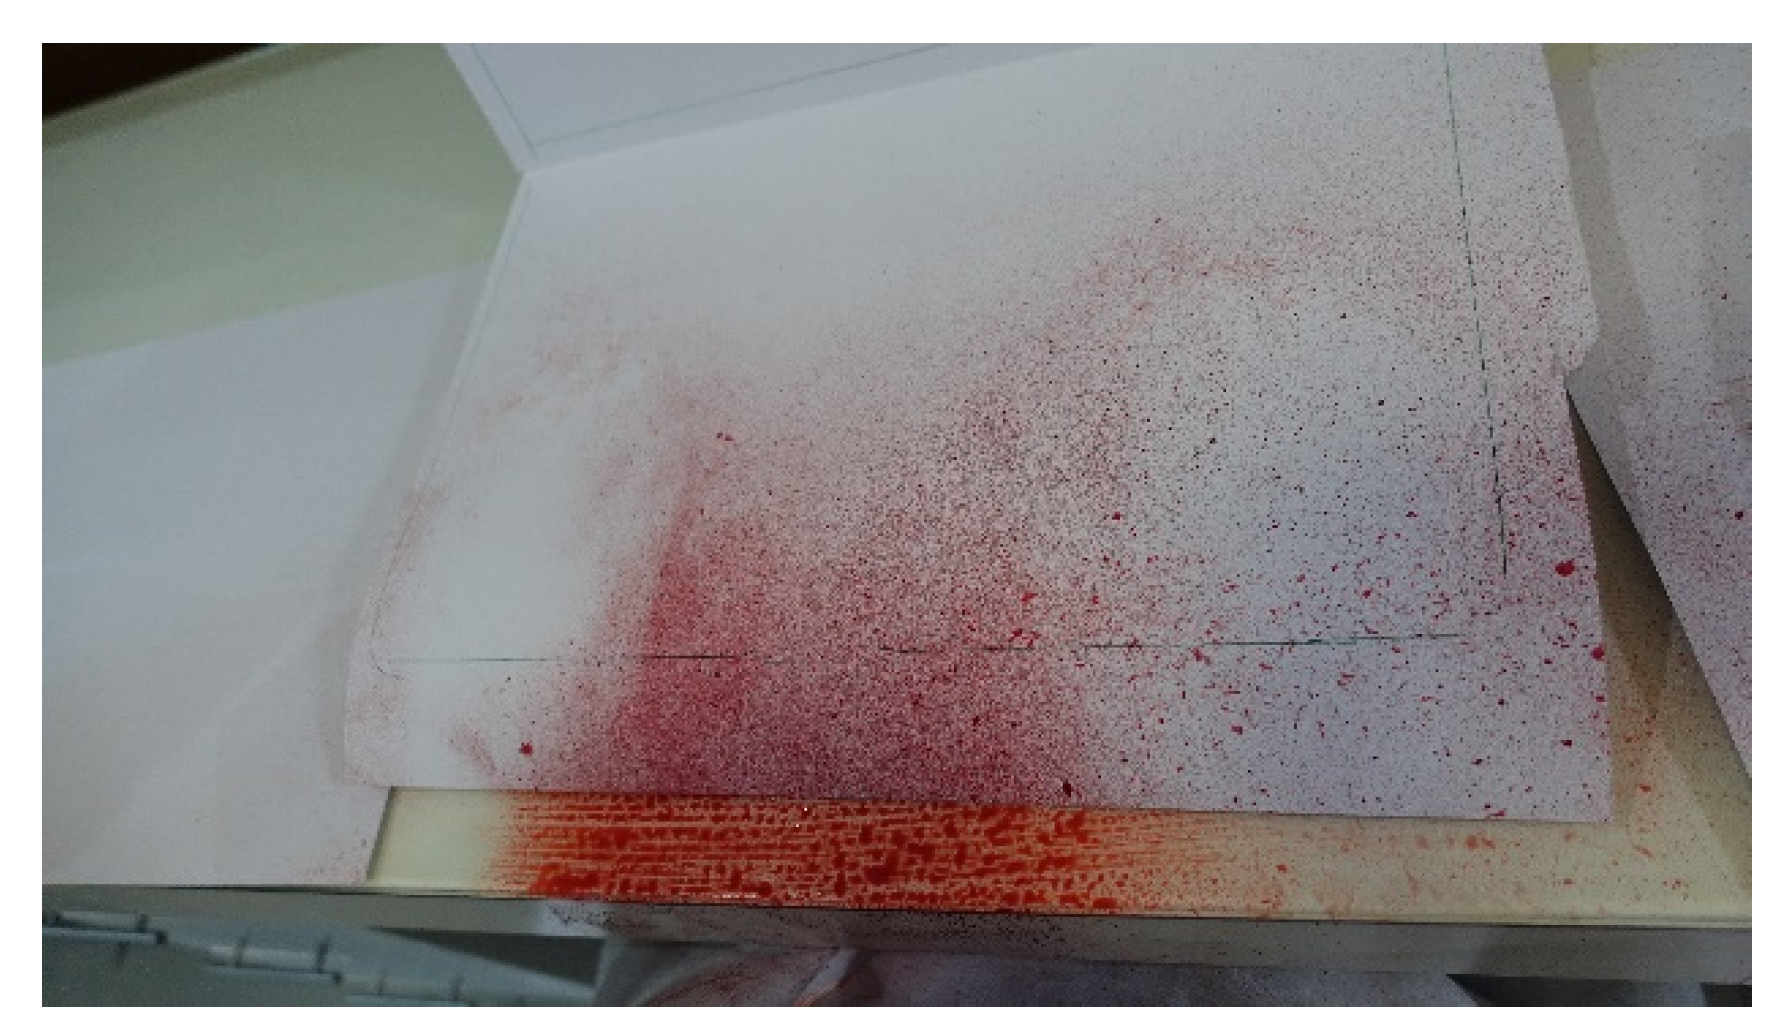
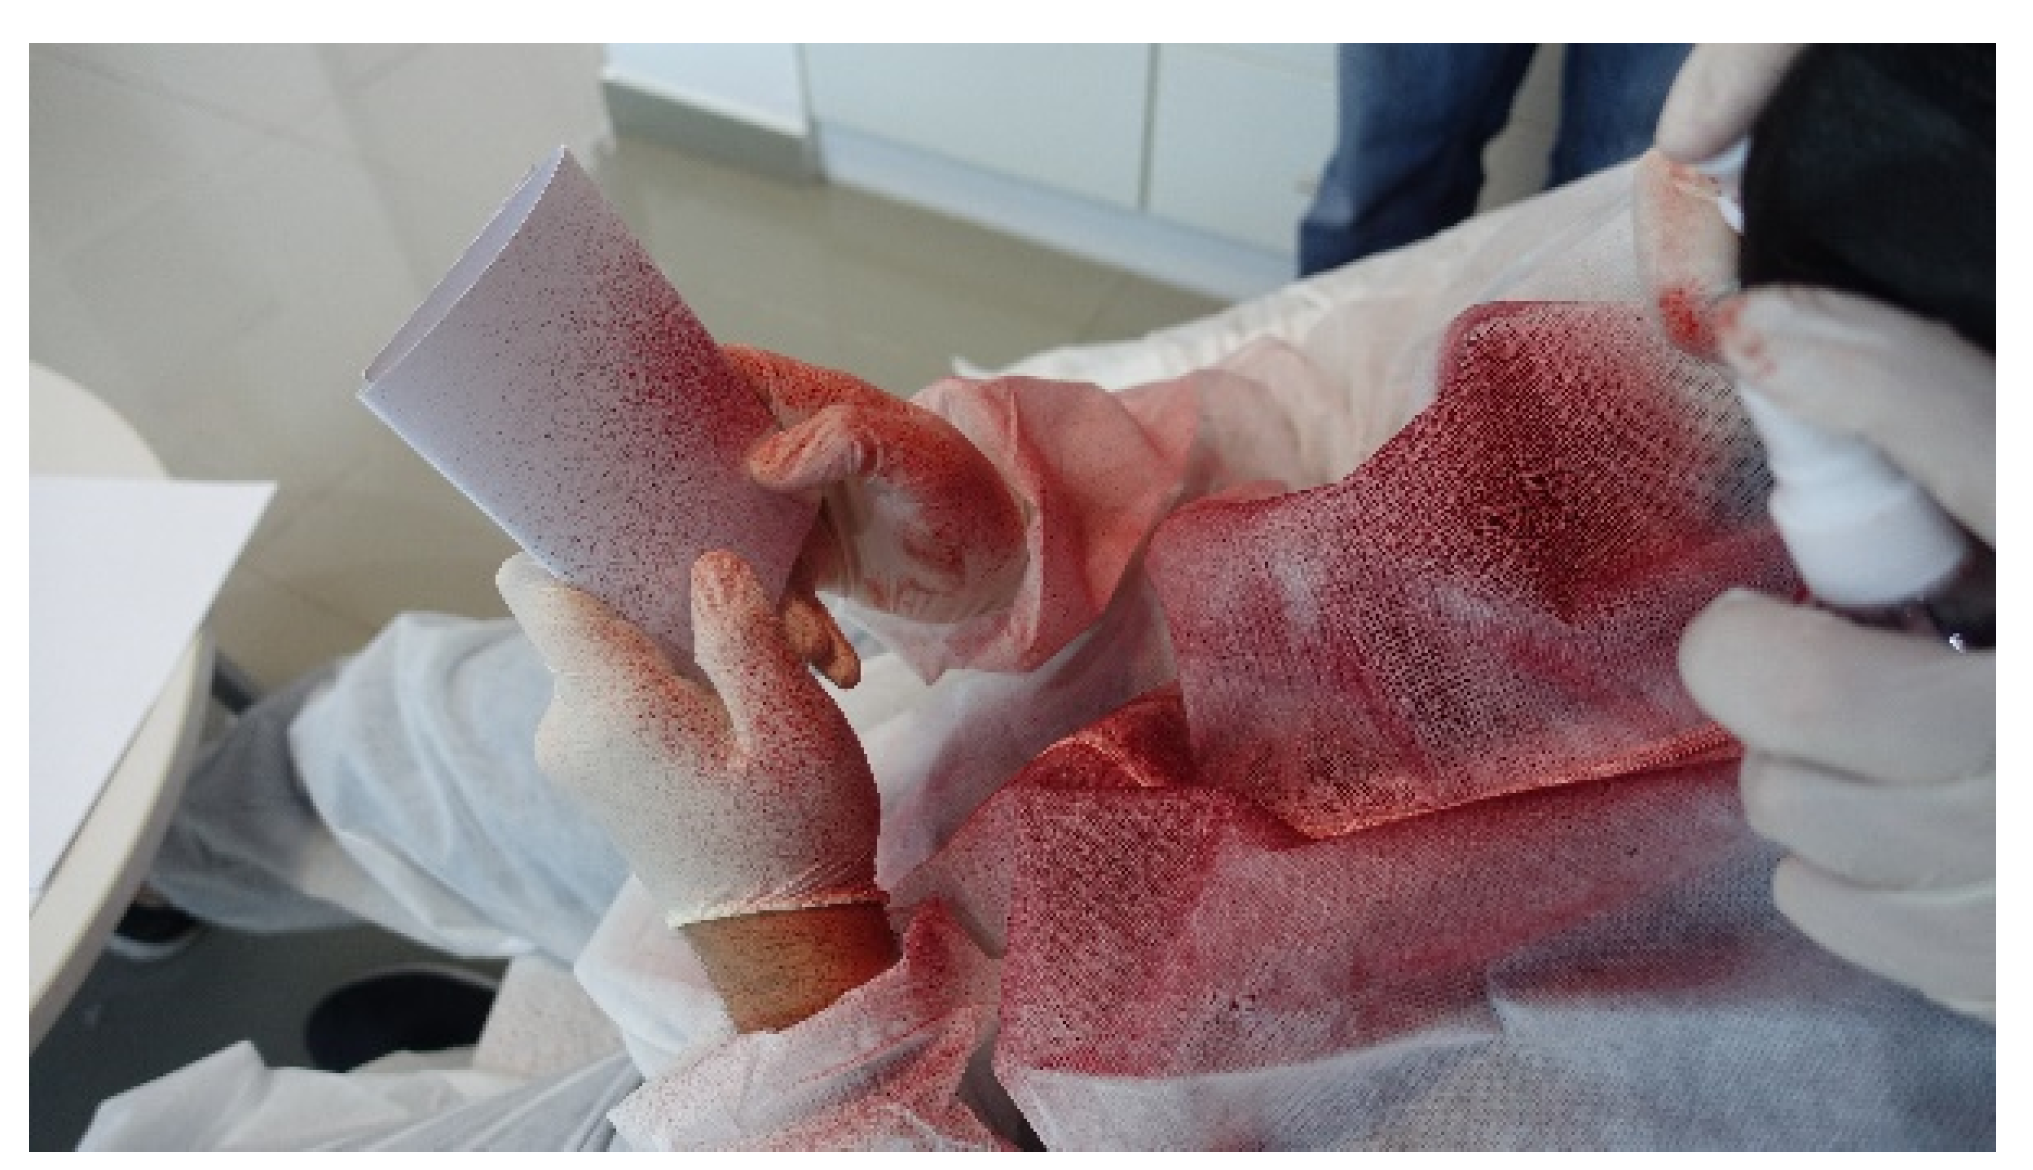
The bottom parts of the front of the hands also collected a significant amount of pigment while typing on the laptop which was collected from surface in front of the keyboard, which received a substantial amount of pigment, as is evident in
Figure 19, while
Figure 20 shows the pigment stain on the actor while in the process of mimicking using the mobile phone. The spray covers the whole area below the face down to the hands holding the phone.
4. Discussion
The interior surfaces most liable to collect expiratory droplets, as expected and noted by other researchers, are those closest to the face, mouth, and nose. That includes, foremost, the clothes directly below these areas, as seen in
Figure 14. Clothes do not tend to release pathogens easily as they trap them inside their fibers, although the transfer is still possible [
22]. Considering the amount of pigment noticed on the front of the actors’ suits after each experiment, these must be considered hazardous.
After a long-seated period, the areas around the person also collect droplets relative to the time spent seated in that location. The space between the legs on the chair may also be contaminated subject to similar clothing and seating patterns as in the tests.
While there has been much concern regarding hand contamination, the study found that the most affected area by the exhalation of breath is the backside of the hands, not the front. However, while performing regular daily activities, the front of the hand will also gather contamination while brushing against other interior surfaces.
Of these surfaces, it is clear that the mobile phone, laptop, and mouse should never be borrowed or lent to other persons, as they are primary gatherers of user droplets. Other objects which are used similarly would also qualify, such as tablets and touch screens.
Visitors, while inside the space and keeping a distance, will suffer almost no droplet fallout in the size and form created by the spraying mechanism. Smaller droplets will linger for a longer period and may come into contact with the visitor. However, these droplets evaporate quickly [
15], adding to the popular recommendation of keeping a safe distance. The larger droplets will not reach the second party, and the smaller ones might evaporate. However, they must care while entering a room with a small entrance where they are more susceptible to being in close contact with the host. This observation justifies social distancing as an essential preventive measure during the COVID-19 pandemic.
These tests were conducted in a manner that allowed comparison between the surfaces, and to do so, each activity was limited to one minute. Most activities in the house will go on for significantly more extended periods. On the other hand, the number of droplets in the tests is exaggerated substantially by the spray mechanism in order to collect samples with enough pigment to allow for image analysis.
Recommendations
When washing, clean the thumb, back of the hand, palm, and wrist as well, especially if you have been using a keyboard;
Mobile phones are distinctly disposed to collect breath droplets. They, more than any other surface besides hands, should be sanitized frequently and thoroughly;
Do not borrow or lend mobile phones or laptops, even if for a short period;
Higher surfaces, which are closer to the nose and mouth, such as counters and tabletops, should be cleaned thoroughly after a visit by a guest;
Although cloth usually does not transfer viruses well, it is advisable to avoid touching clothes in the abdominal area. If the person is wearing leather or plastic, then be even more careful;
Laptops, tablets, mice, as well as the table they sit on, should be cleaned and sanitized frequently;
Remote controls and magazines, especially glossy ones, are also collection surfaces;
The importance of cleaning clothes that cover the front abdomen, such as shirts and t-shirts, is higher than lower body covers, such as trousers.

 ,
, 


