Article

Energy Consumption and Carbon Emission Analysis of Typical Regeneration Methods for Asphalt Pavements

1
Guangdong Guanyue Highway & Bridge Co., Ltd., Guangzhou 511450, China
2
School of Civil Engineering and Transportation, South China University of Technology, Guangzhou 510641, China
*
Author to whom correspondence should be addressed.
Buildings 2023, 13(6), 1569; https://doi.org/10.3390/buildings13061569
Submission received: 10 May 2023 / Revised: 6 June 2023 / Accepted: 13 June 2023 / Published: 20 June 2023
(This article belongs to the Special Issue Innovation in Pavement Materials)

Abstract

:
A quantitative evaluation was conducted on the energy consumption and carbon emissions during the asphalt pavement regeneration process, and the energy consumption and emission ratios during the construction and raw material production stages of the cold and hot regeneration process were obtained. This study applies the theory of life cycle assessment to propose an evaluation framework and calculation method suitable for quantitatively evaluating the environmental impact of the asphalt pavement regeneration process. Firstly, based on the life cycle evaluation theory, the evaluation framework and calculation method applicable to the quantitative study of the environmental impact of asphalt pavement regeneration processes are discussed, and the calculation formulae for the comprehensive energy consumption and comprehensive carbon emission of asphalt pavement regeneration are derived. It is found that the energy consumption and emission in the hot regeneration process account for 50~70% of the total process in the construction stage, and 50~65% of the total process in the cold regeneration process in the raw material production stage. Compared with the milling and resurfacing process, the energy consumption and carbon emission of the asphalt pavement regeneration process are reduced by about 16~66%, and the carbon emission is reduced by about 14~53%, so the energy saving and emission reduction benefits are more significant. The amount of RAP mixing, transportation distance of raw materials and pavement regeneration depth have a great influence on the energy consumption and emission of pavement regeneration. It can provide scientific guidance for the quantitative evaluation of the environmental impact of asphalt pavement regeneration, with a view to providing energy-saving and emission reduction level data support for technology improvement and engineering decisions.

1. Introduction

As an important infrastructure for national life and production, highway transportation plays an important role in the economy, culture, national defense and other fields. Asphalt pavement occupies an important position in China’s highway construction [1]. With its good high-temperature stability, low-temperature crack resistance, water stability and easy construction and maintenance advantages, it is widely used on all levels of roads, especially on high-grade roads. As the structural design life of asphalt pavement in China is 8~15 years, more sections have entered the maintenance stage of major and medium maintenance. At the same time, China’s highway construction concept gradually changed from reconstruction to construction and maintenance, asphalt pavement maintenance and repair needs are growing year by year. China’s asphalt road construction has shifted from a high-speed construction period to a maintenance period [2].
About 12% of the asphalt pavement in China needs maintenance and resurfacing every year, and the common method in China is milling and resurfacing in the face of more serious pavement diseases [3]. Asphalt pavement milling resurfacing will produce a large amount of waste asphalt mixture, the waste pile not only occupies a lot of space but also cause serious environmental pollution and waste of resources. At the same time, the reconstruction process uses more high-quality raw materials, which consumes a lot of money and resources, and consumes a lot of energy and emits a lot of greenhouse gases into the atmosphere [4,5]. According to a study by the International Road Federation, the energy consumption of 1 km of two-lane asphalt pavement construction is about 7 × 10⁶ MJ, which is equivalent to the calorific value of 240 tons of standard coal burning. Faced with the problem of resources and environment caused by the construction of asphalt pavement, China promotes asphalt pavement regeneration technology in the field of pavement construction, which can solve the problem of resource waste and the environmental impact of the road construction process to a greater extent [6,7].
For the evaluation of the environmental impact of road regeneration, the method of life cycle assessment can provide a mature research framework to comprehensively and quantitatively analyze the environmental impact in the field of road regeneration [8]. Life Cycle Assessment (LCA), as a quantitative research method for product environmental impact, takes into account the energy consumption and emission performance of a product in all aspects of its life cycle to identify potential environmental impact problems and propose solutions [9]. However, there is still a lack of research boundaries and calculation methods for asphalt pavement regeneration methods and a lack of quantitative comparative evaluation of environmental impacts in each phase. It is necessary to conduct quantitative research and analysis of energy consumption and carbon emission of asphalt pavement regeneration technology [10].
Tarja Häkkinen used a process-based life-cycle (PLCA) evaluation method to compare and analyze the energy consumption and carbon emissions of asphalt pavement and cement pavement raw material production, construction, and operation in the Finnish region. The results showed that asphalt pavements consume about twice as much energy as cement pavements, while cement pavement emissions are about 40% to 60% higher than those of asphalt pavements [11]. Horvath et al. used the EIO-LCA model to comparatively evaluate hot-mix asphalt pavements and continuously reinforced cement pavements, and the results showed that asphalt pavements consumed about 40% more energy than cement pavements [12]. Stripple studied the environmental impact of cement pavements and hot-mix cold-mix asphalt pavements at various stages using the PLCA evaluation method, and the indicators included energy consumption, water pollution, air pollution, resource consumption, and so on. The results showed that asphalt pavements consumed more energy than cement pavements when considering energy consumption for raw material production. Cement pavements had higher greenhouse gas emissions than hot-mix cold-mix asphalt pavements [13]. Park et al. used a comprehensive life cycle assessment method (Hybrid LCA) applied to the study in the field of roads [14]. Treloar et al. used the Hybrid LCA approach to study the environmental impacts of eight different structures of pavements, and the results showed that the lowest energy consumption was achieved for concrete pavements with transmission bars and the highest for full-thickness asphalt pavements under the same conditions [15].
Chan used monetized indicators to analyze the environmental impacts of products through a life-cycle evaluation approach to explain the environmental burden, combining LCA research with LCCA research in the road sector for the first time [16]. Darrell et al. collected and summarized data on the production of raw materials, construction machinery, and transportation involved in the maintenance process of road projects in the United States [17]. Liu et al. quantified and analyzed the GHG emissions generated during the pavement design phase and evaluated the GHG emissions of pavements based on the project bid list, combined with data from additional carbon emission documents such as the European Building Research Institute [18]. Chen J et al. developed a process-based LCA framework to quantify the GHG emissions during road construction, mainly using emission factors to estimate asphalt and cement pavements separately [19]. Chen used a time-based LCA evaluation method to study the GHG emissions from asphalt recycled pavements. The results showed that as the RAP content increased, the reduction in GHG emissions increased accordingly, but the environmental benefits of RAP decreased as the mixing efficiency decreased or the water content of RAP increased [20]. Saadi et al. used the LCA method to quantitatively evaluate the environmental impacts of the construction and use phases of the asphalt pavement maintenance process, and the maintenance techniques studied in comparison included thin slurry layering, crack filling and sealing and thin layer overlay. The study showed that the carbon emissions of thin-layer overlay were the largest and the emissions of crack filling were the smallest due to the use of rawer materials [21]. Heidari et al. combined the LCA evaluation method with the LCCA evaluation method to study the selection of sustainable pavements using a multi-criteria decision-making approach. The study showed that the use of PCCP pavement is more sustainable compared to ACP pavement due to 12% lower environmental impact and 55% lower energy consumption over the whole life cycle of PCCA pavement. For developing countries that are making large investments in road construction, choosing pavements with PCCP can increase sustainability and reduce energy consumption [22].
The study of energy consumption and carbon emission of asphalt pavement mainly adopts the LCA evaluation method. The research generally divides each stage of road construction, such as dividing the new road into four stages of asphalt mixture production, transportation, paving and rolling, and quantitatively studies the energy consumption and carbon emission of each process in each stage. Although the research on the energy consumption and carbon emission of each typical regeneration method of asphalt pavement has been initially developed in China, it has not yet conducted unified research and analysis on each regeneration method, and it has not formed a complete environmental impact evaluation system for the typical regeneration method of asphalt pavement, lacking systematic calculation methods and calculation models, making it difficult to clarify the specific environmental impact performance of various pavement regeneration methods.
For the research and analysis of energy consumption and carbon emission of typical regeneration methods of asphalt pavement, the LCA evaluation method is adopted to quantify the environmental impact of four typical regeneration methods: plant-mix hot regeneration, plant-mix cold regeneration, in-situ hot regeneration and in-situ cold regeneration, and to clarify the key aspects of the environmental impact of each regeneration method. Additionally, we quantitatively analyze the environmental impact performance of each regeneration method, in order to complement and improve the field of road energy saving and emission reduction. The study provides a data basis for the improvement and upgrading of regenerated pavement technology at the environmental impact level.

2. Energy Consumption and Carbon Emission Calculation Model

2.1. Calculation Formula for Each Stage of Asphalt Pavement Regeneration

2.1.1. Raw Material Production Stage Environmental Load Calculation Formula

Considering the characteristics of asphalt pavement regeneration methods, the calculation range of energy consumption and carbon emissions for asphalt pavement regeneration is divided into three parts: raw material production stage, construction stage, and transportation stage. The formula for calculating comprehensive energy consumption is:
E t o t = E R a w   m a t e r i a l + E c o n s t r u c t i o n + E t r a n s p o r t i o n                                                                        
where, E t o t is the comprehensive energy consumption of asphalt pavement regeneration;
E R a w   m a t e r i a l is the energy consumption during the production stage of raw materials;
E c o n s t r u c t i o n is the energy consumption during the road surface stage;
E t r a n s p o r t i o n is the energy consumption during the transportation phase.
The formula for calculating comprehensive carbon emissions is:
M t o t C O 2 = M R a w   m a t e r i a l s   C O 2 + M c o n s t r u c t i o n C O 2 + M t r a n s p o r t i o n C O 2
where, M t o t C O 2 represents the comprehensive carbon emissions from asphalt pavement regeneration;
M R a w   m a t e r i a l s   C O 2 refers to the emissions during the production stage of raw materials;
M c o n s t r u c t i o n C O 2 represents emissions during the construction phase;
M t r a n s p o r t i o n C O 2 represents the emissions during the transportation phase.
The main raw materials used in the construction process of asphalt pavement regeneration include asphalt, new aggregate, cement, and regenerating agent. These materials consume a large amount of energy in the production process and emit exhaust gases during the production process, causing a relatively large impact on the environment [23,24]. If the energy consumption equivalent per unit mass of raw material production and the carbon emission equivalent per unit mass of raw material production are known, then only the mass of each material needs to be obtained to calculate the corresponding energy consumption and emission [25]. The production quality of raw materials is m i R a w   M a t e r i a l s and the energy equivalent of raw material production per unit quality is e ¯ i R a w   M a t e r i a l s = ( j = 1 i e j R a w   m a t e r i a l s · p j R a w   m a t e r i a l s ) / m i R a w   m a t e r i a l s . Then, the energy consumption of raw material production is E i R a w   M a t e r i a l s = m i R a w   m a t e r i a l s · m i R a w   m a t e r i a l s . The energy consumption of this stage is calculated by the Formula (1).
E R a w   m a t e r i a l s = m i R a w   m a t e r i a l s · e ¯ i R a w   m a t e r i a l s
where, E R a w   M a t e r i a l s is the energy consumption during the production stage of raw materials.
Similarly, the production emission equivalent per unit mass of raw material is E F ¯ i   r a w   m a t e r i a l . The carbon emission calculation formula is:
M R a w   M a t e r i a l s C O 2 = m i R a w   M a t e r i a l s · E F ¯ i R a w   M a t e r i a l s
where, M R a w   M a t e r i a l s C O 2 represents the emissions during the production stage of raw materials.

2.1.2. Construction Phase Environmental Load Calculation Formula

The energy consumption and emission of asphalt pavement construction stage are mainly caused by the electricity and oil consumption of construction machinery and equipment, so the calculation of energy consumption and carbon emission in this stage needs to investigate and analyze the parameters of electricity and oil consumption of each piece of equipment. In the process of asphalt pavement regeneration, the electricity consumption of machinery and equipment is reflected in the electric drive of plant mixing equipment and other processes. The oil consumption is reflected in the heavy oil or fuel oil consumed when heating the hot regeneration equipment, and the gasoline or diesel consumed when driving the in-situ regeneration equipment, paving and compaction equipment, loaders, water tankers and other equipment. In the field of energy saving and emission reduction, the equipment parameters of each piece of machinery and equipment are expressed as the oil consumption per unit of construction time.
Considering the construction time to calculate energy consumption and emissions, the consumption of various types of energy in a process during the construction phase is:
e i C o n s t r u c t i o n = T M i · O i C o n s t r u c t i o n
where,   e i C o n s t r u c t i o n is the row matrix of each energy consumption of process t. T M i is the construction time, usually expressed in shifts or hours. O i C o n s is the row matrix of different types of energy quantities consumed per unit construction time of the process t.
The discounted energy consumption and carbon emissions during the construction phase are shown in Equation (6).
E i C o n s t r u c t i o n = e i C o n s t r u c t i o n · p T = T M i · O i C o n s t r u c t i o n · p T
M i C o n s t r u c t i o n C O 2 = e i C o n s t r u c t i o n · E F T = T M i · O i C o n s t r u c t i o n · E F T
The integrated energy consumption of the construction phase is the sum of the converted energy consumption of each process (including the process set and the process set), and the integrated carbon emission is the sum of the carbon emissions of each of the processes, then:
E C o n s t r u c t i o n = T M i · O i C o n s t r u c t i o n · p T
M C o n s t r u c t i o n C O 2 = T M i · O i C o n s t r u c t i o n · E F T
Using the environmental load values H C o n s t r u c t i o n for E C o n s t r u c t i o n and M C o n s t r u c t i o n C O 2 and the environmental load coefficients β for p T and E F T , the environmental load calculation formula for the construction phase can be obtained as:
H C o n s t r u c t i o n = T M i · O i C o n s t r u c t i o n · β T

2.1.3. Environmental Load Calculation Formula for Transportation Phase

The transportation process needs to consider the energy consumed and carbon emissions generated during the return trip, calculated using the return coefficient a: if the return trip is empty, then a = 0.8. If the return trip is loaded, it is included in the other system boundaries, when a = 0. For the sake of convenience, it is assumed that the same mode of transportation is used and the full load is transported, and the return trip is completed with no load.
The energy consumption and emissions of transportation are calculated by considering the volume m i T r a n s p o r t a t i o n and distance l i T r a n s p o r t a t i o n . Remembering that O i T r a n s p o r t a t i o n is the fuel consumption per unit volume-distance of a certain transportation mode, the fuel consumption of this transportation process is shown in Equation (11).
e i T r a n s p o r t a t i o n = ( 1 + α ) m i T r a n s p o r t a t i o n l i T r a n s p o r t a t i o n O i T r a n s p o r t a t i o n
Then, the amount of converted energy consumption in the transportation phase is:
E T r a n s p o r t a t i o n = ( 1 + α ) m i T r a n s p o r t a t i o n l i T r a n s p o r t a t i o n O i T r a n s p o r t a t i o n · p T
Emissions during transportation are mainly provided by fuel, without considering greenhouse gases from other factors. Thus, the carbon emissions from the transportation phase are:
M T r a n s p o r t a t i o n C O 2 = ( 1 + α ) m i T r a n s p o r t a t i o n l i T r a n s p o r t a t i o n O i T r a n s p o r t a t i o n · E F T
Then the formula for calculating the environmental load in the transportation phase can be written as:
H T r a n s p o r t a t i o n = ( 1 + α ) m i T r a n s p o r t a t i o n l i T r a n s p o r t a t i o n O i T r a n s p o r t a t i o n · β T

2.2. Asphalt Pavement Regeneration Environmental Load Calculation Formula

From the above derivation process, the pavement regeneration environmental load calculation formula can be obtained as shown in Equation (14)
H t o t = H R a w   M a t e r i a l s + H C o n s t r u c t i o n + H T r a n s p o r t a t i o n = m i R a w   M a t e r i a l s γ i R a w   M a t e r i a l s + T M i O i C o n s t r u c t i o n β T + ( 1 + α ) m i T r a n s p o r t a t i o n l i T r a n s p o r t a t i o n O i T r a n s p o r t a t i o n β T
Among them, m i R a w   M a t e r i a l s , m i T r a n s p o r t a t i o n , T M i and l i T r a n s p o r t a t i o n are determined by the actual project volume, construction time and transportation distance. γ i R a w   M a t e r i a l s , O i C o n s t r u c t i o n   , O i T r a n s p o r t a t i o n and β T are determined in accordance with the research data and equipment parameters.
The process of road surface regeneration process volume is shown in Table 1.
The meanings represented by each symbol in Table 1 are described in Table 2.

2.3. Basic Information of Asphalt Regeneration Project

There are many asphalt road maintenance and construction processes in China, and different processes have different scopes of application. In order to ensure the comparability of the regeneration process, we used 1 km of single-lane asphalt pavement surface as the object of study of the environmental load of the regeneration process, the transport of raw materials was calculated by the same distance, the cold regeneration process used foam asphalt equipment, plant mix hot regeneration used 30% RAP doping, plant mix cold regeneration used 50% RAP dosing. The basic information on the pavement layer and engineering information is shown in Table 3. In this paper, the regeneration process for functional restoration of asphalt pavement is considered. In order to better evaluate the energy consumption and carbon emission of different regeneration methods of asphalt pavement, and to facilitate the comparative environmental impact analysis among the regeneration methods, a uniform functional unit needs to be selected. A 1 km single-lane road surface is defined as the functional unit under study, and the energy consumption and carbon emission are calculated to derive the environmental load value of the functional unit road section. Due to the large values of energy consumption and carbon emission values for the 1 km road section, the energy consumption and carbon emission values per square meter of the construction road section are used as the data for the analysis for ease of reading, expressed as MJ/m2 as the unit of converted energy consumption value and kgCO2/m2 as the unit of carbon emission value.
The density of the recycled mixture can be taken as 2.553 t/m3, and the calculation results of its engineering volume are shown in Table 4.

3. Results and Discussion

3.1. Analysis of Energy Consumption and Carbon Emission in Each Stage of Asphalt Pavement Regeneration

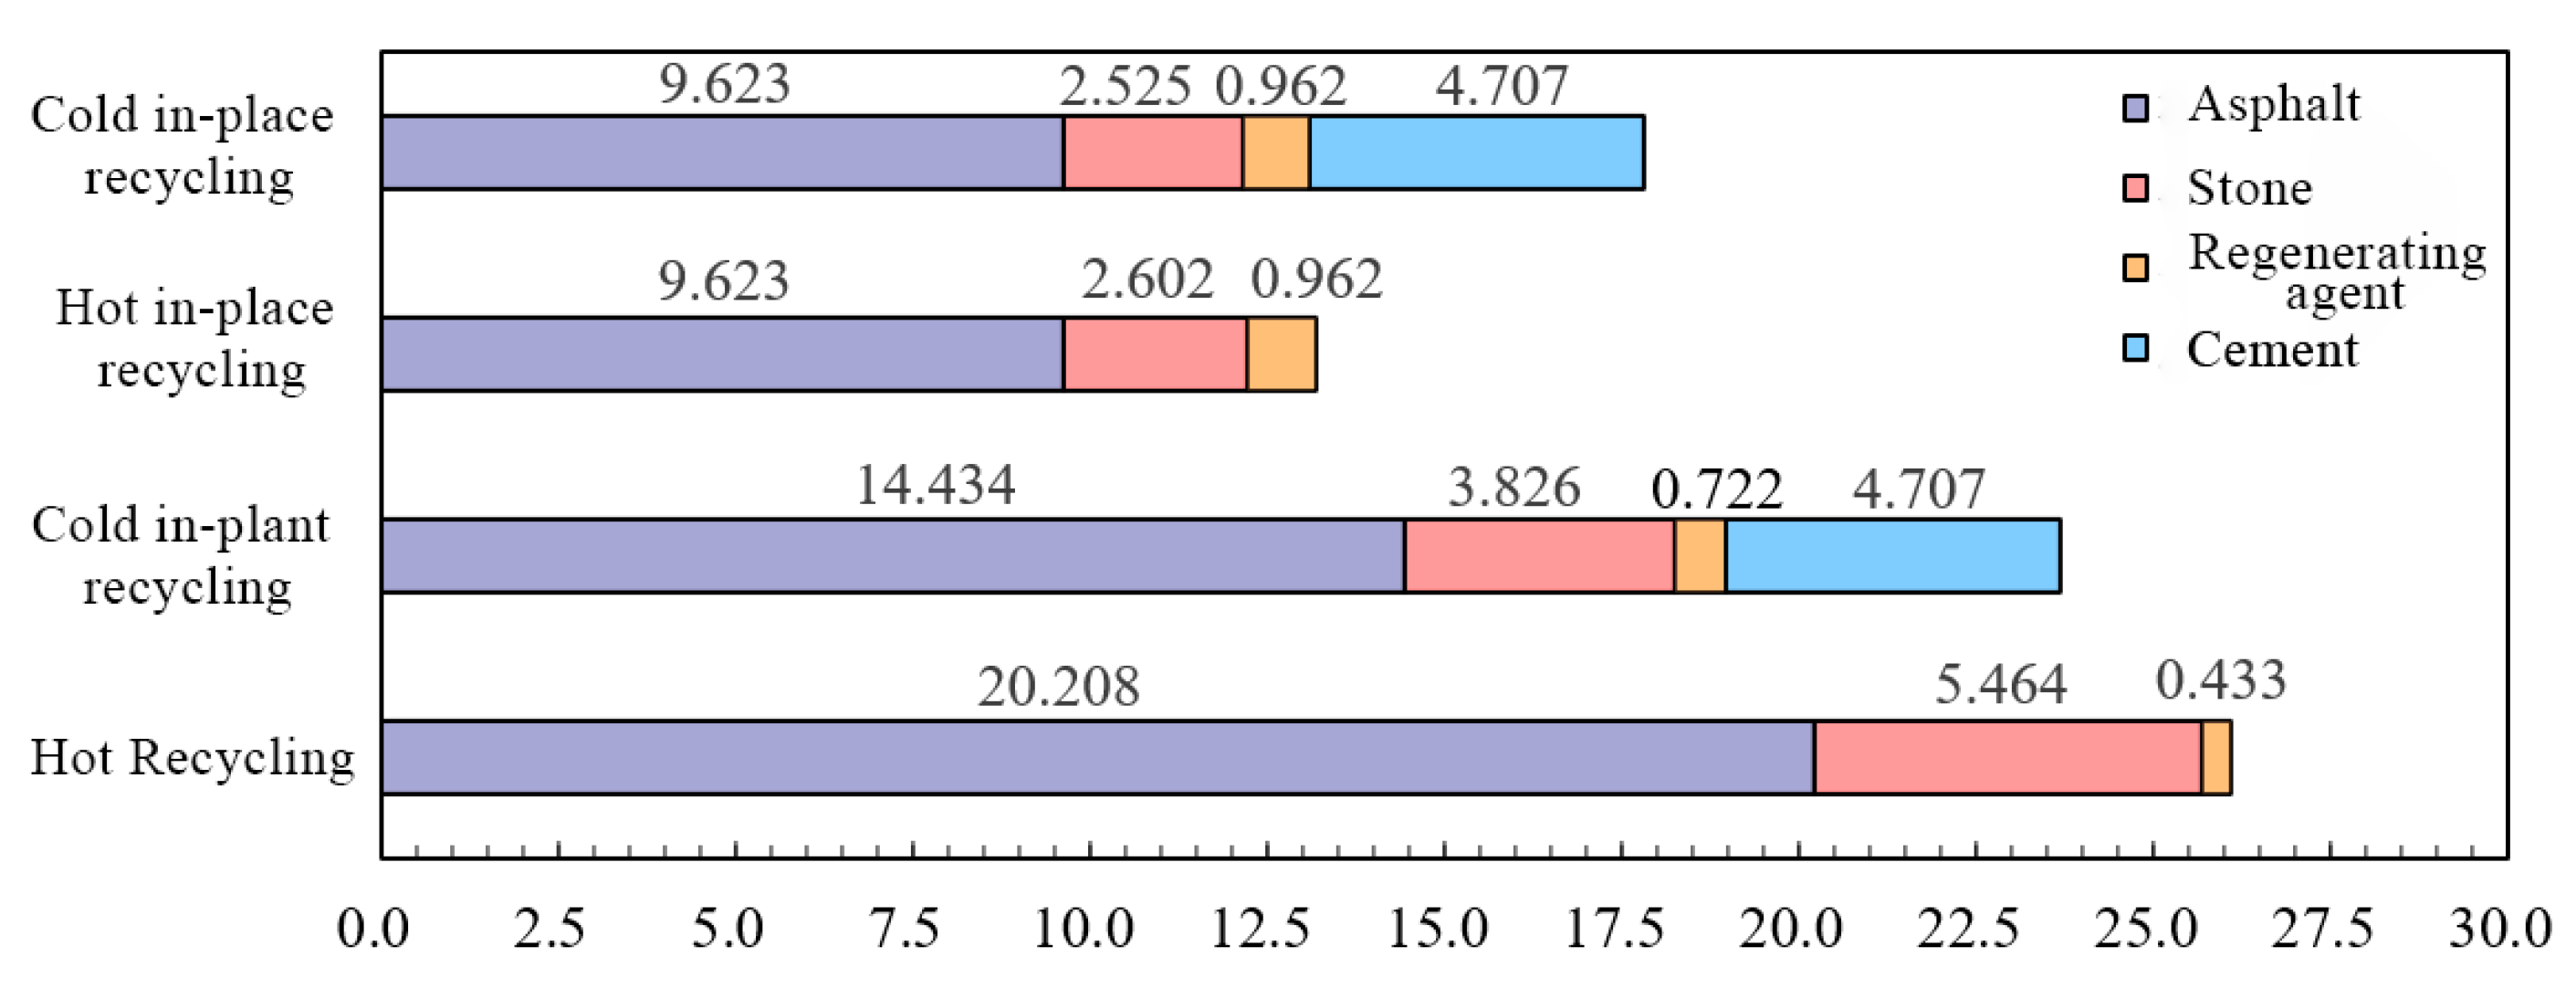
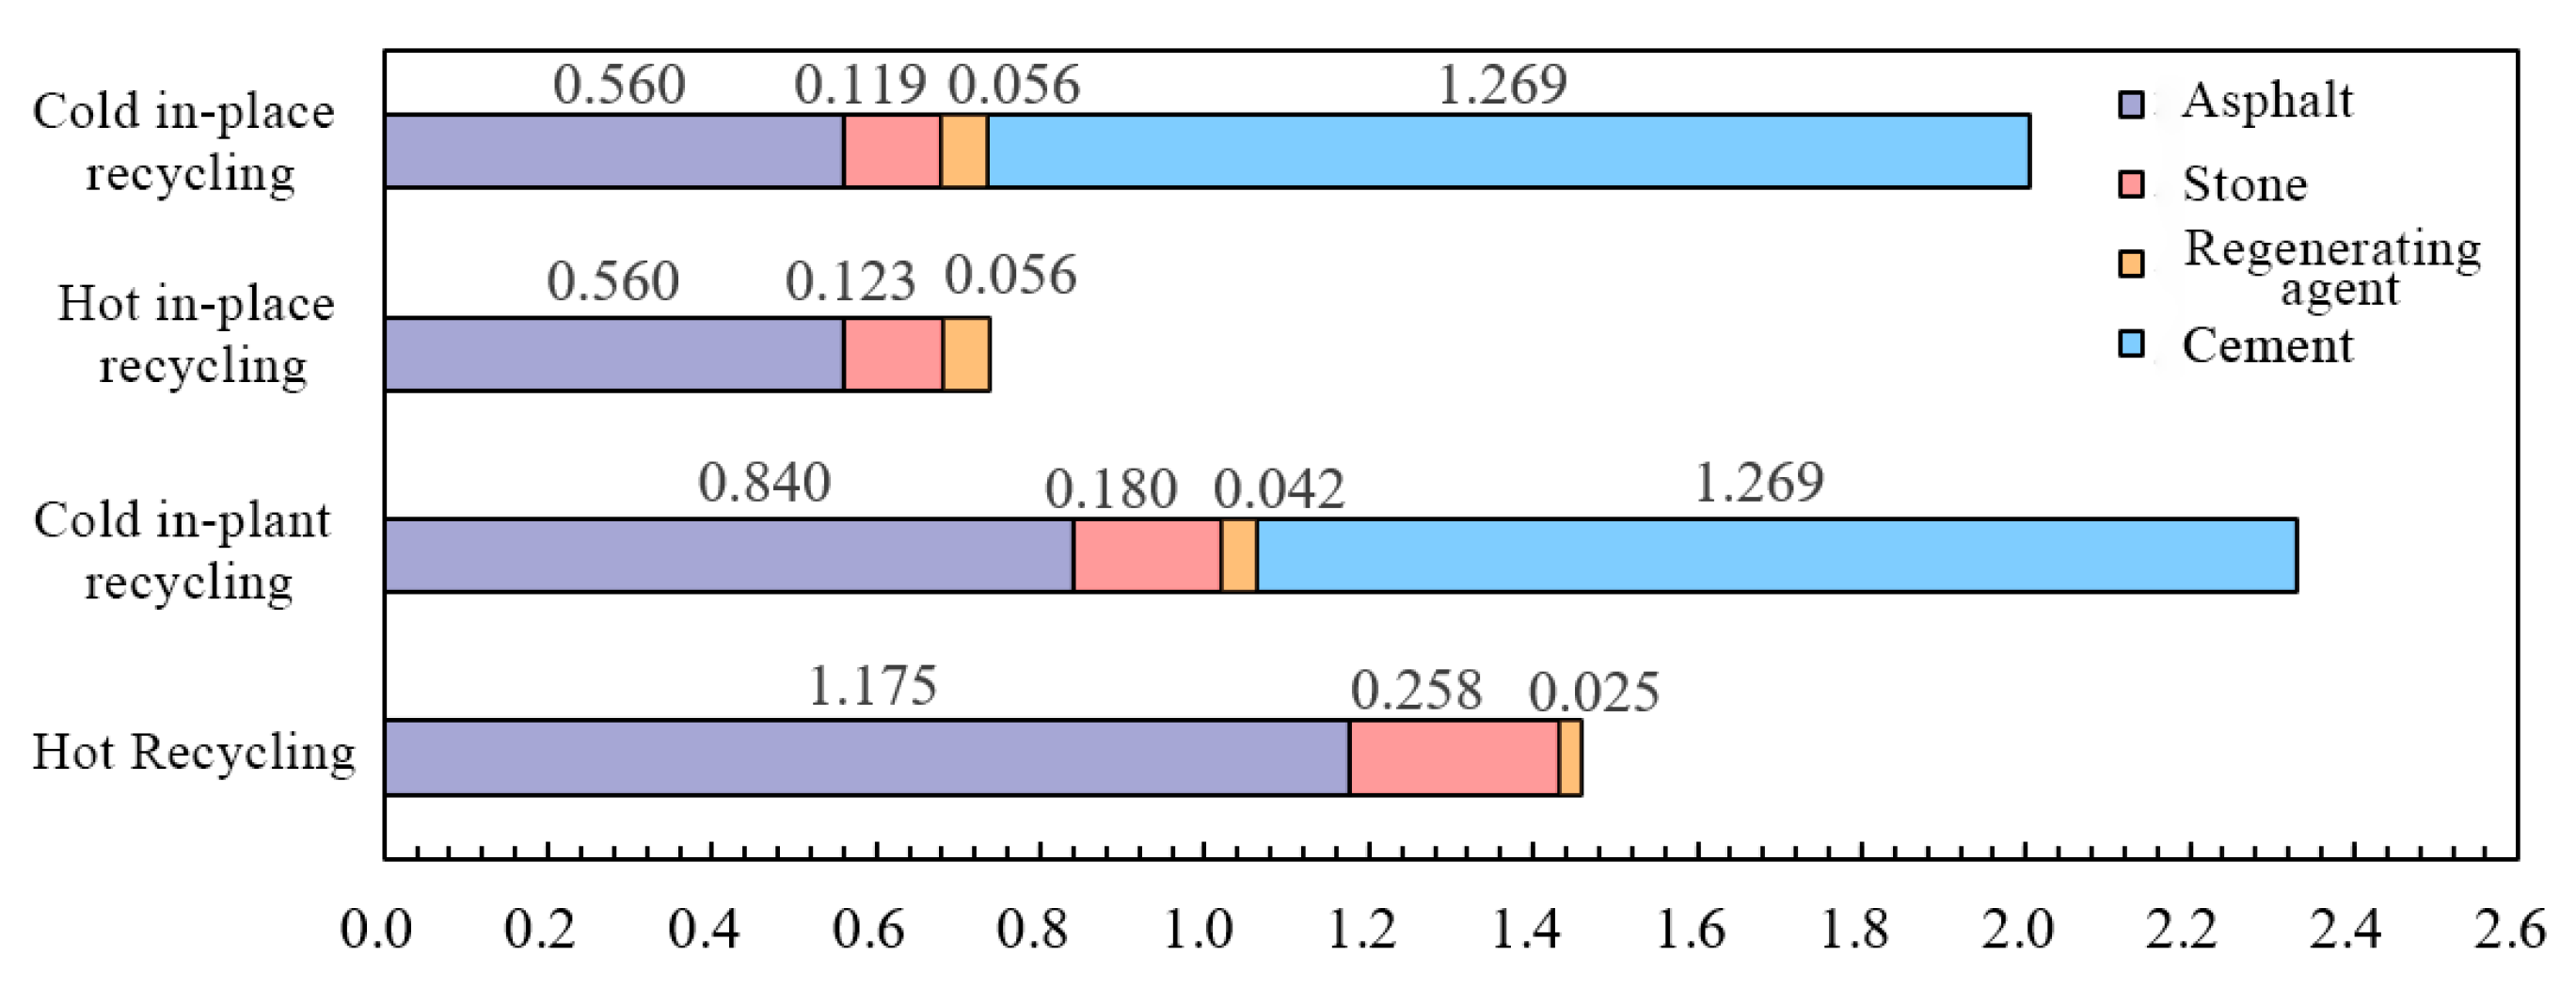
3.1.1. Analysis of Energy Consumption and Carbon Emissions during the Production Stage of Raw Materials

According to the environmental load calculation Formula (10) for the raw material production stage, the energy consumption and carbon emission calculation for the raw material production stage requires raw material quality and environmental load equivalents per unit mass of raw material production. The environmental load equivalent per unit mass of raw material production γ i r a w is shown in Table 5.
The energy consumption and carbon emission values for each regeneration method of asphalt pavement in the raw material production stage can be obtained, and the results are shown in Figure 1 and Figure 2.
The converted energy consumption values of the raw material production stages of a typical regeneration method for asphalt pavement are shown in Figure 1.
As can be seen from Figure 1, in the raw material production stage, the total energy consumption of the plant mix hot regeneration process is 26.105 MJ/m2, of which the highest energy consumption of asphalt production is 20.208 MJ/m2, accounting for 77.41%. The total energy consumption of the plant mix cold recycling process is 23.688 MJ/m2, of which the highest energy consumption is 14.434 MJ/m2 for asphalt production, accounting for 60.93%. The total energy consumption of the in-situ hot regeneration process is 13.187 MJ/m2, of which the energy consumption of asphalt production is 9.623 MJ/m2, accounting for 72.97%. The converted energy consumption value of the in-situ cold regeneration process is 17.816 MJ/m2, of which 9.623 MJ/m2 is for asphalt production, accounting for 54.01%. The comparison of energy consumption of each regeneration process is plant mix hot regeneration > plant mix cold regeneration > in-situ cold regeneration > in-situ hot regeneration.
The carbon emission values of the raw material production stage of typical regeneration methods for asphalt pavement are shown in Figure 2.
As can be seen from Figure 2, in the raw material production stage, the plant mix hot regeneration process emits 1.458 kgCO2/m2 of greenhouse gases, of which asphalt production has the highest carbon emission of 1.175 kgCO2/m2, accounting for 80.60%. The carbon emission of plant mix cold recycling process is 2.331 kgCO2/m2, among which cement production has the highest emission of 1.269 kgCO2/m2, accounting for 54.44%, followed by asphalt production emission of 0.840 kgCO2/m2, accounting for 36.01%. The carbon emission of the in-situ thermal regeneration process is 0.738 kgCO2/m2, among which the emission of asphalt production is 0.560 kgCO2/m2, accounting for the highest percentage of 75.80%. The carbon emission of the in-situ cold recycling process is 2.004 kgCO2/m2, among which 1.269 kgCO2/m2 is emitted from cement production, accounting for 63.33%, and 0.560 kgCO2/m2 is emitted from asphalt production, accounting for 27.93%, which is the second most important carbon emission link. The comparison of carbon emission in the production stage of raw materials of each regeneration process is plant mix cold regeneration > in-situ cold regeneration > plant mix hot regeneration > in-situ hot regeneration.
From the results in Figure 1 and Figure 2, it can be seen that the production of asphalt and cement are the main factors of energy consumption and emission in the raw material production stage of each asphalt pavement regeneration process. The production process of these two materials is complex and requires high-temperature heating to promote physicochemical reactions, so the energy consumption per unit mass of production is higher, and therefore, is in a dominant position in the energy consumption ratio of each regeneration process. The production process of cement produces a large amount of carbon dioxide due to chemical reactions, and the carbon emission per unit mass is much higher than that of other materials, so it makes the carbon emission of the cold regeneration process higher than that of the hot regeneration process. Although the use of aggregate is the largest, the energy consumption and emission of this material production are much lower than asphalt and cement, so its contribution to energy consumption and emission is not high. From the perspective of raw material production, to reduce the energy consumption and carbon emission of asphalt pavement regeneration, energy consumption and carbon emission can be effectively controlled by adjusting the amount of asphalt and cement within a reasonable range, so as to improve the energy saving and emission reduction benefits at this stage.

3.1.2. Analysis of Energy Consumption and Carbon Emissions during the Construction Phase

The pavement construction process includes milling, mixing, paving and compaction. For the plant mix regeneration process, the RAP material from the old pavement milling needs to be transported to the mixing station, and then the recycled mixture is heated and mixed after pretreatment, and then the mixture is transported to the construction site for paving and compaction. For the in-situ regeneration process, the pavement milling and mixing process can be carried out simultaneously by the regeneration machine, which will complete the regenerated asphalt mixture and form the final regenerated pavement through the paver and roller leveling and compaction process.
According to Equation (14), the calculation of energy consumption and carbon emissions during the pavement construction phase is composed of three multiplicative factors: environmental load parameters β , construction time T M i and equipment parameters O C o n s t r u c t i o n .
During the pavement construction phase, the main energy types are gasoline, diesel, heavy oil and electricity. According to the energy load list, the environmental load parameters β are as follows:
Energy consumption factor:
p = [ p Gasoline   p Diesel   p Heavy   Oil   p Electricity ] = [ 43.124   42.705   41.816   3.600 ] ;
Carbon emission factor:
E F = [ E F Gasoline   E F Diesel   E F Heavy   Oil   E F Electricity ] = [ 2.625   3.096   3.020   0.714 ] .
Construction time T M i is a key factor in calculating the oil and electricity consumption of equipment, which can directly affect the results of energy consumption and carbon emission. The equipment type and construction time of construction equipment are shown in Table 6.
The construction equipment parameters O C o n s t r u c t i o n are shown in Table 7.
According to Equation (14), the calculation process of energy consumption in the construction phase is shown in Table 8.
The converted energy consumption values for this phase are shown in Table 9.
As can be seen from Table 9, in the construction phase, the energy consumption value of the plant mix hot regeneration process is 40.613 MJ/m2, and the main energy-consuming equipment is the plant mix hot regeneration equipment, which consumes 33.006 MJ/m2, accounting for 81.27% of the total energy consumption in the construction phase. The energy consumption value of the plant mixing and cold regeneration process is 9.592 MJ/m2, and the energy consumption of each process is more average, among which the energy consumption of the plant mixing process is larger. The energy consumption value of the in-situ thermal regeneration process is 34.584 MJ/m2, and the main energy-consuming equipment is the in-situ thermal regeneration heater, which consumes 26.762 MJ/m2, accounting for 77.38% of the total energy consumption in the construction stage. The energy consumption value of the in-situ cold regeneration process is 9.968 MJ/m2, and the main energy-consuming equipment is the in-situ cold regeneration host, which consumes 4.252 MJ/m2, accounting for 42.65%.
According to the construction phase carbon emission calculation Formula (12), the carbon emission process of energy consumption in the construction phase is shown in Table 10. The comprehensive carbon emissions of this phase are shown in Table 11.
As can be seen from Table 11, in the construction phase, the emission value of the plant mix hot regeneration process is 3.054 kgCO2/m2, and the main equipment of carbon emission is the plant mix hot regeneration equipment, which emits 2.507 kgCO2/m2, accounting for 82.09% of the total emission in the construction phase. The carbon emission of the plant mixing and cold regeneration process is 0.746 kgCO2/m2, and the carbon emission of each process is more average, among which the carbon emission of the plant mixing process is 41.56%. The carbon emission of the in-situ thermal regeneration process is 2.500 kgCO2/m2, and the main equipment of carbon emission is the in-situ thermal regeneration heater, which emits 1.933 kgCO2/m2, accounting for 77.32% of the total emission in the construction stage. The emission of the in-situ cold regeneration process is 0.721 kgCO2/m2, and the main equipment of carbon emission is the in-situ cold regeneration mainframe, which emits 0.308 kgCO2/m2, accounting for 42.73%.
The results show that the energy consumption and carbon emission values of the hot regeneration process are higher than those of the cold regeneration process in the construction phase. For the hot regeneration process, the main equipment of energy consumption and emission is the plant mix hot regeneration equipment and the in-situ hot regeneration heater, because these two pieces of equipment need to consume a lot of heavy oil to heat the material, thus consuming more energy and emitting more greenhouse gas. For the cold regeneration process, the energy consumption (such as heavy oil) is greatly reduced due to the reduction of the heating process of the material, and the energy saving and emission reduction benefits are significant. Therefore, from the construction point of view, improving the heating equipment, enhancing the thermal efficiency of the equipment, or using warm or cold-mixing technology can significantly reduce energy consumption and carbon emission at this stage.

3.1.3. Analysis of Energy Consumption and Carbon Emissions in the Transportation Phase

The transportation phase of asphalt pavement regeneration mainly includes the transportation of raw materials. In addition, the plant mix regeneration process also includes the transportation of milling material and regeneration mix. In the calculation of this stage, assuming that the vehicle is fully loaded and returns empty, the return coefficient = 0.8. The distance between the raw material plant and the mixing plant is equal to the distance between the raw material plant and the construction site. All milling materials are transported to the mixing station for stacking and use, and all transportation is by road, and the transportation tool is a car with a capacity of 20 t.
According to the project profile, the transport distance and volume of each regeneration process is shown in Table 12.
The fuel consumption equivalent of 20 t transport equipment is O T r a n s p o r t = 0.0140 kg/(t·km).
The transport fuel type is diesel, then the environmental load parameters are:
p = 42.705   M J / k g
E F = 3.0959   k g C O 2 / k g
The energy consumption of the transport phase of asphalt pavement regeneration is calculated as shown in Table 13.
As can be seen from Table 13, in the transportation stage, the energy consumption value of plant mix hot regeneration is 15.670 MJ/m2, plant mix cold regeneration is 12.379 MJ/m2, in-place hot regeneration is 5.516 MJ/m2, and in-place cold regeneration is 5.516 MJ/m2. Because of the large quantity of aggregate, the transportation energy consumption is also larger, and the percentage of aggregate transportation in the transportation energy consumption of each process is 70.81%, 62.75%, 95.79% and 92.94%, respectively.
The emissions from the transport phase of asphalt pavement reclamation are shown in Table 14.
As shown in Table 14, in the transportation stage, the carbon emission value of plant mix hot regeneration is 1.136 kgCO2/m2, the carbon emission value of plant mix cold regeneration is 0.897 kgCO2/m2, the carbon emission value of in situ hot regeneration is 0.400 kgCO2/m2, and the carbon emission value of in situ cold regeneration is 0.400 kgCO2/m2. The percentage of aggregate transportation in the transportation energy consumption of each process is 70.81%, 62.75%, 95.79% and 92.94%, respectively.
It can be seen that in the transportation stage, aggregate transportation is the main link of energy consumption and carbon emission of each regeneration process, while the transportation energy consumption and emission of asphalt, regenerant, cement, milling material and regeneration mix are in the secondary position due to the relatively small amount of other raw materials and the close distance of mixing stations. In the transportation stage, the overall energy consumption and carbon emission of transportation can be effectively reduced by using materials from the aggregate plant which is closer.

3.2. Environmental Impact Assessment of Asphalt Pavement Regeneration Process

For the environmental impact evaluation of the typical regeneration process of asphalt pavement, the comprehensive energy consumption and comprehensive carbon emission of the whole process are mainly considered, and the performance of its environmental impact in the whole regeneration process is studied by counting the chemical values of energy consumption and carbon emission in each stage.

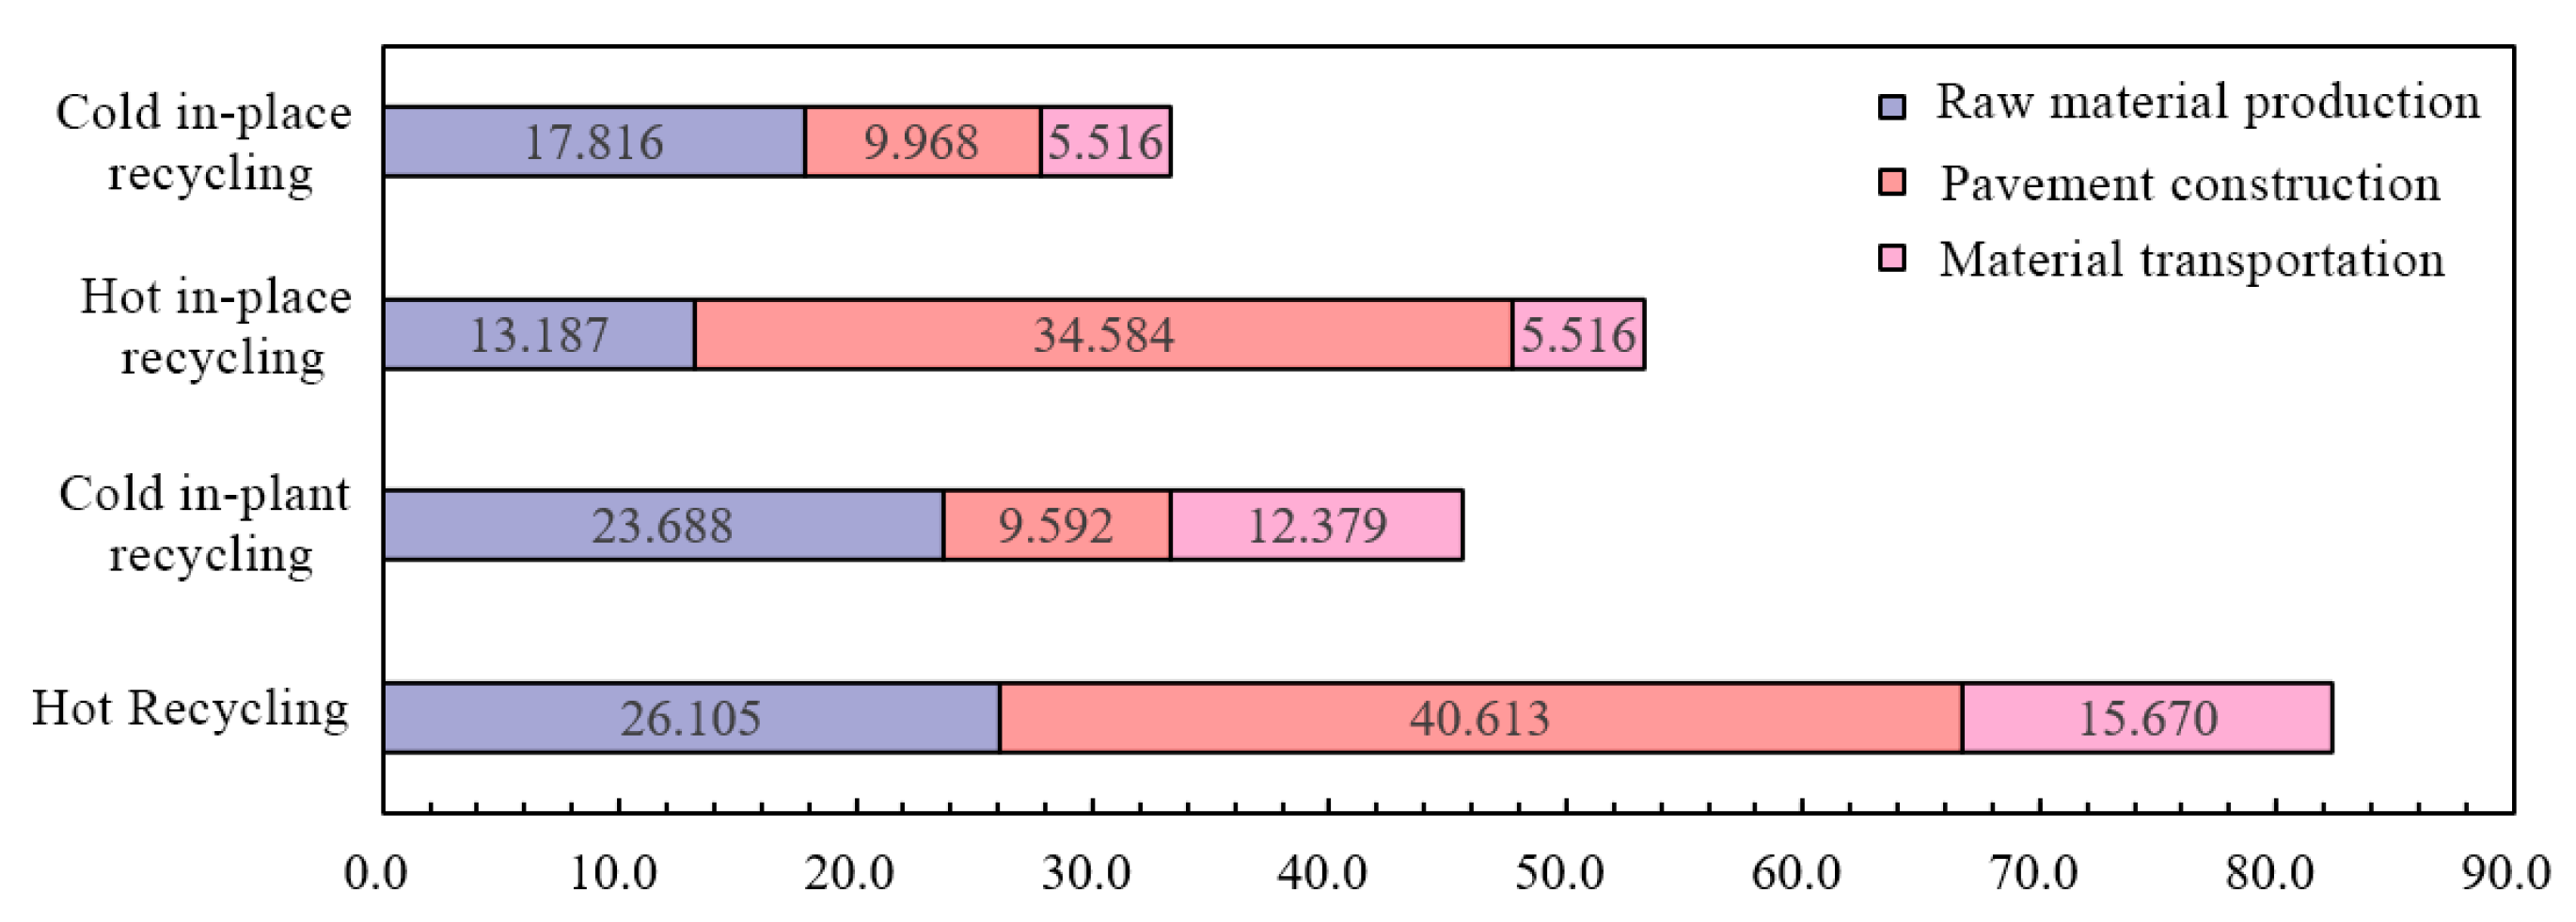
3.2.1. Comparative Evaluation of Energy Consumption of Asphalt Pavement Regeneration

Based on the calculation of energy consumption and carbon emission for each stage of the asphalt pavement recycling process, which is derived from the integrated energy consumption calculation model E t o t = E R a w   m a t e r i a l + E C o n s t r u c t i o n + E T r a n s p o r t a t i o n , the calculation results are shown in Figure 3.
As can be seen from Figure 3, the comprehensive energy consumption of plant mix hot regeneration is 82.388 MJ/m2, and the construction stage has the largest energy consumption value of 49.29%. The comprehensive energy consumption of plant-mixed cold regeneration is 46.660 MJ/m2, and the largest energy consumption in the raw material production stage is 23.688 MJ/m2, accounting for 51.88% of the comprehensive energy consumption. The comprehensive energy consumption of in-situ thermal regeneration is 53.288 MJ/m2, and the value of energy consumption in the construction stage accounts for 64.90% of the comprehensive energy consumption, which is the main stage of energy consumption. The comprehensive energy consumption of in-situ cold regeneration is 33.301 MJ/m2, and the raw material production stage consumes the most energy, 17.816 MJ/m2, accounting for 53.50% of the comprehensive energy consumption.
For the thermal regeneration process, the construction stage is the main stage of energy consumption. High mixing temperature and high construction temperature are the characteristics of asphalt pavement hot regeneration, and the regeneration process needs to consume a large amount of heavy oil and natural gas for heating, thus increasing the percentage of energy consumption in the construction stage, and also increasing the total energy consumption of the whole process of regeneration. For the cold regeneration process, since the construction can be carried out at room temperature, the energy consumption of the heating process is reduced compared with that of the hot regeneration process, so the comprehensive energy consumption is relatively low. The energy consumption of the two cold regeneration processes accounts for a larger proportion of the energy consumption in the raw material production stage, which accounts for half of the overall energy consumption of the regeneration process. The energy consumption of each asphalt pavement regeneration process is plant mix hot regeneration > in situ hot regeneration > plant mix cold regeneration > in situ cold regeneration.

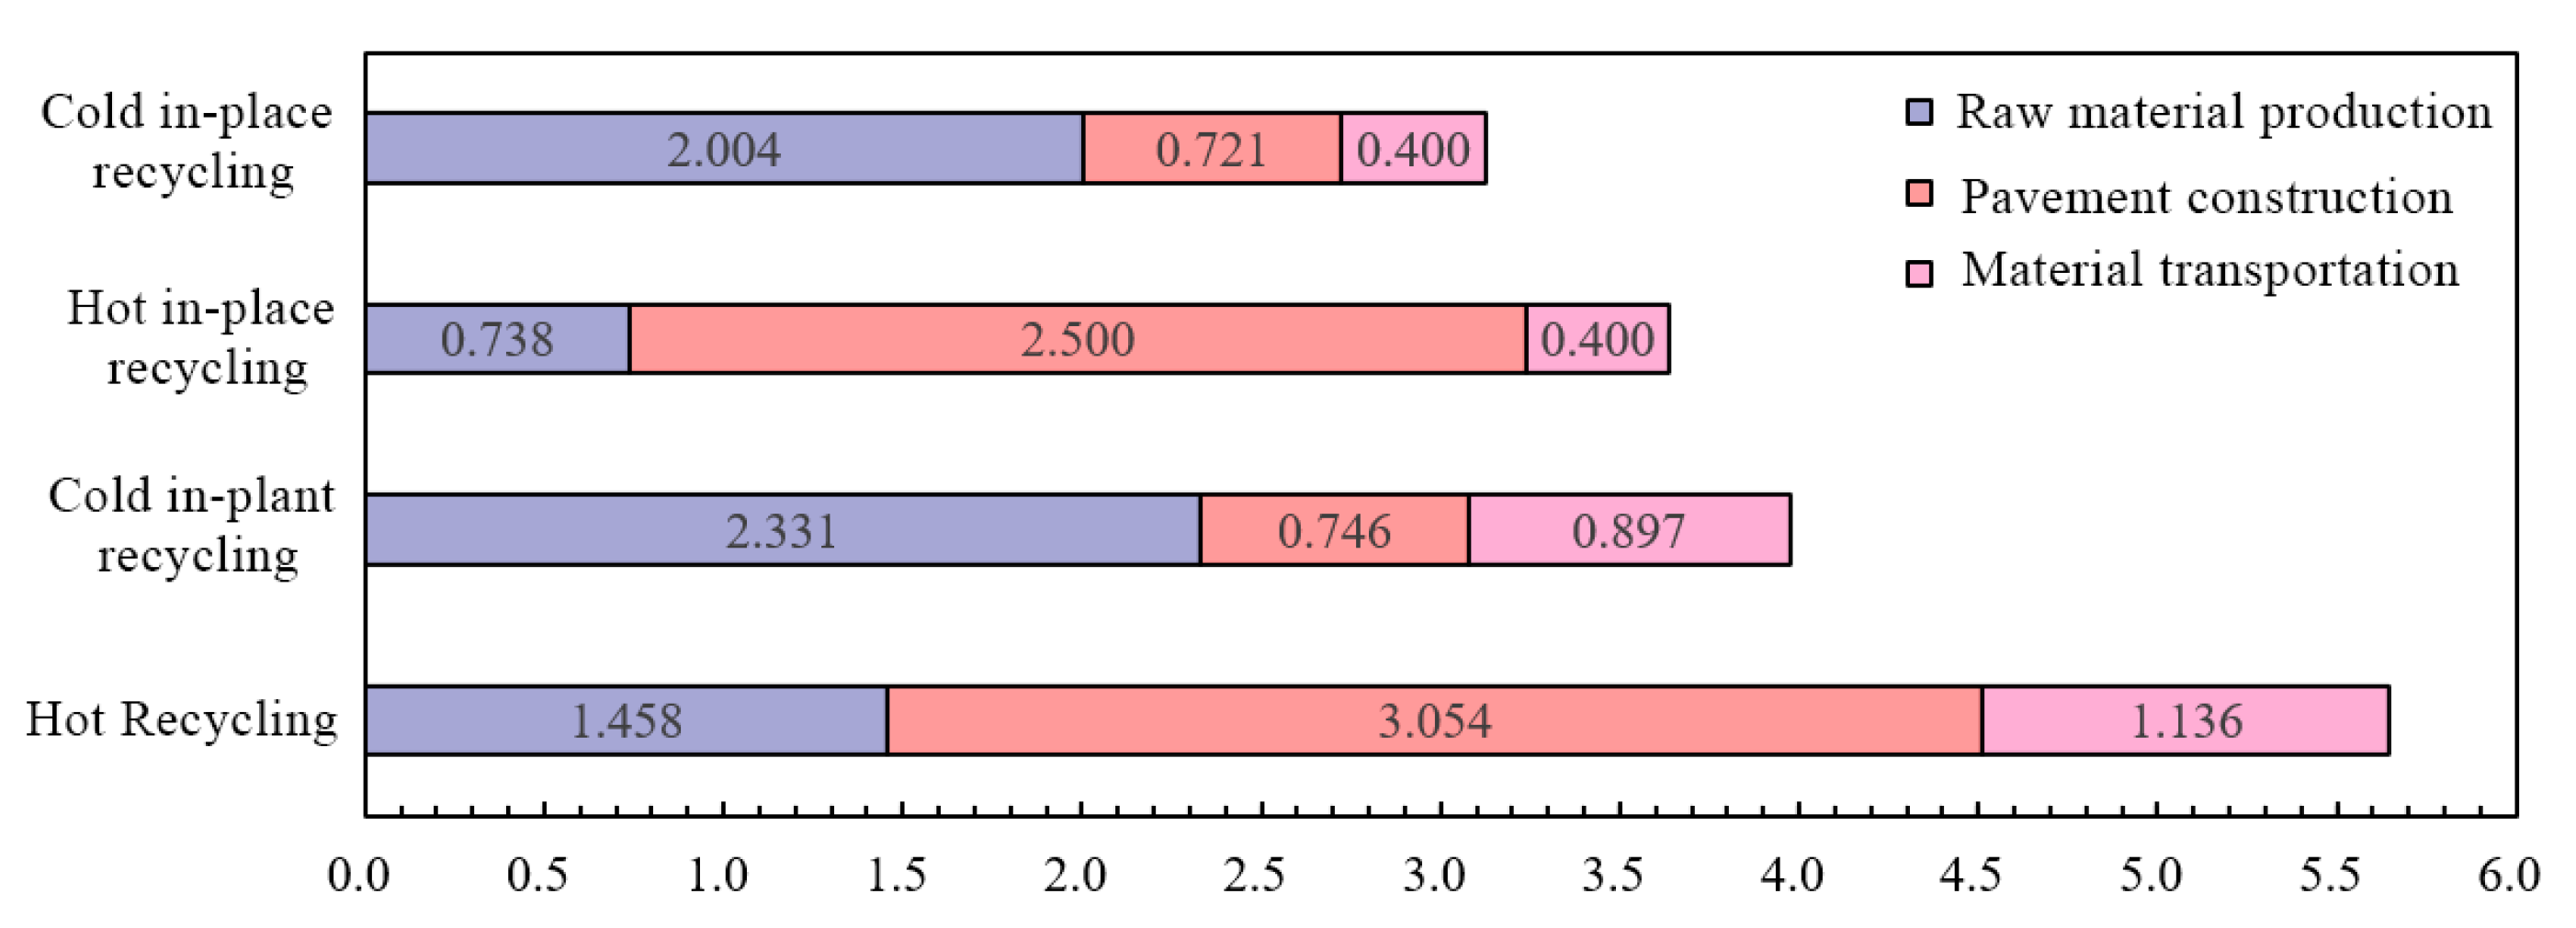
3.2.2. Comparative Evaluation of Carbon Emissions from Asphalt Pavement Recycling

The comprehensive carbon emission calculations for the typical regeneration process of asphalt pavement are shown in Figure 4.
As can be seen from Figure 4, the integrated carbon emission of plant-mix hot regeneration is 5.648 kgCO2/m2, and the construction stage has the largest emission share of 54.07%. The integrated carbon emission of plant-mixed cold regeneration is 3.915 kgCO2/m2, and the largest carbon emission is 2.331 kgCO2/m2 in the raw material production stage, accounting for 58.65% of the integrated carbon emission. The integrated carbon emission of in-situ thermal regeneration is 3.638 kgCO2/m2, and the carbon emission of the construction stage accounts for 68.71% of the integrated energy consumption, which is the main stage of the integrated carbon emission. The integrated energy consumption of in-situ cold recycling is 3.638 kgCO2/m2, in which the raw material production stage consumes the most energy, 2.004 kgCO2/m2, accounting for 64.12% of the integrated energy consumption.
The key stages of carbon emission and energy consumption of each asphalt pavement regeneration process are similar, with the hot regeneration process having higher carbon emission in the construction stage and the cold regeneration process having higher carbon emission in the raw material production stage. The main emission link between plant-mix hot regeneration and in-situ hot regeneration is material heating, and the carbon emission is influenced by the mixing temperature and construction temperature. Although the amount of cement used is not very high, the carbon dioxide emissions from the production of a unit quality of cement are higher than those of other materials, which affects the carbon emission ratio of the raw material production stage in the whole process of asphalt pavement regeneration. The comparison of the carbon emission size of each regeneration process is plant mix hot regeneration > plant mix cold regeneration > in-situ hot regeneration > in-situ cold regeneration.

3.3. Analysis of Energy Saving and Emission Reduction in Asphalt Pavement Regeneration

3.3.1. Evaluation of Energy Saving and Emission Reduction Benefits of Asphalt Pavement Regeneration

Compared with asphalt pavement milling and resurfacing, asphalt pavement recycling technology can recycle the waste resources of old pavement, reduce the use of asphalt and aggregate, and effectively reduce energy consumption and emissions. For the calculation of energy consumption and carbon emissions of the asphalt pavement rejuvenation process, when the RAP mixing ratio of the plant mix hot regeneration process is 0, the energy consumption and carbon emission of this construction process can be regarded as the energy consumption and carbon emission of milling and resurfacing, at this time, the comprehensive energy consumption and carbon emission of milling and resurfacing are calculated as shown in Table 15.
A comparison of the combined energy consumption and carbon emission between the milling and resurfacing process and each regeneration process is shown in Table 15. Compared with milling and resurfacing, the energy consumption and carbon emission of plant mix hot regeneration are 15.84% lower and 14.36% lower than that of milling and resurfacing. Compared with milling and resurfacing, the energy consumption of plant mix cold recycling are 53.36% lower and carbon emission is 39.73% lower. The energy consumption of in-situ hot regeneration is reduced by 45.57%, and carbon emission is reduced by 44.84%. The energy consumption of in-situ cold regeneration is reduced by 65.98%, and the carbon emission is reduced by 52.62%.
Compared with the milling and resurfacing process, the energy consumption and carbon emission of asphalt pavement can be reduced by 16~66% and 14~53%, respectively, so the energy saving and emission reduction benefits are significant.

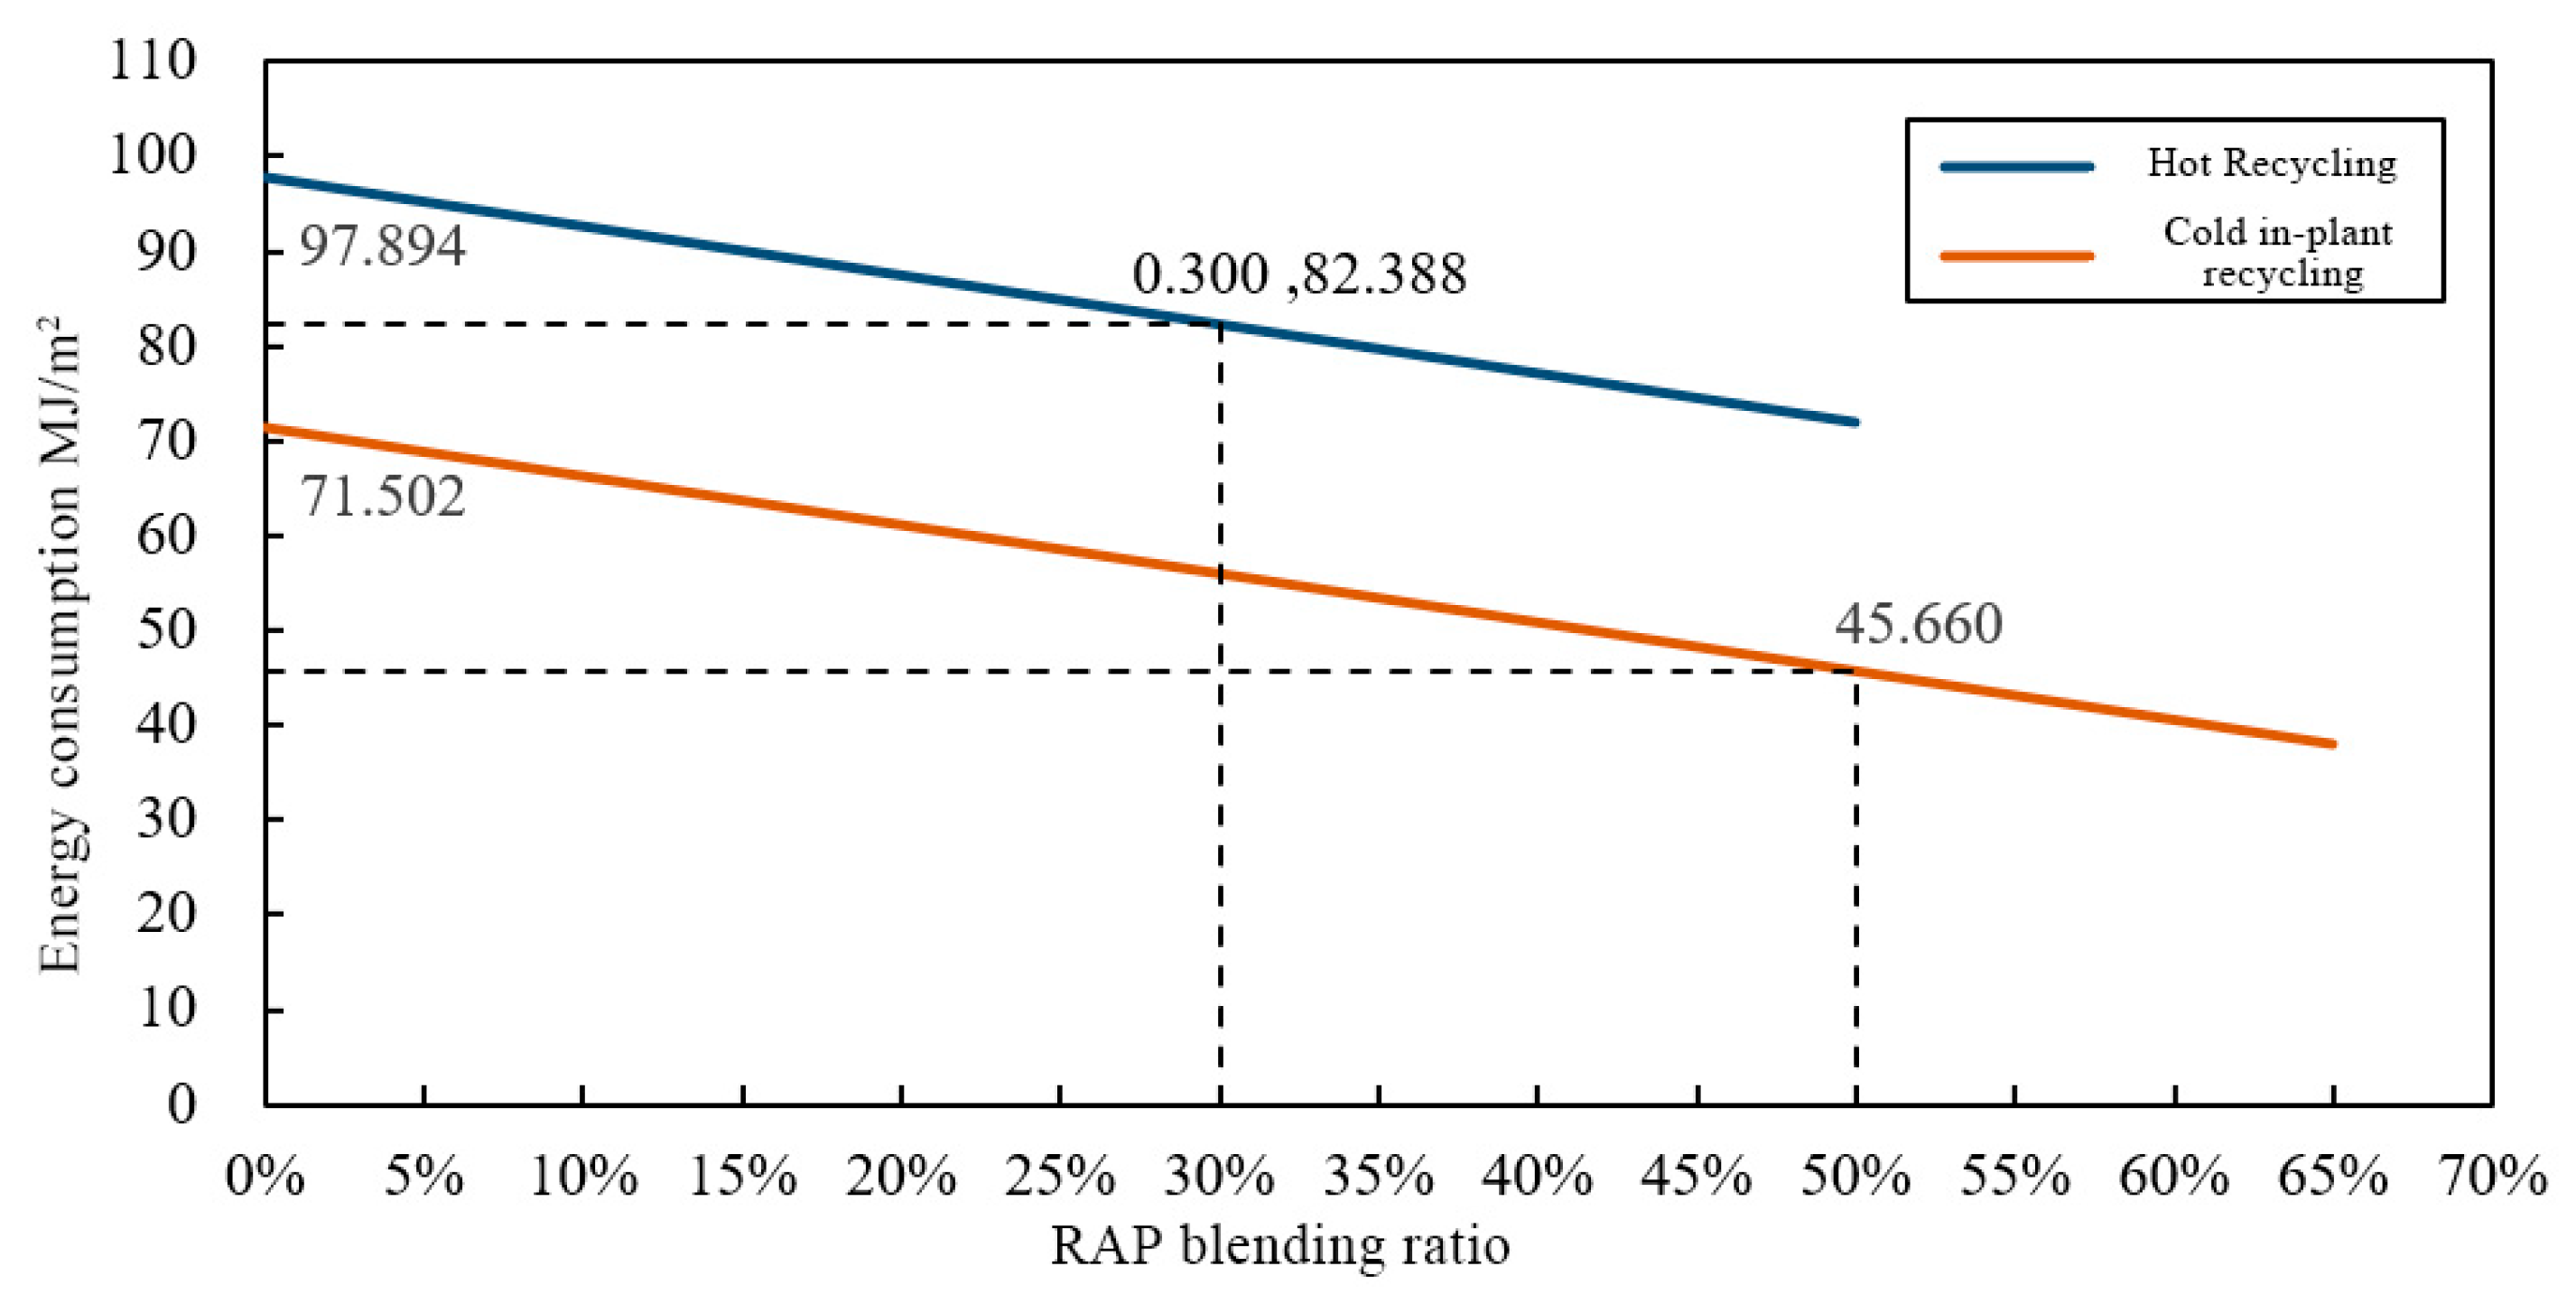
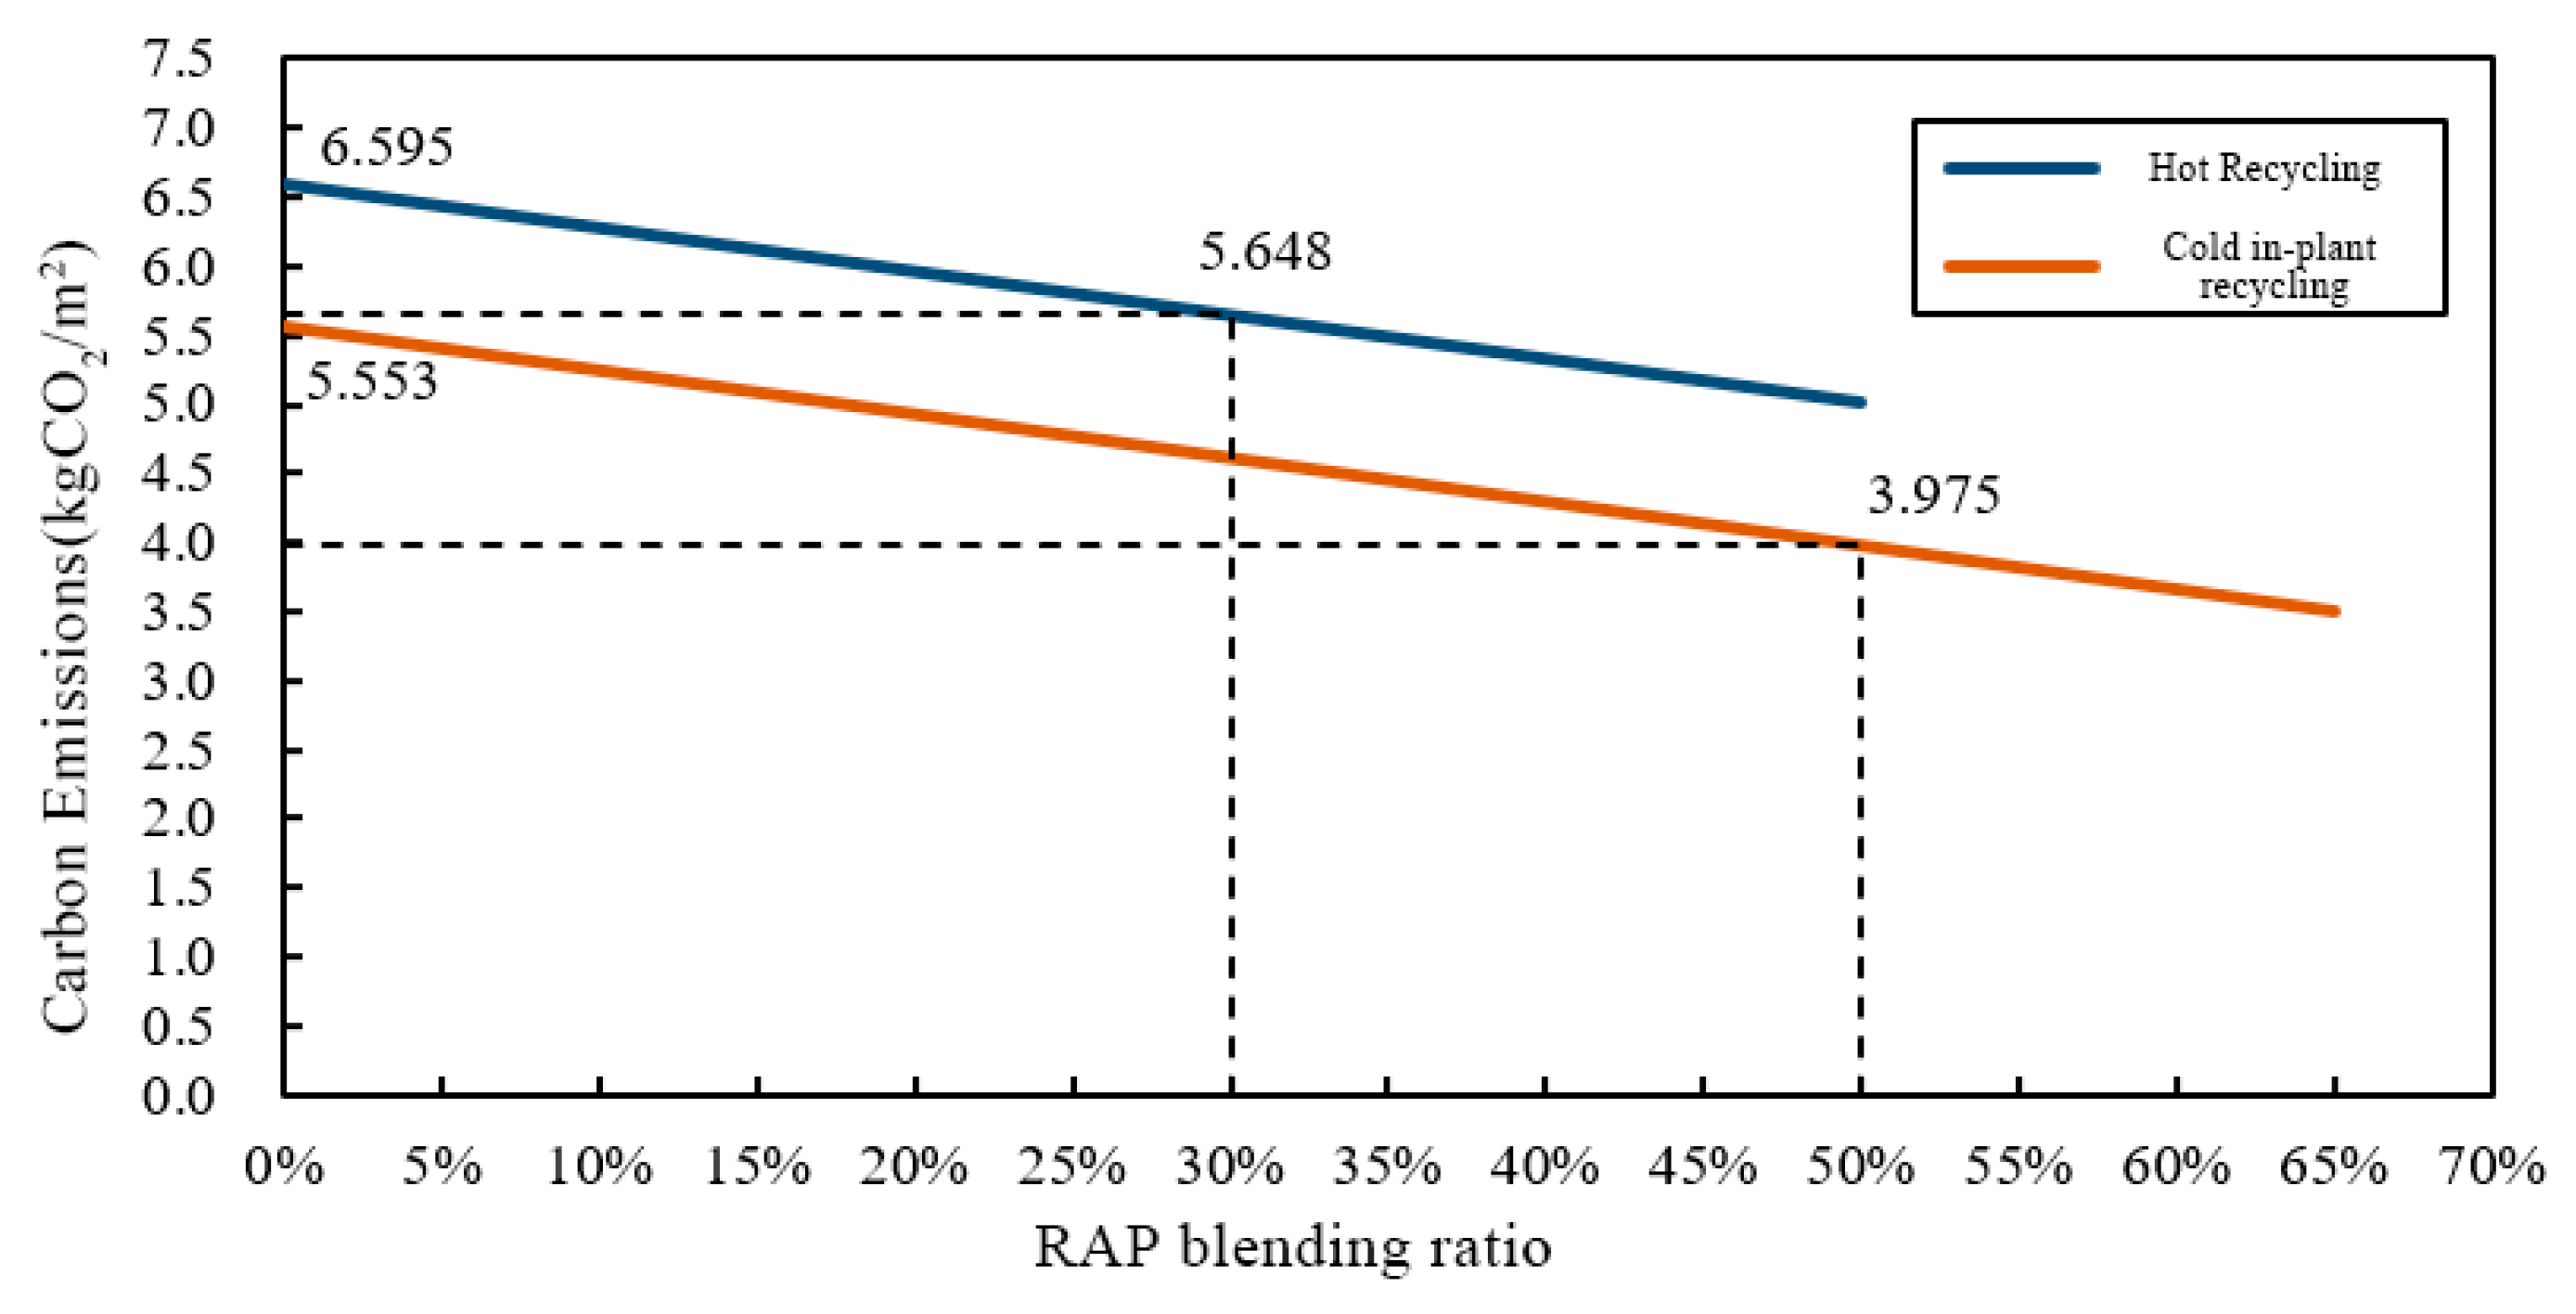
3.3.2. Environmental Loading Effect of RAP Blending Ratio

In the process of calculating the energy consumption and carbon emission of asphalt pavement recycling process, the amount of RAP has a greater influence on the comprehensive energy consumption and carbon emission, and the change in the RAP dosing ratio will affect the comprehensive energy consumption and carbon emission of plant mix recycling process from each stage. The results are shown in Figure 5 and Figure 6, where the energy consumption and carbon emission of the plant mix reclamation process are calculated with a 5% blending ratio as a step, and the energy consumption and carbon emission of the plant mix cold reclamation process are calculated with RAP blending ratio from 0% to 50% and from 0% to 65%.
The effect of the RAP blending ratio on the energy consumption and carbon emission of the plant mixing process showed a linear decreasing trend, and for each 5% increase in RAP blending ratio, the combined energy consumption and carbon emission of the plant mixing hot recycling process is reduced by 2.584 MJ/m2 and 0.158 kgCO2/m2, respectively. Compared with the 0% RAP hot-mix process, the energy consumption is reduced by 15.84% and carbon emission is reduced by 14.36%. Compared with the cold-mix process with 0% RAP, the energy consumption and carbon emission of the cold-mix process with 50% RAP will be reduced by 36.14% and 28.42%, respectively. Therefore, increasing the RAP blending ratio within a reasonable range can reduce the energy consumption and carbon emission of the whole process of pavement regeneration by reducing the amount of aggregate and asphalt used, reducing the energy emission of raw material production, and reducing the amount of fuel consumed for transportation, thus reducing the environmental load of asphalt pavement regeneration to a greater extent.

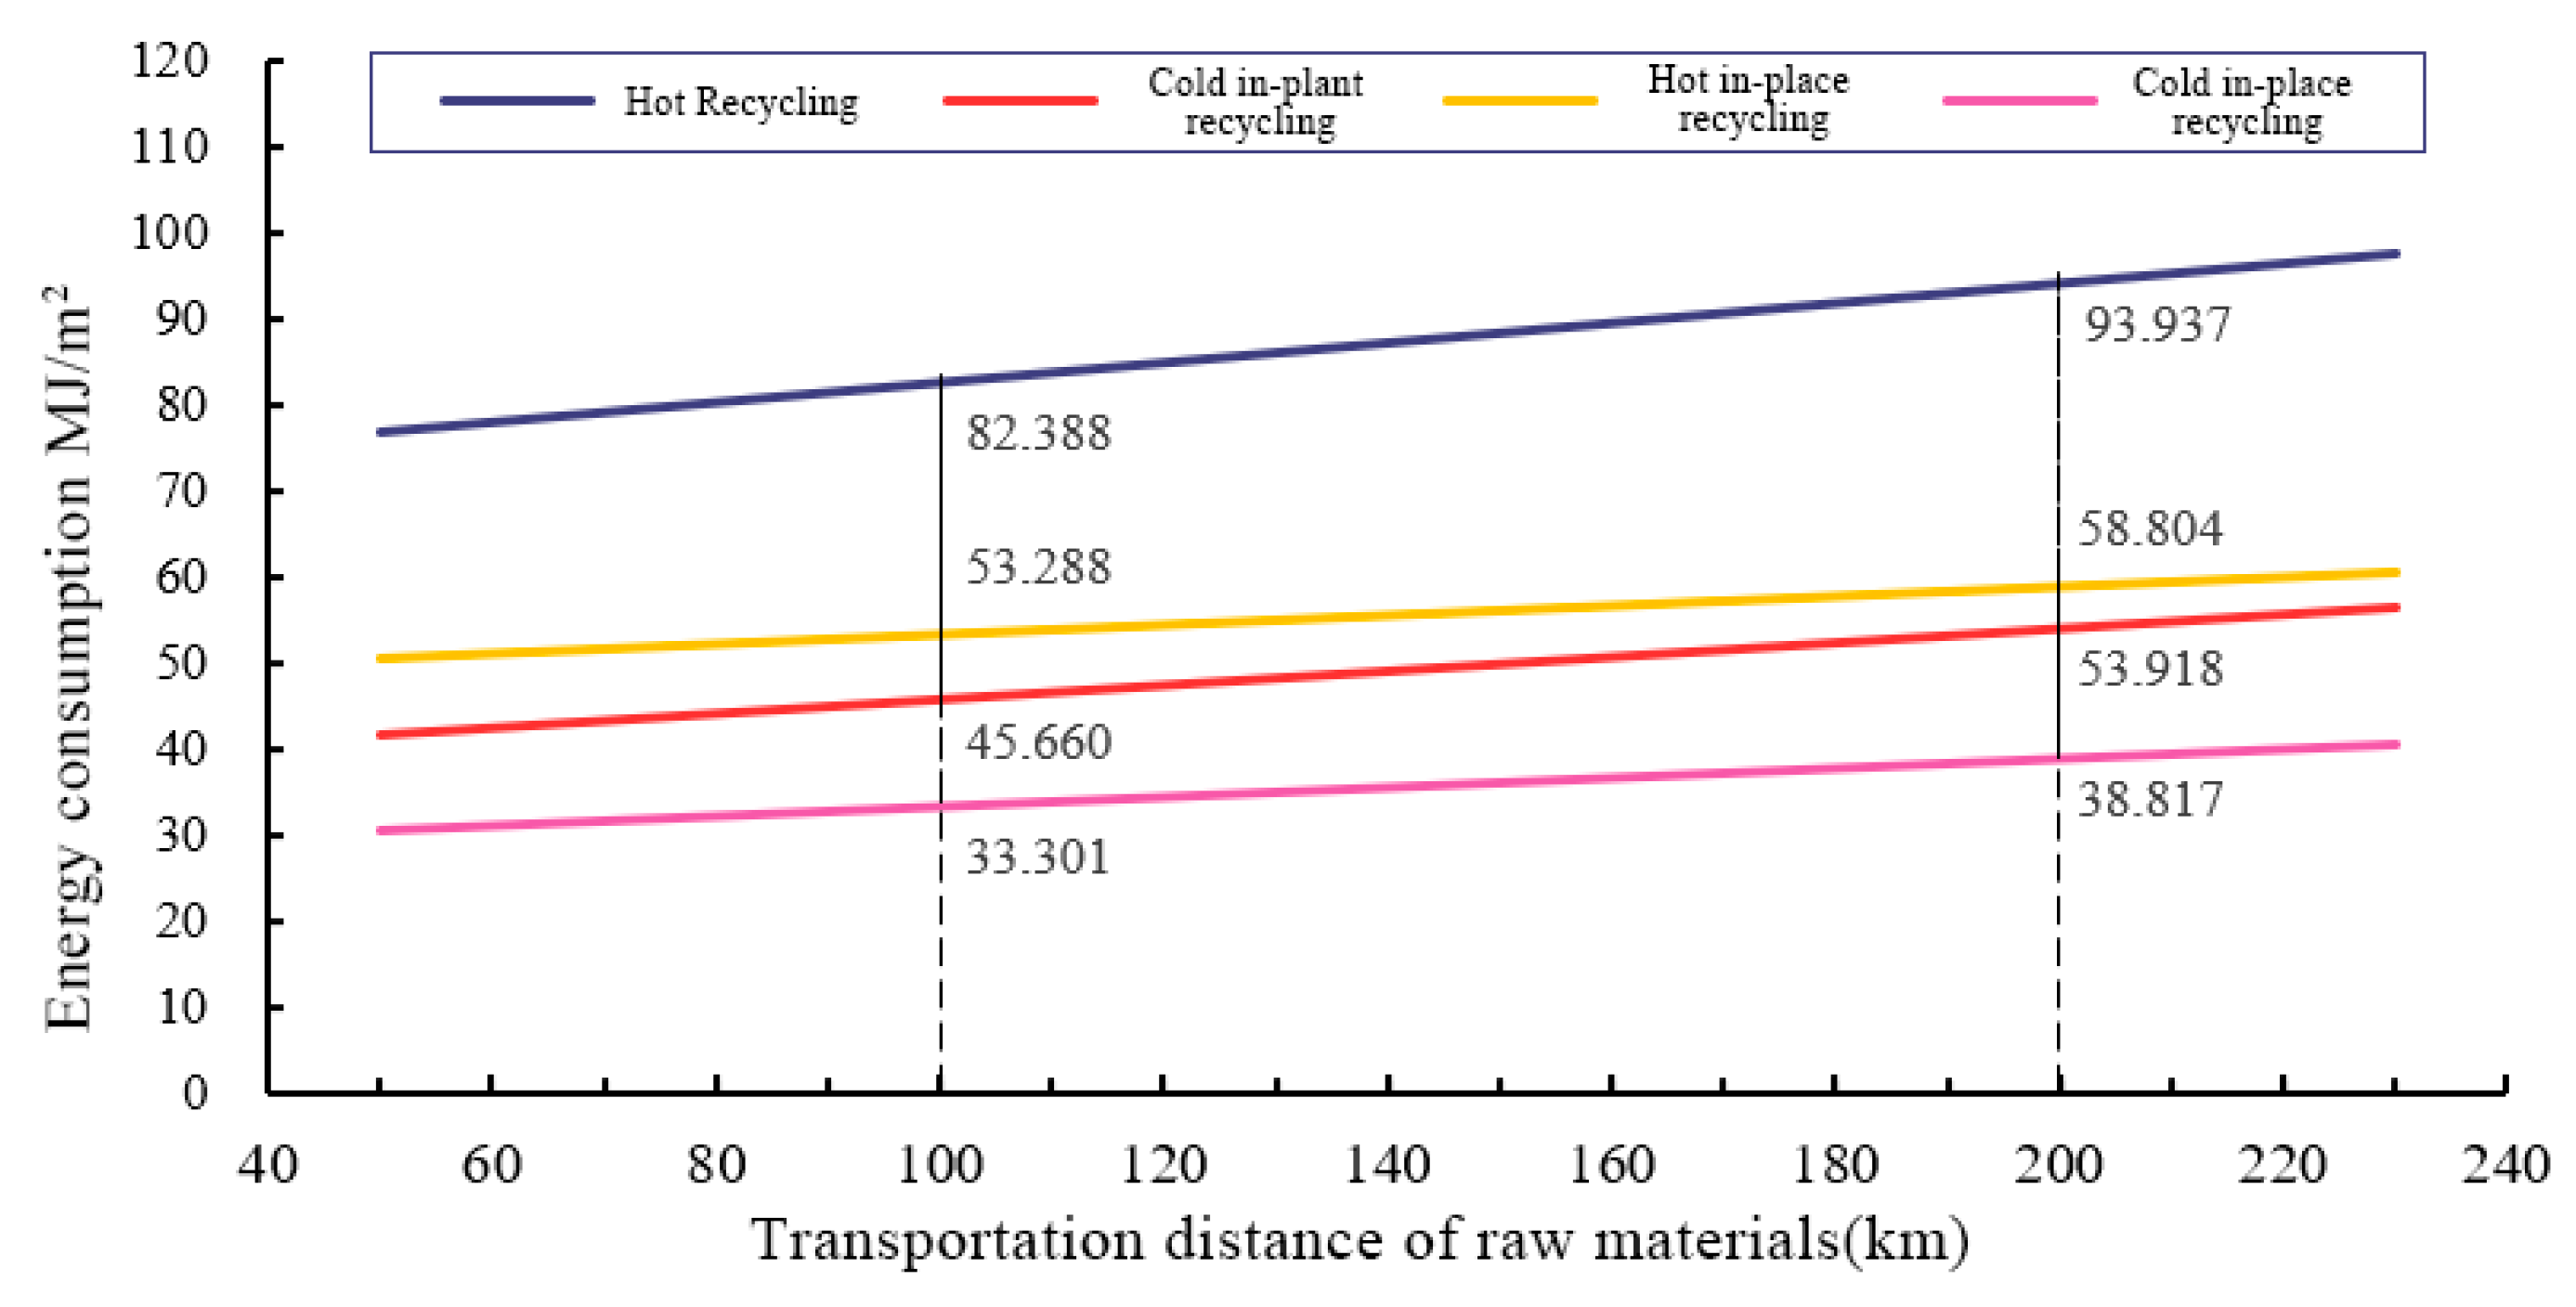
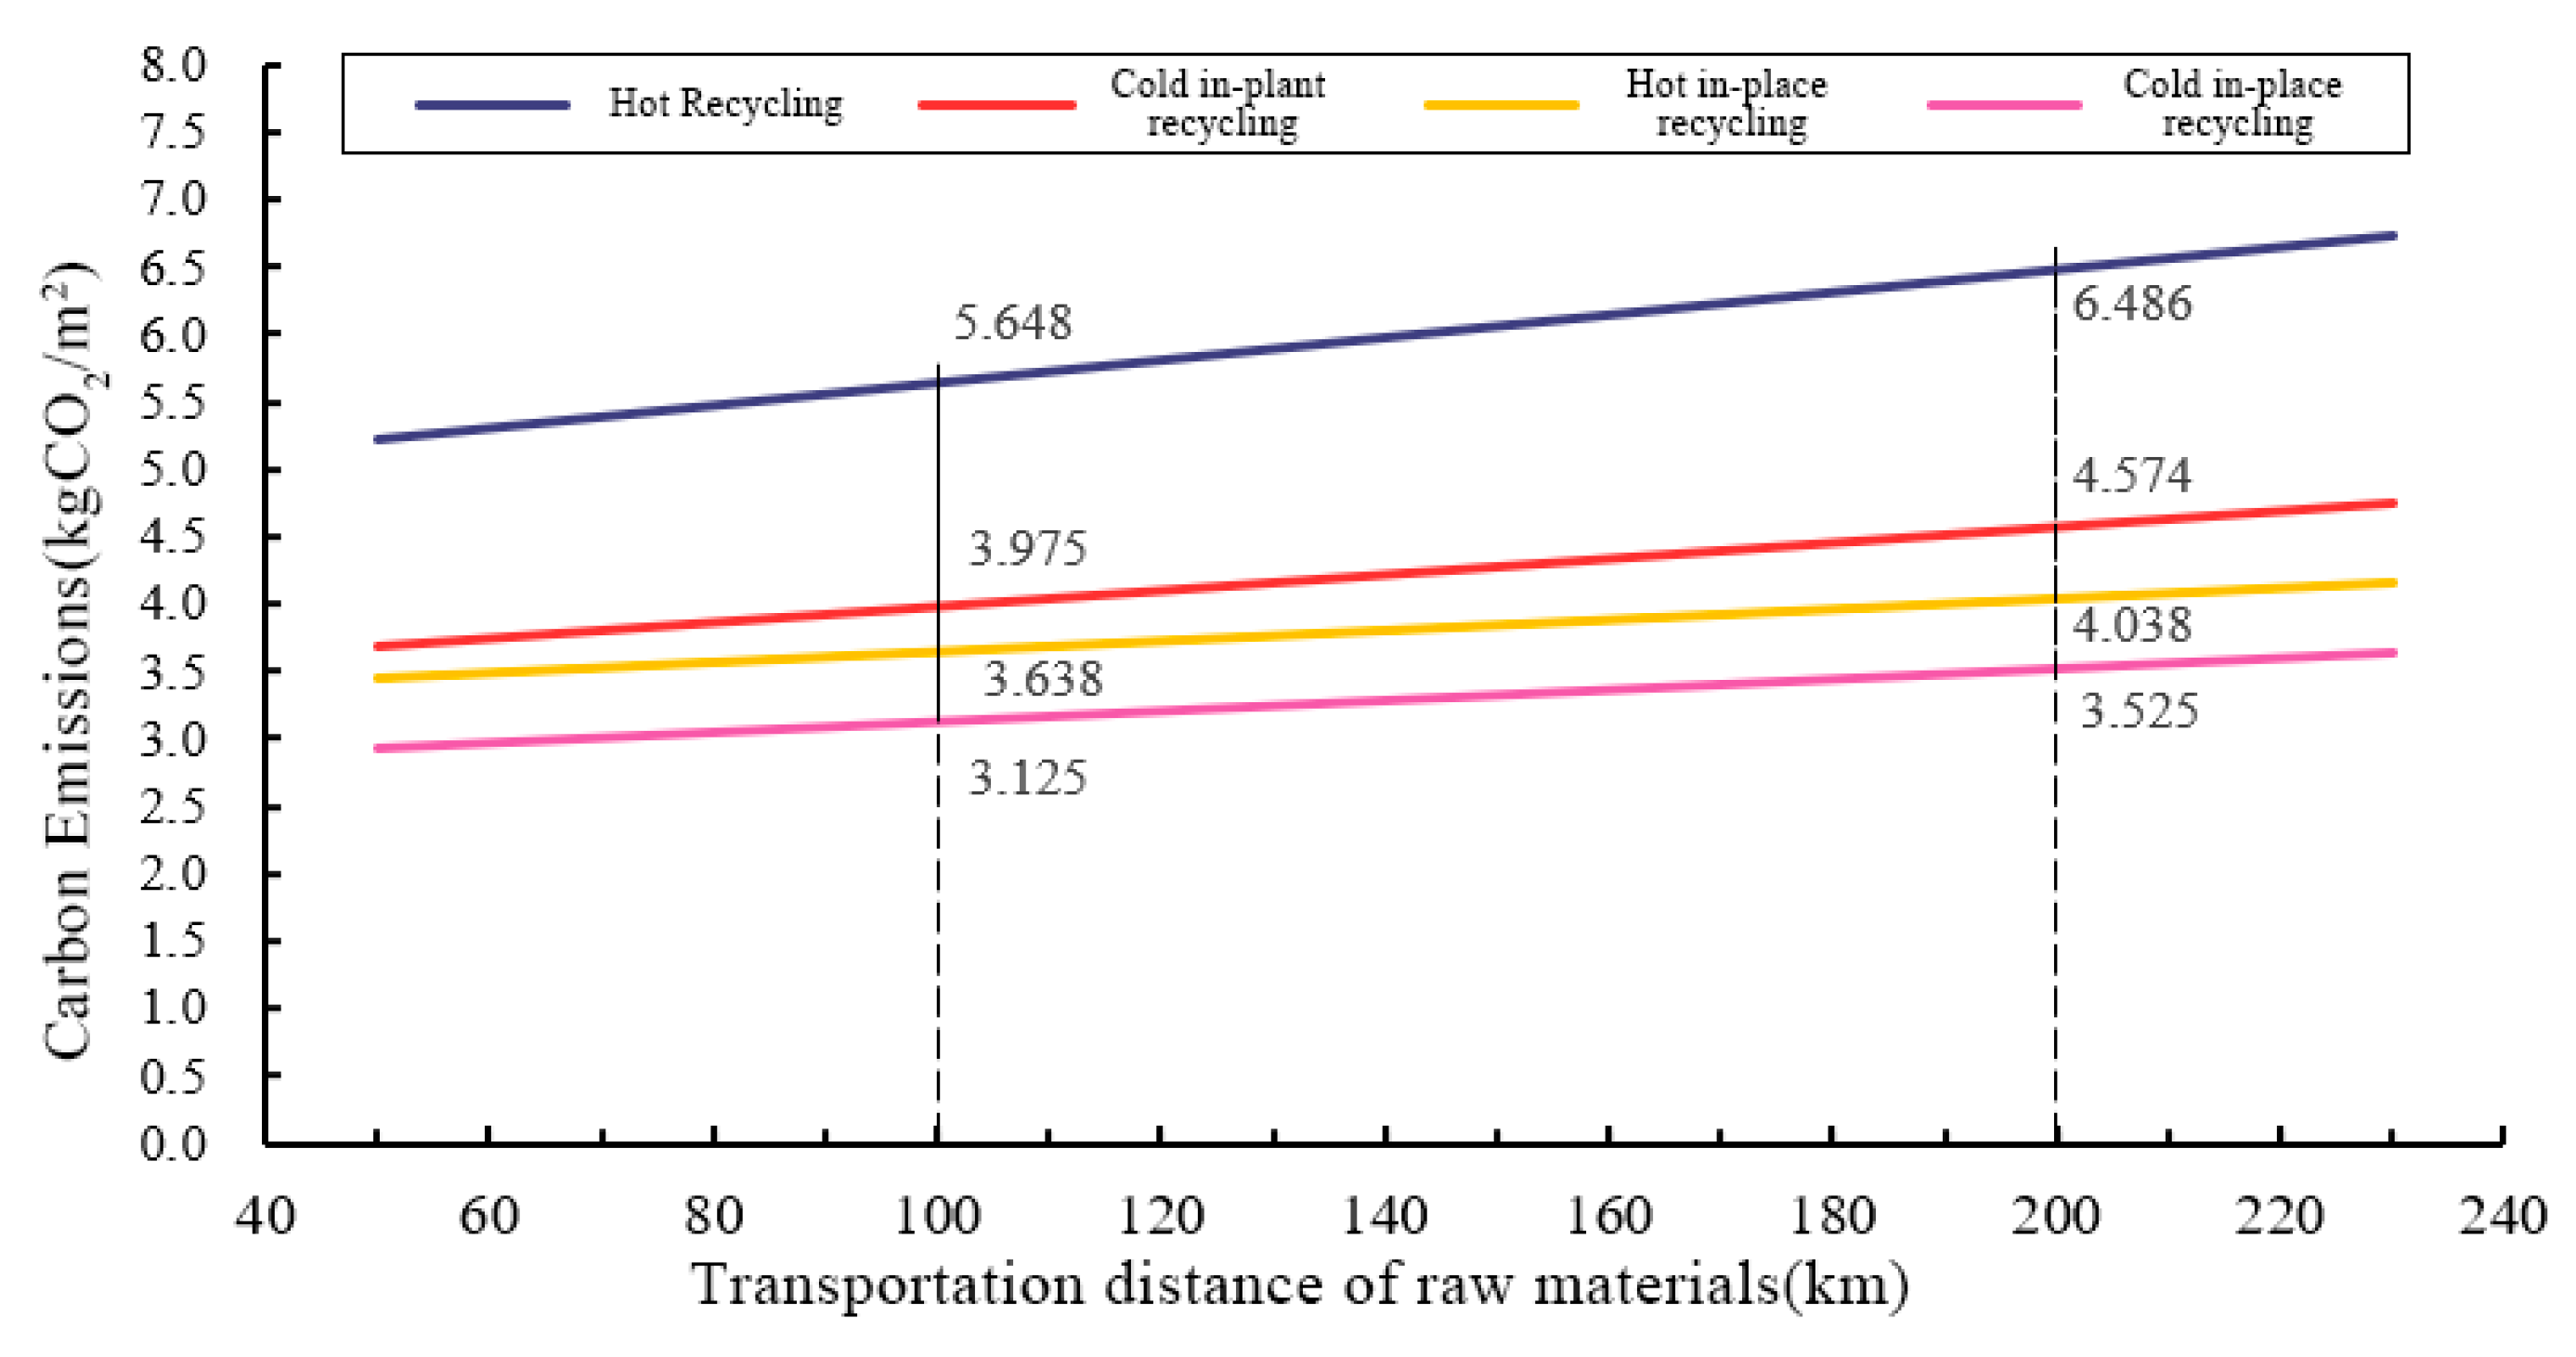
3.3.3. Environmental Load Impact of Transportation Distance of Raw Materials

The influence of raw material transportation distance on the energy consumption and carbon emission of the regeneration process is reflected in the transportation stage of each process, and the energy consumption and carbon emission of each regeneration process are calculated by increasing the transportation distance of raw material, and the results are shown in Figure 7 and Figure 8.
The results show that for every 10 km increase in transportation distance for raw materials, the increases in overall energy consumption and carbon emissions for each process are as follows: for hot-mix plant recycling, energy consumption increases by 1.155 MJ/m2 and carbon emissions increase by 0.084 kgCO2/m2. For cold-mix plant recycling, energy consumption increases by 0.826 MJ/m2 and carbon emissions increase by 0.084 kgCO2/m2. For in situ hot recycling, energy consumption increases by 0.552 MJ/m2 and carbon emissions increase by 0.040 kgCO2/m2. Moreover, for in situ cold recycling, energy consumption increases by 0.552 MJ/m2 and carbon emissions increase by 0.040 kgCO2/m2. When the transportation distance for raw materials is 100 km, the overall energy consumption decreases by 12.29%, 15.32%, 9.38%, and 14.21% for hot-mix plant recycling, cold-mix plant recycling, in situ hot recycling, and in situ cold recycling, respectively, compared to when the transportation distance is 200 km. The overall carbon emissions also decreased by 12.91%, 13.09%, 9.90%, and 11.34%, respectively. Therefore, transporting raw materials over shorter distances can effectively reduce energy consumption and carbon emissions, and mitigate the negative environmental impacts throughout the entire process of road surface recycling.

4. Conclusions

Based on the theory of process-based life cycle evaluation, the quantitative research and calculation methods for energy consumption and carbon emissions of typical asphalt pavement regeneration methods were explored. According to the characteristics of each process, the construction process was subdivided, the comprehensive energy consumption and carbon emissions of typical asphalt pavement regeneration processes were calculated, and the environmental impact was compared and analyzed. The main conclusions of the paper were as follows.
(1)
Based on the process-based LCA evaluation method, the various stages of the road surface regeneration process (i.e., raw material production, construction stage, transportation stage) are studied, and the calculation formula for an environmental load of asphalt road surface regeneration is derived.
H t o t = H R a w   M a t e r i a l s + H C o n s t r u c t i o n + H T r a n s p o r t a t i o n = m i R a w   M a t e r i a l s γ i R a w   M a t e r i a l s + T M i O i C o n s t r u c t i o n β T + ( 1 + α ) m i T r a n s p o r t a t i o n l i T r a n s p o r t a t i o n O i T r a n s p o r t a t i o n β T
(2)
The comprehensive energy consumption comparison of various regeneration methods for asphalt pavement throughout the entire process, from large to small, is as follows: plant mixed hot regeneration>on-site geothermal regeneration > plant mixed cold regeneration > on-site cold regeneration; the comprehensive carbon emissions, from large to small, are as follows: plant mixed hot regeneration > plant mixed cold regeneration > on-site geothermal regeneration > on-site cold regeneration.
(3)
Analyzing the key links of energy consumption and emissions in each stage of the entire process of asphalt pavement regeneration technology and controlling the energy consumption and emissions in each key link will effectively improve the energy-saving and emission-reduction benefits of the regeneration process.
(4)
In the stage of raw material production, the key link between energy consumption and emissions is the production of asphalt and cement; during the construction phase, the heating process of asphalt mixture in the hot regeneration process and the working process of the regeneration equipment in the cold regeneration process are the key links in terms of energy consumption and emissions; during the transportation phase, the key link between energy consumption and emissions is stone transportation.
(5)
Controlling energy consumption and carbon emissions during the construction phase plays the most effective role in the hot regeneration process while controlling energy consumption and carbon emissions during the raw material production phase has the greatest effect on the cold regeneration process.

Author Contributions

Conceptualization, J.M. and H.Y.; methodology, H.Y. and Y.Z.; writing—original draft preparation, Q.C. and J.M.; writing—review and editing, H.Y. All authors have read and agreed to the published version of the manuscript.

Funding

This research was funded by Guangdong Basic and Applied Basic Research Foundation (grant number 2022A1515011607, 2022A1515011537 and 20231515030287) and supported by the Special Project of Foshan Science and Technology Innovation Team [Grant No. 2120001010776]. The finical support from the Fundamental Research Funds for the Central Universities (2023ZYGXZR001, 2022ZYGXZR056) are also sincerely acknowledged.

Institutional Review Board Statement

Not applicable.

Informed Consent Statement

Not applicable.

Data Availability Statement

The data presented in this study are available on request from the corresponding author.

Conflicts of Interest

The authors declare that they have no known competing financial interests or personal relationships that could have appeared to influence the work reported in this paper.

References

  1. Häkkinen, T.; Mäkelä, K. Environmental Adaptation of Concrete; Environmental Impact of Concrete and Asphalt Pavements; VTT Research Notes 1752. VTT OFFSETPAINO, ESPOO 1996; Technical Research Centre of Finland: Espoo, Finland, 1996; Available online: https://publications.vtt.fi/pdf/tiedotteet/1996/T1752.pdf (accessed on 1 May 2023).
  2. Sharma, A.; Lee, B.-K. Energy savings and reduction of CO2 emission using Ca(OH)(2) incorporated zeolite as an additive for warm and hot mix asphalt production. Energy 2017, 136, 142–150. [Google Scholar] [CrossRef]
  3. Guo, Z.; Hu, D.; Zhang, Z.; Zhang, P.; Zhang, X. Material metabolism and lifecycle GHG emissions of urban road system (URS). J. Clean. Prod. 2017, 165, 243–253. [Google Scholar] [CrossRef]
  4. Hendrickson, C.; Horvath, A.; Joshi, S.; Lave, L. Peer reviewed: Economic input–output models for environmental life-cycle assessment. Environ. Sci. Technol. 1998, 32, 184A–191A. [Google Scholar] [CrossRef]
  5. Wang, T.; Xiao, F.; Zhu, X.; Huang, B.; Wang, J.; Amirkhanian, S. Energy consumption and environmental impact of rubberized asphalt pavement. J. Clean. Prod. 2018, 180, 139–158. [Google Scholar] [CrossRef]
  6. Karlsson, R.; Carlson, A.; Dolk, E. Energy Use Generated by Traffic and Pavement Maintenance: Decision Support for Optimization of Low Rolling Resistance Maintenance Treatments; Statens väg-och transportforskningsinstitut: Linköping, Sweden, 2012; Available online: https://vti.diva-portal.org/smash/get/diva2:669289/FULLTEXT01.pdf (accessed on 1 May 2023).
  7. Treloar, G.J.; Love, P.E.D.; Crawford, R.H. Hybrid life-cycle inventory for road construction and use. J. Constr. Eng. Manag. 2004, 130, 43–49. [Google Scholar] [CrossRef]
  8. Huang, Y.; Qiao, Z.; Zhang, Y.; Zhang, H. Life-cycle assessment of carbon dioxide emissions of asphalt pavements in China. Proc. Inst. Civ. Eng.-Eng. Sustain. 2020, 173, 228–240. [Google Scholar] [CrossRef]
  9. Park, K.; Hwang, Y.; Seo, S.; Seo, H. Quantitative assessment of environmental impacts on life cycle of highways. J. Constr. Eng. Manag. 2003, 129, 25–31. [Google Scholar] [CrossRef]
  10. Chen, C.-Y.; Liu, Z.-Q.; Hu, C.; Li, H.-F.; Yu, H.; Xia, J.-P.; Guo, Y.; Zhang, F.-L. Study on evaluation method of energy efficiency and carbon emission intensity of highway maintenance. In Functional Pavements; CRC Press: Boca Raton, FL, USA, 2020; pp. 253–257. [Google Scholar] [CrossRef]
  11. Muench, S.T.; Caraballo, E.M.; Lin, Y.Y. Determining Changes in Greenhouse Gas Emissions (1990–2010) due to Pavement Technology; Washington State Department of Transportationa: Olympia, WA, USA, 2015. Available online: https://www.wsdot.wa.gov/research/reports/fullreports/838.1.pdf (accessed on 1 May 2023).
  12. Xiao, F.; Yao, S.; Wang, J.; Li, X.; Amirkhanian, S. A literature review on cold recycling technology of asphalt pavement. Constr. Build. Mater. 2018, 180, 579–604. [Google Scholar] [CrossRef]
  13. Chen, J.; Zhao, F.; Liu, Z.; Ou, X.; Hao, H. Greenhouse gas emissions from road construction in China: A province-level analysis. J. Clean. Prod. 2017, 168, 1039–1047. [Google Scholar] [CrossRef]
  14. Huang, Y.; Qiao, Z.; Zhang, H. Evaluation of an economy-technology-green development system for asphalt pavement construction in China based on synergetics. J. Clean. Prod. 2021, 289, 125132. [Google Scholar] [CrossRef]
  15. Keijzer, E.; Leegwater, G.; de Vos-Effting, S.; De Wit, M. Carbon footprint comparison of innovative techniques in the construction and maintenance of road infrastructure in The Netherlands. Environ. Sci. Policy 2015, 54, 218–225. [Google Scholar] [CrossRef]
  16. Chen, X.; Wang, H. Life cycle assessment of asphalt pavement recycling for greenhouse gas emission with temporal aspect. J. Clean. Prod. 2018, 187, 148–157. [Google Scholar] [CrossRef]
  17. Liu, X.; Cui, Q.; Schwartz, C. Greenhouse gas emissions of alternative pavement designs: Framework development and illustrative application. J. Environ. Manag. 2014, 132, 313–322. [Google Scholar] [CrossRef]
  18. Zhou, W.; Yi, J.; Pei, Z.; Xie, S.; Feng, D. Preliminary design of recyclable epoxy asphalt: Regeneration feasibility analysis and environmental impact assessment. J. Appl. Polym. Sci. 2022, 139, 52349. [Google Scholar] [CrossRef]
  19. Cass, D.; Mukherjee, A. Calculation of greenhouse gas emissions for highway construction operations by using a hybrid life-cycle assessment approach: Case study for pavement operations. J. Constr. Eng. Manag. 2011, 137, 1015–1025. [Google Scholar] [CrossRef]
  20. Ma, F.; Dong, W.; Fu, Z.; Wang, R.; Huang, Y.; Liu, J. Life cycle assessment of greenhouse gas emissions from asphalt pavement maintenance: A case study in China. J. Clean. Prod. 2021, 288, 125595. [Google Scholar] [CrossRef]
  21. Wang, H.; Al-Saadi, I.; Lu, P.; Jasim, A. Quantifying greenhouse gas emission of asphalt pavement preservation at construction and use stages using life-cycle assessment. Int. J. Sustain. Transp. 2020, 14, 25–34. [Google Scholar] [CrossRef]
  22. Heidari, M.R.; Heravi, G.; Esmaeeli, A.N. Integrating life-cycle assessment and life-cycle cost analysis to select sustainable pavement: A probabilistic model using managerial flexibilities. J. Clean. Prod. 2020, 254, 120046. [Google Scholar] [CrossRef]
  23. Zhou, X.; Zhang, X.; Zhang, Y.; Adhikari, S. Life cycle assessment of asphalt and cement pavements: Comparative cases in Shanxi Province. Constr. Build. Mater. 2022, 315, 125738. [Google Scholar] [CrossRef]
  24. Xing, C.; Li, M.; Liu, L.; Lu, R.; Liu, N.; Wu, W.; Yuan, D. A comprehensive review on the blending condition between virgin and RAP asphalt binders in hot recycled asphalt mixtures: Mechanisms, evaluation methods, and influencing factors. J. Clean. Prod. 2023, 398, 136515. [Google Scholar] [CrossRef]
  25. Xu, X.; Meteyer, S.; Perry, N.; Zhao, Y.F. Energy consumption model of Binder-jetting additive manufacturing processes. Int. J. Prod. Res. 2015, 53, 7005–7015. [Google Scholar] [CrossRef]
Figure 1. Typical regeneration method of asphalt pavement raw material production stage converted energy consumption values.
Buildings 13 01569 g001
Figure 2. Carbon emission values of the production stage of raw materials for the typical regeneration method of asphalt pavement.
Buildings 13 01569 g002
Figure 3. Comprehensive energy consumption value of asphalt pavement regeneration (MJ/m2).
Buildings 13 01569 g003
Figure 4. Integrated carbon emissions from asphalt pavement regeneration (kgCO2/m2).
Buildings 13 01569 g004
Figure 5. Effect of RAP blending ratio on energy consumption of asphalt pavement recycling.
Buildings 13 01569 g005
Figure 6. Effect of RAP blending ratio on carbon emission of asphalt pavement recycling.
Buildings 13 01569 g006
Figure 7. Effect of transportation distance of raw materials on energy consumption of asphalt pavement recycling.
Buildings 13 01569 g007
Figure 8. Impact of transportation distance of raw materials on carbon emission of asphalt pavement recycling.
Buildings 13 01569 g008
Table 1. Calculation formula for engineering quantity.
CategoryFormula
Recycled pavement area (m2)S = l d
Recycled mix quality (t) m = ρ l h d
Original pavement solid mass (t) m 0 = ρ 0 l 0 h 0 d 0
RAP usage (t) m R A P = c R A P ρ l h d   (When greater than m 0 , take m R A P = m 0 )
Asphalt quality in RAP (t) m R A P A s p h a l t = c R A P ρ l h d · a 0 / ( 1 + a 0 )
Aggregate quality in RAP (t) m R A P A g g r e g a t e = c R A P ρ l h d / ( 1 + a 0 )
Quality of recycled pavement asphalt (t) m R e c y c l e d   P a v e m e n t   A s p h a l t = ρ l h d · a / ( 1 + a )
Quality of recycled pavement aggregates (t) m R e c y c l e d   P a v e m e n t   A g g r e g a t e = ρ l h d / ( 1 + a )
New asphalt dosage (t) m A s p h a l t = m R e c y c l e d   P a v e m e n t   A s p h a l t m R A P a s p h a l t
Amount of cement (t) m C e m e n t = m R e c y c l e d   P a v e m e n t   A g g r e g a t e · b C e m e n t / ( 1 + b C e m e n t )
Amount of new aggregate (t) m N e w   S t o n e = m R e c y c l e d   P a v e m e n t   A g g r e g a t e m R A P A g g r e g a t e m C e m e n t
Amount of regenerating agent (t) m R e g e n e r a t i n g   a g e n t = b R e g e n e r a t i n g   a g e n t m R A P A s p h a l t
Table 2. Explanation of quantity calculation formula symbols.
CategorySymbolsCategorySymbols
Original PavementLength (m) l 0 Original pavement asphalt content (%) a 0
Width (m) d 0 Recycled pavement asphalt-aggregate ratio (%) a
Thickness (m) h 0 Recycler dosage (in proportion to old asphalt) (%) b
Recycled PavementLength (m) l Cement content (in proportion to recycled aggregate) (%) b c o m e n t
Width (m) d RAP blending ratio (%) c R A P
Thickness (m) h Compaction density of recycled pavement (t/m3) ρ
Table 3. Asphalt Pavement Recycling Project.
Process TypePlant Mixed RecycledIn-Situ Regeneration
Project Information Heat
Regeneration
Cold
Regeneration
Heat
Regeneration
Cold
Regeneration
Original PavementLength (m)1000100010001000
Width (m)3.753.753.753.75
Thickness (m)0.040.040.040.04
Recycled PavementLength (m)1000100010001000
Width (m)3.753.753.753.75
Thickness (m)0.060.060.060.06
RAP blending ratio (%)3050(66.7)(66.7)
Old pavement asphalt-aggregate ratio (%)4444
Recycled pavement asphalt-aggregate ratio (%)4444
Amount of cement (%)0101
Amount of regenerating agent (%)5555
Transportation distance of raw materials (km)100100100100
Mixing building distance (km)1515----
Table 4. Number of Asphalt Pavement Regeneration Projects.
Process TypePlant Mixed RecycledIn-Situ Regeneration
Heat
Regeneration
Cold
Regeneration
Heat
Regeneration
Cold
Regeneration
Recycled pavement area (m2)3750375037503750
Volume of recycled mix (m3)225225225225
Milling material quality (t)382.95382.950.000.00
Recycled mix quality (t)574.43574.43574.43574.43
New asphalt dosage (t)15.4711.057.367.36
Amount of new aggregate (t)386.63270.70184.11178.64
Amount of regenerating agent (t)0.330.550.740.74
Amount of cement (t)0.005.470.005.47
Table 5. Inventory of Energy Consumption and Carbon Emission of Raw Material Production.
Energy Consumption Equivalent (MJ/t)CO2 Equivalent (kg/t)
Binder4900285
Aggregate532.5
Regenerating agent4900285
Cement3227.4870.3
Table 6. The use time of each piece of equipment during the construction phase (h).
ItemEquipment NameModel
Specification
Plant Mixed RecycledIn-Situ Regeneration
Heat
Regeneration
Cold
Regeneration
Heat
Regeneration
Cold
Regeneration
Milling and planningRoad milling machineLX2008.988.98----
8 t dump truckQD3519.589.58----
Sprinkler carYGJ5102GSSEQ2.392.39----
Plant MixingPlant mixing and hot regeneration equipmentXRP1633.59------
Plant Mix Cold Recycling EquipmentXCL300P--1.91----
Tire loaderZL4011.6611.66----
5 t dump truckCA3404.704.70----
Liquid asphalt transport truckCZL9350--9.97----
In-situ mixingIn-situ thermal regeneration heaterKAPH 8S----4.76--
In-situ thermal regeneration mainframeKRM2000RS----4.76--
In-situ cold regeneratorW380CRi------5.56
8 t dump truckQD351----4.76--
Tire loaderZL50----9.259.25
Liquid asphalt transport truckCZL9350------9.85
Sprinkler carYGJ5102GSSEQ------2.41
Paving and rollingAsphalt mix paversS20003.553.553.553.55
Vibratory rollersYZC-159.689.689.689.68
Tire type road rollerYL20 (16~20 t)4.82--4.82--
Tire type road rollerYL27 (20~25 t)6.4414.026.4414.02
Table 7. Energy consumption rate parameters for equipment in the construction phase.
ItemEquipment NameModel
Specification
Equipment Energy Consumption Rate Parameters
Gasoline (kg/h)Diesel (kg/h)Heavy Oil (kg/h)Electricity ((kW·h)/h)
Milling and planningRoad milling machineLX200--23.81----
8 t dump truckQD351--6.18----
Sprinkler carYGJ5102GSSEQ4.29------
Plant MixingPlant mixing and hot regeneration equipmentXRP163----880284
Plant Mix Cold Recycling EquipmentXCL300P------240
Tire loaderZL40--11.61----
5 t dump truckCA3405.24------
Liquid asphalt transport truckCZL9350--11.37----
In-situ mixingIn-situ thermal regeneration heaterKAPH 8S----504.00--
In-situ thermal regeneration mainframeKRM2000RS--63.00----
In-situ cold regeneratorW380CRi--67.20----
8 t dump truckQD351--6.18----
Tire loaderZL50--14.39----
Liquid asphalt transport truckCZL9350--11.37----
Sprinkler carYGJ5102GSSEQ4.29------
Paving and rollingAsphalt mix paversS2000--17.03----
Vibratory rollersYZC-15--10.10----
Tire type road rollerYL20 (16~20 t)--5.3----
Tire type road rollerYL27 (20~25 t)--6.3----
Table 8. Calculation of energy consumption of each piece of equipment in the construction stage of asphalt pavement regeneration (Unit: MJ/m2).
ItemEquipment NamePlant Mixed RecycledIn-Situ Regeneration
Heat
Regeneration
Cold
Regeneration
Heat
Regeneration
Cold
Regeneration
Milling and planningRoad milling machine2.435 2.435 ----
8 t dump truck0.674 0.674 ----
Sprinkler car0.118 0.118 ----
Plant MixingPlant mixing and hot regeneration equipment33.006 ------
Plant Mix Cold Recycling Equipment--0.441 ----
Tire loader1.542 1.542 ----
5 t dump truck0.283 0.283 ----
Liquid asphalt transport truck--1.291 ----
In-situ mixingIn-situ thermal regeneration heater----26.762 --
In-situ thermal regeneration mainframe----3.416 --
In-situ cold regenerator------4.252
8 t dump truck----0.335 --
Tire loader----1.516 1.516
Liquid asphalt transport truck------1.275
Sprinkler car------0.119
Paving and rollingAsphalt mix pavers0.688 0.688 0.688 0.688
Vibratory rollers1.114 1.114 1.114 1.114
Tire type road roller0.291 --0.291 --
Tire type road roller0.462 1.006 0.462 1.006
Total40.613 9.592 34.584 9.968
Table 9. Commuted energy values for the construction phase of asphalt pavement regeneration.
Process TypePlant Mixed RecycledIn-Situ Regeneration
Construction Process Heat
Regeneration
Cold
Regeneration
Heat
Regeneration
Cold
Regeneration
Milling and planningMJ/m23.2273.227----
Plant MixingMJ/m234.8313.557----
In-situ mixingMJ/m2----32.0297.161
Paving and rollingMJ/m22.5552.8072.5552.807
TotalMJ/m240.6139.59234.5849.968
Table 10. Carbon emission results for each piece of equipment in the construction phase of asphalt pavement regeneration (Unit: kgCO2/m2).
ItemEquipment NamePlant Mixed RecycledIn-Situ Regeneration
Heat
Regeneration
Cold
Regeneration
Heat
Regeneration
Cold
Regeneration
Milling and planningRoad milling machine0.177 0.177 ----
8 t dump truck0.049 0.049 ----
Sprinkler car0.007 0.007 ----
Plant MixingPlant mixing and hot regeneration equipment2.507 ------
Plant Mix Cold Recycling Equipment--0.087 ----
Tire loader0.112 0.112 ----
5 t dump truck0.017 0.017 ----
Liquid asphalt transport truck--0.094 ----
In-situ mixingIn-situ thermal regeneration heater----1.933 --
In-situ thermal regeneration mainframe----0.248 --
In-situ cold regenerator------0.308
8 t dump truck----0.024 ----
Tire loader----0.110 0.110
Liquid asphalt transport truck------0.092
Sprinkler car------0.007
Paving and rollingAsphalt mix pavers0.050 0.050 0.050 0.050
Vibratory rollers0.081 0.081 0.081 0.081
Tire type road roller0.021 --0.021
Tire type road roller0.034 0.073 0.034 0.073
Total3.054 0.746 2.500 0.721
Table 11. Carbon emission values for the construction phase of asphalt pavement regeneration.
Process Type Plant Mixed RecycledIn-Situ Regeneration
Construction Process Heat
Regeneration
Cold
Regeneration
Heat
Regeneration
Cold
Regeneration
Milling and planningkgCO2/m20.233 0.233 ----
Plant MixingkgCO2/m22.636 0.310 ----
In-situ mixingkgCO2/m2----2.315 0.518
Paving and rollingkgCO2/m20.185 0.204 0.185 0.204
TotalkgCO2/m23.054 0.746 2.500 0.721
Table 12. Distance and volume of transportation of recycled asphalt pavement materials.
Type of TransportationTransport Distance (km)Freight Volume (t)
Heat
Regeneration
Cold
Regeneration
Heat
Regeneration
Cold
Regeneration
Binder10015.47 11.05 7.36 7.36
Aggregate100386.63 270.70 184.11 178.64
Regenerating agent1000.33 0.55 0.74 0.74
Cement100--5.47 --5.47
Milling and planning material15382.95 382.95 ----
Recycled mixes15574.43 574.43 ----
Table 13. Commuted energy consumption value of asphalt pavement regeneration transportation stage (MJ/m2).
Type of TransportPlant Mixed RecycledIn-Situ Regeneration
Heat RegenerationCold RegenerationHeat RegenerationCold Regeneration
Binder0.4440.3170.2110.211
Aggregate11.0957.7685.2845.127
Regenerating agent0.0100.0160.0210.021
Cement0.0000.1570.0000.157
Milling and planning material1.6481.6480.0000.000
Recycled mixes2.4732.4730.0000.000
Total15.67012.3795.5165.516
Table 14. Carbon emission values for the transportation phase of asphalt pavement reclamation (kgCO2/m2).
Type of TransportPlant Mixed RecycledIn-Situ Regeneration
Heat RegenerationCold RegenerationHeat RegenerationCold Regeneration
Binder0.0320.0230.0150.015
Aggregate0.8040.5630.3830.372
Regenerating agent0.0010.0010.0020.002
Cement0.0000.0110.0000.011
Milling and planning material0.1200.1200.0000.000
Recycled mixes0.1790.1790.0000.000
Total1.1360.8970.4000.400
Table 15. Comprehensive energy consumption and comprehensive carbon emission of asphalt pavement milling and resurfacing.
Energy Consumption (MJ/m2)Carbon Emissions (kgCO2/m2)
Raw material production36.6752.047
Road construction40.6133.054
Material transportation20.6061.494
Total97.8946.595
Disclaimer/Publisher’s Note: The statements, opinions and data contained in all publications are solely those of the individual author(s) and contributor(s) and not of MDPI and/or the editor(s). MDPI and/or the editor(s) disclaim responsibility for any injury to people or property resulting from any ideas, methods, instructions or products referred to in the content.

