Article

Automated Classification of the Phases Relevant to Work-Related Musculoskeletal Injury Risks in Residential Roof Shingle Installation Operations Using Machine Learning

1
Wadsworth Department of Civil and Environmental Engineering, West Virginia University, P.O. Box 6103, Morgantown, WV 26506, USA
2
National Institute for Occupational Safety and Health, 1095 Willowdale Road, Morgantown, WV 26505, USA
*
Author to whom correspondence should be addressed.
Buildings 2023, 13(6), 1552; https://doi.org/10.3390/buildings13061552
Submission received: 8 May 2023 / Revised: 27 May 2023 / Accepted: 15 June 2023 / Published: 18 June 2023

Abstract

:
Awkward kneeling in sloped shingle installation operations exposes roofers to knee musculoskeletal disorder (MSD) risks. To address the varying levels of risk associated with different phases of shingle installation, this research investigated utilizing machine learning to automatically classify seven distinct phases in a typical shingle installation task. The classification process relied on analyzing knee kinematics data and roof slope information. Nine participants were recruited and performed simulated shingle installation tasks while kneeling on a sloped wooden platform. The knee kinematics data were collected using an optical motion capture system. Three supervised machine learning classification methods (i.e., k-nearest neighbors (KNNs), decision tree (DT), and random forest (RF)) were selected for evaluation. The KNN classifier provided the best performance for overall accuracy. The results substantiated the feasibility of applying machine learning in classifying shingle installation phases from workers’ knee joint rotation and roof slope angles, which may help facilitate method and tool development for automated knee MSD risk surveillance and assessment among roofers.

1. Introduction

About 33% of cases of days away from work and physical disabilities in the construction industry are due to work-related musculoskeletal disorders (WMSDs) [1]. WMSDs cause immense losses to injured workers, their employers, and also to society, as workers’ compensation is partially shared by society [2]. Postures that are awkward, prolonged, or repetitive are generally considered a major contributor to increases in MSD risks [3]. Residential roofers typically perform repetitive tasks on sloped surfaces ranging from 10° to 26° (sometimes as steep as 45°) for a long time. As a result, this population has the second-highest incidence rate of WMSDs among all construction trades [4].
Roofers often experience a considerable amount of knee joint rotation because of prolonged and repetitive awkward kneeling during shingle installation on sloped rooftops. Awkward knee joint rotation includes knee flexion, abduction–adduction, and internal–external rotation. Deep flexed kneeling postures generate significant net quadriceps moments at the knee and increase the stress on the patellar tendon [5]. Increased knee adduction and abduction create additional stress and force on the inner part of the knee, specifically the medial compartment, leading to an elevated risk of osteoarthritis development [6]. Similarly, when the tibia rotates internally or externally in relation to the femur it exerts stress on the ligaments of the knee joint, particularly the posterior cruciate ligament (PCL) and medial collateral ligament (MCL) [7]. At sloped rooftops, residential roofers’ knees encounter higher abduction and internal rotation during shingle installation [8]. Previous research conducted by the authors revealed that roofers face an elevated risk of knee musculoskeletal disorders (MSDs) during various phases of shingle installation on sloped surfaces [
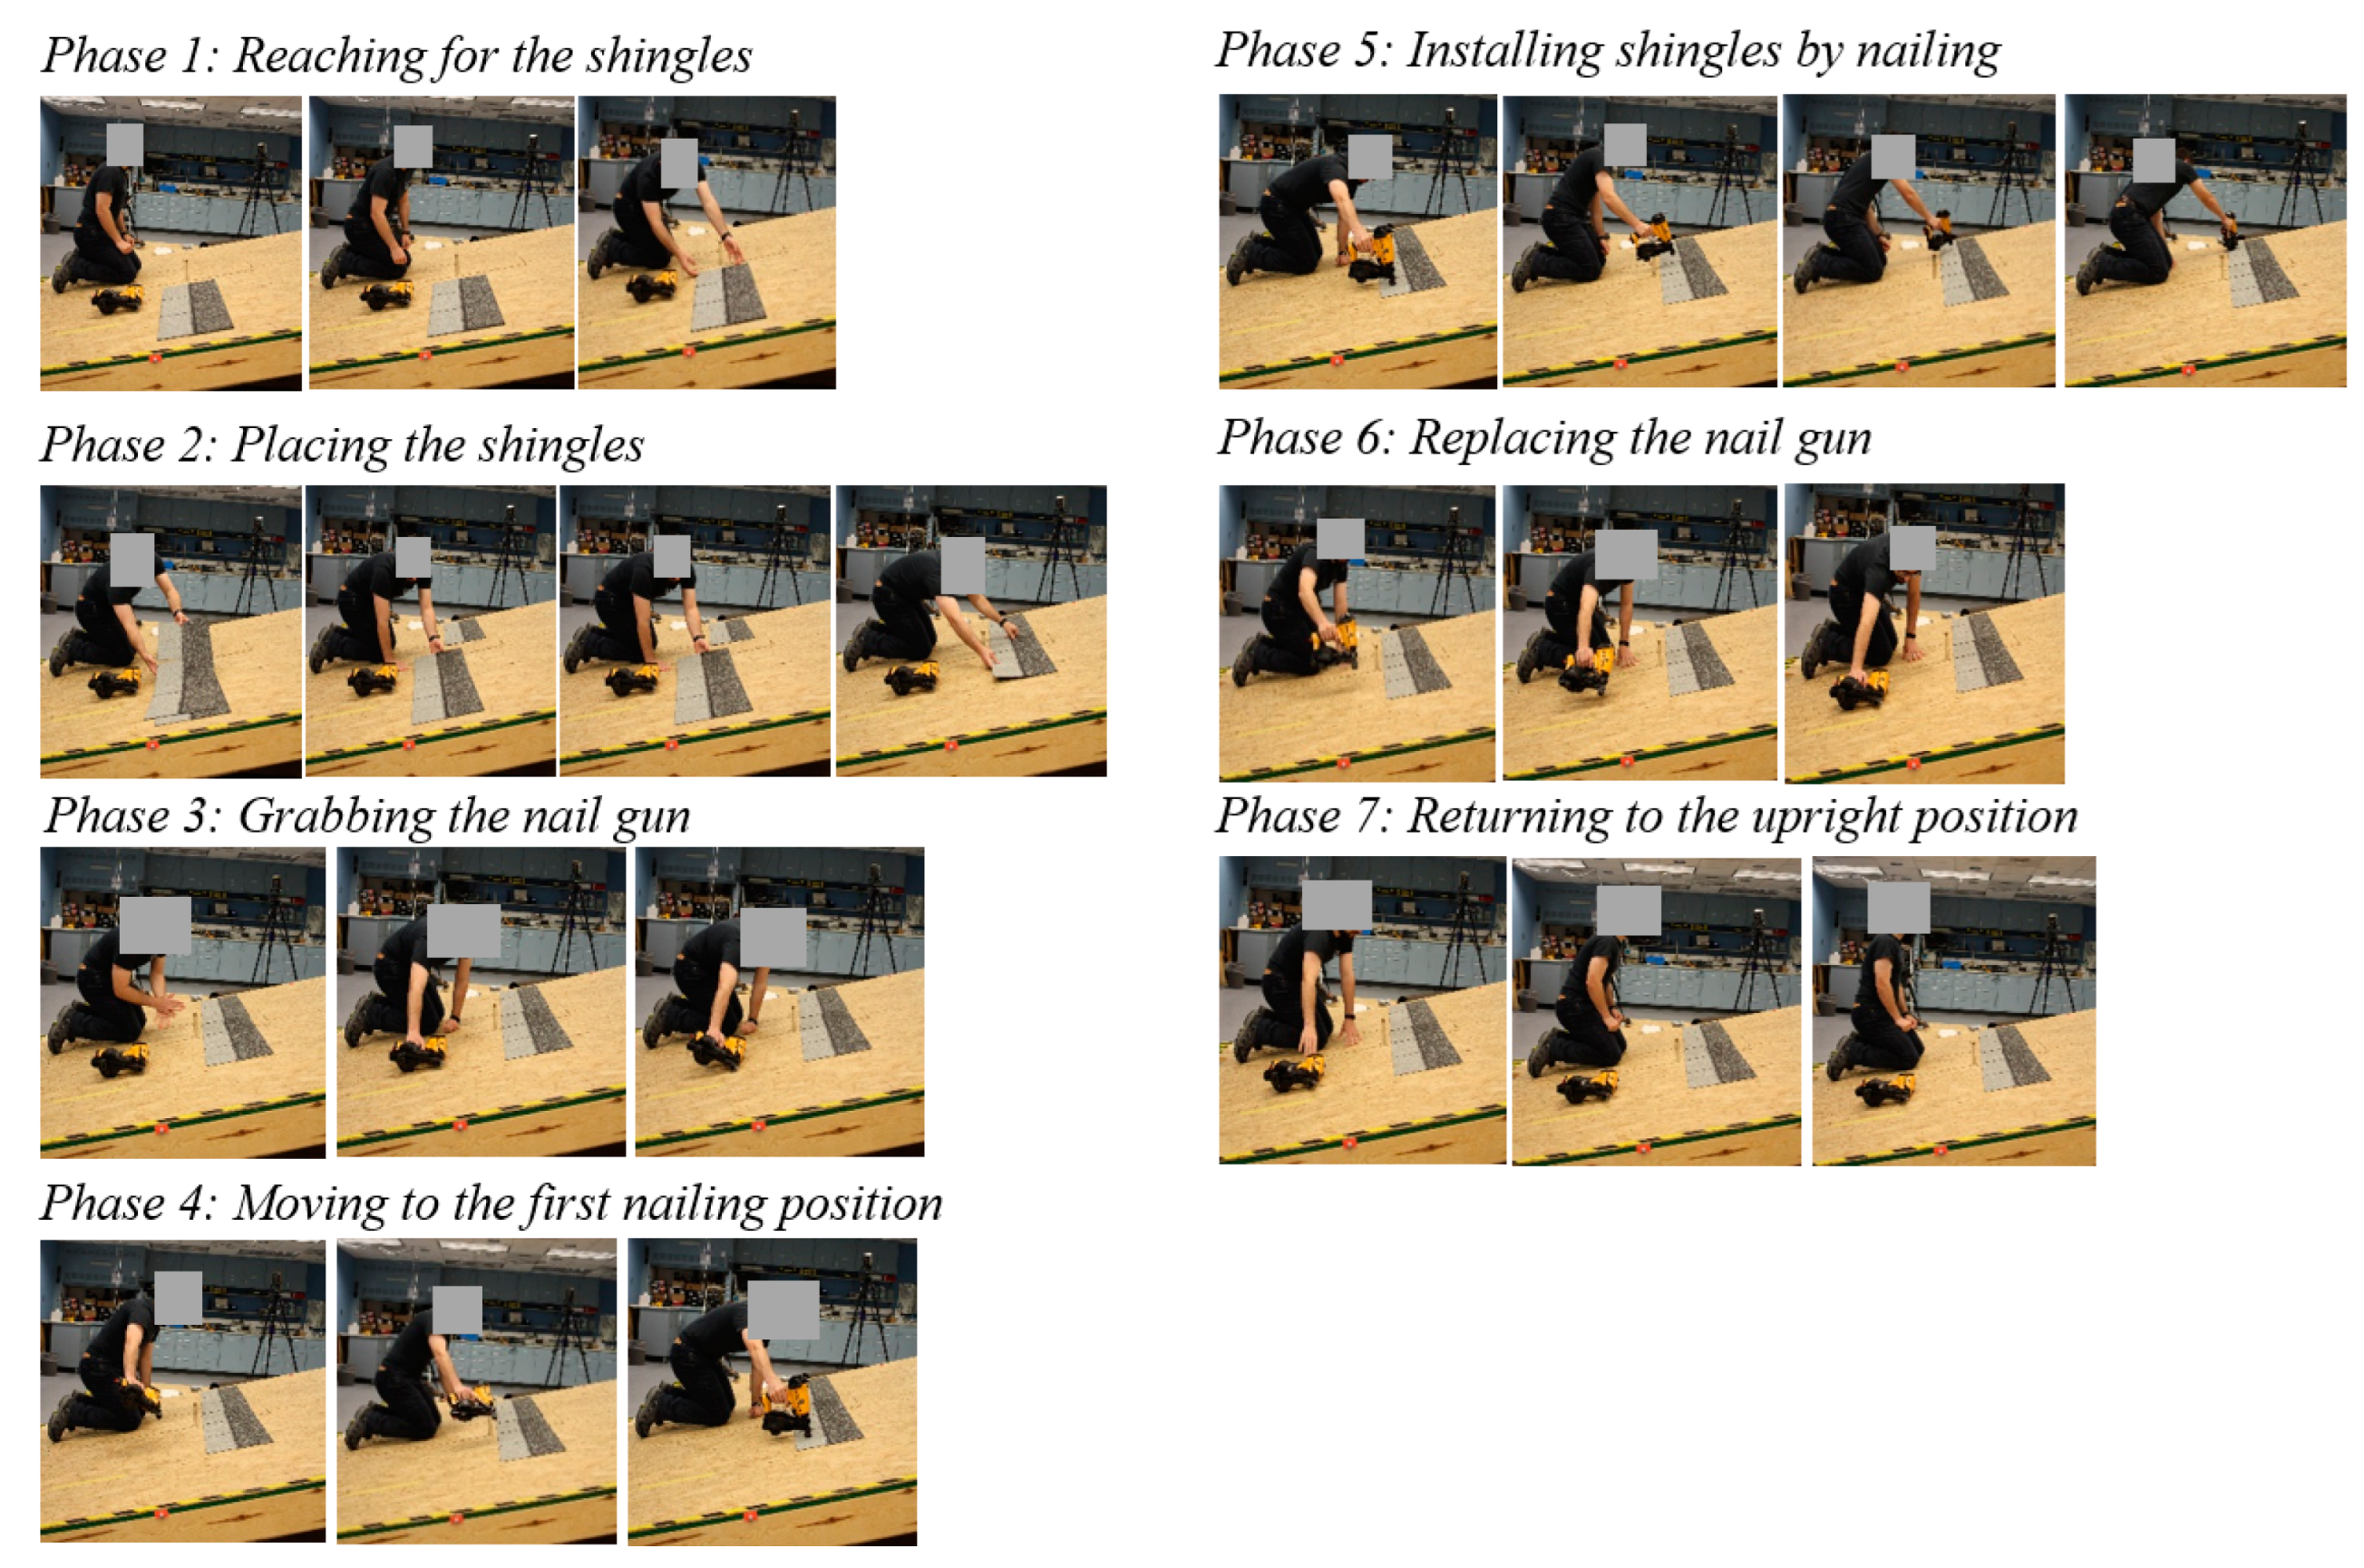
9]. The research findings indicated that certain phases carry a higher risk of awkward knee joint rotation compared to others. Specifically, the placement and nailing of shingles were identified as the two phases with the greatest amount of awkward knee joint rotation. Consequently, these phases are considered the most risky in shingle installation and have the potential to contribute to the development of knee MSDs [9]. Without any training and/or wearable protective devices, residential roofers frequently experience persistent harm to their knees due to incorrect operations during phases. To avoid potential injuries or disorders, it is crucial to ensure that roofers adopt the correct postures over different phases during the shingle installation.
The current practice primarily relies on ergonomists to observe and assess undesirable postures in roofing jobsites. Such a procedure is manual and tedious, and the results can be subjective and error-prone. As a result, it is plausible to create techniques that automate this observation and assessment process via the use of advanced sensing and data analytics [10]. As such, the jobsite safety performance can be improved by alerting roofers with warnings of potential hazards in a timely manner [11]. It is envisioned that a roofer will be monitored through a surveillance system using sensors while installing shingles on a slanted rooftop, and the sensors will collect the needed data to inform the system in real-time about the roofer’s posture and position and the duration of each posture in which s/he has been. To enable such a system, it is essential to identify different phases of shingle installation automatically so that this identification result can be further used to improve the surveillance system towards automation.

2. Background

2.1. Severity of Knee MSDs among Residential Roofers

MSDs among residential roofers are a major contributing factor to reduced physical functioning and may result in an early departure from the workforce and even disability [12,13,14]. In the state of Washington, the insurance premium composite base rate for roofers is the highest among all building construction trades [15]. The U.S. Bureau of Labor Statistics (BLS) indicated that the median number of days away from work due to knee injuries is 16 days, the second highest among all industries after shoulder injuries [1]. Safe Work Australia published that injuries to knees are ranked the third highest among all body parts of workers in the construction industry [16]. According to the Health and Safety Executive, the median number of days lost due to lower-limb-related musculoskeletal disorders in the United Kingdom is 17.8 days, which accounts for 24% of all other body parts [17]. During residential roofing shingle installation, roofers’ knee joints undergo a significant amount of rotation repeatedly, sometimes near the end range of motion. Awkward kneeling postures and repetitive motions have been proven to be associated with knee MSDs [7]. Awkward kneeling postures can additionally alter the force that the muscles are normally able to generate, which can further overload the muscle and lead to knee MSDs generated by heightened muscular activation. As the roofing occupation demands high kneeling requirements, roofers have the uppermost likelihood of knee MSDs [18]. Besides awkward posture, the unique work setting of roofing work, i.e., slanted rooftops, is another contributing factor to knee MSDs among construction roofers [8,19]. As the length of muscles deviates from the optimal resting length during shingle installation on a slanted rooftop, the ability to produce the maximum active tension in the muscles decreases. As a result, the muscle activation is triggered by the nerve stimulation, which promotes the recruitment of more motor neurons that, in turn, stimulate the muscle fibers and results in the generation of the required muscle force to perform the shingle installation task.

2.2. State of Research on WMSD Problems among Roofers

There have been studies regarding the assessment of WMSD risks among roofers. A laboratory assessment was conducted, and the findings indicated roofers experience greater pain in their lower extremities during shingle installation on sloped roof surfaces [20]. Several more assessments were performed to investigate the effects of laterally slanted ground on trunk biochemical responses [21] and on lumber flexion–relaxation responses [22]. The results of both of these studies suggested that the uneven ground surface could increase pressure on the spine and the lower extremities of the body, which can increase the risk of a WMSD. Another study, while focusing on low back disorders among roofers, assessed the influences of roof slope, working technique, and working pace in kneeling and stooped postures [2]. Effects of factors such as posture variance and a slanted roof surface on the roofers were assessed to determine the association of these factors with low back disorders (LBDs), and the results asserted that unfavorable conditions like these have significant effects on LBD development [23]. A laboratory assessment was conducted on roofers to determine the factors affecting their knees causing knee MSDs, and the results showed that the working posture on a sloped surface during shingle installation might have significant impacts on developing knee MSDs via measuring the indicators, such as knee flexion, abduction, adduction, and axial rotation [8]. Another laboratory study was conducted to assess the effects of working postures and roof slopes on the major knee postural muscles of roofers during shingle installation, and the results indicated an increased risk of developing knee MSDs among residential roofers [19].
A typical shingle installation operation can be divided into seven phases: (1) reaching for shingles, (2) placing shingles, (3) grasping the nail gun, (4) moving to the first nailing position, (5) nailing shingles, (6) replacing the nail gun, and (7) returning to the upright position [9], as illustrated in Figure 1. Different phases are associated with different levels of risks depending on the criteria of (a) the duration of the awkward knee joint rotation that roofers encounter in a phase, (b) the forceful exertion generated within the phase, which relates to the maximum knee joint rotation, and (c) the number of repetitions of the awkward knee joint rotations within a phase. Recently, the authors investigated the shingle installation work conditions at an operational level and examined the risks of the seven phases involved in the process of shingle installation task to knee MSD development among roofers [9]. It was revealed that over the course of roofing shingle installation, based on the awkward knee rotations and repetitive motions considering flexion, abduction, adduction, and internal and external knee rotations of roofers, different phases during shingle installation expose roofers to different levels of knee MSD risks. In particular, Phases 2 and 5 (i.e., placing and nailing shingles) were found to cause the highest awkward rotation, repetition, and forceful exertion and are deemed to be the riskiest phases for developing knee MSDs among roofers [9].

2.3. State of Research on Machine Learning in Postural-Recognition-Related Tasks for Jobsite Applications

The use of machine learning for classifying human activities and associated postures in occupational tasks has seen a rise in recent studies. For instance, supervised machine learning techniques have been employed within the construction industry to recognize and differentiate the awkward postures adopted by construction workers [24,25]. To monitor and evaluate MSD risks, studies have explored machine learning classification to identify inadequate postures of workers during their tasks [26] and assess ergonomic risks in occupational activities that involve overexertion [27]. During manual material handling tasks, machine learning was used for classifying correct and incorrect postures to measure the biomechanical risk in lifting loads [28], to distinguish between high-risk and low-risk lifting [29], and to observe and analyze the handler’s foot placement strategies while lifting loads [30]. In addition, machine learning classification has been explored to identify healthy and efficient body postures for mason workers [31] as well as to predict injury types, energy types, and affected body parts during construction tasks [32]. In the field of gait and biomechanics research, machine learning has been utilized to detect lying postures [33], sitting postures [34], alterations in gait patterns due to aging [35], disparities in walking related to surface conditions and age [36], and changes in gait parameters following physically demanding occupational tasks [37]. These works demonstrated the potential of applying machine learning in postural-recognition-related tasks for jobsite applications.

3. Problem Statement and Research Objective

Roofing postures can be recorded and quantified to assess the possibility of developing knee MSDs. However, the assessment procedure may face technical challenges thanks to differences in individual behaviors in performing the shingle installation tasks. To alleviate this situation, it is attractive to leverage the postural data to determine the working phases in which an individual is currently involved considering the evidence that different phases are associated with different risk levels in shingle installation. As a result, risk assessment can be performed by observing the amount of time a roofer is spending in a particular phase. With the rapid advancement in the field of sensors and monitoring technologies, it is envisioned that the collection of roofers’ postural data in an automatic and inexpensive manner will become viable. This will enable obtaining the knee joint rotation angles from the roofers’ postural movement. However, the existing literature does not currently provide evidence of successfully using knee joint rotation angles to accurately identify the specific activities associated with the phases of shingle installation. Whether machine learning methods can perform such identification is also unknown.
In this research, the authors proposed to examine the feasibility of utilizing machine learning to automatically identify the various phases involved in a residential roofing task of shingle installation by harvesting the combination of knee joint rotations and roof setting information. Previously, the authors presented the preliminary findings in a conference to demonstrate the potential of this subject matter [38]. However, the prior work did not examine the impacts of different features on learning efforts or provide in-depth analyses of the learning performance. This paper presents a comprehensive design, implementation, analysis, results, and discussion of the present research.

4. Methodology

Figure 2 provides a schematic view of the research methodology. To collect data, nine participants were recruited to simulate a roofing shingle installation task on a sloped platform mimicking an actual roof surface in a controlled laboratory setting. Using an optical motion capture system with retroreflective markers, trajectory data of the participants were collected during the simulation. These markers’ coordinates were then processed to calculate knee joint rotation angles along the sagittal (flexion), coronal (abduction–adduction), and transverse (internal–external rotation) planes. Together with roof slope angles, the obtained rotation angles were used as features to classify the various phases of the task. The feature data were then separated into training, validation, and testing sets. The training and validation sets were used to develop three supervised and non-parametric machine learning classification models, while the testing set served as a hold-out set comprising never-seen-before data (i.e., the data that was never used in training) to evaluate the performance of the models. Finally, the performances of the three classification models were compared to identify the most accurate classifier.

4.1. Data Collection and Processing

4.1.1. Participants

Nine male participants with no prior roofing experience were included in this study. The average age, height, and body mass of the participants were 26.1 years (standard deviation of 5.6 years), 180.2 cm (standard deviation of 6.1 cm), and 99.7 kg (standard deviation of 27.6 kg), respectively. Exclusion criteria included a previously known MSD or the presence of neurological diseases. The research protocol was approved by both the Institutional Review Boards (IRB) of the National Institute for Occupational Safety and Health (NIOSH) and West Virginia University.

4.1.2. Instruments

A VICON optical motion capture system, equipped with 14 MX Vicon cameras (Oxford, UK), was used to collect the segment endpoint data of the participants. Forty-two (42) retroreflective markers for motion capture were placed bilaterally on the lower extremities of the participants, including feet, heels, toes, ankles, shanks, knee joints, thighs, and hip joints, following the approach discussed in [39]. The results were three-dimensional (3D) coordinates of the markers placed on the participants, leading to the trajectory data, which were then utilized to calculate the knee joint rotation angles.
A custom-made adjustable wood platform measuring 1.2 × 1.6 m was employed to replicate the surface of a residential roof for shingle installation. The platform had a battery-powered lift mechanism that allowed for adjusting the slope angle within a range of 0° to over 30°. To secure the desired slope, two sets of wooden legs were used to lock the platform into position. For more detailed information regarding the data collection procedure, please refer to [8].

4.1.3. Procedure

The experiment took place in the Biomechanics Lab at NIOSH. Upon arrival, the participants were equipped with motion markers to ensure accurate calibration of their movements and to gather data. To initiate the data gathering process, the participants assumed a deep kneeling posture on the residential roof simulator. Then, they simulated the entire shingle installation process consisting of seven distinct phases, as illustrated in Figure 1. Following instructions to begin, they initially grabbed two shingles and positioned them in front of themselves. They then proceeded to their right side to retrieve a nail gun. Mimicking the shingle installation process, they affixed six nails (three nails in each shingle) into the two adjacent shingles on the roof simulator, following a left-to-right movement. Upon completion, the participants returned the nail gun and went back to their resting or initial position. Three varying slope angles of the roof simulator, 0°, 15°, and 30°, were configured for the participants to carry out the simulated shingle installation task. They performed the assigned task five times for each slope angle, resulting in a total of 45 trial data points (5 trials multiplied by 9 participants) for each slope angle. All data were sampled at a rate of 100 Hz.

4.1.4. Data Processing

Trajectory data captured by VICON were filtered in Visual 3D (Version 6, C-Motion, Germantown, MD, USA) using a fourth-order Butterworth filter with a 6 Hz cutoff. Using these trajectory data, knee joint flexion (FL), abduction–adduction (AB_AD), and internal–external rotation (IN_EX) were calculated in Visual 3D using the method provided by [40].

4.1.5. Preparation of Features

Three knee joint rotation angles and the roof slope were used as features for training the classifiers, as described in Table 1.
To investigate whether using a subset of features could improve the phase classification performance of the classifiers, input feature subsets using all possible combinations of the four features, as depicted in Table 2, were considered for investigating the effects on the classification accuracy of the classifiers.

4.2. Selection of Classifiers

The classification problem involved the identification of the previously mentioned seven phases of a shingle installation task. The seven phases are denoted in Table 3.
Since the performance of a classification algorithm is highly dependent on the used dataset and the features, three classifiers that are generally thought to function best for multiclass classification problems were selected and tested in this study: the random forest (RF), the decision tree (DT), and k-nearest neighbors (KNNs). The KNN classifier performs well when the number of features is low [41]. The RF classifier is well applicable to handle both numerical and categorical features and imbalanced datasets with a non-uniform distribution of class labels [42,43]. The DT classifier is used for handling non-linear datasets effectively [44].
This study included only four features—three numerical features (FL, AB_AD, and IN_EX) representing human activity time series sensor data, which are non-linear in character [45], and one categorical feature representing roof slope angles (S). Moreover, placing and nailing shingle phases (classes P2 and P5) had more observations than the others due to the relatively higher durations involved in these two specific phases, resulting in a non-uniform distribution of class labels and, hence, an imbalanced dataset. Due to these particular properties of the dataset that was included in this study, the above-mentioned three classifiers were used, which were identified to be most suitable for effective classification. These three classifiers have been extensively employed for recognizing awkward postures and classifying activities. They have demonstrated a plausible performance in classification tasks, achieving an accuracy level ranging from 83% to 98%.

4.3. Training and Evaluation of Classifiers

From the experiment, 148,574 time series data points were utilized for training and evaluating the classifiers. Figure 3 outlines the overall procedure followed in the training and evaluation process for each classifier. In this process, 90% of the feature data were used for training and validation, while the remaining 10% (hold-out) were set aside for testing purposes. To minimize the bias, variance, and overfitting during the construction of the classification models, a 10-fold cross-validation technique was employed. This involved randomly assigning all observations in the training and validation set to ten separate folds, with each fold representing 10% of the data. Then, the classifier was trained using nine folds of the data and validated using the remaining fold. This procedure was repeated ten times, with each time using a different fold as the validation set. The final accuracy (i.e., the mean cross-validation accuracy) was calculated by averaging the accuracies achieved from the ten resulting folds.
During learning, each classifier’s specific parameters were tuned to obtain the optimal performance. The DT classifier builds classification models in the form of a tree structure that can be used to predict the class or value of the target variable by learning simple decision rules inferred from training data [46]. For the DT, the quality of the split of the dataset by a node during tree construction was measured by computing ‘Gini impurity’, which measures the likelihood of the incorrect classification of a new instance if that was randomly classified according to the distribution of class labels from the dataset [47].
The RF is an ensemble of decision tree classifiers where each tree is generated using a random vector independently sampled from the input feature vector. Each tree classifier contributes a single vote for the most popular class to classify the input feature vector, and the class with the most votes becomes the model’s prediction [48]. In the RF approach, a number of trials were carried out to select the optimal number of trees. To find the optimal performance of the RF classifier, a range of values, 100, 200, 500, 600, 800, 900, and 1000, were tested for the number of trees, and, finally, the number of trees was set to 100, as increasing the number of trees did not significantly improve the mean cross-validation accuracy of the classifier in this study but increased the computational time. This was consistent with a previous study that showed that this is sufficient for obtaining high-accuracy solutions to similar classification problems [49].
The KNN classifier predicts a class based on the features of known observations that are close to it. In KNN classification, k-nearest training data points from a testing data point are identified by measuring the Euclidean distance between the test data point and each of the training data points [50]. The choice of k can significantly affect the performance of the KNN algorithm. In this study, different values of k, ranging from 1 to 40, were attempted to see the impact on the cross-validation accuracy of the classifier (Figure 4). With the increase in the value of k, a decreasing trend in the cross-validation accuracy was observed. Based on this, k = 1 was identified to provide the highest mean cross-validation accuracy and was therefore chosen for constructing the KNN classifier.
For each classifier, after parameter tuning, the best-performing model was determined by the highest mean cross-validation accuracy. All input feature subsets (Table 2) were tested for each classifier to analyze the effects of the number of features on the mean cross-validation accuracy. The input feature subset that provided the best cross-validation performance was used for subsequent analysis.
The testing dataset (hold-out) was utilized to assess the predictive performance of each classifier on new, untrained data, using the following five performance metrics:
(a)
The overall accuracy, which represents the ratio of correctly predicted observations to the total number of observations.
(b)
The precision score, calculated as the number of observations correctly predicted divided by the total number of observations predicted.
(c)
The recall score, determined by dividing the number of observations correctly predicted by the actual number of observations that should have been predicted correctly.
(d)
The F1 score, which is the harmonic mean of precision and recall, providing a balanced measure of the model’s performance.
(e)
The Kappa index, a weighted average of precision and recall that indicates the level of agreement between the predicted observations and the ground truth observations.
An F1 score reaches its best value at 1 and worst value at 0. The Kappa index value 1 means a perfect agreement. These metrics were processed using the Python scikit-learn module, with the average parameter set as ‘weighted’, which means metrics were calculated for each class, then their average was obtained, weighted by support (i.e., the number of ground truth observations for that class) and thus better accounting for class imbalance. The following equations were used to compute the above-mentioned metrics:
Overall   accuracy :   i = 1 n m i , i N
Precision :   i = 1 n m i , i C i × G i N
Recall :   i = 1 n m i , i N
From Equations (1) and (3), it is understandable that the overall accuracy is equal to the recall score, although these two metrics have different meanings. Please note that the recall score was calculated using a weighted average method to account for class imbalance. For a multiclass imbalanced classification problem, the values of these two metrics are generally equal.
F 1   score :   i = 1 n 2 × ( P r e c i s i o n i   × R e c a l l i ) ( P r e c i s i o n i   + R e c a l l i )   × G i N
where P r e c i s i o n i   = m i , i C i , R e c a l l i = m i , i G i , i   [ 1 , 7 ]
Kappa   index :   N   i = 1 n m i , i       i = 1 n G i   C i N 2   i = 1 n G i   C i
Here, m i , i is the number of observations belonging to the ground truth class i , which has also been predicted as a class i (i.e., values found along the diagonal of the confusion matrix).
  • Ci is the total number of predicted observations belonging to class i.
  • Gi is the total number of ground truth observations belonging to class i.
  • N is the total number of classified observations that are being compared to ground truth observations.
For each of the three classifiers, the training and evaluation process outlined earlier was conducted. The implementation of each classification algorithm was performed using Python (version 3.6.4).

4.4. Performance Comparison of Classification Methods

After the values of the performance metrics were calculated for all classifiers, by comparison, the classifier that exhibited the highest values for these metrics was considered to provide the most accurate phase classification results. Therefore, it was selected as the best-performing phase classification model among the three classifiers.

5. Results

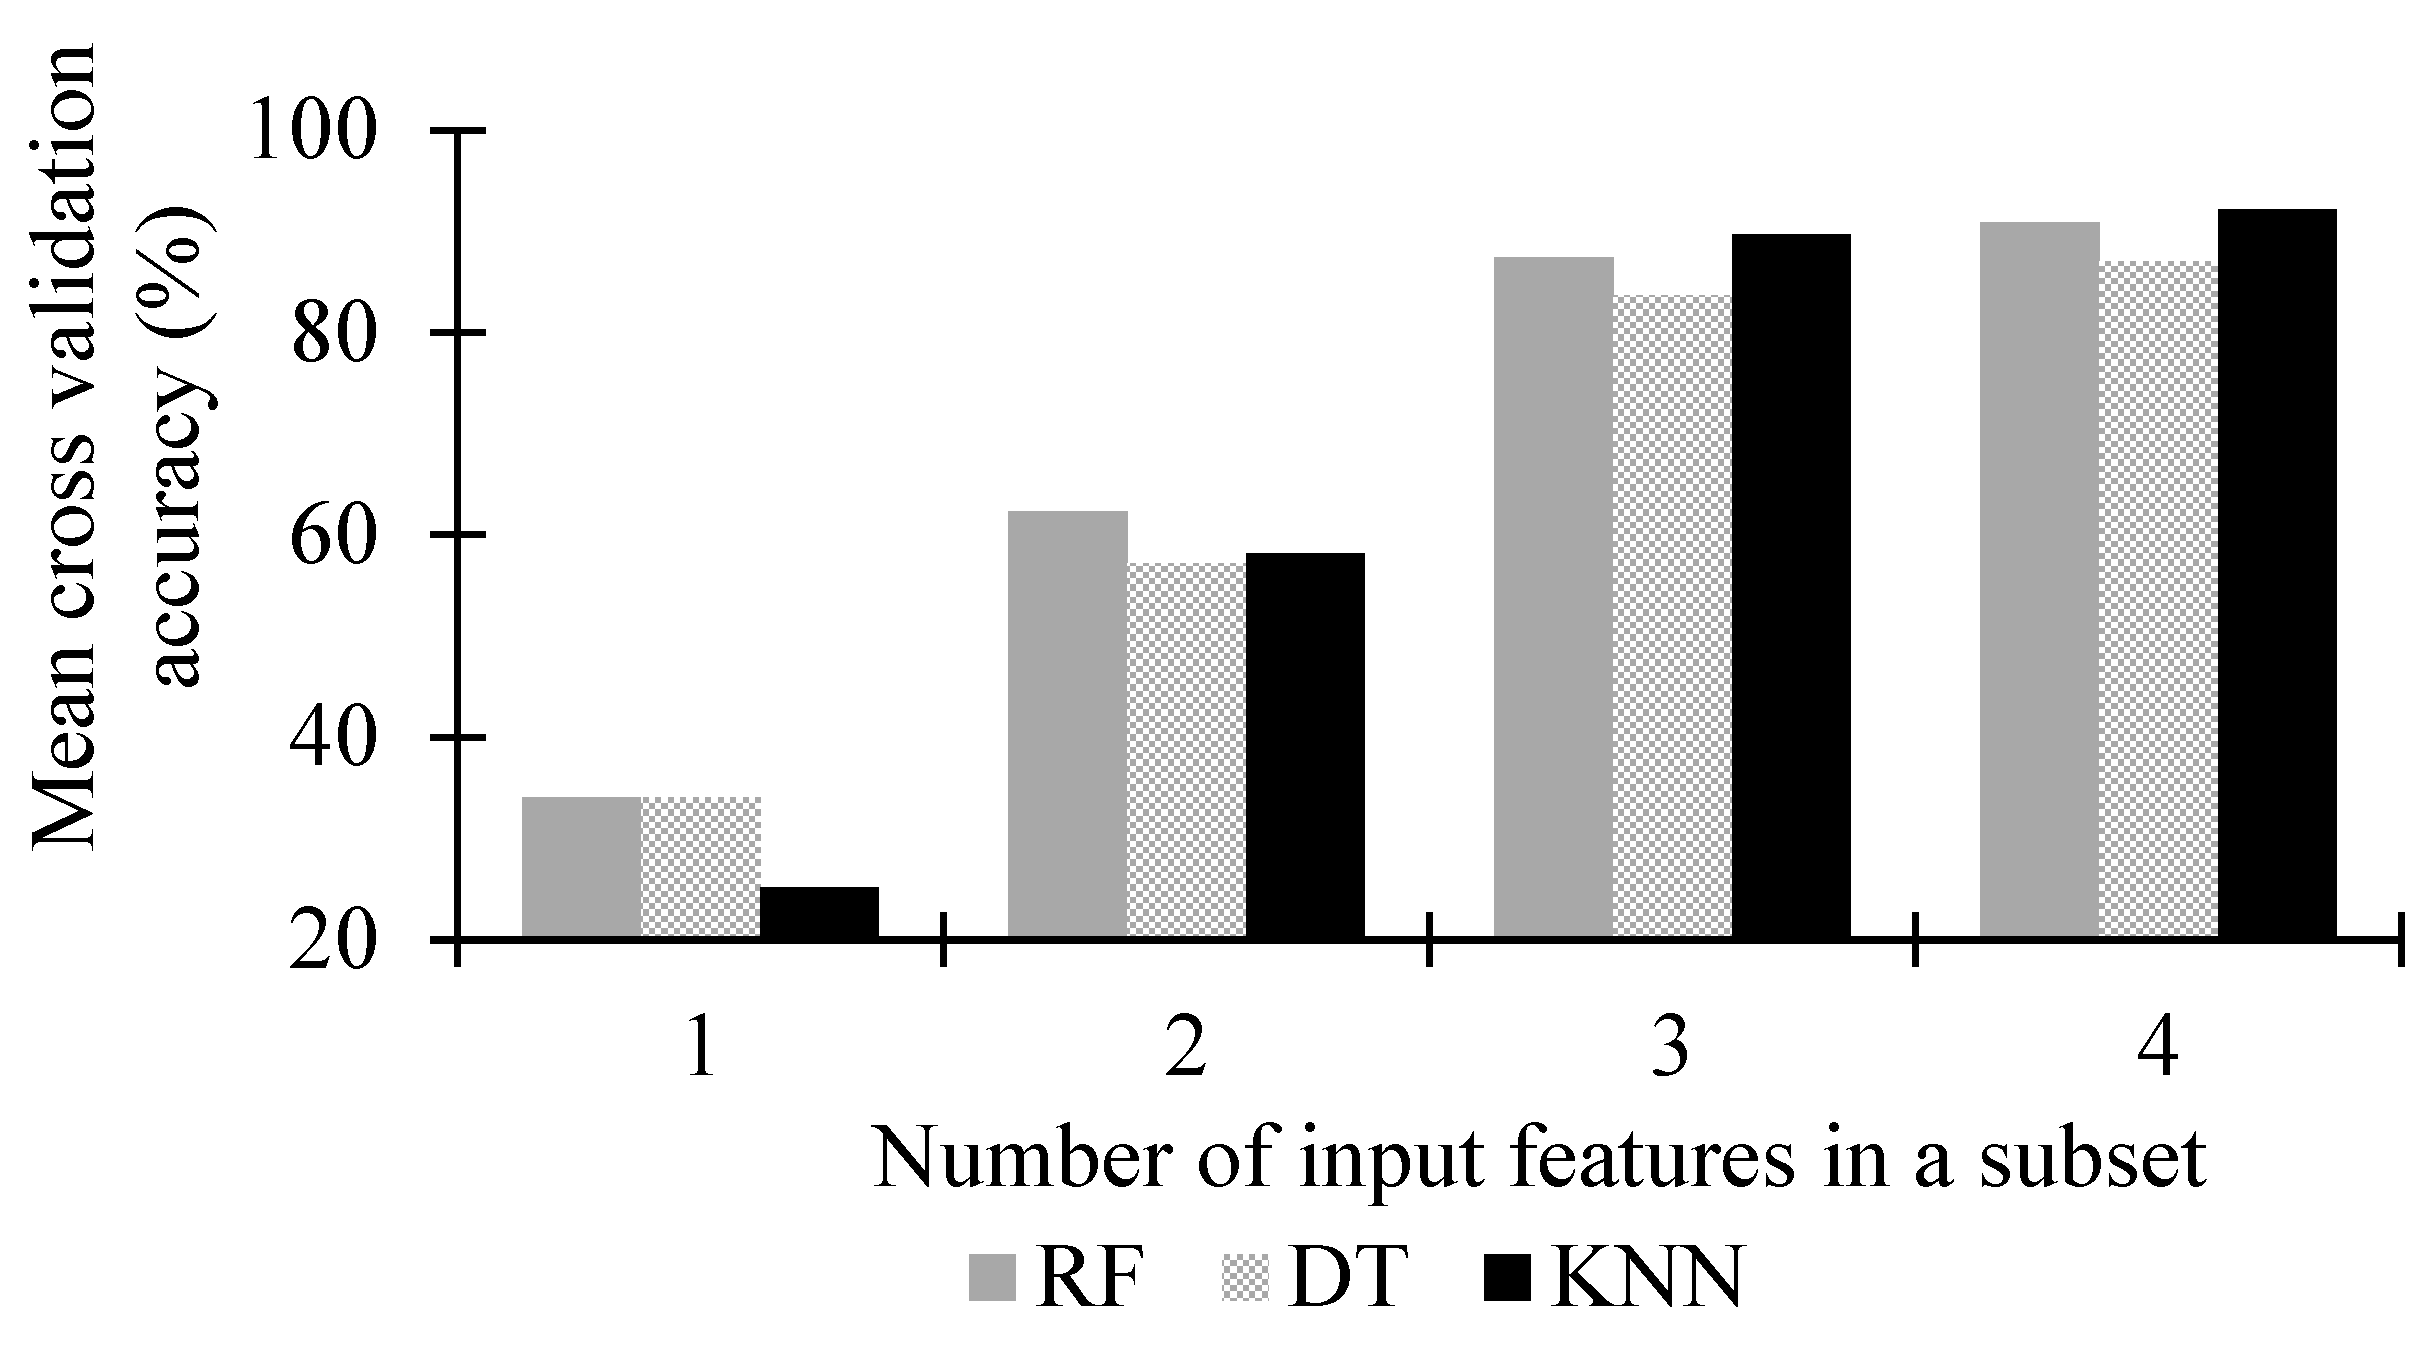
The mean cross-validation accuracies obtained from the three approaches for a number of input features in a subset are depicted in Figure 5. Please note that for each number of input features in a subset, presented in Table 2, only the result of the input feature subset that provided the highest mean cross-validation accuracy has been presented. For all three classifier types, the highest mean cross-validation accuracies were obtained when all four features were used; therefore, the classifiers trained on all four features were selected for further analysis.
Table 4 displays the average cross-validation accuracy along with the corresponding standard deviation for each classifier. Additionally, the table presents the lowest cross-validation accuracy achieved by each classifier.
Mean cross-validation accuracies are also summarized in Table 5 for different classifiers. The mean cross-validation accuracy was at best 92.16% when both knee kinematics (FL + AB_AD + IN_EX) and the residential roof slope were used in the KNN inputs; however, the mean cross-validation accuracy rate dropped to 89.68% when only kinematic data were used to train the KNN classifier. A similar pattern was also observed for the DT and RF classifiers. These results confirm that adding roof setting information along with knee kinematics variables improved the classification performance of the classifiers.
Table 6 shows the time taken to train and test different classifiers. All classifiers were very quick at both training and testing instances of data.
Table 7 presents the overall performance of the different classifiers in terms of their overall accuracy, F1 score, precision score, recall score, and Kappa index.
In this study, the KNN classifier demonstrated the best performance among all the classifiers. In Table 4, it achieved the highest mean cross-validation accuracy of 92.16%. In Table 7, the KNN classifier outperformed the other classifiers in all metrics. It had the highest overall classification accuracy of 0.9262, as well as the highest scores for F1, precision, recall, and the Kappa index, with values of 0.9260, 0.9220, 0.9262, and 0.9020, respectively. The F1 score, which is close to 1, indicates the KNN classifier’s ability to correctly identify the phases better than just relying on any standard classification’s accuracy alone. A high precision score suggests a low false positive rate, while a high recall score indicates a low false negative rate in the predictions. The high Kappa index value suggests excellent agreement between the test data and the predicted data, as values ranging from 0.81 to 1.00 indicate almost perfect agreement.
In terms of overall accuracy, it was also observed that the RF classifier achieved a classification accuracy of 91.12%, which is comparable to that achieved by KNN. This classifier also performed well in phase classification in terms of its precision, recall, F1 score, and Kappa index.
To gain insights into the accuracy of classifying each phase, a detailed analysis of the classification results for each phase was conducted. This involved examining the confusion matrices generated by the KNN and RF classifiers, which are presented in Table 8 and Table 9, respectively. These matrices provide precision and recall values to determine per-class classification accuracies. The elements on the diagonal of the confusion matrices indicate the number of instances where the predicted class aligns with the actual class. Conversely, the off-diagonal elements indicate the classifier’s incorrect predictions. Higher values along the diagonal indicate a better performance, indicating that the classifier made a higher number of correct predictions. For instance, in Table 8 a Precision1 value of 0.943 for class P1 signifies that 94.3% of the observations classified as P1 were accurate. Similarly, a Recall1 value of 0.930 signifies that 93% of the observations belonging to class P1 were accurately identified as P1.
R e c a l l i 
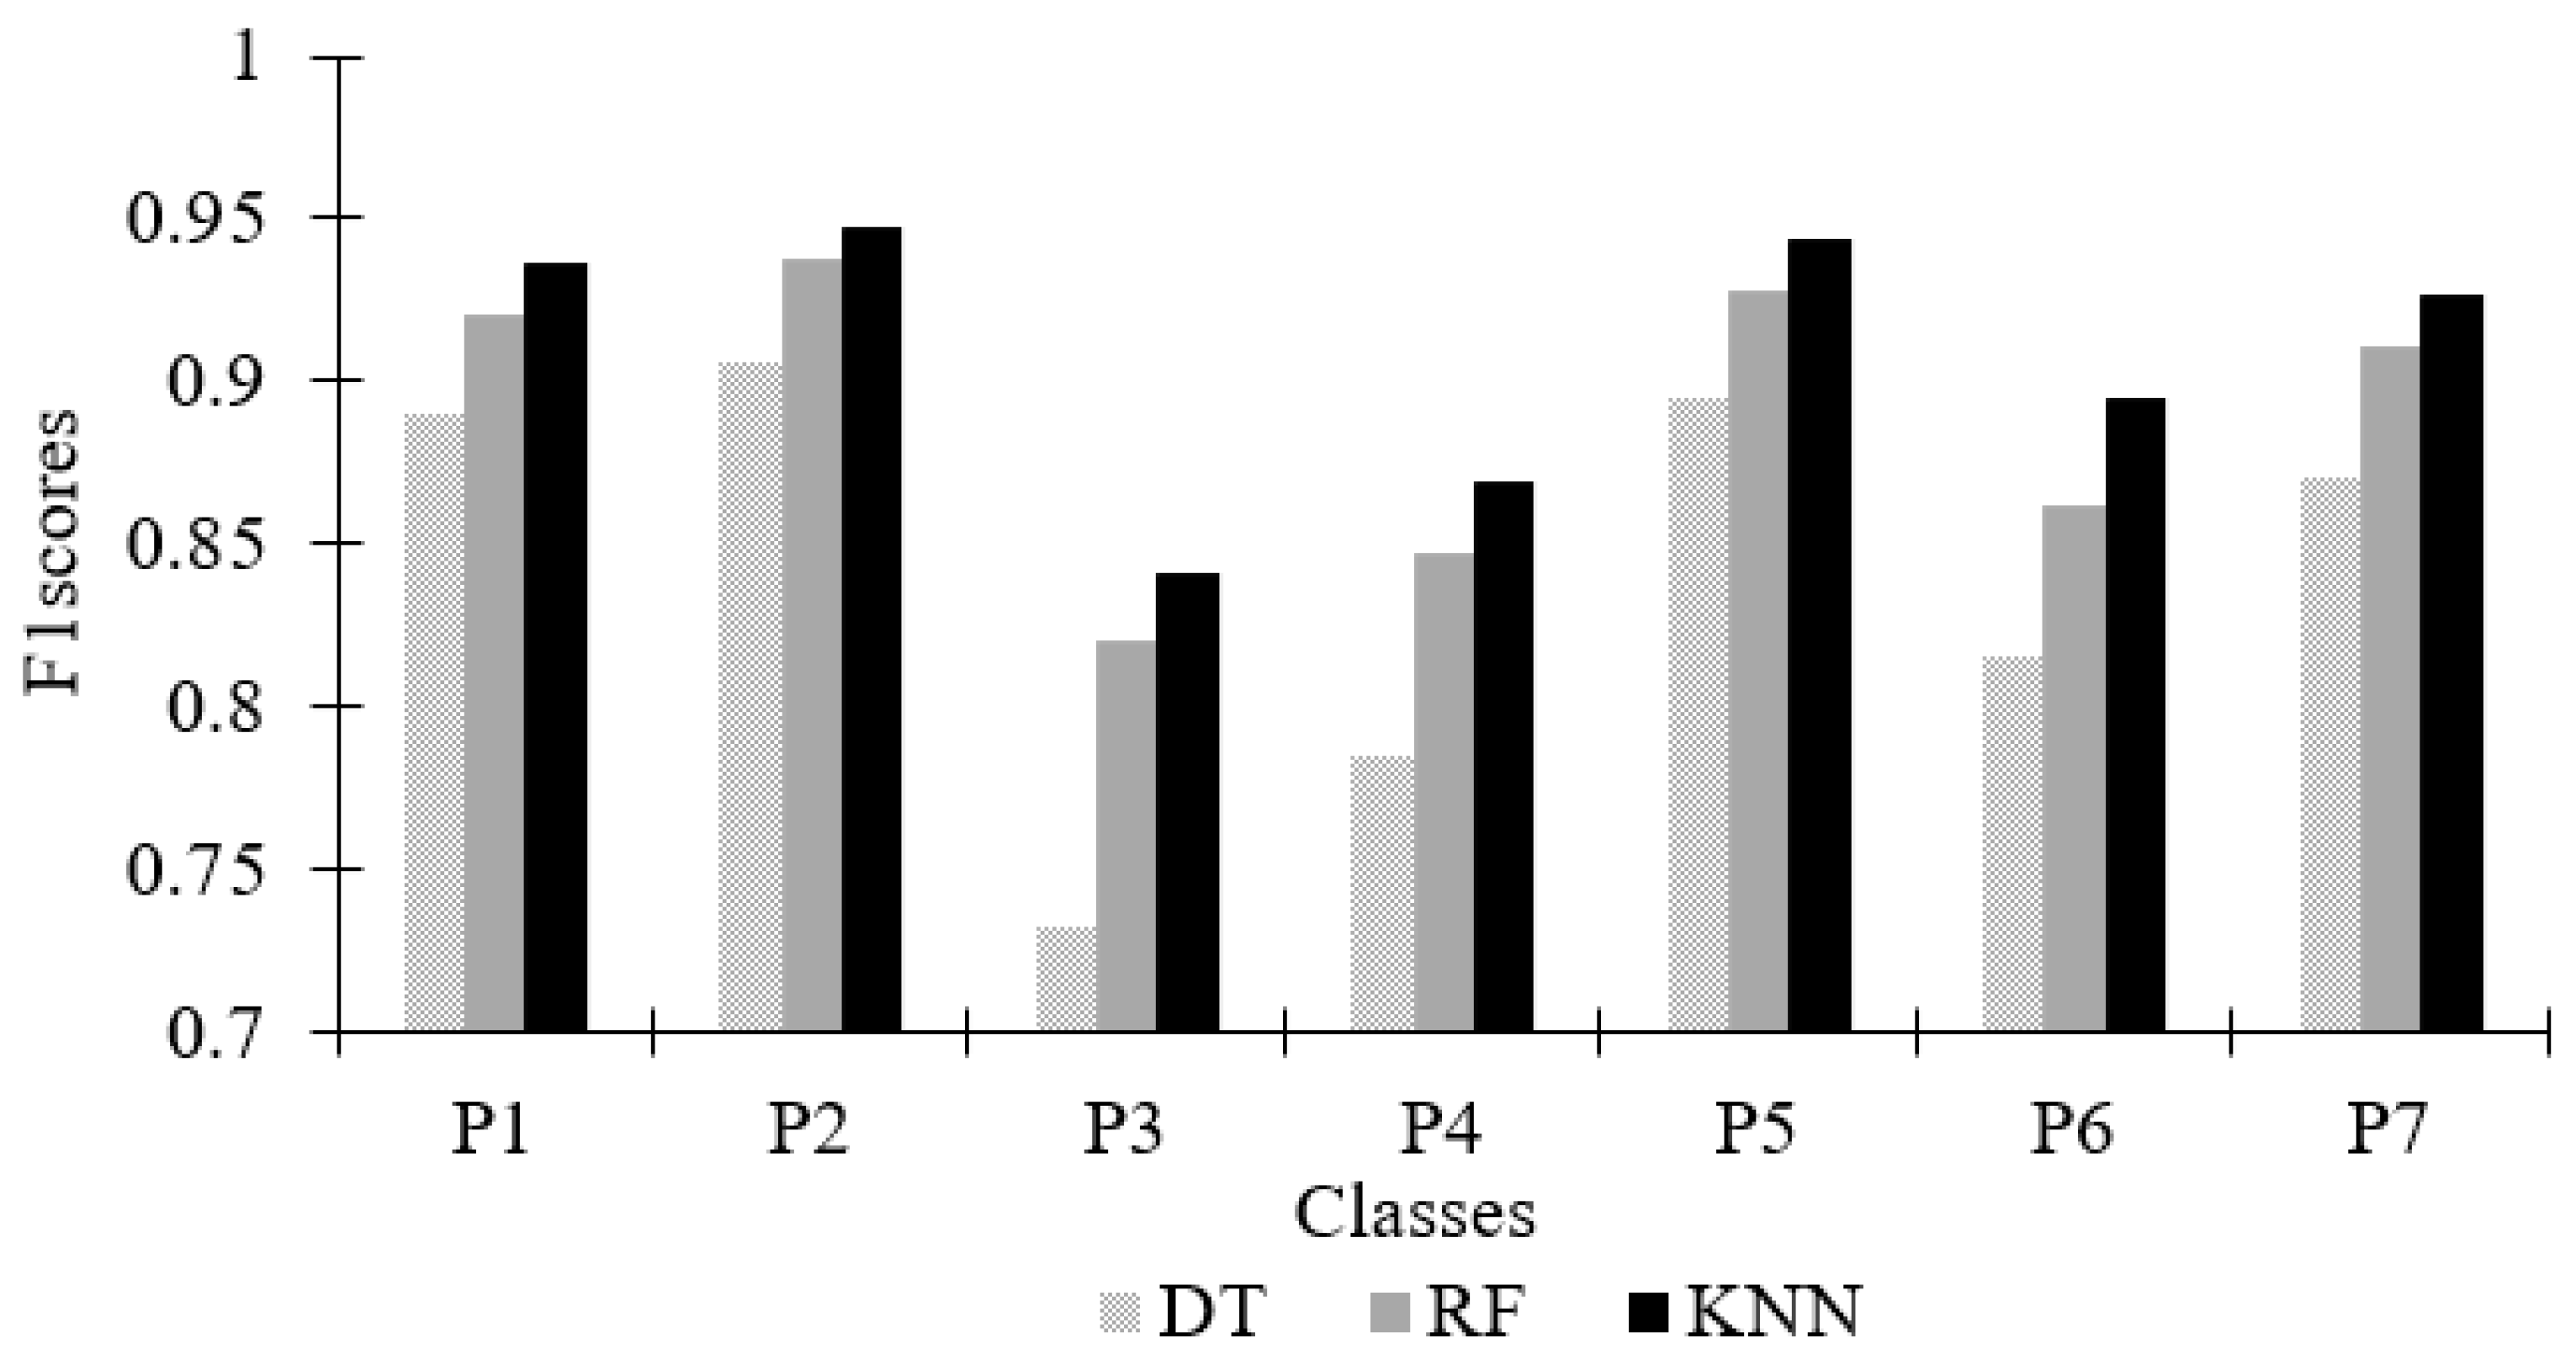
Table 10 represents the performances of different classifiers to classify the seven phases in terms of F1 scores. In Figure 6, the performance of different classifiers in classifying the phases has been illustrated with F1 scores.
Table 10 and Figure 6 suggest that the KNN classifier also outperformed the other two classifiers in a per-class prediction accuracy assessment.

6. Discussion

This study investigated the use of machine learning to classify roofers’ activities in the shingle installation process. Knee kinematics data and residential roof setting information were used to classify seven different phases of shingle installation operation, applying machine learning techniques. Given the high prevalence of knee MSDs among roofers, as well as the lack of knowledge in understanding postural differences among different phases of sloped shingle installation roofing tasks, this study examined if machine learning can be used to differentiate the seven phases of shingle installation using knee joint rotation (kinematics) and roof slope information. Meanwhile, this study investigated if the combination of knee kinematics and roof setting information as machine learning mode inputs are more effective than knee kinematics only for the classification of the shingle installation phases.
Three classifiers (i.e., decision tree, random forest, and k-nearest neighbors) were tested in this study. The results reported in 
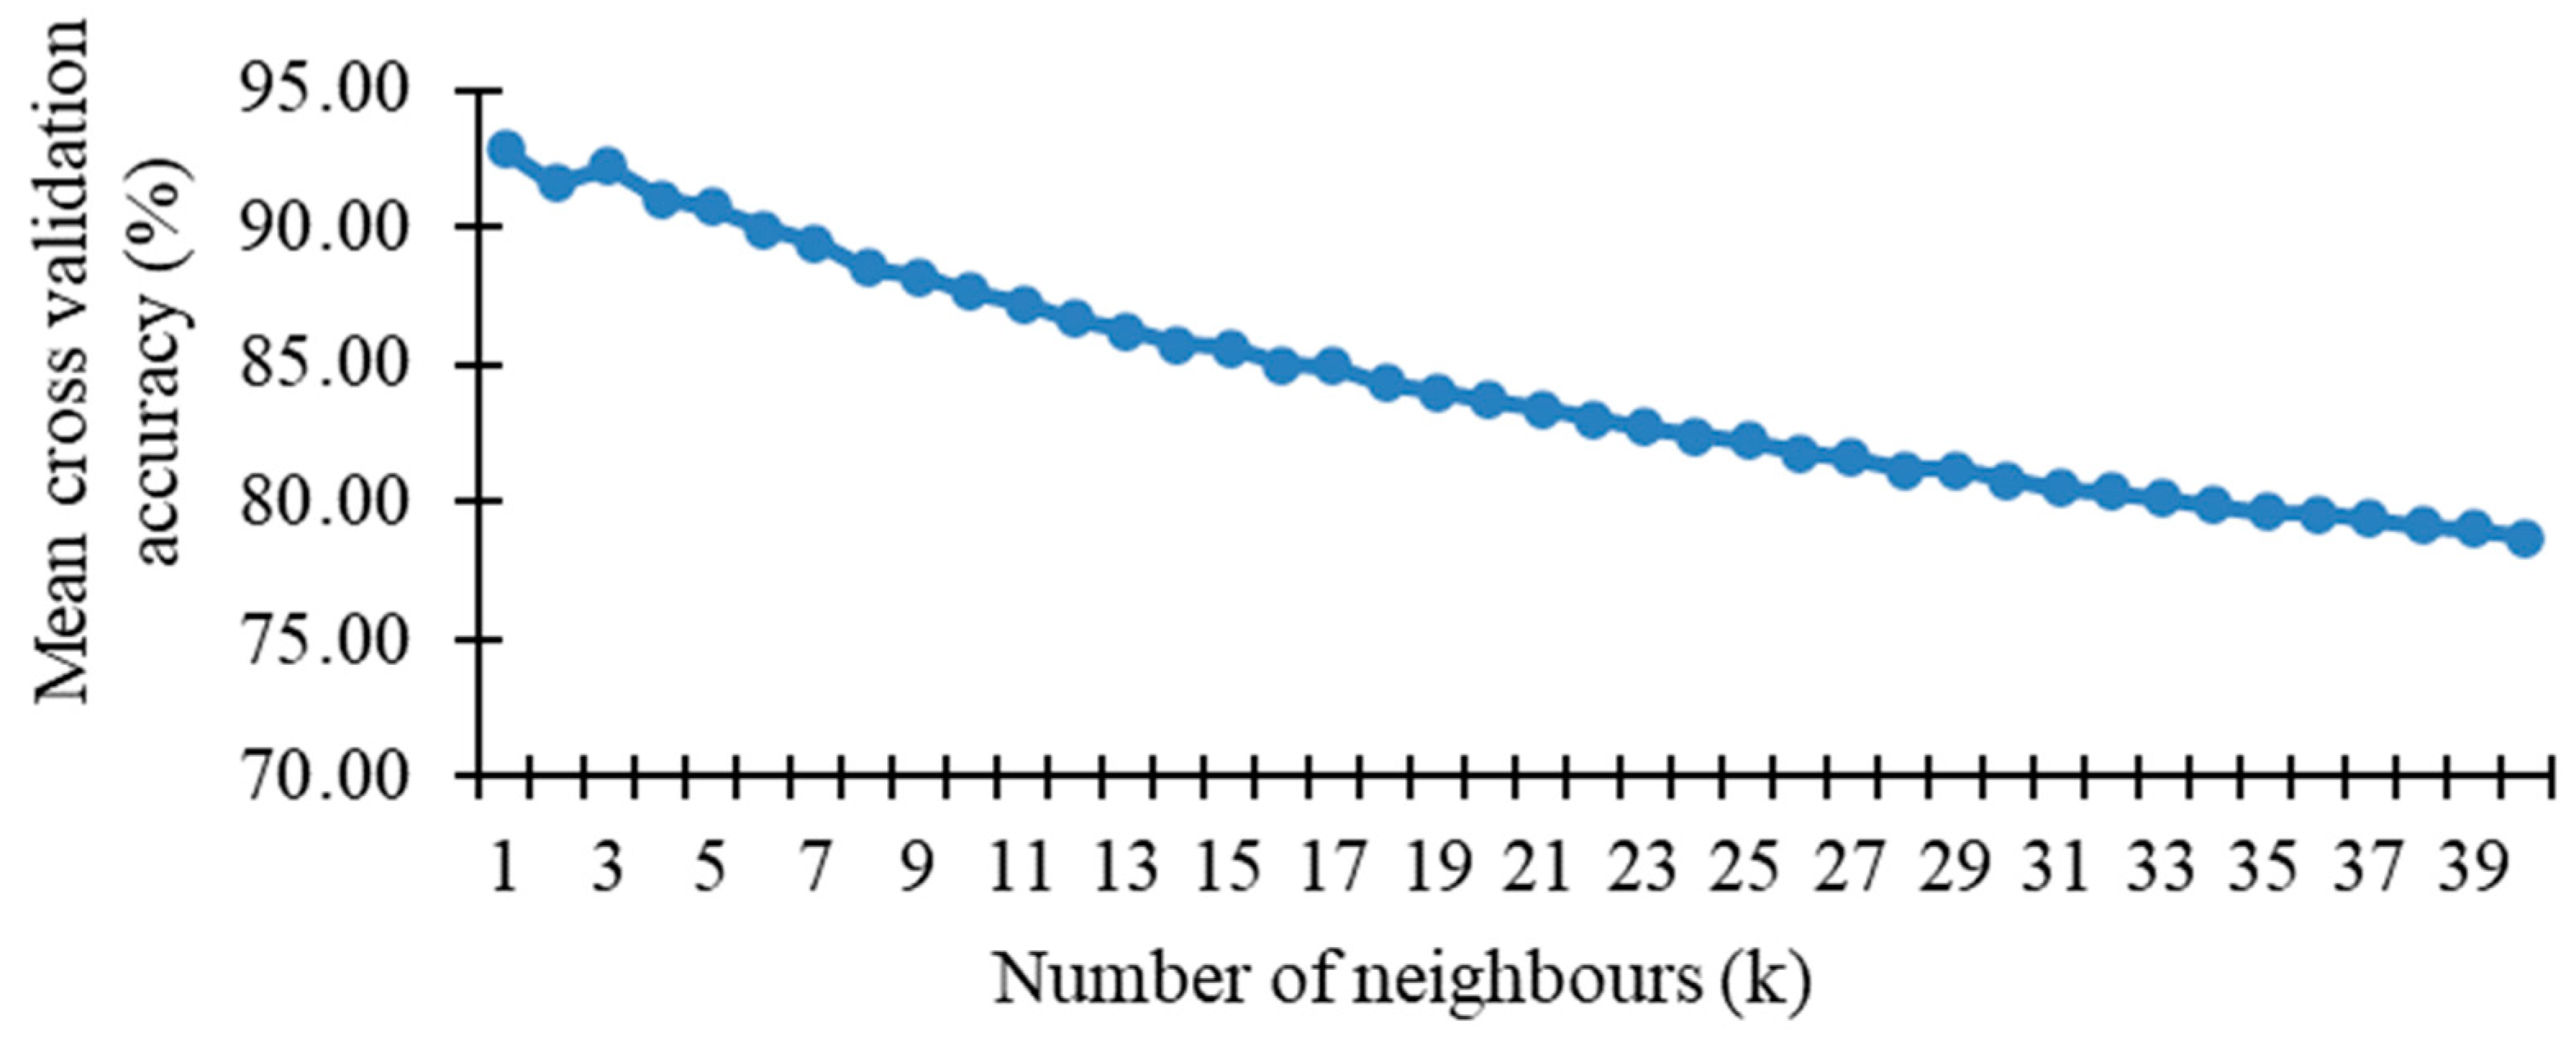
Table 5 showed that the highest testing accuracy of 92.62% was obtained by the KNN classifier. The RF classifier also achieved a testing accuracy of 91.12%, which was comparable to that achieved by the KNN classifier. For the KNN classifier, the number of neighbors k plays an important role in the classification performance of the classifier, i.e., k is the key tuning parameter of the KNN classifier. In this study, k values from 1 to 40 were examined to identify the optimal k value for all training sample sets. Although the collected data were post-processed to attenuate noise and remove outliers, the robustness of the KNN classifier to noisy data and outliers is still in question [51]. One advantage of RF over KNN is the ease of parameter tuning during the training of the classifier. Tuning the number of trees in the forest often leads to good accuracy. Oshiro et al. [49] suggested that it is possible to obtain a good balance between accuracy, processing time, and memory usage with a range between 64 and 128 trees in a forest. Using more than the required number of trees may be unnecessary, but this does not harm the model except by increasing the computation time [48].
From Table 5, it can be observed that the complete set of all four features provided the best phase classification results (KNN 92.62%, RF 91.12%). These findings indicate that knee kinematics and roof slope information complement each other when detecting the risky phases of a shingle installation process. Moreover, residential roof slopes can significantly affect the knee joint rotation angles during sloped shingle installation [8]. As a result, a better phase classification performance by the classifier can possibly be attributed to more useful information generated by the combination of knee kinematics variables and the roof slope compared to the knee kinematics variables only.
Per-class classification results (F1 scores) presented in Table 10 and Figure 6 suggested that relatively risker phases (P2 and P5) could be identified more accurately using knee kinematics variables and roof setting information as input to the training algorithms, compared to the moderate and least risky phase. This is evident from the higher F1 scores (~95%) of these two phases compared to the other phases. F1 scores were considered as they enable the measurement of the balance between precision and recall scores. Moreover, the F1 score is a useful measure to deal with imbalanced datasets with a non-uniform distribution of class labels, as is the case in this study. The authors’ previous study found that, among the seven phases, the placing and nailing shingle phases (P2 and P5) required more repetition of extreme and awkward movements of the knees for placing and installing shingles compared to the other phases. More specifically, roofers experienced extreme flexion, abduction, adduction, and internal and external rotations in their knee joints during placing shingles (P2), and hence P2 could be deemed as the riskiest phase in terms of awkward knee rotations during the sloped shingle installation. As to flexion, abduction, and external rotation, the next riskiest phase was nailing shingles (P5), when the participants faced extreme adduction as well. Moreover, the durations of these two phases were relatively higher compared to other phases. Therefore, each classifier was well able to distinguish these two riskiest phases from the other ones. However, further investigation is needed to substantiate this finding. From the confusion matrices presented in Table 6 and Table 7, it is observed from the recall and precision scores that the highest areas of confusion using the KNN and RF classifiers were P4, P6, and P3. This lies in the small variations in the flexion, abduction–adduction, and internal–external rotations of knee joint rotation angles, which were the least extreme in these phases, as suggested in the authors’ previous study [9].
While previous research has explored the recognition of awkward postures, there is limited knowledge regarding their identification within a work context. Roofers, who frequently experience awkward postures and repetitive movements while installing shingles, are particularly vulnerable to MSDs, with knee MSDs being the most prevalent. Accurately identifying these factors during roofing operations can help minimize roofers’ exposure and reduce the knee MSD risks. This study successfully illustrated the ability of machine learning in identifying high-risk phases of shingle installation by leveraging knee joint rotation angles and information regarding the specific residential roof settings where roofers carry out their tasks. To the authors’ best knowledge, this paper is the first that exploits machine learning to classify task-specific risky phases using knee kinematics data and roof setting information.
The importance of proactive safety measures over reactive ones is widely acknowledged. The present study, which focuses on automating the classification of work phases in roofing operations, has significant implications for researchers, practitioners in the occupational safety and health field, and the construction industry. The integration of machine learning with non-invasive biomechanical devices or inertial measurement units (IMUs) that can capture knee rotational kinematics during dynamic movements presents significant potential. This combination could lead to the development of an automated activity monitoring and risk identification system as an intervention for roofers. Such a system would enable the continuous monitoring and evaluation of roofers’ postures throughout the entire process of sloped shingle installation. Furthermore, it shows promise in identifying instances where a worker spends an excessive duration in a specific phase, particularly in high-risk phases involving awkward rotations and repetitive motions, such as shingle placement and nailing. Currently, there is no standardized procedure for shingle installation in residential roofing. This information could be beneficial to designing a well-documented and standardized residential roofing procedure that can help reduce MSDs among roofers. Automated machine-learning-based classification may also facilitate the process of MSD-risk-related data collection. Additionally, the productivity of workers may also be analyzed through the automated identification of the phases and, thereby, the determination of their working durations at each identified phase.
This study has several limitations. First, ground truth data were collected from an experimental study performed in a controlled laboratory setting, not from a real construction site. Second, only knee kinematics and roof slope information were used as features to analyze the phase classification performance of the classifiers. Activations of the knee postural muscles (i.e., electromyography signals from different muscles) were not considered. Awkward postures can make a muscle less efficient in producing the required amount of force to accomplish a task, which results in higher muscle activation and muscle overloading. Hence, knee postural muscle activation data might yield more useful discriminative features, which could further improve phase classification performance of the classifier. Third, only three feature-based models (i.e., KNN, DT, and RF) were tested in the current study. A results comparison from a deep learning model, such as a deep neural network, might provide more insights into the underlying classification mechanisms, but it was outside the scope of the current investigation. Fourth, this study employed individuals without professional roofing experience as participants. Kinematically speaking, distinctions may exist between professional and non-professional roofers. Nevertheless, all subjects in this research were physically active and possessed relevant experience in activities such as home remodeling. It is hypothesized that their biomechanical responses during the experiments closely resemble those of professional roofers. However, further scientific investigation is required to substantiate this assumption [8]. Lastly, the dataset included only roofing phase data. Real-life scenarios will include non-roofing phases as well, such as standing, resting, and walking. In such cases, those non-roofing phase related data should be removed before applying the classification method.

7. Conclusions and Future Extension

Construction roofers are exposed to awkward knee joint rotations in different phases of shingle installation roofing tasks, which contributes to the development of knee MSDs among them. Some of the phases involve extreme knee joint rotation and hence impose the greatest risk of knee MSDs. This study suggested that machine learning can automatically detect and classify the phases of a typical sloped shingle installation task with a high accuracy based on the roofer’s knee joint rotation angles and the information of the roof slope at which they operated. Seven different phases, namely reaching for shingles, placing shingles, grasping the nail gun, moving to the first nailing position, nailing shingles, replacing the nail gun, and returning to an upright position, were performed in a simulated shingle installation task to examine the feasibility of the automated detection and classification of the phases. The classification performances of three types of supervised machine learning classifiers (i.e., DT, KNN, and RF) were compared in order to select the best classifier. Cross-validation and overall prediction accuracy results showed that the KNN classifier obtained the best results with 92.16% and 92.62%, respectively. The recall and precision performance of correctly classifying the phases were above 92% for this classifier. The results of the current study show that machine learning can be used to accurately recognize the different phases of a shingle installation task. The findings of this study highlight the feasibility and potential of the application of a machine-learning-based automated phase classification method for assessing the MSD risk, productivity, and efficiency of residential roofers.
In future studies, the focus will be on investigating the effects of knee postural muscle activation on the classification of shingle installation phases. The aim is to ascertain whether muscle activation can offer more informative features for a deeper comprehension of postural disparities among phases and the associated risk of knee MSDs in roofing. Additionally, more insights into the underlying mechanisms of classification can be obtained through an exploration of deep neural network learning models. It is important to note that personal protective equipment, such as fall protection harnesses and lifelines, were not utilized in the simulated roofing tasks conducted for this study. Future research is needed to examine how the implementation of these safety measures affects the performance of roofers during their tasks. Furthermore, the models developed in this study will be extended to real-life settings, incorporating the use of wearable sensors, to assess the feasibility of automated recognition with the involvement of professional roofers. Additionally, the extension of the models to other body parts of roofers, such as the lower back, which are susceptible to MSDs, may also be explored.

Author Contributions

Conceptualization, methodology, investigation, formal analysis, validation, and visualization, F.D. and A.D.; data curation, S.P.B., E.W.S., and C.M.W.; writing—original draft preparation, A.D. and D.M.; writing—review and editing, F.D., S.P.B., E.W.S., C.M.W., and J.Z.W.; supervision and project administration, S.P.B. and F.D.; funding acquisition, S.P.B. All authors have read and agreed to the published version of the manuscript.

Funding

This research was funded by the National Occupational Research Agenda (NORA) Construction Sector of the National Institute for Occupational Safety and Health, grant number 939051J.

Data Availability Statement

Some or all of the data, models, or codes generated or used during the study are available from the corresponding authors by request (experimental data).

Acknowledgments

The authors acknowledge the support of the National Institute for Occupational Safety and Health (NIOSH), who funded this research. The findings and conclusions in this report are those of the authors and do not necessarily represent the official position of the National Institute for Occupational Safety and Health, Centers for Disease Control and Prevention.

Conflicts of Interest

The authors declare no conflict of interest.

References

  1. BLS. Nonfatal Occupational Injuries and Illness Requiring Days Away from Work. 2015. Available online: https://www.bls.gov/news.release/pdf/osh2.pdf (accessed on 21 December 2022).
  2. Wang, D.; Dai, F.; Ning, X. Risk assessment of work-related musculoskeletal disorders in construction: State-of-the-art review. J. Constr. Eng. Manag. 2015, 141, 04015008. [Google Scholar] [CrossRef]
  3. Breloff, S.P.; Sinsel, E.W.; Dutta, A.; Carey, R.E.; Warren, C.M.; Dai, F.; Ning, S.; Wu, J.Z. Are knee savers and knee pads a viable intervention to reduce lower extremity musculoskeletal disorder risk in residential roofers? Int. J. Ind. Ergon. 2019, 74, 102868. [Google Scholar] [CrossRef] [PubMed]
  4. BLS. Nonfatal Cases Involving Days Away from Work: Selected Characteristics (2011 Forward). Available online: https://www.bls.gov/help/one_screen/cs.htm (accessed on 21 December 2022).
  5. Nagura, T.; Dyrby, C.O.; Alexander, E.J.; Andriacchi, T.P. Mechanical loads at the knee joint during deep flexion. J. Orthop. Res. 2002, 20, 881–886. [Google Scholar] [CrossRef]
  6. Barrios, J.A.; Crossley, K.M.; Davis, I.S. Gait retraining to reduce the knee adduction moment through real-time visual feedback of dynamic knee alignment. J. Biomech. 2010, 43, 2208–2213. [Google Scholar] [CrossRef] [Green Version]
  7. Hofer, J.K.; Gejo, R.; McGarry, M.H.; Lee, T.Q. Effects on tibiofemoral biomechanics from kneeling. Clin. Biomech. 2011, 26, 605–611. [Google Scholar] [CrossRef] [PubMed]
  8. Breloff, S.P.; Dutta, A.; Dai, F.; Sinsel, E.W.; Warren, C.M.; Ning, X.; Wu, J.Z. Assessing work-related risk factors for musculoskeletal knee disorders in construction roofing tasks. Appl. Ergon. 2019, 81, 102901. [Google Scholar] [CrossRef] [PubMed]
  9. Dutta, A.; Breloff, S.P.; Dai, F.; Sinsel, E.W.; Warren, C.M.; Wu, J.Z. Identifying potentially risky phases leading to knee musculoskeletal disorders during shingle installation operations. J. Constr. Eng. Manag. 2020, 146, 04019118. [Google Scholar] [CrossRef]
  10. Rao, A.S.; Radanovic, M.; Liu, Y.; Hu, S.; Fang, Y.; Khoshelham, K.; Palaniswami, M.; Ngo, T. Real-time monitoring of construction sites: Sensors, methods, and applications. Autom. Constr. 2022, 136, 104099. [Google Scholar] [CrossRef]
  11. Zhao, Z.; Shen, L.; Yang, C.; Wu, W.; Zhang, M.; Huang, G.Q. IoT and digital twin enabled smart tracking for safety management. Comput. Oper. Res. 2021, 128, 105183. [Google Scholar] [CrossRef]
  12. Welch, L.; Haile, E.; Boden, L.I.; Hunting, K.L. Musculoskeletal disorders among construction roofers—Physical function and disability. Scand. J. Work Environ. Health 2009, 35, 56–63. [Google Scholar] [CrossRef] [Green Version]
  13. Welch, L.S.; Haile, E.; Boden, L.I.; Hunting, K.L. Impact of musculoskeletal and medical conditions on disability retirement—A longitudinal study among construction roofers. Am. J. Ind. Med. 2010, 53, 552–560. [Google Scholar] [CrossRef]
  14. Welch, L.S.; Russell, D.; Weinstock, D.; Betit, E. Best practices for health and safety technology transfer in construction. Am. J. Ind. Med. 2015, 58, 849–857. [Google Scholar] [CrossRef]
  15. Washington State Department of Labor and Industries. Rates for Worker’s Compensation: 2021 Base Rates by Business Type and Classification Code. Available online: https://lni.wa.gov/insurance/_docs/2021RatesBusTypeClassCode.pdf (accessed on 5 May 2023).
  16. Safe Work Australia. Construction Industry Profile. Available online: https://www.safeworkaustralia.gov.au/system/files/documents/1702/construction-industry-profile.pdf (accessed on 26 May 2023).
  17. Health and Safety Executive. Work-Related Musculoskeletal Disorders Statistics in Great Britain. 2022. Available online: https://www.hse.gov.uk/statistics/causdis/msd.pdf (accessed on 26 May 2023).
  18. Marras, W.S.; Karwowski, W. Occupational Ergonomics: Design and Management of Work Systems; University of Iowa: Iowa, IA, USA, 2003. [Google Scholar]
  19. Dutta, A.; Breloff, S.P.; Dai, F.; Sinsel, E.W.; Warren, C.M.; Carey, R.E.; Wu, J.Z. Effects of working posture and roof slope on activation of lower limb muscles during shingle installation. Ergonomics 2020, 63, 1182–1193. [Google Scholar] [CrossRef]
  20. Choi, S.D. Postural balance and adaptations in transitioning sloped surfaces. Int. J. Constr. Educ. Res. 2008, 4, 189–199. [Google Scholar] [CrossRef]
  21. Zhou, J.; Ning, X.; Nimbarte, A.D.; Dai, F. The assessment of material-handling strategies in dealing with sudden loading: The effect of uneven ground surface on trunk biomechanical responses. Ergonomics 2015, 58, 259–267. [Google Scholar] [CrossRef]
  22. Hu, B.; Ning, X.; Dai, F.; Almuhaidib, I. The changes of lumbar muscle flexion-relaxation phenomenon due to antero-posteriorly slanted ground surfaces. Ergonomics 2016, 59, 1251–1258. [Google Scholar] [CrossRef]
  23. Di Wang, F.D.; Ning, X.; Dong, R.G.; Wu, J.Z. Assessing work-related risk factors on low back disorders among roofing workers. J. Constr. Eng. Manag. 2017, 143, 04017026. [Google Scholar] [CrossRef] [PubMed]
  24. Antwi-Afari, M.F.; Li, H.; Yu, Y.; Kong, L. Wearable insole pressure system for automated detection and classification of awkward working postures in construction workers. Autom. Constr. 2018, 96, 433–441. [Google Scholar] [CrossRef]
  25. Chen, J.; Qiu, J.; Ahn, C. Construction worker’s awkward posture recognition through supervised motion tensor decomposition. Autom. Constr. 2017, 77, 67–81. [Google Scholar] [CrossRef]
  26. Barkallah, E.; Freulard, J.; Otis, M.J.-D.; Ngomo, S.; Ayena, J.C.; Desrosiers, C. Wearable devices for classification of inadequate posture at work using neural networks. Sensors 2017, 17, 2003. [Google Scholar] [CrossRef] [PubMed] [Green Version]
  27. Nath, N.D.; Chaspari, T.; Behzadan, A.H. Automated ergonomic risk monitoring using body-mounted sensors and machine learning. Adv. Eng. Inform. 2018, 38, 514–526. [Google Scholar] [CrossRef]
  28. Conforti, I.; Mileti, I.; Del Prete, Z.; Palermo, E. Measuring biomechanical risk in lifting load tasks through wearable system and machine-learning approach. Sensors 2020, 20, 1557. [Google Scholar] [CrossRef] [Green Version]
  29. Zurada, J. Classifying the risk of work related low back disorders due to manual material handling tasks. Expert Syst. Appl. 2012, 39, 11125–11134. [Google Scholar] [CrossRef]
  30. Muller, A.; Vallée-Marcotte, J.; Robert-Lachaine, X.; Mecheri, H.; Larue, C.; Corbeil, P.; Plamondon, A. A machine-learning method for classifying and analyzing foot placement: Application to manual material handling. J. Biomech. 2019, 97, 109410. [Google Scholar] [CrossRef]
  31. Alwasel, A.; Sabet, A.; Nahangi, M.; Haas, C.T.; Abdel-Rahman, E. Identifying poses of safe and productive masons using machine learning. Autom. Constr. 2017, 84, 345–355. [Google Scholar] [CrossRef]
  32. Tixier, A.J.-P.; Hallowell, M.R.; Rajagopalan, B.; Bowman, D. Application of machine learning to construction injury prediction. Autom. Constr. 2016, 69, 102–114. [Google Scholar] [CrossRef] [Green Version]
  33. Caggiari, S.; Worsley, P.R.; Payan, Y.; Bucki, M.; Bader, D.L. Biomechanical monitoring and machine learning for the detection of lying postures. Clin. Biomech. 2020, 80, 105181. [Google Scholar] [CrossRef] [PubMed]
  34. Zemp, R.; Tanadini, M.; Plüss, S.; Schnüriger, K.; Singh, N.B.; Taylor, W.R.; Lorenzetti, S. Application of machine learning approaches for classifying sitting posture based on force and acceleration sensors. BioMed Res. Int. 2016, 2016, 5978489. [Google Scholar] [CrossRef] [Green Version]
  35. Begg, R.; Kamruzzaman, J. A machine learning approach for automated recognition of movement patterns using basic, kinetic and kinematic gait data. J. Biomech. 2005, 38, 401–408. [Google Scholar] [CrossRef] [PubMed]
  36. Hu, B.; Dixon, P.; Jacobs, J.; Dennerlein, J.; Schiffman, J. Machine learning algorithms based on signals from a single wearable inertial sensor can detect surface-and age-related differences in walking. J. Biomech. 2018, 71, 37–42. [Google Scholar] [CrossRef]
  37. Baghdadi, A.; Megahed, F.M.; Esfahani, E.T.; Cavuoto, L.A. A machine learning approach to detect changes in gait parameters following a fatiguing occupational task. Ergonomics 2018, 61, 1116–1129. [Google Scholar] [CrossRef]
  38. Dutta, A.; Breloff, S.P.; Dai, F.; Sinsel, E.W.; Warren, C.M.; Wu, J.Z. Automated phase identification in shingle installation operation using machine learning. In Proceedings of the 9th International Conference on Construction Engineering and Project Management, Las Vegas, NV, USA, 20–23 June 2022; pp. 728–735. [Google Scholar]
  39. Pollard, J.P.; Porter, W.L.; Redfern, M.S. Forces and moments on the knee during kneeling and squatting. J. Appl. Biomech. 2011, 27, 233–241. [Google Scholar] [CrossRef] [Green Version]
  40. Robertson, D.G.E.; Caldwell, G.E.; Hamill, J.; Kamen, G.; Whittlesey, S. Research Methods in Biomechanics; Human Kinetics: Champaign, IL, USA, 2013. [Google Scholar]
  41. Jiang, S.; Pang, G.; Wu, M.; Kuang, L. An improved K-nearest-neighbor algorithm for text categorization. Expert Syst. Appl. 2012, 39, 1503–1509. [Google Scholar] [CrossRef]
  42. Khoshgoftaar, T.M.; Golawala, M.; Van Hulse, J. An empirical study of learning from imbalanced data using random forest. In Proceedings of the 19th IEEE International Conference on Tools with Artificial Intelligence (ICTAI 2007), Patras, Greece, 29–31 October 2007; pp. 310–317. [Google Scholar]
  43. Rodriguez-Galiano, V.F.; Ghimire, B.; Rogan, J.; Chica-Olmo, M.; Rigol-Sanchez, J.P. An assessment of the effectiveness of a random forest classifier for land-cover classification. ISPRS J. Photogramm. Remote Sens. 2012, 67, 93–104. [Google Scholar] [CrossRef]
  44. Anifowose, F.A.; Labadin, J.; Abdulraheem, A. Non-linear feature selection-based hybrid computational intelligence models for improved natural gas reservoir characterization. J. Nat. Gas Sci. Eng. 2014, 21, 397–410. [Google Scholar] [CrossRef]
  45. Tu, P.; Li, J.; Wang, H.; Cao, T.; Wang, K. Non-linear chaotic features-based human activity recognition. Electronics 2021, 10, 111. [Google Scholar] [CrossRef]
  46. Kotsiantis, S.B. Decision trees: A recent overview. Artif. Intell. Rev. 2013, 39, 261–283. [Google Scholar] [CrossRef]
  47. Grabmeier, J.L.; Lambe, L.A. Decision trees for binary classification variables grow equally with the Gini impurity measure and Pearson’s chi-square test. Int. J. Bus. Intell. Data Min. 2007, 2, 213–226. [Google Scholar] [CrossRef]
  48. Breiman, L. Random forests. Mach. Learn. 2001, 45, 5–32. [Google Scholar] [CrossRef] [Green Version]
  49. Oshiro, T.M.; Perez, P.S.; Baranauskas, J.A. How many trees in a random forest? In International Workshop on Machine Learning and Data Mining in Pattern Recognition; Springer: Berlin/Heidelberg, Germany, 2012; pp. 154–168. [Google Scholar]
  50. Roussopoulos, N.; Kelley, S.; Vincent, F. Nearest neighbor queries. In Proceedings of the 1995 ACM SIGMOD International Conference on Management of Data, San Jose, CA, USA, 22–25 May 1995; pp. 71–79. [Google Scholar]
  51. Liu, H.; Zhang, S. Noisy data elimination using mutual k-nearest neighbor for classification mining. J. Syst. Softw. 2012, 85, 1067–1074. [Google Scholar] [CrossRef]
Figure 1. Seven phases of the shingle installation process.
Buildings 13 01552 g001
Figure 2. Schematic view of methodology.
Buildings 13 01552 g002
Figure 3. Training and evaluation process of each classifier. The solid boxes and the dashed boxes indicate the proportion of data used for training and testing, respectively, in the 10-fold cross-validation process.
Buildings 13 01552 g003
Figure 4. Cross validation accuracy vs. number of neighbors plot for KNN.
Buildings 13 01552 g004
Figure 5. Mean cross-validation accuracy vs. number of features used.
Buildings 13 01552 g005
Figure 6. Roofing phase classification performance in terms of F1 scores.
Buildings 13 01552 g006
Table 1. Features and their description.
FeaturesUnitVariable TypeDescriptionRange/Value
Flexion (FL)Degree (deg)NumericalRotation angle of the lower leg about the medio-lateral axis that runs from the left to the right of the leg through the knee joint.77° to 163°
Abduction–adduction (AB_AD) 1Degree (deg)NumericalRotation angle of the lower leg with respect to the anterior–posterior axis that runs from the front to the back of the leg through the knee joint.−18° to 18°
Internal–external rotation (IN_EX) 1Degree (deg)NumericalRotation angle of the knee joint about the longitudinal axis that passes vertically along the leg in an upright standing position.−22° to 32°
Roof slope (S)Degree (deg)CategoricalThe slope of the roof at which the roofers operated the shingle installation. A coded value was assigned for each slope. The value 1 was for 0°, 2 was for 15°, and 3 was for the 30° slope.0°, 15°, and 30°
1 For AB_AD and IN_EX, negative values indicate adduction and external rotation, respectively.
Table 2. Feature combinations.
No. of Input Features in a SubsetInput Feature Subsets
1FL
AB_AD
IN_EX
S
2FL + AB_AD
FL + IN_EX
AB_AD + IN_EX
FL + S
AB_AD + S
IN_EX + S
3FL + AB_AD + IN_EX
S + FL + AB_AD
S + FL + IN_EX
S + AB_AD + IN_EX
4S + FL + AB_AD + IN_EX
Table 3. Class labels for the seven phases.
PhaseClass
Reaching for shinglesP1
Placing shinglesP2
Grasping the nail gunP3
Moving to the first nailing positionP4
Nailing shinglesP5
Replacing the nail gunP6
Returning to an upright positionP7
Table 4. Mean cross-validation accuracy of phase classification.
ClassifierMean Cross-Validation Accuracy ± Standard DeviationLowest Cross-Validation Accuracy (%)
DT87.00 ± 0.005886.63
RF90.87 ± 0.004190.55
KNN92.16 ± 0.004191.79
Table 5. Mean cross-validation accuracy of phase classification using different types of variables.
ClassifierVariables
Kinematics Only (%)Kinematics + Slope (%)
DT83.6187.00
RF87.4290.87
KNN89.6892.16
Table 6. Training and testing time of three classifiers.
ClassifierTraining Time (s)Testing Time (s)
DT1.6320.007
RF31.1460.400
KNN0.1040.401
Table 7. Resulting performance of three classifiers.
ClassifierOverall
Accuracy (%)
F1 ScorePrecision ScoreRecall ScoreKappa Index
DT87.290.87290.87300.87290.8407
RF91.120.91060.91070.91120.8880
KNN92.620.92600.92200.92620.9020
Table 8. Confusion matrix by KNN (k = 1) classifier using four features.
Class Actual Total P r e c i s i o n i  
P1P2P3P4P5P6P7
PredictedP1153425159104316270.943
P2354878797949303251820.941
P3363661349347770.851
P445135115338231113150.877
P512599462933492031280.938
P69243154010542611710.900
P7522075817154916580.934
Total16495120795133730861186168514,858
R e c a l l i 0.9300.9530.8310.8620.9500.8890.919
Table 9. Confusion matrix by RF classifier using 4 features and 100 trees.
Class Actual Total P r e c i s i o n i  
P1P2P3P4P5P6P7
PredictedP1155625441175716640.935
P2584805859572394451980.924
P34606463581037660.843
P453941110542241312690.871
P588215692929732031960.916
P62222714449742111040.882
P76411917828152416610.917
Total17175044807133931141155168214,858
R e c a l l i 0.9060.9530.8000.8250.9410.8430.906
Table 10. F1 scores obtained from the three classifiers applied during training sessions.
ClassifierClasses
P1P2P3P4P5P6P7
DT0.8900.9050.7320.7850.8940.8160.871
RF0.9200.9380.8210.8470.9280.8620.911
KNN0.9360.9470.8410.8690.9440.8940.926
Disclaimer/Publisher’s Note: The statements, opinions and data contained in all publications are solely those of the individual author(s) and contributor(s) and not of MDPI and/or the editor(s). MDPI and/or the editor(s) disclaim responsibility for any injury to people or property resulting from any ideas, methods, instructions or products referred to in the content.

