Article

The Effect of Electric Arc Furnace Dust (EAFD) on Improving Characteristics of Conventional Concrete

1
Departamento de Tecnología de la Edificación, Escuela Técnica Superior de Edificación, Universidad Politécnica de Madrid, 28040 Madrid, Spain
2
Complex Systems Group, Department of Applied Mathematics, Universidad Politécnica de Madrid. Av. Juan de Herrera 6, 28040 Madrid, Spain
*
Authors to whom correspondence should be addressed.
Buildings 2023, 13(6), 1526; https://doi.org/10.3390/buildings13061526
Submission received: 16 May 2023 / Revised: 8 June 2023 / Accepted: 12 June 2023 / Published: 14 June 2023
(This article belongs to the Special Issue New Challenges in Building Innovation Technologies and Management)

Abstract

:
The steel industry is one of the key industries and its use is inevitable in many industries including construction. In addition to steel, this industry produces massive amounts of electric arc furnace dust (EAFD) that is classified as hazardous waste. Using this material as an admixture can improve the characteristics of concrete, neutralize potential risks and be beneficial to the circular economy. Considering the differences in EAFD between different steel companies, which in turn is caused by the type and percentage of input materials, the optimal percentage and specific application of EAFD from steel companies of each region is unique. In the present study, samples from 11 different sources of EAFD in Khuzestan Steel Company (KSC) were collected. Then, they were classified into three groups depending on the size and origin (fine and coarse, both obtained by filtering those particle sizes directly from furnaces, and a third class obtained in the interior of the steelmaking site close to material handling (MH) belt conveyors) based on their physical and chemical characteristics. To test the effect of EADF as an admixture, several conventional concrete samples were prepared by replacing 0% (control), 2%, 5% and 8% of cement with each EAFD group. Finally, the resulting material was characterized through several tests, namely: (i) compressive strength test at 7, 28 and 90 days, (ii) depth of water penetration under pressure test and (iii) electrical indication of concrete’s ability to resist chloride ion penetration. The result shows that replacing 2% of the cement with MH caused the largest improvement in compressive strength of 7 day concrete, but also showed negative effect on water penetration, while coarse had a negative effect in almost all tests except in the chloride ion penetration test. The best results were obtained by replacing with 2% of cement with fine EAFD, showing significant improvements in all tests, as well as in the observed trend of increasing compressive strength over time.

1. Introduction

Today’s industry produces large amounts of waste during the material conformation processes in both manufacturing processes and many sorts of production [1], this being a significant environmental challenge on a global scale [2,3,4]. Understanding the potential effects of waste, whether it is urban or industrial, will help environmental protection protocols. In turn, new material-recycling procedures add a fundamental economic and social dimension to the circular economy and environmental health that will enable us to optimally balance between sustainable development and the environmental interests of future generations [1,5]. It is widely accepted that most waste materials are inherently valuable, but it is crucial to fully understand how to best extract such value [6].
Electric-arc furnace dust (EAFD) is an unwanted byproduct substance produced by the electric-arc furnace (EAF) method during the steelmaking process [2,7,8,9,10,11] at an average of 1% to 2% of the overall output of steel [2,11,12,13]. Many of the elements included in iron scraps, such as Zn, Fe, Cr, Mn, and Pb, can be volatile at temperatures as high as 1600 °C during the process of melting. This vapor phase generates a significant amount of undesired powder known as electric arc furnace dust (EADF) as the furnace cools [14,15,16,17]. This industrial byproduct is collected using a baghouse dust collection system in contemporary furnaces. A total of 1808 Mt of crude steel was produced globally in 2018, whereas the overall production was 1869.9 Mt in 2019 [18] and 1950 Mt in 2021 [19]. The electric arc furnace (EAF) method is estimated to account for about 33% of total steel production [12,13,20]. According to estimates, an EAF produces 10–20 kg of dust for every ton of steel made from iron wastes [14,15,21,22,23,24]. Every year, the world produces around 7.5 million tons of EAFD, only 45% of which is recycled [25,26].
Depending on the particular conditions affecting each EAF process, such as feedstock composition, furnace temperature, production duration, and the type of furnace employed, EAFD composition may change on a daily basis [8,22]. EADF substances are categorized as hazardous waste, so they may be treated [9,13,22,27,28,29,30]. After being treated with encapsulation, approximately 70% of the EAFD generated worldwide is headed for landfilling, with the other 30% being used for metal recovery [15,16,31,32]. Monolithic blocks that are mechanically and chemically stable are the goal of EAFD encapsulation approaches. Due to the comprehensive knowledge of this material, its availability, and its good long-term physical and chemical stability, using standard Portland cement is typically the method that is most frequently suggested in the encapsulation process of EAFD [16,33]. However, it’s not always chemically possible to immobilize heavy metals from EAFD [16,34]. One important strategy for achieving integrated ecological and sustainable productivity across all economic sectors is the conversion of trash into new raw materials. This could mitigate the detrimental effects of local trash disposal, including landscape degradation, water contamination, and air pollution [3,4].
Recycling waste materials to make concrete is a reliable and environmentally friendly way to lower the cement content of concrete. As a result, it reduces greenhouse gas emissions [35,36]. Due to the significant depletion of high-grade iron mineral reserves, together with the mining of deposits with lower grades and complex compositions, recycling of iron-containing wastes is an appealing alternative at the moment [25,37]. However, the additional treatment of the leftovers is challenging and has negative environmental effects [38]. There are now a number of research contributions published about the potential use of steel slags as an addition to or replacement for cement in concrete [1,39]. When compared to the reference concrete mixture, certain investigations have demonstrated that adding EAFD to concrete has improved mechanical properties and durability ability. Other research articles examined how introducing EAFD into concrete mixtures influenced mechanical properties and durability [2,31,40,41,42,43,44,45]. In this contribution, we quantitatively investigated the replacement of cement with different percentages of EAFD in concrete. Changes in concrete’s compressive strength at various ages and differing percentages of EAFD replacement were analyzed and compared. We also found that all compounds had controlled rates of chloride and water penetration under pressure. The best percentages were then characterized, and such dust concentrations can be used for practical purposes. Therefore, our results can serve as a technological foundation for future investigations into electric furnace arc dust, as well as for practical applications in construction processes.

2. Materials and Methods

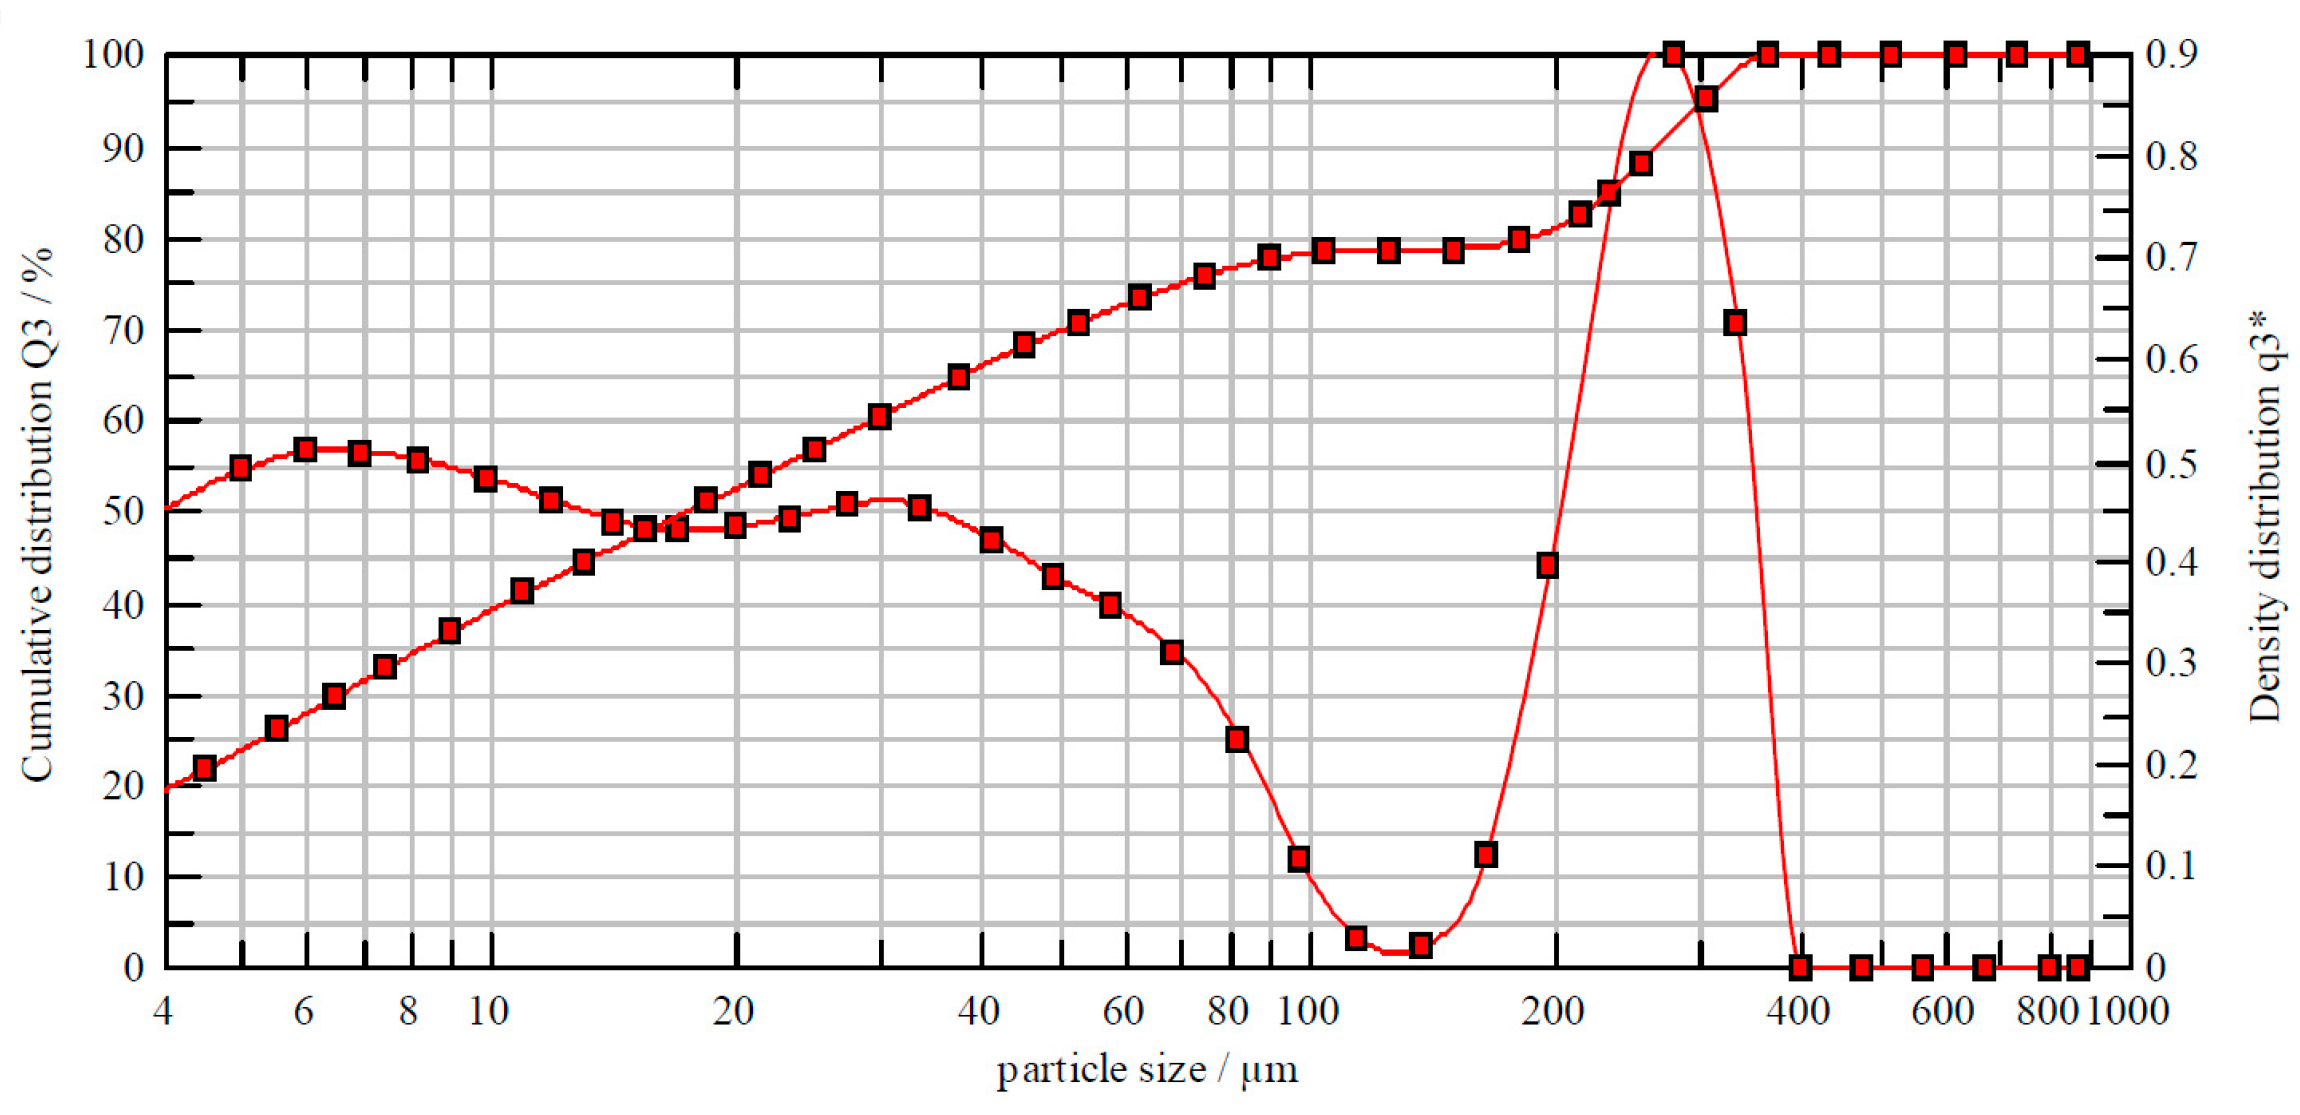
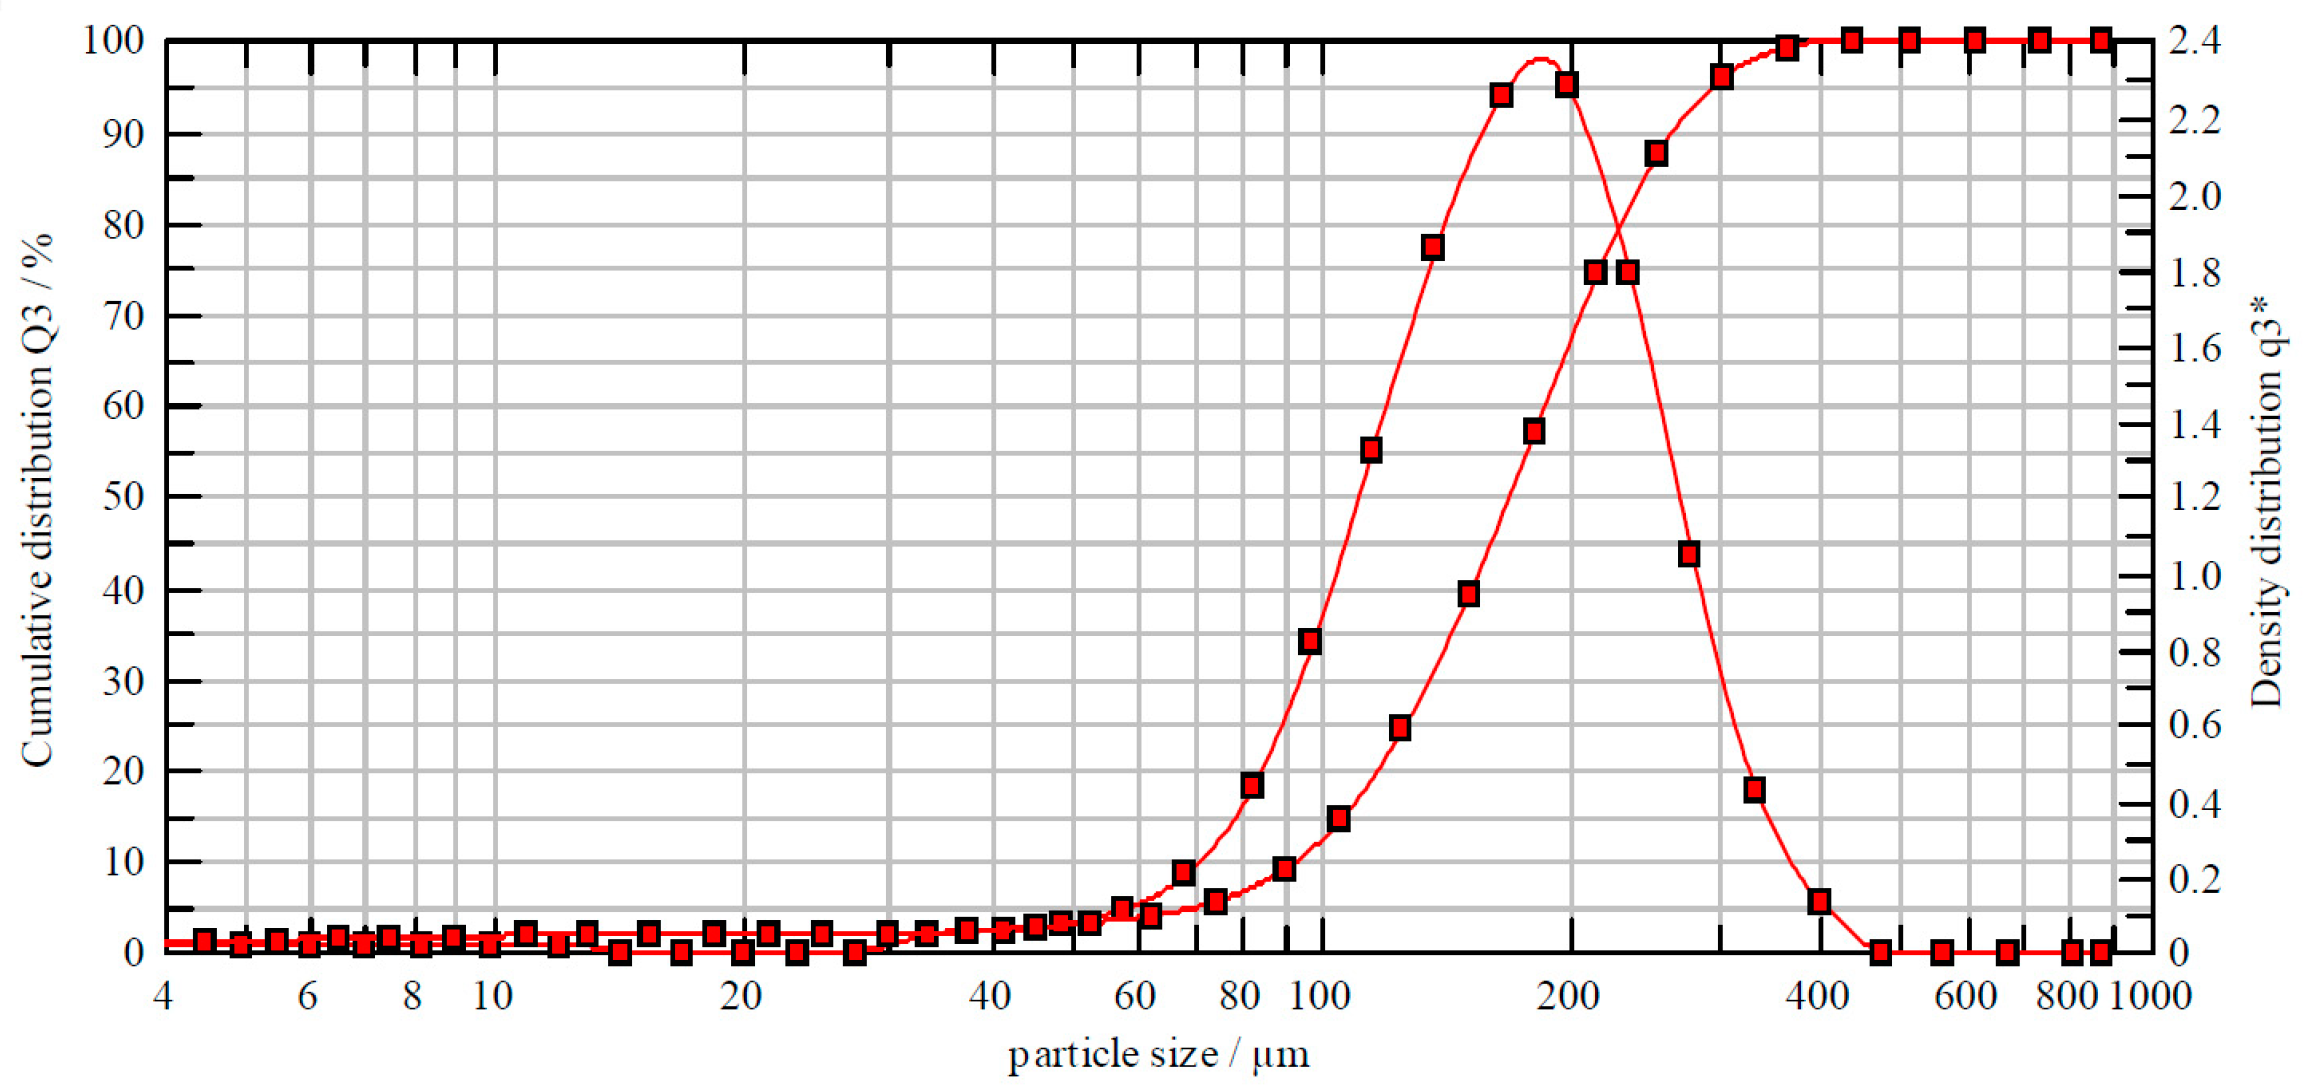
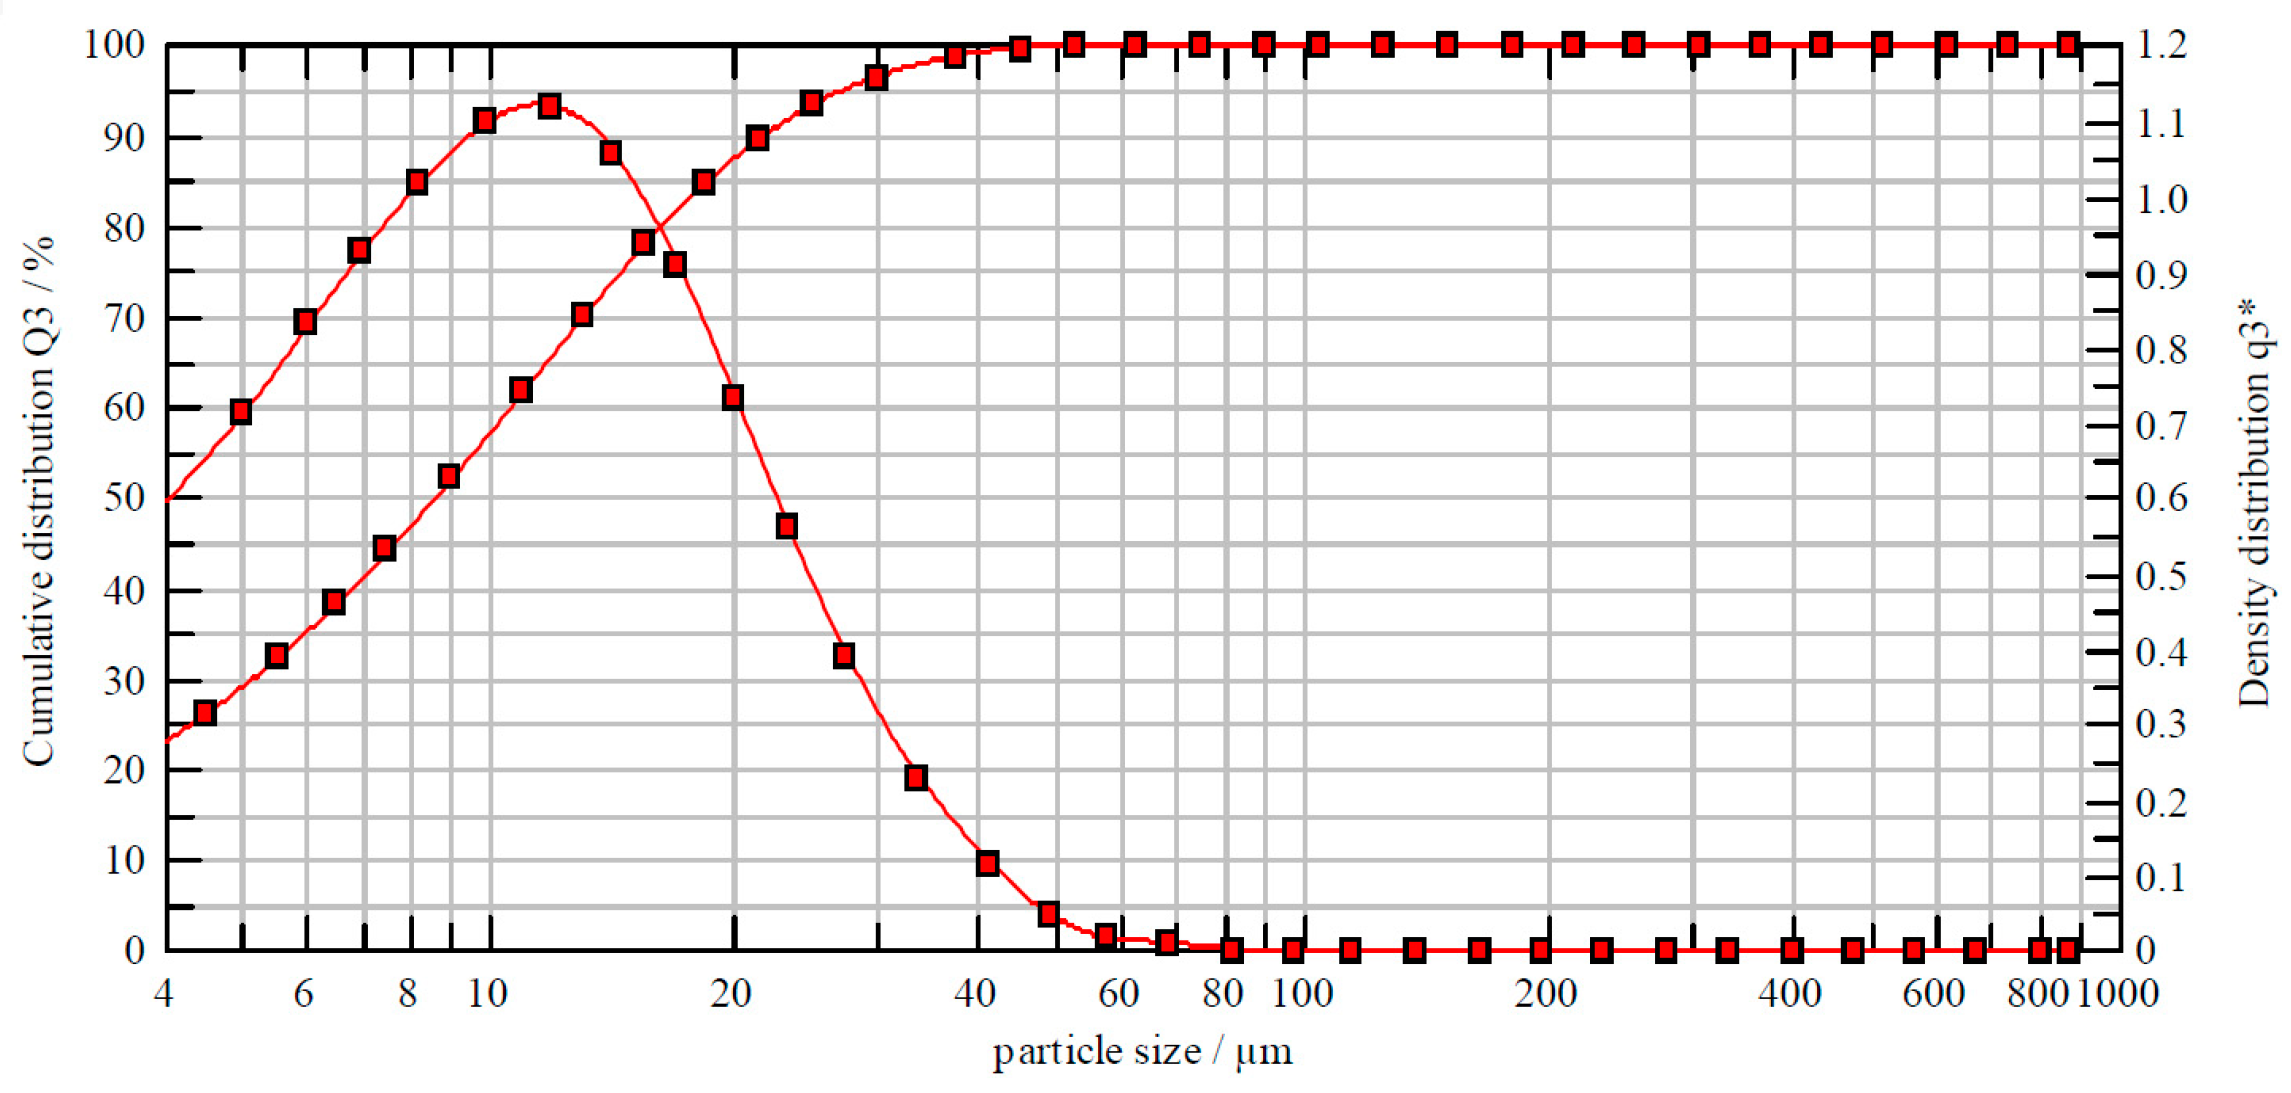
2.1. Material Properties

Every resource used in this contribution was obtained from Iranian local sources. Type II of Portland cement (OPC) based on ASTM C150 [46] was obtained from Khuzestan Cement Company. Drinking water was selected to use in mixture preparations, while sand and gravel were obtained from neighborhood mines. Due to its high amount of EAFD production (more than 100 tons a day), Khuzestan Steel company (KSC) was selected as the EAFD source. In that company, there are six furnaces, each of which is connected to an industrial dust collection system (baghouse). Consequently, there are six sources of fine-sized EAFD material related to six furnaces (we name this class of material fine). Table 1 shows the chemical composition of the class. In addition, three furnaces have filters able to separate coarse-sized particles of EAFD, which introduces an additional class of material named coarse. Thus, there are three sources of coarse EAFD, whose chemical composition is shown in Table 2. The source of fine and coarse is the same (close to furnaces) and they are separated into two sizes by different filters. The third class of EAFD we have used in this study is obtained far from the furnaces, and its source is located in the interior of the steelmaking site close to material handling (MH) belt conveyors. Therefore, other factors such as the dust caused by transporting direct reduced iron (sponge iron) can influence its composition. There are two MHs that filter the air of the steelmaking plant, and the compositional analysis obtained from these sites is shown in Table 3. We name this third class of dust as MH, given the source it comes from.
Overall, 11 sources of EAFD were investigated and characterized. Table 1, Table 2 and Table 3 show some significant differences in the dust composition between different categories of dust depending on the size and the source of the dust. For example, the percentage of SiO2 in fine samples lies between 4.15% and 6.31% (with an average composition of 5.28%), while in coarse samples it lies between 12.83% and 14.46% (average 13.56%), well beyond the small-sized values. Furthermore, the average composition of SiO2 in MH samples is 3.97%, similar to fine samples in composition. Other significant examples are the compositional analysis of Al2O3, showing average abundances of 0.9%, 2.95% and 0.93% for fine, coarse and MH, respectively, or the composition of Fe2O3, yielding average abundances of 47.44%, 42.89% and 82.51% for fine, coarse and MH, respectively.
Consequently, based on the different chemical characteristics of the three groups we have considered, mixing samples from different groups might not be appropriate. However, based on the similarity of dust sources and their related chemical properties, as well as due to limitations in laboratory facilities, it was decided that the samples of each group should be mixed together in equal proportion and the homogenized (average) sample would be used for the continuation of the experiments.
A remarkable difference in dust composition compared of other studies [2,41,47,48] is related to zinc abundance. In those references, the proportion of zinc obtained from samples lay between 10% and 20%. Our samples did not reach such high values of zinc composition: the amount of zinc found in 5 samples (coarse and MH) was close to zero, whereas it was between 1.46% and 3.47% in fine samples.
We further characterized the particle size distributions for each group using homogenized samples, as shown in Figure 1 (fine), Figure 2 (coarse) and Figure 3 (MH). Each figure reports the density distribution function (right vertical axis) together with the cumulative distribution (left vertical axis). Size distribution of fine samples is bimodal: there is a nearly uniform bulk of very small particle sizes up to about 80 μm, and a second peak in sizes of about 200–300 μm, probably due to imperfections in particle filtering. The distribution of coarse samples is unimodal and contains only this second peak. The size distribution of MH samples is also very different from the two other classes, because it is unimodal, but particle sizes are much smaller than the other two (90% of the sample is formed by particles with less than 20 μm size, whereas the fine sample contain only 50% particles less than 20 μm size).
Three different sizes of aggregate were used in mixing composition: coarse gravel (crushed stone with maximum diameter of ¾ inches), fine gravel (crushed stone with maximum diameter of ¾ inches) and sand (crushed sand) as fine aggregate part.

2.2. Mix Design and Designation

Throughout the study, a conventional concrete mixture with a 350 kg/m3 cementitious material content was used. The water to cement (W/C) ratio was kept constant at 0.48 for all mixes. Table 4 displays the mixture employed in this study. The concrete mixtures’ cementitious components were listed in Table 5. To create 10 concrete compositions, the three dosages of 2%, 5%, and 8% were utilized with each of the three homogenized types of EAFD (fine, coarse, and MH), while 0% was used as a control.

2.3. Mixing

An electrically powered tilting concrete mixer was used for mixing. The mixing processes were carried out in compliance with ASTM C192 standard [49]. The mixer’s drum was cleaned, scrubbed, and emptied of extra water prior to mixing. The aggregates and a portion of the mixing water equating to the aggregates’ total absorption water were loaded into the wetted drum mixer. The three different types of homogenized EAFD and the cement mixture were then added to the aggregates, followed by the water used for mixing. Three minutes were spent running the mixer, then a three-minute break. After two minutes, the mixing cycle was restarted to ensure that all the components were thoroughly combined. The entire mixing process took 8 min. After mixing was finished, slump flow was estimated [2].

2.4. Testing Procedures

According to ASTM C143 [50], the initial slump was measured. After capping them with sulfur in accordance with ASTM C617 [51], 150 mm by 300 mm cylindrical specimens were subjected to the compressive strength test in accordance with ASTM C39 [52]. Up to 90 days were allotted for the test. At each age, two cylinders were tested, and the average value is given as the test result.
According to ASTM C1202 [53], a rapid chloride permeability test (RCPT) was conducted. At the curing age of 56 days, cylindrical specimens of 100 mm in diameter and 50 mm in height were subjected to this permeability test. For each mixture, two samples were used, and the average value is given as the test result. By measuring how much electrical current went through the specimens in 6 h, the chloride ion penetration test was carried out. Up to 6 h, the current was measured every 30 min. According to ASTM C1202 [53], the total charge passed throughout the specimens in a given time interval is determined in coulombs. The system’s temperature should not rise above 90 degrees Celsius for safety reasons and to preserve test equipment. The test must be stopped and declared unsuccessful once this temperature is exceeded.
A test for the depth of water penetration under pressure was performed in accordance with BS EN 12390 8 standard [54]. For this test, the specimen must be cubic, cylinder-shaped, or prismatic, with a minimum surface dimension of 150 mm and no other dimensions smaller than 100 mm. The specimen should be put within the device, and 500 Kilopascal of water pressure should be applied for 72 h. In order to detect the presence of water during the test, we frequently checked the surfaces of the test specimen that were not exposed to water pressure. If any leakage was observed, the result’s validity was taken into account. For this test, 15 cm cubic specimens were used after curing for 56 days.

3. Results and Discussion

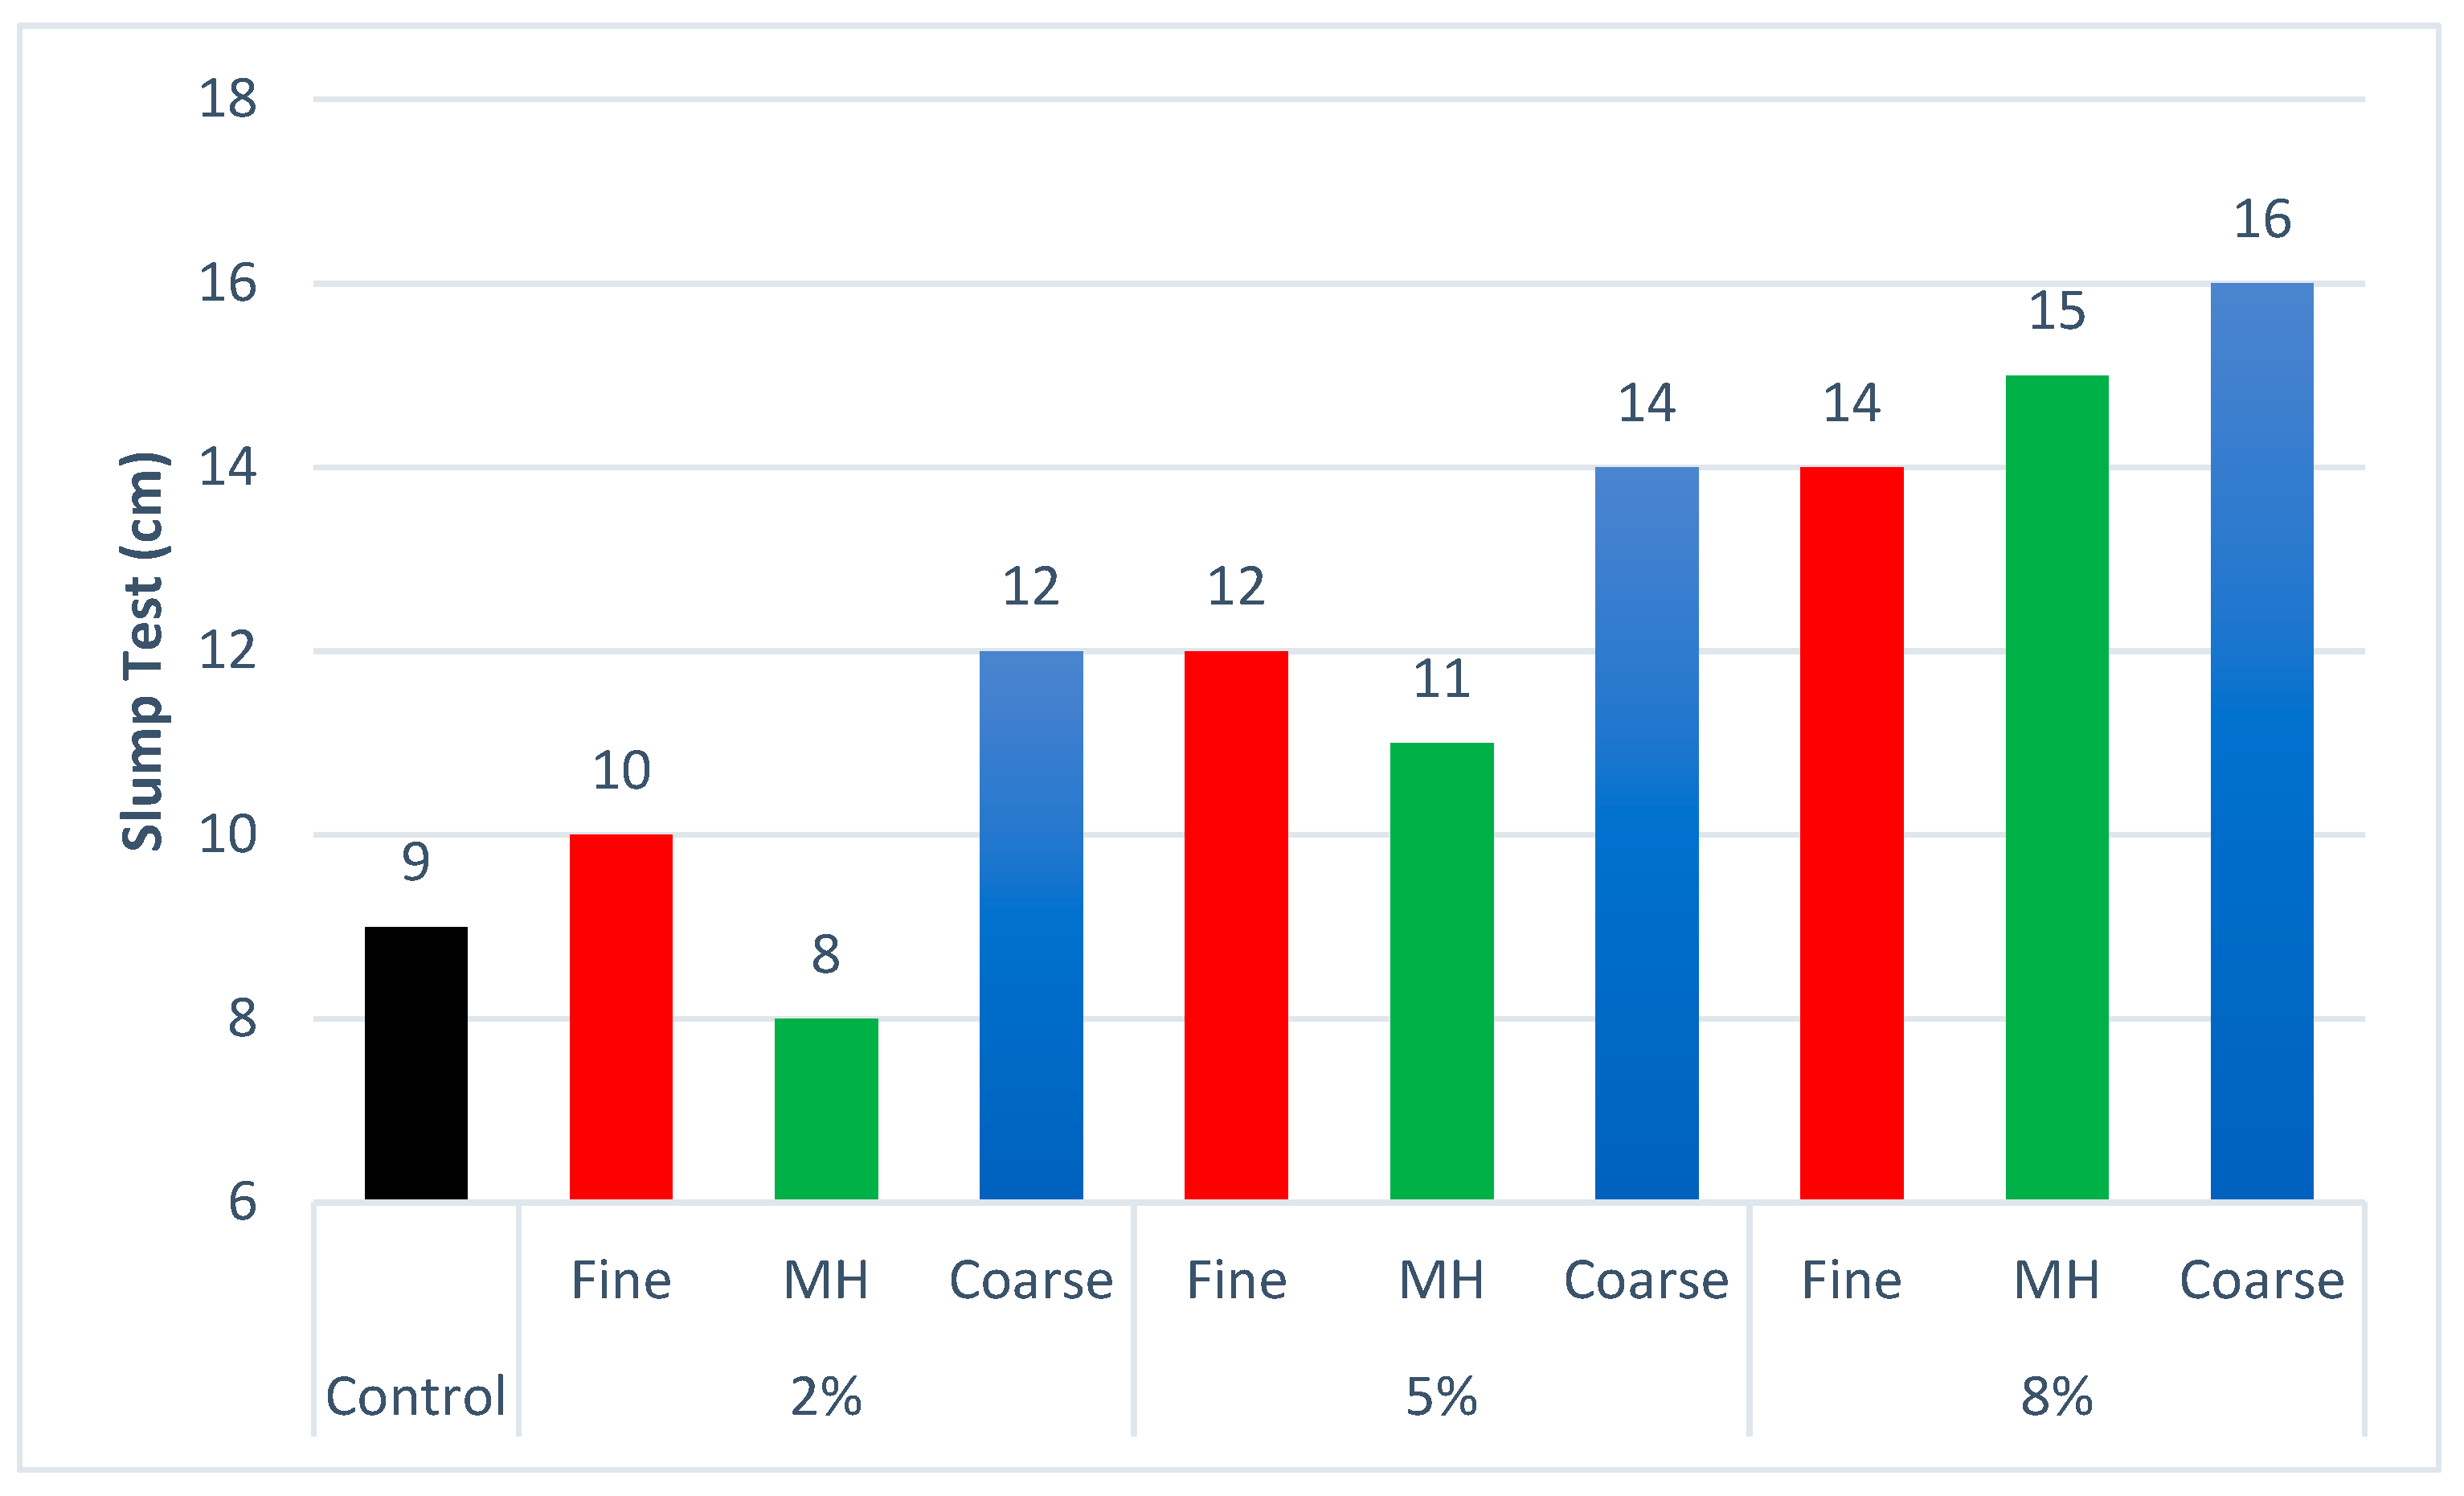
3.1. Effect of EAFD on Slump Test

In order to study the qualities of hardened concrete, regular concrete mixtures with varying concentrations of 0%, 2%, 5%, and 8% containing all three types of EAFD were created. The control mixtures slumped by 9 cm. Replacing cement with all types at all percentages adds slump, except when we replaced a 2% of MH dust type, which reduced slump size by 1 cm. As demonstrated by Figure 4, replacing cement with more EAFD dosage in any type has more effect in adding slump of fresh concrete, and the effect is most important for coarse samples. We observe that replacing 8% of EAFD types could increase the slump magnitude by between 5 and 7 cm. Lubricants are usually used to increase the slump effect, which is used for special applications (such as concreting in thin sections or with a high percentage of reinforcements). Therefore, the addition of EAFD can be considered as having a lubricant effect for the resulting concrete. The lubricating function of EAFD has been confirmed in previous studies (see Refs. [2,31]).

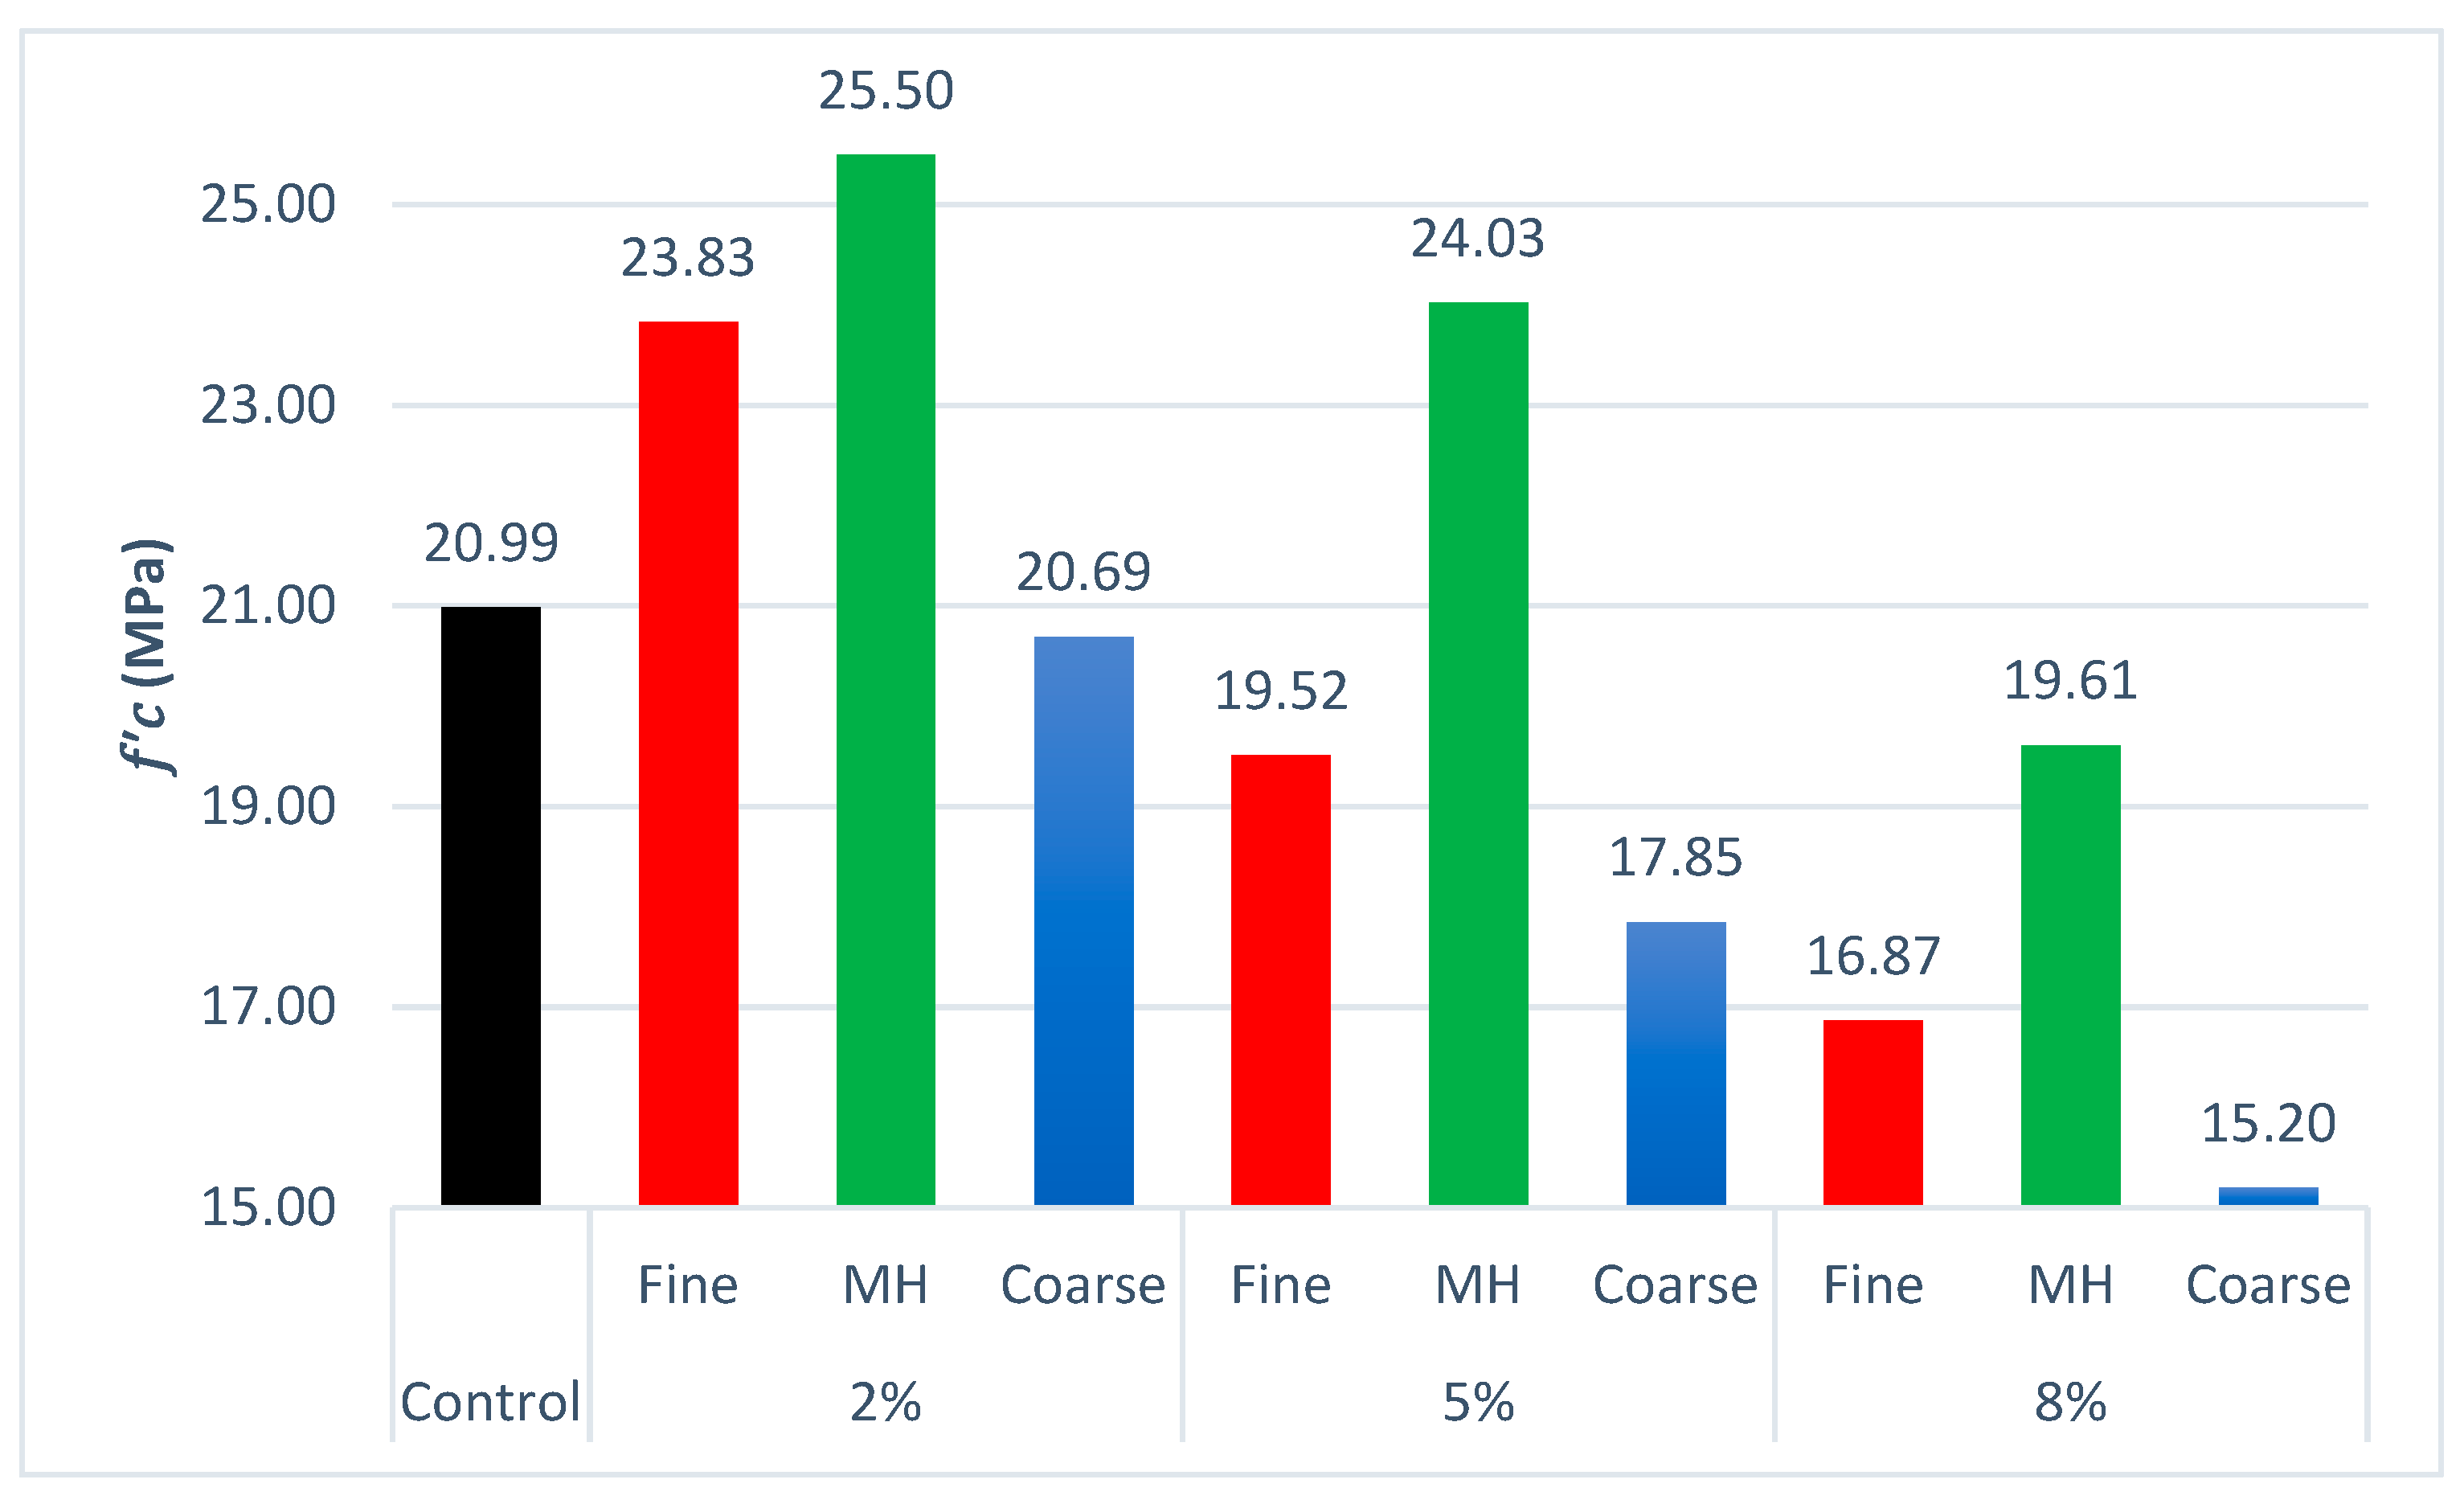
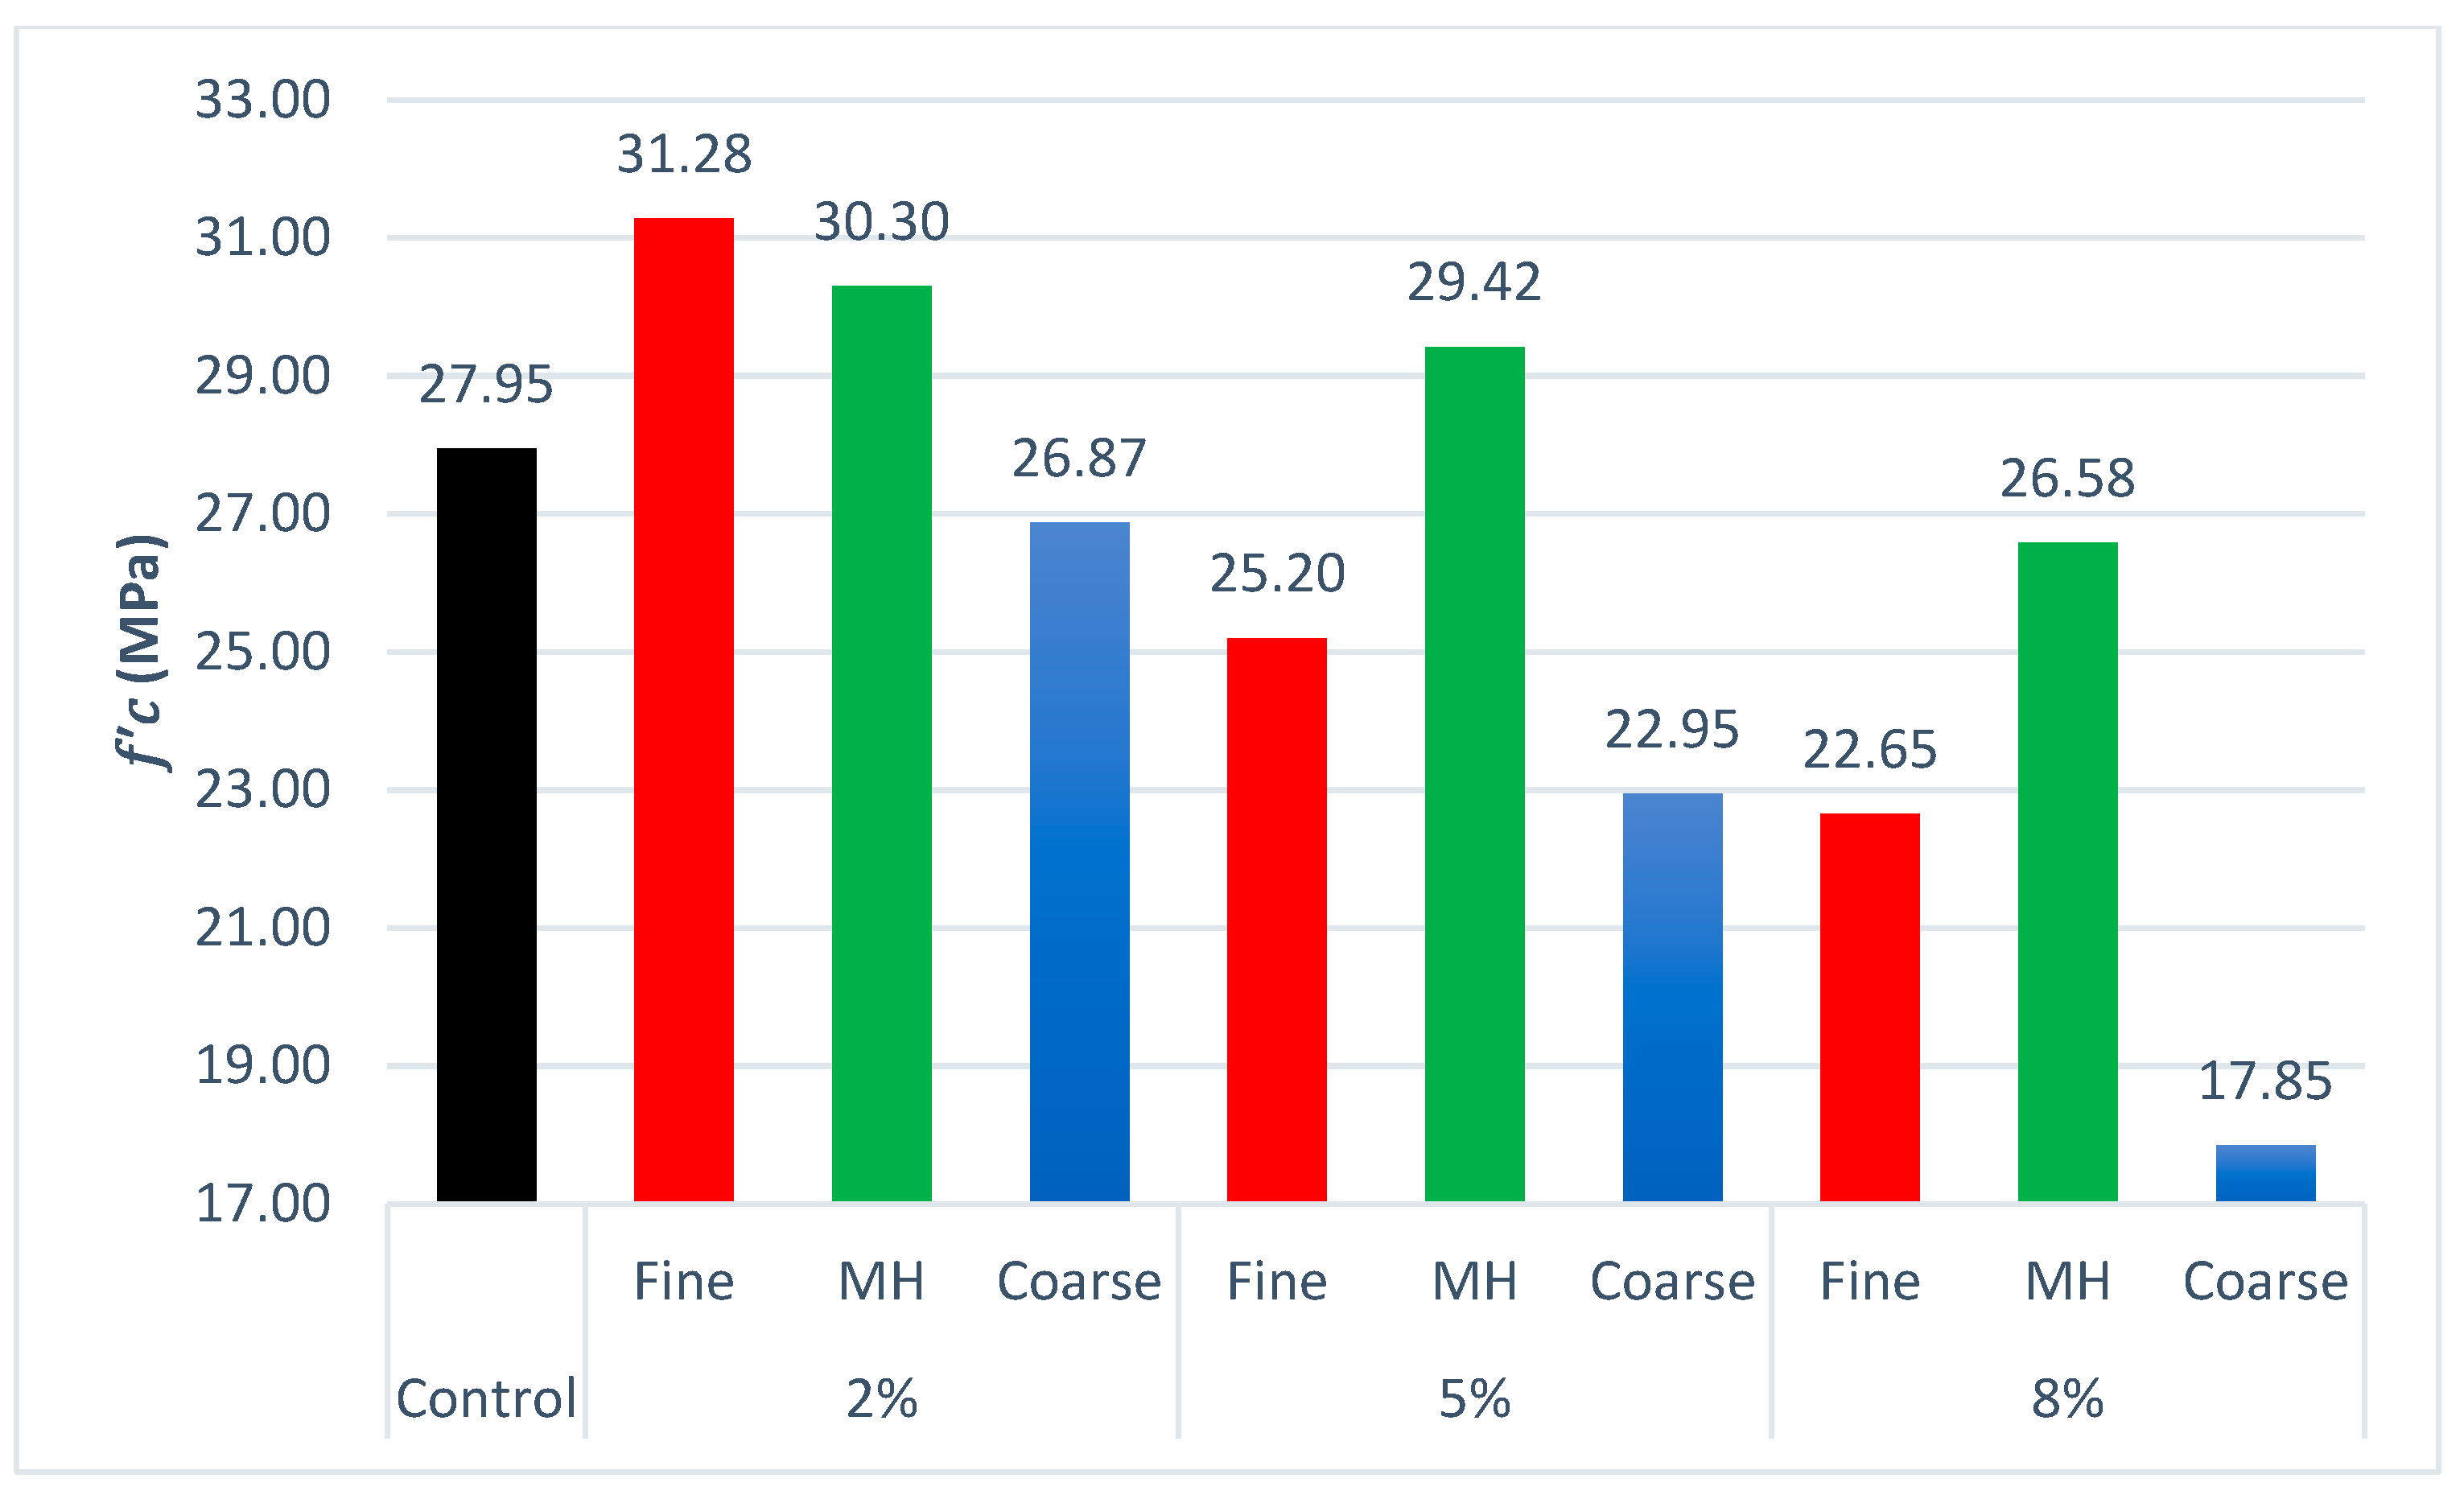
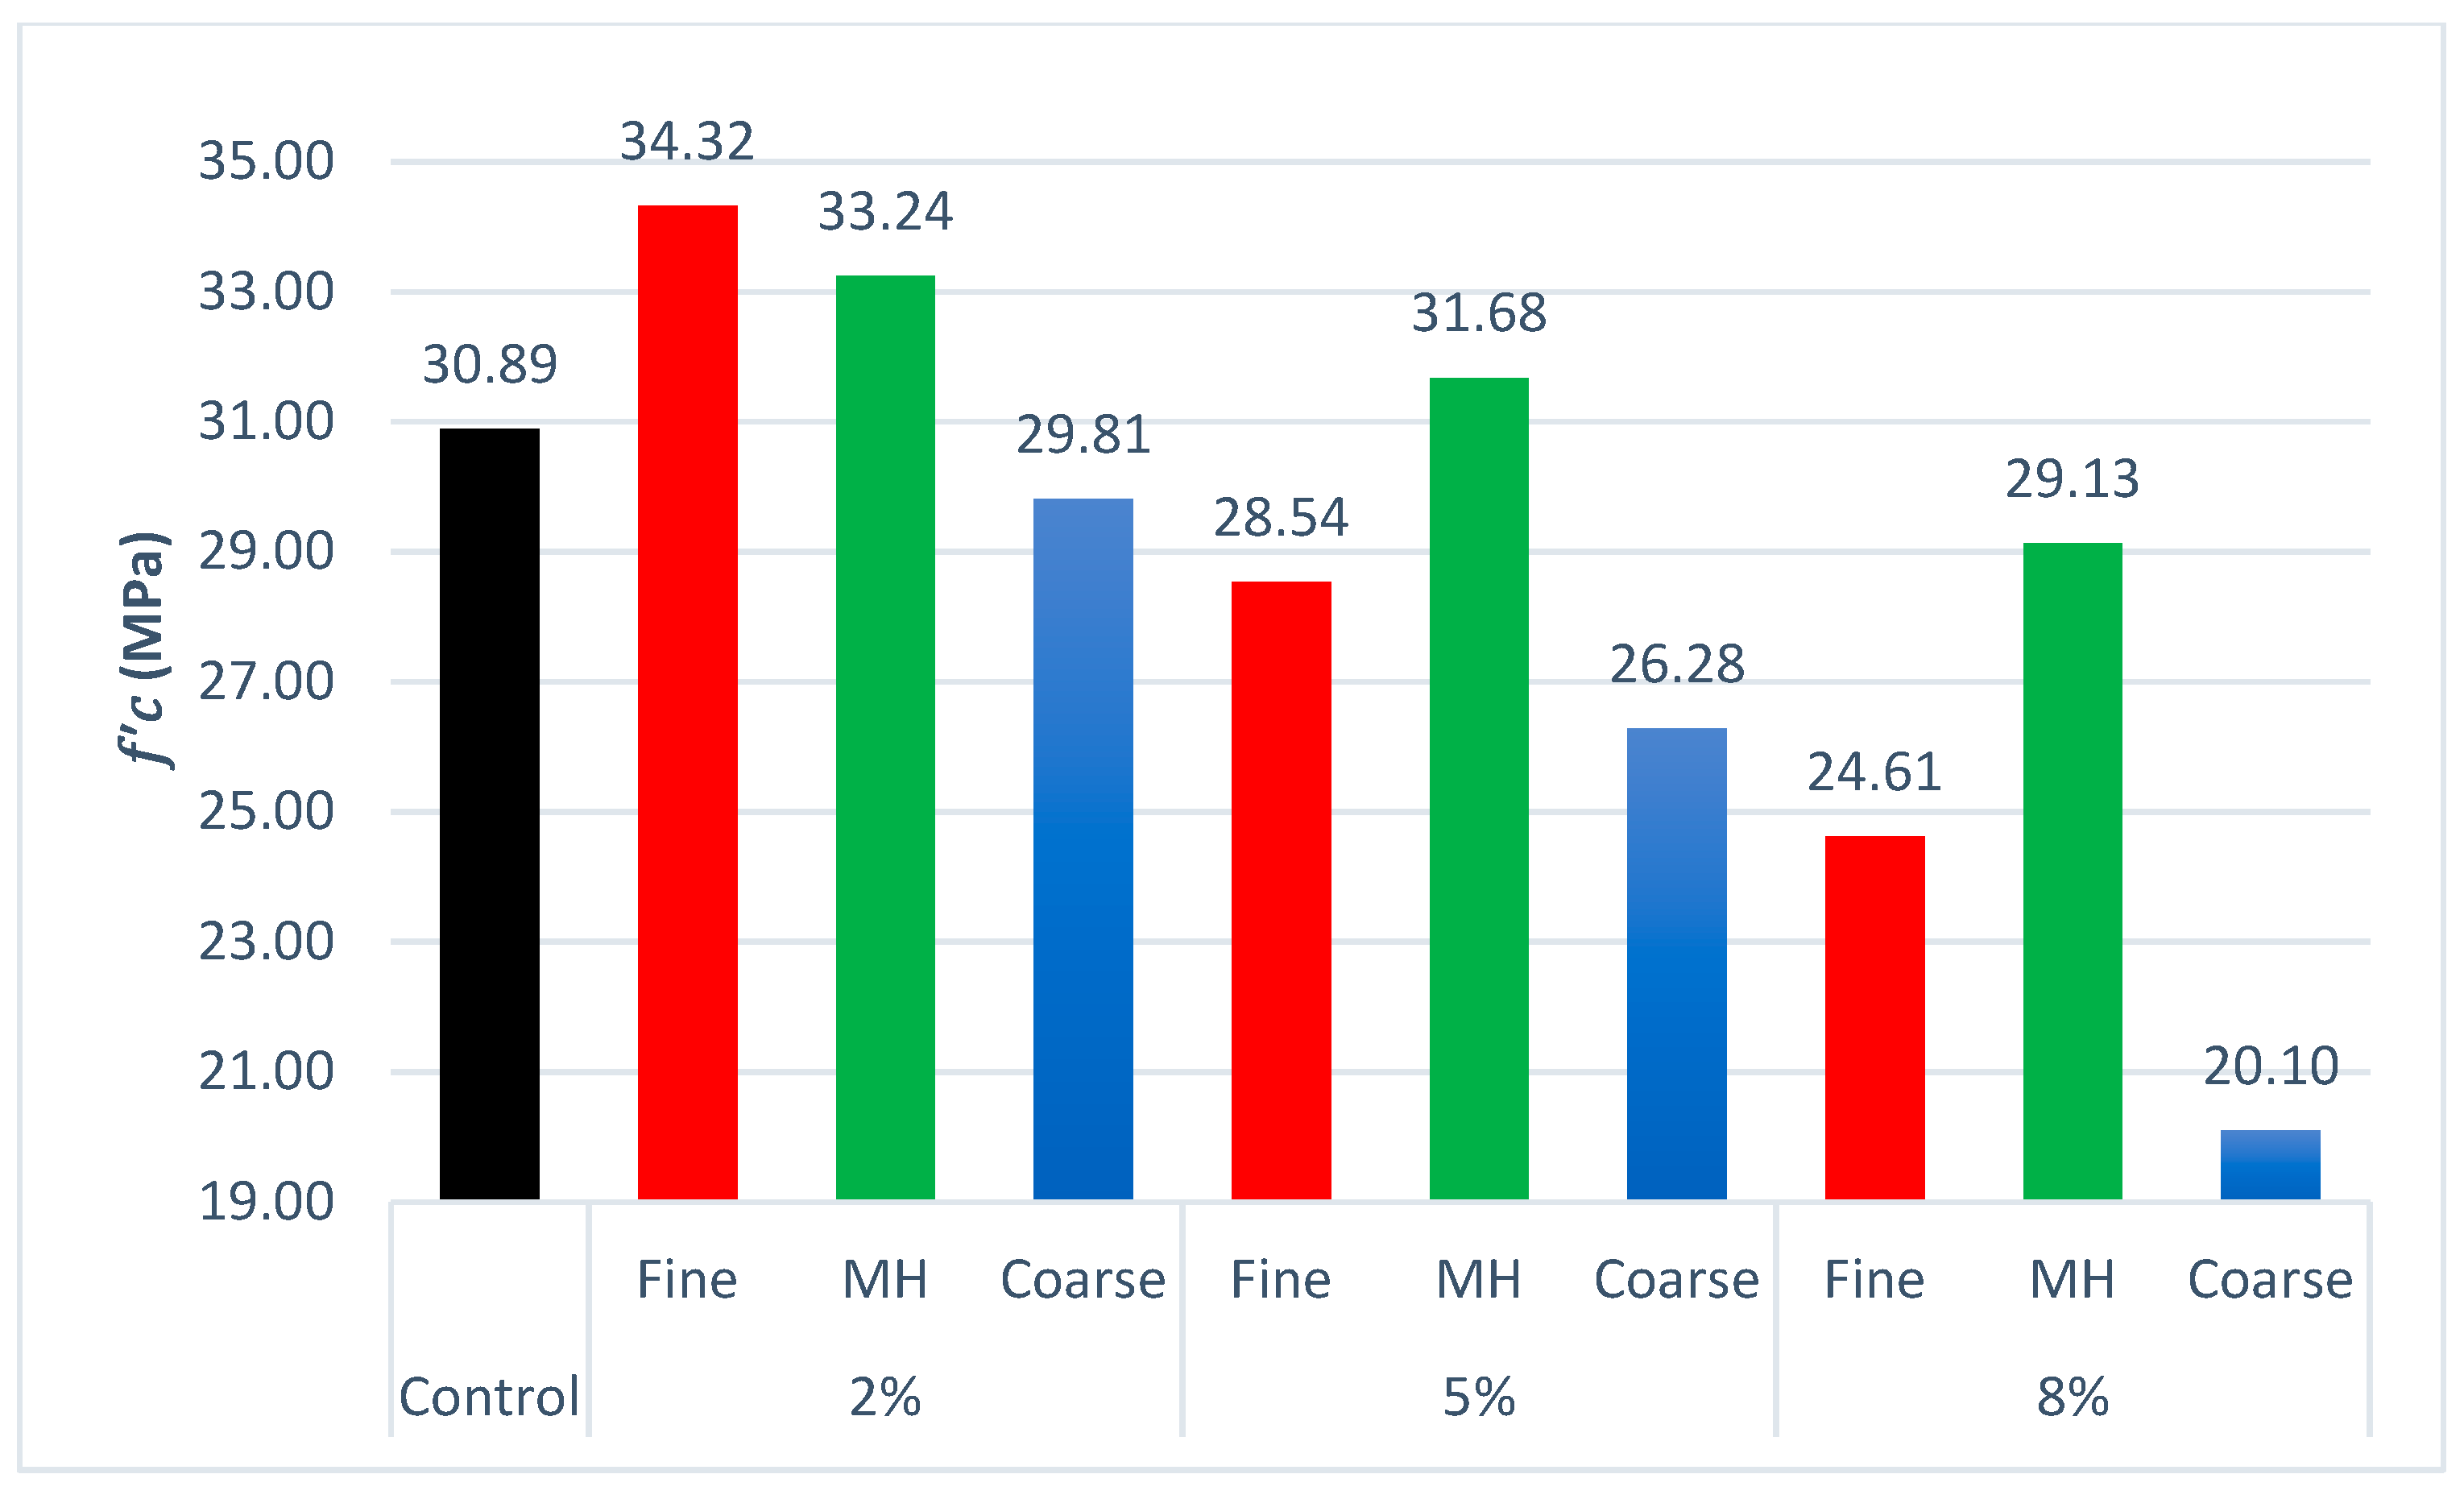
3.2. Effect of EAFD on Concrete Compressive Strength (f′c)

We performed a 7-day compressive strength (fc) of 150 mm by 300 mm cylindrical concrete specimens. The output for the control sample was 20.99 MPa. As shown in Figure 5, replacing 2% of cement with fine and MH types of dust had a positive effect on the strength, while replacing more EAFD mostly has negative effect (except the 5% dosage of MH). After 28 days, the trend remains the same: again, the replacement of a 2% of fine and MH dust has the largest improvement in compressive strength, while an 8% cement replacement with all EAFDs has negative effect, as shown in Figure 6. The only difference between the 7- and 28-day points is that the strongest material after 7 days is the 2% replacement of MH dust, whereas the 2% MH strength value is exceeded by the value of the 2% replacement of fine dust mixture after 28 days. The long-term compressive strength (after 90 days) shows the exact same trend as for the 28 days essay, and again, respectively replacing cement with either 2% of Fine or 2% of MH dust types caused the largest strength improvement. Moreover, replacing cement with of any type of EAFD at 8% dosage had a negative effect, as shown in Figure 7. Previous studies have proven the filler effect and latent pozzolanic reactivity of EAFD [45,55].

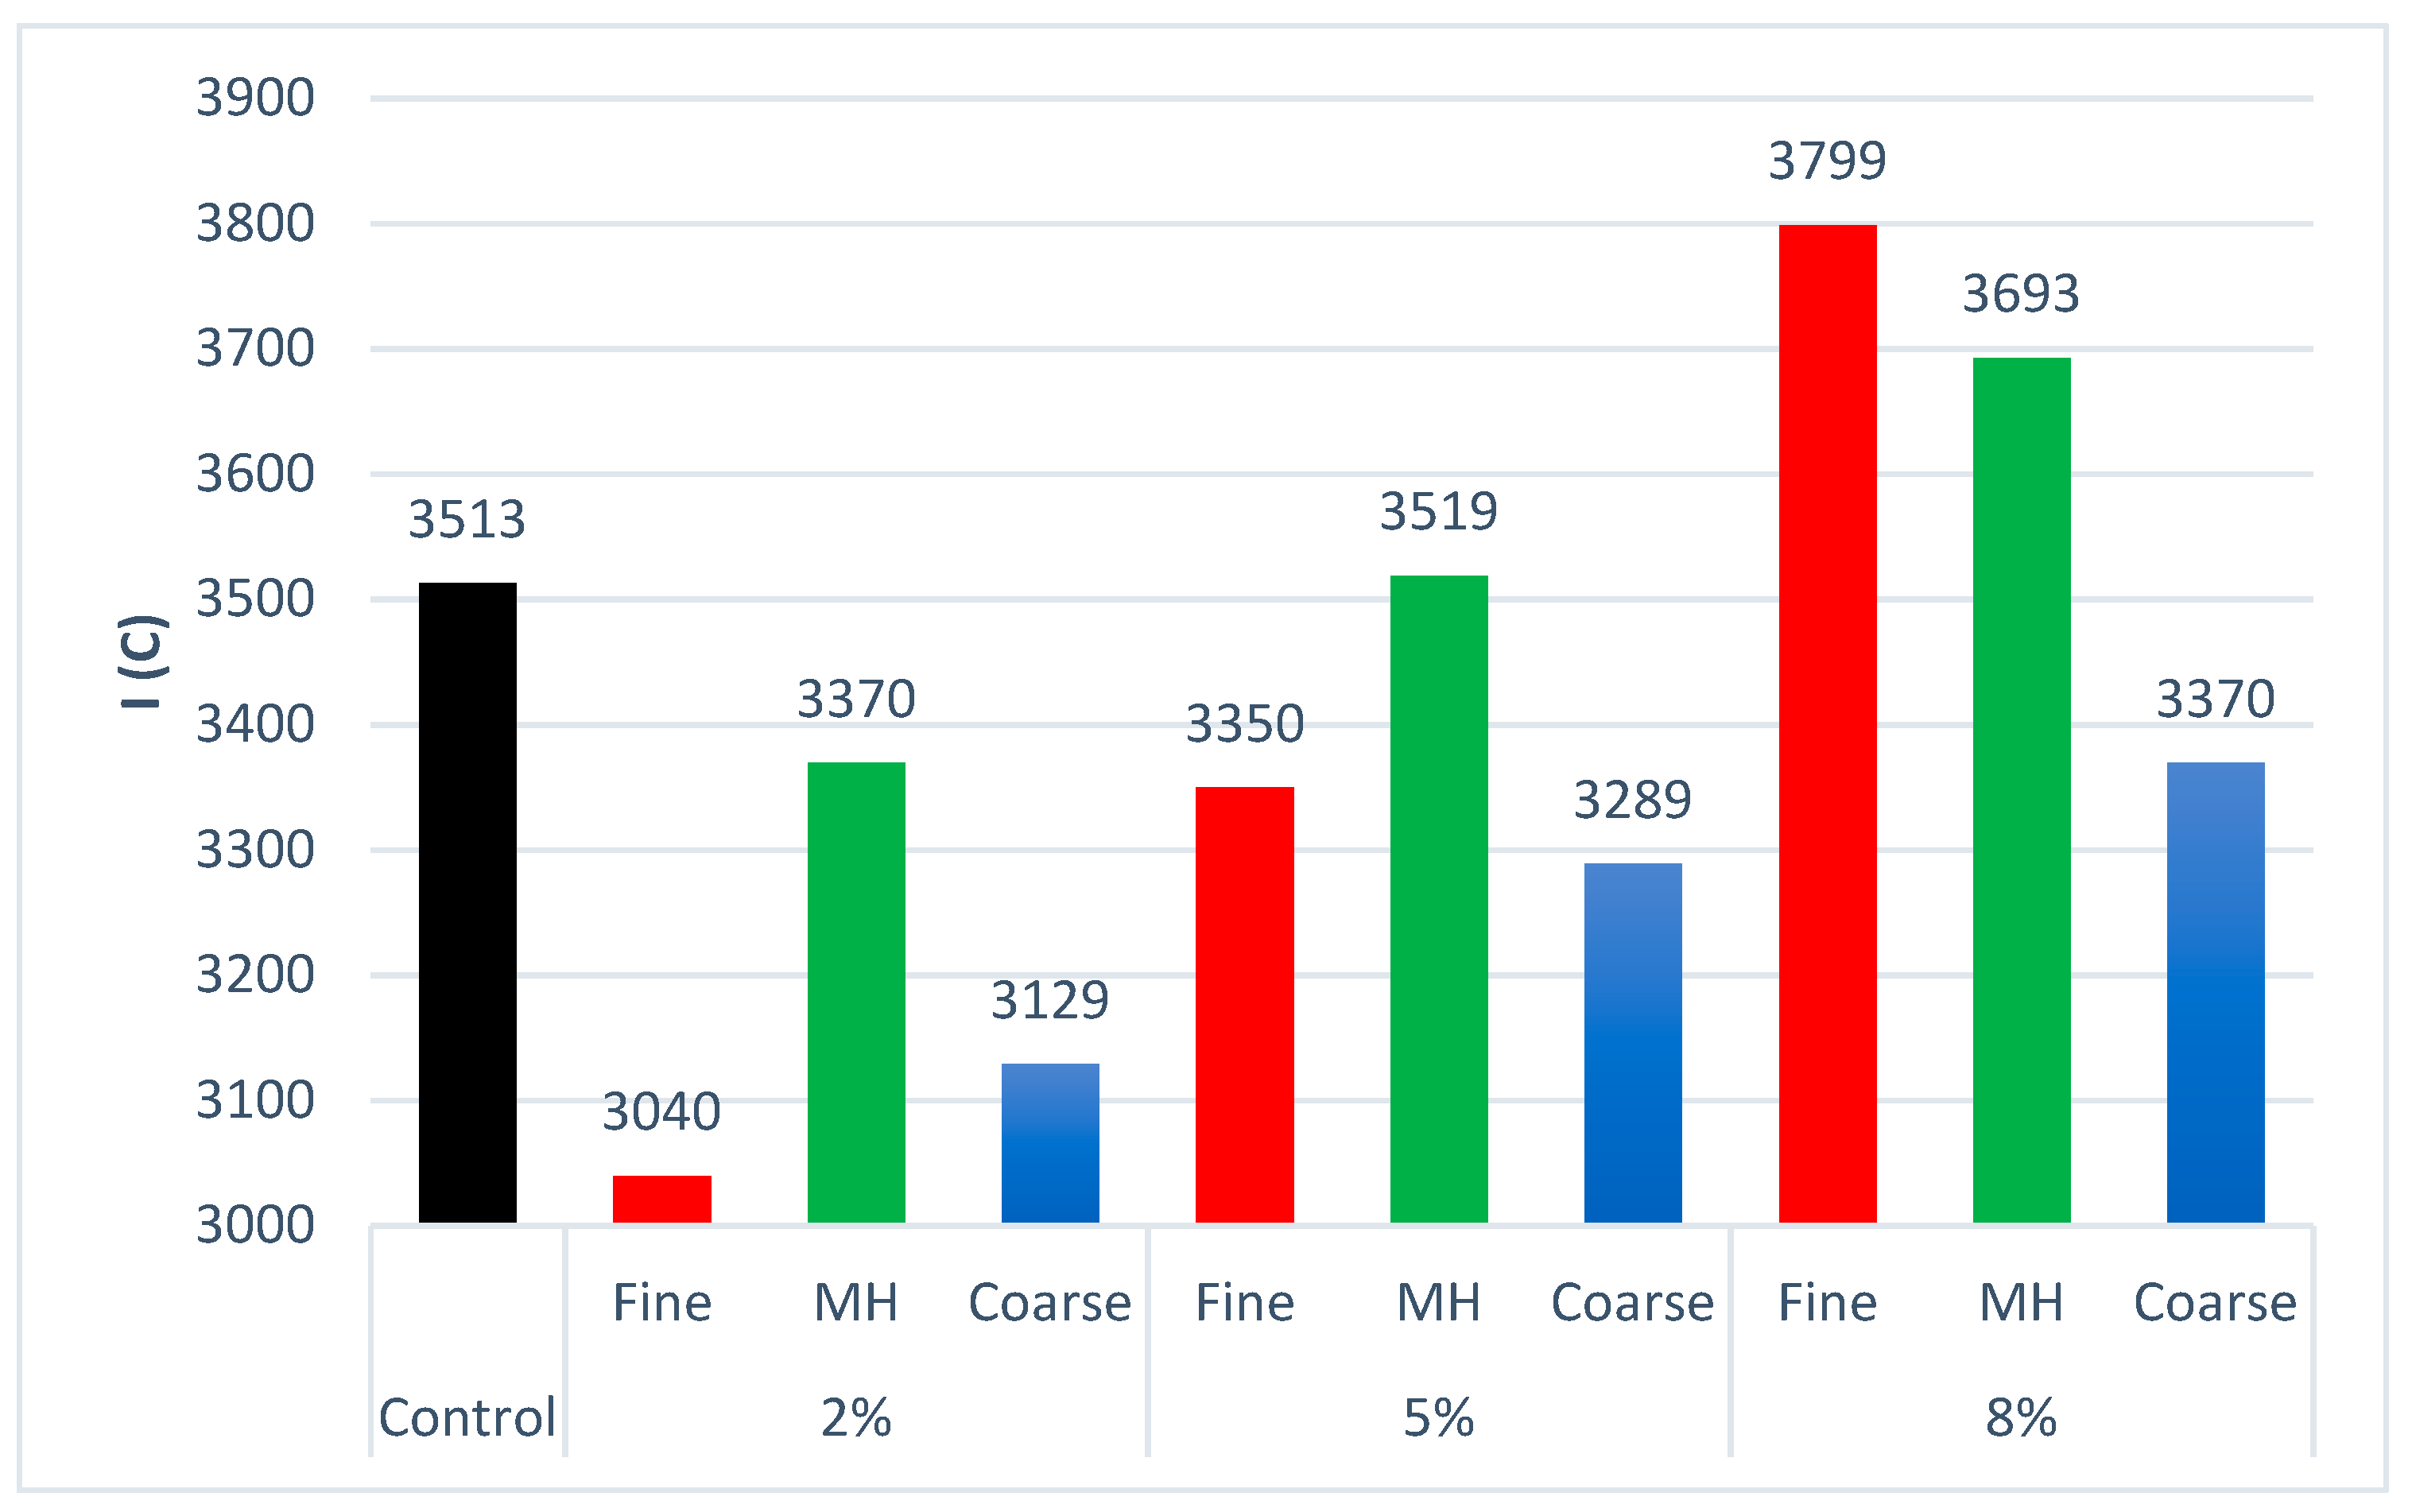
3.3. Effect of EAFD on Rapid Chloride Permeability

A material is substantially more permeable the higher the electrical charge that can travel through it. It is well known that the intensity of electrical charge going through a mortar sample is significantly higher than that in the corresponding concrete one [45,56,57]. A larger conductivity in concrete means that more charge can pass per unit time, and it is more likely to penetrate chloride, having therefore a negative effect on concrete durability. As shown in Figure 8, a 2% of EAFD replacement (of any kind) reduces the charge passing (between 4% and 13.5% in charge reduction). Additionally, replacing cement with 5% of fine and coarse may help reduce chloride penetration, but replacing with 8% dosage of fine and MH shows a negative effect, as depicted in Figure 8. According to previous research, the EAFS-based binder’s denser microstructure accounts for a better resistance to chloride penetration [58,59].

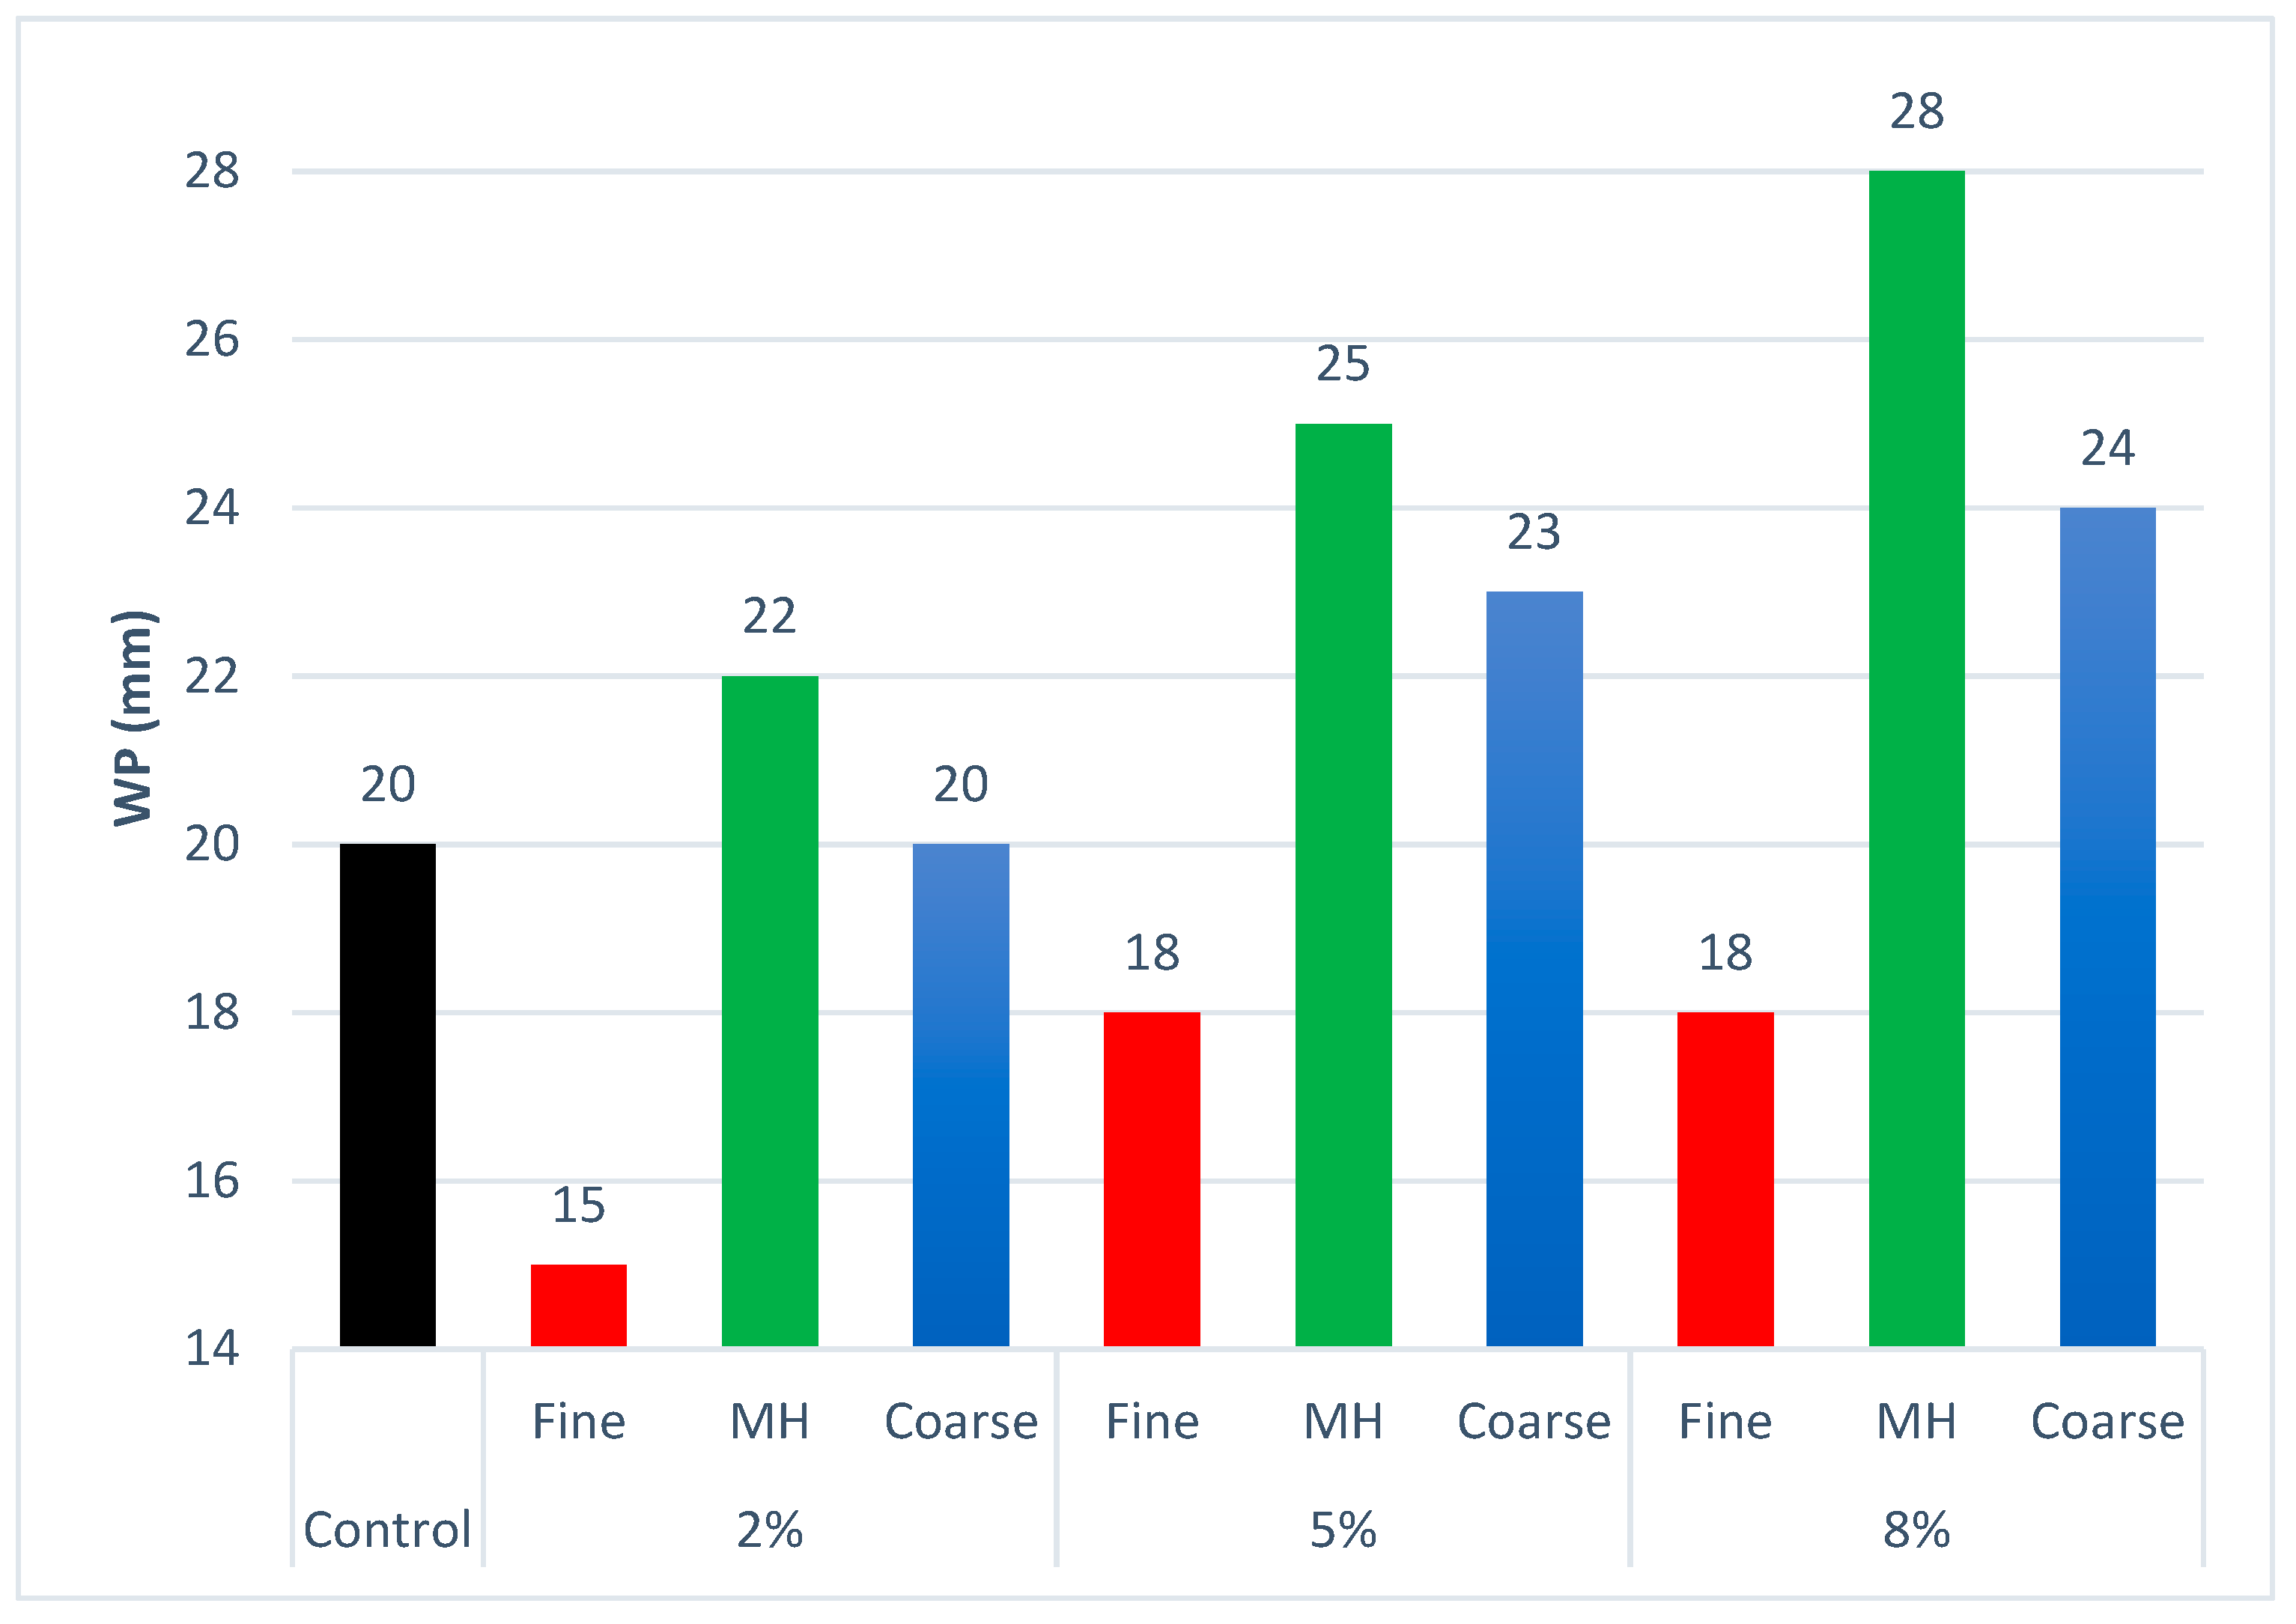
3.4. Effect of EAFD on Water Penetration under Pressure

Having less water penetration (WP) in a material means less water permeability, which implies that concrete can be resistant against some harmful substances soluble in water, consequently yielding more durability. As Figure 9 shows, replacing cement with all MH and coarse types and dosages had negative or no effect on concrete water penetration. The only decrease in water penetration with respect to the control sample was caused by replacing cement with fine dust, the largest effect being achieved by replacing with 2% of fine dust (the depth of water penetration decreased by 5 mm, a 25% reduction of the control value). The decrease in the depth of water penetration obtained in our experiment by replacing with 2%, 5% and 8% Fine dust is similar to that obtained in reference [60], while it is much lower than that obtained in [61], and higher than that obtained in [62].

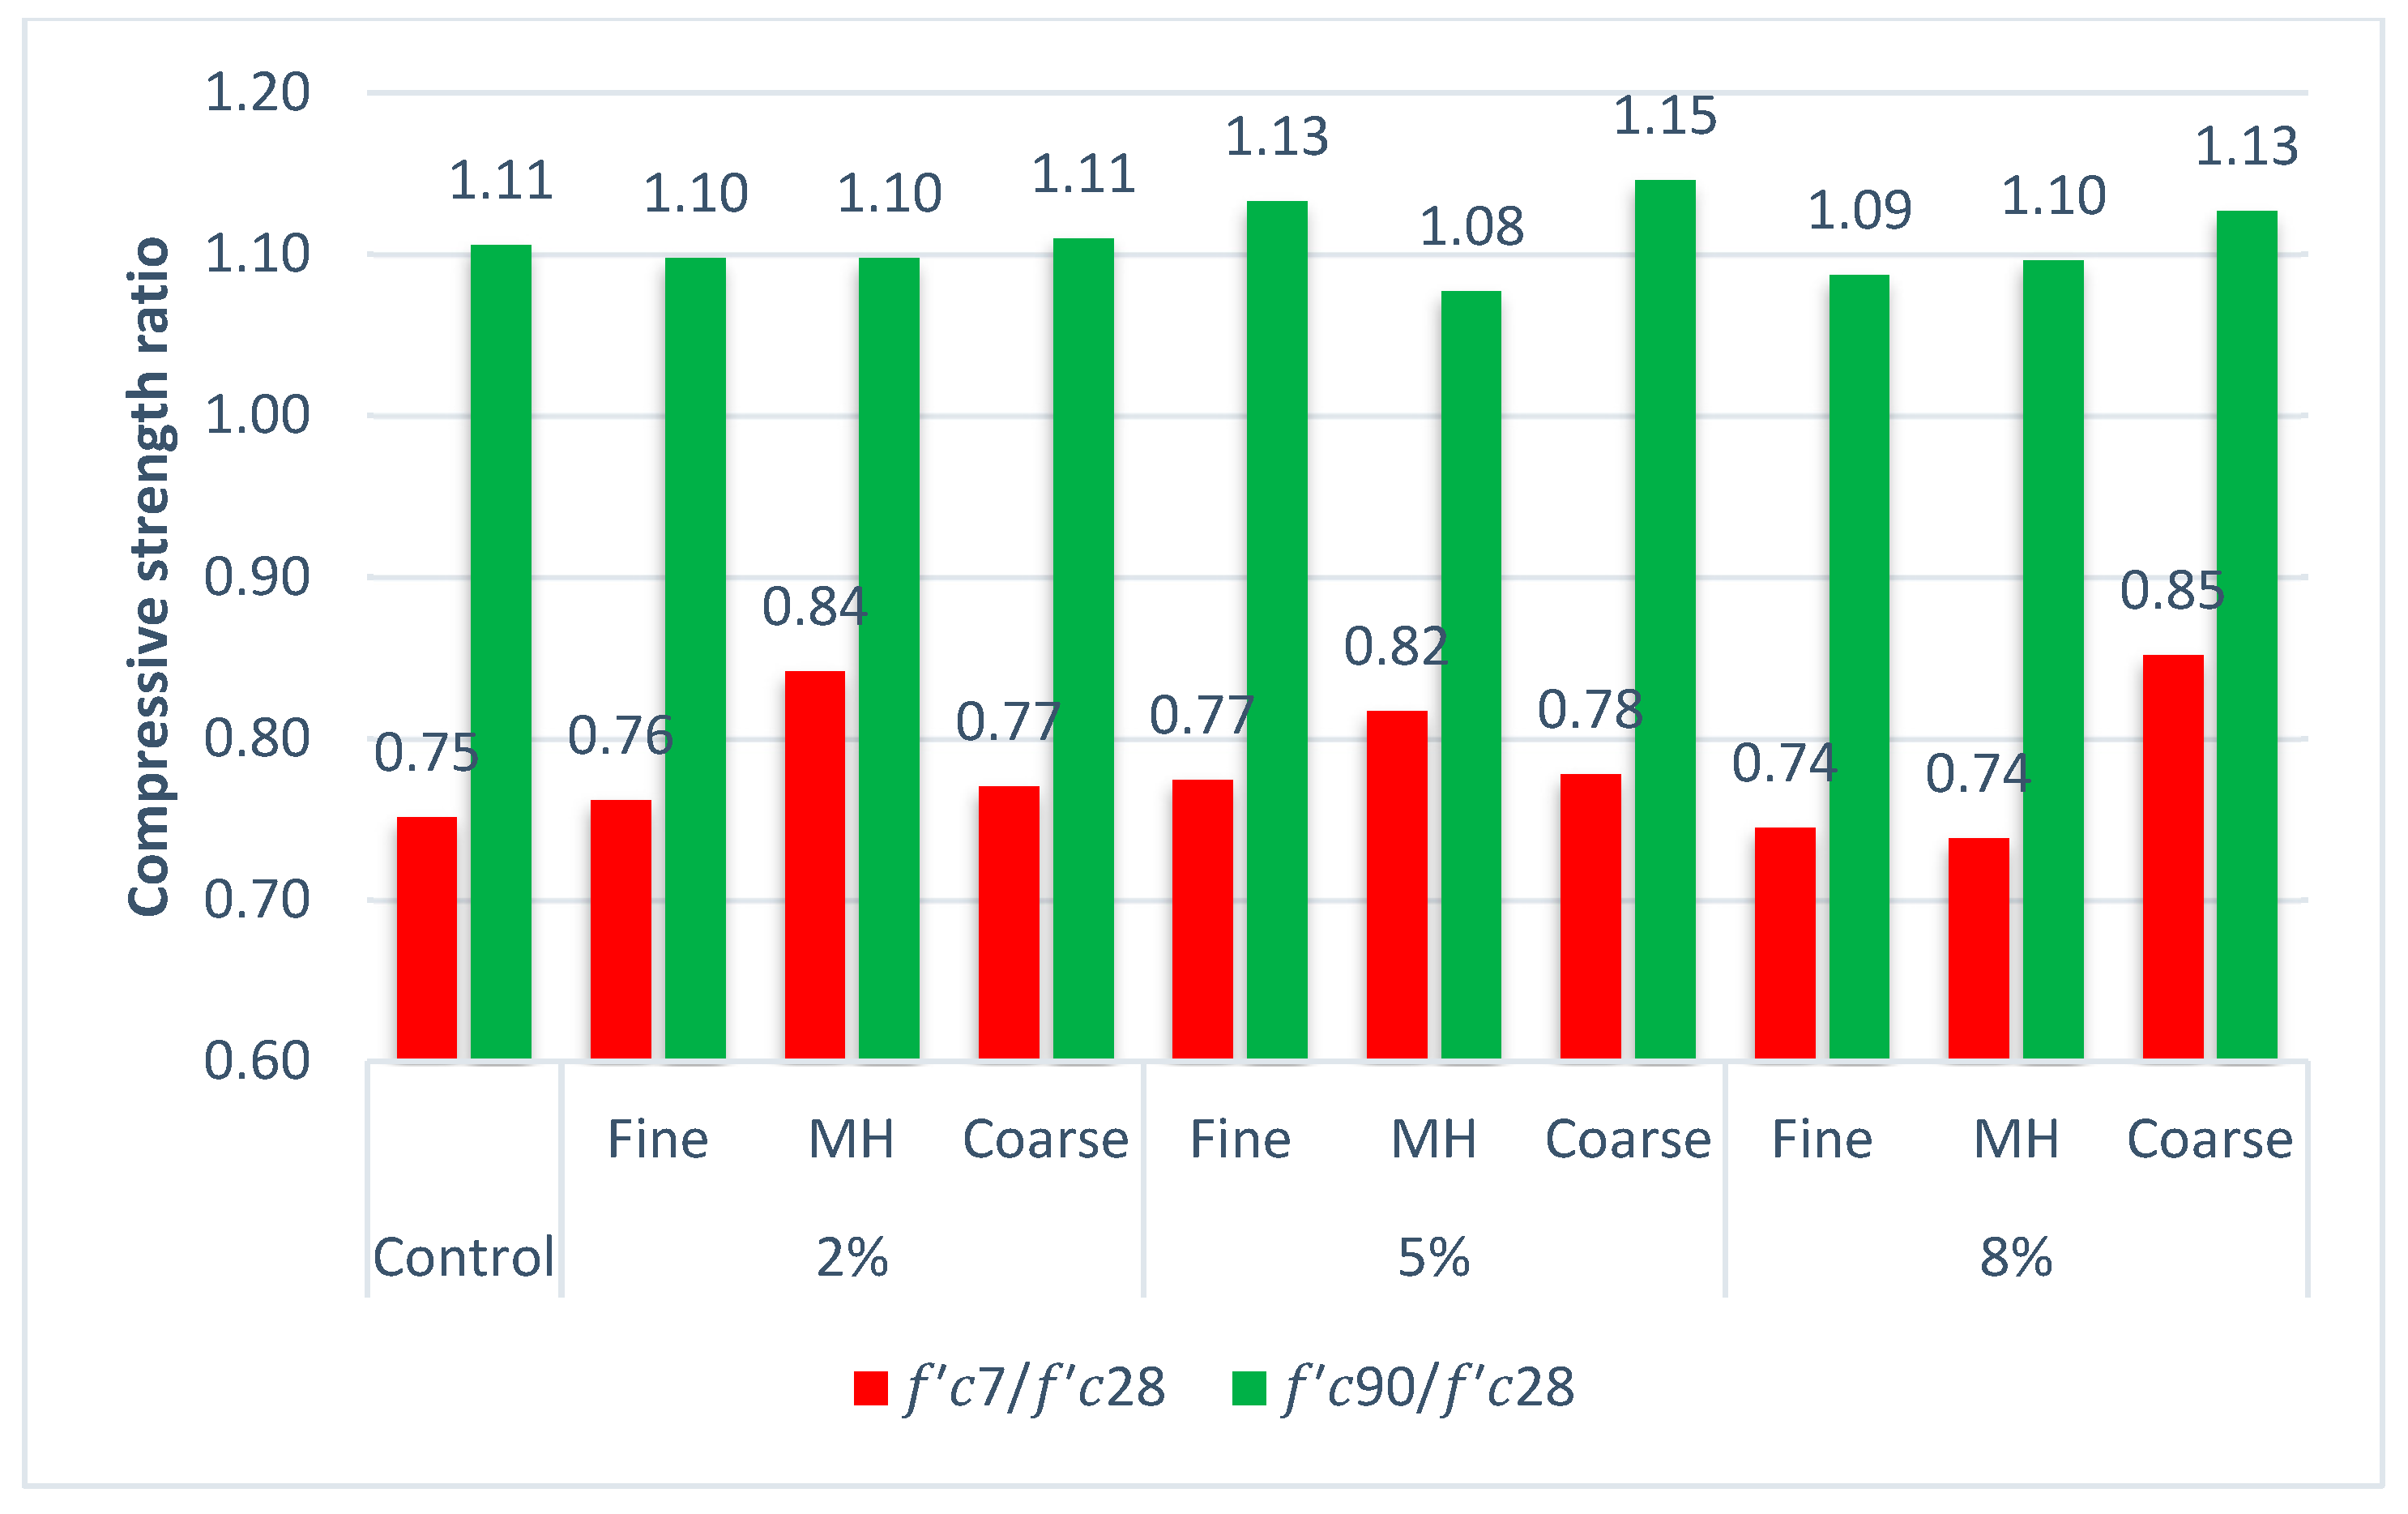
3.5. Comparison of Concrete Compressive Strength over Time

One of the parameters used to predict the compressive strength of concrete in the future is the ratio of concrete compressive strength. This ratio is different for different types of Portland cement. Reference values for the ratios for ASTM C150 [46] type II Portland cement (OPC) are fc7/fc28 = 0.68 and fc90/fc28 = 1.2 (see Ref. [63]). Those ratios were calculated in our experiment for all percentages and all mixing designs, and the results are shown Figure 10. Here, for different mixing designs, fc7/fc28 varies from 0.74 to 0.85, whereas fc90/fc28 changes from 1.08 to 1.15. This second value is lower to the one reported in [63], whereas the first ratio is larger than the reference value.

4. Discussion

The main purpose of our contribution is to respond to the question of whether the use of EAF dust can help improve the properties of concrete. In order to do so, we conducted an experiment to characterize the mechanical and electrical properties of the resulting compounds. Our results show that less cement can be used to meet the characteristics required in standards for concrete. Moreover, considering that the process of cement production is a strong driver of environmental pollution, any reduction of cement consumption helps reduce the negative environmental effects associated with cement production. On the other hand, due to the toxicity of KSC EAFD, its use in concrete neutralizes the harmful environmental effects of this steel industry byproduct. As a result, the use of this product prevents environmental damage in the two aforementioned ways. In our experiments, mixed samples were used to compensate for changes in KSC EAFD characteristics over time.
We obtained the best performance on increasing compressive strength of 28 and 90-day concrete by replacing cement with 2% fine dust. In addition, this dosage with fine dust permitted the lowest amount of electric current, thus ensuring the greatest resistance to the penetration of chlorine ions. Finally, the 2% of fine dust composition had the lowest penetration depth in the water penetration test under a pressure of 500 KPa for 72 h. Therefore, we conjecture that this combination creates the densest concrete among all the types and dosages we have considered. As a consequence, the higher density would help reduce the permeability of different materials and, at the same time, would increase the compressive strength.
However, in the 7-day compressive strength test, replacing with 2% of MH caused the greatest increase in strength, which can be an indication of its short-term effect. In the 7-day compressive strength of concrete, the replacement with 2% of fine dust was the cause of the second-greatest increase in compressive strength.
Although our results may suggest a positive relation among compressive strength and water penetration, compressive strength and chloride permeability, and chloride permeability and water penetration, the correlation coefficient of these linear relations turned out to be non-significant in any of the three potential relations. Further experiments would be needed to determine clear relations between these magnitudes.

5. Conclusions

The findings we have reported for our experiments and the discussion above lead to the following summary of practical implications. (i) In general, KSC EAFD works as a concrete lubricant, so adding more of the aforementioned material caused more slump. (ii) Replacing cement with an optimal dosage of KSC EAFD can strongly improve concrete compressive strength. The most appropriate material and dosage (in the long term) is replacing 2% of cement with fine dust (the second-best combination is to replace cement with a dosage of 2% MH dust). (iii) Replacing cement with 2% fine (or, in the second position, replacing with 2% coarse) are the optimal percentages for reducing chloride penetration. (iv) The best dosage for reducing water penetration in concrete is the 2% fine replacement. (v) Replacing cement with 2% fine caused the largest rise in compressive strength over time. In the light of this summary, we conclude that replacing cement with a 2% fine dust exhibits the optimal mechanical and electrical properties among all kinds of KSC EAFD dosages and types in the short and long term.

Author Contributions

Conceptualization, S.S., J.A.C. and A.C.; Methodology, S.S.; Validation, J.A.C. and A.C.; Investigation, S.S.; Writing—original draft, S.S.; Writing—review & editing, J.A.C. and A.C. All authors have read and agreed to the published version of the manuscript.

Funding

This research received no external funding. The APC was funded by Universidad Politécnica de Madrid.

Data Availability Statement

The data supporting this research is presented in all the figures appearing in the paper, and can be made available upon request.

Acknowledgments

For financing this research, the Khuzestan Steel Company (KSC) is gratefully acknowledged by the authors and for the outstanding assistance given by Mahmoud Landi, Kamran Taher and Hamzeh Hosseinzadeh. Additionally, we would like to extend our thanks to Ayoub Mehri Dehno, R&D Company of Cement Industry (RDCCI) and Khuzestan branch of Technical & Soil Mechanics Lab.co.

Conflicts of Interest

The authors declare no conflict of interest.

Abbreviations

ASTMAmerican Society for Testing and Materials
ASTM C39Standard Test Method for Compressive Strength of Cylindrical Concrete Specimens
ASTM C143Standard Test Method for Slump of Hydraulic-Cement Concrete
ASTM C150Standard Specification for Portland Cement
ASTM C192Standard Practice for Making and Curing Concrete Test Specimens in The Laboratory
ASTM C617Standard Practice for Capping Cylindrical Concrete Specimens
ASTM C1202Standard Test Method for Electrical Indication of Concrete’s Ability to Resist Chloride Ion Penetration
BSBritish Standard
BS EN 12390-8Depth of penetration of water under pressure
EAFElectric arc furnace
EAFDElectric arc furnace dust
KSCKhuzestan Steel Company
MHMaterial handling
OPCOrdinary Portland cement

References

  1. Parron-Rubio, M.E.; Kissi, B.; Perez-García, F.; Rubio-Cintas, M.D. Development in Sustainable Concrete with the Replacement of Fume Dust and Slag from the Steel Industry. Materials 2022, 15, 5980. [Google Scholar] [CrossRef] [PubMed]
  2. Fares, G.; Al-Negheimish, A.I.; Al-Mutlaq, F.M.; Alhozaimy, A.M.; Khan, M.I. Effect of freshly produced electric arc-furnace dust and chloride-free chemical accelerators on concrete performance. Constr. Build. Mater. 2021, 274, 121832. [Google Scholar] [CrossRef]
  3. Sanguino, R.; Barroso, A.; Fernández-Rodríguez, S.; Sánchez-Hernández, M.I. Current Trends in Economy, Sustainable Development, and Energy: A Circular Economy View; Springer: Berlin/Heidelberg, Germany, 2020; Volume 27, pp. 1–7. [Google Scholar]
  4. Lopez-Uceda, A.; Cantador-Fernandez, D.; Da Silva, P.R.; de Brito, J.; Fernandez-Rodriguez, J.M.; Jimenez, J.R. Ternary Blends for Self-Compacting Mortars Production Composed by Electric Arc Furnace Dust and Other Industrial by-Products. Materials 2022, 15, 5347. [Google Scholar] [CrossRef] [PubMed]
  5. Source: Instituto Nacional de Estadistica (Spanish Statistical Office). Available online: https://www.ine.es/ (accessed on 7 June 2023).
  6. Ray, A. Waste management in developing Asia: Can trade and cooperation help? J. Environ. Dev. 2008, 17, 3–25. [Google Scholar] [CrossRef]
  7. Eskani, I.N.; Rahayuningsih, E.; Astuti, W.; Pidhatika, B. Low Temperature In Situ Synthesis of ZnO Nanoparticles from Electric Arc Furnace Dust (EAFD) Waste to Impart Antibacterial Properties on Natural Dye-Colored Batik Fabrics. Polymers 2023, 15, 746. [Google Scholar] [CrossRef]
  8. de Buzin, P.J.W.K.; Heck, N.C.; Vilela, A.C.F. EAF dust: An overview on the influences of physical, chemical and mineral features in its recycling and waste incorporation routes. J. Mater. Res. Technol. 2017, 6, 194–202. [Google Scholar] [CrossRef]
  9. Chang, H.H.; Chen, I.G.; Yu, H.Y.; Tsai, M.Y.; Wu, K.T.; Liu, S.H. Spent Mushroom Substrate and Electric Arc Furnace Dust Recycling by Carbothermic Reduction Method. Materials 2022, 15, 2639. [Google Scholar] [CrossRef]
  10. Anzulevich, A.; Butko, L.; Kalganov, D.; Pavlov, D.; Tolkachev, V.; Fedii, A.; Buchelnikov, V.; Peng, Z. Optimization of the Microwave-Assisted Carbothermical Reduction Process for Metals from Electric Arc Furnace Dust with Biochar. Metals 2021, 11, 1765. [Google Scholar] [CrossRef]
  11. Lin, X.; Peng, Z.; Yan, J.; Li, Z.; Hwang, J.-Y.; Zhang, Y.; Li, G.; Jiang, T. Pyrometallurgical recycling of electric arc furnace dust. J. Clean. Prod. 2017, 149, 1079–1100. [Google Scholar] [CrossRef]
  12. Małecki, S.; Gargul, K.; Warzecha, M.; Stradomski, G.; Hutny, A.; Madej, M.; Dobrzyński, M.; Prajsnar, R.; Krawiec, G. High-performance method of recovery of metals from eaf dust—Processing without solid waste. Materials 2021, 14, 6061. [Google Scholar] [CrossRef]
  13. Loaiza, A.; Cifuentes, S.; Colorado, H.A. Asphalt modified with superfine electric arc furnace steel dust (EAF dust) with high zinc oxide content. Constr. Build. Mater. 2017, 145, 538–547. [Google Scholar] [CrossRef]
  14. Teimouri, S.; Potgieter, J.H.; Lundström, M.; Billing, C.; Wilson, B.P. A New Hydrometallurgical Process for Metal Extraction from Electric Arc Furnace Dust Using Ionic Liquids. Materials 2022, 15, 8648. [Google Scholar] [CrossRef] [PubMed]
  15. Oustadakis, P.; Tsakiridis, P.E.; Katsiapi, A.; Agatzini-Leonardou, S. Hydrometallurgical process for zinc recovery from electric arc furnace dust (EAFD): Part I: Characterization and leaching by diluted sulphuric acid. J. Hazard. Mater. 2010, 179, 1–7. [Google Scholar] [CrossRef] [PubMed]
  16. Ledesma, E.F.; Lozano-Lunar, A.; Ferreira, R.L.; Fernández-Rodríguez, J.M.; Jiménez, J.R. Preliminary Study of Recycled Aggregate Mortar for Electric Arc Furnace Dust Encapsulation. Appl. Sci. 2021, 11, 9525. [Google Scholar] [CrossRef]
  17. Martins, F.M.; dos Reis Neto, J.M.; da Cunha, C.J. Mineral phases of weathered and recent electric arc furnace dust. J. Hazard. Mater. 2008, 154, 417–425. [Google Scholar] [CrossRef]
  18. Al-Negheimish, A.I.; Al-Mutlaq, F.M.; Fares, G.; Alhozaimy, A.M.; Khan, M.I. Characterization of chemical accelerators for sustainable recycling of fresh electric-arc furnace dust in cement pastes. Adv. Powder Technol. 2021, 32, 3046–3062. [Google Scholar] [CrossRef]
  19. Chen, D.; Guo, H.; Li, P.; Wu, F.; Lv, Y.; Yan, B.; Zhao, W.; Su, Y. A Novel Technique for the Preparation of Iron Carbide and Carbon Concentrate from Blast Furnace Dust. Materials 2022, 15, 8241. [Google Scholar] [CrossRef] [PubMed]
  20. Rieger, J.; Colla, V.; Matino, I.; Branca, T.A.; Stubbe, G.; Panizza, A.; Brondi, C.; Falsafi, M.; Hage, J.; Wang, X. Residue valorization in the iron and steel industries: Sustainable solutions for a cleaner and more competitive future Europe. Metals 2021, 11, 1202. [Google Scholar] [CrossRef]
  21. Halli, P.; Hamuyuni, J.; Leikola, M.; Lundström, M. Developing a sustainable solution for recycling electric arc furnace dust via organic acid leaching. Miner. Eng. 2018, 124, 1–9. [Google Scholar] [CrossRef]
  22. Soares, E.; Bouchonneau, N.; Alves, E.; Alves, K.; Filho, O.A.; Mesguich, D.; Chevallier, G.; Khalile, N.; Laurent, C.; Estournès, C. Electric Arc Furnace Dust Recycled in 7075 Aluminum Alloy Composites Fabricated by Spark Plasma Sintering (SPS). Materials 2022, 15, 6587. [Google Scholar] [CrossRef]
  23. Ma, S.; Zhang, Z.; Xing, X.; Xu, S.; Li, X. Kinetic Analysis of Recovering Zinc from Electric Arc Furnace Dust by Vacuum Carbothermic Reduction at 20 Pa. Minerals 2022, 12, 261. [Google Scholar] [CrossRef]
  24. Mantovani, M.C.; Takano, C.; Büchler, P.M. EAF and secondary dust characterisation. Ironmak. Steelmak. 2004, 31, 325–332. [Google Scholar] [CrossRef]
  25. Grudinsky, P.; Zinoveev, D.; Kondratiev, A.; Delitsyn, L.; Kulumbegov, R.; Lysenkov, A.; Kozlov, P.; Dyubanov, V. Reduction Smelting of the Waelz Slag from Electric Arc Furnace Dust Processing: An Experimental Study. Crystals 2023, 13, 318. [Google Scholar] [CrossRef]
  26. Source: Global Steel Dust Ltd. Available online: http://www.globalsteeldust.com/about (accessed on 7 June 2023).
  27. Law, S.L.; Lowry, W.F.; Synder, J.G.; Kramer, G.W. Characterization of Steelmaking Dusts from Electric Arc Furnaces; US Department of the Interior, Bureau of Mines: Washington, DC, USA, 1983; Volume 8750.
  28. Bakkar, A. Recycling of electric arc furnace dust through dissolution in deep eutectic ionic liquids and electrowinning. J. Hazard. Mater. 2014, 280, 191–199. [Google Scholar] [CrossRef] [PubMed]
  29. Ireland, E. European Waste Catalogue and Hazardous Waste List; Environmental Protection Agency: Wexford, Ireland, 2002.
  30. Auer, M.; Wölfler, C.; Antrekowitsch, J. Influence of different carbon content on reduction of zinc oxide via metal bath. Appl. Sci. 2022, 12, 664. [Google Scholar] [CrossRef]
  31. Maslehuddin, M.; Awan, F.; Shameem, M.; Ibrahim, M.; Ali, M. Effect of electric arc furnace dust on the properties of OPC and blended cement concretes. Constr. Build. Mater. 2011, 25, 308–312. [Google Scholar] [CrossRef]
  32. Yoo, J.-M.; Kim, B.-S.; Lee, J.-c.; Kim, M.-S.; Nam, C.-W. Kinetics of the volatilization removal of lead in electric arc furnace dust. Mater. Trans. 2005, 46, 323–328. [Google Scholar] [CrossRef] [Green Version]
  33. Macías, Á.; Goñi Elizalde, S.; Guerrero Bustos, A.M. Immobilisation/Solidification of Hazardous Toxic Waste in Cement Matrices; CSIC—Instituto de Ciencias de la Construcción Eduardo Torroja (IETCC): Madrid, Spain, 1999. [Google Scholar]
  34. Ledesma, E.F.; Jimenez, J.R.; Ayuso, J.; Fernandez, J.M.; Brito, J. Experimental study of the mechanical stabilization of electric arc furnace dust using fluid cement mortars. J. Hazard. Mater. 2017, 326, 26–35. [Google Scholar] [CrossRef]
  35. BREHM, F.A.; Vargas, A.; Moraes, C.; Masuero, A.; Dalmolin, D.; Vilela, A.; Bernardes, A.; Mafaldo, I. Characterization and use of eaf dust in construction. In Proceedings of the Japan-Brazil Symposium on Dust Processing-Energy Environment in Metallurgical and Materials Engineering, Sao Paulo, Brazil, 25–26 October 2001; pp. 173–180. [Google Scholar]
  36. Hilton, R. Method for Manufacturing Cement Clinkers, Especially Portland Cement Clinkers, Using Stabilized Electric Arc Furnace Dust as Raw Material. Patent US5853474, 2 June 1997. [Google Scholar]
  37. Holmes, R.J.; Lu, Y.; Lu, L. Introduction: Overview of the global iron ore industry. In Iron Ore; Woodhead Publishing: Sawston, UK, 2022; pp. 1–56. [Google Scholar]
  38. Xie, Z.; Jiang, T.; Chen, F.; Guo, Y.; Wang, S.; Yang, L. Phase Transformation and Zinc Extraction from Zinc Ferrite by Calcium Roasting and Ammonia Leaching Process. Crystals 2022, 12, 641. [Google Scholar] [CrossRef]
  39. Jiang, Y.; Ling, T.-C.; Shi, C.; Pan, S.-Y. Characteristics of steel slags and their use in cement and concrete—A review. Resour. Conserv. Recycl. 2018, 136, 187–197. [Google Scholar] [CrossRef]
  40. Al-Zaid, R.Z.; Al-Sugair, F.H.; Al-Negheimish, A.I. Investigation of potential uses of electric-arc furnace dust (EAFD) in concrete. Cem. Concr. Res. 1997, 27, 267–278. [Google Scholar] [CrossRef]
  41. de Vargas, A.S.; Masuero, Â.B.; Vilela, A.C. Investigations on the use of electric-arc furnace dust (EAFD) in Pozzolan-modified Portland cement I (MP) pastes. Cem. Concr. Res. 2006, 36, 1833–1841. [Google Scholar] [CrossRef]
  42. Fares, G.; Al-Zaid, R.; Khan, M.; Al-Negheimish, A.; Alhozaimy, A. Suwito, Characterization and microstructural deformation during the hydration of EAFD-cement composite. In Proceedings of the 2nd International Conference on Microstructure Related Durability of Cementitious Composite; Ye, G., van Breugel, K., Sun, W., Miao, C., Eds.; RILEM Publications SARL: Amsterdam, The Netherland, 2012; pp. 189–196. [Google Scholar]
  43. Balderas, A.; Navarro, H.; Flores-Velez, L.M.; Dominguez, O. Properties of Portland Cement Pastes Incorporating Nanometer-Sized Franklinite Particles Obtained from Electric-Arc-Furnace Dust. J. Am. Ceram. Soc. 2001, 84, 2909–2913. [Google Scholar] [CrossRef]
  44. Al-Zaid, R.; Suwito, G.F.; Al-Negheimish, A.; Alhozaimy, A.; Khan, M. Microstructural study on the effects of using electric-arc furnace dust (EAFD) as a cementitious material. In Proceedings of the 2nd International Conference on Microstructure Related Durability of Cementitious Composite; Ye, G., van Breugel, K., Sun, W., Miao, C., Eds.; RILEM Publications SARL: Amsterdam, The Netherland, 2012; pp. 11–13. [Google Scholar]
  45. Fares, G.; Al-Zaid, R.Z.; Fauzi, A.; Alhozaimy, A.M.; Al-Negheimish, A.I.; Khan, M.I. Performance of optimized electric arc furnace dust-based cementitious matrix compared to conventional supplementary cementitious materials. Constr. Build. Mater. 2016, 112, 210–221. [Google Scholar] [CrossRef]
  46. C150/C150M-22; Standard Specification for Portland Cement. ASTM International: West Conshohocken, PA, USA, 2022.
  47. Massarweh, O.; Maslehuddin, M.; Al-Dulaijan, S.U.; Shameem, M.; Ahmad, S. Development of a concrete set retarder utilizing electric arc furnace dust. Constr. Build. Mater. 2020, 255, 119378. [Google Scholar] [CrossRef]
  48. Alizadeh, M.; Momeni, M. The effect of the scrap/DRI ratio on the specification of the EAF dust and its influence on mechanical properties of the concrete treated by its dust. Constr. Build. Mater. 2016, 112, 1041–1045. [Google Scholar] [CrossRef]
  49. C192/C192M-19; Standard Practice for Making and Curing Concrete Test Specimens in the Laboratory. ASTM International: West Conshohocken, PA, USA, 2019.
  50. C143/C143M-20; Standard Test Method for Slump of Hydraulic-Cement Concrete. ASTM International: West Conshohocken, PA, USA, 2020.
  51. C617/C617M-15; Standard Practice for Capping Cylindrical Concrete Specimens. ASTM International: West Conshohocken, PA, USA, 2015.
  52. C39/C39M-21; Standard Test Method for Compressive Strength of Cylindrical Concrete Specimens. ASTM International: West Conshohocken, PA, USA, 2021.
  53. C1202-22e1; Standard Test Method for Electrical Indication of Concrete’s Ability to Resist Chloride Ion Penetration. ASTM International: West Conshohocken, PA, USA, 2022.
  54. BS EN 12390-8; Testing Hardened Concrete Part 8: Depth of Penetration of Water under Pressure. NBS: Newcastle upon Tyne, UK, 2019.
  55. Sabzi, J.; Asadi Shamsabadi, E.; Ghalehnovi, M.; Hadigheh, S.A.; Khodabakhshian, A.; Brito, J.d. Mechanical and durability properties of mortars incorporating red mud, ground granulated blast furnace slag, and electric arc furnace dust. Appl. Sci. 2021, 11, 4110. [Google Scholar] [CrossRef]
  56. Roy, D.; Malek, R.; LicastroI, P. Chloride Permeability of Fly Ash-Cement Pastes and Mortars. Spec. Publ. 1987, 100, 1459–1476. [Google Scholar]
  57. Syahyadi, R.; Fauzi, A.; Majuar, E.; Rizal, F.; Reza, M. Effect of Electric Arc Furnace Dust Treatment on the Properties of Fresh and Hardened Mortar. In Proceedings of the IOP Conference Series: Materials Science and Engineering, Seoul, Republic of Korea, 18–20 October 2019; p. 012032. [Google Scholar]
  58. Hafez, H.; Kassim, D.; Kurda, R.; Silva, R.V.; de Brito, J. Assessing the sustainability potential of alkali-activated concrete from electric arc furnace slag using the ECO2 framework. Constr. Build. Mater. 2021, 281, 122559. [Google Scholar] [CrossRef]
  59. Parron-Rubio, M.E.; Perez-García, F.; Gonzalez-Herrera, A.; Rubio-Cintas, M.D. Concrete properties comparison when substituting a 25% cement with slag from different provenances. Materials 2018, 11, 1029. [Google Scholar] [CrossRef] [Green Version]
  60. Gojević, A.; Ducman, V.; Netinger Grubeša, I.; Baričević, A.; Banjad Pečur, I. The effect of crystalline waterproofing admixtures on the self-healing and permeability of concrete. Materials 2021, 14, 1860. [Google Scholar] [CrossRef] [PubMed]
  61. García Calvo, J.L.; Sánchez Moreno, M.; Carballosa, P.; Pedrosa, F.; Tavares, F. Improvement of the concrete permeability by using hydrophilic blended additive. Materials 2019, 12, 2384. [Google Scholar] [CrossRef] [PubMed] [Green Version]
  62. Cappellesso, V.G.; dos Santos Petry, N.; Dal Molin, D.C.C.; Masuero, A.B. Use of crystalline waterproofing to reduce capillary porosity in concrete. J. Build. Pathol. Rehabil. 2016, 1, 9. [Google Scholar] [CrossRef] [Green Version]
  63. Rüsch, H.; Jungwirth, D.; Hilsdorf, H.K. Creep and Shrinkage: Their Effect on the Behavior of Concrete Structures; Springer Science & Business Media: Berlin/Heidelberg, Germany, 2012. [Google Scholar]
Figure 1. Particle size analysis of the average fine sample. The density distribution function and the corresponding cumulative distribution (i.e., the curve that reaches the 100%) are shown.
Buildings 13 01526 g001
Figure 2. Particle size analysis of the average coarse sample. The density distribution function and the corresponding cumulative distribution (i.e., the curve that reaches the 100%) are shown.
Buildings 13 01526 g002
Figure 3. Particle size analysis of the average MH sample. The density distribution function and the corresponding cumulative distribution (i.e., the curve that reaches the 100%) are shown.
Buildings 13 01526 g003
Figure 4. Slump test results for control and all EAFD dosages and group samples used in the experiment.
Buildings 13 01526 g004
Figure 5. 7 days’ cylindrical compressive strength for control and all EAFD dosages and group samples used in the experiment.
Buildings 13 01526 g005
Figure 6. 28 days’ cylindrical compressive strength for control and all EAFD dosages and group samples used in the experiment.
Buildings 13 01526 g006
Figure 7. 90 days’ cylindrical compressive strength for control and all EAFD dosages and group samples used in the experiment.
Buildings 13 01526 g007
Figure 8. Rapid chloride permeability test result for control and all EAFD dosages and group samples used in the experiment.
Buildings 13 01526 g008
Figure 9. Water penetration test result for control and all EAFD dosages and group samples used in the experiment.
Buildings 13 01526 g009
Figure 10. Compressive strength comparison during time. Here, we plot the ratio of compressive strength at 7 and 90 days to the compressive strength at 28 days.
Buildings 13 01526 g010
Table 1. Chemical analysis of fine-size particle samples from six furnaces and the homogenized sample. The table indicates the chemical composition, expressed as the percentage of each compound obtained from each furnace, as well as the composition obtained in a uniform mixture of the six samples from furnaces.
Oxide (%)Furnace 1Furnace 2Furnace 3Furnace 4Furnace 5Furnace 6Average Fine
SiO25.774.505.455.514.156.315.28
Al2O31.040.660.830.950.721.190.9
Fe2O353.4342.9740.0751.9847.5048.6947.44
CaO9.607.407.768.406.629.528.22
MgO5.183.794.245.444.004.724.56
SO31.161.050.971.371.931.201.28
Na2O8.4512.8014.048.559.849.1410.47
K2O6.5410.9510.216.518.696.658.26
Zn1.543.471.901.462.301.722.07
P2O50.470.981.340.480.470.520.71
TiO20.230.190.210.230.160.280.22
MnO0.500.330.380.840.660.820.59
Table 2. Chemical analysis of coarse samples from three furnaces and the homogenized sample.
Oxide (%)Furnace 2Furnace 3Furnace 5Average Coarse
SiO214.4613.4012.8313.56
Al2O32.982.902.972.95
Fe2O343.9442.9541.7942.89
CaO22.6722.1724.3823.07
MgO7.828.818.408.34
SO30.150.120.180.15
Na2O3.243.733.383.45
K2O1.281.681.591.52
Zn0.010.010.010.01
P2O50.880.830.700.8
TiO20.850.890.830.86
MnO0.360.410.410.39
Table 3. Chemical analysis of MH samples from two MHs and the homogenized sample.
Oxide (%)MH7MH8Average MH
SiO23.914.033.97
Al2O30.771.090.93
Fe2O383.6281.4082.51
CaO5.476.325.90
MgO1.902.702.30
SO30.150.100.13
Na2O0.300.270.29
K2O0.170.130.15
Zn0.010.010.01
P2O50.170.180.18
TiO20.350.300.33
MnO2.010.351.18
Table 4. Mix design composition for control.
Descriptionkg/m3
Coarse Gravel490
Fine Gravel326
Sand1029
Cement350
Water168
W/C0.48
Table 5. Mix design for 2, 5 and 8% EADF replacing cement.
Description2% EAFD
kg/m3
5% EAFD
kg/m3
8% EAFD
kg/m3
Coarse Gravel490490490
Fine Gravel326326326
Sand102910291029
Cement343332.5322
EAFD717.528
Water168168168
W/C0.480.480.48
Disclaimer/Publisher’s Note: The statements, opinions and data contained in all publications are solely those of the individual author(s) and contributor(s) and not of MDPI and/or the editor(s). MDPI and/or the editor(s) disclaim responsibility for any injury to people or property resulting from any ideas, methods, instructions or products referred to in the content.

