1. Introduction
With the increasing trend of “large flow, large-scale vehicle, heavy load and overload” in the world [
1,
2] and the frequent occurrence of extreme weather conditions, asphalt pavement should meet higher performance requirements. Due to the “more coarse aggregates, more mineral powder, more asphalt and less fine aggregates” characteristics of Stone Mastic Asphalt(Hereinafter referred to as SMA), the mixture has a good skeleton. At the same time, there is enough asphalt mastic to fill the skeleton voids. Better stability against high and low temperature, good water stability, durability, and surface function make its application more and more widespread.
For 4 cm SMA pavements on bridge decks, vibratory compaction tends to crush the aggregate, destroy the integrity of the surface coarse aggregate, result in a loose mixture and reduced compaction, and increase the vertical vibration of the bridge deck and the longitudinal pushing of the pavement, resulting in bond failure at the paving layer interface and damaging the levelness [
3]. For the bridge itself, it can increase the vertical vibration of the deck, which can seriously cause internal damage to the bridge structure and reduce bridge safety [
4]. However, because the use of static rolling to compact the bridge deck pavement can be too inefficient and heat dissipation is too fast, the required degree of compaction cannot be achieved. Meanwhile, a very high compaction speed will reduce the compaction quality of asphalt mixture. Inadequate compaction will directly affect the concrete void ratio, compaction, and compressive tensile strength and other physical and mechanical performance indicators, making the road surface seep underwater. Meanwhile, it is prone to early damage such as potholes and looseness under the action of vehicle dynamic load, which is an important cause of early water damage of pavement [
5,
6,
7,
8]. A 1% increase in the compaction of asphalt mixtures can effectively increase the load-bearing capacity by 10% to 15%, and good compaction quality is extremely critical to prolong the service life of the road [
9,
10].
SMA mixtures have a higher viscosity due to the use of high levels of modified bitumen, resulting in a higher temperature sensitivity than AC asphalt mixes. At the same time, the cement concrete of the bridge deck system has a high specific heat capacity and a high heat absorption capacity, so that sufficient excitation force needs to be applied to the asphalt pavement in a relatively short time. At present, the rolling equipment is being updated very rapidly, and the development of large-tonnage, high-frequency rollers in the market has significantly improved the compaction effect of asphalt pavements [
11]. There is also increasing research into the compaction process and the method of evaluating the compaction effect of asphalt pavements. Wang Siqi et al. reviewed the most advanced and practical nondestructive testing methods for pavement density measurement [
12]. Yan Tianhao et al. proposed a new method to evaluate the compaction of asphalt mixes based on the physical mechanism of compaction [
13], and Geng Qin studied the effects of vibration duration, compaction degree, compaction temperature, and semirigid base modulus [
14]. However, in recent years, it has been found that the abrasion damage to the surface texture caused by the rolling process has gradually become an engineering problem that cannot be ignored. Generally speaking, excessive compaction can easily lead to broken pavement aggregate corners, but the compaction of individual sections of drilled cores that does not exceed a hundred also appears as a large area of “white spots”. Early corner wear of newly paved pavements directly reduces the skid resistance and durability of the pavement, which has a very negative impact on traffic safety [
15,
16,
17].
For the SMA asphalt surface pavement of a cement concrete bridge deck, balanced pavement compaction and skid resistance is the key to solve the problem of road wearing course construction quality. Early research on the influence of compaction methods was limited by technology, and the evaluation of compaction quality mainly focused on the macroscopic volume parameters and mechanical properties of the mixture specimens [
18]. In this paper, the compaction effect of pavements under different rolling processes was analyzed through the construction of the upper layer of a highway bridge section, and the effect of construction temperature and the rolling process on the degree of wear of the structure was carried out according to digital image processing. A multiscale evaluation related to the skid resistance of the pavement was carried out based on the laser method. Taking into account compaction, structure wear, and skid resistance, a reasonable compaction process was proposed to provide guidance on compaction technology for the construction of SMA wearing courses on bridge decks.
2. Mechanism
2.1. Oscillating and Vibratory Roller Working Mechanism
The compaction process of the asphalt mixture is from a loose plastic state to a high modulus viscoelastic solid state. The vertical force of the roller overcomes the cohesion and shear stress between the particles of the hot mixture asphalt mixture and rearranges them to a relatively stable state. An in-depth study showed that compaction forming is the key to playing the role of lubricating the free asphalt in the mixture, which can effectively reduce the compaction work required to overcome the embedded interlocking forces between coarse aggregates [
19]. During the rolling process, the aggregate particles within the mixture are spatially displaced and rotated until a new balance is achieved between the internal forces (interaggregate friction and asphalt cohesion) and external forces (mechanical rolling action) of the aggregate particles.
In fact, vibratory compaction is a method of compaction that combines vibration and rolling, thus stimulating the horizontal vibration of the pressed material particles. The main working device is the vibratory wheel. The principle of operation is that the central drum drives the eccentric shafts on both sides by means of synchronized gearing. The shaft is equipped with eccentric blocks, and the rotation of the eccentric shaft drives the eccentric blocks to generate centrifugal force, thus making the vibratory wheel vibrate.
When the angular velocity of the eccentric shaft is constant, the excitation force couple varies in a sine wave. The vibratory wheel vibrates under the action of the varying force couple, generating vibration waves in its forward and backward directions (see
Figure 1a), producing alternating shear strains on the compacted material, so that the vibratory wheel produces a “rubbing” effect on the ground. At the same time, its own gravity causes a vertical displacement of the compacted material. As a result, the compacted material is resonated and displaced by the combined effect of the alternating force coupling of the vibratory wheel and the vertical static load, rearranging the position of the particles in the material and reducing the voids between the particles, thereby improving the compaction of the material.
Figure 1b shows the mechanism of action between the vibratory roller and the asphalt mixture. As can be seen from
Figure 1b, the alternating moment M applied to the vibratory roller causes the roller to be subjected to an alternating torque, forming a vibration wave in the front-to-back direction. The compacted asphalt mixture is subjected to an alternating shear strain by the oscillating excitation force, where G is the axial load on the compaction wheel and F is the horizontal thrust. F1 is the force on the aggregate particles of the asphalt mixture in the horizontal direction, F2 is the force in the vertical direction, and the combined force of F1 and F2 is F. The horizontal excitation force of the vibratory roller and the vertical static load of the vibratory roller act together on the Matsuura asphalt mixture. The shear strength of the asphalt mixture is destroyed under the action of the alternating shear stress, and the bond between the particles of the mixture is weakened to make them rearrange and become more dense to achieve compaction of the asphalt mixture in both horizontal and vertical directions.
Vibratory rollers rely mainly on the vibrating rollers to provide the excitation force. During operation, the vibration shaft rotates at high speed to drive the eccentric block to generate an excitation force that produces an impact on the road surface. Each impact of the vibratory roller generates a vibration wave (see
Figure 2) on the material being compacted, causing the resting material particles to enter a state of motion. When the frequency of the excitation force is close to the inherent frequency of the pavement, the pavement will resonate, the fine aggregate will fill the void between the skeleton, the coarse aggregate will move between each other to reduce the void between the particles, and the mixture will be compacted to increase the internal frictional resistance between the aggregates, thus increasing the bearing capacity of the pavement.
2.2. Skid Resistance Mechanism of Tires on Asphalt Pavements
The asphalt mixture meets the compaction requirements and is the basis for the durability of the pavement. On this basis, the skid resistance of the pavement seriously affects the safety of traffic. In recent years, 3–4 years after the opening of the highway, the construction depth of the asphalt surface layer, friction coefficient, and other skid resistance indicators begin to decline rapidly, even lower than the current standard, which not only causes a large loss of construction funds, but also has a negative social impact and poses a serious threat to the concept of safe, convenient, and efficient development of the transportation industry.
During braking and sliding, the car tire creates a cutting action on the surface of the tire due to the microconvex body of the asphalt pavement aggregate surface being embedded into the tread rubber to cause a greater stress concentration. This microcutting action is similar to the ploughing phenomenon on metal surfaces. The resistance generated by the microcutting action constitutes another part of the frictional component of the tire sliding process, as shown in the figure.
In the field of pavement research, results have shown that the important factors affecting the skid resistance of asphalt pavements are microtexture, macroscopic characterization, and material properties [
20,
21,
22,
23,
24]. Material properties include the quality of raw materials, type of grading, and others, which have great influence on the microtexture and macroscopic characterization of asphalt pavements [
25,
26,
27].
The mechanism of the skid resistance of asphalt pavements is the frictional force generated by the mutual coupling between the wearing course and the vehicle tire, which mainly includes adhesion, hindrance, and ploughing force [
28,
29,
30]; see
Figure 3 and
Table 1.
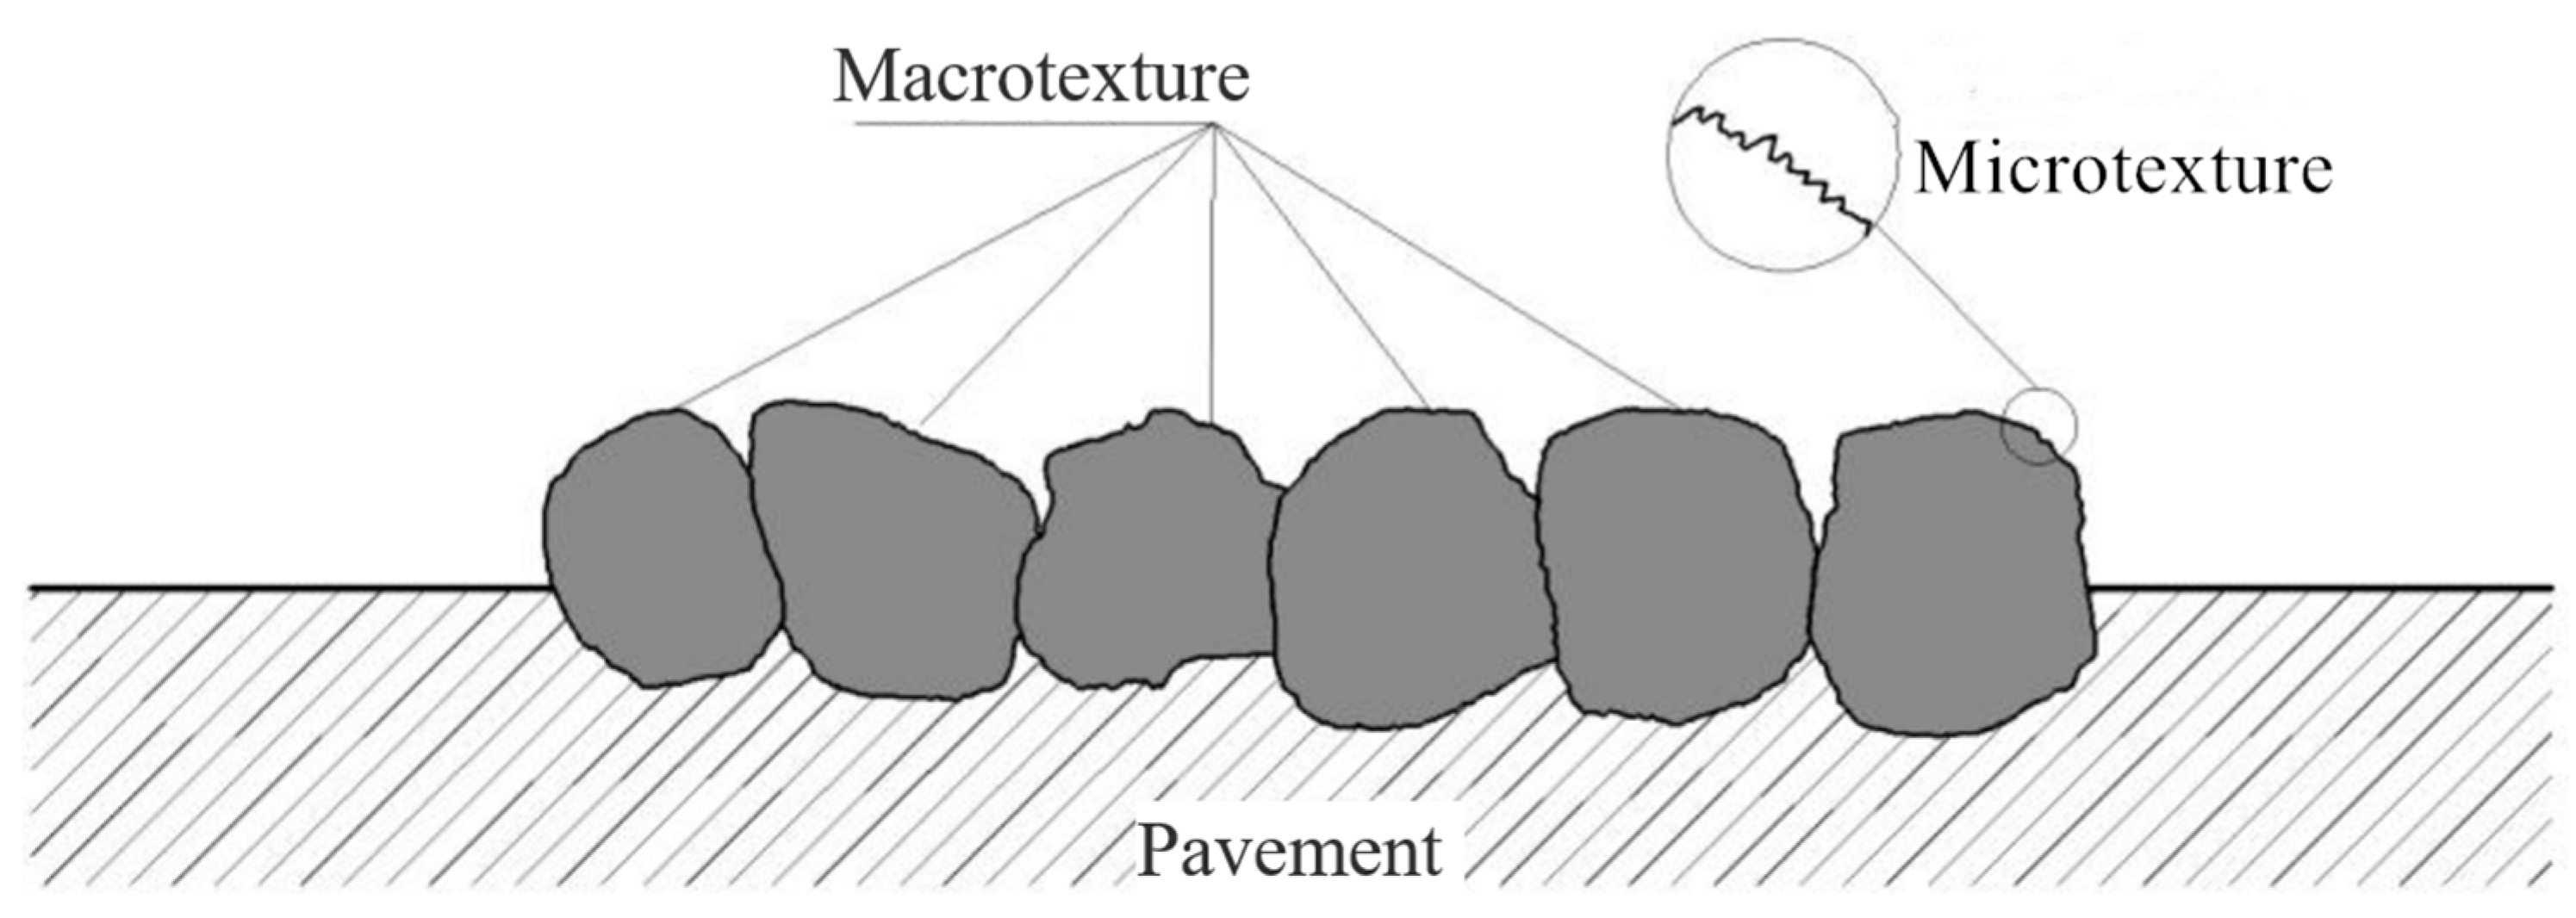
It is generally believed that the mechanism of the antiskid performance of asphalt pavement is mainly the result of [
24,
30] the mutual contact and friction between the surface texture (or texture) and the tire at different scales: the interaction of the tire with the surface texture (convex and concave contours formed by coarse aggregate particles embedded in each other) at a large scale (macroscopic), the interaction of fine aggregate particles or coarse aggregate angles with the tire at a fine scale, and the contact between the microtexture of the crushed surface of the coarse aggregate particles and the tire at a microscopic scale.
For SMA asphalt pavements, the mixture is characterized by a gap gradation. The coarse aggregate skeleton plays a major role in achieving good high-temperature performance while also forming an excellent pavement contour morphology: a rich skid-resistant structure at the macroscopic scale, a certain amount of coarse aggregate angularity (fine view), and a relatively more abundant exposed coarse aggregate fracture surface (microscopic view).
3. Vibratory Compaction and Oscillatory Compaction Comparison Test
3.1. SMA-13 Asphalt Mixture Ratio Design
The hot bin aggregate particle size specifications were 11–16 mm, 6–11 mm, 3–6 mm, and 0–3 mm; the blending ratio was 41%: 33%: 5%: 11%: 8.5%: 1.5%, and the synthetic gradation is shown in
Figure 4. An asphalt aggregate ratio of 6.1% was used, the fiber content was 0.3% of the asphalt mixture, and SMA mixture performance test results are shown in
Table 2. SMA-13 indicates that the maximum nominal particle size of the asphalt mastic crushed stone mix is 13mm. Hereinafter referred to as SMA-13 for this asphalt mix.
3.2. Test Program
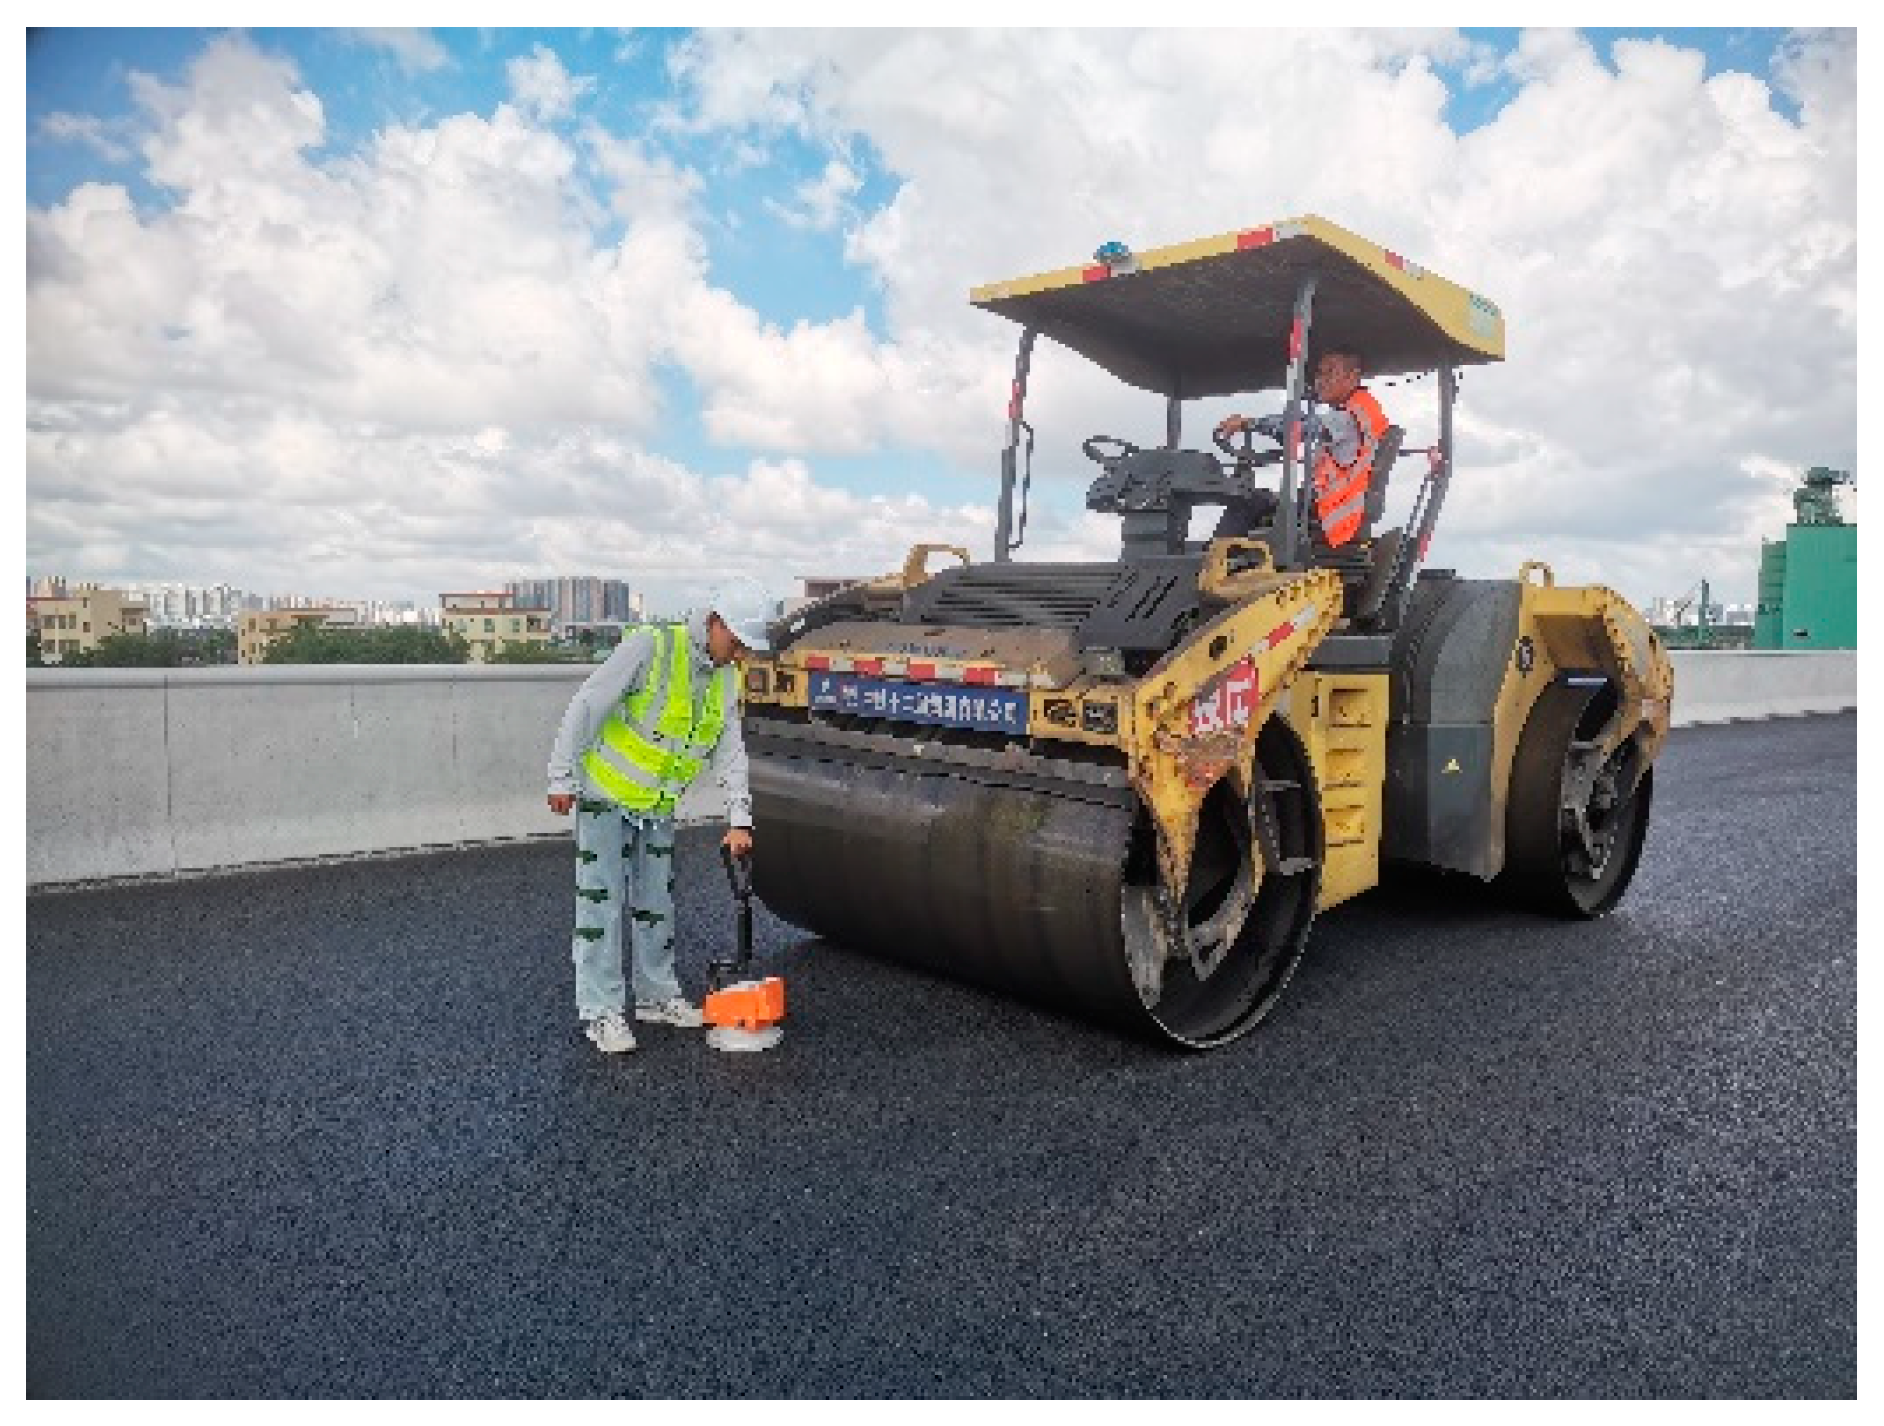
In order to compare the variation of compaction density with rolling variables of SMA asphalt mixes (around 4 cm) for bridge decks under different rolling processes, high-frequency vibratory rollers (Hummer HD138) and vibratory rollers (Hummer HDO138V) of the same tonnage (13t) were selected to roll the asphalt pavement at the same speed, frequency, and amplitude. The compaction was measured with a non-nuclear density meter at different compaction times. The compaction values of the asphalt pavement were then calculated and calibrated by the core specimen for different rollers and different times, and the compaction curves were plotted against times.
Two 50 m long test sections of an SMA-13 modified asphalt wearing course (loose layer of approximately 5 cm, paved section of cement concrete bridge) were selected for compaction tests using vibratory rollers. The tests were carried out with the optimum frequency and amplitude set for each test. The compaction after each rolling was measured with a non-nuclear density meter, and the number of rolling times was set to 10. The length of the test section was 50 m, and the speed of the roller was controlled at 3–3.5 km/h to ensure the compaction quality. Cores were drilled and sampled from the final compacted surface texture to calibrate the compaction with a non-nuclear density meter.
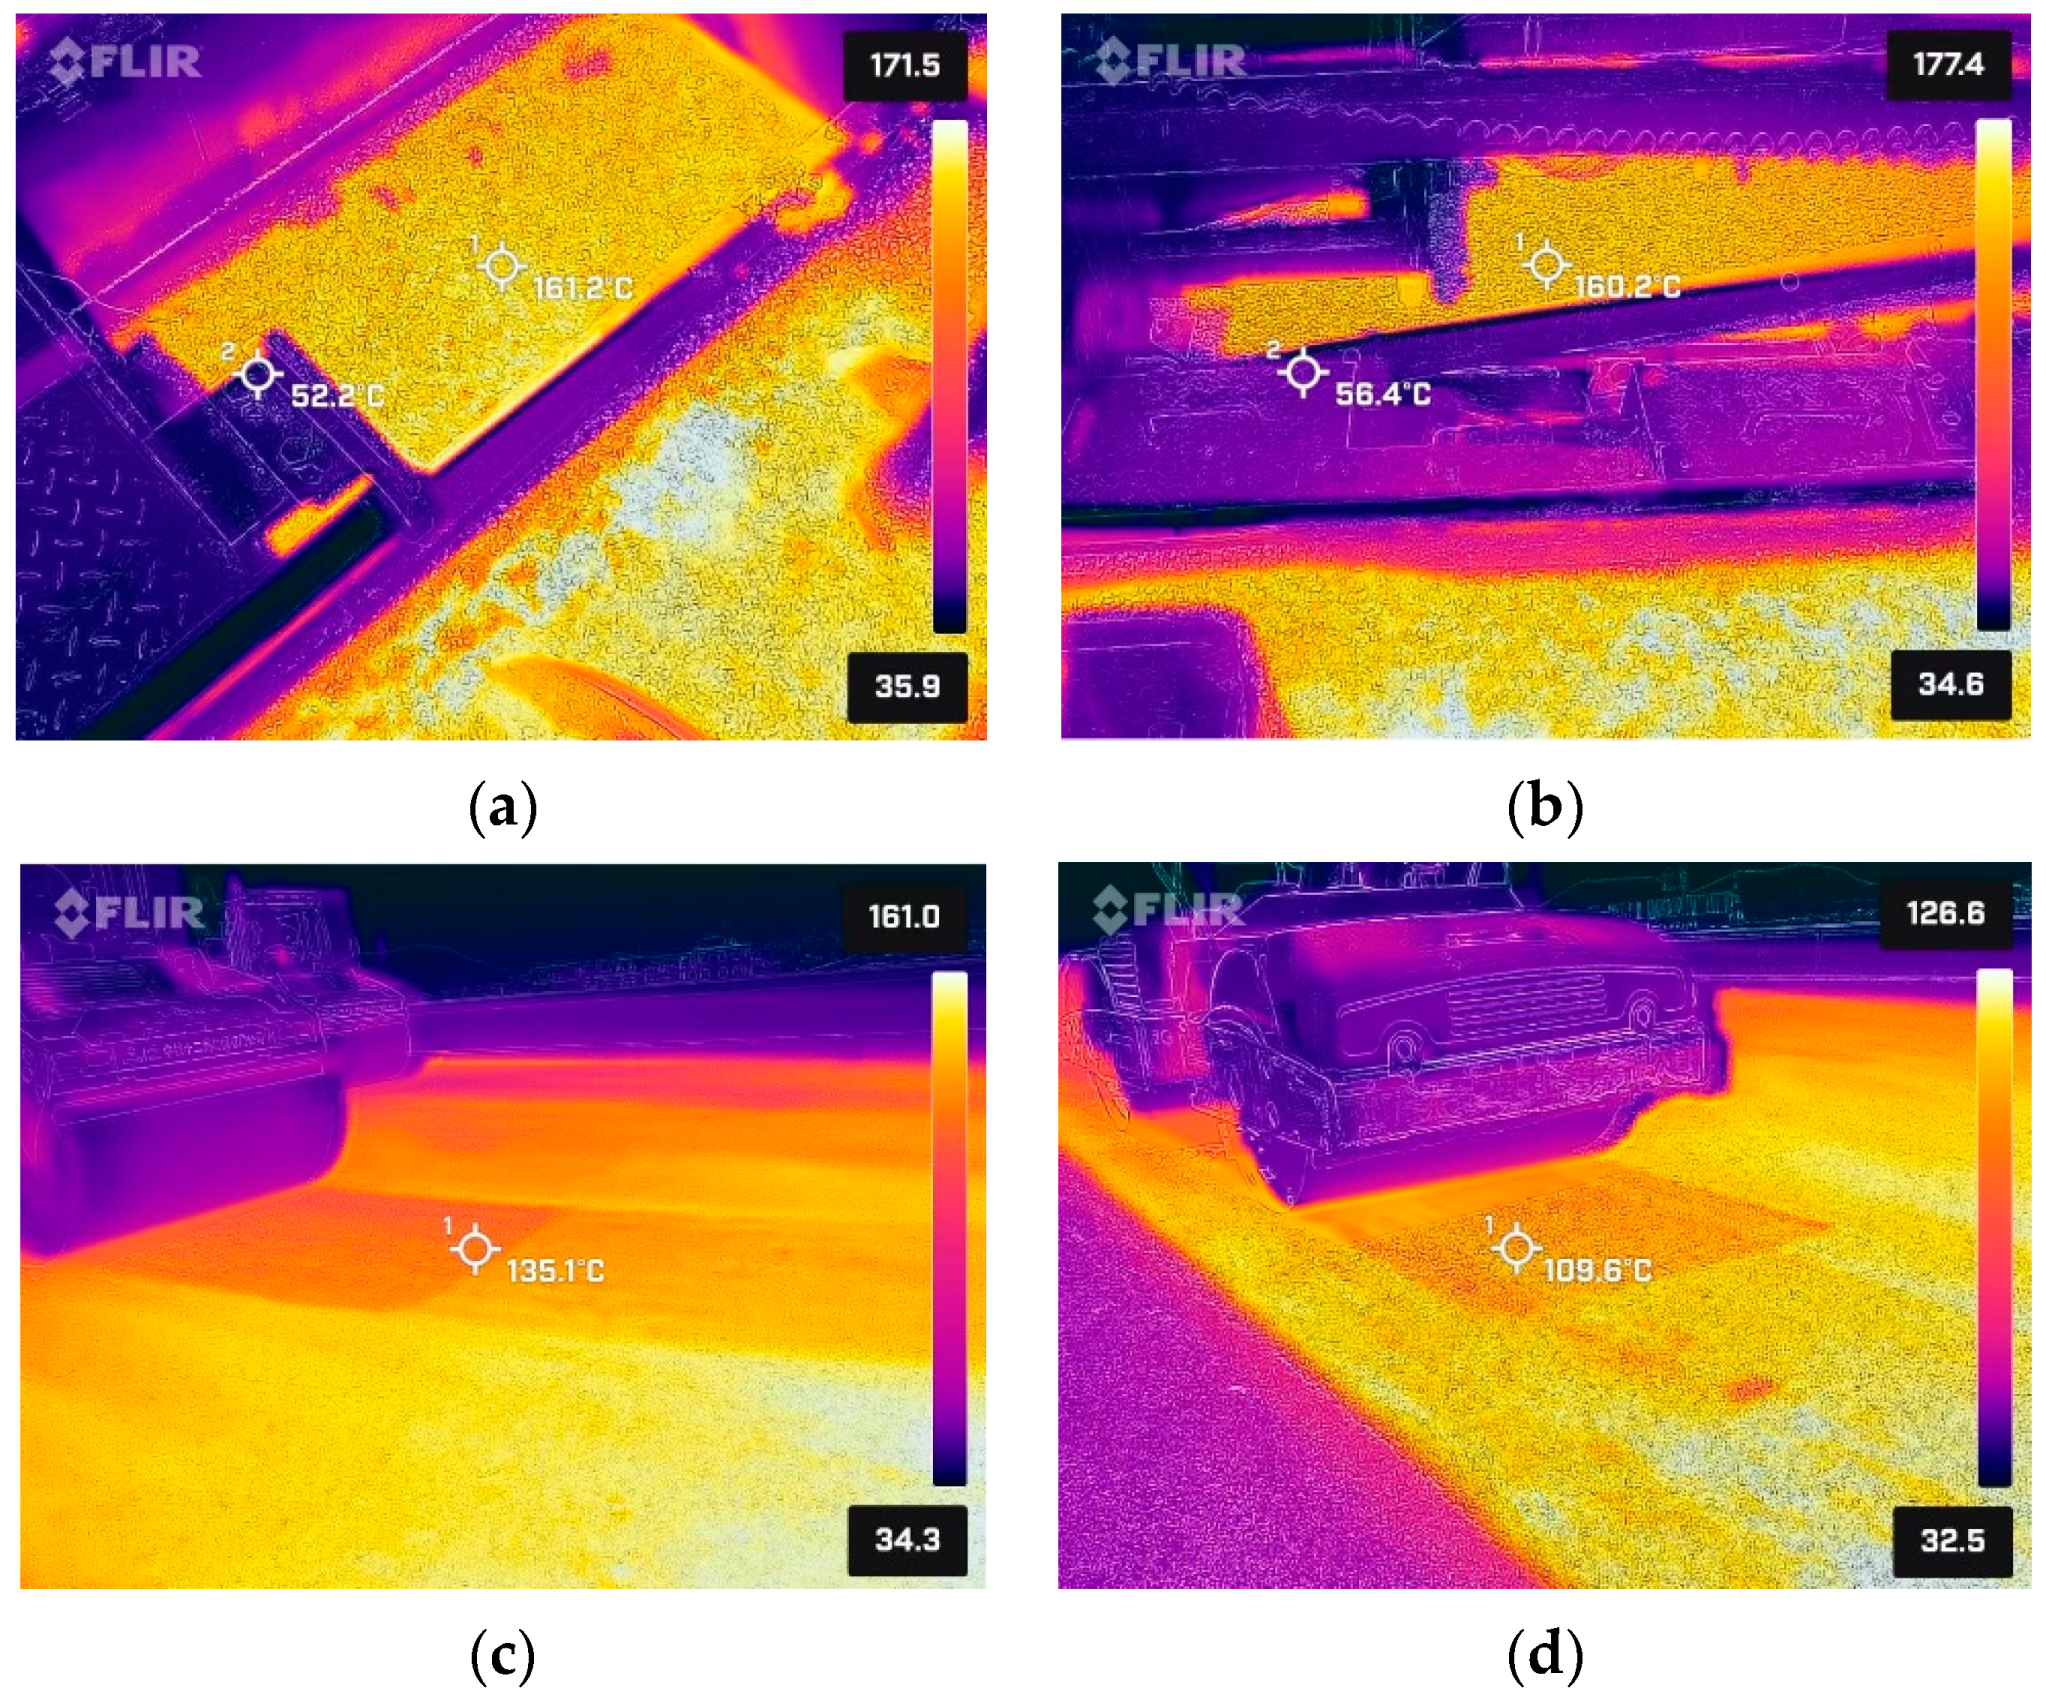
FLIR handheld infrared cameras [
31,
32,
33] were used to monitor the temperature of asphalt mixture at different construction sites in real time. As the surfaces of objects at different temperatures radiate infrared light outwards, thermal imagers are able to convert the radiated energy into an electrical signal that is displayed as an image of the temperature field [
34]. An infrared imager was used to test and evaluate the temperature uniformity of the mixture at each stage of the construction process. To ensure that the results are comparable, the thermal infrared imaging equipment used must be calibrated with a mercury thermometer according to the following steps: (1) Handheld thermal infrared imaging equipment with the lens oriented perpendicular to the unrolled SMA-13 asphalt pavement after paving (flat view), with a fixed lens height of approximately 1 m. (2) Switch on the thermal infrared imaging equipment and record the temperature T1 of the SMA-13 asphalt pavement, while the temperature T2 of the SMA-13 structural layer is measured using a mercury thermometer inserted at a position approximately 2 cm inside the pavement. (3) Correction value D = T1 − T2 for the detection of temperature at a height position of 1 m in the flat view of a handheld thermal infrared imaging device. (4) Thermal infrared imaging temperature calibration result T = TR + D, where TR represents the actual temperature reading of the thermal infrared device, as shown in
Figure 5.
3.3. Working Temperature
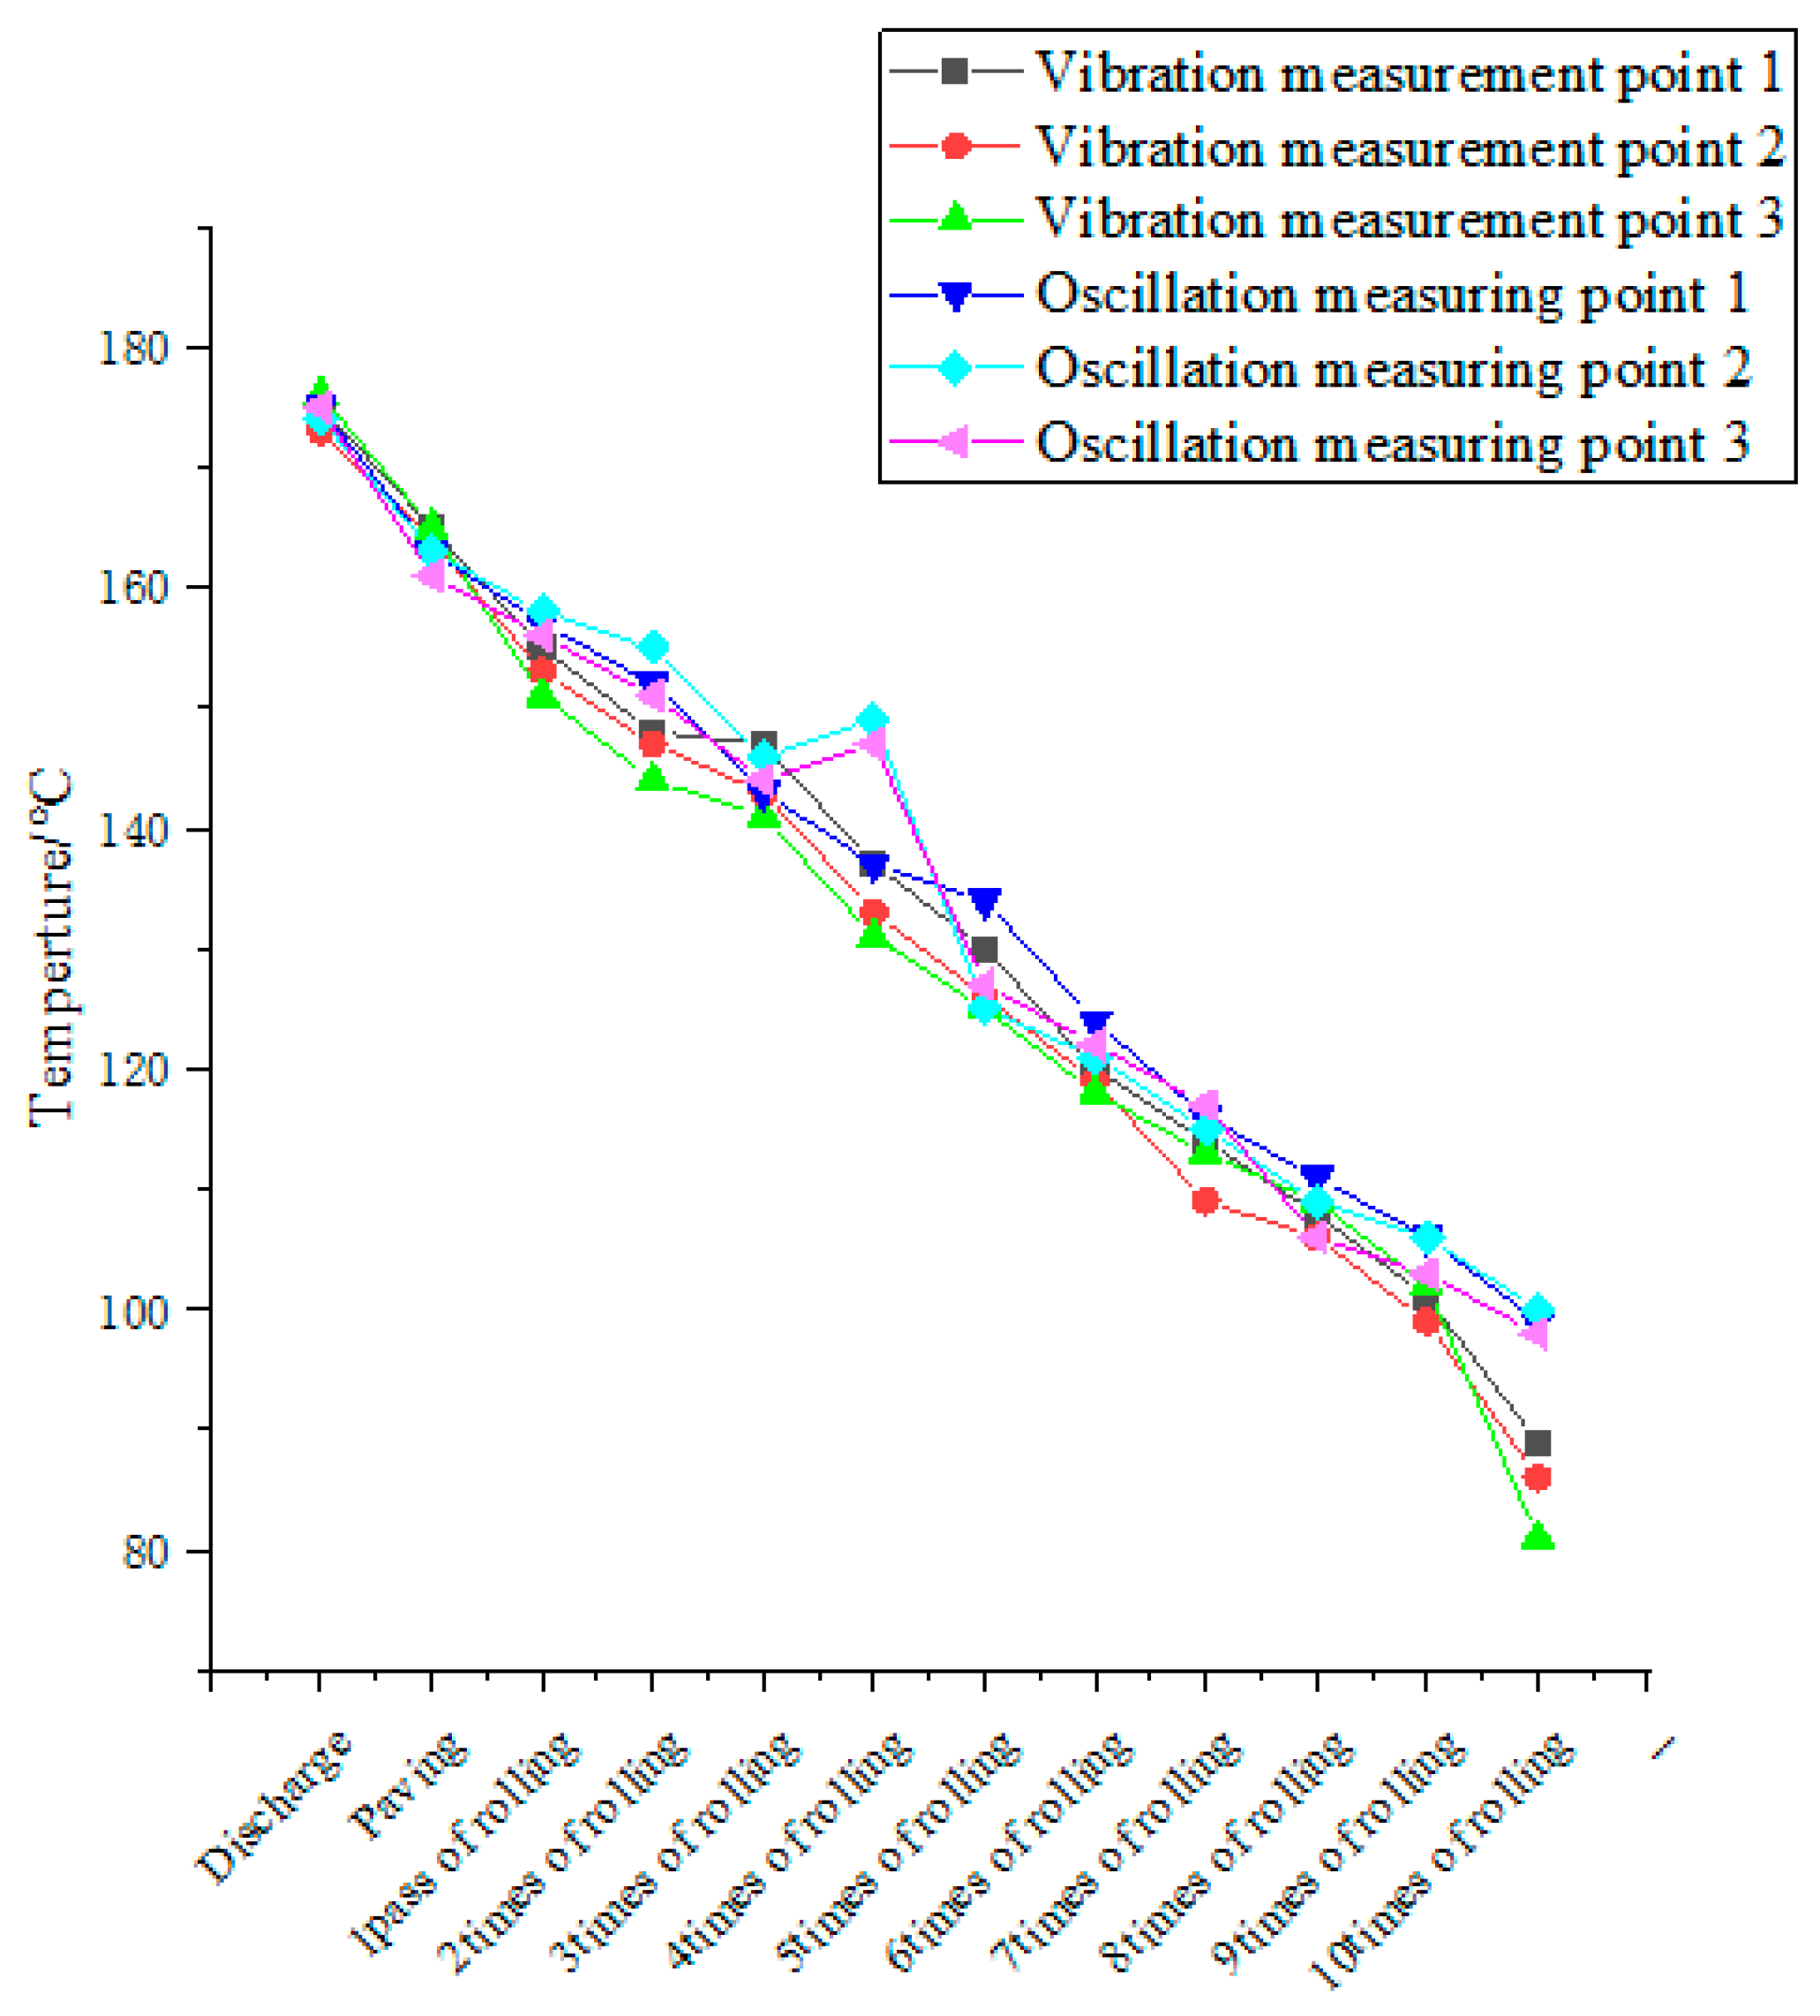
The construction temperature was tested at different numbers of rolling times, and the results are shown in
Figure 6. As can be seen from
Figure 6, the paving temperature was basically close at all measurement points, with a drop of 9–14 °C compared with the arrival temperature. This indicates that due to the high specific heat capacity of the cement concrete bridge deck system, it conducts heat quickly, resulting in rapid heat dissipation from the asphalt mixture. Differences in the temperature distribution of the mixture in other construction sessions are related to the wind speed and the amount of solar radiation during the testing process. The oscillatory compaction process is superior to the vibratory compaction process in terms of temperature maintenance because the horizontal oscillation effect fills the mastic gravel into larger pores on the surface, reducing the contact area with air and reducing the rate of heat exchange. In both vibratory and oscillatory compaction, the construction temperature drops to below 120 °C after 6 times and below 100 °C after 10 times.
3.4. The Influence of the Rolling Process on the Size of the Compaction
Three representative measuring points were selected for each section, and the compaction of the measuring points after each compaction was measured using a non-nuclear density meter in five directions. The cores are taken at the center of the measuring points, and the raw data of the non-nuclear density meter are calibrated by determining the gross bulk density of the core samples using the surface dry method, as shown in
Figure 7.
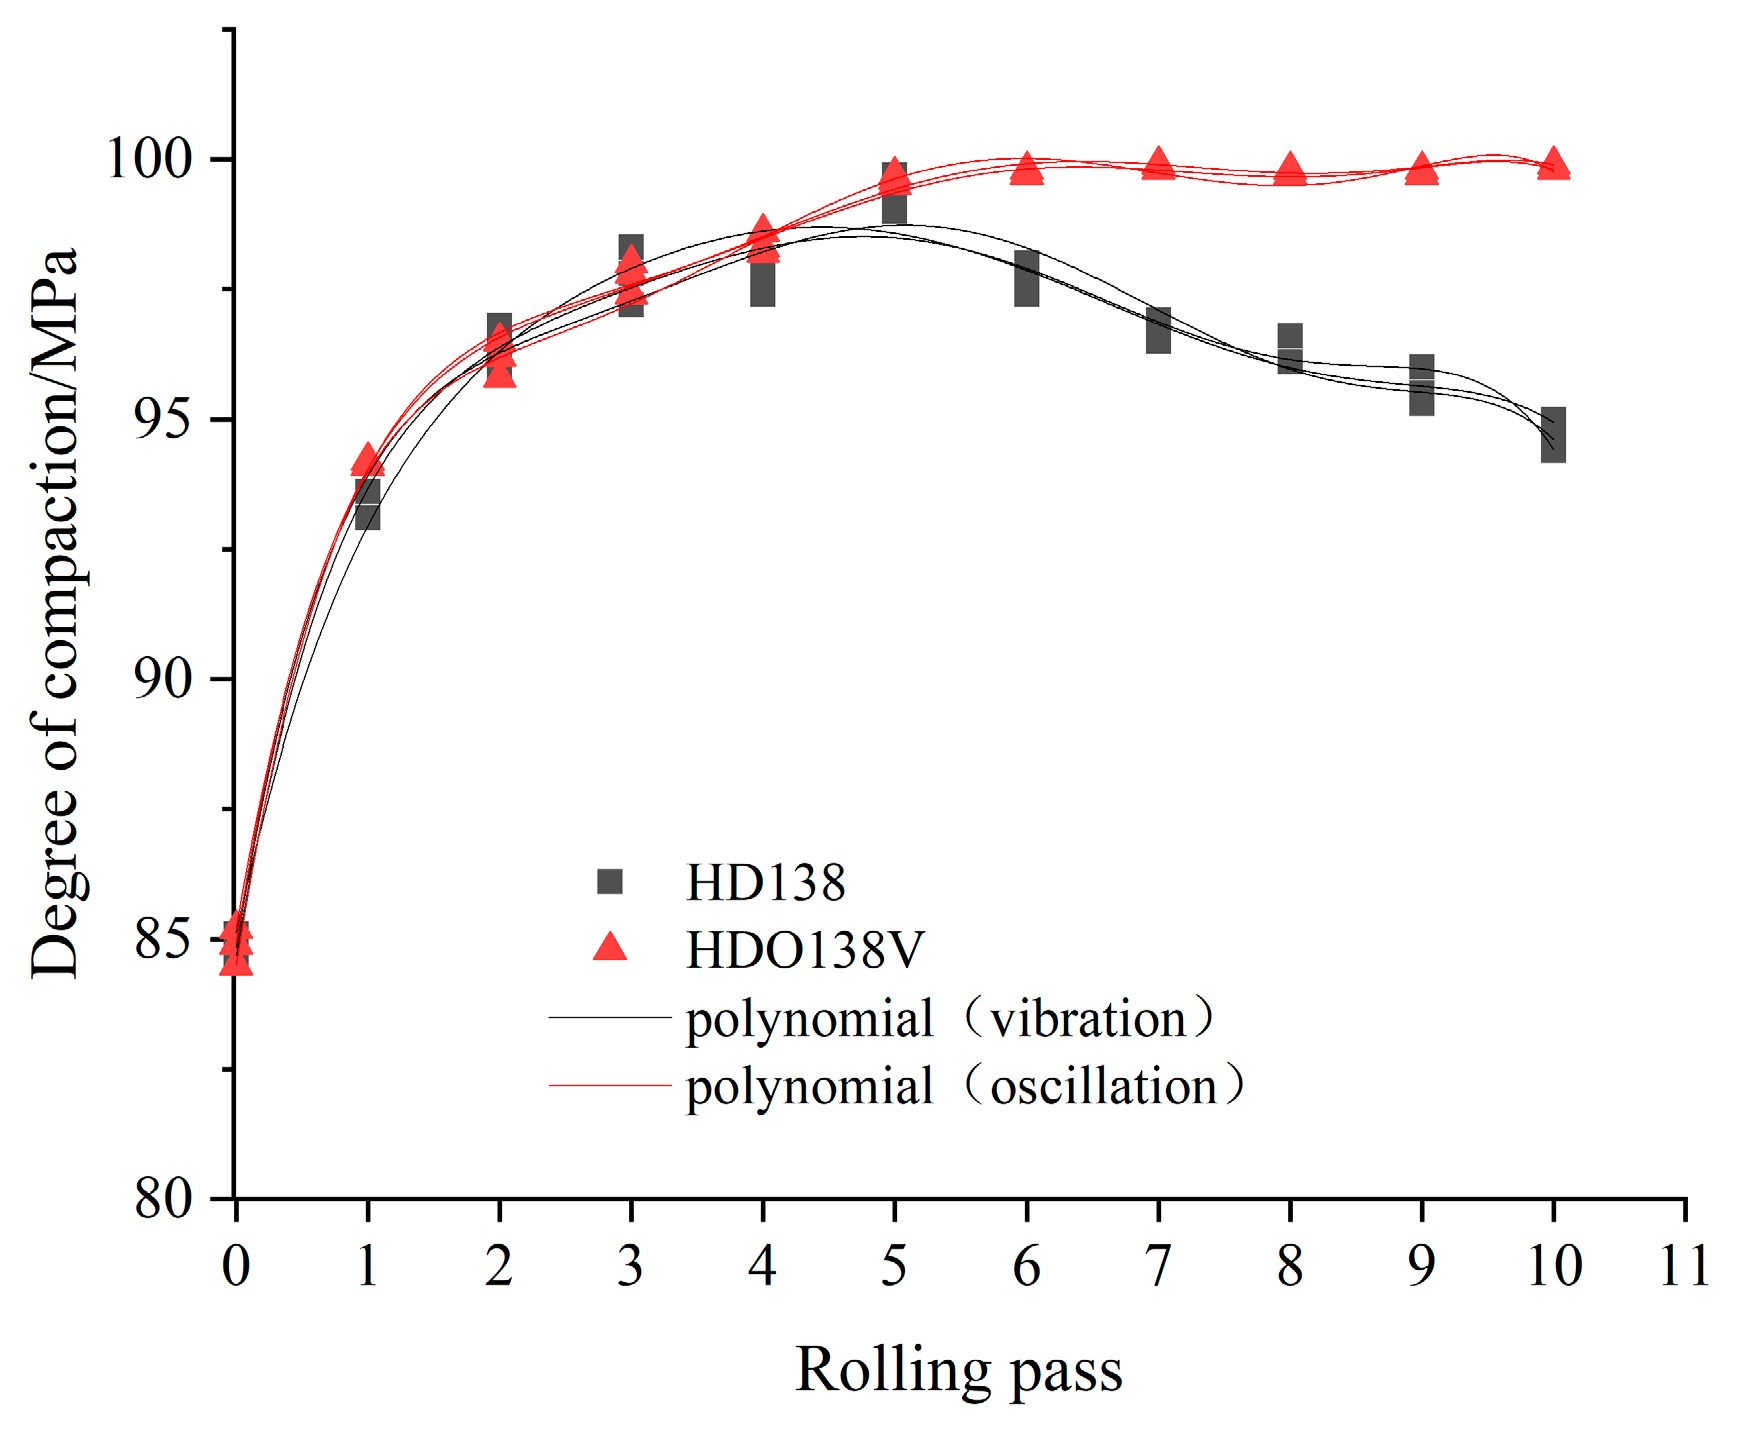
Figure 8 shows a comparison of the compaction changes between the oscillating and vibrating rollers when rolling the SMA-13 bridge deck. The test results show that both oscillatory and vibratory compaction can meet the theoretical compaction requirements, while the compaction of the mixture reaches a relative peak after 5 times. Combined with the temperature test results, the compaction increased by 10.5–11.4% after the first pass of the vibratory roller and 9.2–10.5% after the first pass of the vibrating roller, indicating that the compaction of the mixture can be significantly improved by the vibrating of the roller under high temperature.
It is shown that the construction temperature of SMA-13 asphalt mixture for bridge decks is greater than 120 °C, which is conducive to the formation of compaction.
After vibratory rolling for 5 times, the compaction of the bridge deck SMA-13 reaches its peak in a stable trend, and too much rolling does not increase the contribution of the compaction effect. This indicates that after the energy absorbed by the paving layer has reached saturation, the oscillation energy of the oscillating compaction wheel then propagates along the horizontal direction within the layer, achieving a rolling effect under the influence of alternating shear stresses in the horizontal and vertical directions, making full use of the vibration energy and causing the mixture to rearrange to achieve dense compaction.
The vibratory roller shows a slight decrease at the fourth pass and then reaches a peak after the fifth rolling pass. This indicates that the excitation force generated by the vertical vibratory compaction of the vibratory roller is applied to the paving layer, most of which is absorbed by the paving layer and a small portion is transferred to the lower bridge structure, resulting in a smaller compaction growth rate after the initial compaction compared with the vibratory roller. Continue to increase the number of rolling variables instead of a smaller compaction phenomenon, indicating that excessive vibration rolling not only cannot improve the compaction of asphalt pavement, but because the pavement can absorb the maximum energy, vertical vibration will be excess excitation work reflected back to the compacted pavement. The asphalt mixture will then be internally overvibrated from the compact state, destroying the compactness of the paving layer.
At the same time, according to
Figure 6, as the rolling times increase, the lower the temperature of the asphalt mixture, the continuous vertical excitation force of the vibratory roller will destroy the skeleton of the mixture. At the same time, the viscosity of the asphalt is too high, resulting in poor flowability, and the asphalt slurry is unable to fill the pores formed after the skeleton has been destroyed, and thus the compaction becomes smaller and smaller. The alternating shear stress of the oscillatory roller not only does not destroy the skeleton, but the “rubbing” effect lifts the excess asphalt slurry to the surface, filling the open pores and ensuring compaction while improving impermeability.
3.5. Influence of the Rolling Process on Compaction Uniformity
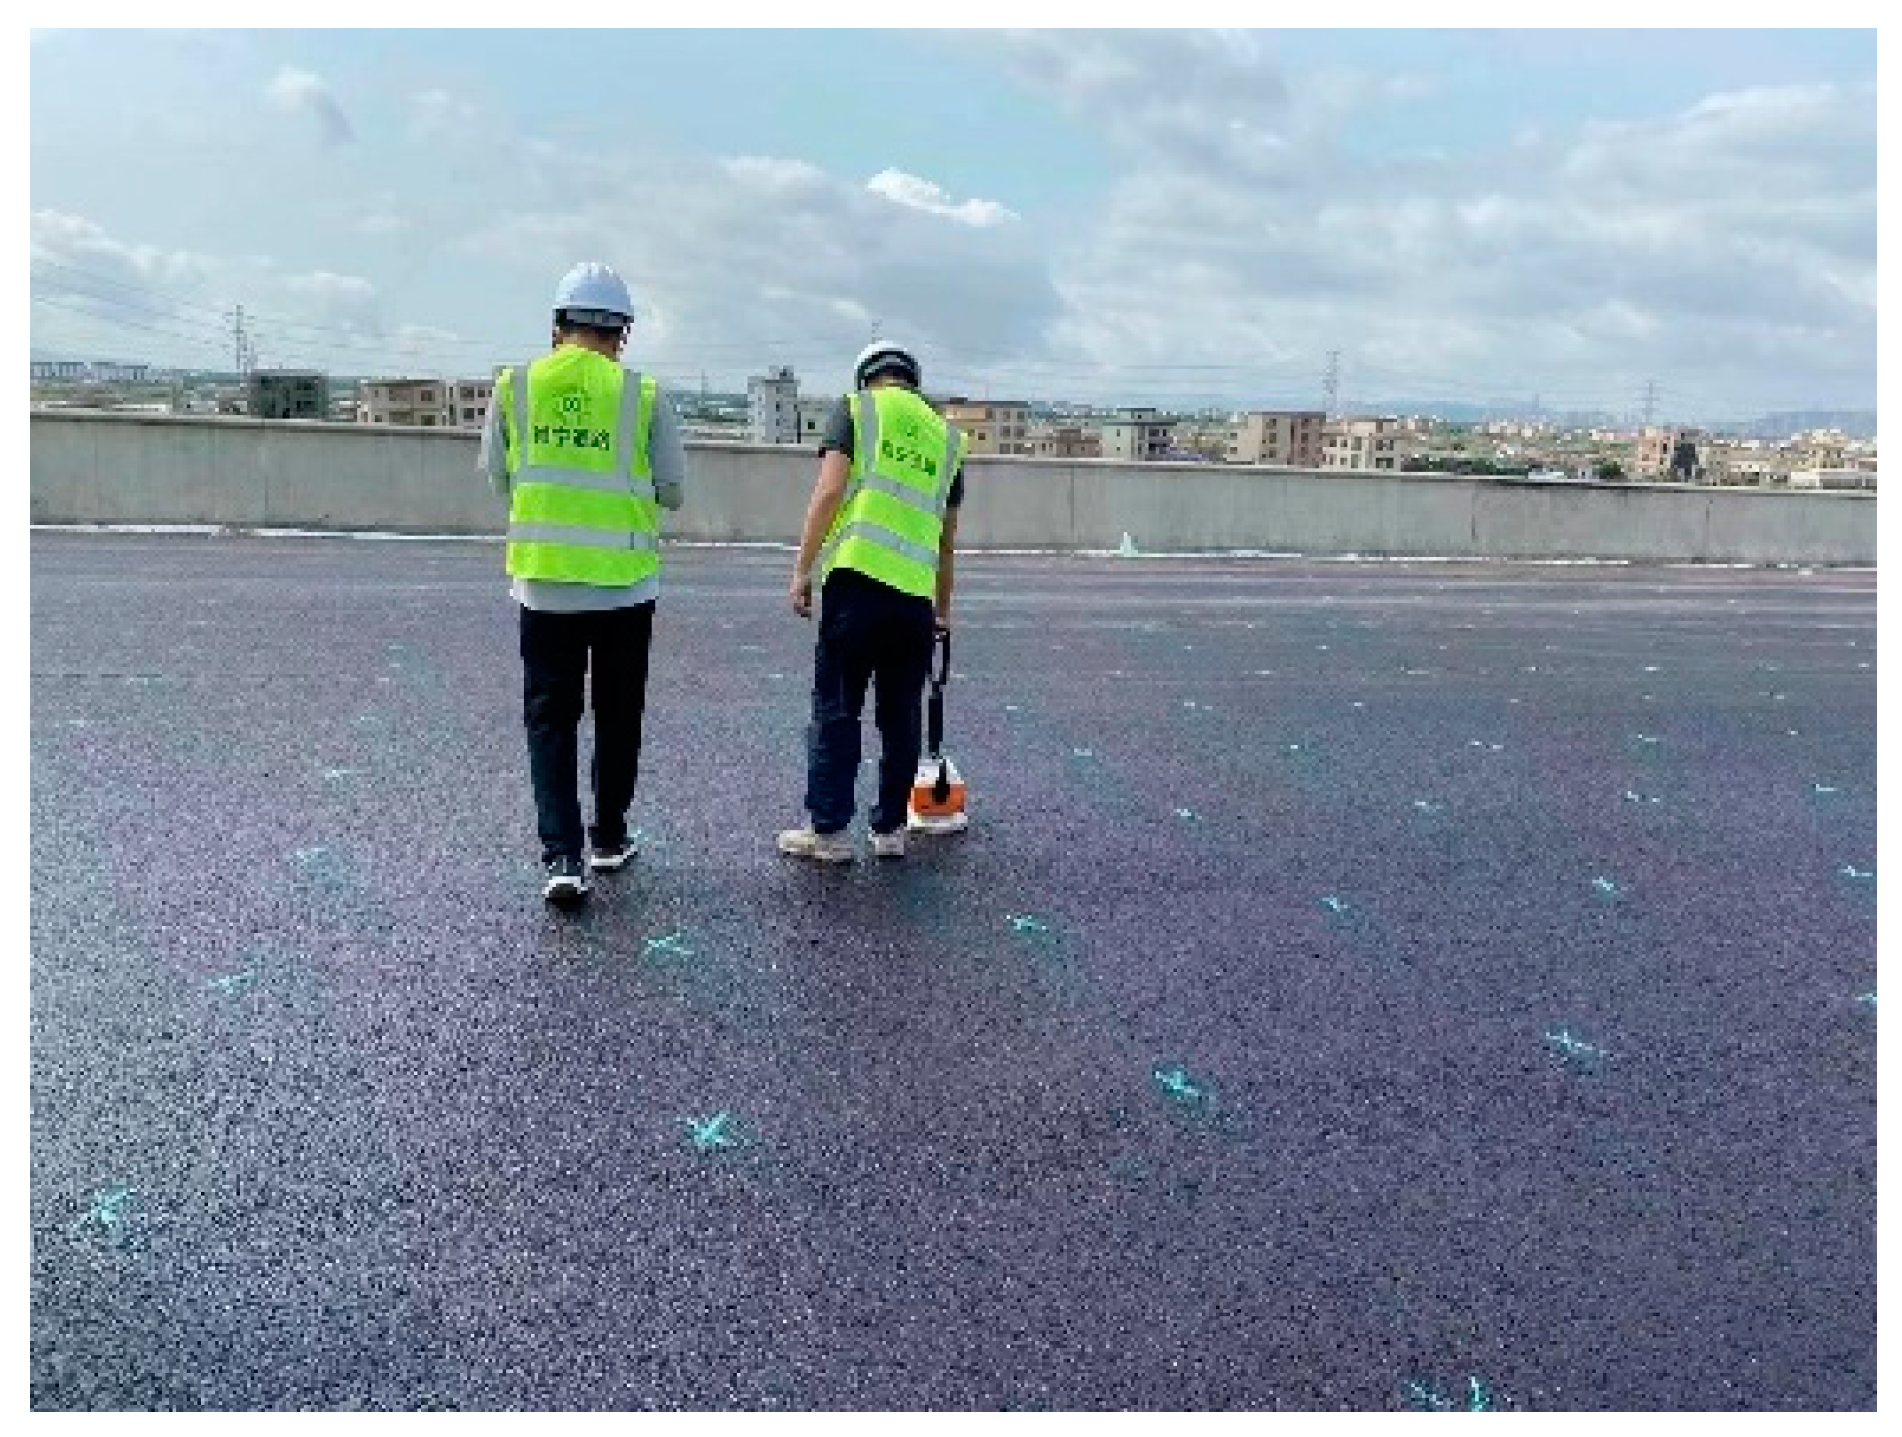
The effect of oscillatory compaction and vibratory compaction on the compaction effect of SMA on bridge decks is further demonstrated by a stretched grid inspection of the completed pavement compaction with a longitudinal interval of 1 m and a transverse interval of 1 m, as shown in
Figure 9.
The test results show that under the same compaction conditions, the types of rolling machines can meet the theoretical compaction requirements, and the HDO138V oscillation roller achieves a higher average theoretical compaction than the HD138 vibratory roller.
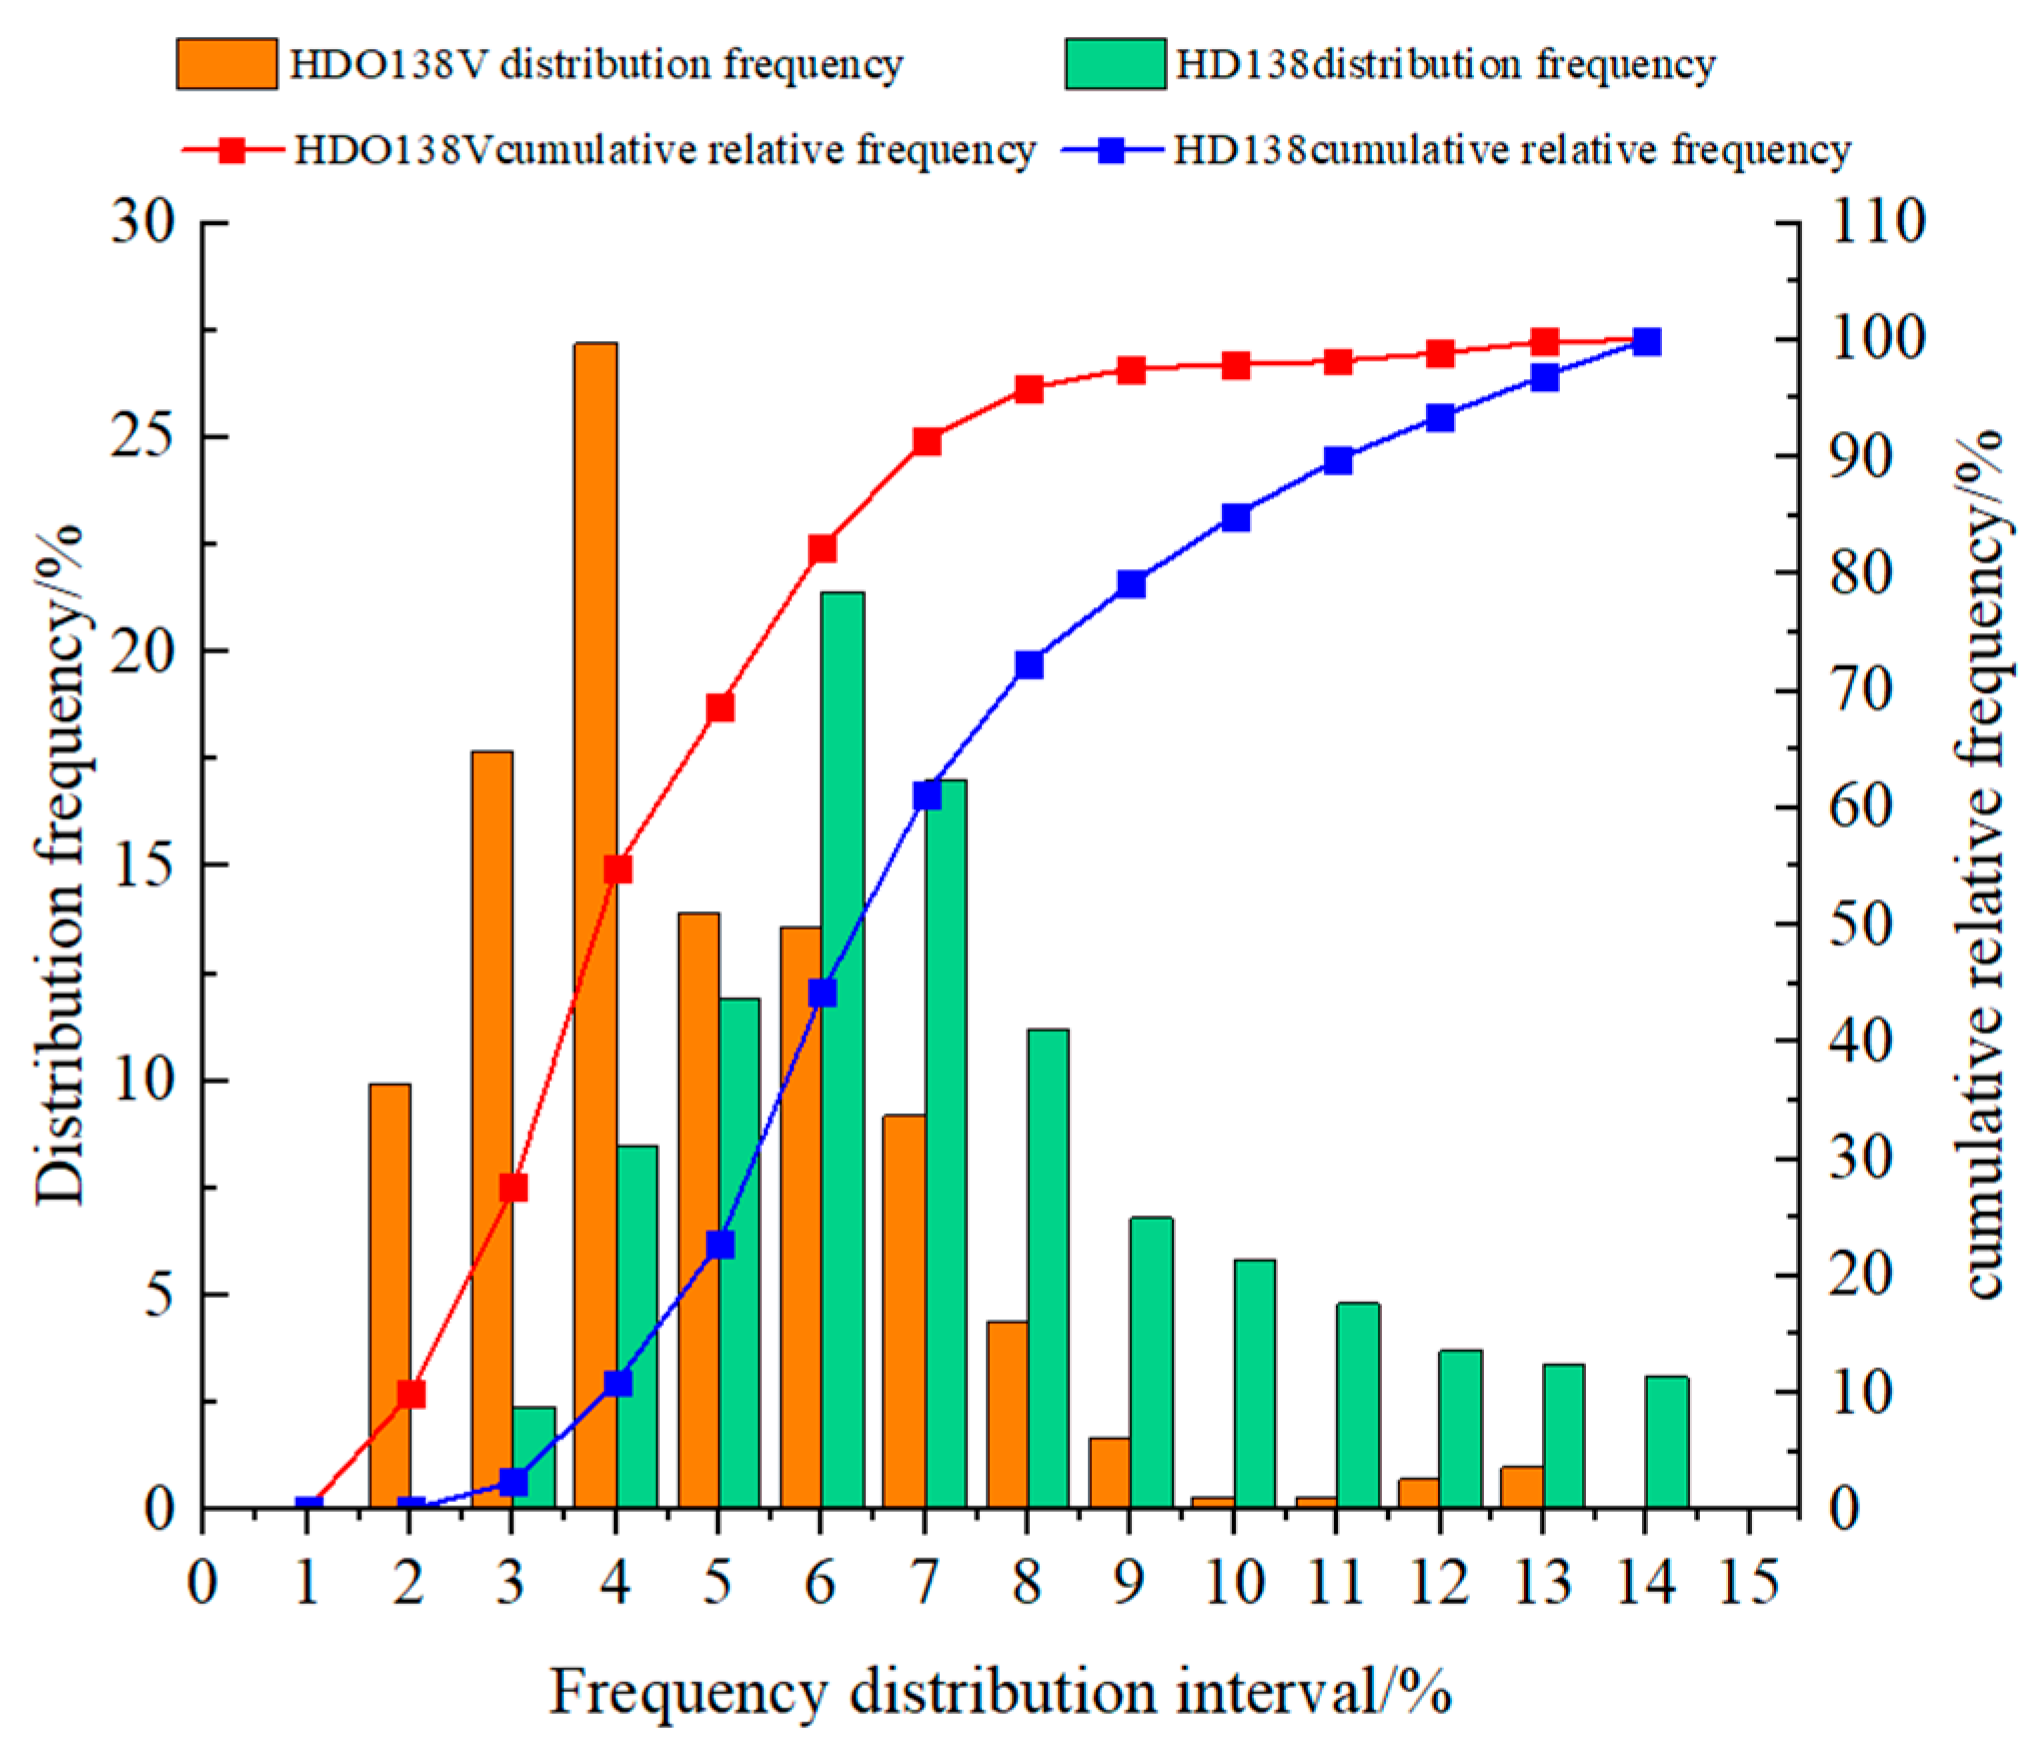
Figure 10 and
Table 3 show the statistics for the compaction of the bridge deck pavement with vibratory rollers and oscillation rollers. The test results show that there is a significant difference in the compaction of the SMA-13 asphalt wearing course of the bridge deck under a tightly followed rolling process of 10 times. For oscillatory compaction, the density, compaction, and void ratio of the pavement tend to be in the direction of dense compaction, increasing the proportion of voids not less than 2%, while the proportion of voids greater than 6% are kept at a very low level, with a smaller distribution of voids and a more uniform distribution of compacted density. The void ratio is mainly distributed in the range of 2.5% to 5%, while the average percolation coefficient is only 7 mL/min, indicating that the oscillating compaction wheel can play a rubbing effect after the compaction density of the pavement layer has reached the maximum, and achieve effective slurry lifting and reduce the open pore space.
For the vibratory roller, the distribution of air voids was wide, ranging from 2.5% to 9%. The percentage of measured points with a void ratio of higher than 6% for bridge compaction was 20.7%, and the percentage of measured points with a void ratio of higher than 7% was 10.2%. The average measured permeability coefficient was 86 mL/min, with a maximum value of 120 mL/min, indicating that there is a greater risk of water permeation in asphalt pavement with a void ratio higher than 7%. It shows that excessive rolling of the vibratory roller not only fails to improve the compaction density of the pavement, but also greatly increases the probability that the compacted pavement will be overcompacted and vibrated apart, resulting in a decrease in the compaction of the pavement.
4. Wear Evaluation Method of Road Surface Construction Based on Digital Image Technology
4.1. Fundamentals of Digital Imaging
In the past, many studies have been conducted to evaluate the wear and tear of the surface texture by means of the rolling process during construction. Only with more subjective visual judgment, it is difficult to accurately reflect macro indicators, such as structure depth. As a result, the wear of the structure during rolling will have a direct impact on the skid resistance and durability of the pavement in service. New asphalt pavement structures are typically a darker black in color under the asphalt membrane coating. The color difference between the worn area and the unworn areas of the pavement is obvious with different rolling variables, and provides a good basis for the grayscale characteristics of the digital image technology [
35,
36,
37].
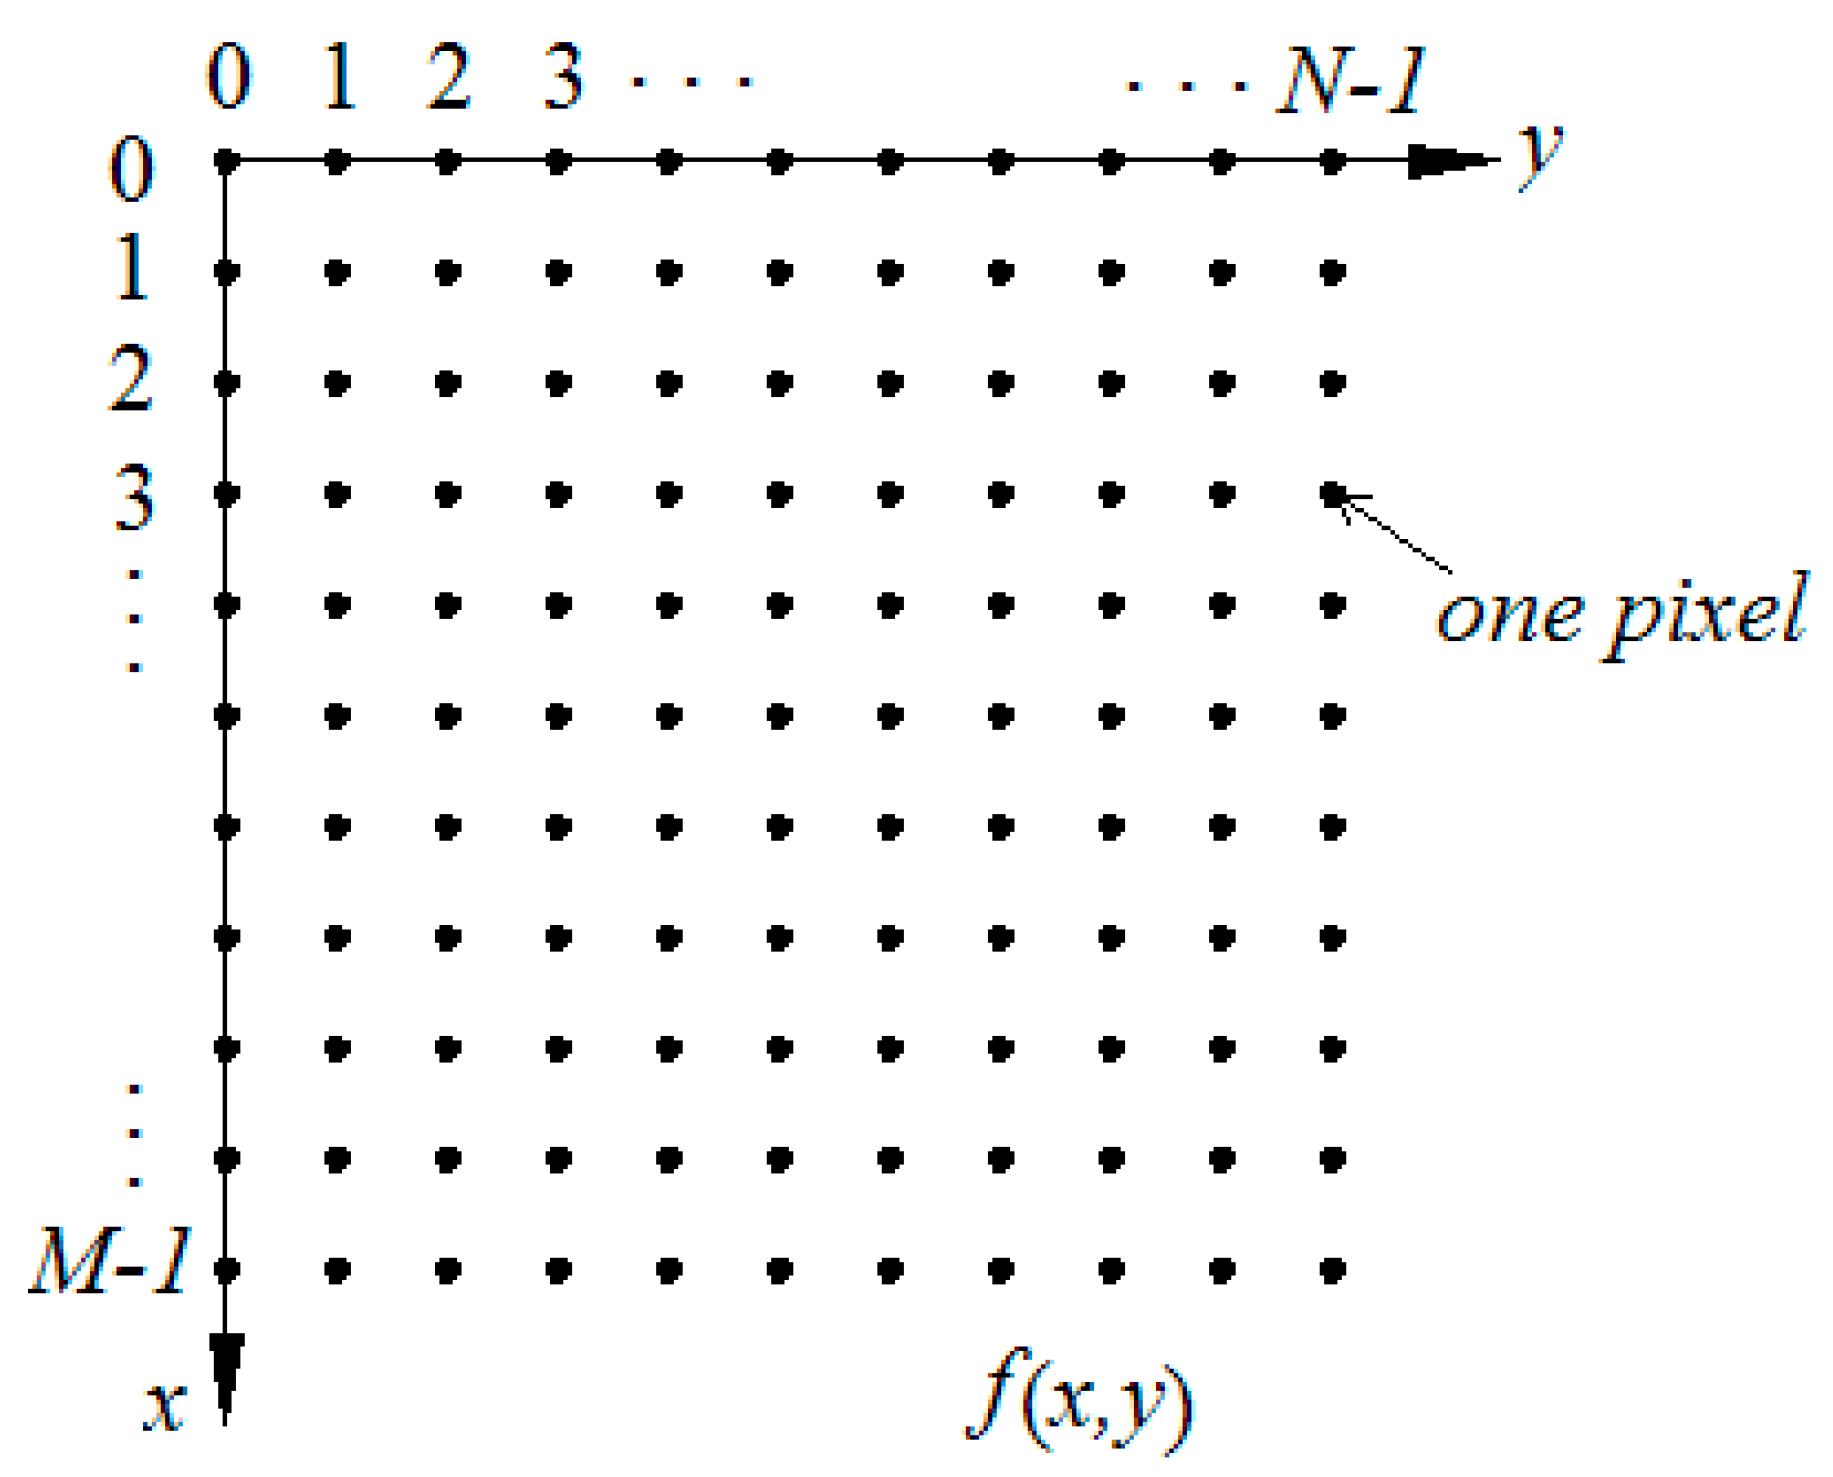
The basic principle of digital image technology is to use optical components to convert the acquired image information into discrete digital matrix information, which can be extracted into two-dimensional matrix data by software recognition, as shown in
Figure 11. By quantizing the pixel values of the digital image, the pixel distribution matrix of the surface texture can be obtained.
4.2. Image Acquisition and Analysis
During the image acquisition process, direct sunlight must be avoided, while the camera lens should be held parallel to the road, and the shooting distance should be fixed at about 50 cm. The uneven light intensity and the reflective phenomenon of the asphalt film make it difficult to identify the wear characteristics of the road surface. Therefore, the pavement image must be filtered and denoised, enhanced, and grayed out, and then binarized to extract the target features. The Otsu method (maximum interclass variance method) is a more effective binarization method. Based on the feature that the grayscale value at the wear location is larger than the background grayscale value, the Otsu method is used to calculate the grayscale threshold and perform segmentation of the wear features from the background image to obtain wear information.
For an image with a size of
M ×
N, assume that the number of pixels is
N, the value range of gray level is [0,
L − 1],
ni represents the number of pixels with a gray level of
i, and
Pi represents the probability of the occurrence of points with a gray level of
i; then:
According to the gray value characteristics, the pixels in the image are classified into background class and target class based on the threshold value t, which are represented by
C0 and
C1, respectively. The gray value range of elements in
C0 is between [0,
t], while the gray value range of elements in
C1 is between [
t + 1,
L − 1]. For the whole image, its gray mean is:
The mean values of
C0 and
C1 are:
The interclass variance is defined as:
where
; when the value of
in the above formula is the largest, the corresponding t value is the ideal segmentation threshold [
38].
The morphological features of the white areas of the binarized image are extracted, and the number of nonzero pixels of the image is counted by writing a program in MATLAB, which in turn allows for obtaining the proportion of the cumulative area of the worn area to be obtained, which can be defined as the wear rate:
where
w represents the wear rate, %;
Si represents the area of the i
th wear location, mm
2;
S0 represents the total area of the road surface corresponding to the image, mm
2;
Nw represents the number of nonzero pixel points in the binary image; and
N0 represents the total number of pixels in the binary image.
4.3. Wear Evaluation Results of Road Table Construction Based on Digital Image Technology
After image grayscale processing and binarization calculations, the wear results for each measurement point of each grinding scheme road section were counted and are shown in
Table 4. The wear rate of the surface texture increases with the increase in the number of times. After 5 to 6 times, the wear rate of the surface texture is less than 1%, which can be considered an intact structure with good angles. After 6 times, the wear rate of the surface texture increases at a higher rate. The wear rate of the structure after 9 times is the most serious, basically over 10%.
The mixture is plastic at high temperatures, and most of the impact energy is absorbed and converted into work performed to overcome the frictional resistance embedded in the particles of the mixture and the viscosity of the asphalt. As the temperature of the surface layer decreases and the modulus of stiffness of the mixture increases, the surface of the asphalt concrete forms a relatively hard and thin-shell structure. At this point, the pavement reaches a flatter and denser state, and the effective contact area of the steel wheels is greatly reduced. At this point, the use of steel wheel oscillation rolling is likely to result in the surface structure corners being crushed and broken, forming a “white spot” phenomenon.
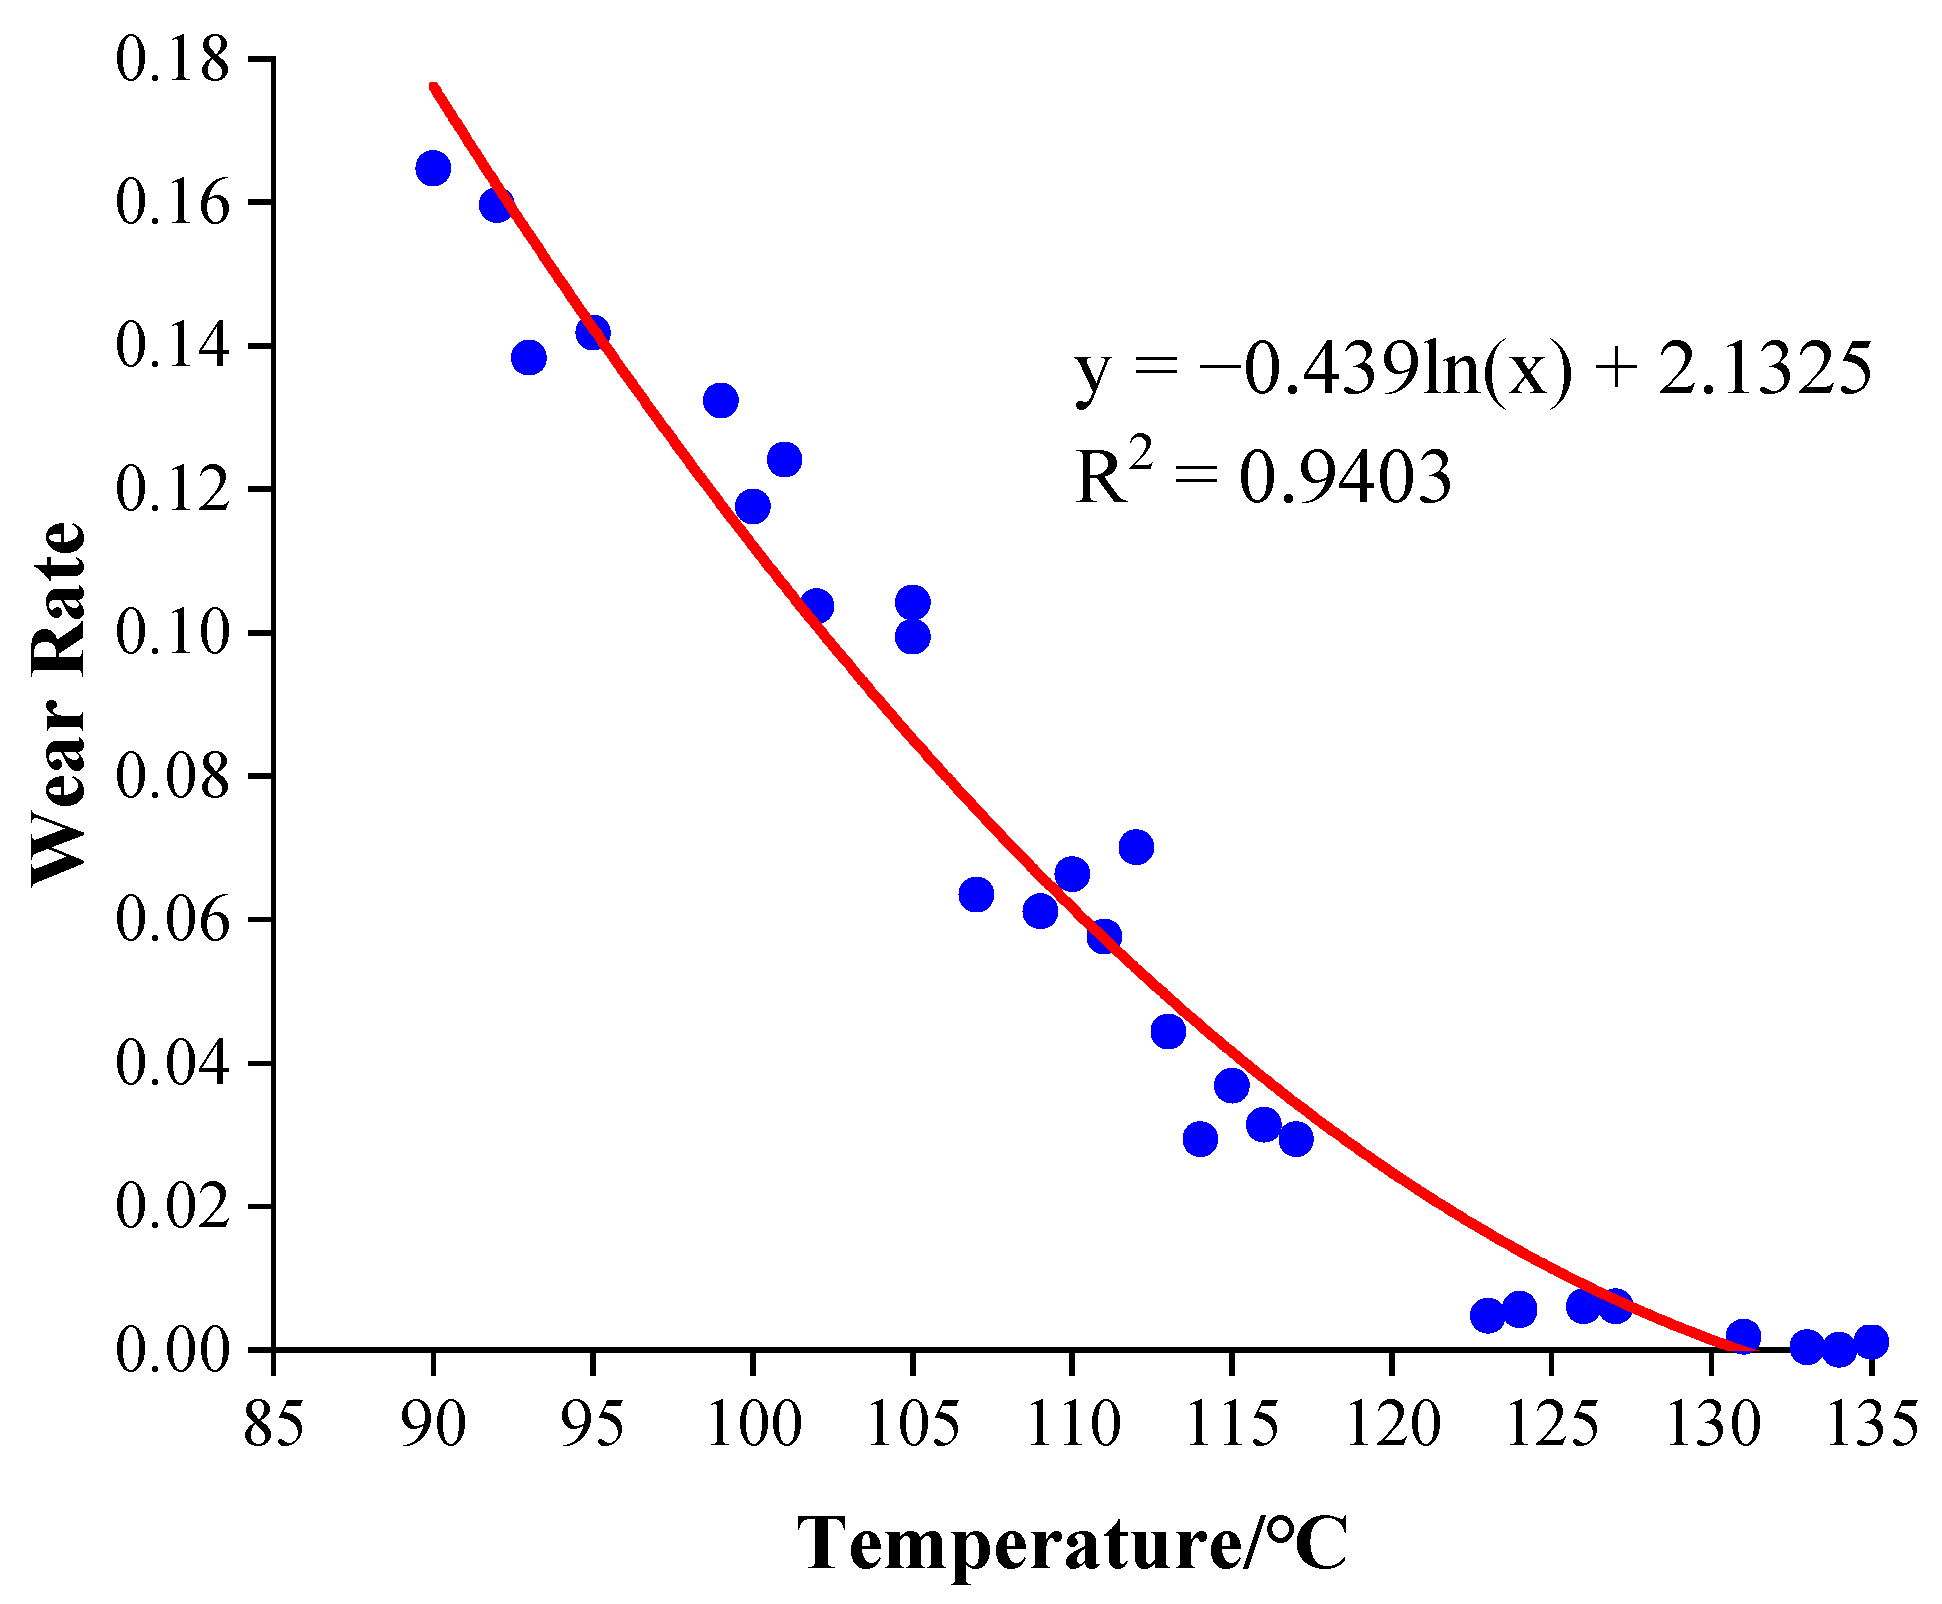
The influence of the mixture temperature on the wear of the structure during oscillation rolling was further analyzed by plotting the regularity curve based on the temperature and wear rate before oscillation rolling of the last steel wheel at different measurement points, as shown in
Figure 12. As the temperature of the pavement decreases, the wear rate of the surface texture by oscillation rolling of the steel wheel shows an increasing trend, and there is a good exponential relationship between the steel wheel rolling temperature and the wear rate of the road surface structure with a correlation coefficient of 0.940. Test data indicate that the use of steel wheel compaction at pavement temperatures below 105 °C will result in a structural wear rate of more than 10%, indicating that most of the compaction power of vibration at this temperature cannot be absorbed by the mixture. When the pavement temperature is 110–120 °C, the surface texture wear rate is 3–5%; when the pavement temperature is higher than 120 °C, the steel wheel vibration pressure on the surface texture wear is smaller (less than 1%); when the steel wheel oscillation compaction energy can be mostly absorbed by the mixture, compaction effect is better. Therefore, the compaction process should strictly control the pavement temperature of the double steel wheel vibration rolling to avoid damage to the surface texture by the oscillating alternating shear stress energy at low temperature.
5. Evaluation Method of the Skid Resistance of Road Surfaces Based on the Laser Method
5.1. Principle of Detection
In recent years, the road antiskid mechanism and application research has become more and more in-depth, and there are few studies on the influence of the rolling process on the initial skid resistance of asphalt pavement during construction. Pavement skid resistance construction testing and evaluation methods are mainly divided into coarse aggregate texture testing pavement construction evaluation. For coarse aggregate, morphology and texture testing means mainly include a digital image method, laser scanning method, CT scanning, microscope observation, and other testing means. For asphalt mixture, surface texture testing means mainly include a digital image method, laser scanning method, and industrial CT scanning method. Usually, due to the contradiction between testing range and accuracy, there are mainly multidimensional evaluation indicators, such as depth of construction indicators in a large range, fractal dimensional roughness in a small range, and peak intersection angle of contours in skid-resistant construction-sensitive areas.
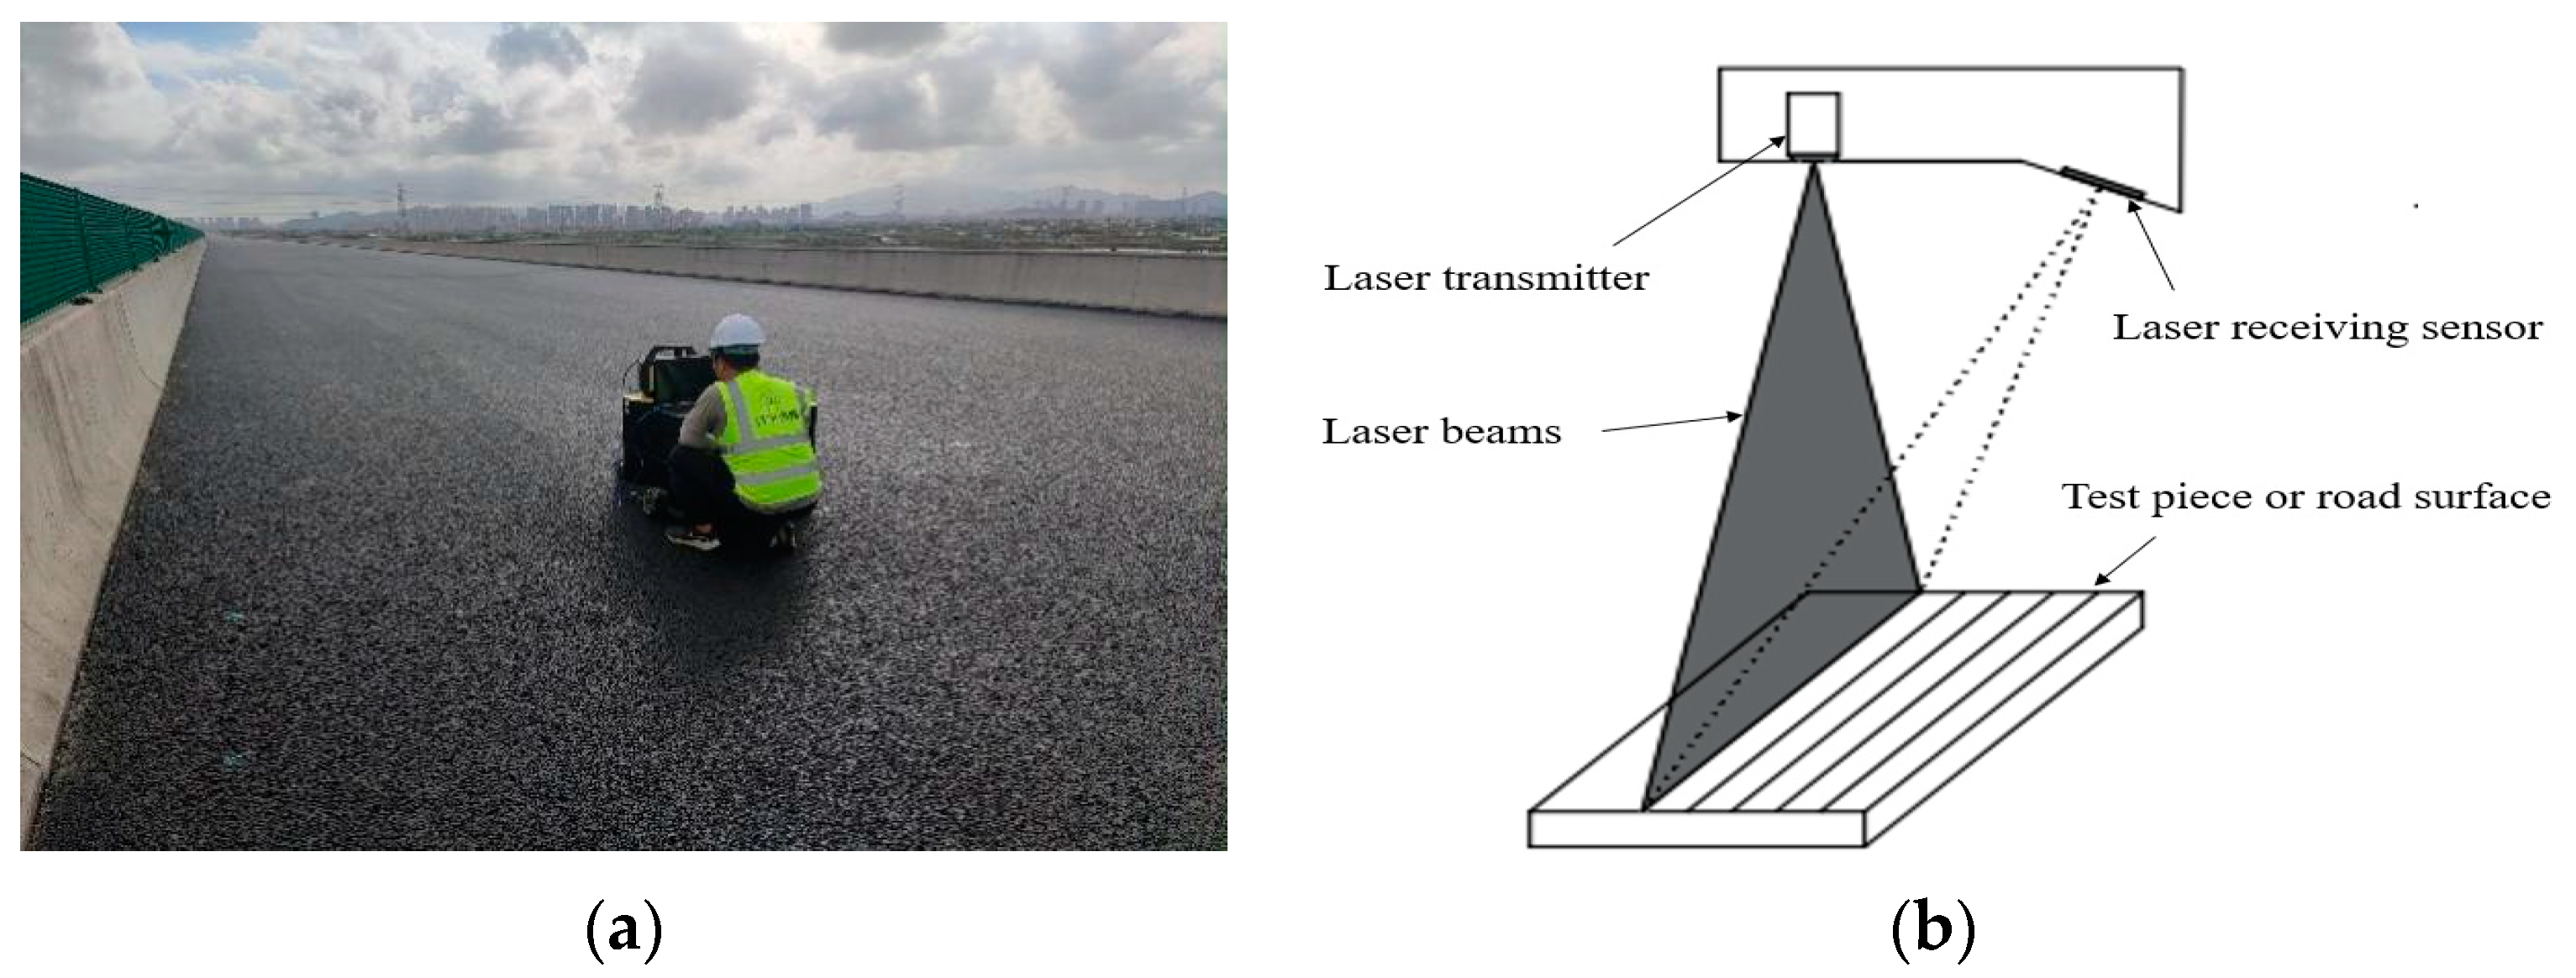
The PATT pavement laser antiskid texture tester reconstructs a three-dimensional surface model of asphalt surface texture, and the height relationship between the different measuring points can be determined, so that the contour construction of the road surface can be obtained [
20,
21,
22,
23,
24,
39], The detection method and the detection scheme are shown in
Figure 13. The calculation formula is
where
PS is the elevation,
count is the laser device measurement,
sf is the magnification factor, and
dp is the laser device point position factor.
5.2. Detection Scheme
Based on the variation of compaction and wear rate with the number of rolling cycles, four 50 m long test sections were selected and rolled 5–8 times according to the previous rolling conditions. Ten measuring t points were selected for each type of rolling section, and random points were selected for the location of the paver’s nondissociation zone. A PATT pavement laser antiskid texture tester was used to efficiently and accurately obtain the three-dimensional surface configuration, microtexture distribution density, and contour peak crest angle of the rolled pavement.
5.3. Principle of Construction Depth Calculation
The PATT pavement laser antiskid texture tester was used to obtain the surface of the pavement texture for different times of oscillatory rolling and to calculate the area of the texture envelope of the two-dimensional contour at unit intervals. Assuming that the first contour envelope area is
A1 and the average section depth is
I1, the following equation can be obtained:
where
A1 represents the constructed envelope area of the 2D contour, mm
2;
d represents the contour line acquisition interval in the Y direction, mm;
I1 represents the average section depth under the 2D contour, mm; and
l represents the length of the contour curve, mm.
This gives the following relationship:
Calculate the constructed envelope area
Ai for each 2D contour (
i = 1, 2, 3, …); then the average constructed depth of the surface is as follows:
where
MTD* is the average construction depth of the road 3D surface, mm;
V is the approximate volume under the construction envelope of the road 3D surface, mm
3;
A is the horizontal projection area of the road 3D surface, mm
2;
D is the width of the scanning
Y-axis direction, mm;
n is the number of contour lines; and
Ii is the average section depth of the i
th contour line, mm.
5.4. Principles of Microtexture Density Calculation
The microtexture of the pavement surface mainly provides the adhesion component, which is a function of the shear strength τi at the pavement interface and the contact area
Ai. The richer the microtexture of the pavement, the greater the adhesion and the better the skid resistance. In order to better evaluate the density of the distribution of the surface texture, the morphological data are collected at the microscopic scale of the three-dimensional surface texture, and the specific surface area of the structure (macroscopic and microscopic) within the range is calculated using the projection plane of the three-dimensional surface texture as a reference, as shown in
Figure 14.
The texture area per unit reference plane is used to characterize the density of distribution of road surface structures, defined as the density of microtexture distribution:
where
SMI indicates the density of microstructure distribution;
AT is the area of microscopic three-dimensional surface graphics, mm
2; and
AP is the plane area of the tectonic profile area (i.e., horizontal projection area), which can be calculated from the side lengths a and b of the measurement area, mm
2. If the
SMI value is close to 1, it indicates that the tectonic distribution of the pavement texture is sparse and the pavement tends to be smooth and flat.
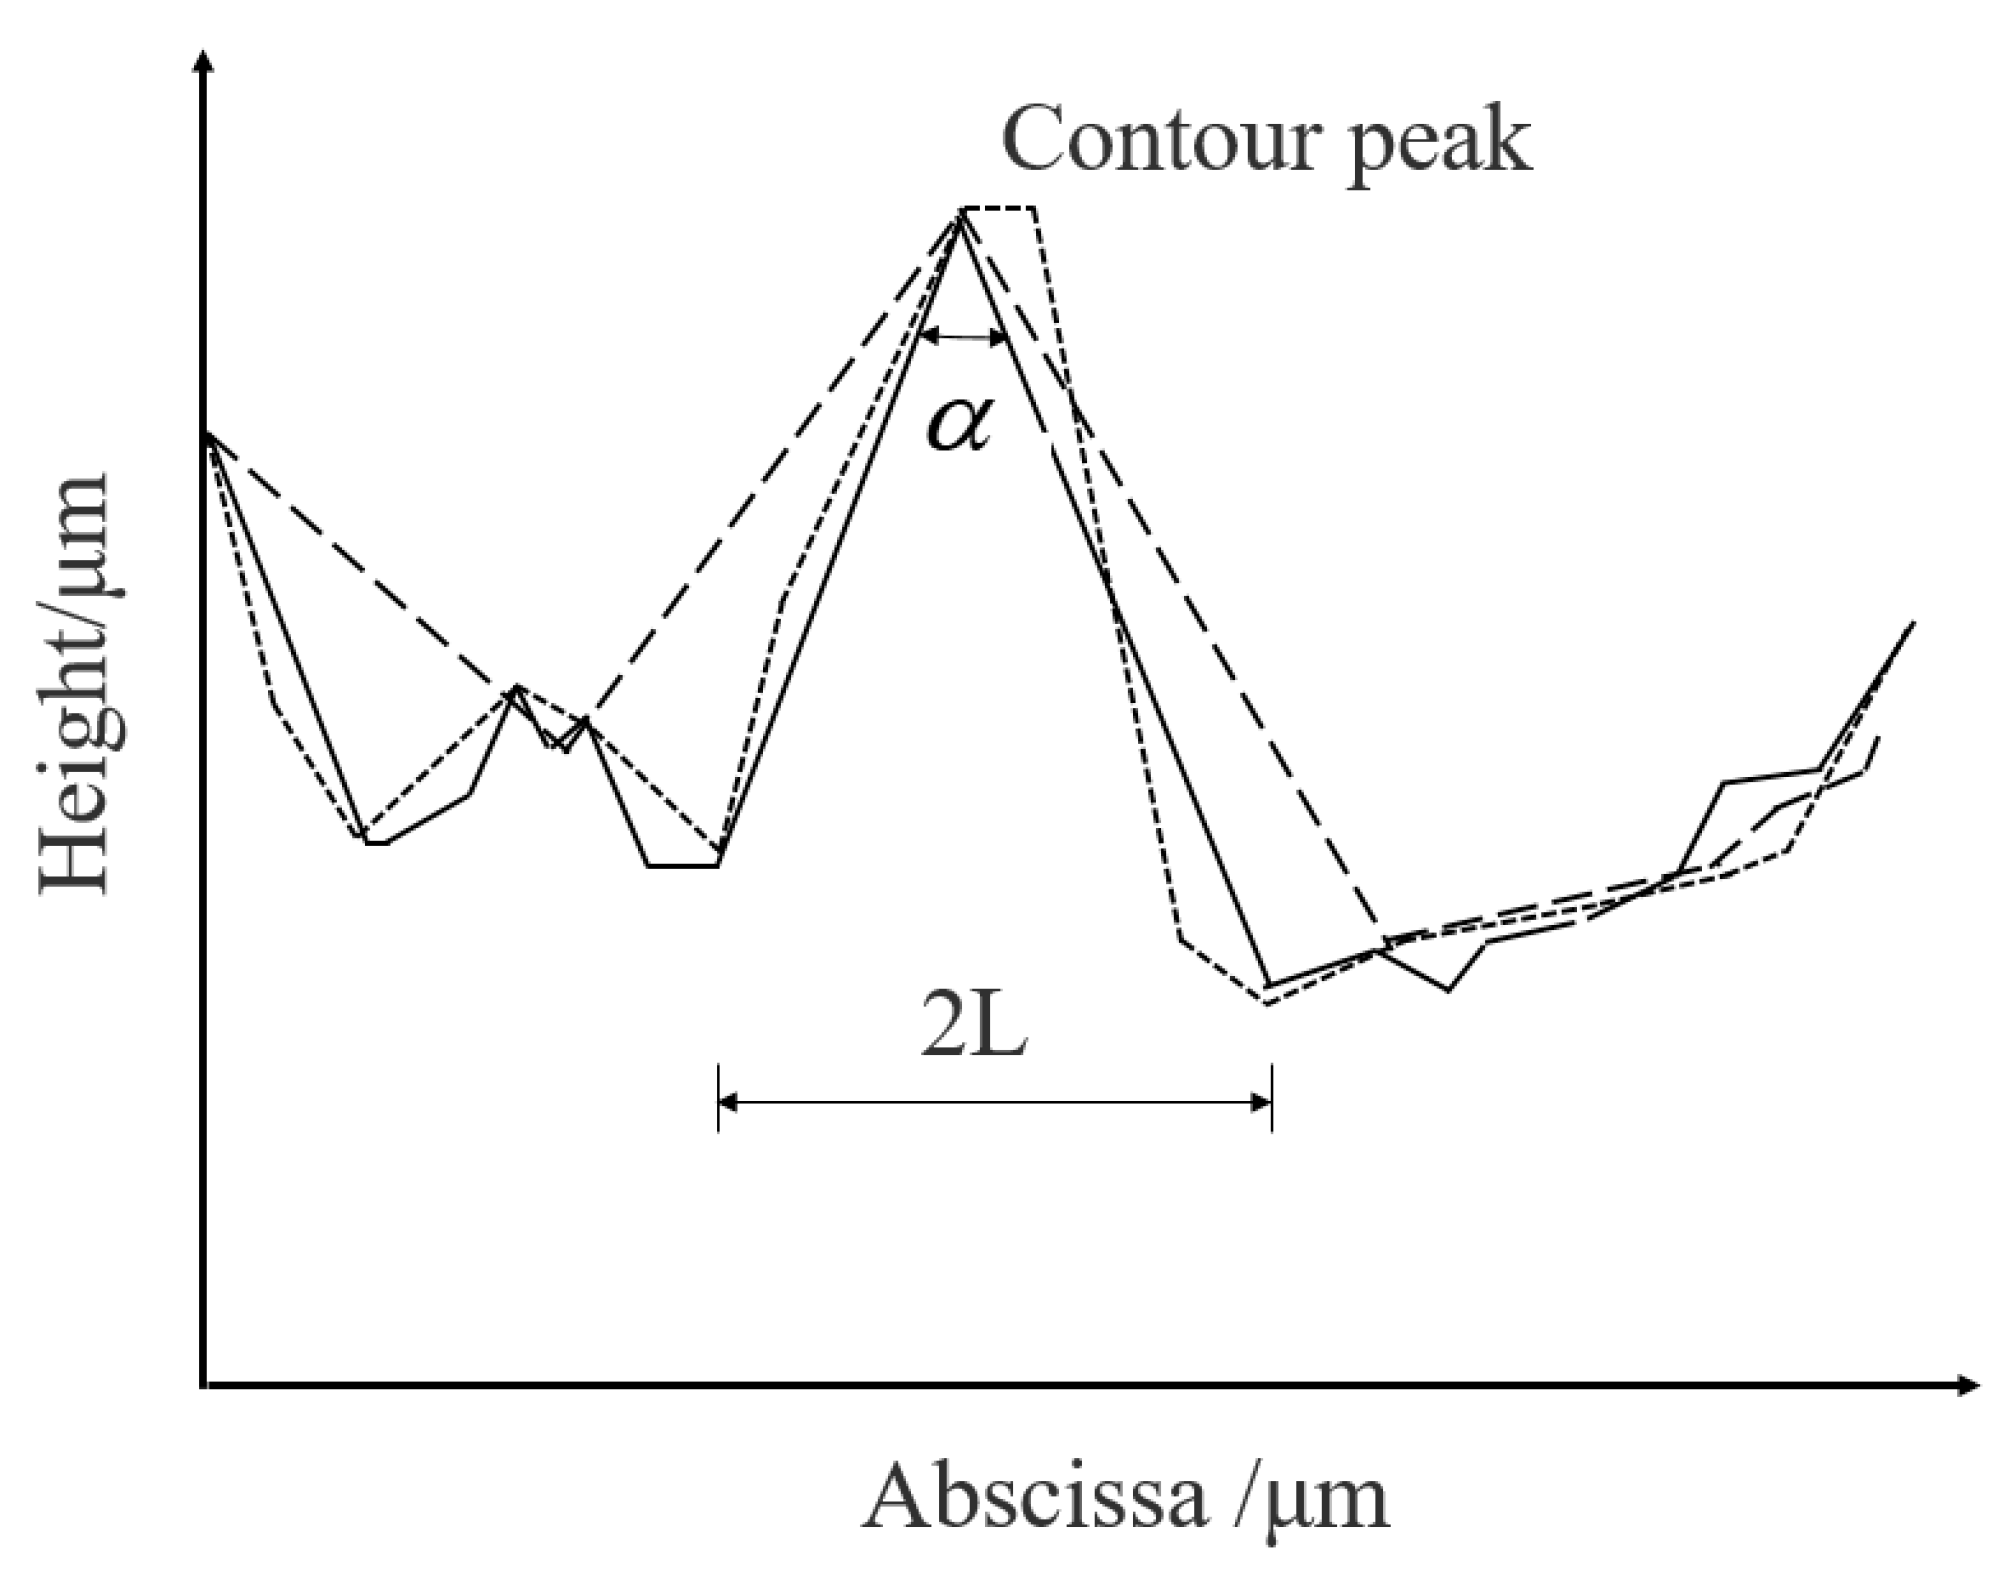
5.5. Principle of Contour Crest Angle Calculation
The form of the protruding peaks of the road structure affects the engagement deformation of the tire when it contacts the road surface structure; i.e., it mainly contributes to the plough force component between the tire and the road. The smaller the value of the contour crest angle of the pavement configuration, the more pointed and narrow the aggregate particles and the greater their contribution to the ploughing force; the larger the angle value, the wider and flatter the aggregate particles and the smaller the ploughing effect, as shown in
Figure 15.
Calculate the contour crest angle of the surface texture according to the following formula:
where
xi represents the value of the i
th extreme point on the x-coordinate axis. If the peak is at point
i, the valley is at point
i − 1 and at point
i + l;
yi represents the value in the height direction of the i
th extreme point.
5.6. Evaluation Results of the Skid Resistance of Road Surfaces Based on the Laser Method
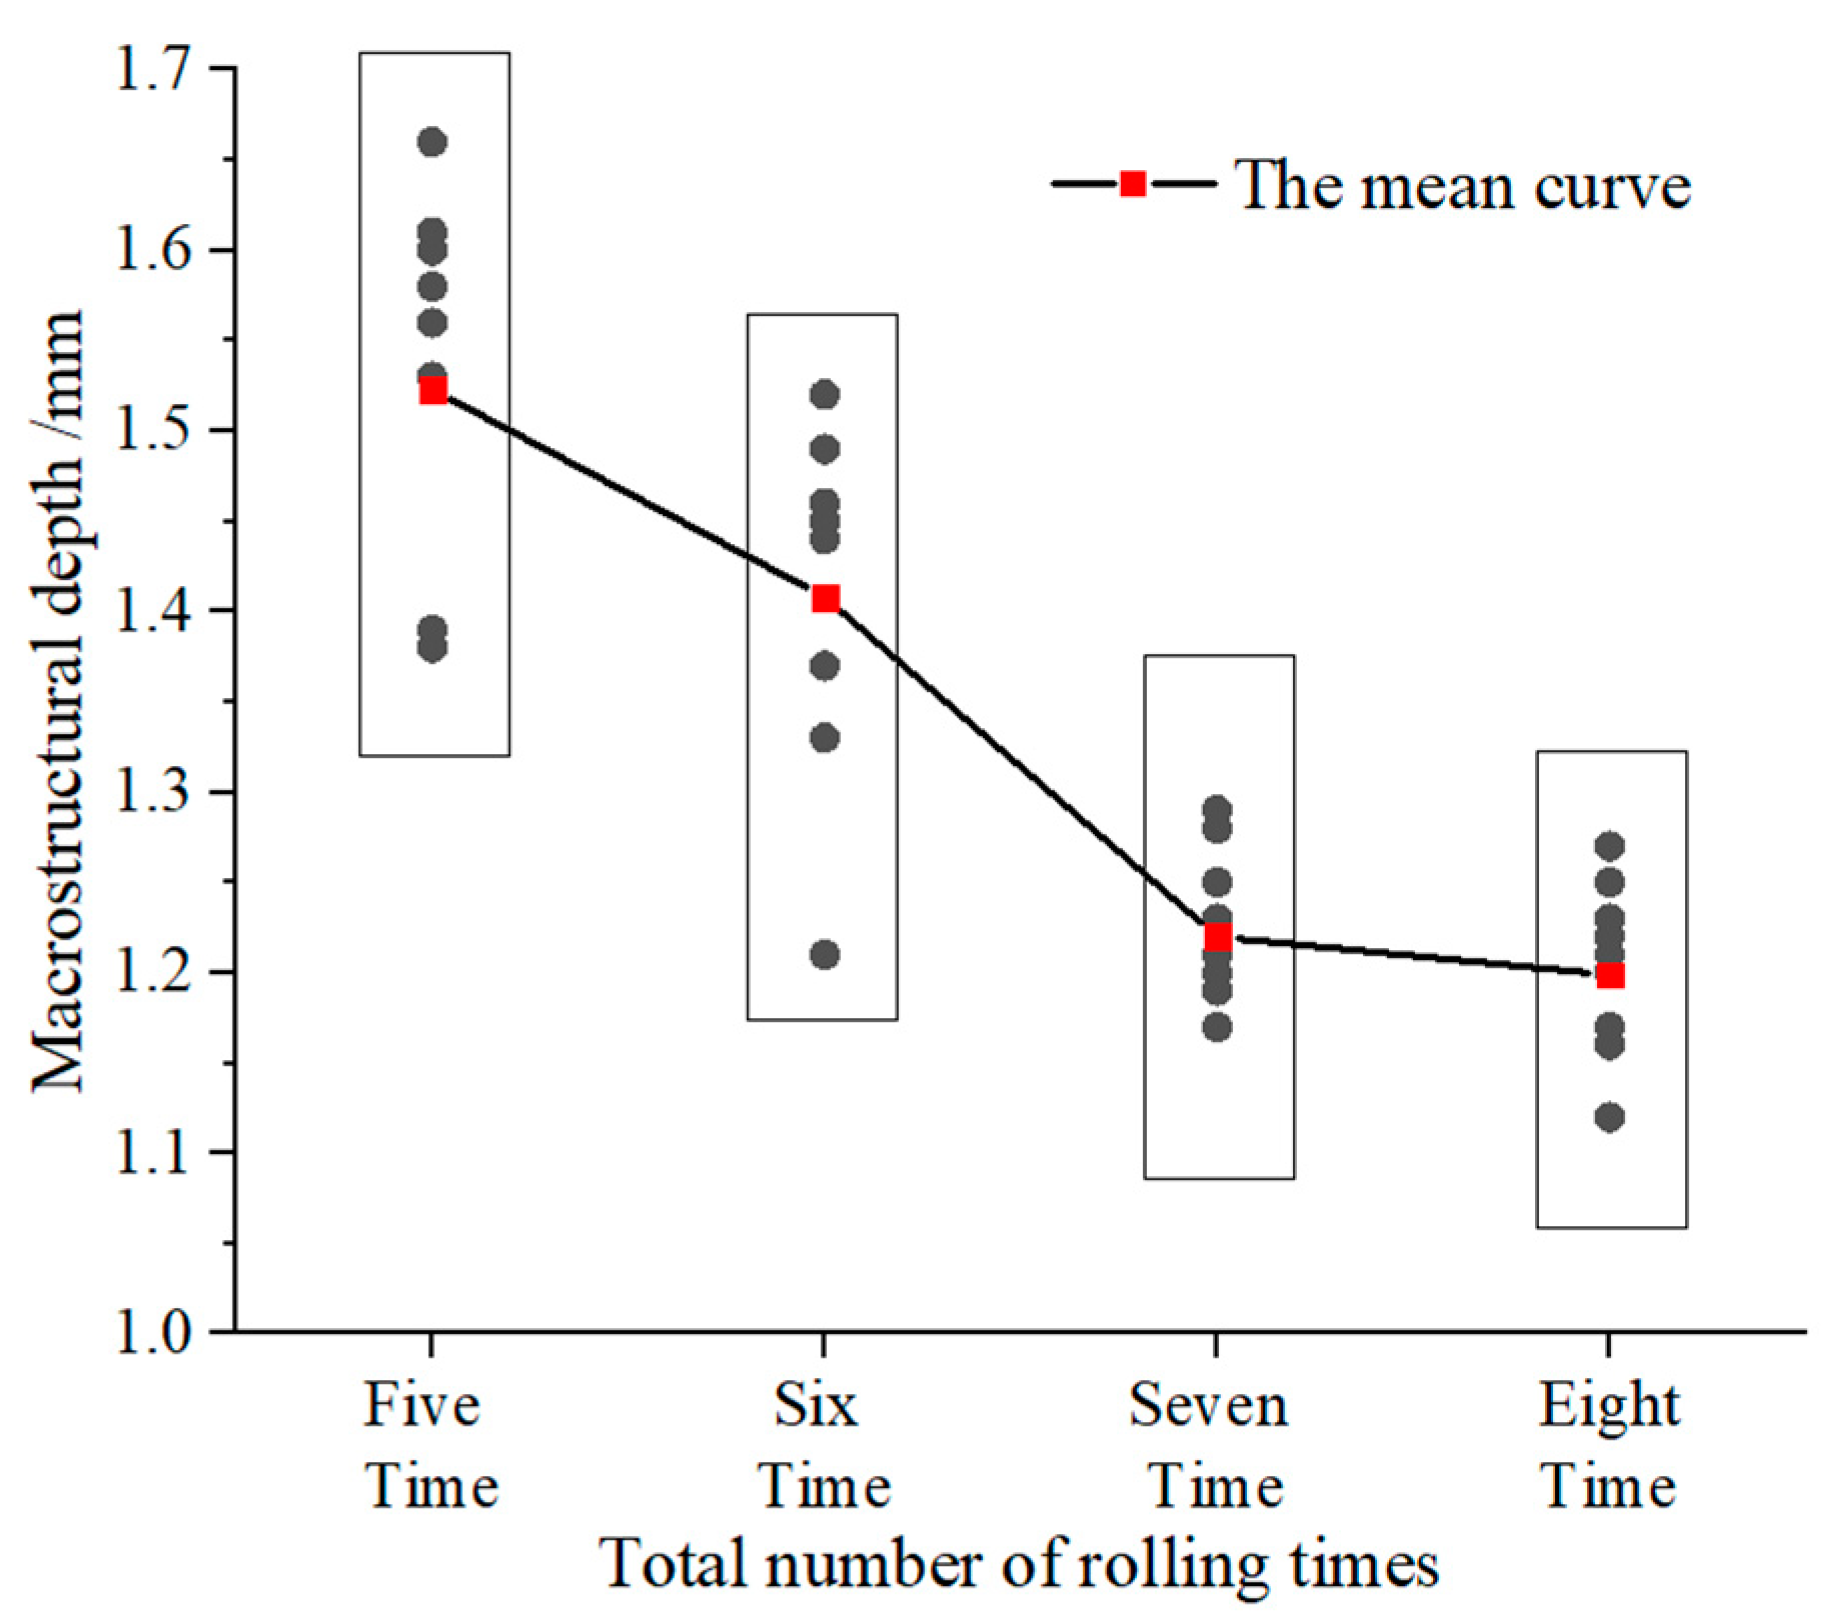
According to the experimental results, as shown in
Figure 16, the average depth of the structure decreases as the number of times increases. The average structure depth decreases rapidly from the 5th to the 7th compaction at a rate of 19.9%, and stabilizes (1.2 mm) after the 7th to the 8th compaction. After vibration compaction for 5 times, SMA-13 asphalt pavement surface construction depth is greater than 1.2 mm, the surface open pores will be large, and the pavement below the 1 cm range of connected voids will be more. Water will enter the pores and produce a pumping effect under vehicle load, which may lead to asphalt stripping and early water damage under long-term operation. When the vibratory compaction reaches 7–8 times, the compaction degree has stabilized and the vertical excitation force is unable to improve the compaction degree, while the horizontal excitation force produces a rubbing effect on the paving layer similar to that of a tire roller, which fills the mastic rubble into the larger pores on the surface, thus making the compaction surface denser and improving the water penetration resistance of the surface layer.
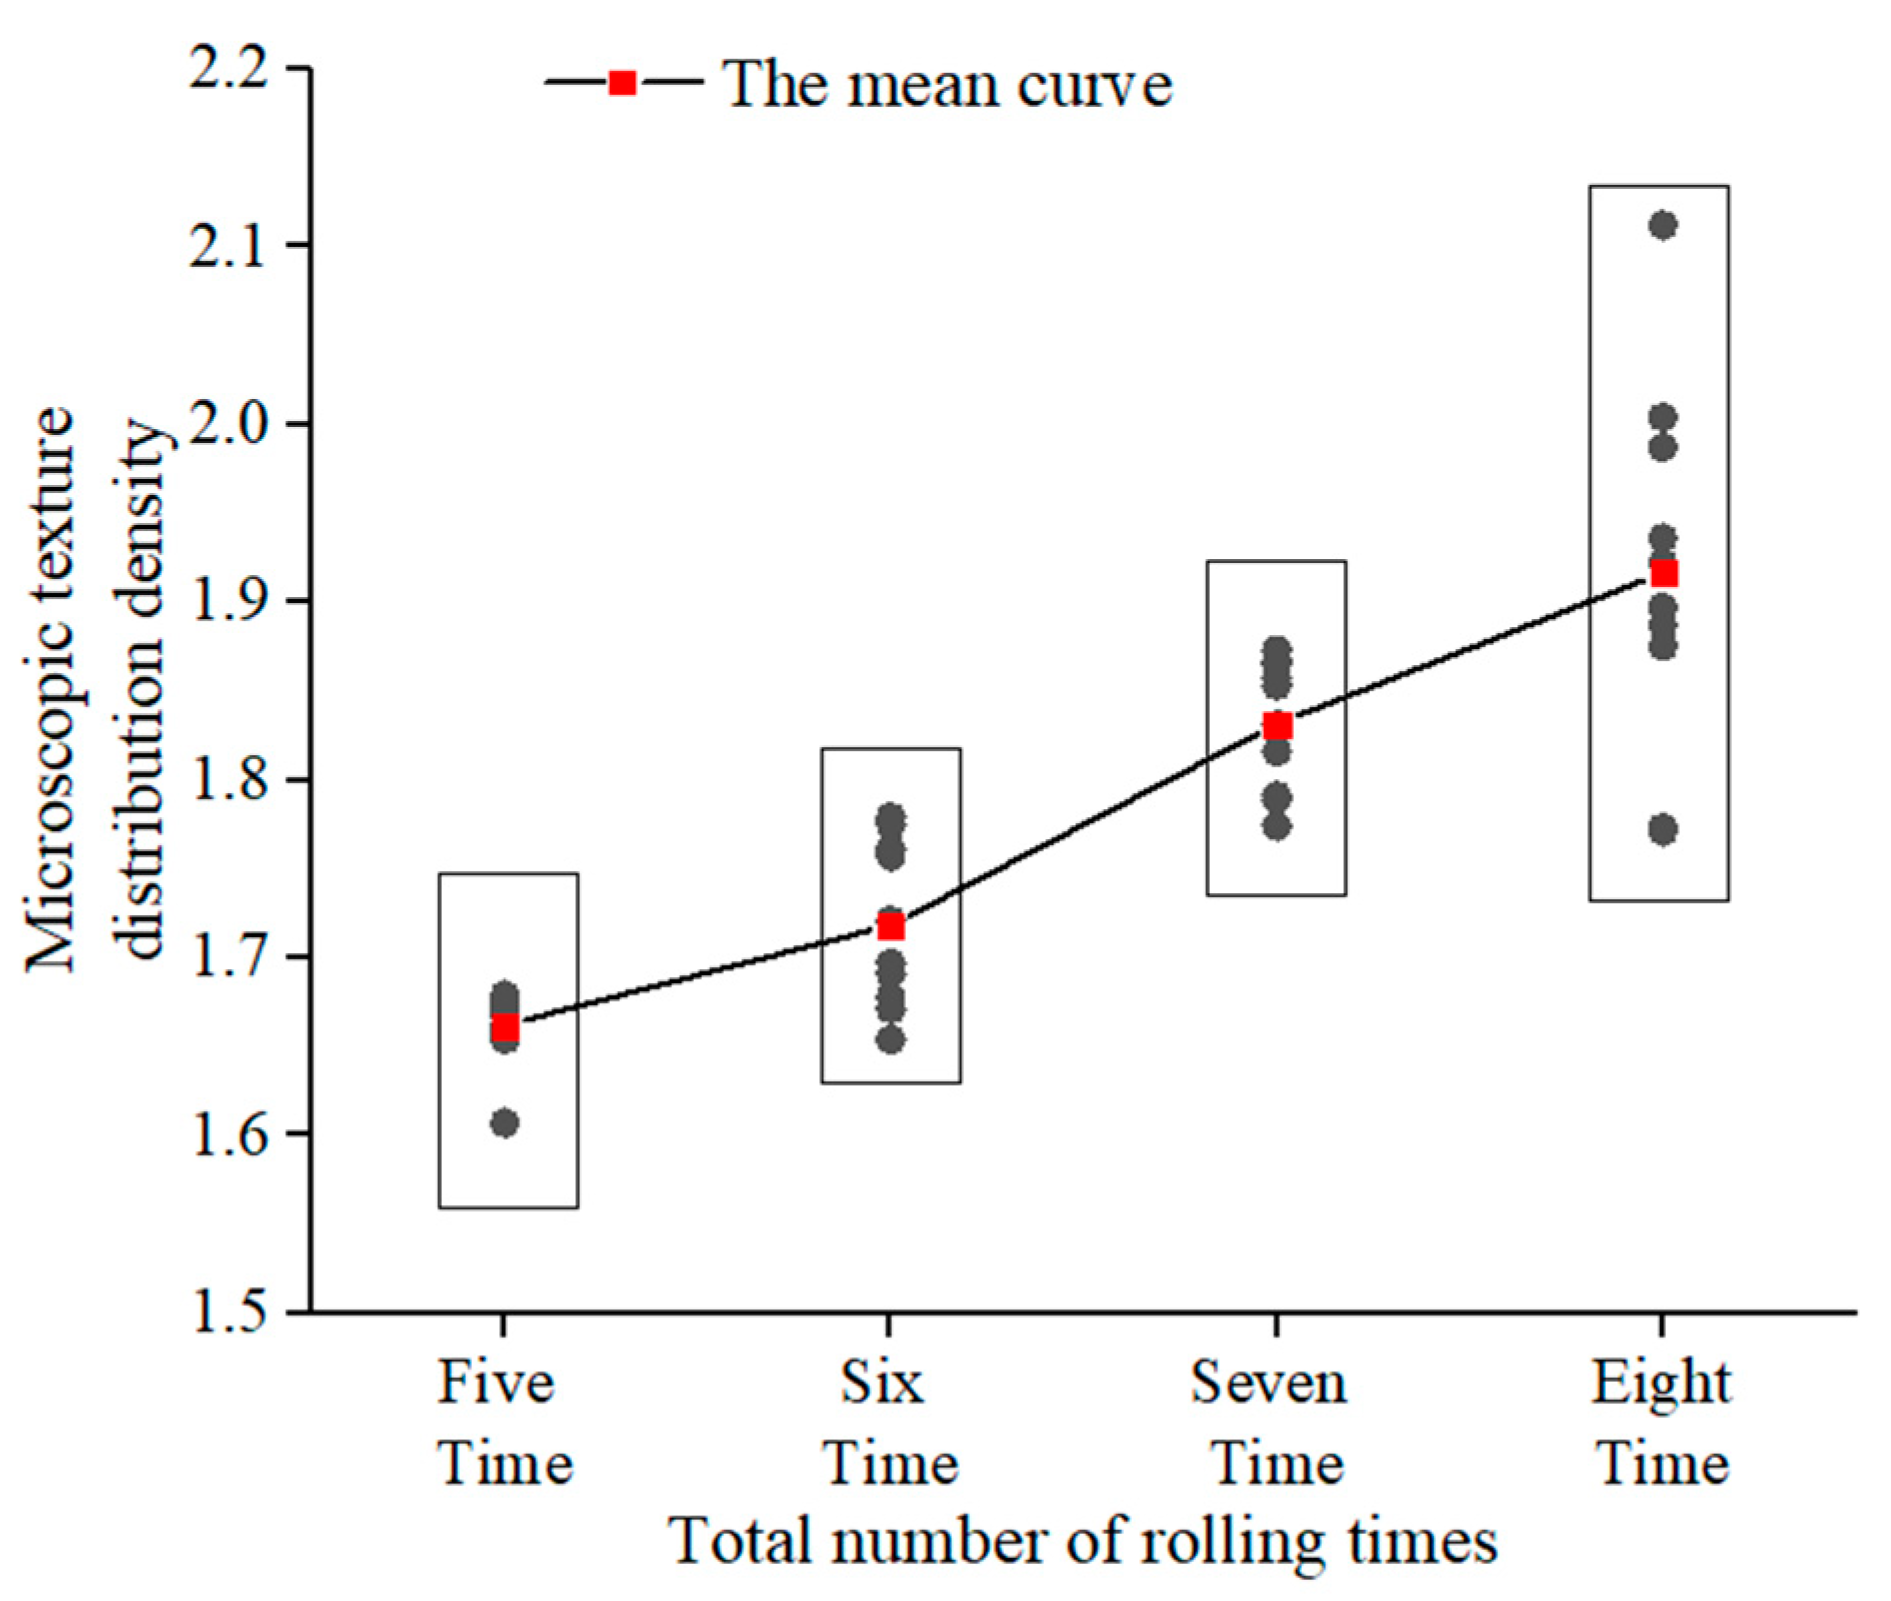
According to the experimental results, as shown in
Figure 17, the microtexture density increases with the number of rolling times. The average value of microtexture density at the measuring points was 1.662 after rolling for 5 times. At this point, the road surface was macroscopically large and the microtexture density was mainly provided by the microtexture on the surface of the coarse aggregate, but the thicker asphalt mastic film covered part of the microconvex structure on the surface of the coarse aggregate, resulting in the smallest microtexture density. As the rolling times increases and the temperature of the asphalt mixture decreases, resulting in a greater wear of the surface texture, the SMA surface gullies are somewhat smoothed out and the exposed coarse aggregate and the wear on the aggregate angles make for a richer mix surface structure, providing fresh microtextures at the same time as the uplifted asphalt mortar.
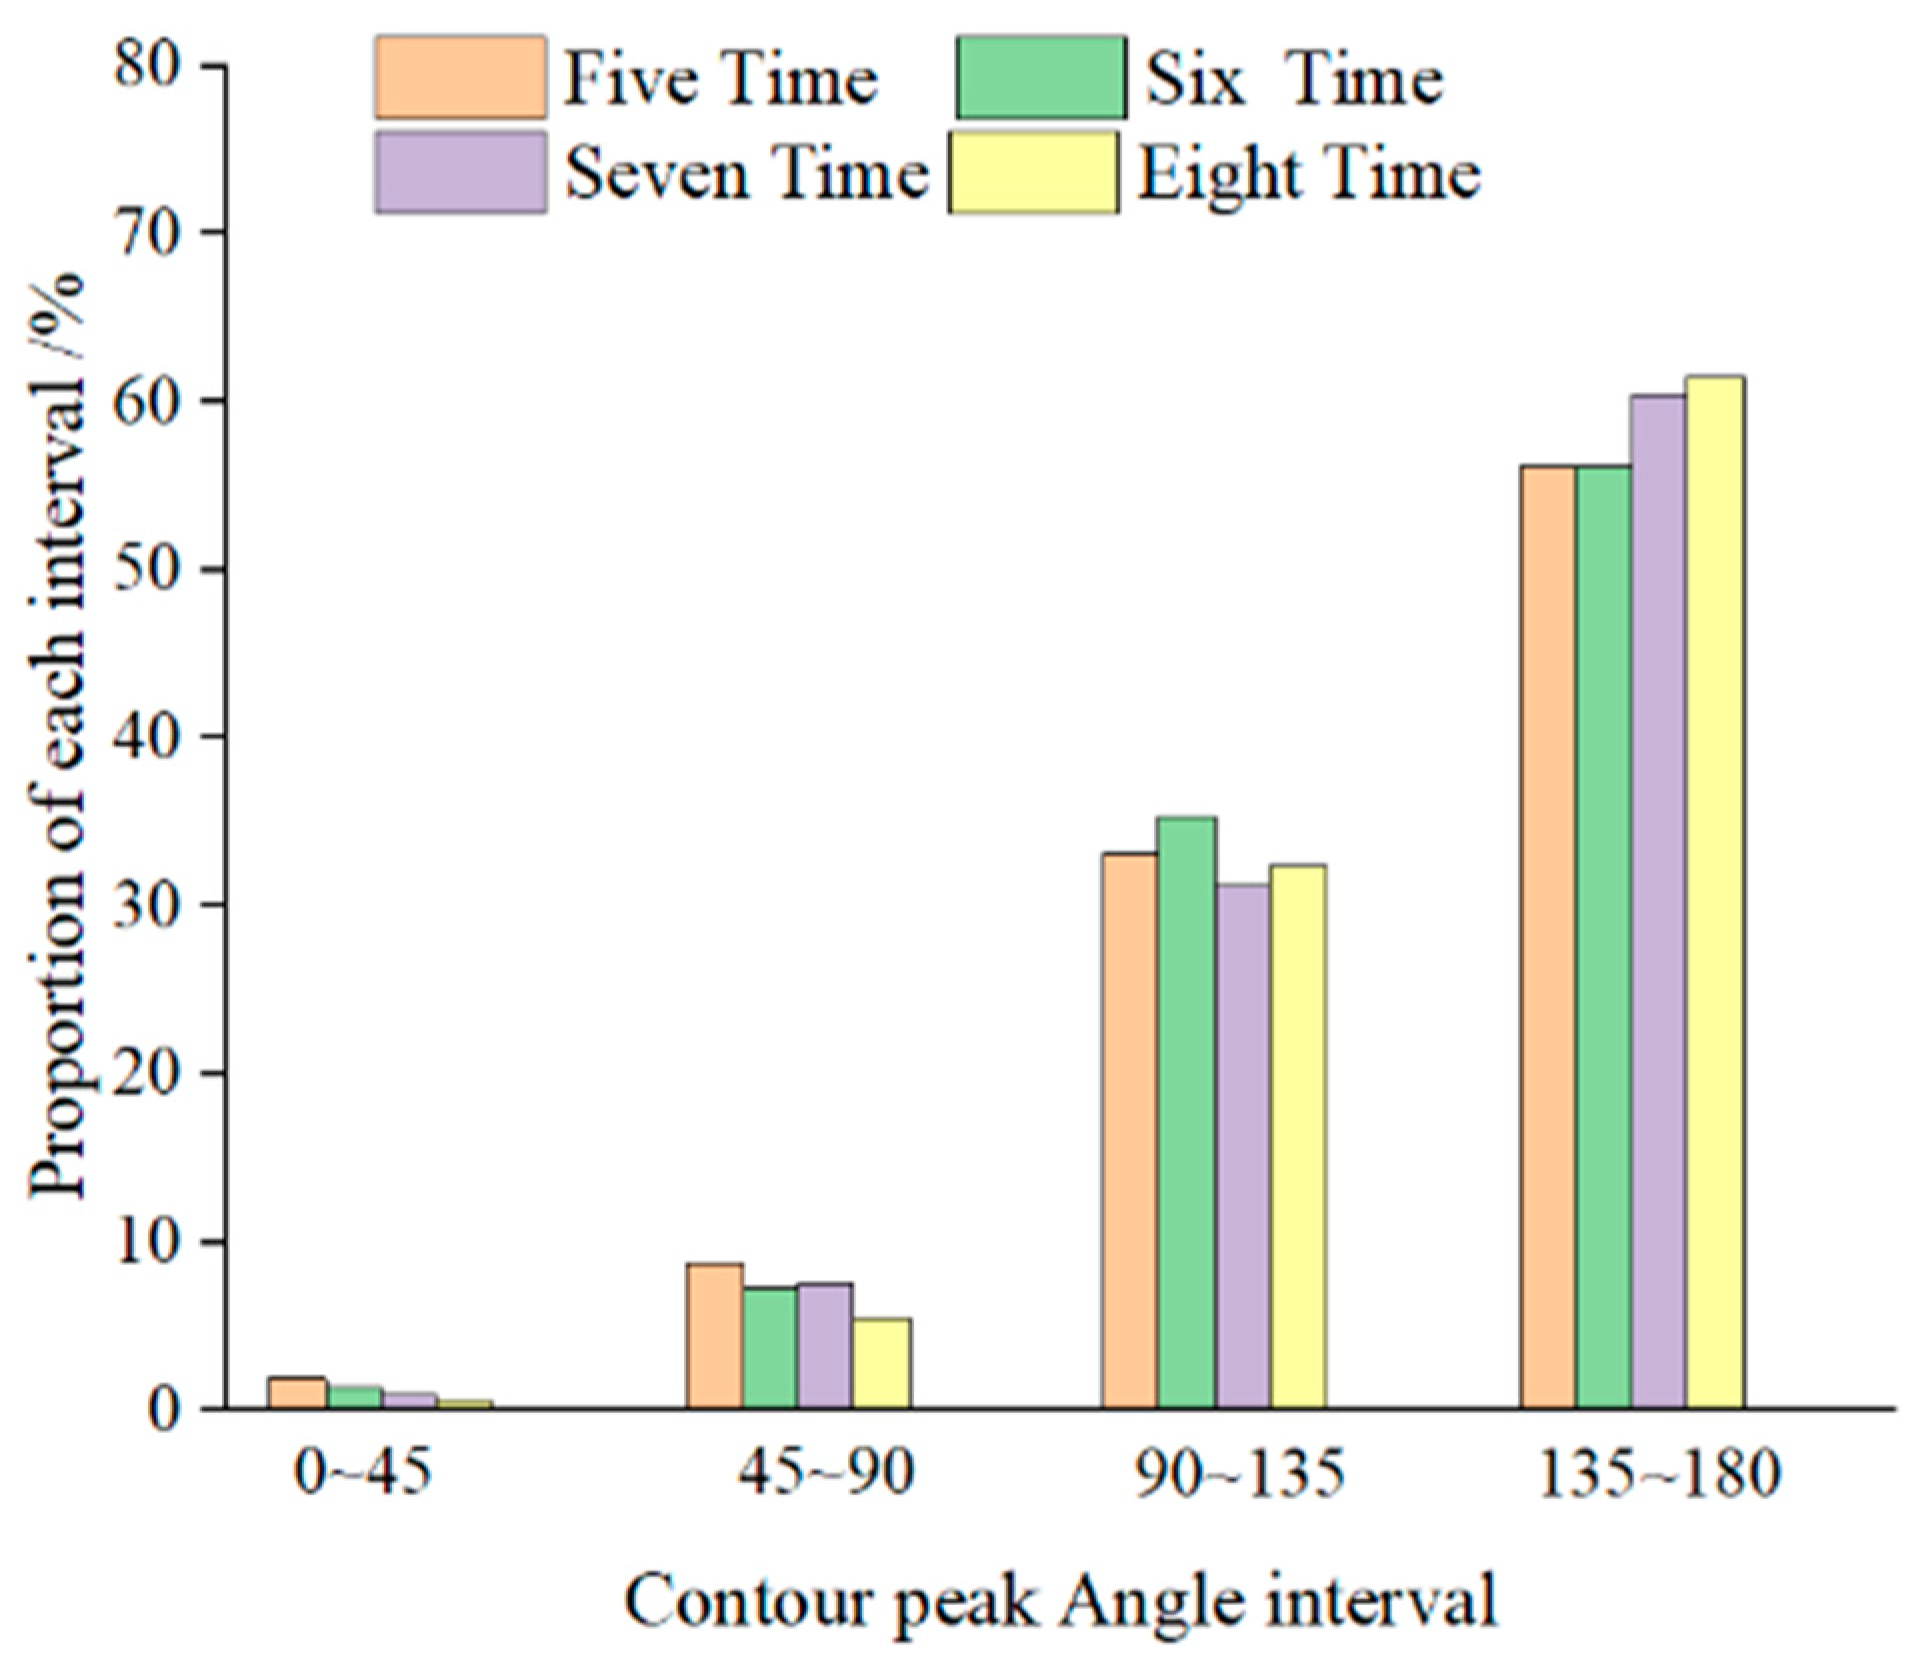
According to the experimental results, as shown in
Figure 18, the proportion of the acute part (<90°) of the contour crest angle of the surface texture decreases with the number of rolling times, from 9.97% to 2.55%, and the angles in this zone are related to the sharpness of the coarse aggregate angles on the one hand. Conversely, the obtuse part (90° to 180°) increases from 90.03% to 97.45%. The angularity of this zone is mainly related to the amount of coarse aggregate (gradation) and the spatial distribution state of the coarse aggregate in the pavement. At 5 times, the proportion of sharp angles (<90°) was 9.97%. At this time, the construction temperature is high, the asphalt mix is easy to work with, the aggregate particles are rolled to form a skeleton and the surface aggregate angular gullies, and the proportion of SMA aggregate in a “vertical” state is high. The “upright” state of the aggregate particles is difficult to maintain due to the impact and friction between the double steel rollers and the aggregate particles during the rolling process. A contour crest angle of 0°–90° will be converted to a 90°–180° contour crest angle. The unconverted “upright” state of the aggregate will also be smoothed and worn down by the steel wheels as the temperature decreases, and as the number of rolling times increases, the greater is the proportion of “lying down” due to the rolling rock.
6. Conclusions
(1) It is concluded that for a 4 cm SMA-13 bridge deck pavement, the oscillatory roller could achieve a greater and more stable compaction of the mixture and, at the same time, improve the uniformity of pavement compaction, air voids, and water permeability resistance, thus ensuring the durability of the bridge deck pavement.
(2) Using digital image processing techniques to analyze the roll-formed pavement structure, the angular wear rate is proposed to evaluate the degree of damage to the surface texture by different rolling processes. As the steel wheel oscillation rolling temperature decreases, the wear rate of the pavement structure increases significantly.
(3) The laser test results of the pavement texture reflect the influence of a different rolling process on the surface texture. As the number of oscillating rolling cycles increases, the pavement macrotexture depth gradually decreases and tends toward a stable value (1.2 mm), the microtexture density increases, and the proportion of acute angles (<90°) in the contour crest angle of the pavement decreases.
(4) The results of this study are only applicable to the type of SMA-13 asphalt mixture shown in the paper. The applicability of this study conclusion to the rolling process of other pavement types on the cement concrete bridge deck cannot be determined, but it can be determined by referring to this study scheme.


