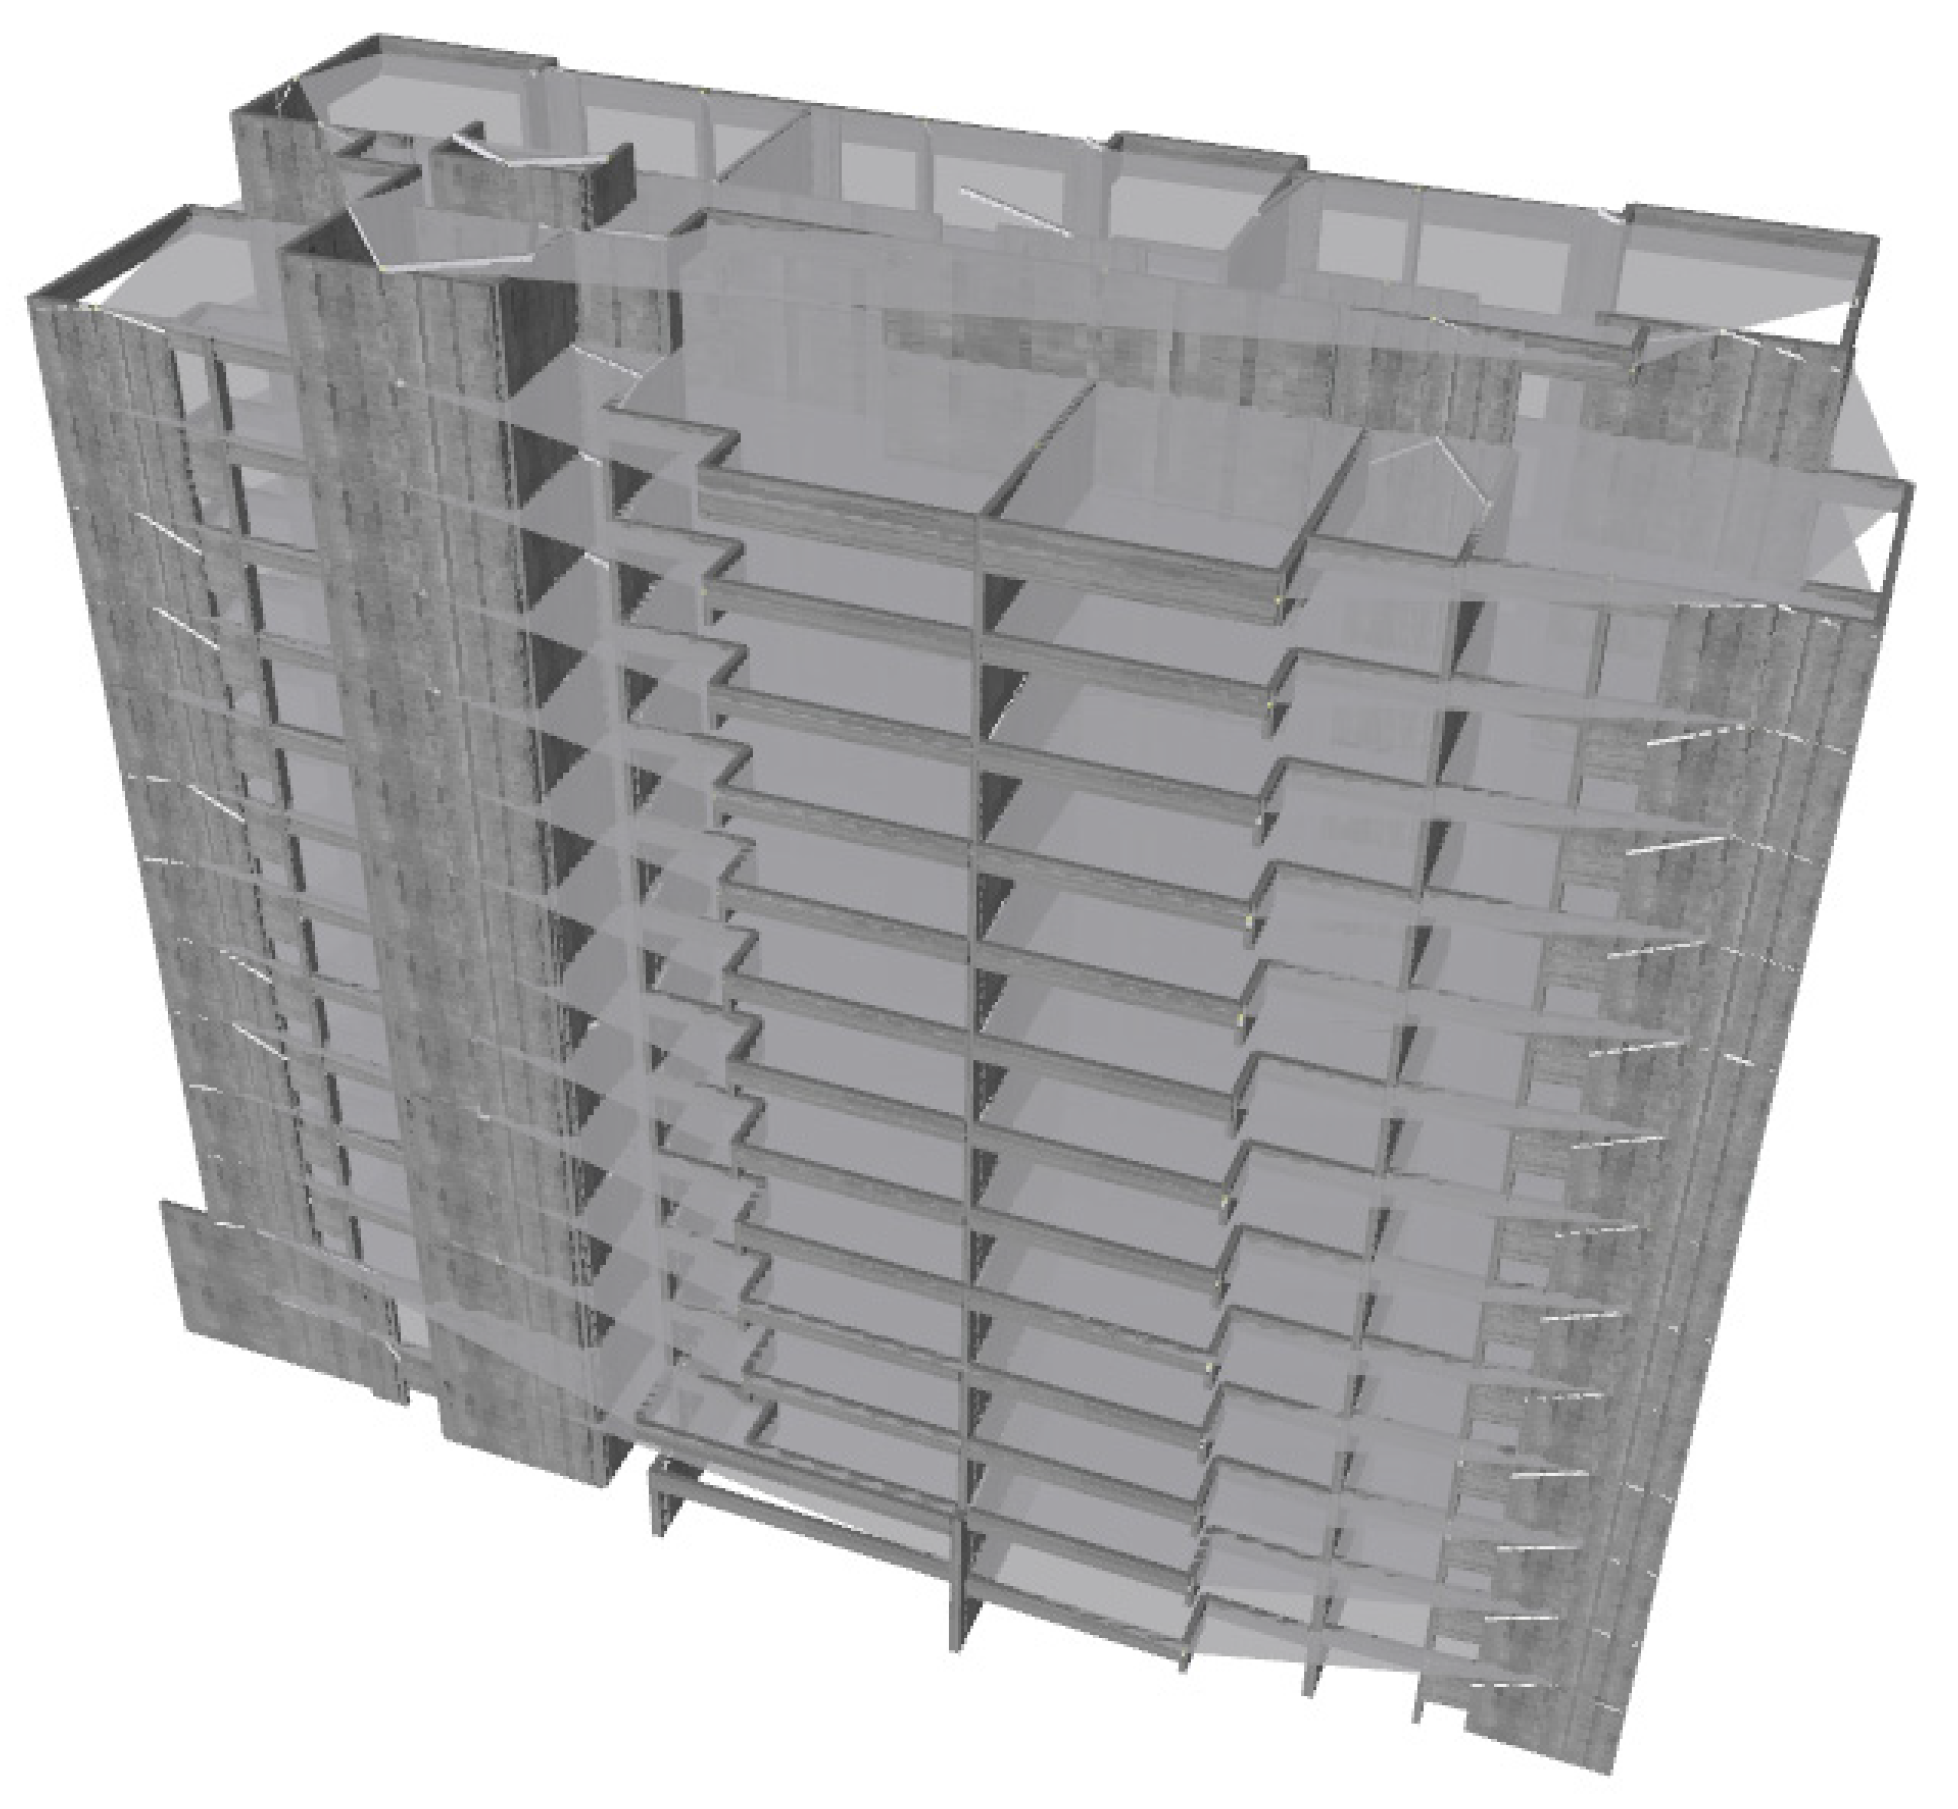
Figure 1.
Perspective view of the computational model of the building under study.
Figure 1.
Perspective view of the computational model of the building under study.
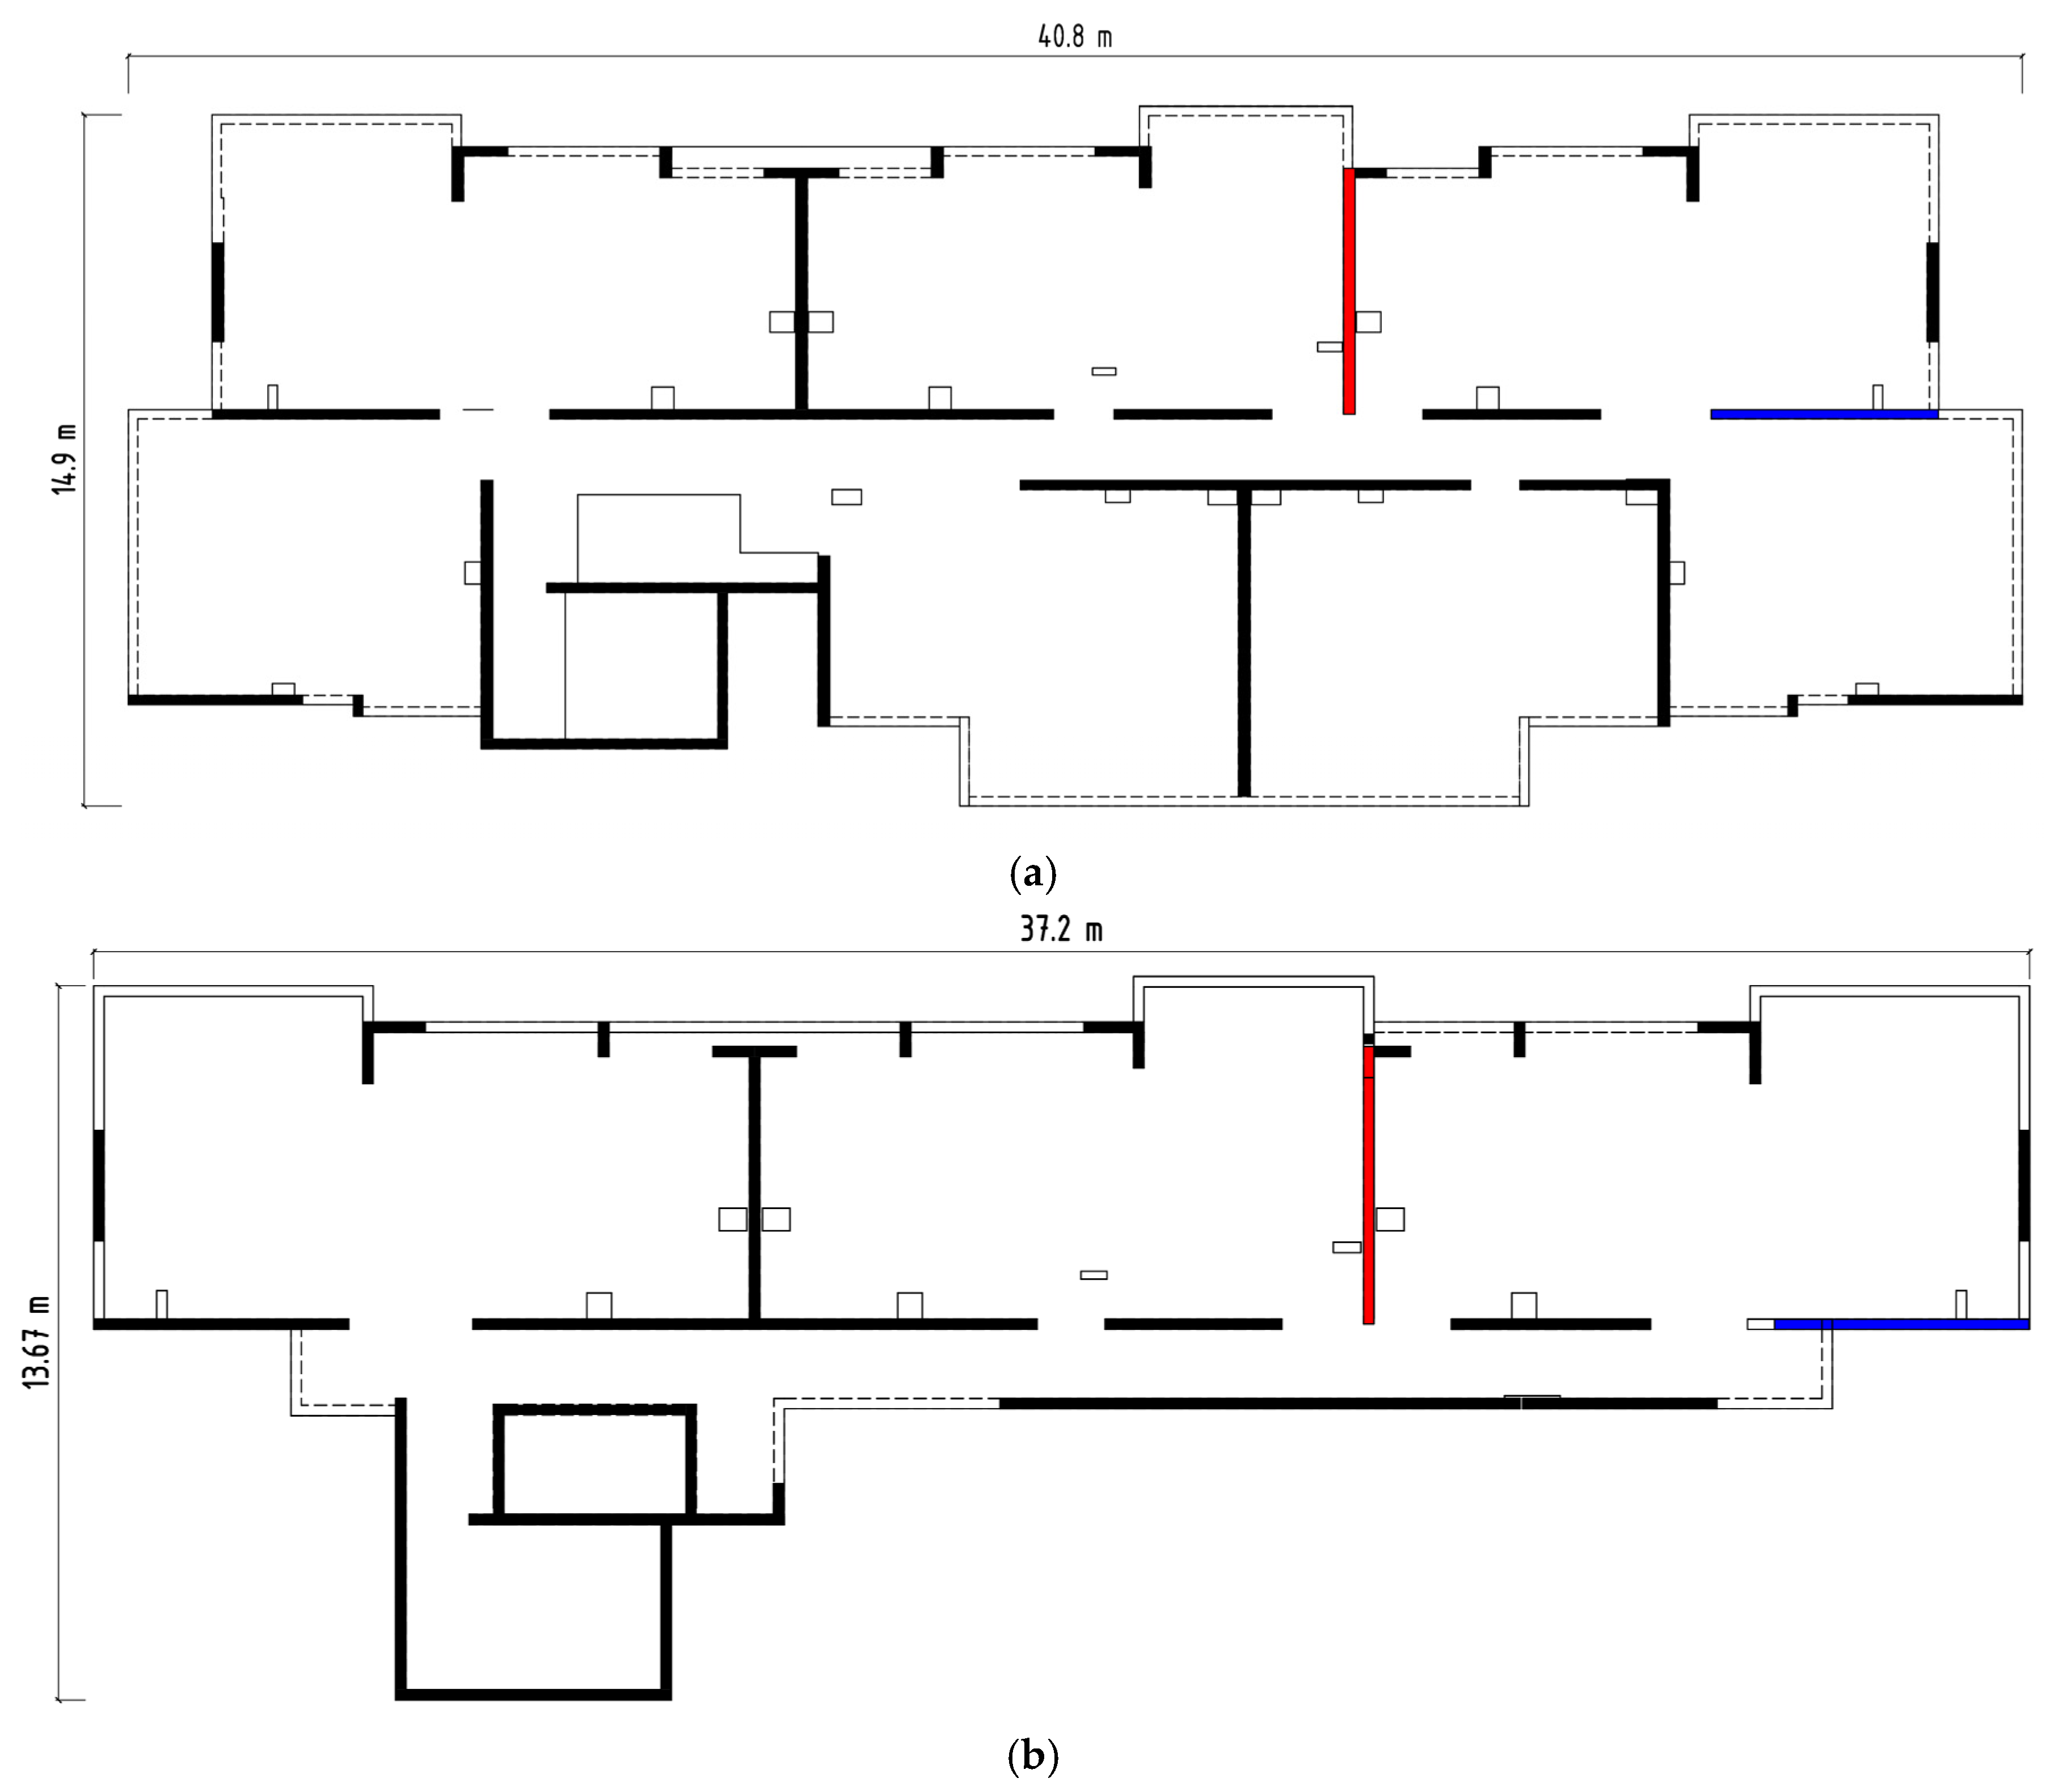
Figure 2.
Structural plan, with black lines marking the walls and light lines marking the beams: (a) Typical floor, and (b) Roof floor.
Figure 2.
Structural plan, with black lines marking the walls and light lines marking the beams: (a) Typical floor, and (b) Roof floor.
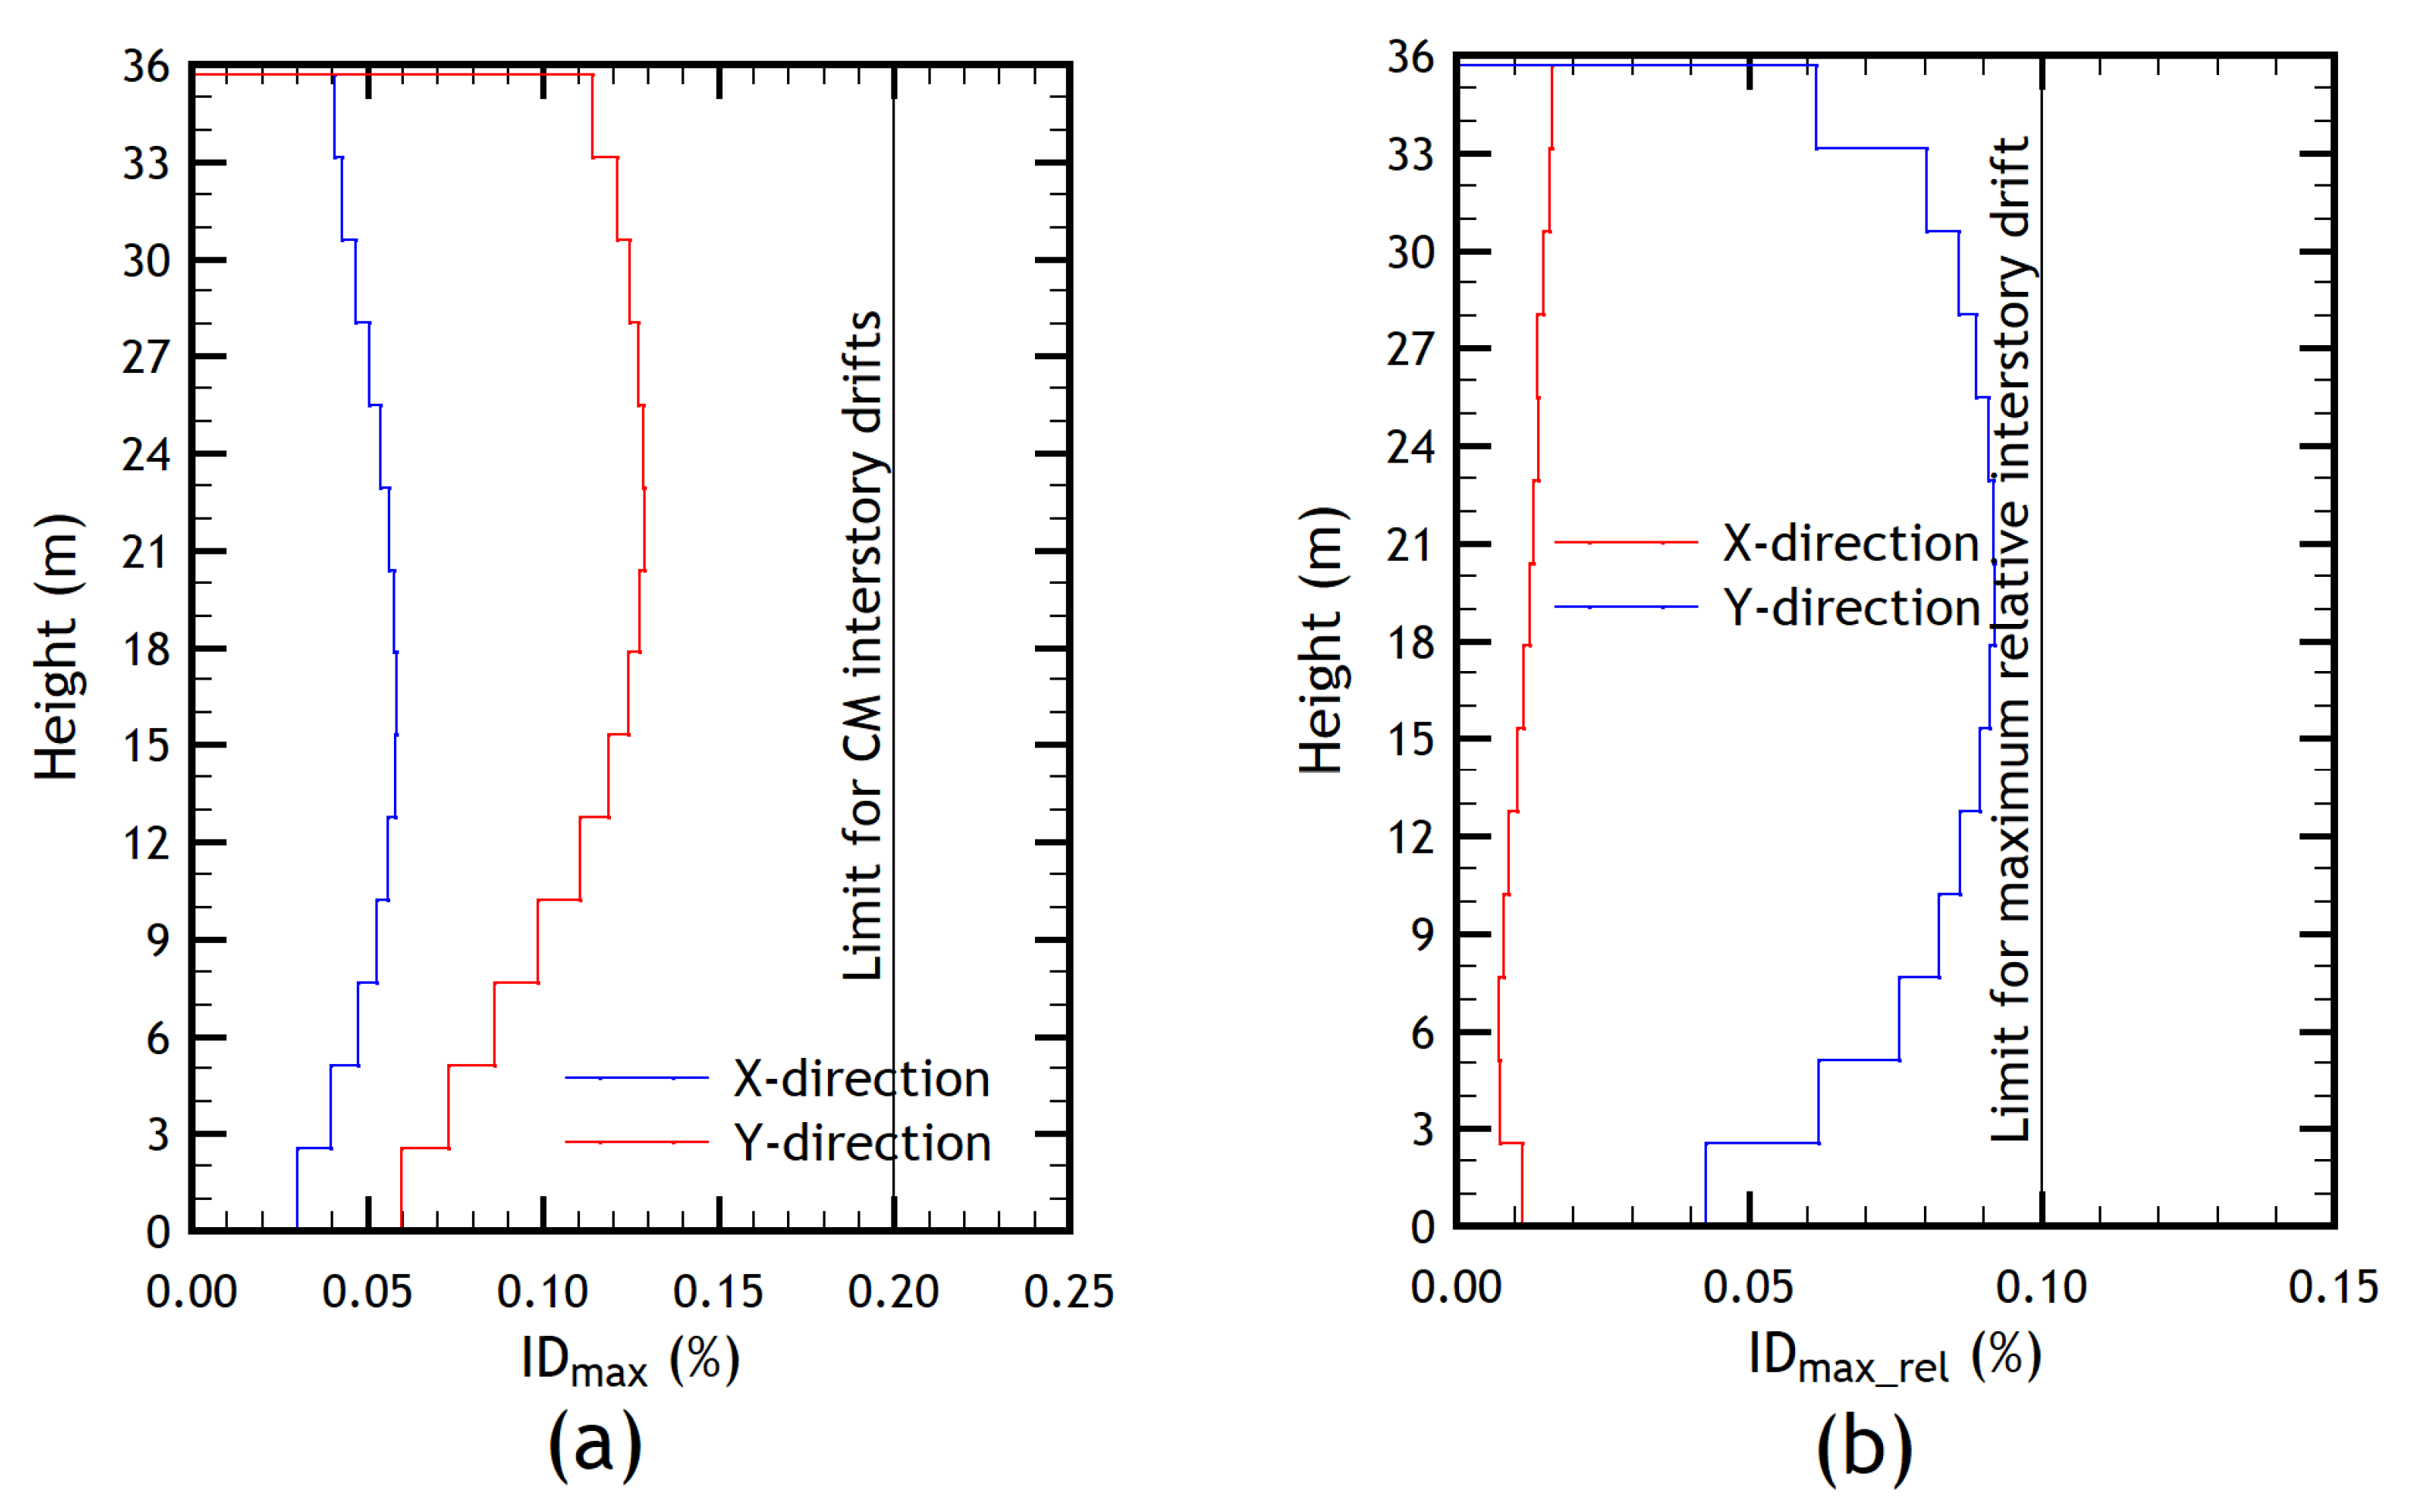
Figure 3.
Criteria used to verify the structural regularity for (a) CM interstory drift, and (b) interstory drift between the CM and the most unfavorable point of the floor.
Figure 3.
Criteria used to verify the structural regularity for (a) CM interstory drift, and (b) interstory drift between the CM and the most unfavorable point of the floor.
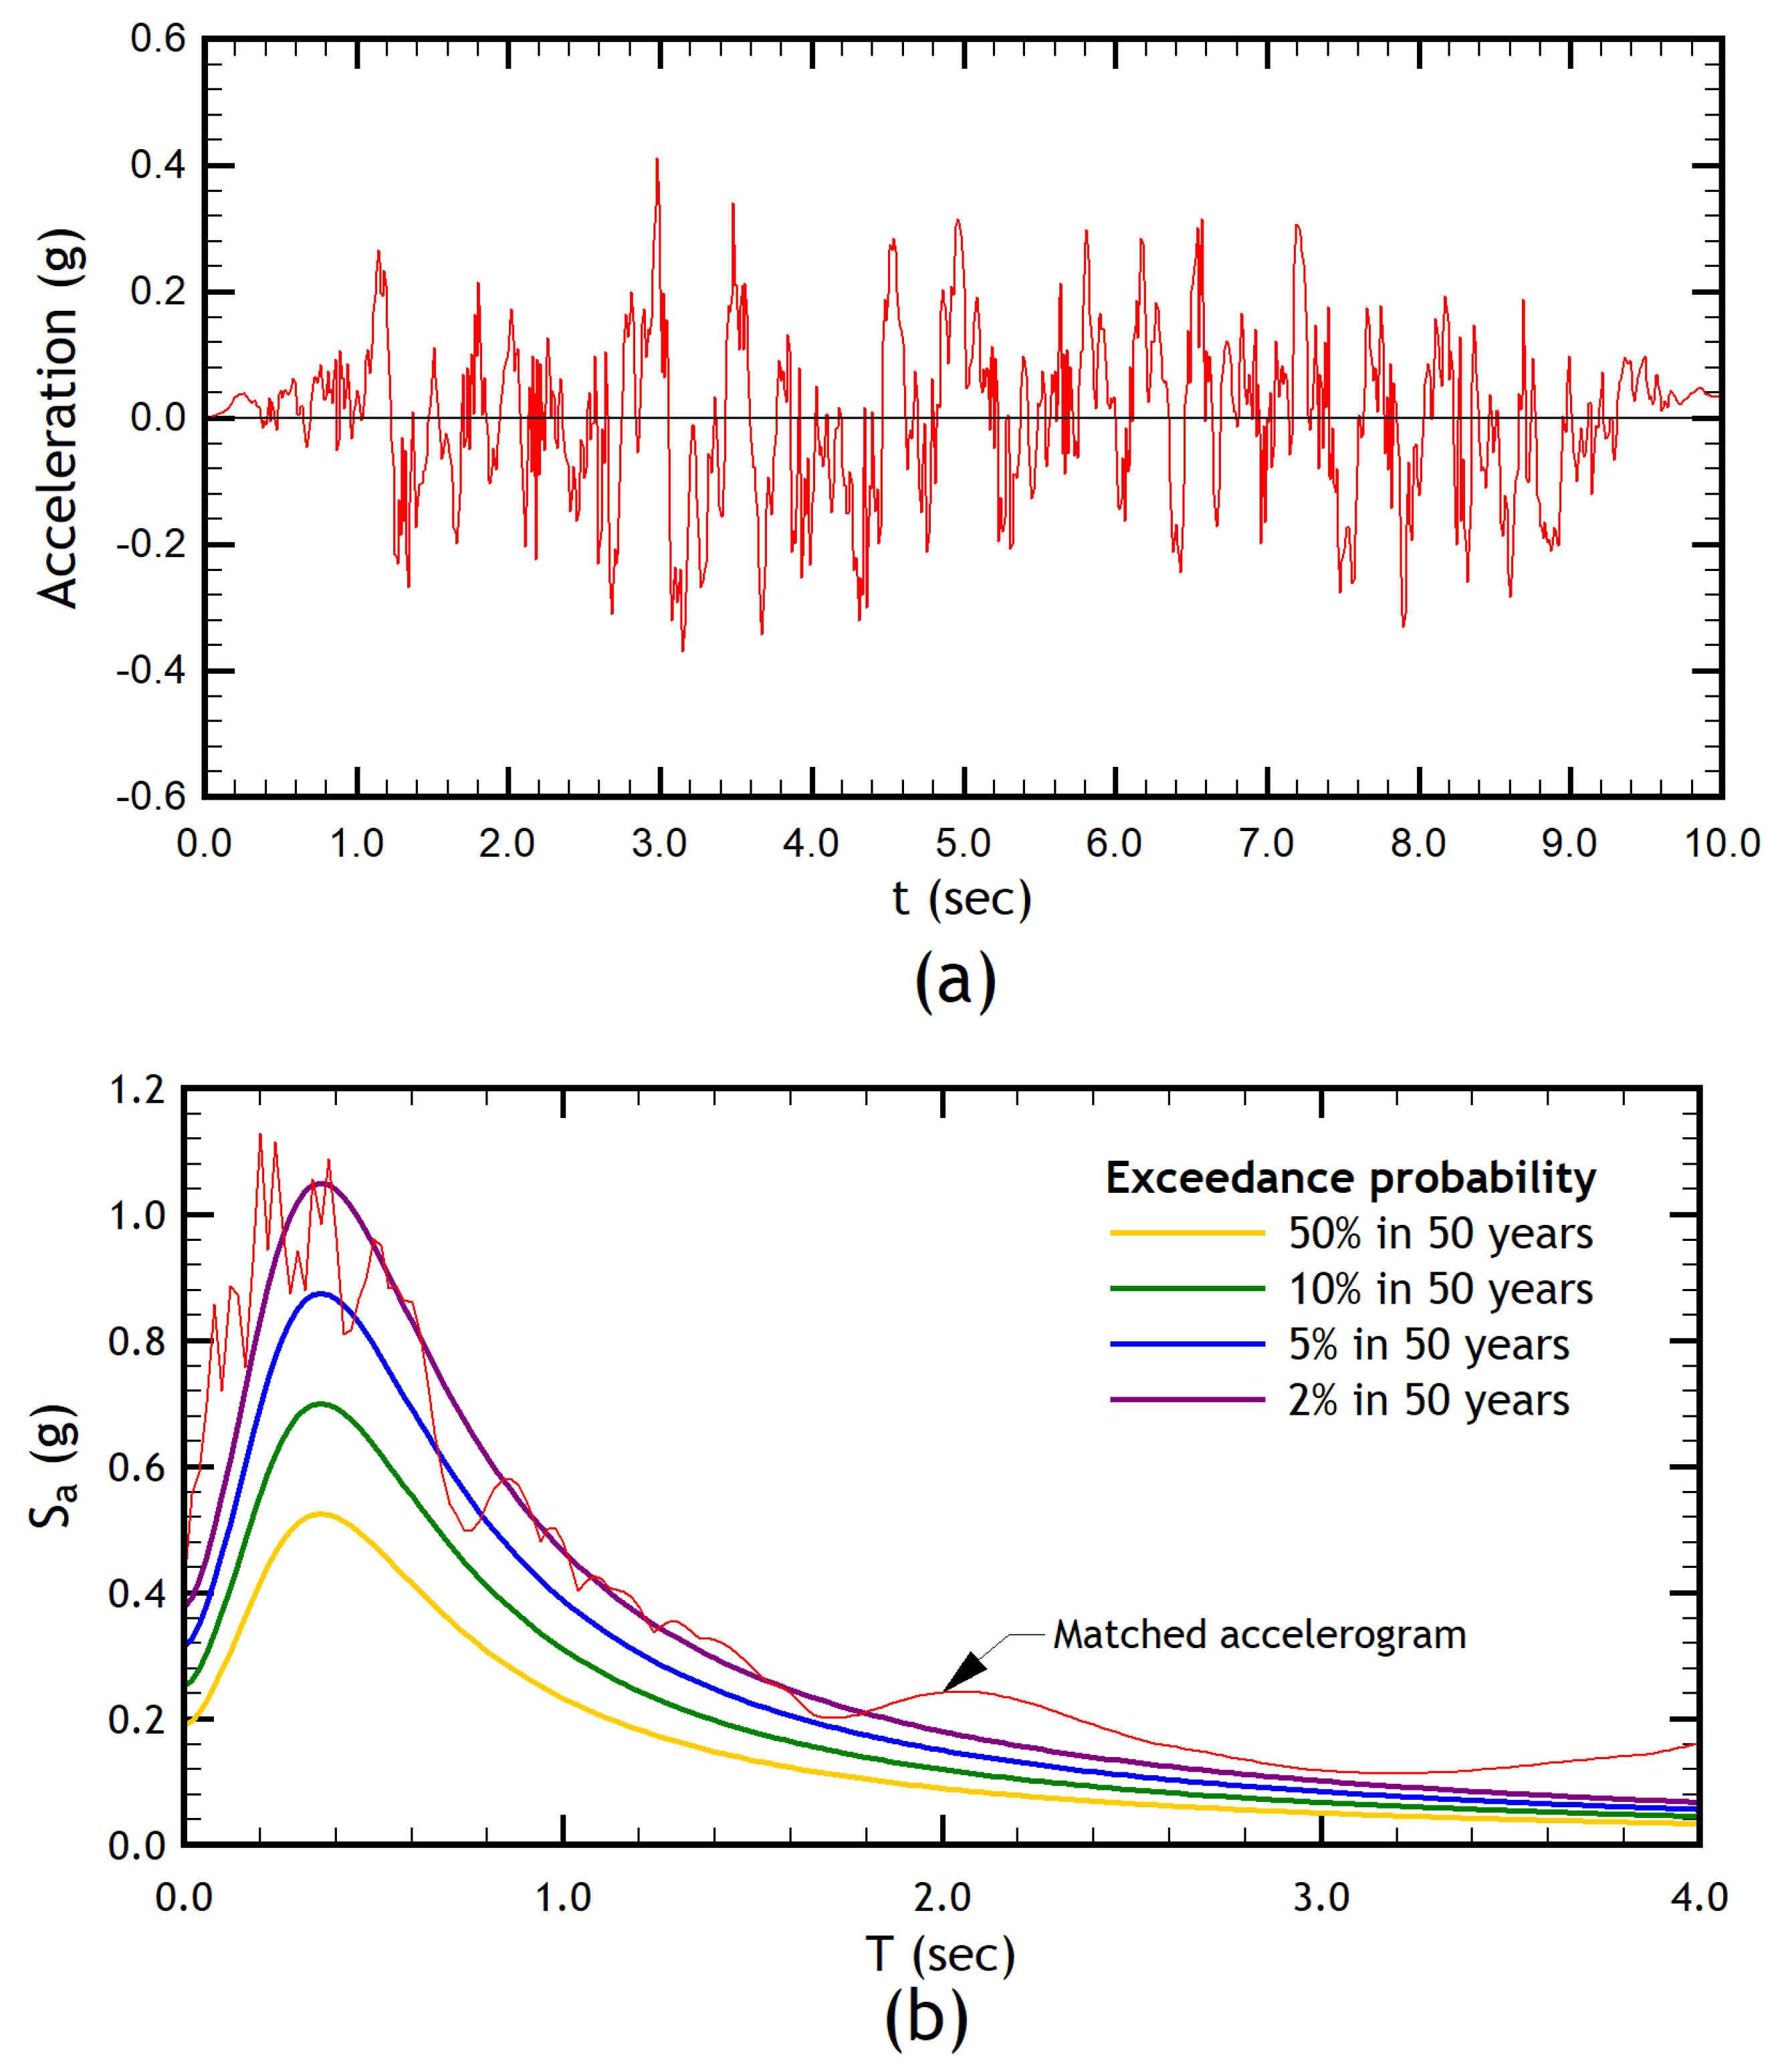
Figure 4.
(a) Example of artificial accelerogram. (b) Adjustment of the matched acceleration spectrum.
Figure 4.
(a) Example of artificial accelerogram. (b) Adjustment of the matched acceleration spectrum.
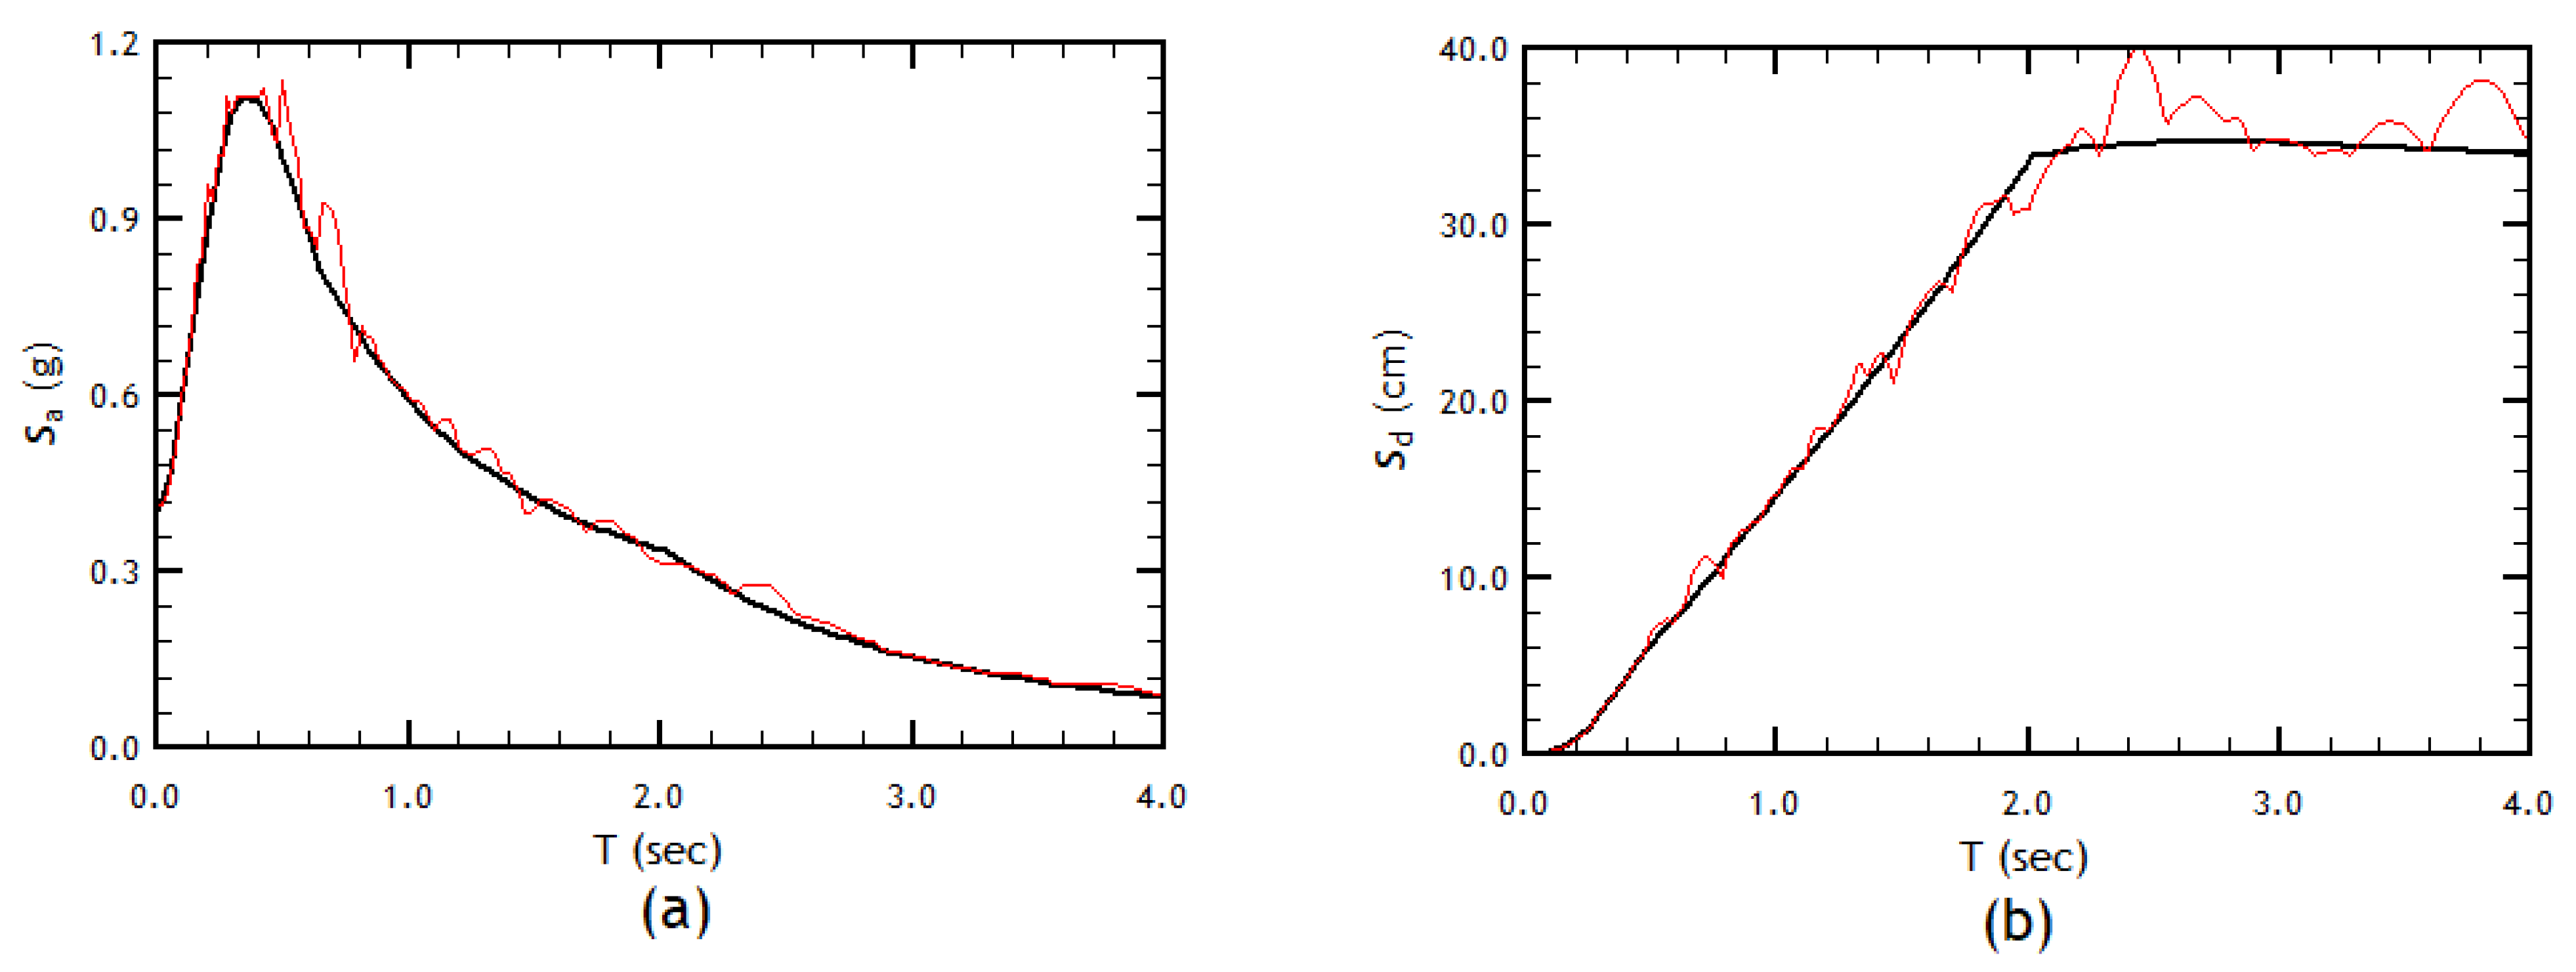
Figure 5.
Correspondence of the response spectrum of the matched record with respect to the acceleration spectrum derived from the design spectrum in soil displacement C amplified by 17%: (a) acceleration spectra; (b) displacement spectra.
Figure 5.
Correspondence of the response spectrum of the matched record with respect to the acceleration spectrum derived from the design spectrum in soil displacement C amplified by 17%: (a) acceleration spectra; (b) displacement spectra.
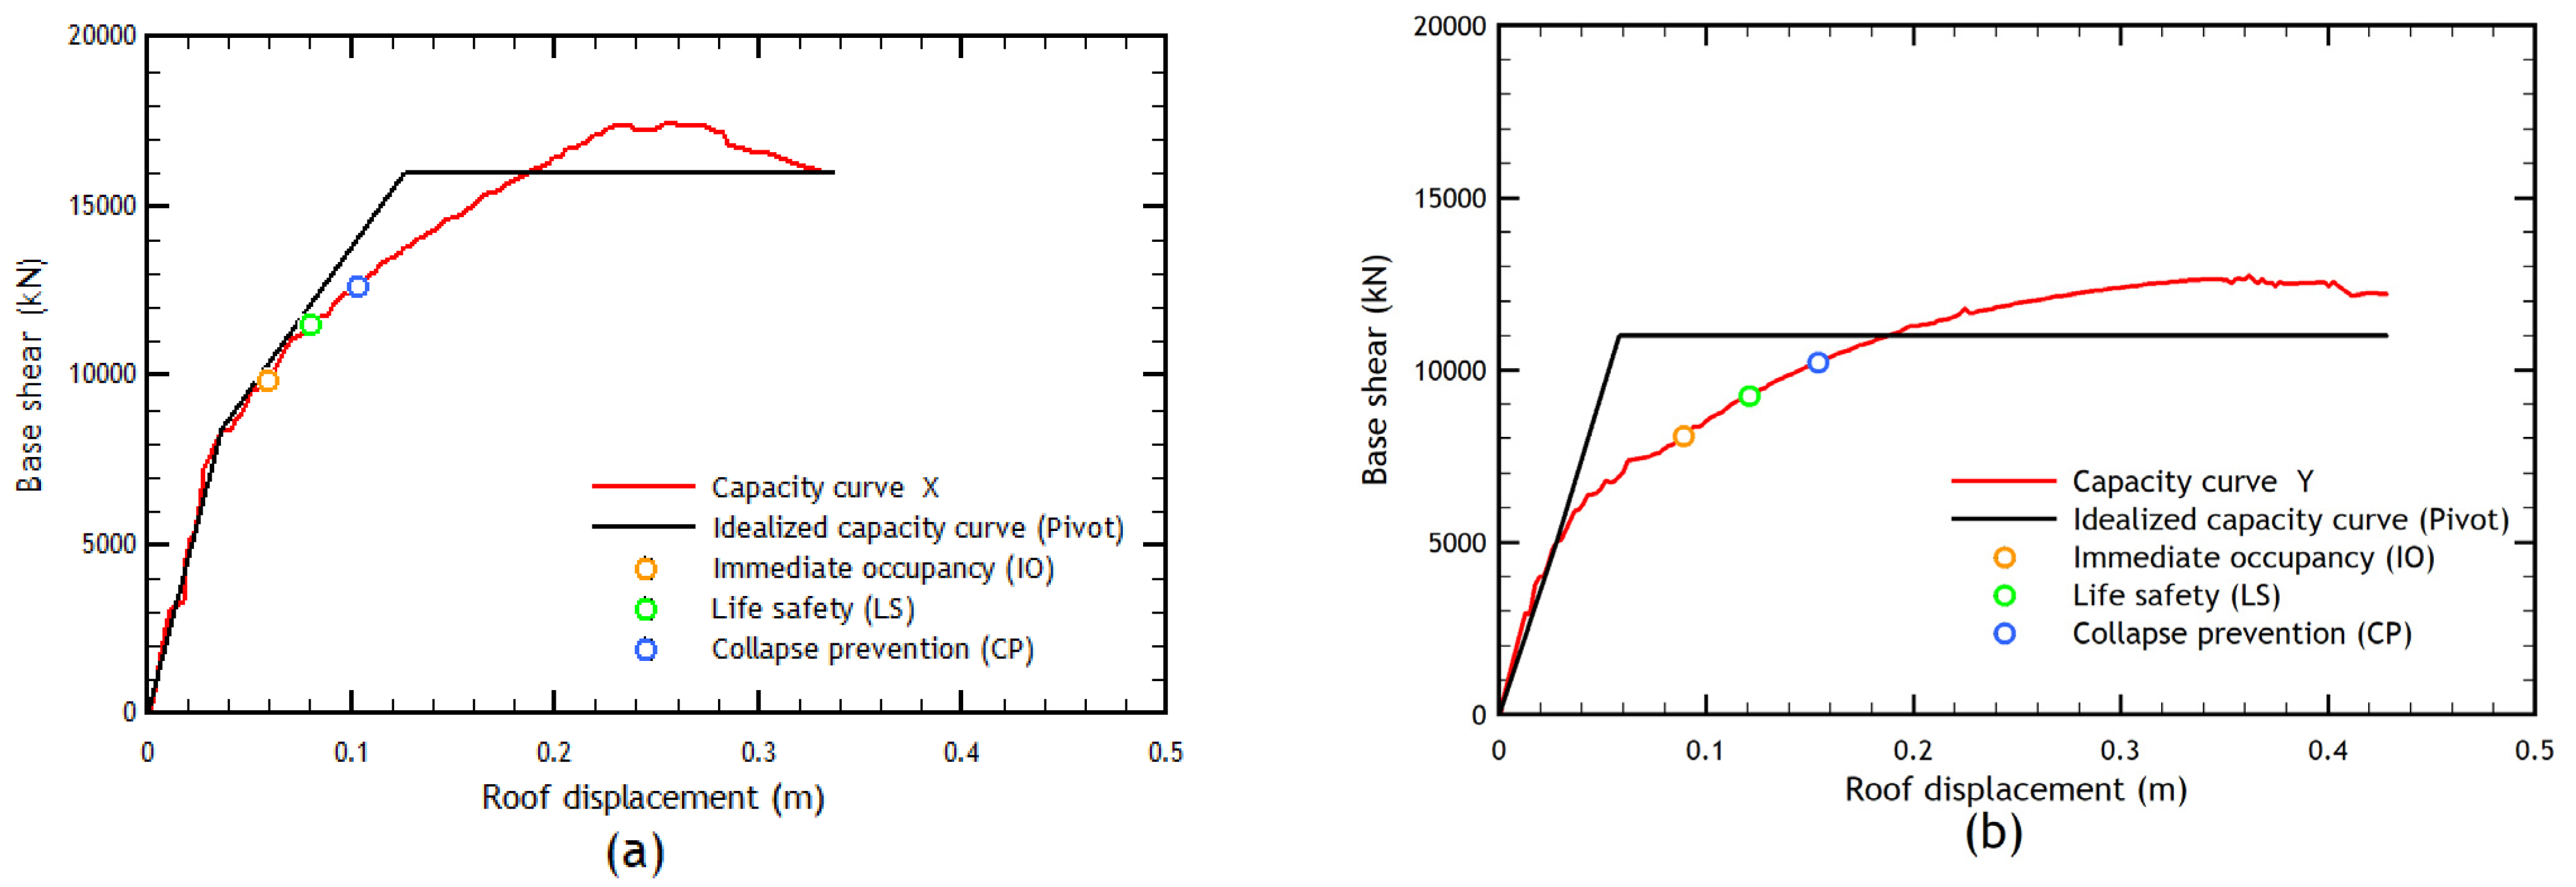
Figure 6.
Results of the pushover analysis in the (a) X and (b) Y directions.
Figure 6.
Results of the pushover analysis in the (a) X and (b) Y directions.
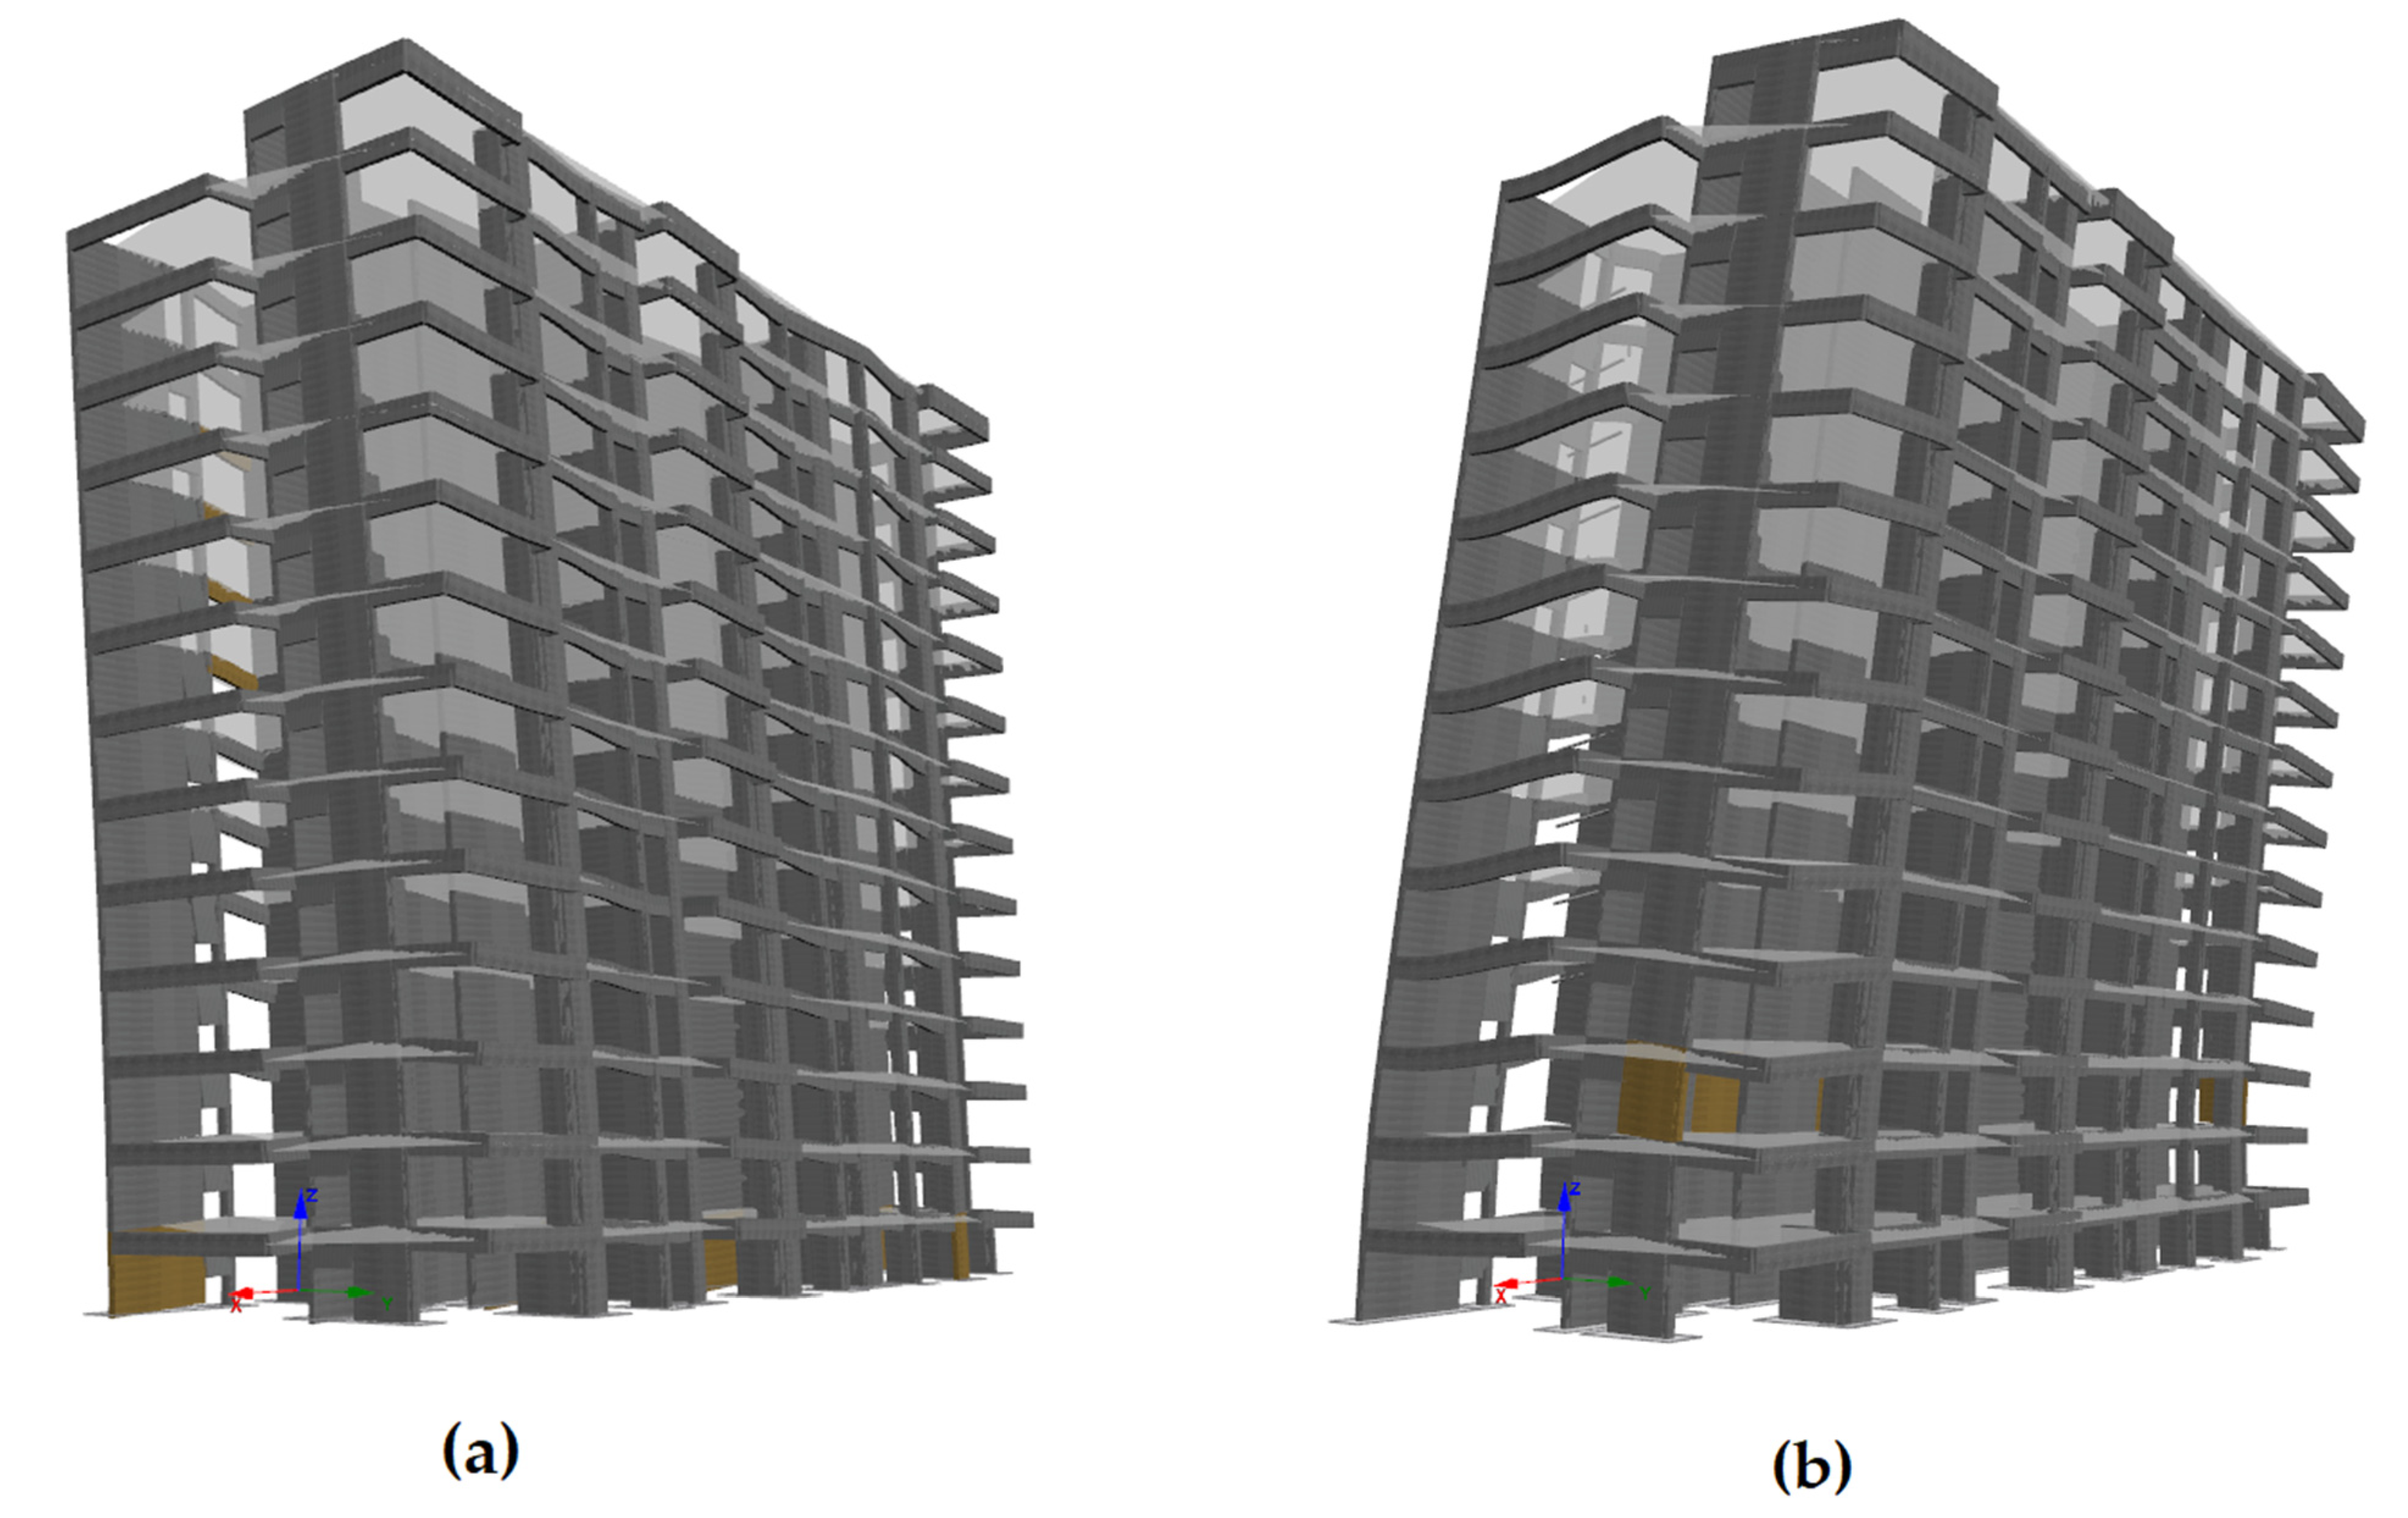
Figure 7.
Deformed shape of the building during pushover analysis in (a) X and (b) Y directions. Colored members indicate the presence of chord rotations over their limit values for Life Safety.
Figure 7.
Deformed shape of the building during pushover analysis in (a) X and (b) Y directions. Colored members indicate the presence of chord rotations over their limit values for Life Safety.
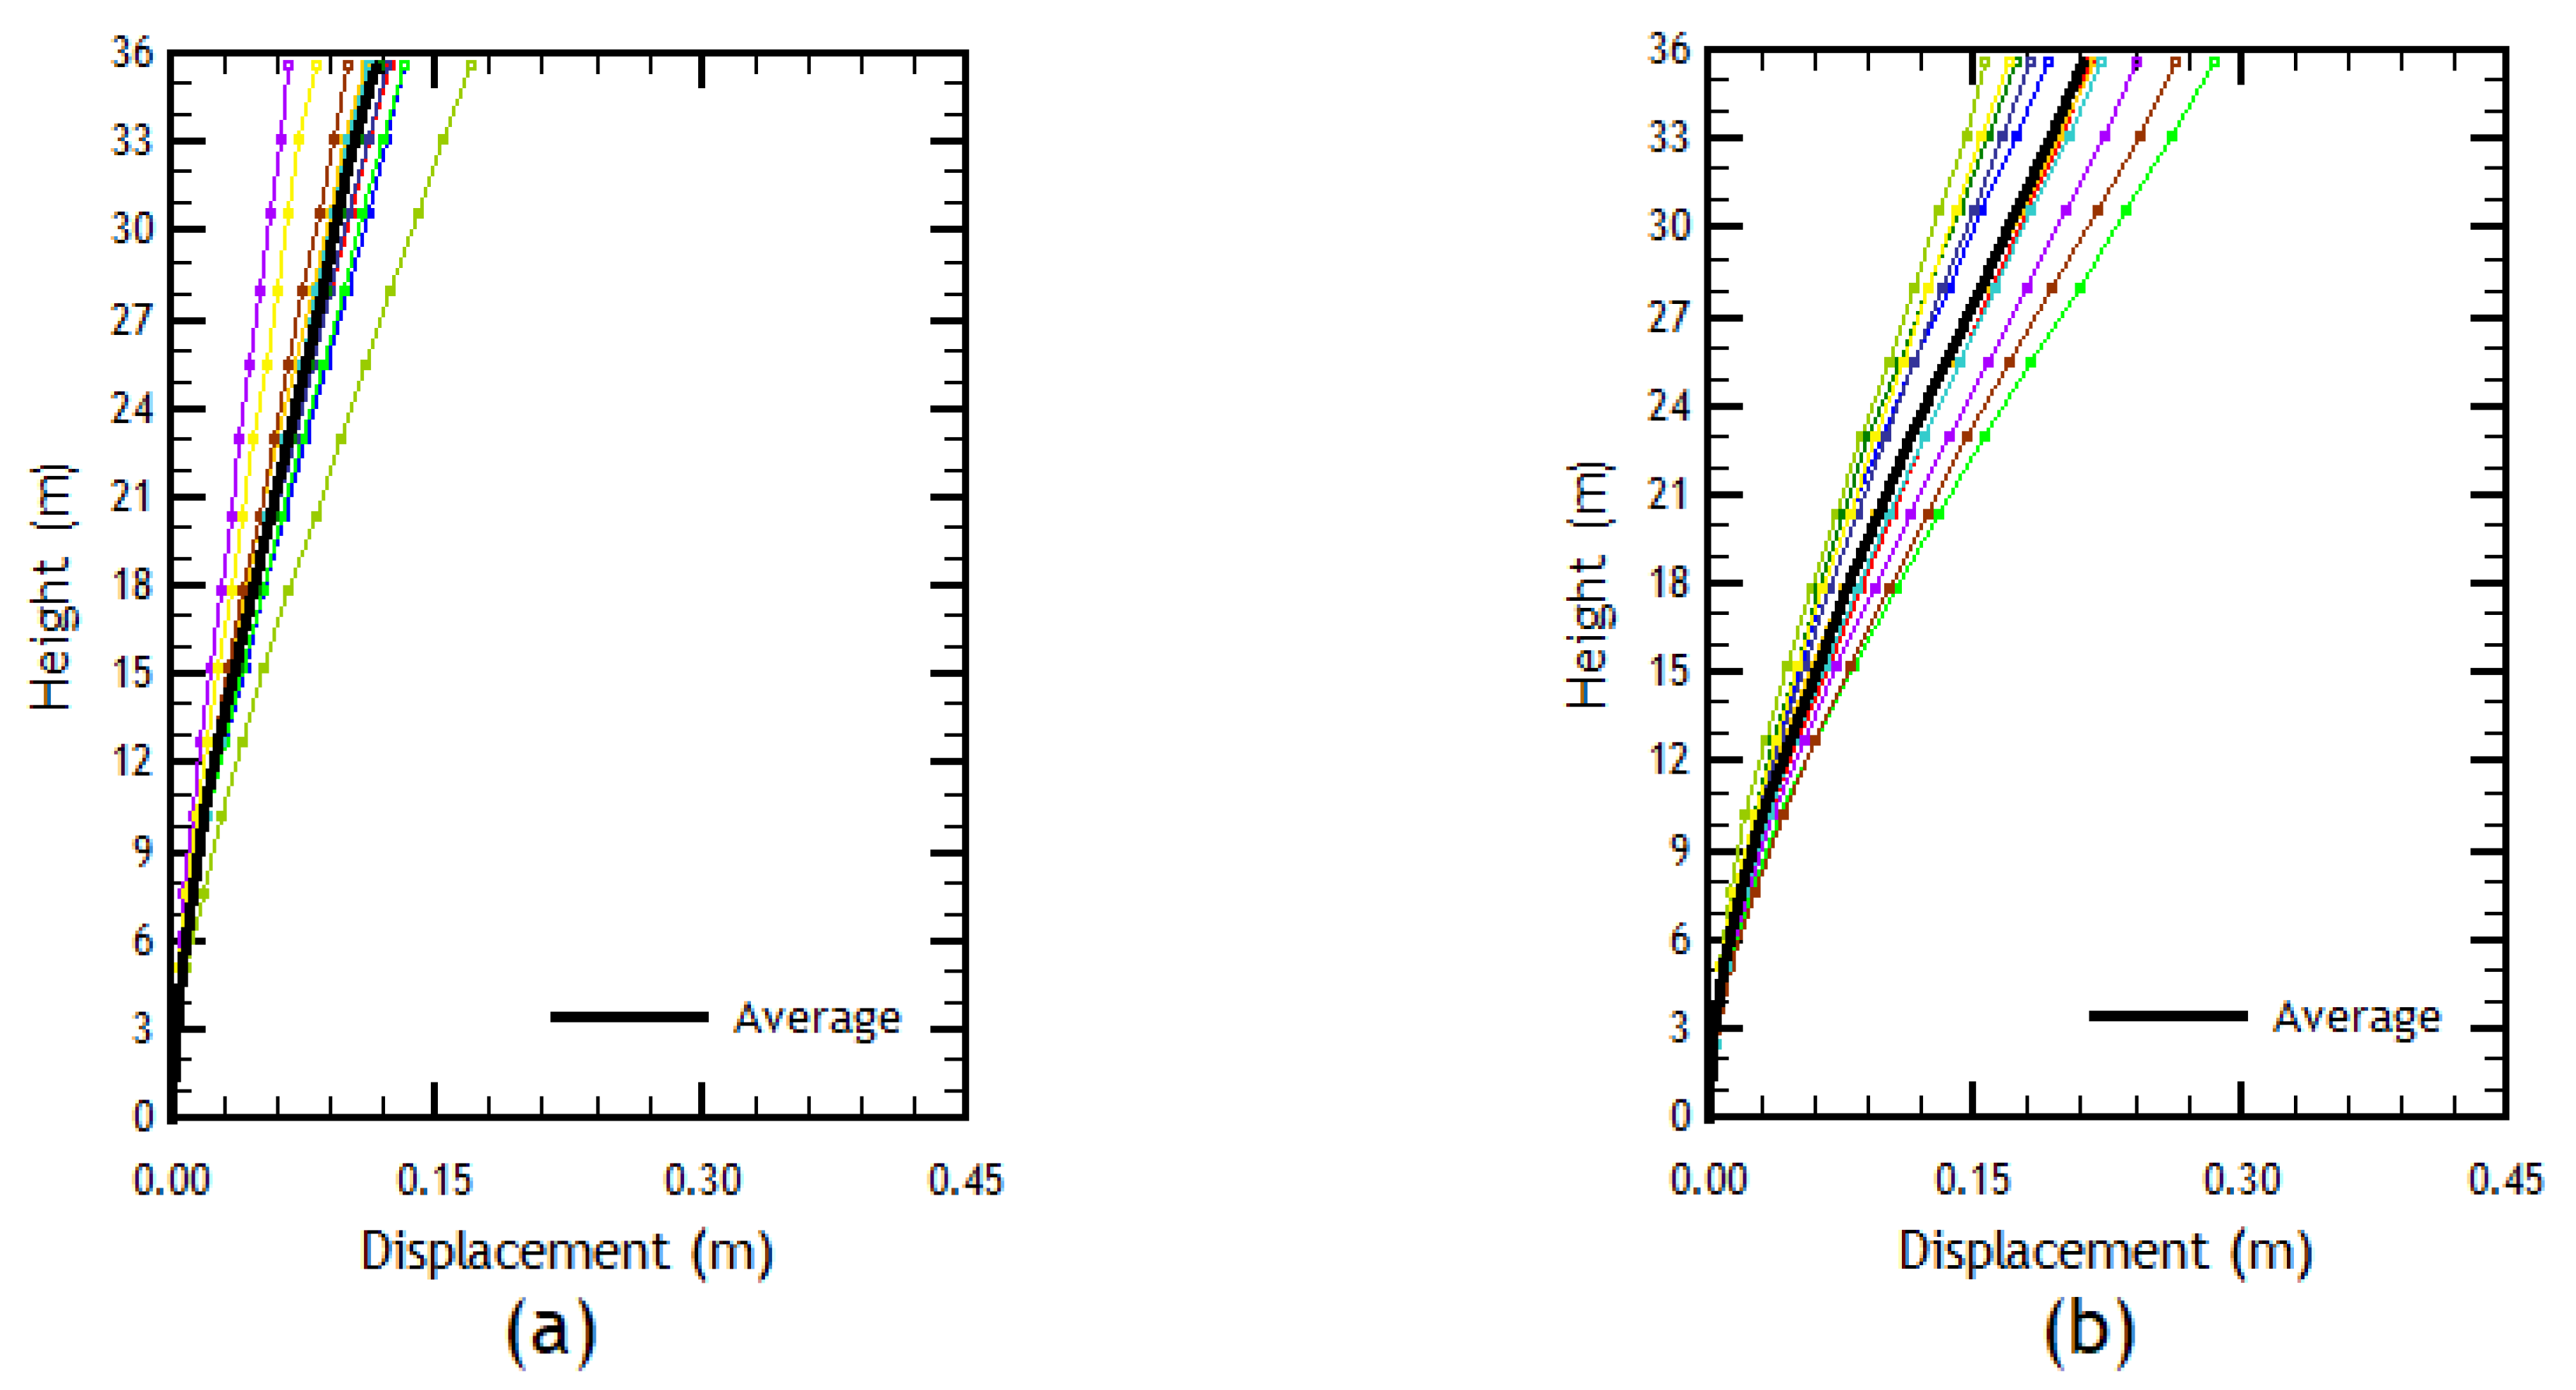
Figure 8.
Floor displacements: (a) X direction; (b) Y direction.
Figure 8.
Floor displacements: (a) X direction; (b) Y direction.
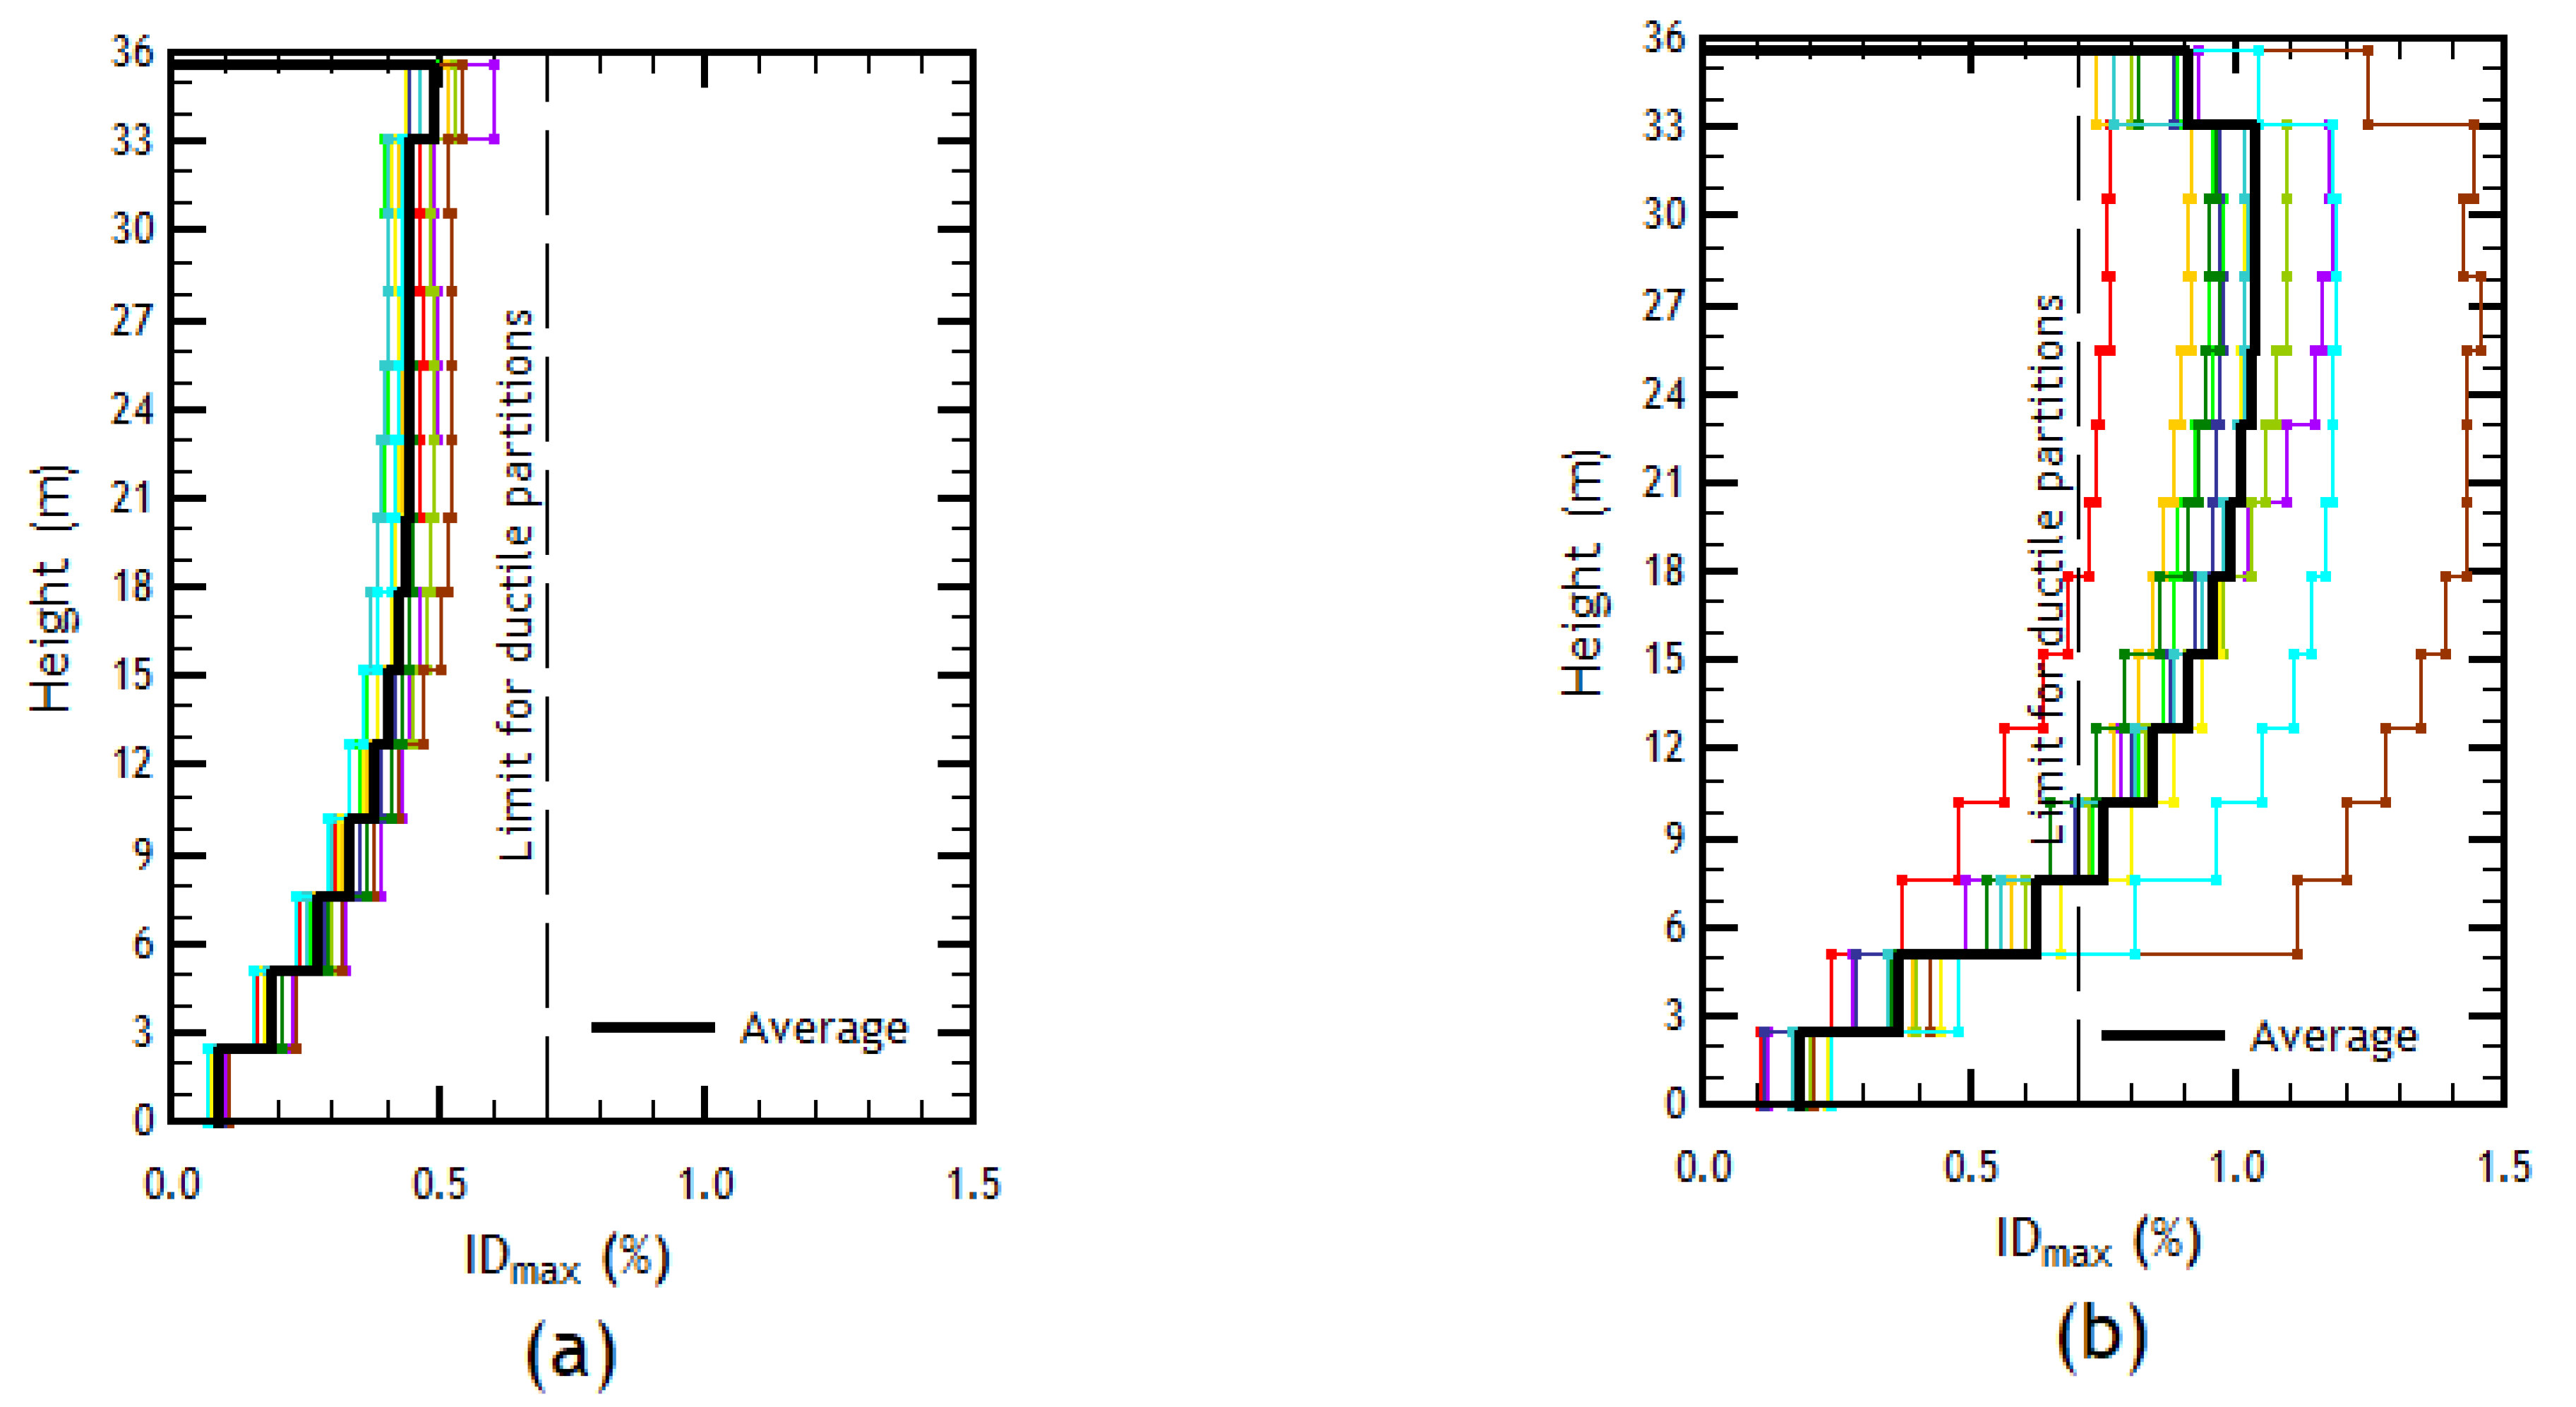
Figure 9.
Story drifts: (a) X direction; (b) Y direction.
Figure 9.
Story drifts: (a) X direction; (b) Y direction.
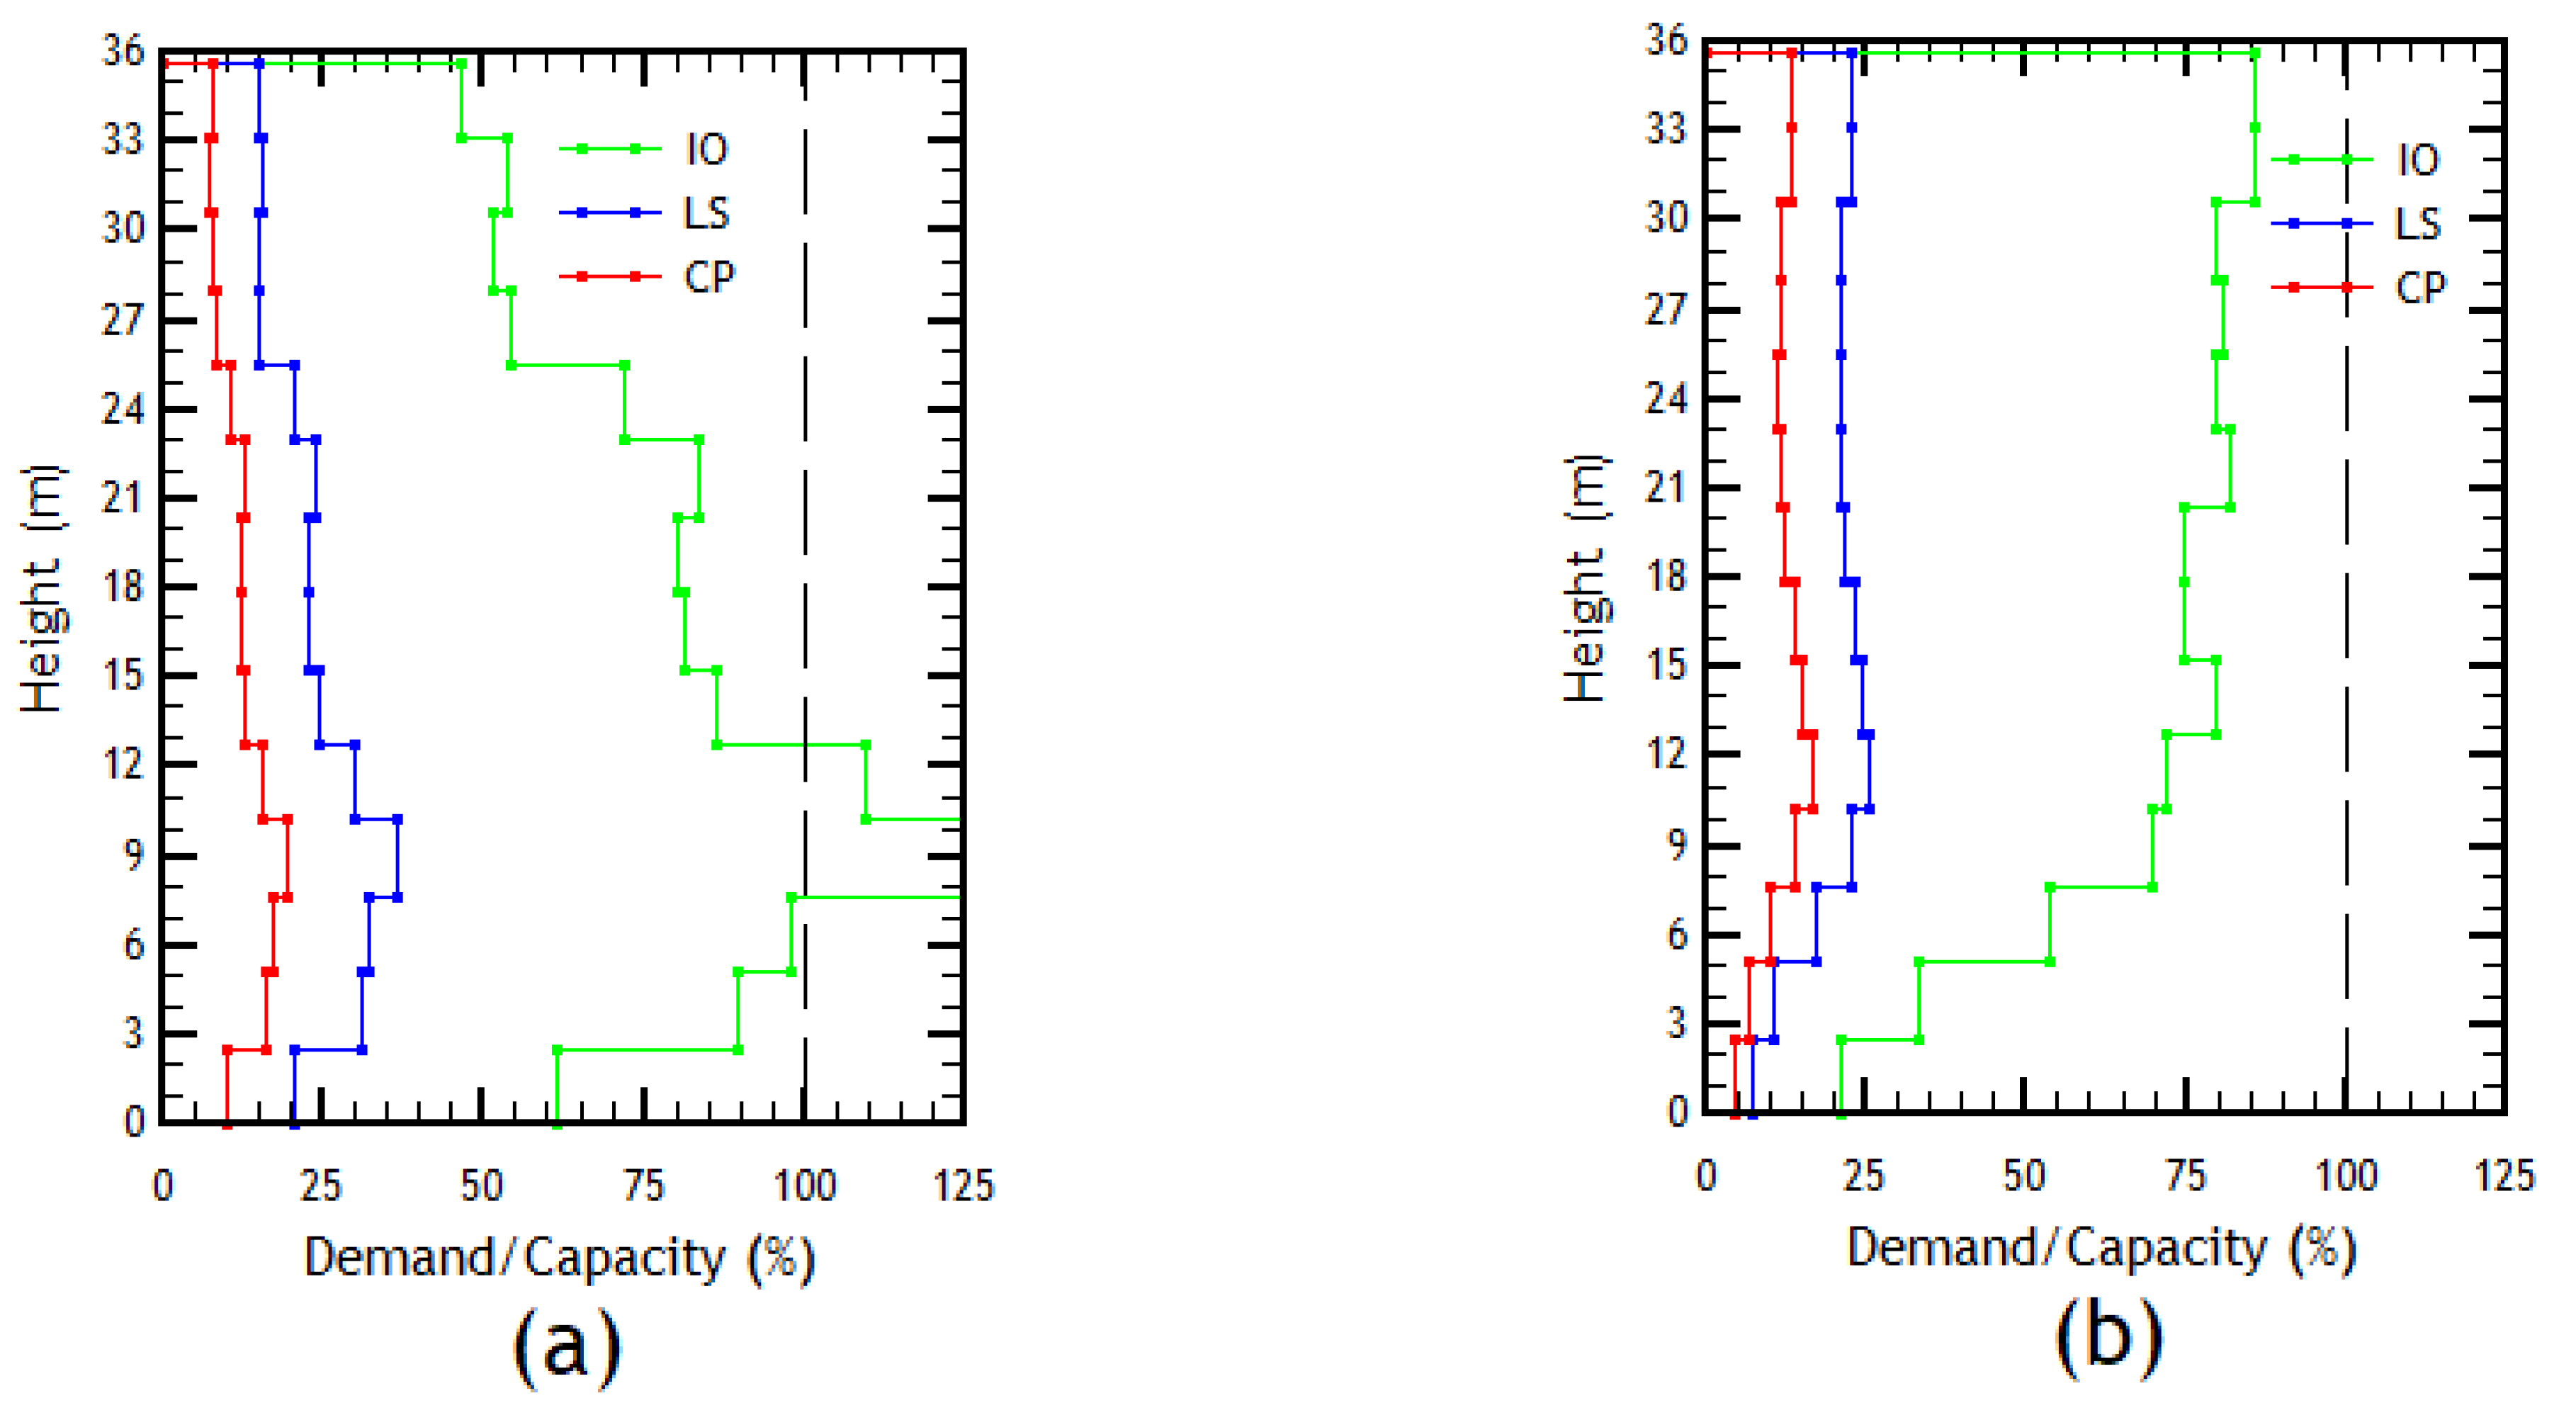
Figure 10.
Chord rotation demand/capacity ratio: (a) wall in the X direction; (b) wall in the Y direction.
Figure 10.
Chord rotation demand/capacity ratio: (a) wall in the X direction; (b) wall in the Y direction.
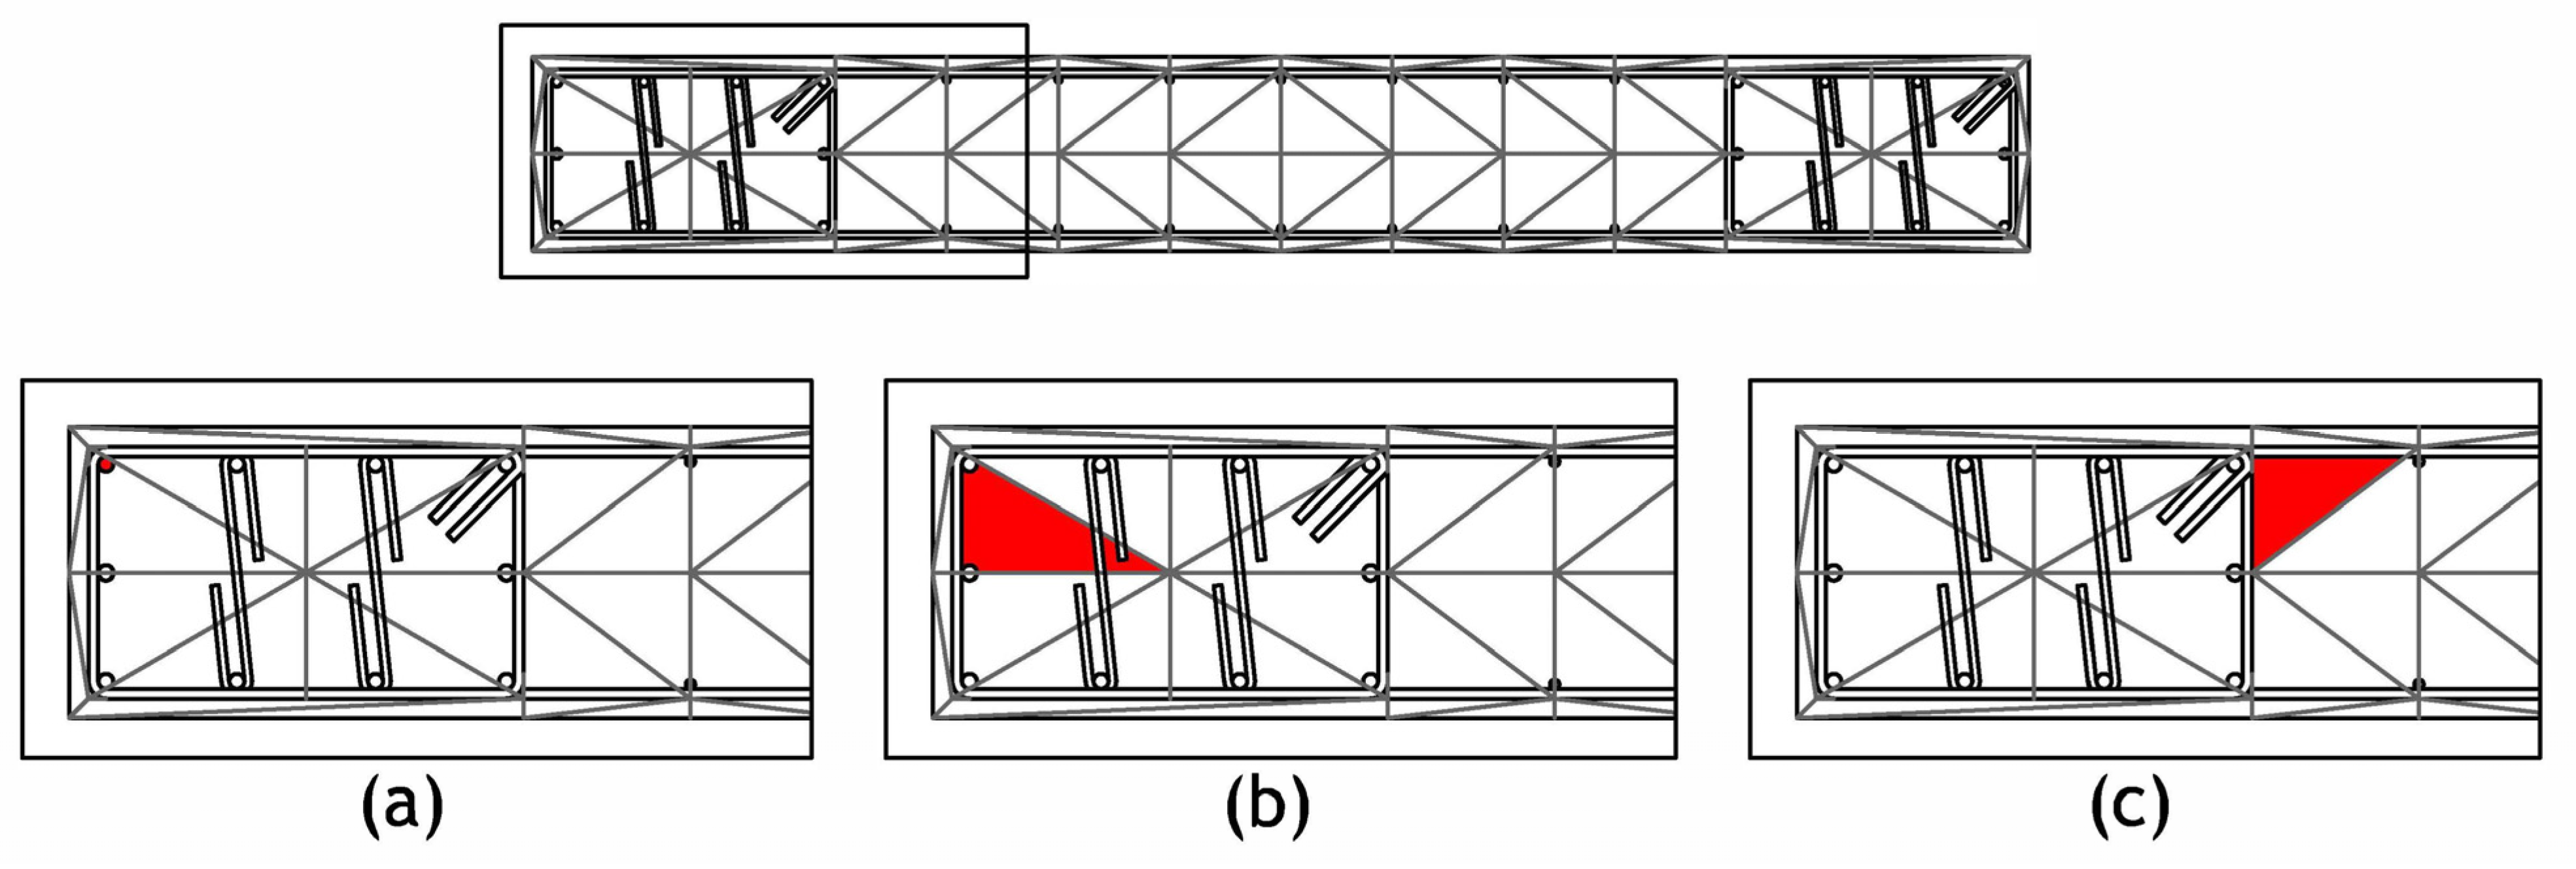
Figure 11.
Location of fibers for local performance evaluation, wall in X direction: (a) reinforcement steel; (b) concrete in edge element; and (c) concrete in double mesh.
Figure 11.
Location of fibers for local performance evaluation, wall in X direction: (a) reinforcement steel; (b) concrete in edge element; and (c) concrete in double mesh.
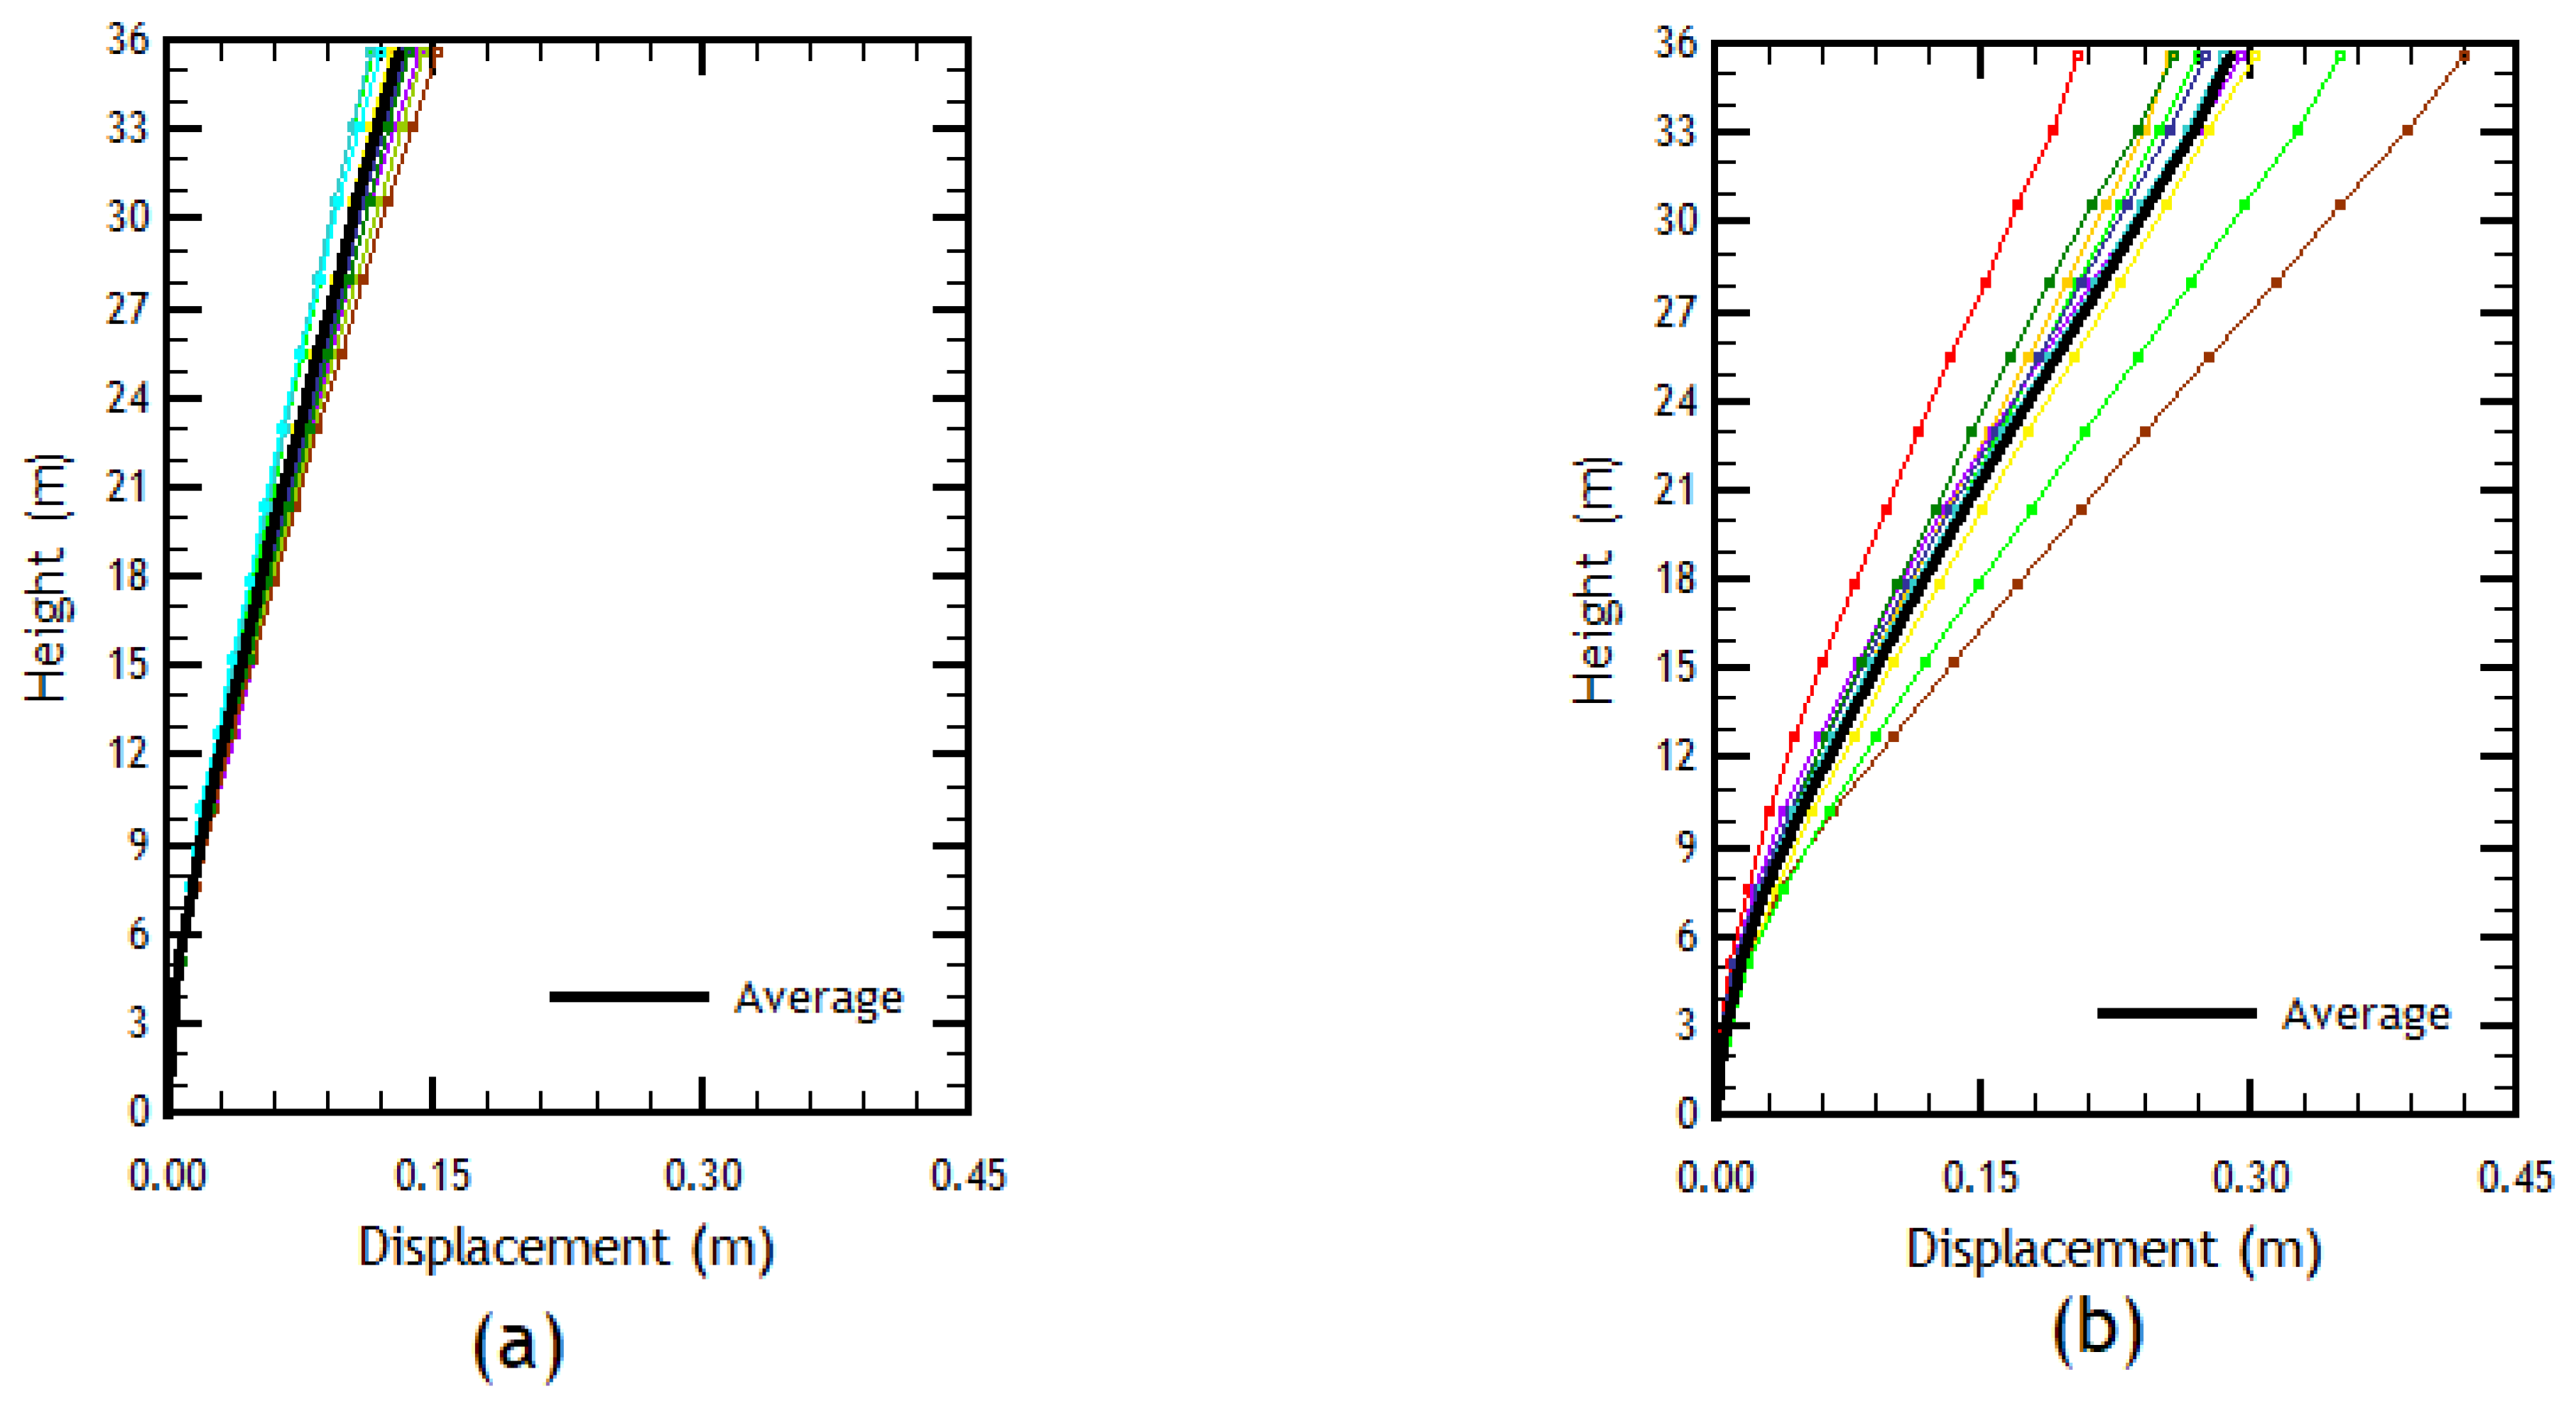
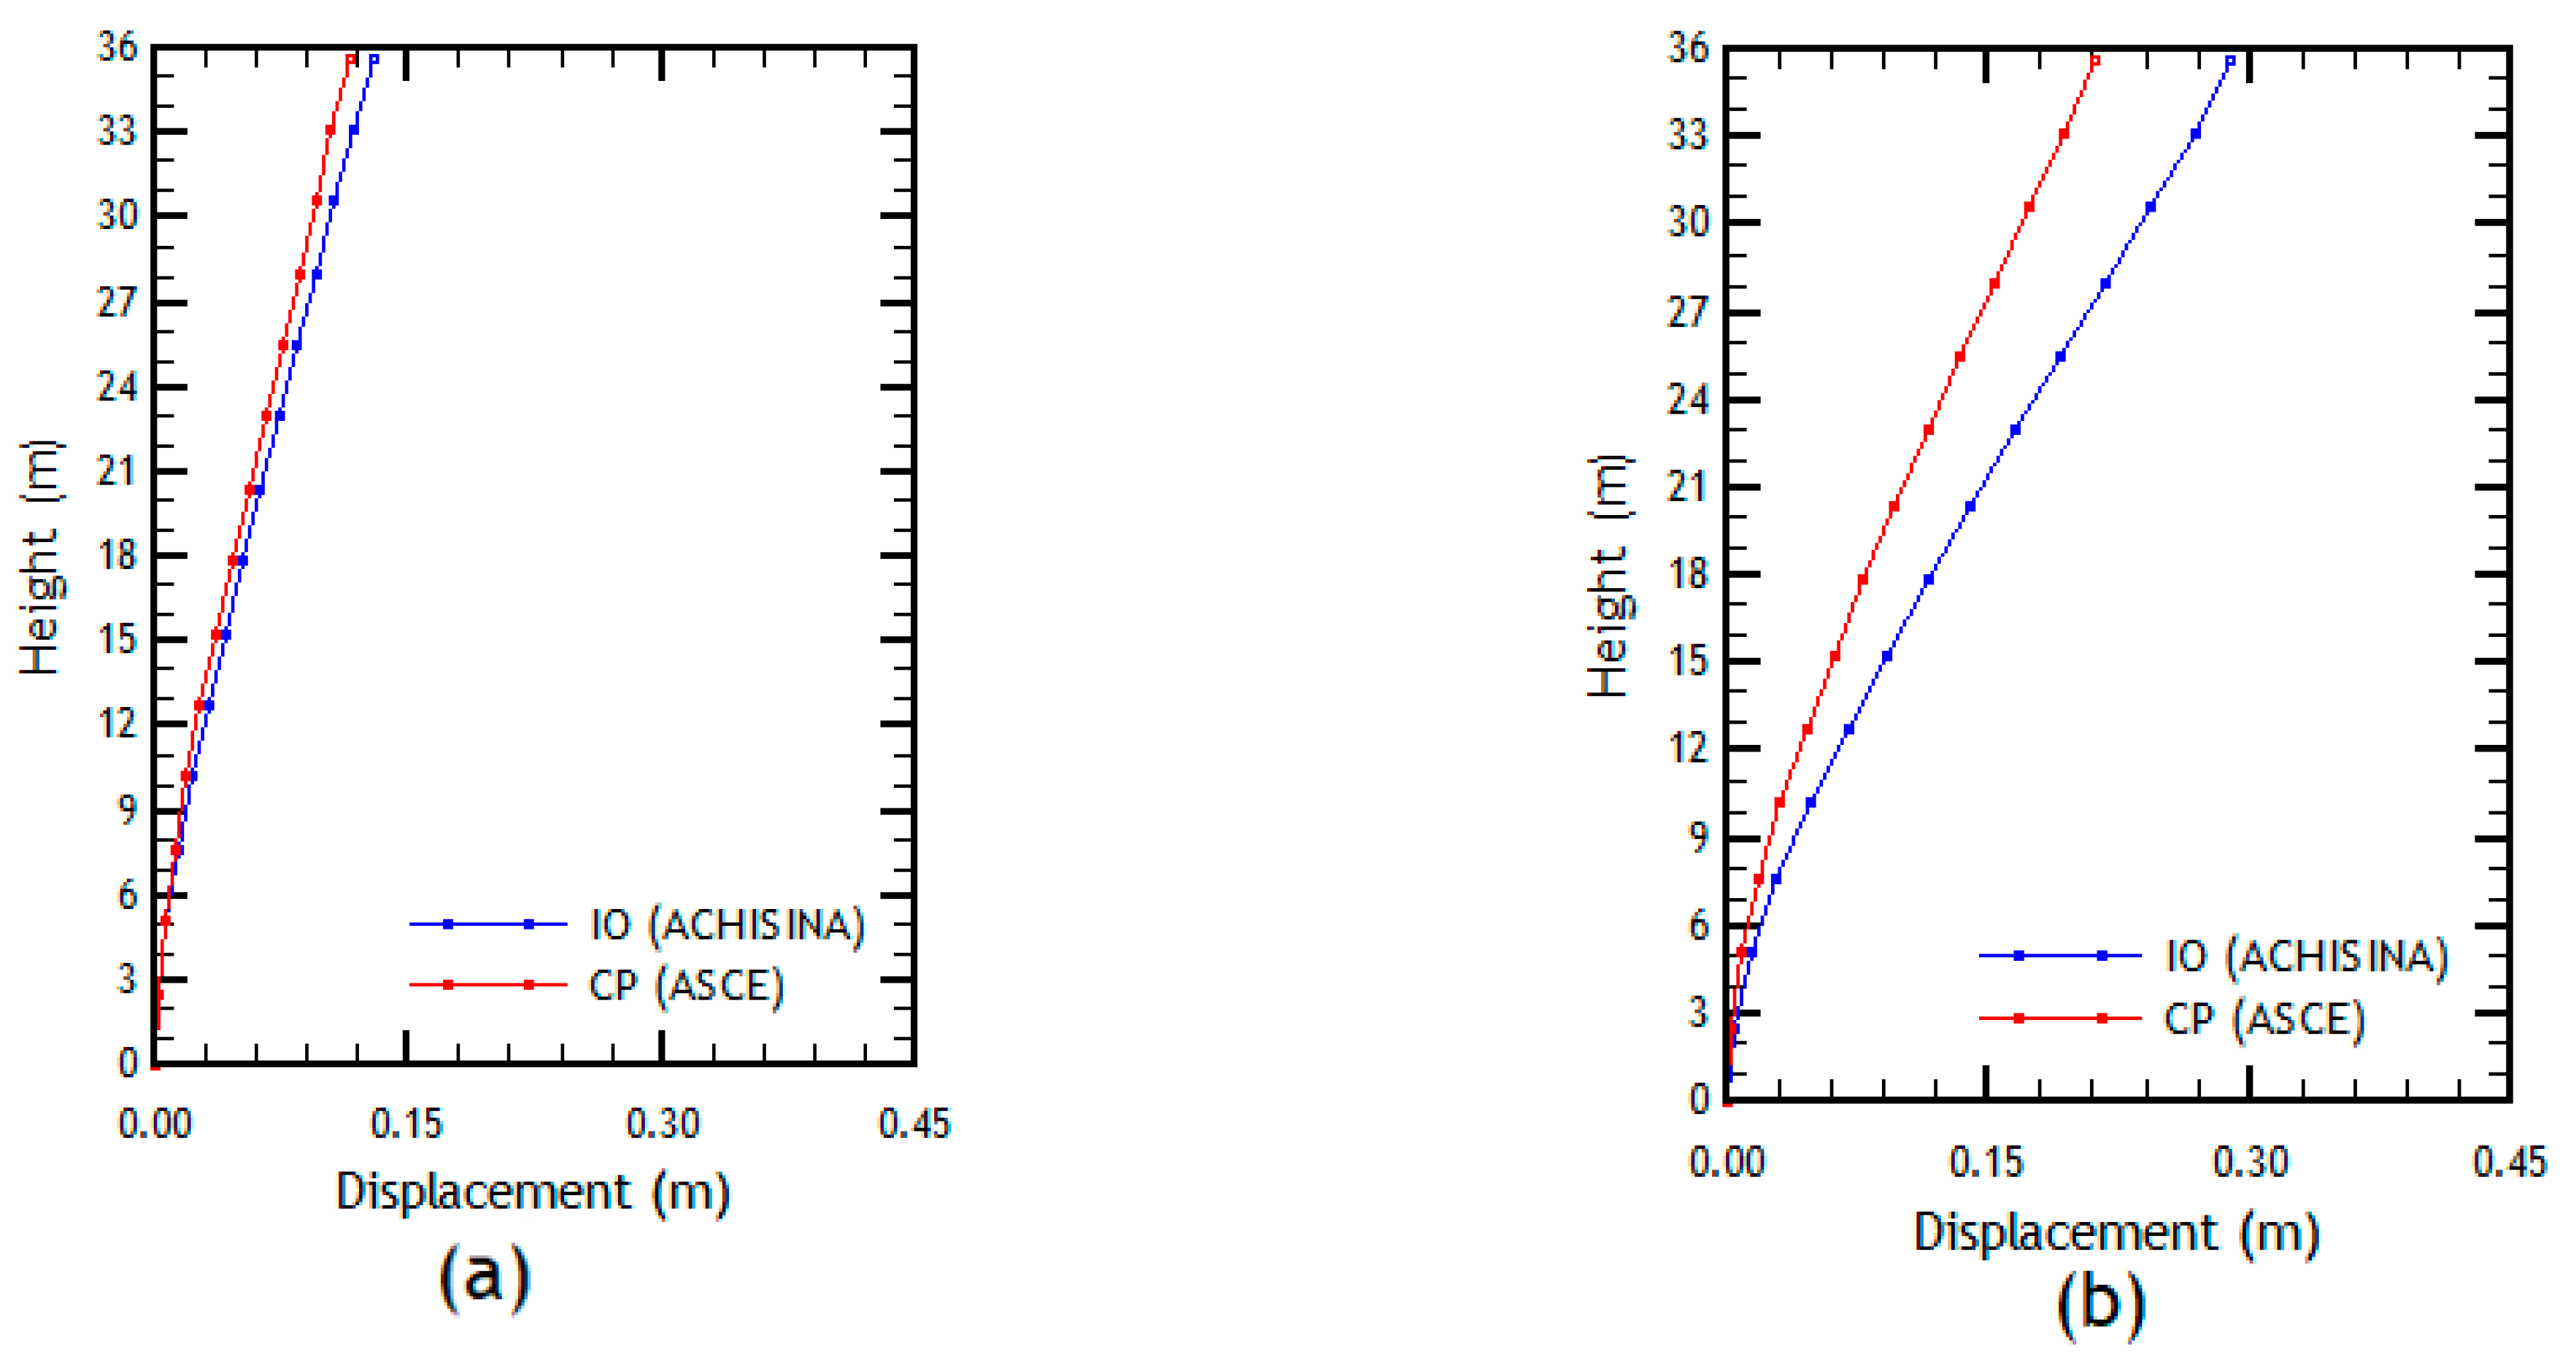
Figure 12.
Floor displacements: (a) X direction; (b) Y direction. Immediate Occupancy Limit State.
Figure 12.
Floor displacements: (a) X direction; (b) Y direction. Immediate Occupancy Limit State.
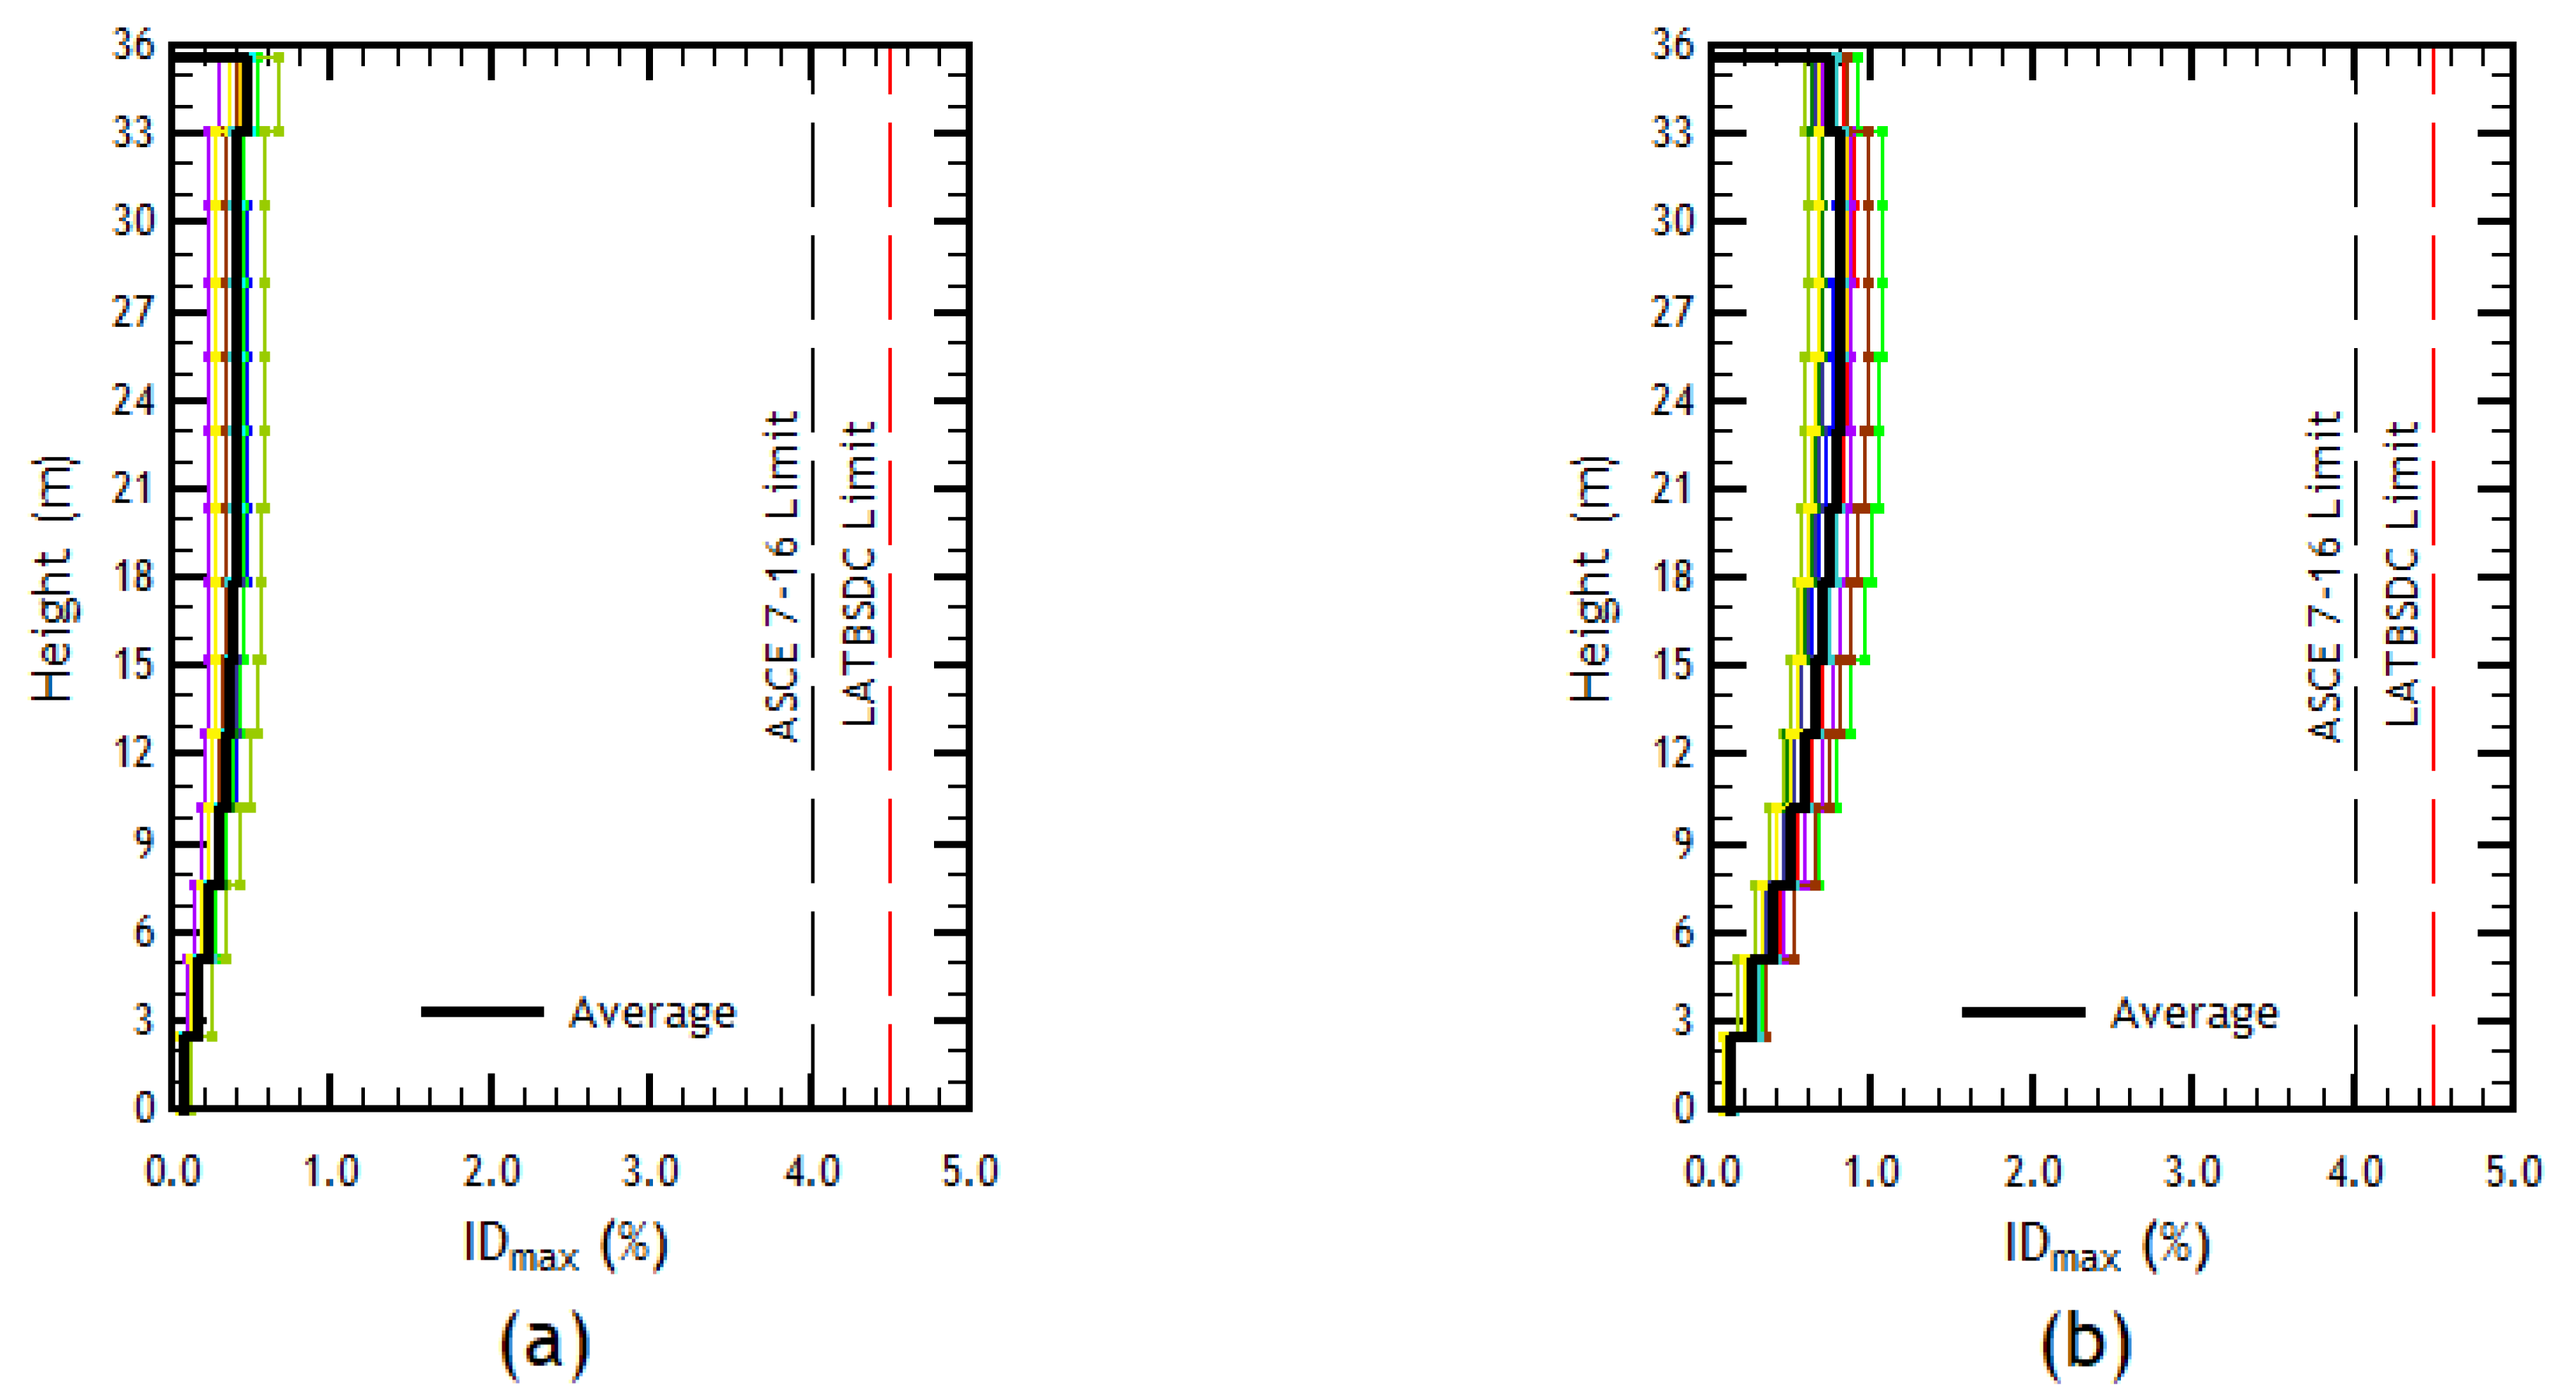
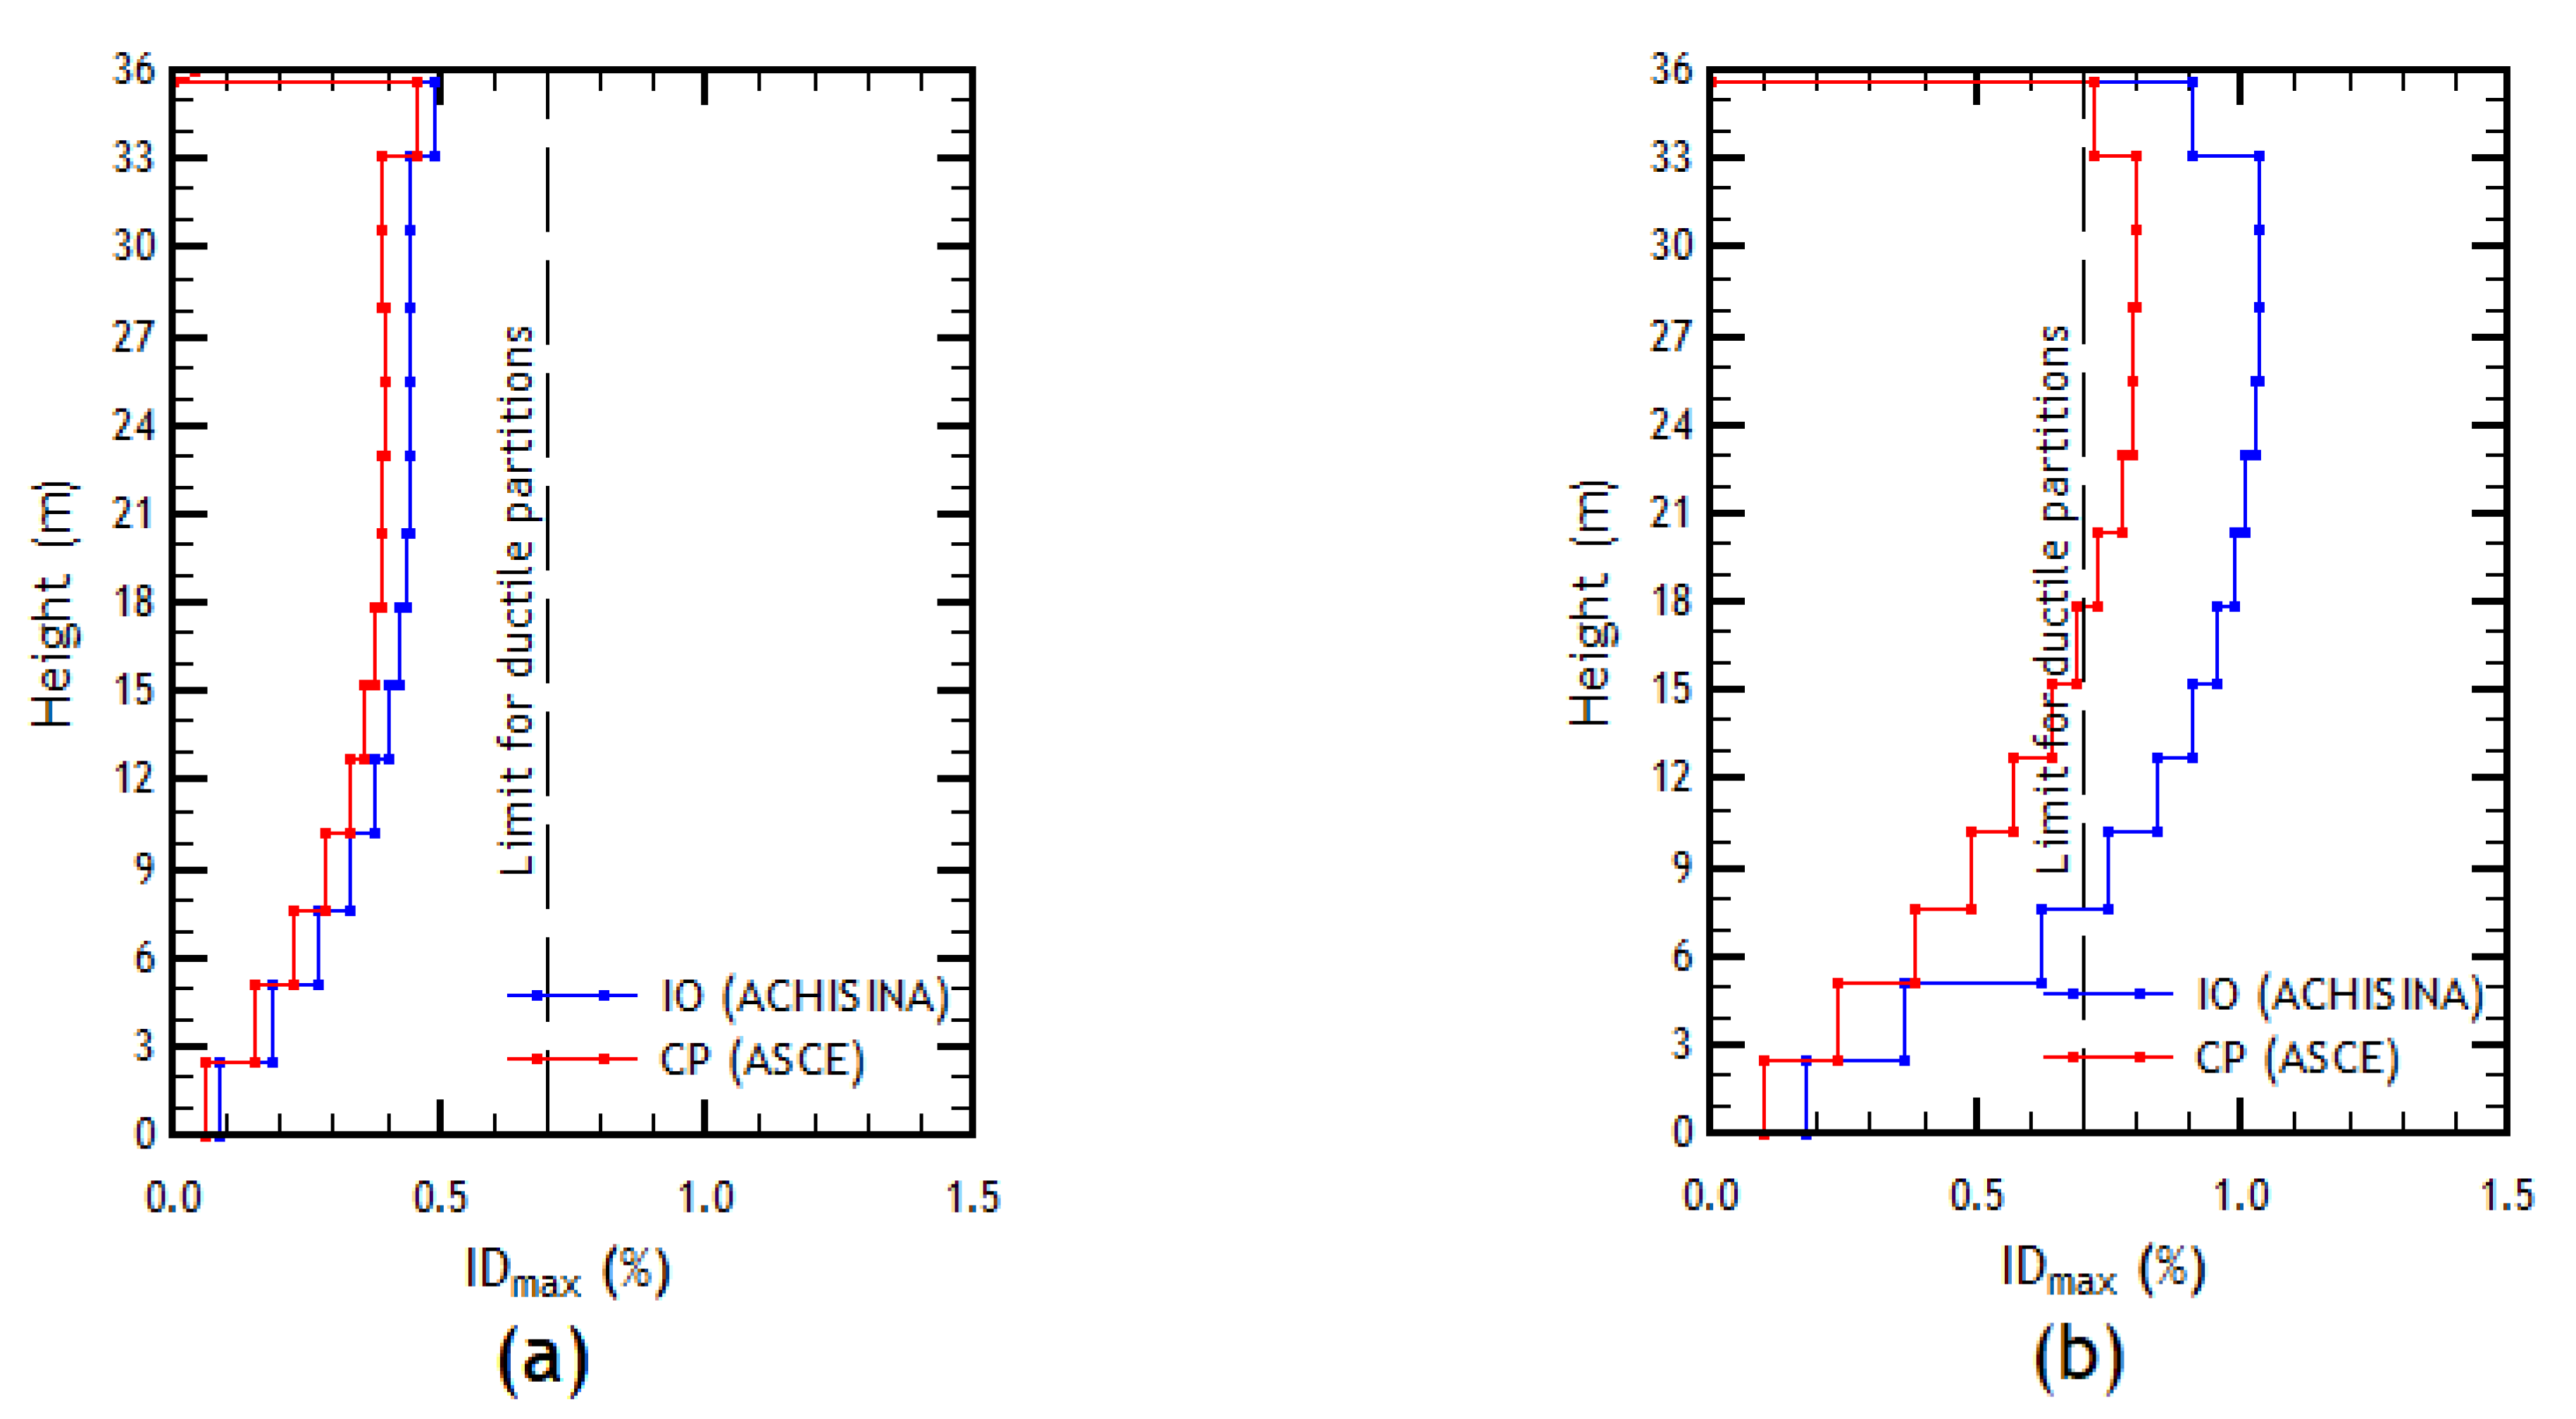
Figure 13.
Story drifts: (a) X direction; (b) Y direction. Immediate Occupancy Limit State.
Figure 13.
Story drifts: (a) X direction; (b) Y direction. Immediate Occupancy Limit State.
Figure 14.
Comparison of displacements between ASCE 41-17 and ACHISINA analyses: (a) X direction; (b) Y direction.
Figure 14.
Comparison of displacements between ASCE 41-17 and ACHISINA analyses: (a) X direction; (b) Y direction.
Figure 15.
Comparison of story drifts between ASCE 41-17 and ACHISINA analyses: (a) X direction; (b) Y direction.
Figure 15.
Comparison of story drifts between ASCE 41-17 and ACHISINA analyses: (a) X direction; (b) Y direction.
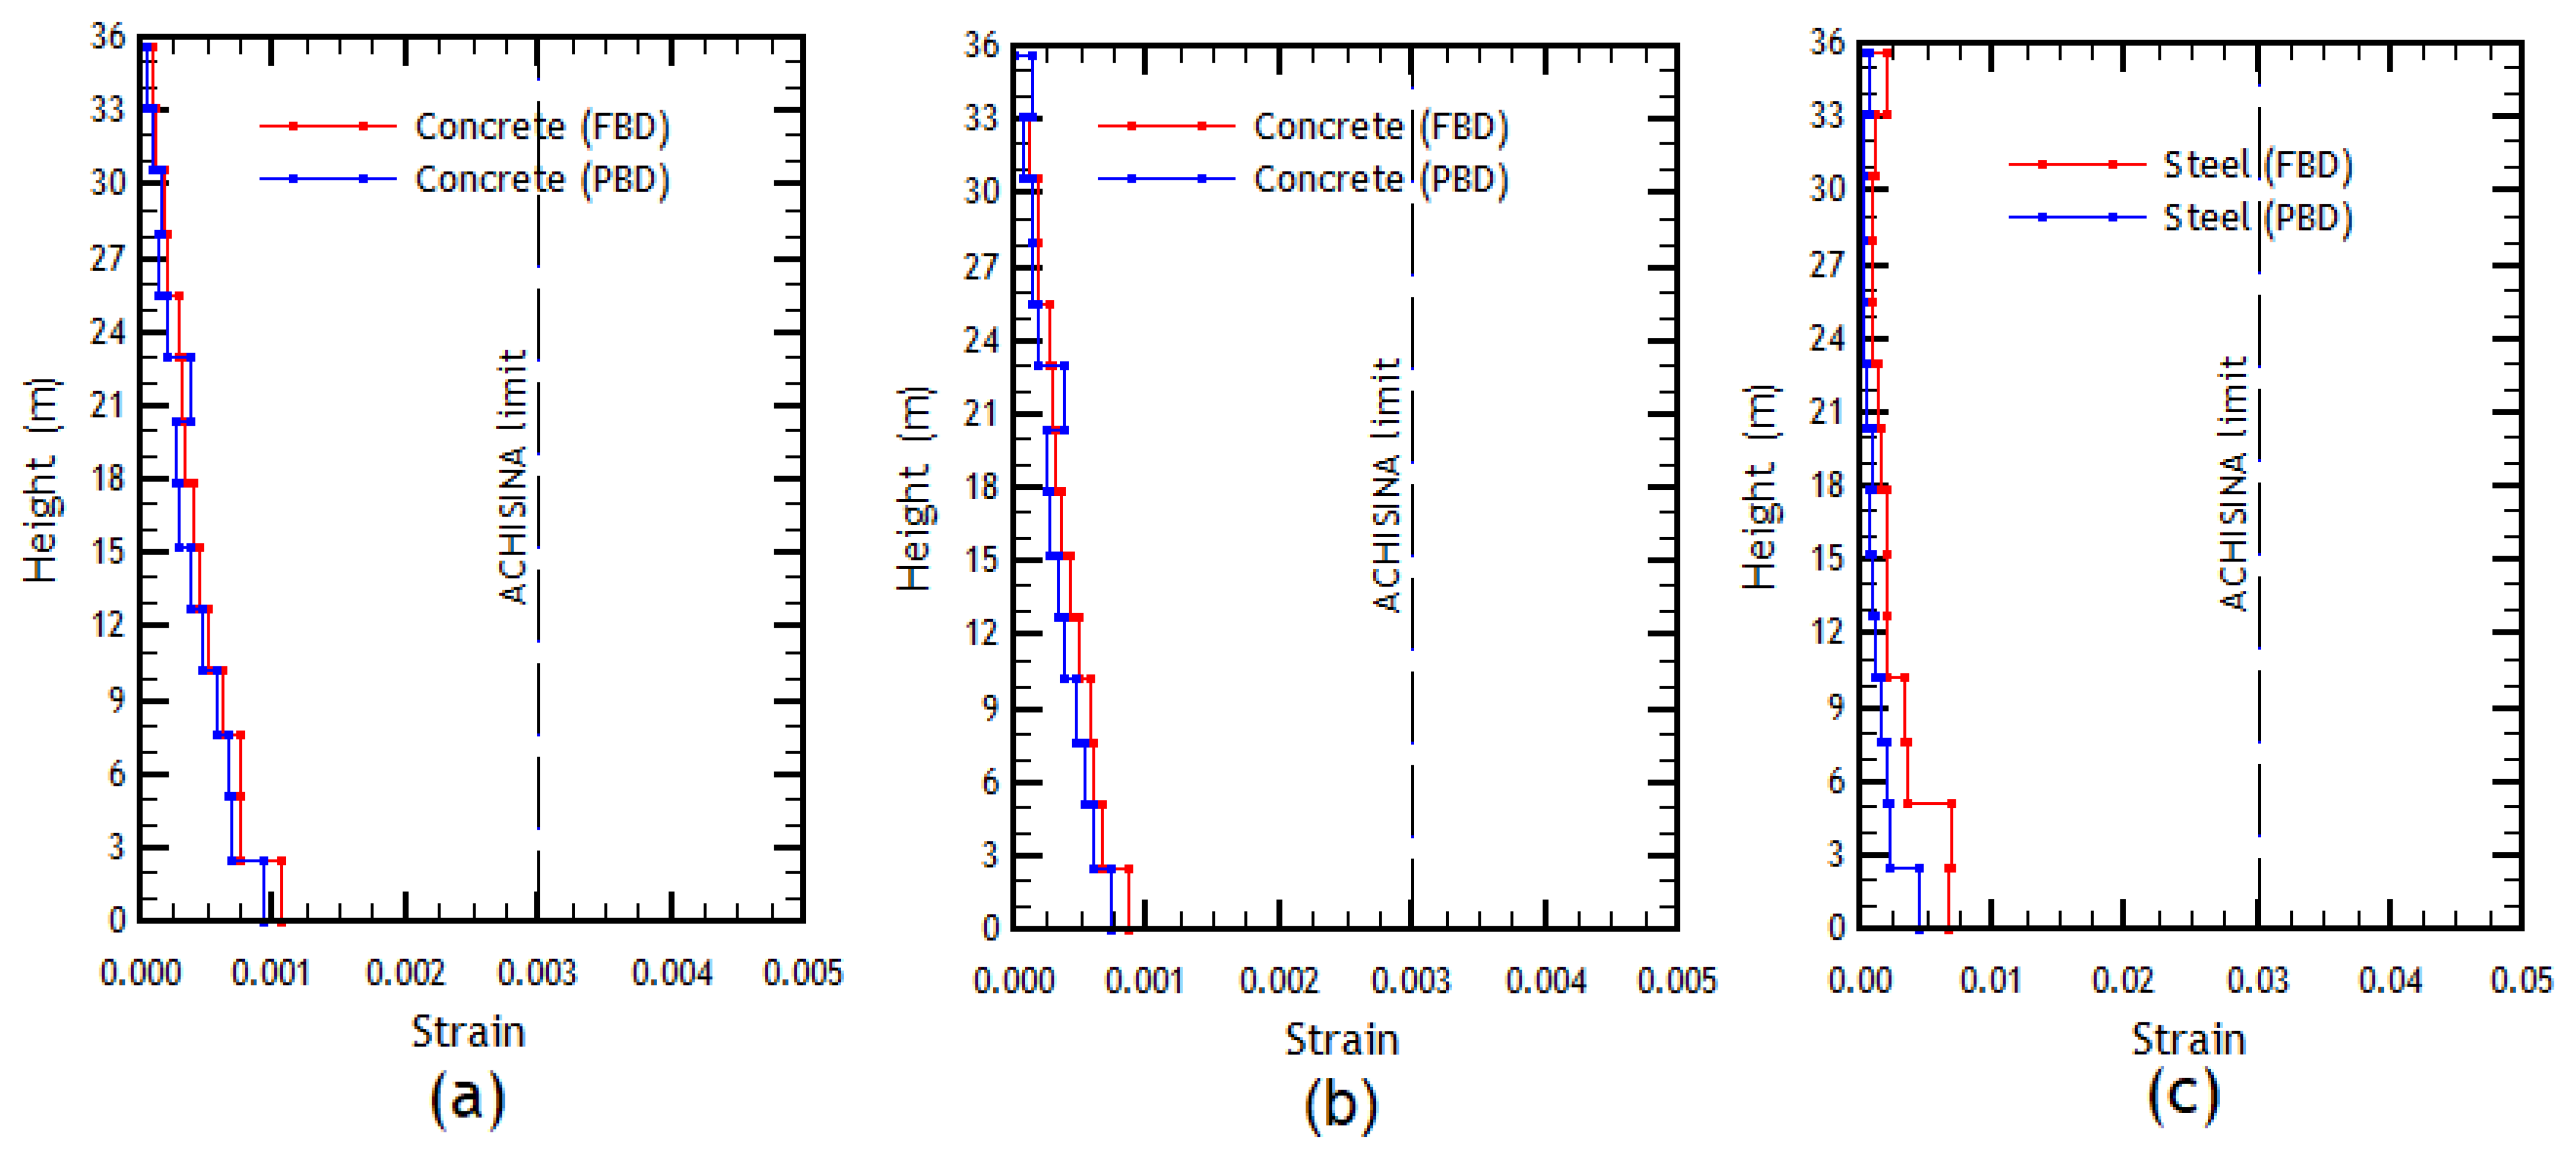
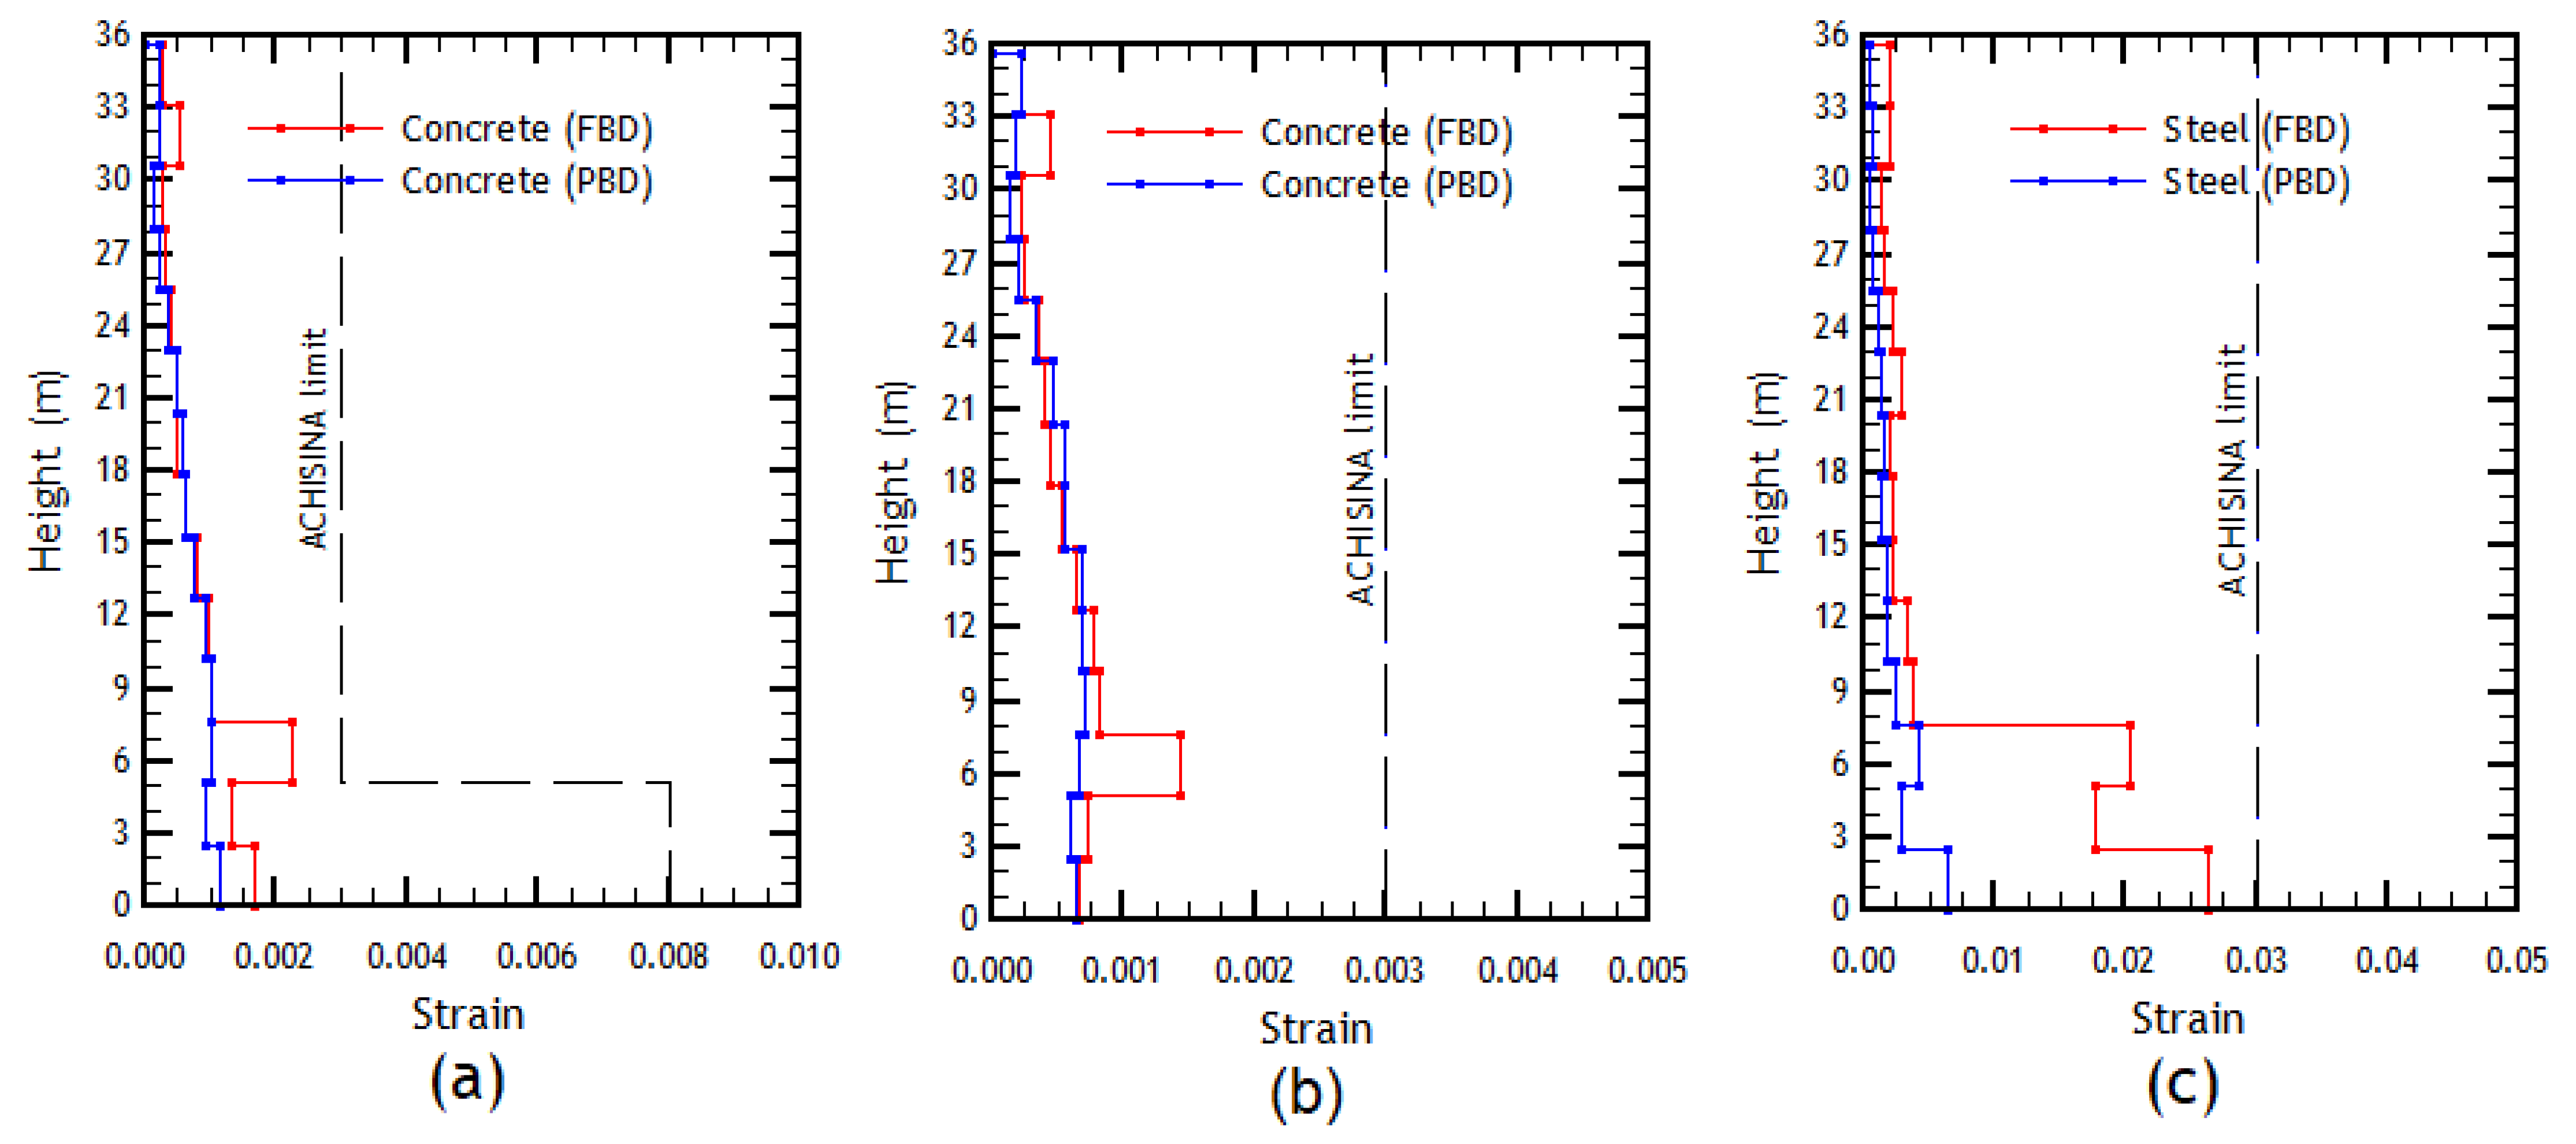
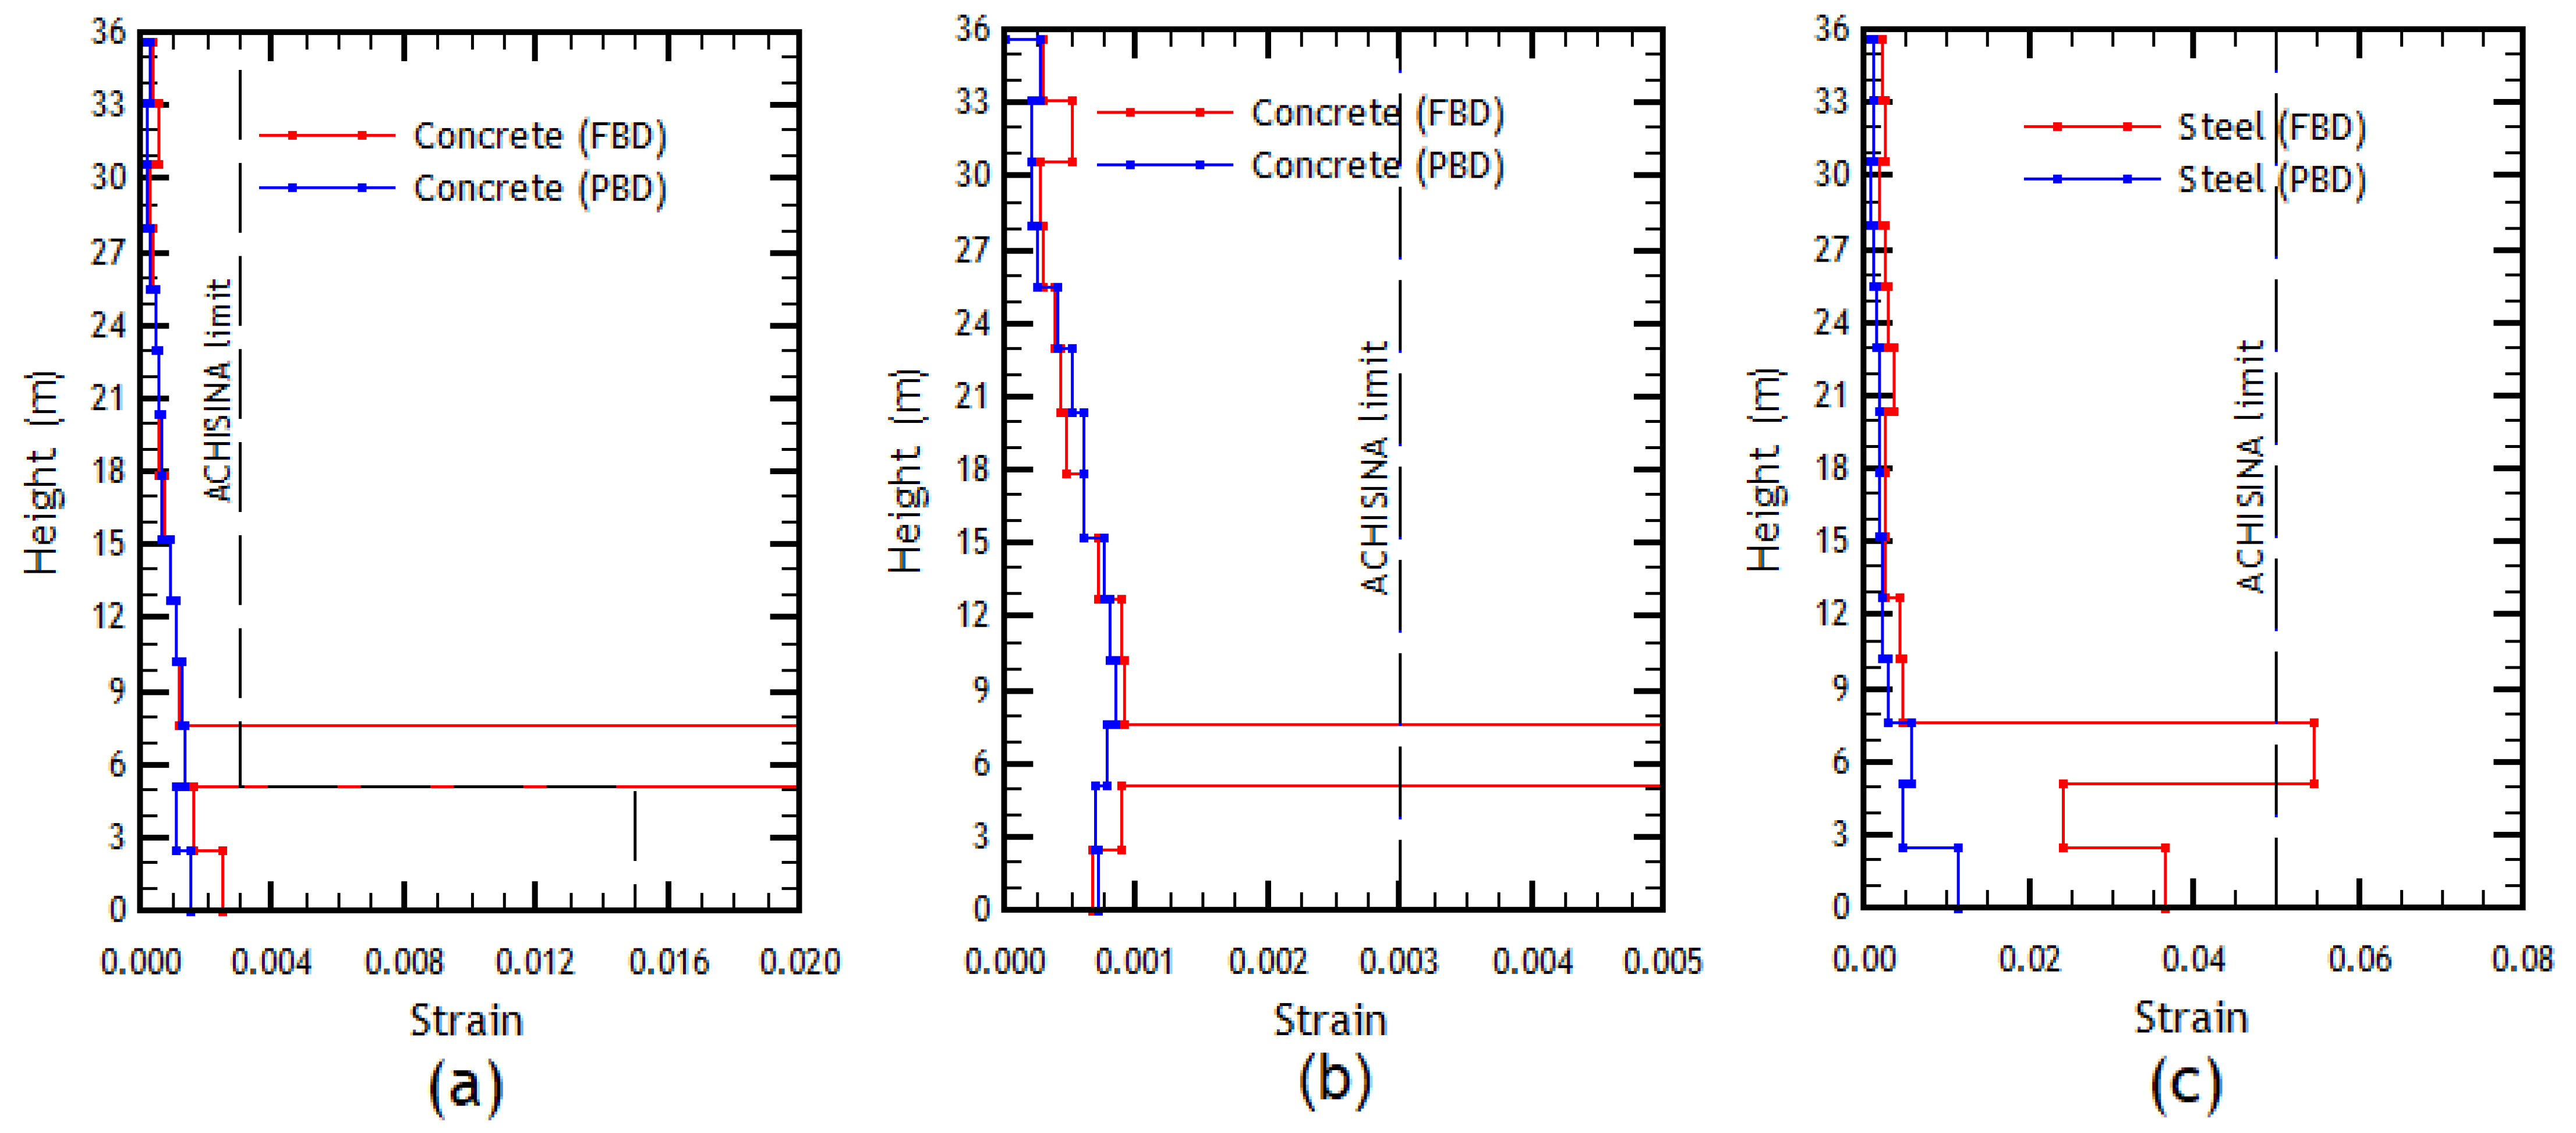
Figure 16.
Unit strain comparison of the wall in the X direction and respective acceptance criteria under the FBD and PBD designs: (a) edge element concrete; (b) double mesh concrete; and (c) edge element reinforcing steel. Immediate Occupancy limit state.
Figure 16.
Unit strain comparison of the wall in the X direction and respective acceptance criteria under the FBD and PBD designs: (a) edge element concrete; (b) double mesh concrete; and (c) edge element reinforcing steel. Immediate Occupancy limit state.
Figure 17.
Unit strain comparison of the wall in the Y direction and respective acceptance criteria under the FBD and PBD designs: (a) edge element concrete; (b) double mesh concrete; and (c) edge element reinforcing steel. Immediate Occupancy limit state.
Figure 17.
Unit strain comparison of the wall in the Y direction and respective acceptance criteria under the FBD and PBD designs: (a) edge element concrete; (b) double mesh concrete; and (c) edge element reinforcing steel. Immediate Occupancy limit state.
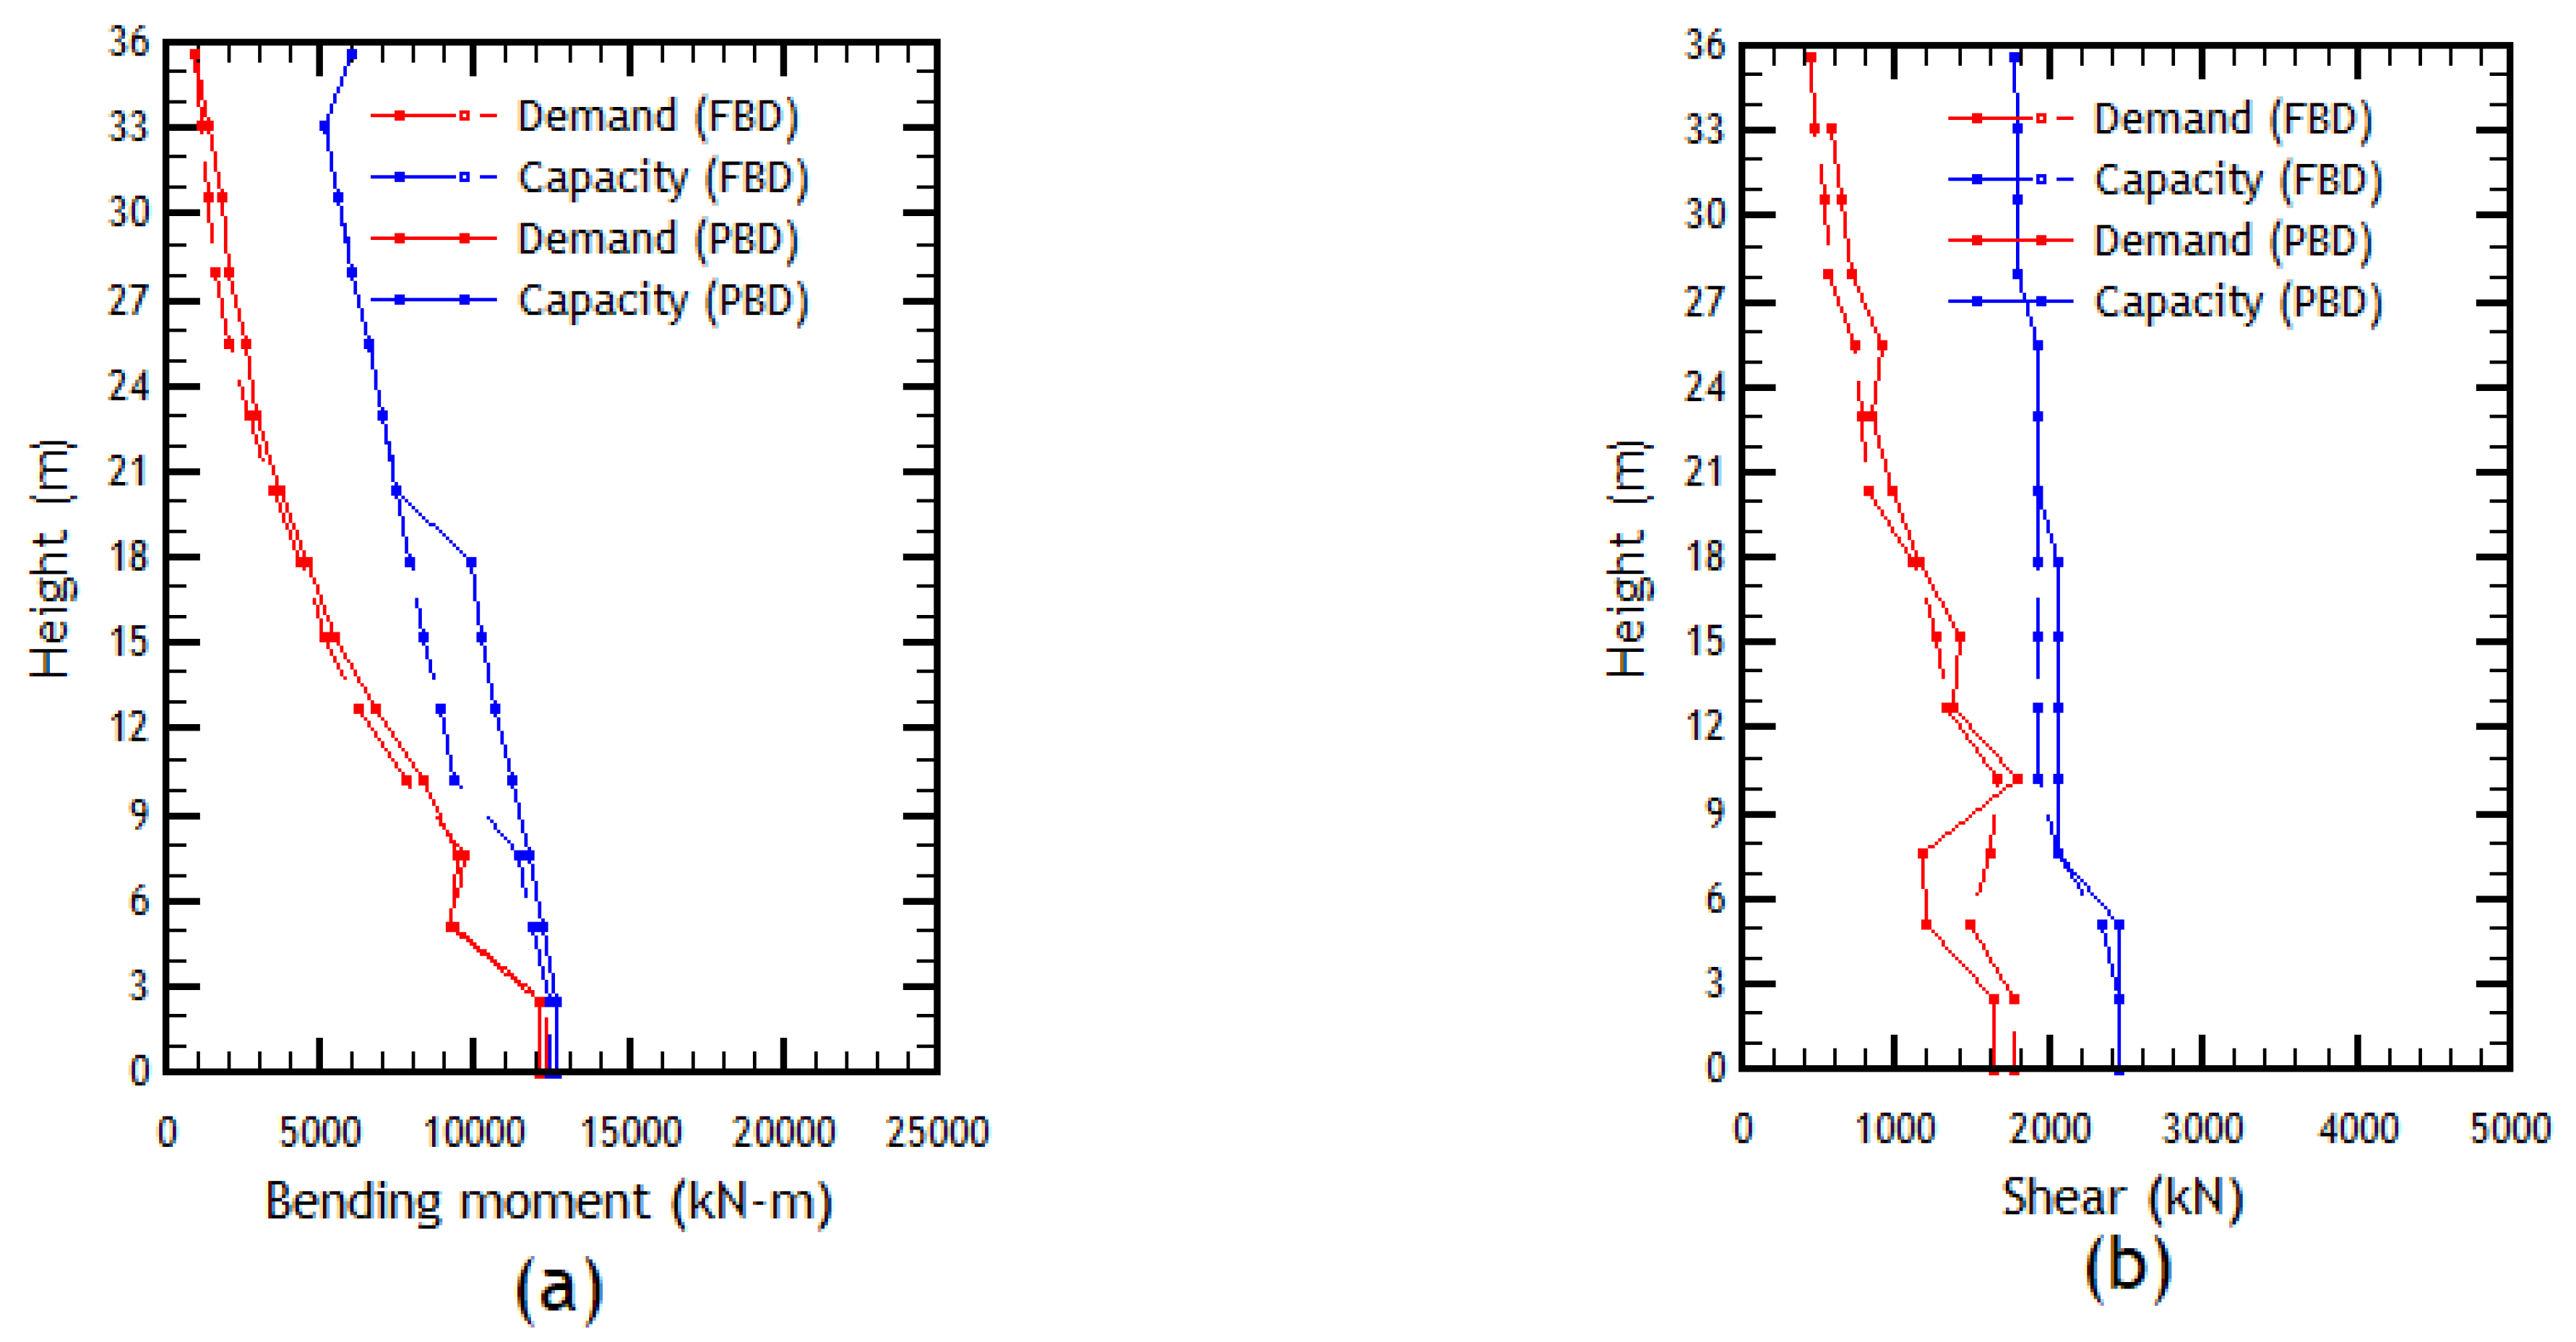
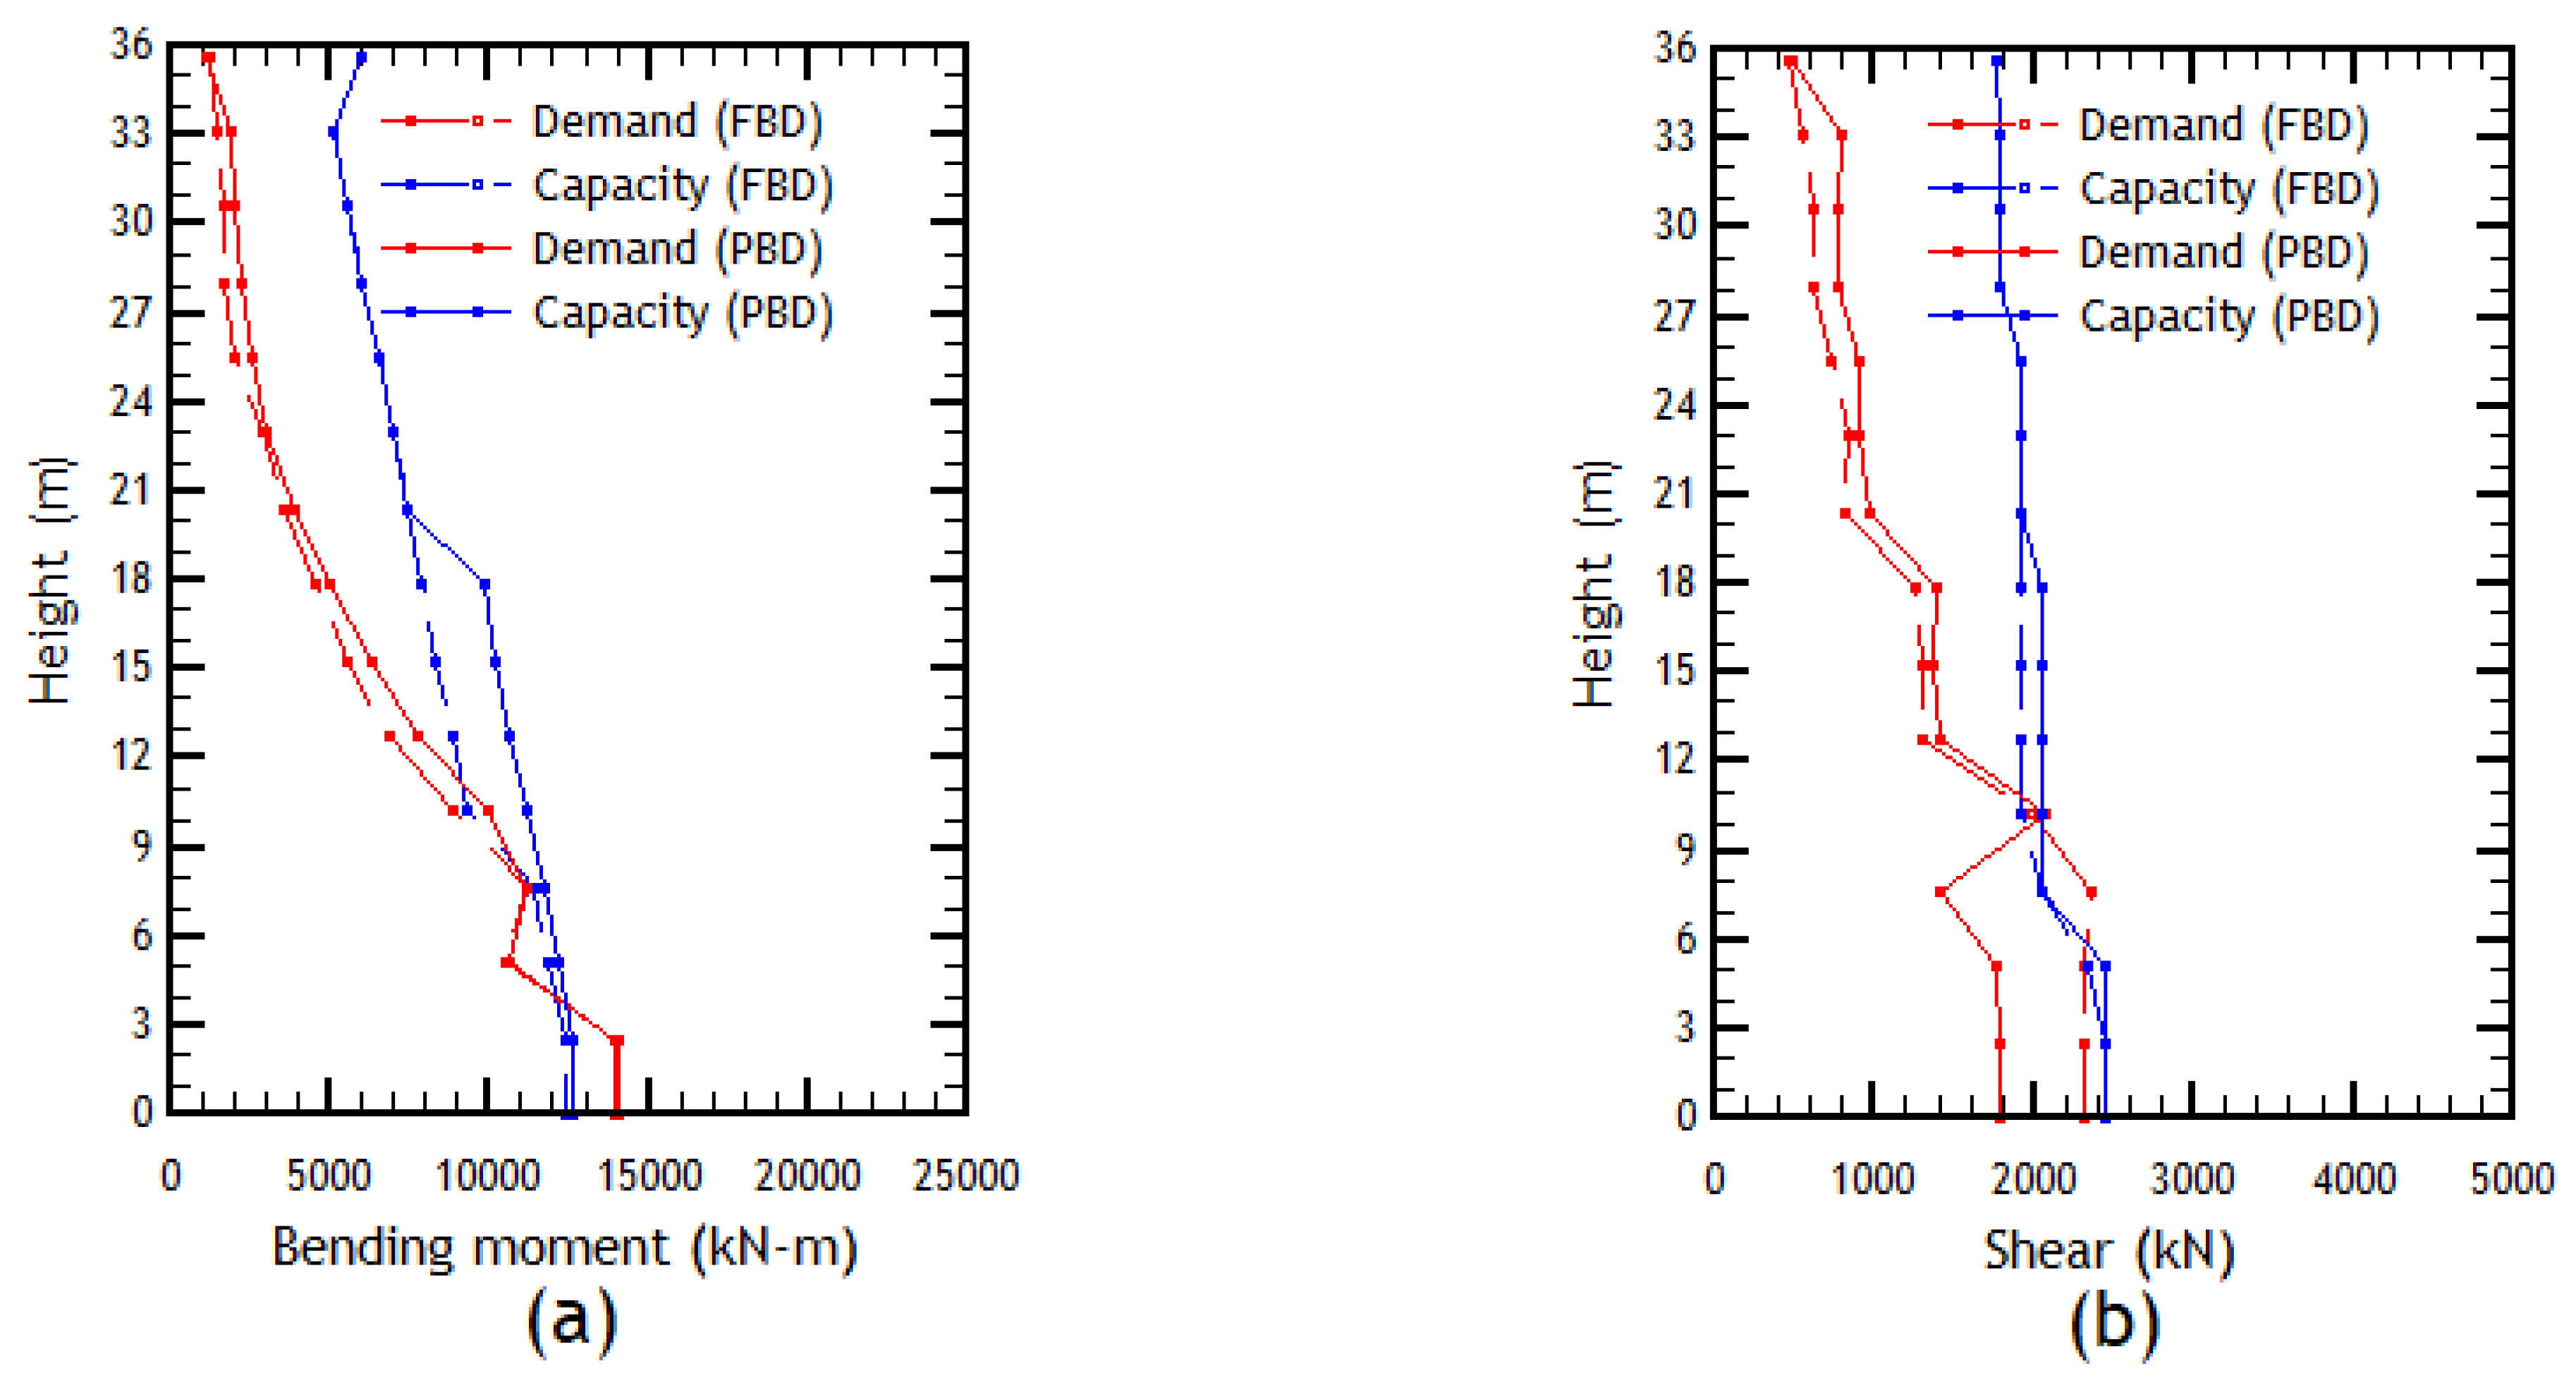
Figure 18.
Comparison of the demand/capacity in the wall in the X direction under the FBD and PBD designs: (a) moment envelope; (b) shear envelope. Immediate Occupancy limit state.
Figure 18.
Comparison of the demand/capacity in the wall in the X direction under the FBD and PBD designs: (a) moment envelope; (b) shear envelope. Immediate Occupancy limit state.
Figure 19.
Comparison of the demand/capacity in the wall in the Y direction under the FBD and PBD designs: (a) moment envelope; (b) shear envelope. Immediate Occupancy limit state.
Figure 19.
Comparison of the demand/capacity in the wall in the Y direction under the FBD and PBD designs: (a) moment envelope; (b) shear envelope. Immediate Occupancy limit state.
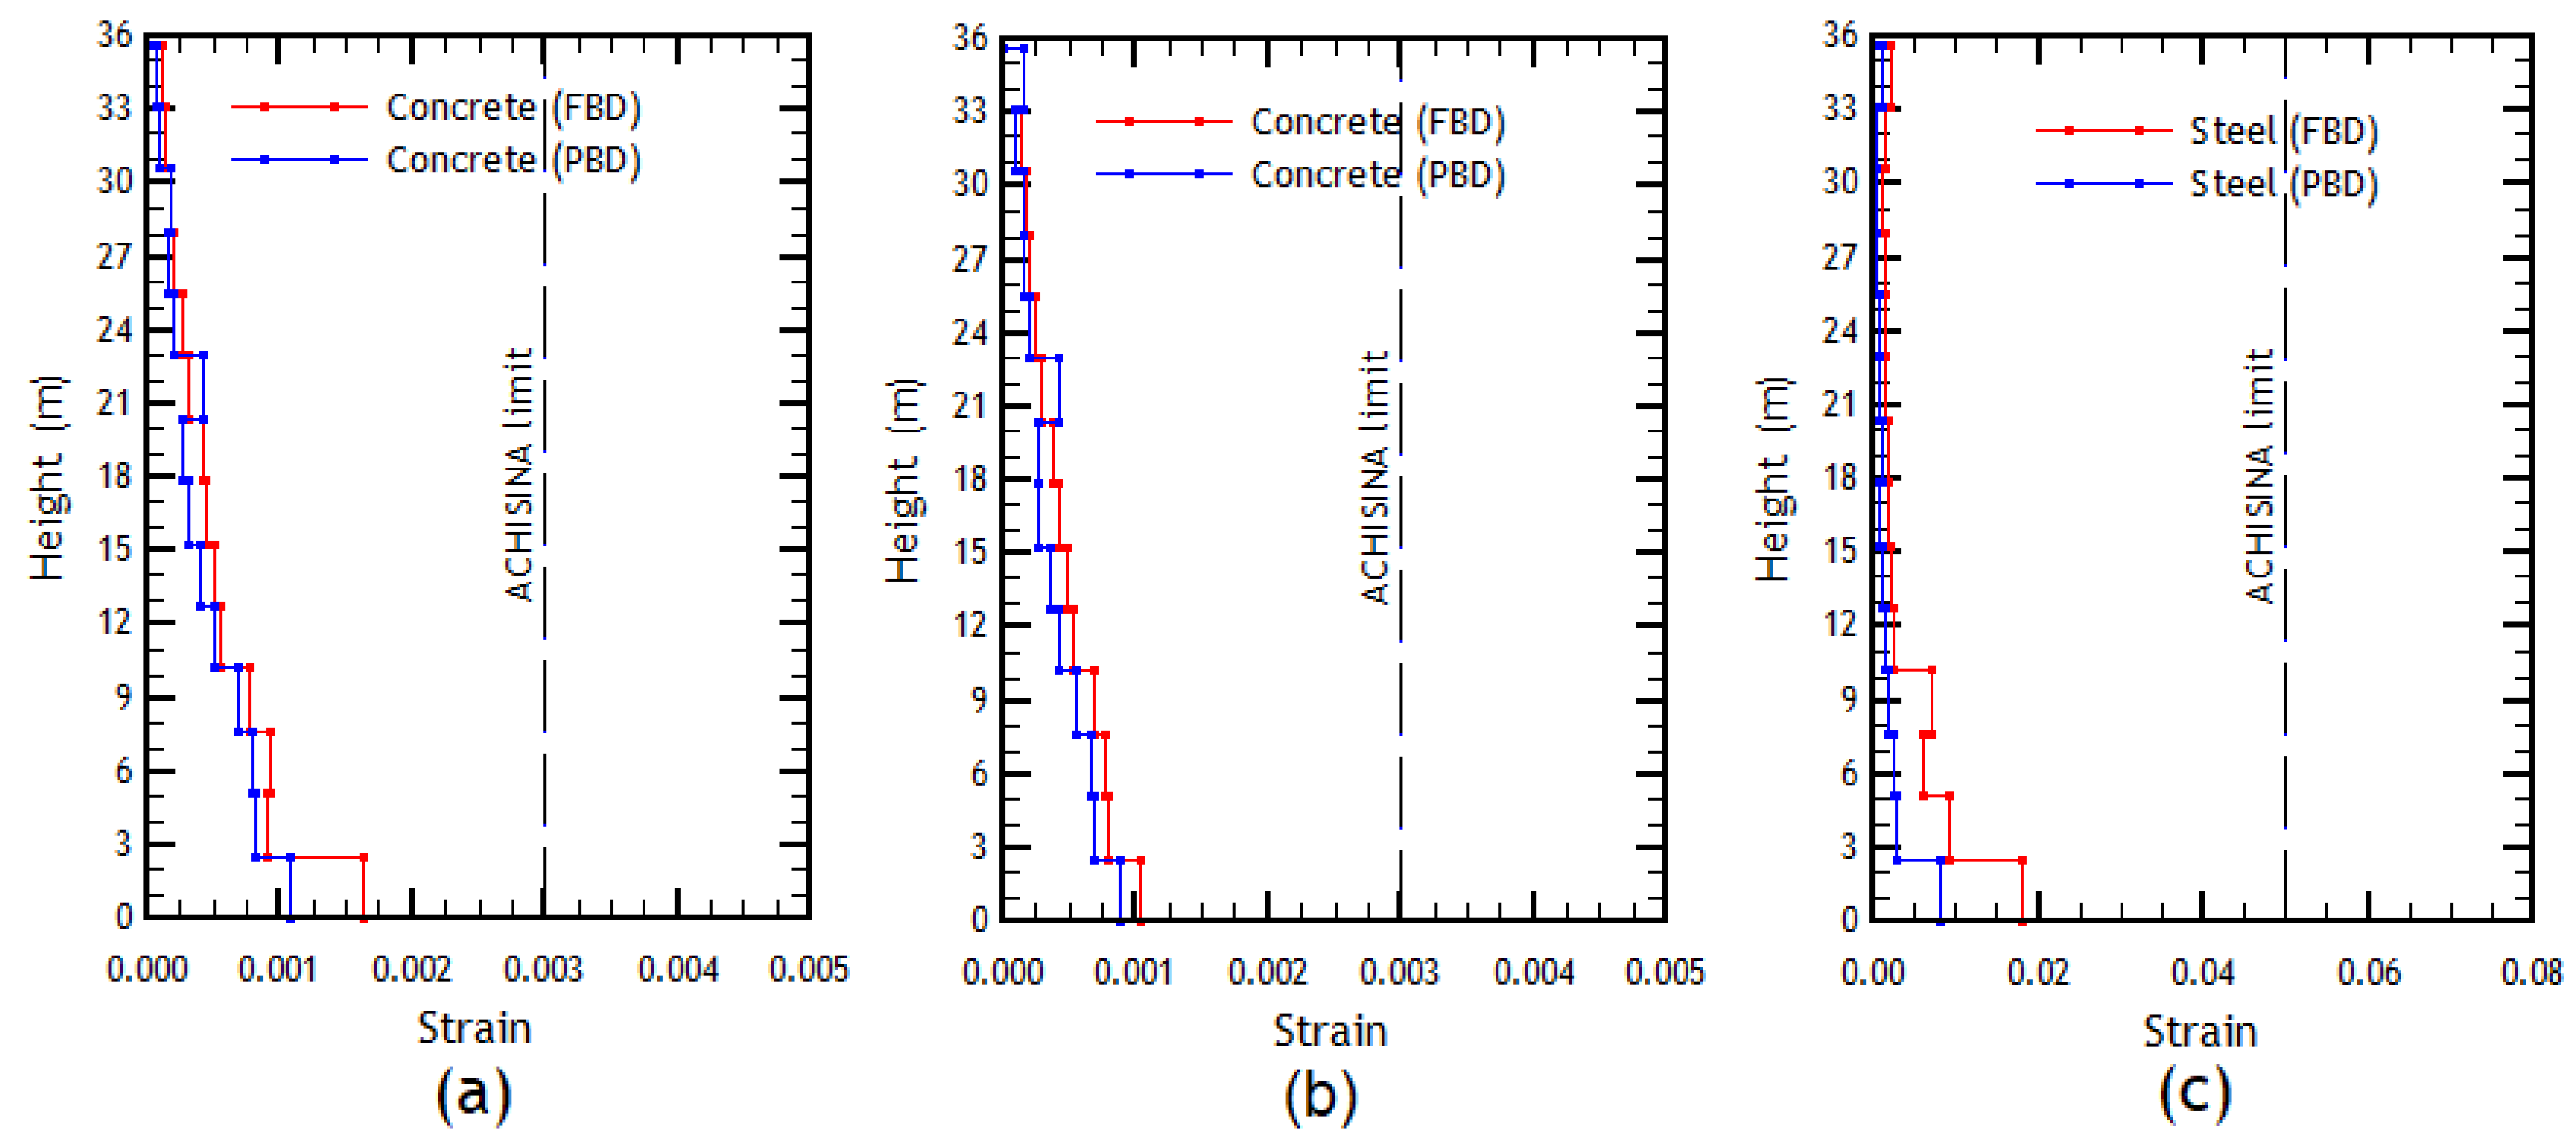
Figure 20.
Unit strain comparison of the wall in the X direction and respective acceptance criteria under the FBD and PBD designs: (a) edge element concrete; (b) double mesh concrete; and (c) edge element reinforcing steel. Additional Deformation Capacity limit state.
Figure 20.
Unit strain comparison of the wall in the X direction and respective acceptance criteria under the FBD and PBD designs: (a) edge element concrete; (b) double mesh concrete; and (c) edge element reinforcing steel. Additional Deformation Capacity limit state.
Figure 21.
Unit strain comparison of the wall in the Y direction and respective acceptance criteria under the FBD and PBD designs: (a) edge element concrete; (b) double mesh concrete; and (c) edge element reinforcing steel. Additional Deformation Capacity limit state.
Figure 21.
Unit strain comparison of the wall in the Y direction and respective acceptance criteria under the FBD and PBD designs: (a) edge element concrete; (b) double mesh concrete; and (c) edge element reinforcing steel. Additional Deformation Capacity limit state.
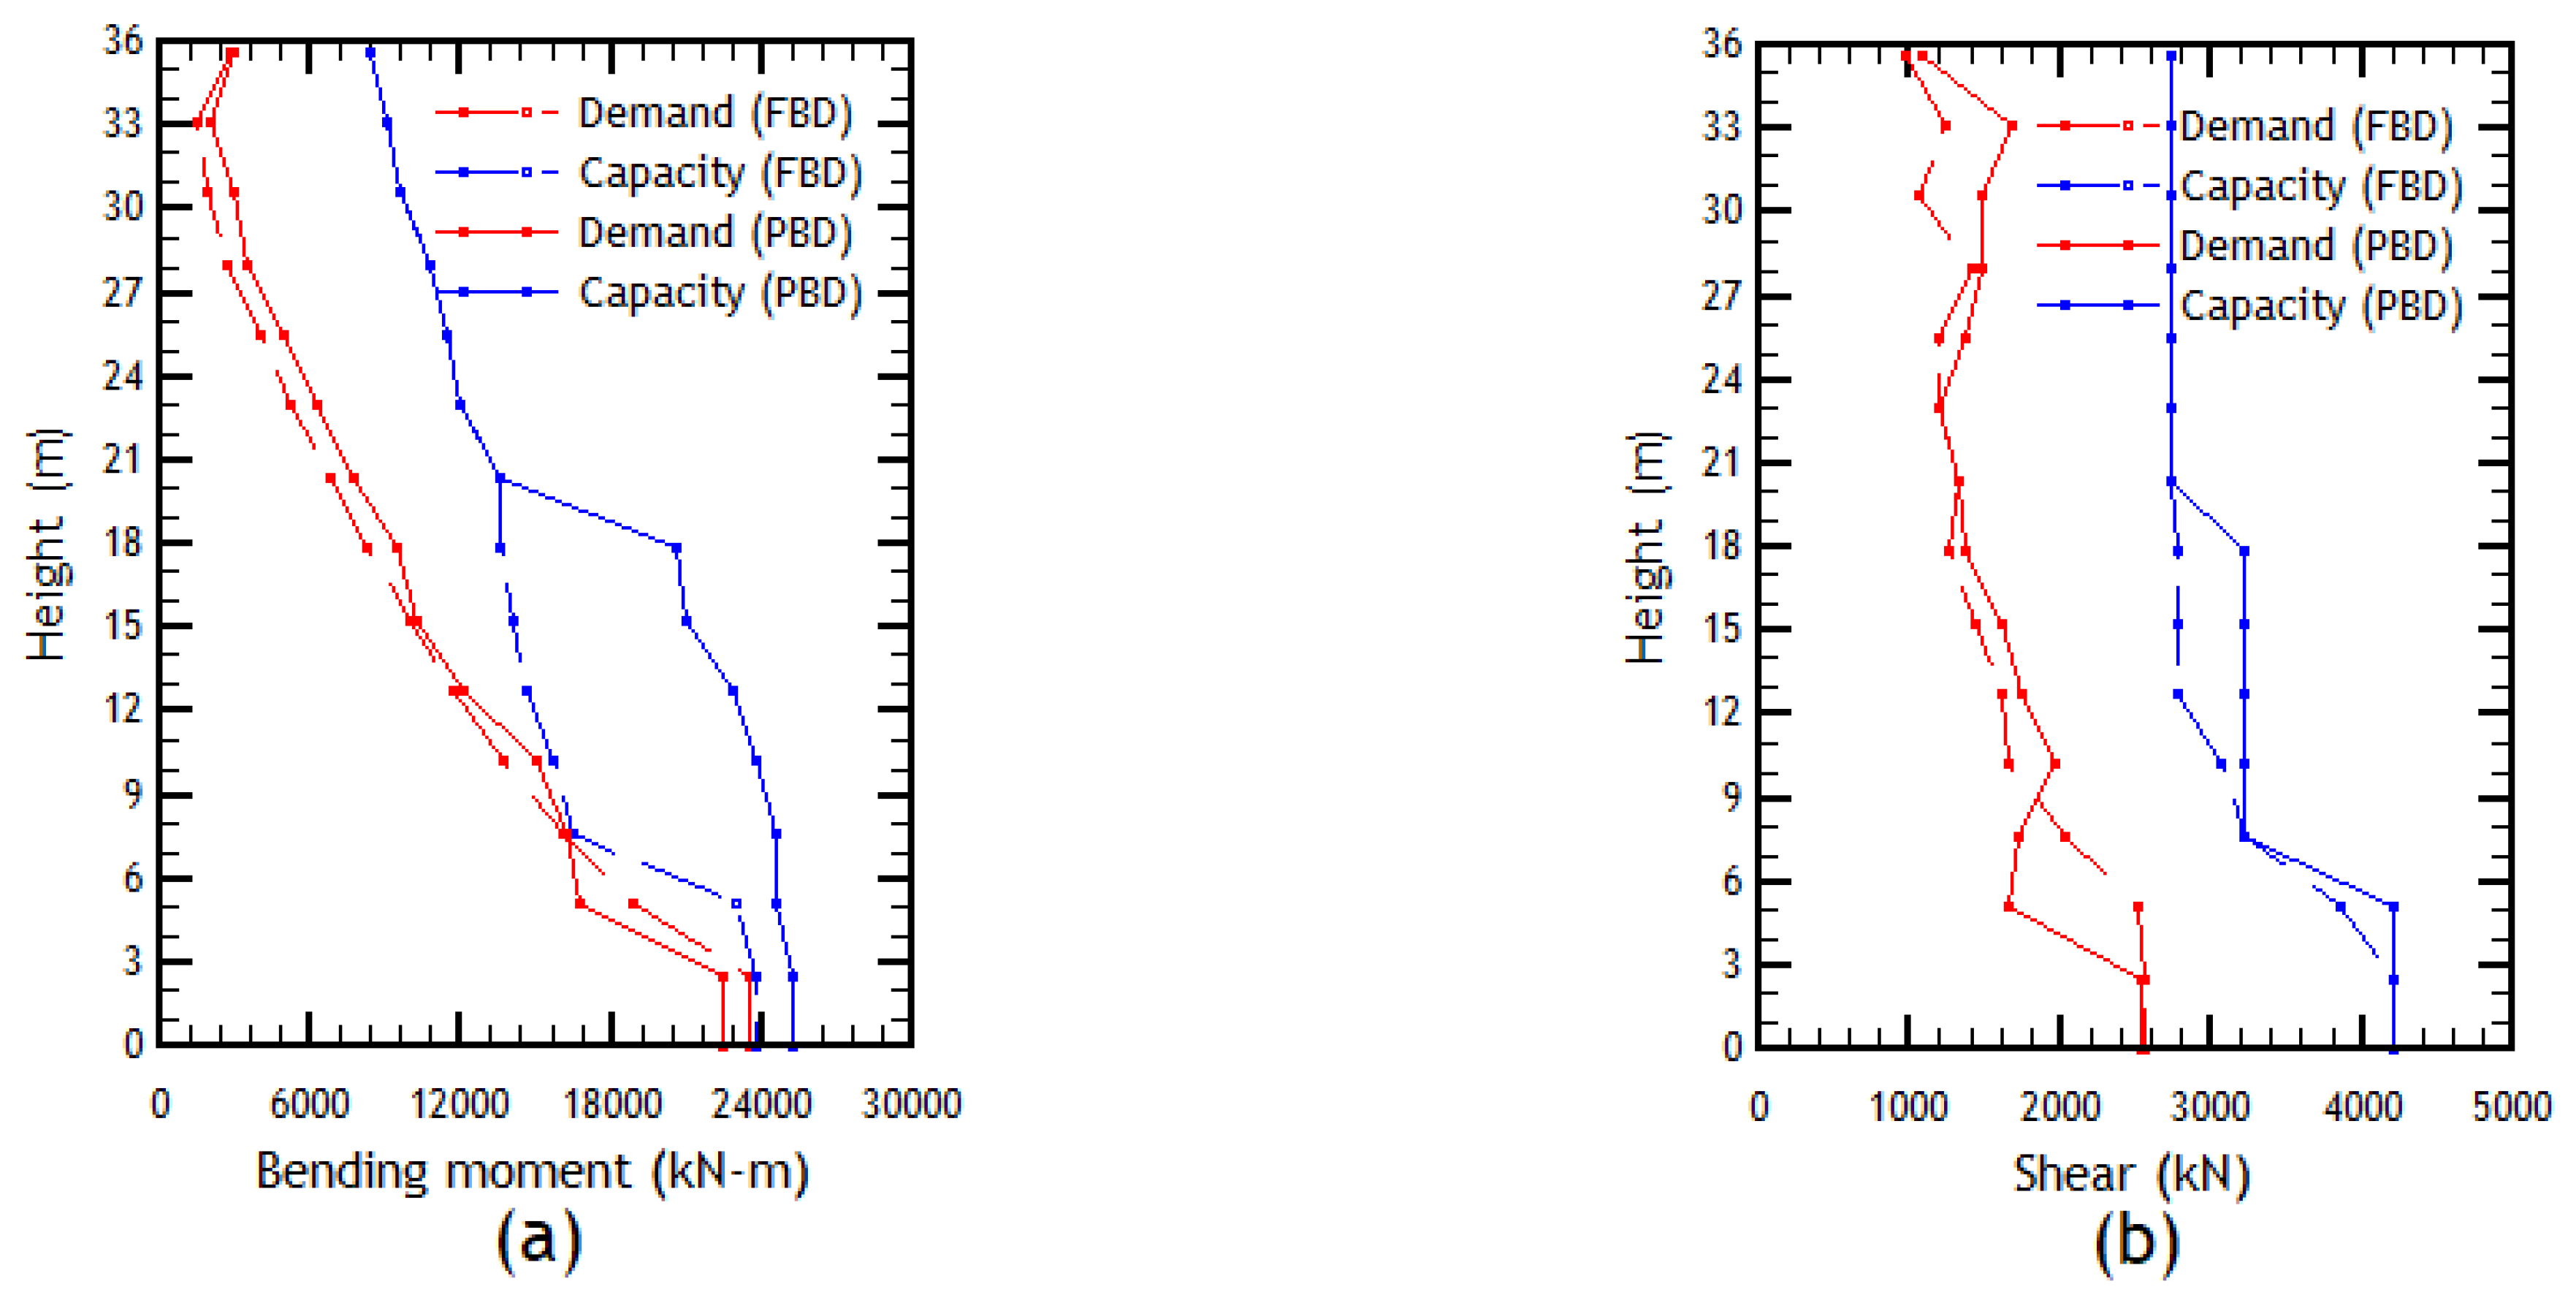
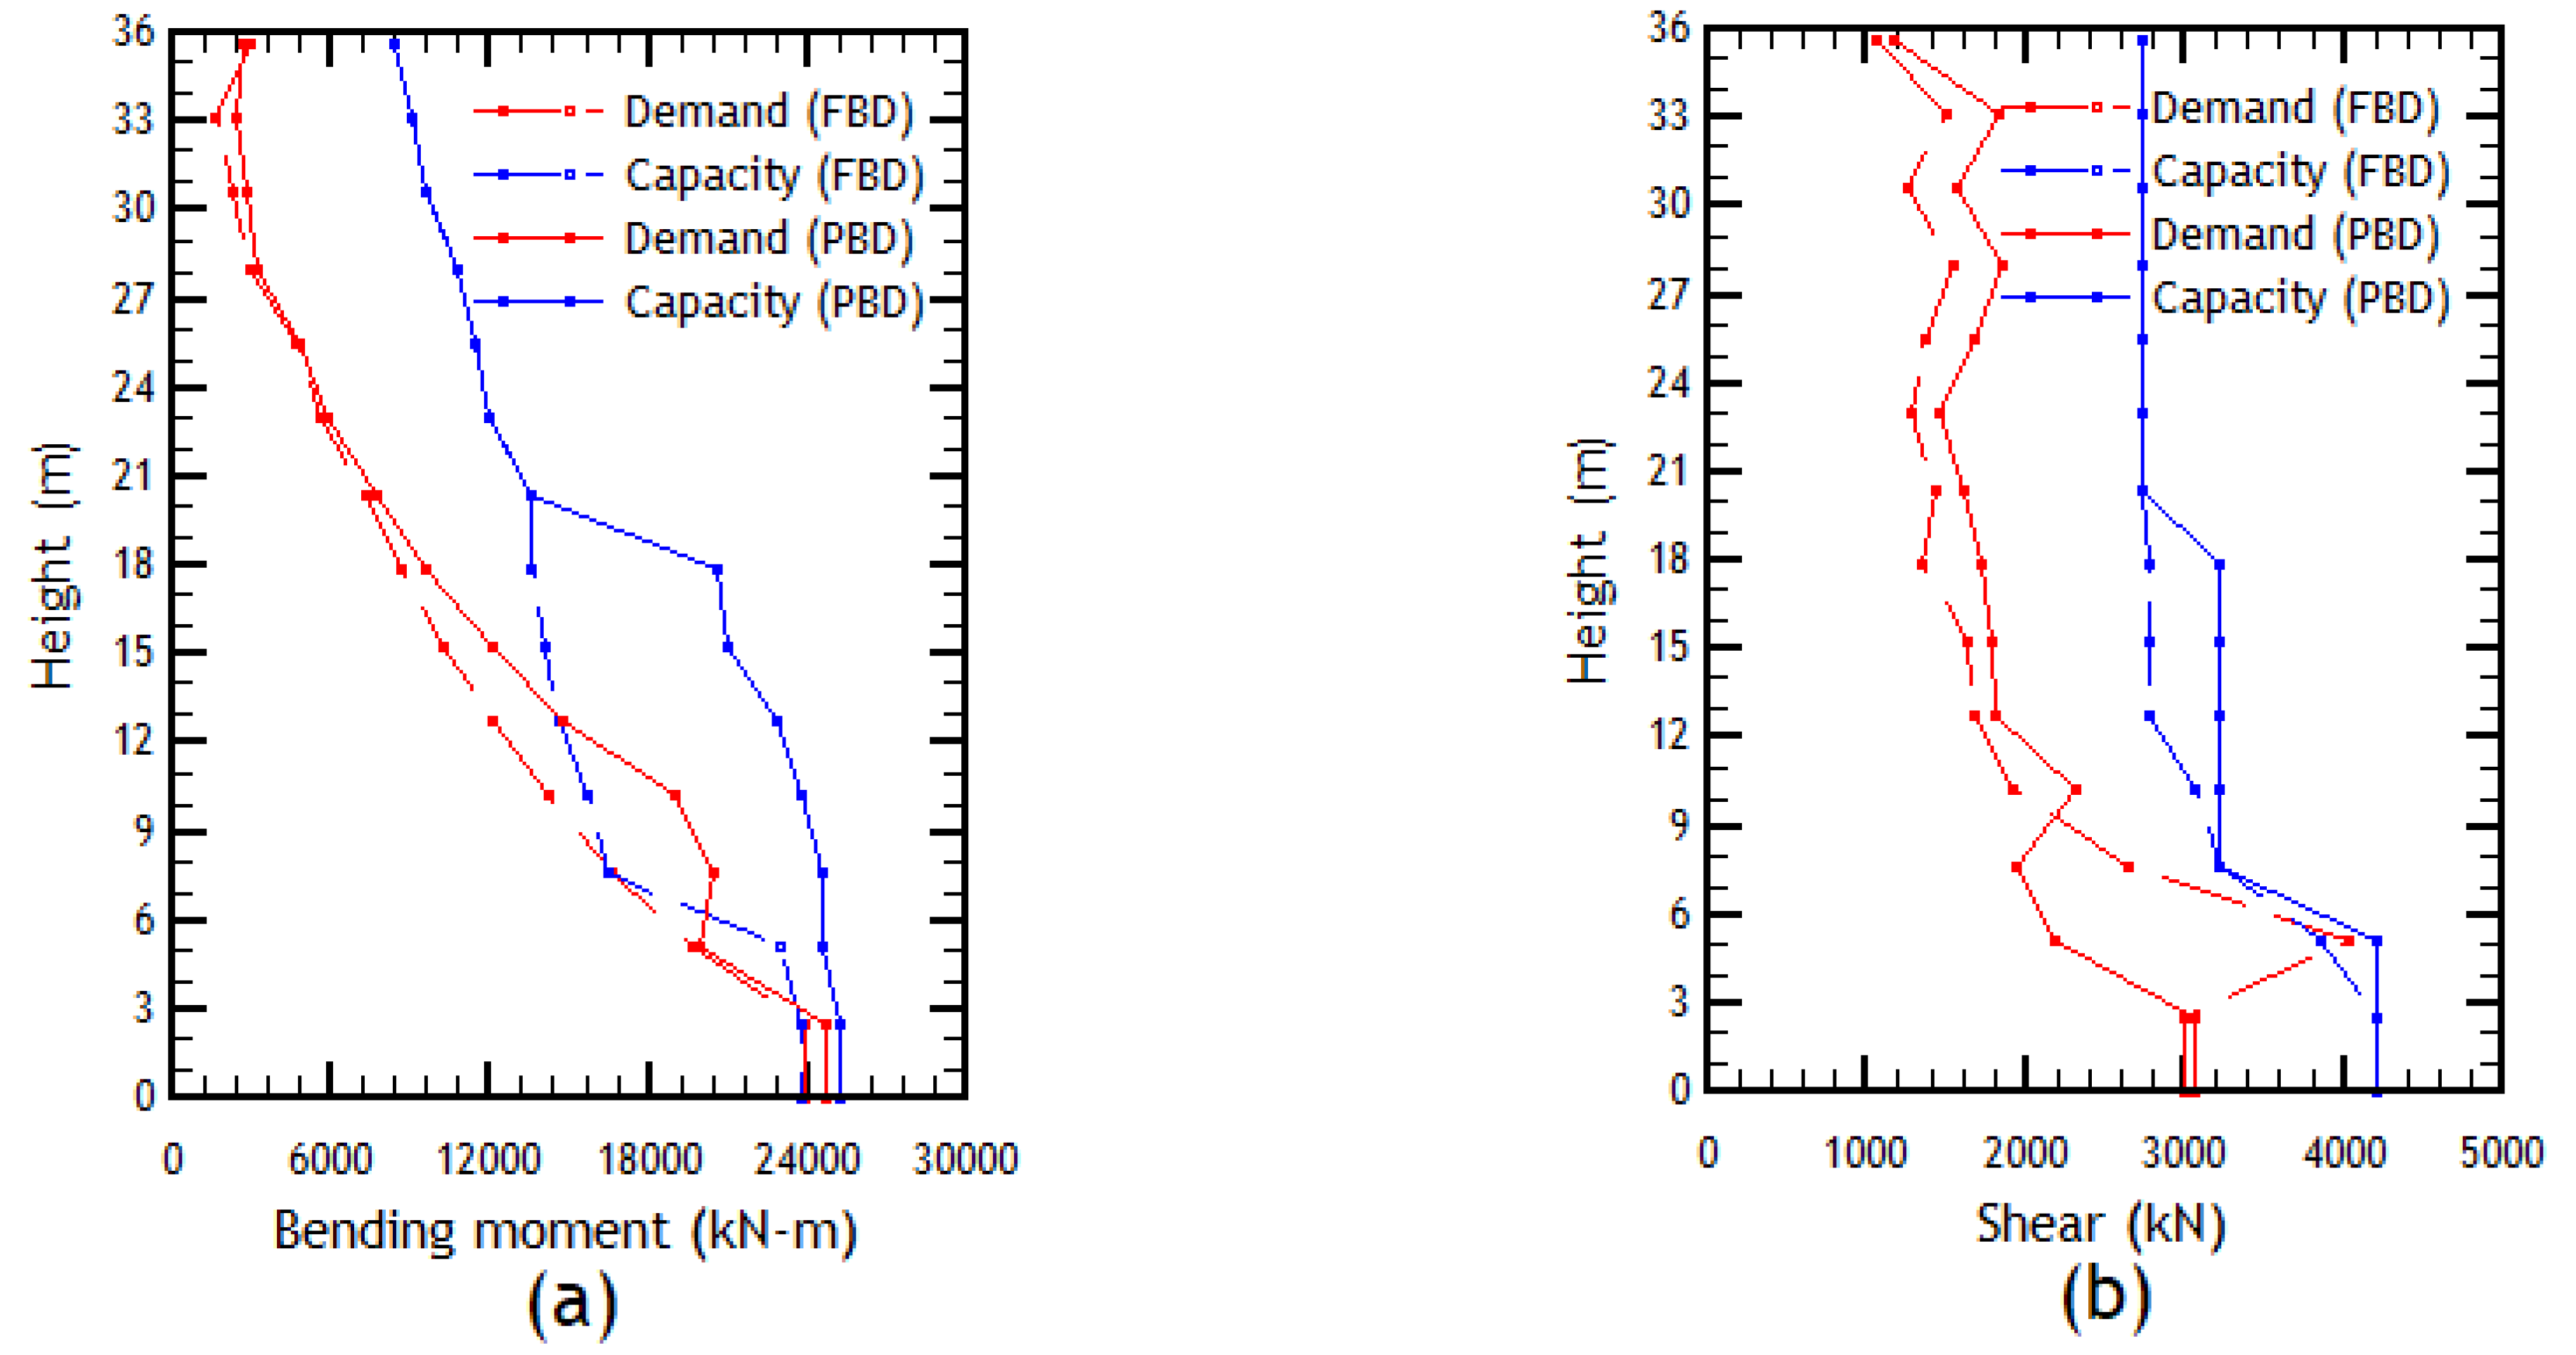
Figure 22.
Comparison of the demand/capacity in the wall in the X direction under the FBD and PBD designs: (a) moment envelope; (b) shear envelope. Additional Deformation Capacity limit state.
Figure 22.
Comparison of the demand/capacity in the wall in the X direction under the FBD and PBD designs: (a) moment envelope; (b) shear envelope. Additional Deformation Capacity limit state.
Figure 23.
Comparison of the demand/capacity in the wall in the Y direction under the FBD and PBD designs: (a) moment envelope; (b) shear envelope. Additional Deformation Capacity limit state.
Figure 23.
Comparison of the demand/capacity in the wall in the Y direction under the FBD and PBD designs: (a) moment envelope; (b) shear envelope. Additional Deformation Capacity limit state.
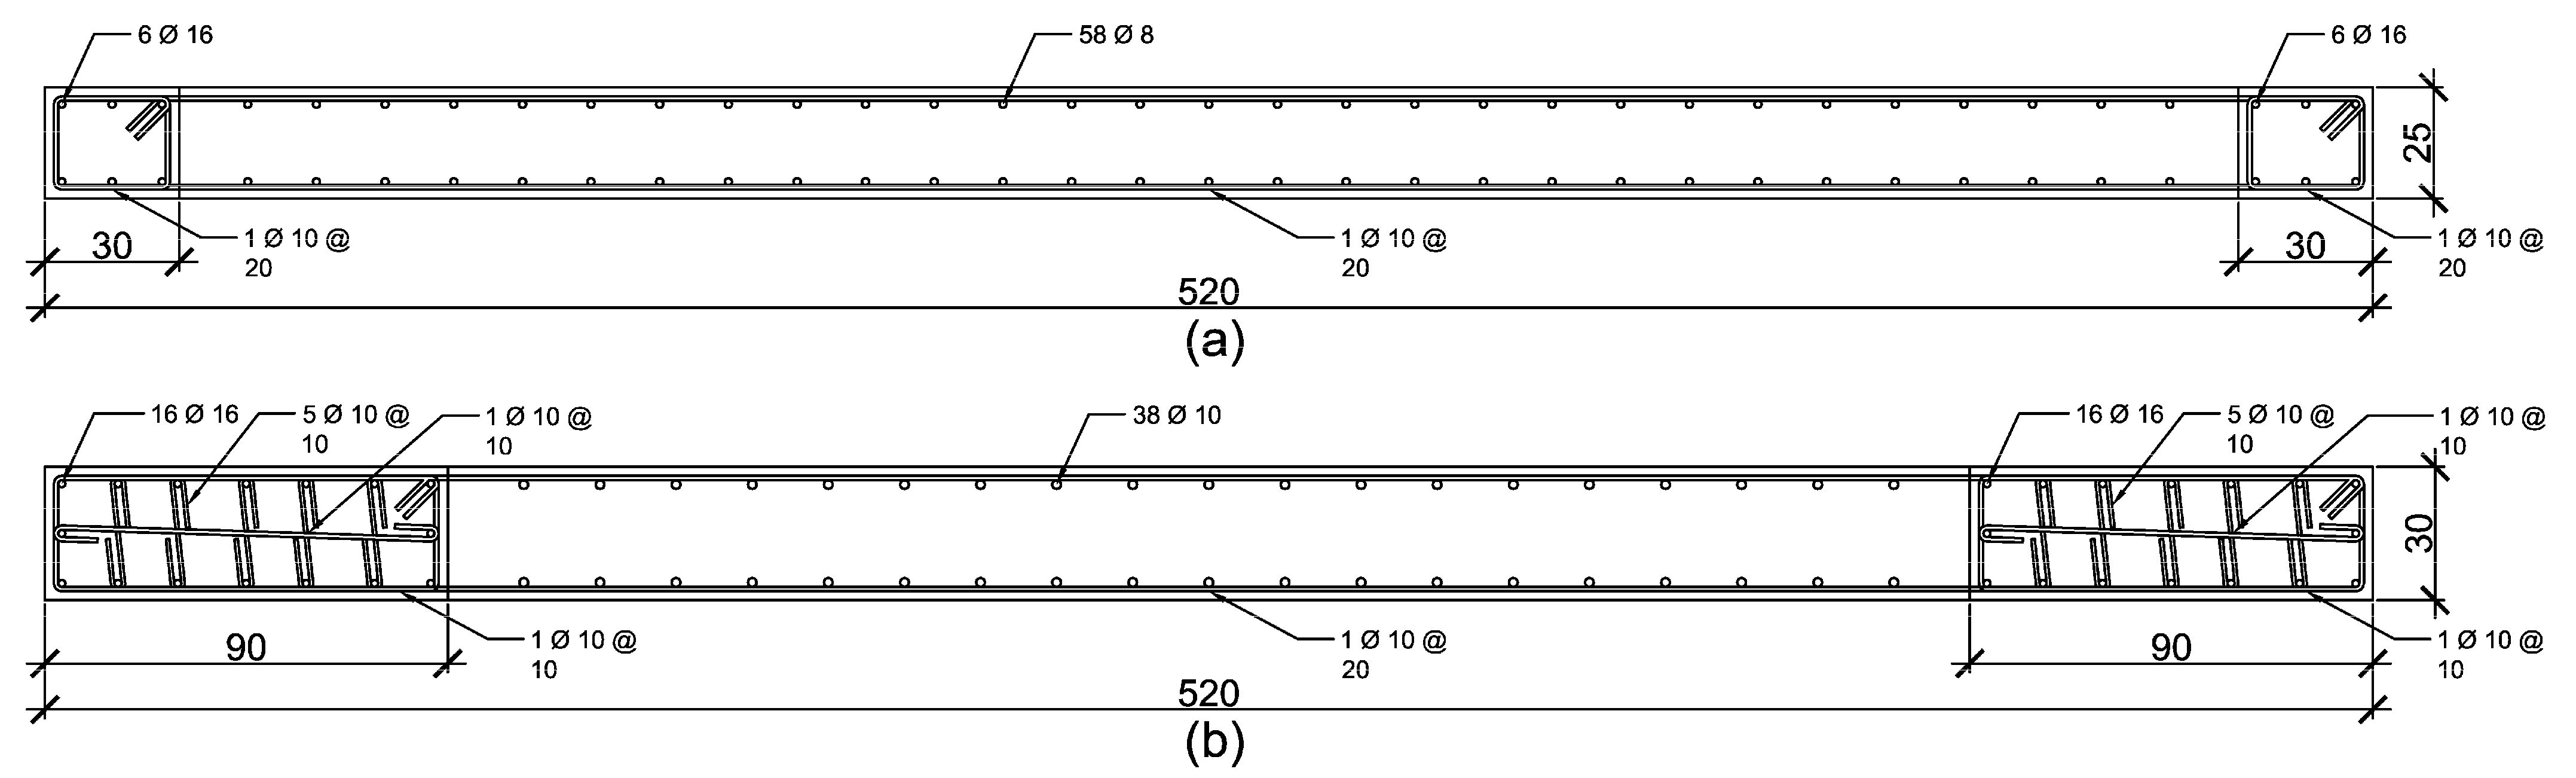
Figure 24.
Comparative example of the structural detail of (a) the wall obtained using FBD and (b) the wall obtained using PBD.
Figure 24.
Comparative example of the structural detail of (a) the wall obtained using FBD and (b) the wall obtained using PBD.
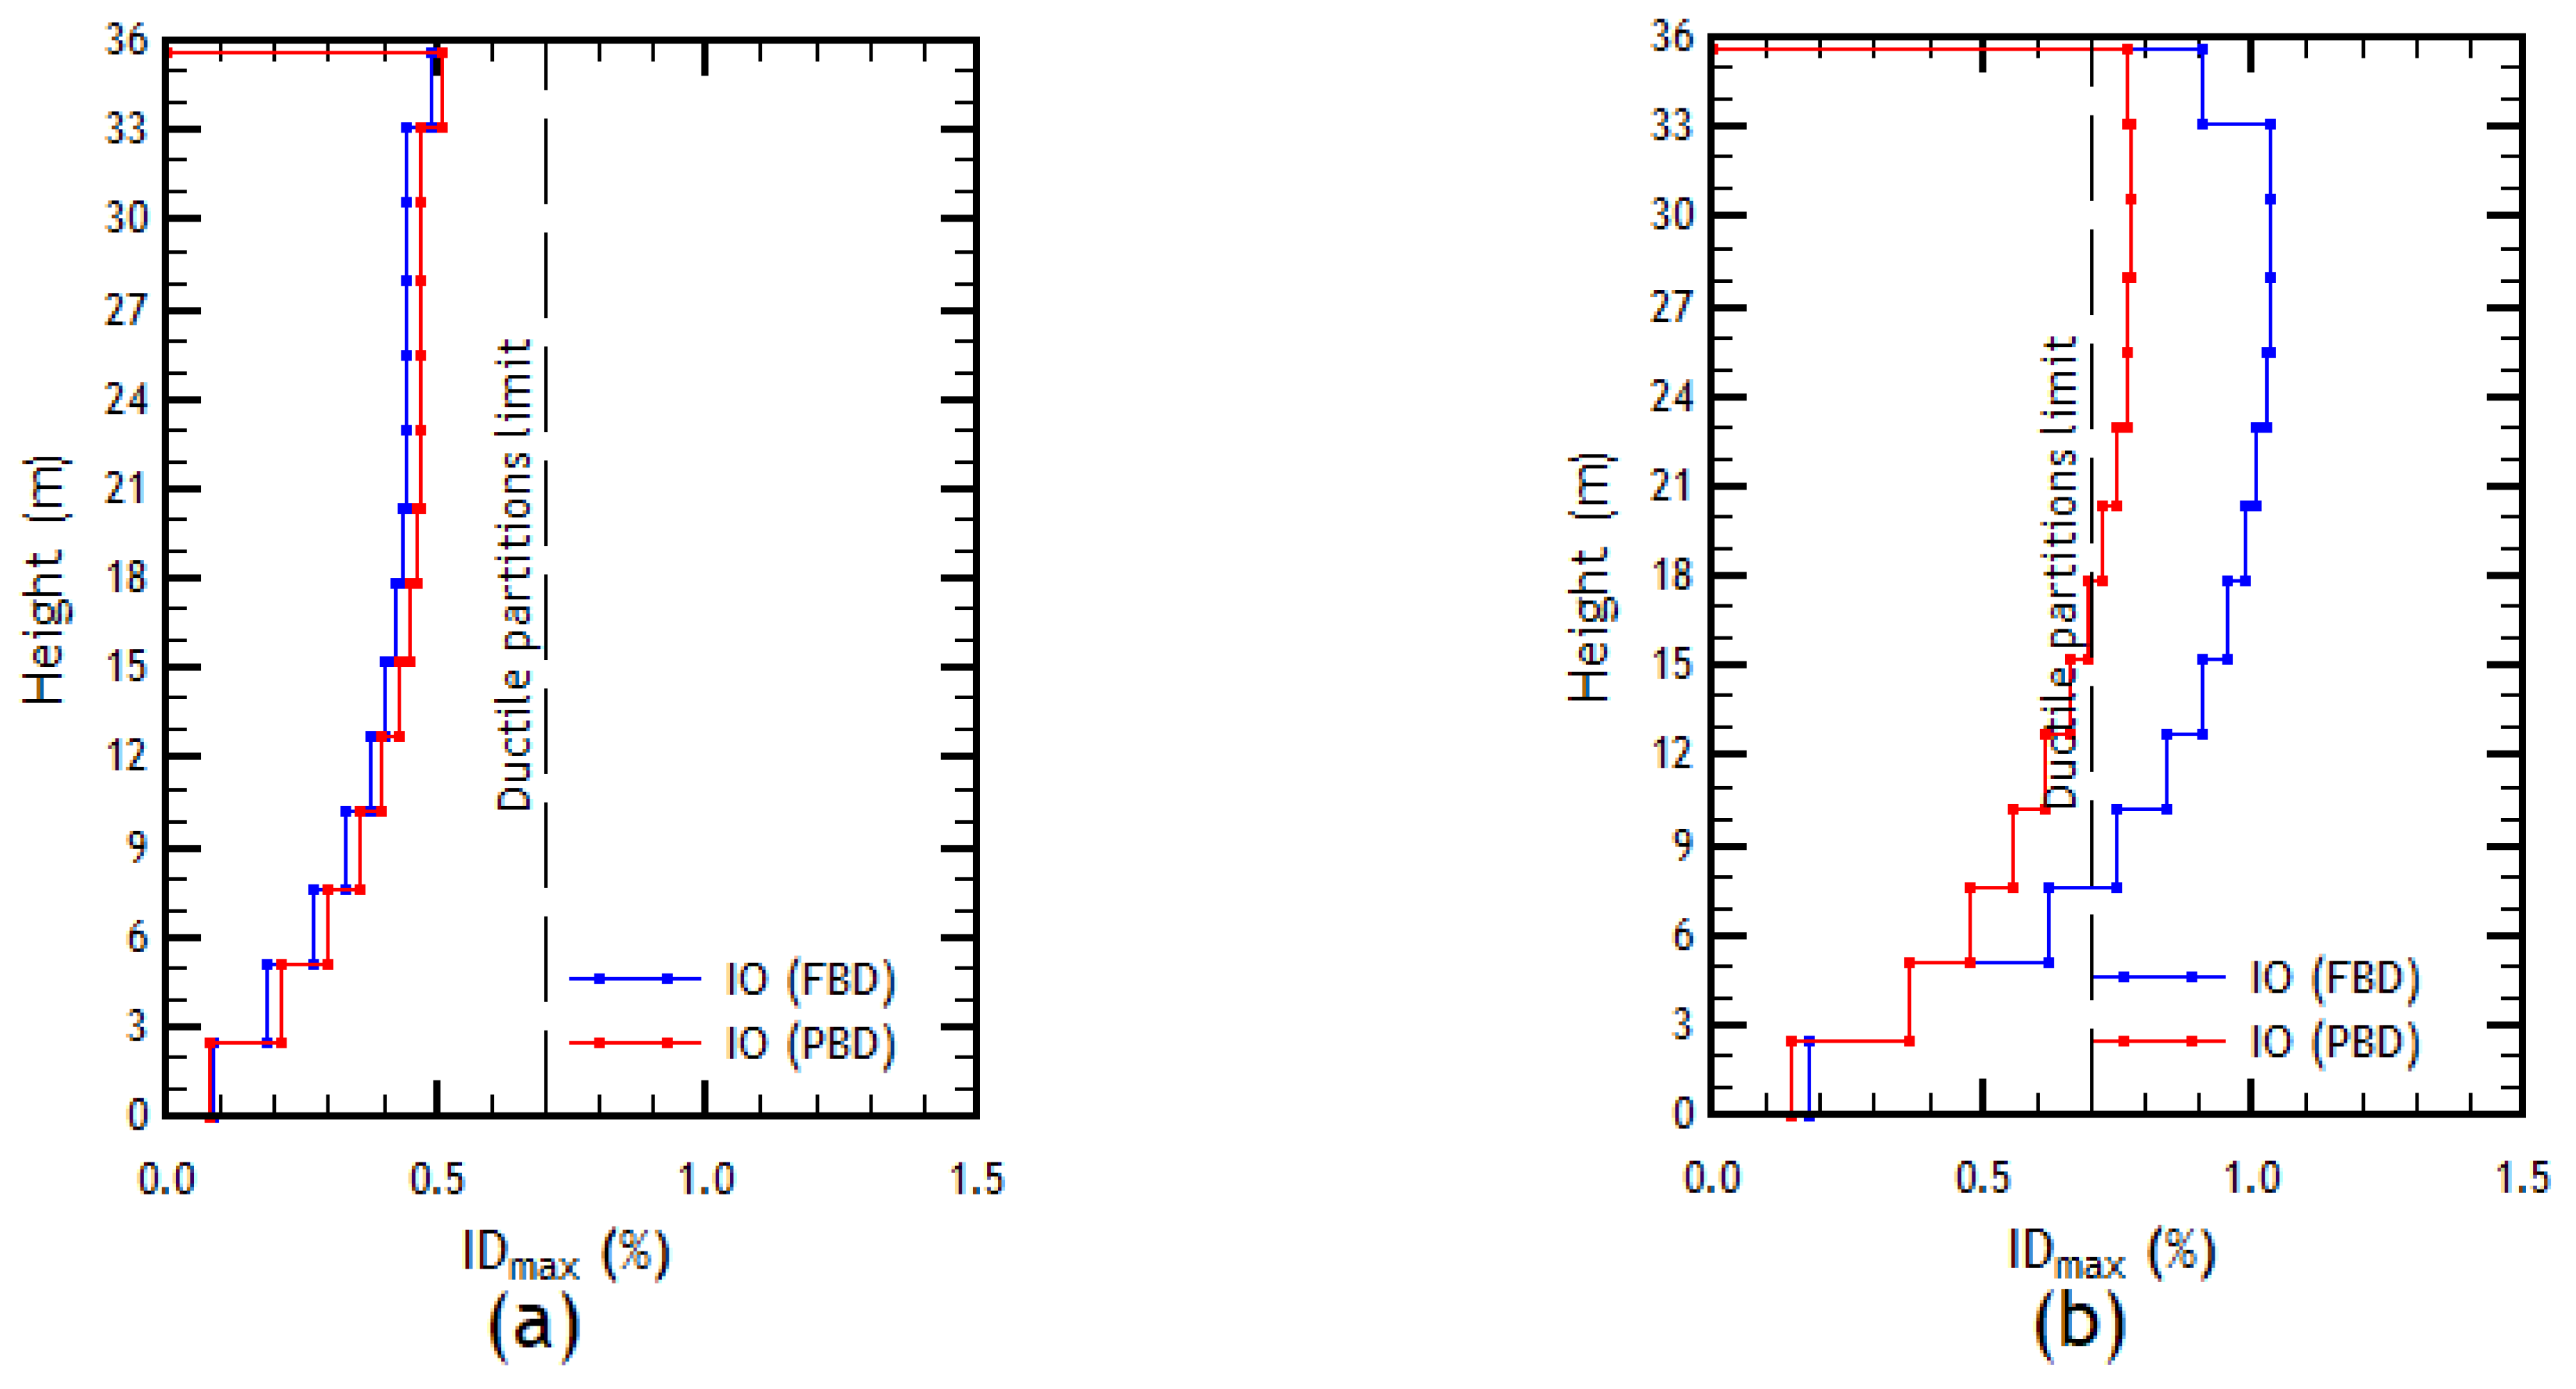
Figure 25.
Comparison of interstory drifts, building under FBD and PBD design: (a) X direction; (b) Y direction.
Figure 25.
Comparison of interstory drifts, building under FBD and PBD design: (a) X direction; (b) Y direction.
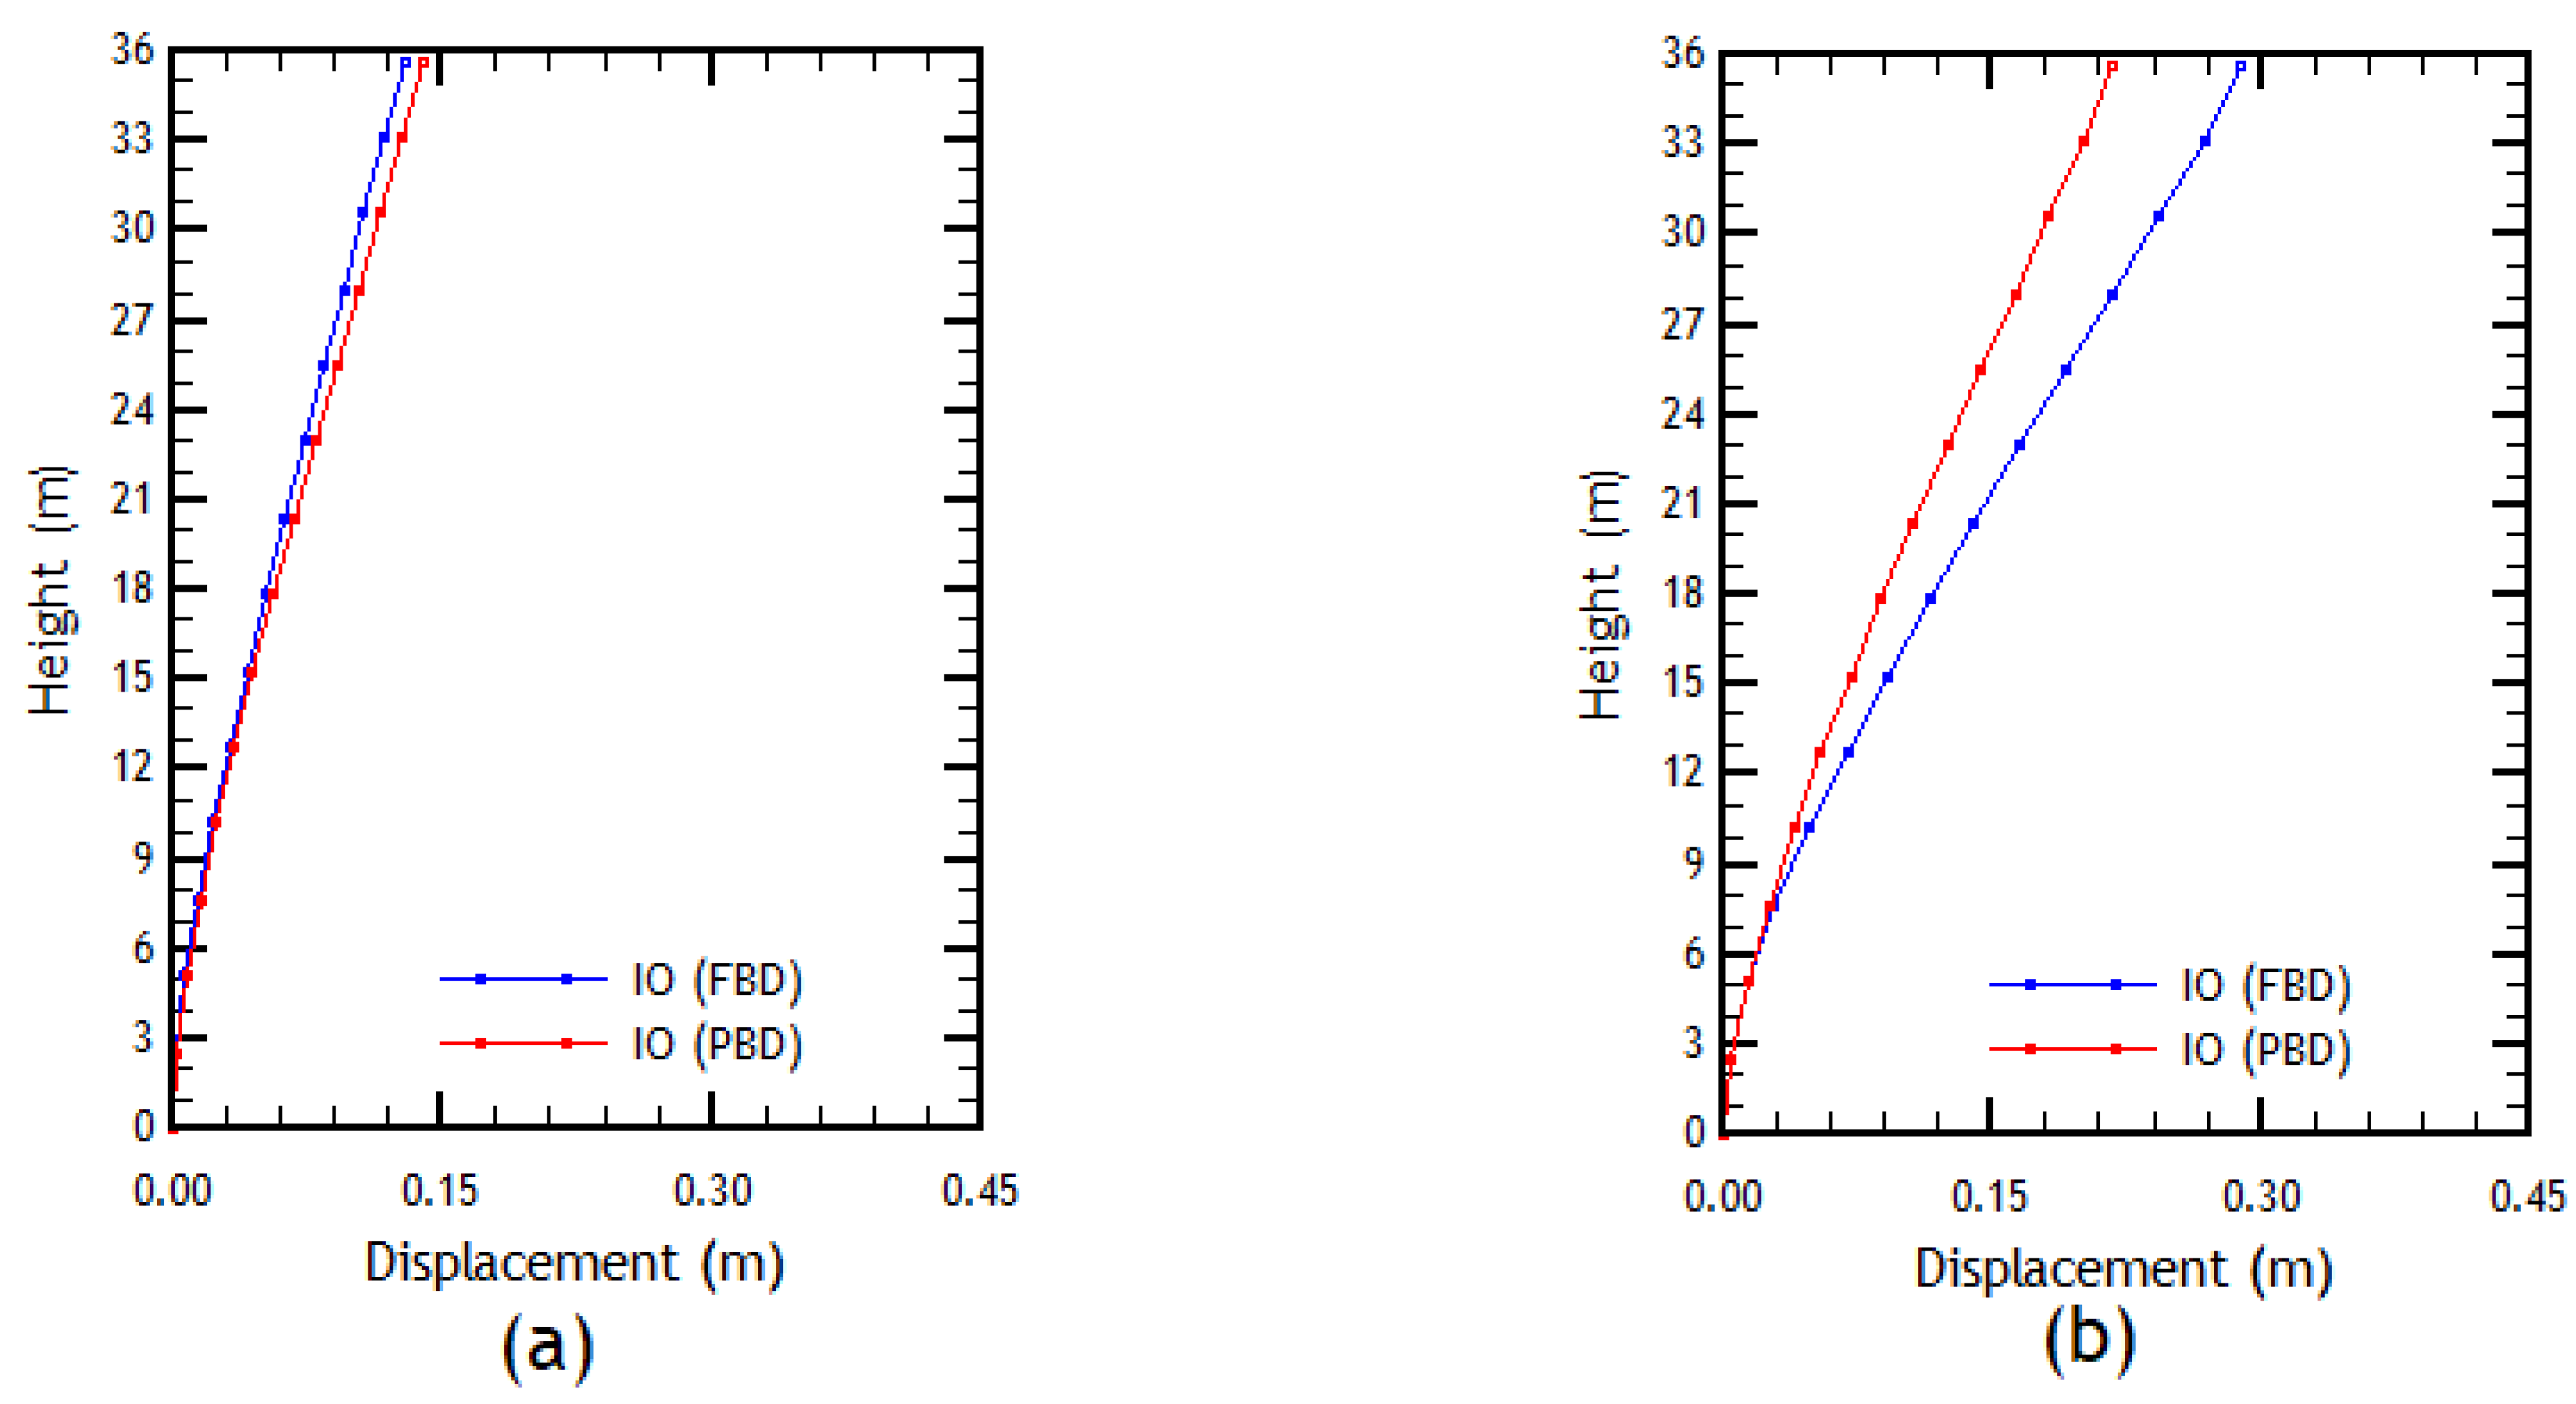
Figure 26.
Comparison of displacements under the FBD and PBD designs: (a) X direction; (b) Y direction.
Figure 26.
Comparison of displacements under the FBD and PBD designs: (a) X direction; (b) Y direction.
Table 1.
Results of the modal-response spectral analysis.
Table 1.
Results of the modal-response spectral analysis.
| Parameter | X-Direction | Y-Direction |
|---|
| Analysis fundamental period [s] | 0.86 | 1.41 |
| 8.26 | 9.39 |
| [kN] | 28,941.95 | 18,449.57 |
| [kN] | 12,506.38 | 12,506.38 |
| [kN] | 5955.45 | 5955.45 |
| [kN] | 3502.76 | 1965.53 |
| [kN] | 5955.45 | 5955.45 |
| 4.86 | 3.10 |
| [m/s2] | 6.23 | 3.20 |
| [m] | 0.1211 | 0.2199 |
| [m] | 0.1574 | 0.2859 |
Table 2.
Constitutive model parameters by Mander et al. for concrete grades G25, G30 and G35.
Table 2.
Constitutive model parameters by Mander et al. for concrete grades G25, G30 and G35.
| Parameter | Concrete G25 | Concrete G30 | Concrete G35 |
|---|
| Compression strength (MPa) | 33.00 | 38.00 | 43.00 |
| Strength lower bound (MPa) | 25.00 | 30.00 | 35.00 |
| Tension strength (MPa) | 2.60 | 2.90 | 3.20 |
| Modulus of elasticity (MPa) | 26,999.00 | 28,973.00 | 30,820.00 |
| Specific weight (kN/m3) | 24.00 | 24.00 | 24.00 |
Table 3.
Constitutive model parameters by Menegotto and Pinto for steel grade A630-420H.
Table 3.
Constitutive model parameters by Menegotto and Pinto for steel grade A630-420H.
| Parameter | Value |
|---|
| (MPa) | 200,000.00 |
| (MPa) | 490.00 |
| Strain hardening parameter (Dimensionless) | 0.0050 |
| Transition curve initial shape parameter (Dimensionless) | 20.00 |
| Transition curve shape calibrating coefficient A1 (Dimensionless) | 18.50 |
| Transition curve shape calibrating coefficient A2 (Dimensionless) | 0.15 |
| Transition curve shape calibrating coefficient A3 (Dimensionless) | 0.00 |
| Transition curve shape calibrating coefficient A4 (Dimensionless) | 1.00 |
| Fracture/buckling strain (Dimensionless) | 1.00 |
| Specific weight (kN/m3) | 78.00 |
Table 4.
Seismic hazard levels and the corresponding target building performance levels defined according to ASCE 41-17.
Table 4.
Seismic hazard levels and the corresponding target building performance levels defined according to ASCE 41-17.
| | | | Target Building Performance Level |
|---|
| | Eceedance Probability | Return Period (Years) | Operational Level | Inmediate Occupancy | Life Safety | Collapse Prevention |
|---|
| Seismic hazard | 50% in 50 years | 72 | x | | | |
| 10% in 50 years | 225 | | x | | |
| 5% in 50 years | 975 | | | x | |
| 2% in 50 years | 2475 | | | | x |
Table 5.
Descriptive summary of Chilean records used.
Table 5.
Descriptive summary of Chilean records used.
| Earthquake | Date | | Station | Epicentral Distance (km) | Component | PGA
(cm/s2) |
|---|
| Maule | 27 February 2010 | 8.8 | Angol | 209 | E–W | 684 |
| N–S | 916 |
| Maule | 27 February 2010 | 8.8 | Concepción San Pedro | 109 | 97 | 598 |
| 7 | 667 |
| Maule | 27 February 2010 | 8.8 | Constitución | 70 | E–W | 530 |
| N–S | 618 |
| Maule | 27 February 2010 | 8.8 | Llolleo | 274 | E–W | 324 |
| N–S | 549 |
| Maule | 27 February 2010 | 8.8 | Santiago Maipú | 69 | E–W | 481 |
| N–S | 549 |
| Coquimbo | 16 September 2015 | 8.3 | El pedregal | 92 | 90 | 677 |
| 360 | 561 |
| Coquimbo | 16 September 2015 | 8.3 | Tololo | 175 | 90 | 234 |
| 360 | 338 |
| Coquimbo | 16 September 2015 | 8.3 | San Esteban | 168 | 90 | 268 |
| 360 | 182 |
| Puerto Quellón | 25 December 2016 | 7.6 | Loncomilla | 136 | 90 | 136 |
| 360 | 148 |
| Puerto Quellón | 25 December 2016 | 7.6 | Hotel Espejo de Luna | 75 | 90 | 371 |
| 360 | 350 |
| Valparaíso | 24 July 2015 | 6.9 | Torpederas | 39 | 90 | 889 |
| 360 | 731 |
Table 6.
Acceptance criteria according ACHISINA’s manual for the Immediate Occupancy and Additional Deformation limit states.
Table 6.
Acceptance criteria according ACHISINA’s manual for the Immediate Occupancy and Additional Deformation limit states.
| Criteria Type | Criteria | Limit Value |
|---|
| Immediate Occupancy | Additional Deformation |
|---|
| Local | Compression unit strain in confined concrete walls | 0.008 | 0.015 |
| Compression unit strain in unconfined concrete walls | 0.003 | 0.003 |
| Tension unit strain in reinforcement steel of walls | 0.030 | 0.050 |
| Plastic rotation of coupling beams | 0.01 | No limit if it does not compromise the stability |
| Global | Story drifts of buildings with fragile nonstructural elements | 0.005 | No limit |
| Story drifts of buildings with ductile nonstructural elements | 0.007 | No limit |
Table 7.
Parameters obtained for the calculation of the target displacements, X direction.
Table 7.
Parameters obtained for the calculation of the target displacements, X direction.
| Limit State | IO | LS | CP |
|---|
| (s) | 0.5697 | 0.5697 | 0.5697 |
| (g) | 0.5783 | 0.7710 | 0.9638 |
| 1.3000 | 1.3000 | 1.3000 |
| 1.0682 | 1.1082 | 1.1480 |
| 1.0068 | 1.0171 | 1.0320 |
| (m) | 0.0652 | 0.0911 | 0.1197 |
Table 8.
Parameters obtained for the calculation of the target displacements, Y direction.
Table 8.
Parameters obtained for the calculation of the target displacements, Y direction.
| Limit State | IO | LS | CP |
|---|
| (s) | 0.8134 | 0.8134 | 0.8134 |
| (g) | 0.4020 | 0.5360 | 0.6700 |
| 1.3000 | 1.3000 | 1.3000 |
| 1.0340 | 1.0537 | 1.0735 |
| 1.0000 | 1.0000 | 1.0000 |
| (m) | 0.0888 | 0.1207 | 0.1537 |
Table 9.
Comparison of the concrete grades and wall thicknesses between the original design and redesign.
Table 9.
Comparison of the concrete grades and wall thicknesses between the original design and redesign.
| | FBD | PBD |
|---|
| Story | Concrete (MPa) | Width X (cm) | Width Y (cm) | Concrete (MPa) | Width X (cm) | Width Y (cm) |
|---|
| 8 to 14 | 25 | 20 | 20 | 35 | 20 | 25 |
| 7 | 25 | 20 | 20 | 35 | 20 | 30 |
| 6 | 30 | 20 | 20 | 35 | 20 | 30 |
| 5 | 30 | 20 | 20 | 35 | 20 | 30 |
| 4 | 30 | 20 | 25 | 35 | 20 | 30 |
| 3 | 35 | 20 | 25 | 35 | 20 | 30 |
| 2 | 35 | 20 | 30 | 35 | 20 | 30 |
| 1 | 35 | 20 | 30 | 35 | 20 | 30 |
Table 10.
Comparison of material quantity between structures obtained according to FBD and PBD.
Table 10.
Comparison of material quantity between structures obtained according to FBD and PBD.
| | Concrete Volume (m3) | Steel Weight (kg) |
|---|
| FBD | 3329.44 | 338,271.91 |
| PBD | 3404.31 | 357,864.31 |
| Difference | +2.25% | +5.79% |


